Article

Using Multi-Platform Satellite Observations to Study the Atmospheric Evolution of Brown Carbon in Siberian Biomass Burning Plumes

by
Igor B. Konovalov
1,*,
Nikolai A. Golovushkin
1,2,
Matthias Beekmann
3 and
Solène Turquety
4
1
Institute of Applied Physics, Russian Academy of Sciences, 603950 Nizhny Novgorod, Russia
2
Institute of Economics and Management, Nizhny Novgorod State Technical University n.a. R.E. Alekseev, 603950 Nizhny Novgorod, Russia
3
Université Paris Cité and Univ Paris Est Creteil, CNRS, LISA, F-75013 Paris, France
4
Laboratoire de Météorologie Dynamique (LMD), Sorbonne Université, École Polytechnique, École Normale Supérieure, CNRS, F-75005 Paris, France
*
Author to whom correspondence should be addressed.
Remote Sens. 2022, 14(11), 2625; https://doi.org/10.3390/rs14112625
Submission received: 28 March 2022 / Revised: 9 May 2022 / Accepted: 27 May 2022 / Published: 31 May 2022
(This article belongs to the Special Issue Remote Sensing of Atmospheric Aerosol Using Spaceborne Observations)

Abstract

:
A bulk of evidence from in situ observations and lab experiments suggests that brown carbon (light-absorbing organic compounds in particles) can provide a significant yet highly variable contribution to the overall light absorption by aerosol particles from biomass burning (BB). Partly stemming from the complexity of the atmospheric evolution of organic aerosol (OA), the variability in brown carbon (BrC) absorption makes it difficult to partition the radiative effects of BrC and black carbon (BC) in atmospheric and climate models; as such, there are calls for satellite-based methods that could provide a statistical characterization of BrC absorption and its evolution in different regions of the world, especially in remote BB regions, such as Siberia. This study examined the feasibility of the statistical characterization of the evolution of BrC absorption and related parameters of BB aerosol in smoke plumes from intense wildfires in Siberia through the analysis of a combination of data from three satellite instruments: OMI (Ozone Monitoring Instrument), MISR (Multi-Angle Imaging SpectroRadiometer), and MODIS (Moderate Resolution Imaging Spectroradiometer). Using a Monte Carlo method, which related the satellite retrievals of the absorption and extinction aerosol optical depths to Mie theory calculations of the optical properties of BB aerosol, we found that the BrC absorption, as well as the imaginary refractive index for the OA, decreased significantly in Siberian BB smoke plumes during about 30 h of the daylight evolution, nevertheless remaining considerable until at least 70 h of the daylight evolution. Overall, the study indicated that the analysis of multi-platform satellite observations of BB plumes can provide useful insights into the atmospheric evolution of BrC absorption and the partitioning of BrC and BC contributions to the total light absorption by BB aerosol.

Graphical Abstract

1. Introduction

Aerosol particles emitted from open biomass burning (BB) constitute a major fraction of aerosol emissions from combustion sources and, as such, contribute significantly to the radiative budget of the atmosphere and the aerosol radiative forcing, both at global and regional scales, through the direct aerosol–radiation interaction [1,2,3] by impacting the formation and lifetime of clouds [4,5,6] and affecting the carbon fluxes in ecosystems [7]. The direct interaction of BB aerosol with solar light is mostly determined by a balance between light scattering by organic aerosol (OA) and light absorption by black carbon (BC) and brown carbon (BrC), with the latter being comprised of a complex mixture of light-absorbing organic compounds. Strong variability in the sources, chemical composition, and mixing state of BB aerosol results in large uncertainty in the available estimates of the aerosol radiative forcing due to the anthropogenic impact on BB emissions [8,9,10]. Among the potentially important yet poorly investigated factors contributing to this uncertainty is insufficient knowledge of the direct radiative effect of BrC, which is estimated at the top of the atmosphere to range globally from 0.03 to 0.6 W m2 (e.g., [11,12,13,14]).
The broad range of the available estimates of the radiative effect of BrC reflects a high variability in both the OA mass fraction in BB smoke and absorptive properties of particulate organic matter, as well as the fact that BrC is formed by chemically active organic species, which can be produced or destroyed during the atmospheric evolution of BB aerosol. Findings from lab studies suggest that the magnitude of the BrC contribution to the light absorption by fresh BB aerosol strongly depends on the fuel type and the fire regime, generally increasing with a decrease in the modified combustion efficiency [15,16]. There is also abundant evidence based on both atmospheric observations and lab studies showing that the absorption enhancement due to BrC can strongly vary during the atmospheric evolution of BB aerosol, either increasing or decreasing (e.g., [17,18,19,20,21,22]).
The strong variability of the BrC content across individual samples of BB aerosol calls for observational information that would be representative of typical BrC absorption properties and their time evolution in different regions of the world [13,23]. Such information could further be used as a constraint on BB aerosol absorption properties in regional and global models, in addition to the a priori knowledge of the chemical composition of BB emissions provided as emission factors [24].
Presently, the most abundant data characterizing the contribution of organic compounds to the absorption properties of fresh and aged BB aerosol are available from laboratory experiments (e.g., [15,16,19,20,21,25,26,27]). The results of these experiments advanced the fundamental knowledge of BB aerosol but their representativeness of real atmospheric conditions is not always clear. Useful insights into possible regional differences in characteristics of the BrC absorption in BB plumes, indicating that these differences can be significant, are provided by field observations of the optical and physical properties of BB aerosol [17,22,28,29,30,31]. In particular, the analysis of BB aerosol samples collected by aircraft in BB plumes over several regions in the U.S. revealed that BrC gradually vanished with the BB aerosol age, almost disappearing after about 1 day of atmospheric exposure [17]. In contrast, an aircraft campaign conducted in Western Africa indicated that BrC formation in BB plumes strongly dominated over its loss, at least during the first 12 h of the atmospheric evolution [22]. However, such field observations are sparse and have very limited temporal and spatial coverage. In particular, to the best of our knowledge, there have been no field campaigns investigating the evolution of BrC in Siberia, which is one of the largest source regions of BB aerosol in the world [32].
Numerous studies derived information on BrC absorption from remote sensing measurements at Aerosol Robotic Network (AERONET) by exploiting the fact that BrC absorption cross-section rapidly increases with decreasing wavelength in the visible and near-UV regions [33,34,35,36,37,38,39,40]. Although the AERONET data have been shown to provide useful insights into the evolution of BrC [18,38], the quality assured AERONET observations of BB plumes in remote regions are rather sparse [40,41], which hampers their use for achieving a better quantitative understanding of BrC formation and loss processes. Furthermore, the BrC absorption at the shortest wavelength of the AERONET observations (440 nm) is typically rather weak compared to the absorption at shorter wavelengths [42], which makes the use of AERONET data to constrain the radiative effect of BrC even more challenging.
Several studies indicated the feasibility of inferring BrC absorption in BB plumes from satellite observations. In particular, accounting for BrC absorption in retrievals from the Ozone Monitoring Instrument (OMI) measurements allowed for improving the agreement of the retrieved values for aerosol optical depth (AOD) and single scattering albedo (SSA) with the corresponding AERONET observations in a biomass burning region in South America [41]. Evidence for a strong BrC absorption in BB plumes in South America from the OMI observations was found to be consistent with similar evidence from the ground-based radiometric measurements in the UV-A spectral region [42]. Furthermore, the OMI-retrieved absorption AOD (AAOD) combined with the extinction AOD derived from the Moderate Resolution Imaging Spectroradiometer (MODIS) observations provided useful insights into the role of BrC in the atmospheric evolution of the AAOD in BB plumes in Siberia [43]. Apart from the OMI observations, satellite observations retrieved using an experimental (research) aerosol retrieval algorithm from the Multi-Angle Imaging Spectrometer (MISR) measurements were also recently shown to provide a meaningful, albeit mostly qualitative rather than quantitative, characterization of BrC absorption in BB plumes [44]. Note that a possible strong wavelength dependence of the imaginary refractive index (IRI) of organic aerosol has not yet been explicitly accounted for in the standard MISR algorithm [45], and therefore, the corresponding MISR data are not informative regarding BrC absorption. Overall, to the best of our knowledge, no methods have been proposed to constrain the BrC absorption in BB plumes by using the standard satellite data products mentioned above.
This study was primarily motivated by the need to constrain the absorption properties of BB aerosol emitted from wildfires in Siberia. Siberian fires are recognized as an important source of BC transported to and deposited in the Arctic [46], where rapid climate changes are observed and various components of atmospheric aerosol are known to contribute significantly to the regional radiative balance [47]. There is, however, much fewer data about the contribution of Siberian fires to non-BC light-absorbing aerosol, which has been found in Arctic snow in significant quantities along with BC [48]. Evidently, this contribution depends not only on primary emissions of BrC and transport patterns but also on the BrC atmospheric evolution, which is, as indicated above, still poorly known.
Given our previous experience of combining data from different satellites to study phenomena associated with biomass burning [43,49,50,51], we assumed that useful constraints on the BrC absorption can be derived from a combination of observations performed by the three different satellite instruments mentioned above. Accordingly, the goal of this study was to investigate the feasibility of constraining BrC absorption and its evolution in Siberian BB plumes by using the standard aerosol data products derived from the OMI, MISR, and MODIS measurements.
We analyzed the satellite data that were available for a big Siberian region in July 2016. In this period, major forest fires occurred both in the western and eastern parts of Siberia [43,52,53]. The study region and period were determined by taking into account the availability of estimates of the photochemical age of BB aerosol from our previous studies and the need to isolate Siberian forest fires from other fires (such as grass fires in Kazakhstan) that are likely to emit BB aerosol featuring different absorption properties than forest fires.
To the best of our knowledge, this is the first study in which satellite observations of BB aerosol were used for quantitative statistical characterization of BrC absorption and its atmospheric evolution. Hence, despite the temporal and spatial limitations of our analysis, we regard this study as a significant step forward toward creating the satellite measurement-based climatology of BrC absorption in BB plumes in major BB regions.
An overview of the study design is presented in Figure 1. The input data that were used for our analysis are described in Section 2.1. The analysis methods are described in Section 2.2. Our main results are presented in Section 3 and then discussed in Section 4. The objectives, methods, and results of the study are summarized in Section 5.

2. Materials and Methods

2.1. Measurement and Simulation Data

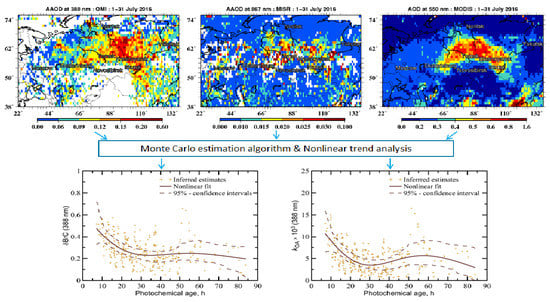
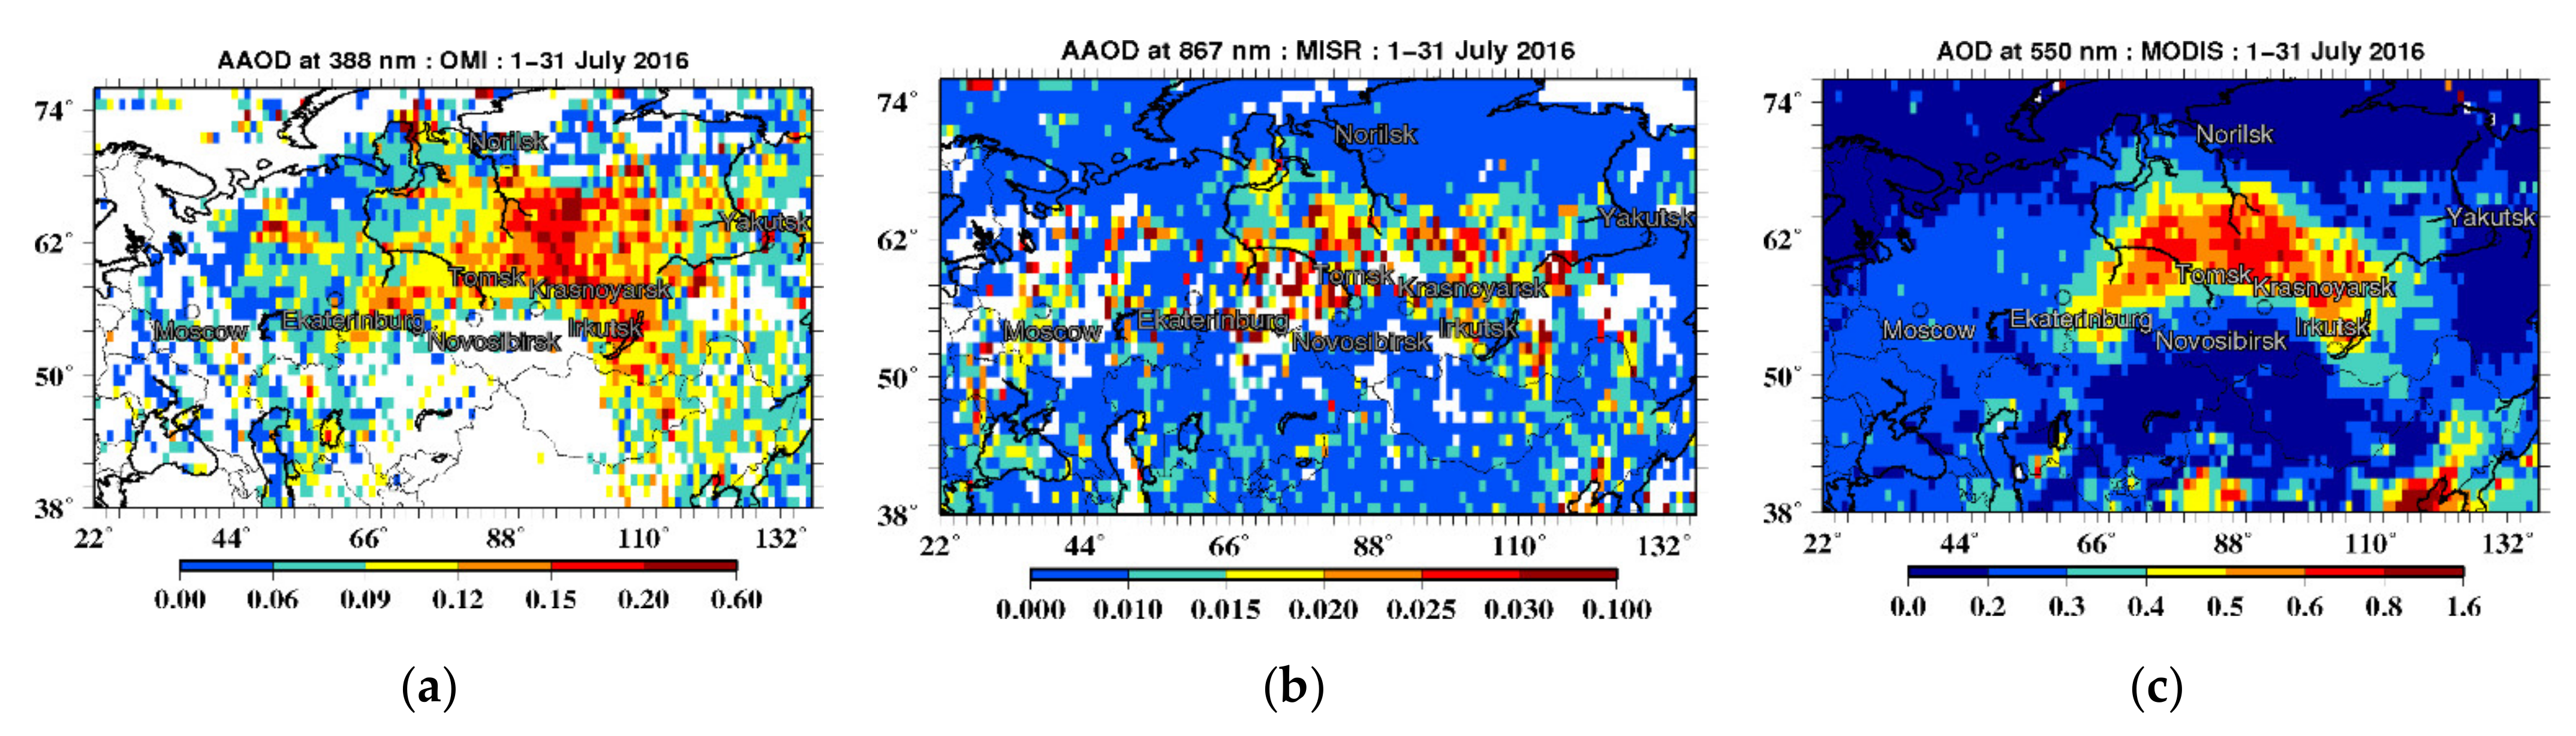
2.1.1. Satellite Data

In this study, the key information on BrC absorption was inferred from the AAOD values retrieved at the 388 nm wavelength from the OMI observations onboard the EOS Aura satellite. Similar to our previous studies that exploited the OMI AAOD observations [43,50], we used the Level-2 OMAERUV data product [54,55] (v1.8.9.1) available from the NASA EarthData portal (https://search.earthdata.nasa.gov/, accessed on 15 February 2022). This data product has been derived from the differences between the spectral radiances measured at the top of the atmosphere and those calculated for a hypothetical purely molecular atmosphere by using a set of pre-defined aerosol models from a look-up table.
The OMAERUV algorithm segregates the retrievals into three assumed aerosol types (biomass burning, urban, and desert dust), with the OMI observations representative of BB aerosol being identified based on values of the CO column amounts retrieved from AIRS (Atmospheric Infrared Sounder) measurements [54]. Only the data for BB aerosol were used in this study. Another important feature of the OMAERUV (v1.8.9.1) algorithm is that the IRI for BB aerosol particles is assumed to depend on the wavelength, making it possible to account for the BrC absorption [41]. It is also noteworthy that the aerosol optical properties were retrieved by assuming five different locations of the center of mass of the aerosol vertical distribution: 0, 1.5, 3.0, 6.0, and 10 km above the surface, and the data product includes the AAOD retrievals for each of these locations. Hence, additional information on the vertical distribution of aerosol particles was needed to ensure the best fit of the retrievals to the properties of the BB aerosol in real smoke plumes. Following our previous studies involving the OMI AAOD retrievals [43,50], we obtained this information from simulations with a chemistry transport model (see Section 2.1.3). Finally, one more important feature of the OMAERUV data product is that the quality-assured AOD and SSA retrievals are much less abundant than the AAOD retrievals [43,50]. For this reason, the OMI AOD and SSA data were not used in the given study. The nominal spatial resolution of the OMI AAOD retrievals is 13 × 24 km2 at nadir. Although, to the best of our knowledge, quantitative estimates of the accuracy of the OMI AAOD data have not yet been reported in the literature, the AOD and SSA retrievals were previously compared with AERONET data in different regions of the world and were found to be in good quantitative agreement with them [56,57], with correlation coefficient values of 0.75 or better obtained at 50% of sites in the case of the AOD retrievals. Furthermore, the OMI AAOD data were found to be consistent (either directly or through 3D model simulations) with in situ, aircraft, and remote sensing measurements of BB aerosol in Siberia [50]. Several studies (which were mentioned in the Introduction) indicated that the AAOD values retrieved from the OMI observations are sensitive to the BrC content in BB aerosol [41,42,43] and even enable quantitative characterization of the BrC contribution to the total absorption of light by BB aerosol at 388 nm [43].
Note that the most reliable estimates of the aerosol properties (AAOD, AOD, and SSA) are provided by the OMAERUV algorithm only for the 388 nm wavelength [54], even though the OMAERUV data product reports values of the same properties also for the 354 and 500 nm wavelengths as a result of transformations from 388 nm. Since these transformations are determined by the assumed models of aerosol, the reported values for the 354 and 500 nm wavelengths are regarded as less reliable [54]. Based on these considerations, we opted not to use these values in our analysis. To estimate the absorption Ångström exponent (AAE), which is indicative of the contribution of BrC to the light absorption by BB aerosol [40], we used, along with the OMI retrievals of the AAOD at 388 nm (henceforth, AAOD388), the AAOD at 867 nm (henceforth, AAOD867) derived from the MISR measurements aboard the NASA EOS Terra. Specifically, we used the data from the level 2 version 23 (MIL2ASAE) [45] available with a nominal horizontal resolution of 4.4 km from the NASA LaRC ASDC file system (https://urs.earthdata.nasa.gov/, accessed on 1 October 2021). The MISR algorithm exploits a unique capability of the MISR instrument, namely, multi-angle imaging at four wavelengths (447, 558, 672, and 867 nm), to obtain view-angle and wavelength-dependent equivalent reflectances at the top of the atmosphere (TOA), which are then compared to radiances computed with a coupled atmosphere/surface radiative transfer model for a pre-defined set of 74 aerosol compositions and particle size distributions (aerosol models). The aerosol model that enables the best fit of the computed TOA atmospheric path radiances to those derived from the MISR measurements is selected to provide the column aerosol parameters and properties.
As noted in the Introduction, the standard MISR aerosol algorithm does not take into account a possible wavelength dependence of the IRI of organic aerosol particles. Hence, it is not feasible to derive the BrC absorption (which is typically associated with an increase in the IRI at shorter wavelengths) directly from the MIL2ASAE data. However, since BrC is likely to provide only a very minor contribution to the absorption at the green, red, and near-infrared bands of the MISR measurements, we assumed that the retrieved absorption properties of BB aerosol for the corresponding wavelengths are not significantly biased, even when the BrC contribution to the absorption at the near-UV region is considerable. For definiteness, we used the MISR data for the 867 nm wavelength, assuming that they are the least affected by the actual BrC absorption. The AAOD values needed for our analysis (but not directly provided by the MIL2ASAE data product) were derived from the SSA and AOD retrievals:
AAOD = AOD × 1 SSA ,
where all values correspond to the 867 nm wavelength.
A preceding version (version 22) of the MISR aerosol product (which has the spatial resolution of 17.6 × 17.6 km2) was extensively validated against AERONET and other ground-based photometer observations, e.g., [58,59,60,61,62], although the validation studies mainly focused on the AOD retrievals. For example, Petrenko and Ichoku [61] found that the coefficient of determination (R2) of the MISR AOD retrievals relative to AERONET observations worldwide was 0.73 in summer, and the root-mean-square error (RMSE) was 0.13. Garay et al. [45] reported evidence that the accuracy of the AOD retrievals provided as part of the version 23 MISR aerosol product is comparable to that of the version 22 AOD retrievals over land and is significantly better over oceans. In contrast to the AOD retrievals, the SSA retrievals available as part of MIL2ASAE have not been extensively evaluated (mainly due to the fact that the SSA data suitable for validation of MISR retrievals are too sparse [62]), and accordingly, have been regarded as semiquantitative [45]. Details on the MISR aerosol retrieval procedure and further information on the validation of the MISR aerosol data product used in this study can be found elsewhere [46].
We emphasize that the SSA values available from MIL2ASAE were involved in our analysis only to derive the AAOD values according to Equation (1), while the use of the SSA as an independent input variable in our estimation algorithm was avoided. We took into account the fact that not only have the retrieved SSA values been insufficiently validated, but they are also rigidly determined by a limited number of aerosol models. These models can impose unnecessary limitations on our estimates of the aerosol absorption characteristics, leading to uncontrollable biases in them. Our particular concern was that these aerosol models are not necessarily always able to fit the possible variability of the size distribution of BB aerosol particles. As this variability can be manifested as strong and wavelength-dependent changes in the aerosol optical properties [18,43], the retrieved absorption parameters and the SSA values for BB aerosol may be affected by systematic errors. However, since the AAOD values are determined not only by the SSA but also by the AOD, the uncertainties in the AAOD are likewise dependent on uncertainties in both the SSA and AOD. Taking into account that the retrieved values of the AOD depend on the optical and microphysical aerosol properties assumed in the same aerosol models that were used to retrieve the SSA and the relation between the retrieved AOD and the intrinsic aerosol properties is likely very complex [45], we expected a complex combination of observation and retrieval errors in the AAOD to behave in a random-like fashion. This expectation was justified in part by a comparison of the satellite data with AERONET retrievals (see Section 2.1.4 below).
Using the AAOD388 and AAOD867 values derived from the OMI and MISR observations, we computed the absorption Ångström exponent (AAE388/867) as follows:
AAE 388 / 867 = log AAOD 388 / AAOD 867 / log 388 / 867 .
Since the AAE is undefined when the AAOD is zero, all the MISR retrievals corresponding to an SSA of 1 were disregarded. Such selection could, in principle, result in a positive bias in the average of the AAOD867 values. Nonetheless, as evidenced by our analysis presented below in Section 2.1.4, the AAOD388-to-AAOD867 ratio that determines AAE388/867 according to Equation (2) is not significantly biased in Siberian BB plumes. This fact may indicate that the MISR retrievals featuring an SSA of 1 are mostly not representative of dense BB plumes in Siberia.
Finally, we also used the AOD at 550 nm (denoted below as AOD550) derived from the MODIS measurements [63] aboard the Aqua and Terra satellites. The AOD data with a nominal horizontal resolution of 10 × 10 km2 were obtained from the Collection 6.1 Level-2 MODIS data products [64] as the merged “dark target” and “deep blue” AOD retrievals. The MODIS AOD values demonstrated a good agreement with the AERONET-observed AOD values, indicating a high quality of the MODIS aerosol data products [64].
Following our previous study [44], we considered the ratios of the AAOD and AOD values retrieved at different wavelengths as proxies for the SSA, which, along with the AAE, was found to provide a useful constraint on the absorption properties of OA in BB plumes [40]. Unlike the SSA values from the MISR aerosol product, the AAOD and AOD values considered here were not linked through a common aerosol model, and thus their ratio was likely to be less dependent overall on any specific assumptions involved in the retrieval algorithms. As possible “algorithmic” limitations contribute to the overall uncertainties in the AAOD/AOD ratios, along with many other uncertainty sources, they are not expected to preclude fitting these ratios by an independent aerosol model. More generally speaking, the use of the data independently retrieved from observations performed by three (rather than one or two) different satellite instruments in our analysis reduces the possibility of biases that may appear in our estimates of the BrC absorption due to error covariances between the different input variables and is deemed to be necessary for enhancing the reliability of our estimates.
All the satellite data described above were projected onto the same 1° × 1° grid covering most of Siberia, as well as some adjacent regions in Northern Eurasia. Different observations falling into the same grid cell and corresponding to the same hour were averaged. The spatial distributions of the temporal averages of the AAOD388, AAOD867, and AOD550 retrievals projected onto our grid are shown in Figure 2. Since the satellite observations considered here were made with three different instruments from three different satellites, a harmonization procedure was needed to increase the probability that the different observations represent the same BB plumes. To this end, we required that the time difference between the OMI, MISR, and MODIS observations for a given grid cell should not exceed two hours. The available data that did not satisfy this requirement were disregarded. A similar 2 h difference between the different satellite observations was imposed in Konovalov et al. [43]. The remaining inconsistencies and mismatches between the satellite observations performed by the different instruments are expected to result in random errors (noise) in the characteristics inferred in this study, rather than in any persistent biases in them. Furthermore, to minimize the chances that some of the measurements covered the background scenes rather than BB plumes, we disregarded any gridded data points for which AOD550 was less than 0.8: the indicated threshold value was chosen (as in Konovalov et al. [40]) by taking into account the fact that the “background” AOD in the absence of fires in Siberia is typically less than 0.2 [43,50,65]. This AOD-based selection criterion complements a CO-based criterion applied within the OMAERUV algorithm to the OMI data (see above) and is intended to further reduce the impact of the background aerosol on our estimates of the BrC absorption. To diminish the complex and uncertain effects of hygroscopicity of aerosol particles on our estimates, we also disregarded any observations corresponding to the scenes with the relative humidity (RH) within the aerosol column larger than 70%. The RH was estimated using a chemistry transport model, as described in Section 2.1.3. In addition, we excluded any observations south of 50° N since those observations could be affected by fires that occurred outside of Siberia.
Figure 3 illustrates the same data as in Figure 2 but after applying the data harmonization procedure. The amount of data was consequently drastically reduced, which was mostly due to the lack of matched data from OMI and MISR observations. Note that the MODIS AOD data were much more abundant than the OMI and MISR data considered here, and the availability of the MODIS data did not pose any noticeable limitation on the size of the harmonized data set. The remaining data were mostly representative of the hot spot in Siberia. There were also a few remaining data points in the European part of Russia, which were due to the mentioned episode of outflow of BB plumes from Siberia [43,52,53]. The observations illustrated in Figure 3 were used as the input data for our analysis described below. Note that any data pixel shown in Figure 1 and Figure 2 can correspond to several observations taken on different days during the study period.
The three sets of the pre-processed and harmonized satellite observations were combined to estimate the three characteristics mentioned above, that is, AAE388/867 along with the AAOD388/AOD550 and AAOD867/AOD550 ratios. These three characteristics constituted the components of the observation vector for our estimation algorithm described below in Section 2.2.1. The AAOD388/AOD550 and AAOD867/AOD550 ratios are referred to below as the absorption-to-extinction ratios and are abbreviated, respectively, as AER388/550 and AER867/550.

2.1.2. AERONET Data

AERONET data were used in this study for auxiliary purposes, such as validation of the satellite observations (see Section 2.1.4) and testing of our estimation algorithm (see Section 2.2.3). AERONET is a network of sun–sky radiometers located at more than 500 sites worldwide [66]. The radiance measurements are processed using a unique algorithm that enables the retrieval of multiple optical and physical properties of aerosol [67]. In this study, we used quality-assured AAOD retrievals available for 440, 675, and 870 nm wavelengths as part of the Level 2.0 Version 3 inversion products, as well as AOD Level 2.0 data provided for the 500 and 675 nm wavelengths as the Version 3 Direct Sun Algorithm product (https://aeronet.gsfc.nasa.gov/, accessed on 21 October 2021). As noted above, multiple studies used the AERONET observations to make inferences on the aerosol composition and BrC absorption [33,34,35,36,37,38,39,40].
Following our previous study [40] in which the BrC absorption in Siberian BB plumes was analyzed using AERONET data, we used the Level 2 AAOD, SSA, and AOD data from the Tomsk_22 (56.4°N, 84.7°E) and Yakutsk (61.7°N, 129.4°E) AERONET sites, which are situated in western and eastern Siberia, respectively. For the algorithm testing, we considered all the data available from these sites for the summer months (June–August) by the end of 2020 (as in Konovalov et al. [40]). However, taking into account the availability of the data characterizing the BB aerosol photochemical age from our 3D model simulations, the summer observations for only two years—2012 and 2016—were employed for the validation of the satellite data. Our concept of using the AERONET data for 2012 to validate the satellite data for 2016 is explained below in Section 2.1.4. Note that the evolution of BrC absorption was not analyzed in Konovalov et al. [40]. The selected AERONET data were then used to derive the AOD and AAOD values at the wavelengths of the satellite observations. Specifically, since the 388 nm wavelength, for which the AAOD values are available from the OMI observations, is slightly outside of the wavelength range of the AERONET observations, the AAOD388 values representing the AERONET observations were obtained from the power-law extrapolation from available values of the AAOD at the 440 and 675 nm wavelengths. The power-law interpolation between the 675 and 870 nm wavelengths was used to estimate the AAOD at the 867 nm wavelength. To select the AERONET observations that were representative of BB plumes, we applied the same AOD-based criterion as the one applied to the satellite data. Specifically, we disregarded any data points with an AOD at 550 nm less than 0.8. Further details on these data and examples of the corresponding time series can be found elsewhere [40].

2.1.3. Simulation Data

In this study, we took advantage of the availability of simulated data from two previous studies of Siberian BB aerosol [43,50]. The simulations were performed with the CHIMERE chemistry transport model (v2017) [68] and covered (but were not limited to) the three summer months of 2012 [50] and the period from 15 June to 15 August of 2016 [43]. Note that the simulations for 2012 were used here only for validation purposes (see Section 2.1.4 below) and were not employed to obtain our main results reported in Section 3. The simulation results provided concentrations of multiple gas-phase and aerosol species from various sources (anthropogenic, biogenic, and pyrogenic), along with concentrations of model tracers that allowed for estimating the photochemical age of BB aerosol. However, most of these data, except for concentrations of two BB aerosol age tracers (T1 and T2), the vertical distribution of the BB aerosol mass concentration, and the relative humidity, were unused in the given observation-based study.
The atmospheric transport of the tracers and pollutants was driven by the meteorological processes simulated using the WRF model [69]. The BB emissions were derived using a well-established method [43,51,70] from satellite observations of the fire radiative power (FRP) [71] retrieved from the MODIS measurements. The FRP data were also used to calculate the maximum injection heights of BB emissions according to the parameterization of Sofiev et al. [72]. The parameterization was validated [72] through a comparison of the calculated injection heights for multiple fires that occurred in Canada, Siberia, and the US during the fire seasons of 2007 and 2008 with observations of the BB plume top using the MISR instrument [73]. Note that although the MISR-derived BB plume heights could, in principle, be used in our analysis instead of the corresponding simulated data, they are not provided as part of the MISR standard aerosol product and were not readily available for the region and period considered in this study. The simulations were performed with a horizontal resolution of 1° × 1° for 12 non-equidistant layers that extended up to the 200 hPa pressure level. Further details on the 3D model simulations used in this study can be found elsewhere [43,50]. The age tracers were simulated as hypothetical gases emitted from biomass burning with the same emission rate as particulate organic carbon. The tracer T1 behaved as an inert gas, while the tracer T2 decayed with the constant rate (kT) of 2.3 × 10⁻⁵ s−1 (about 1/12 h−1) during daytime (when the local zenith angle was less than 90°). The BB aerosol photochemical age (τa) was calculated using the columnar mass concentrations, namely, [T1] and [T2], of these tracers as follows [43]:
τ a = k T 1 l n T 1 / T 2 .
Note that according to Equation (3), the BB aerosol photochemical age is effectively estimated as the solar exposure time. As argued in Konovalov et al. [43], using Equation (3) to estimate the photochemical age implies that the photochemical processes affecting the BB composition and optical properties are active only during daytime and that the OH concentration within a BB plume is constant during the daytime and drops to zero during the nighttime. Such a simplified estimation reflects the lack of quantitative knowledge about the nighttime oxidation processes within BB plumes, as well as about the variability of the OH concentration within BB plumes.
The spatial distribution of the mean BB aerosol photochemical age in July 2016 is shown in Figure 4. The simulated data were selected consistently (in time and space) with the satellite data shown in Figure 3. It can be seen that relatively fresh BB aerosol dominated northeast of Krasnoyarsk and west of Norilsk. In July 2016, these locations roughly coincided with the “hot spots” of BB emissions; conversely, the most aged BB aerosol prevailed in the European part of Russia, where it was transported from Siberia [43].

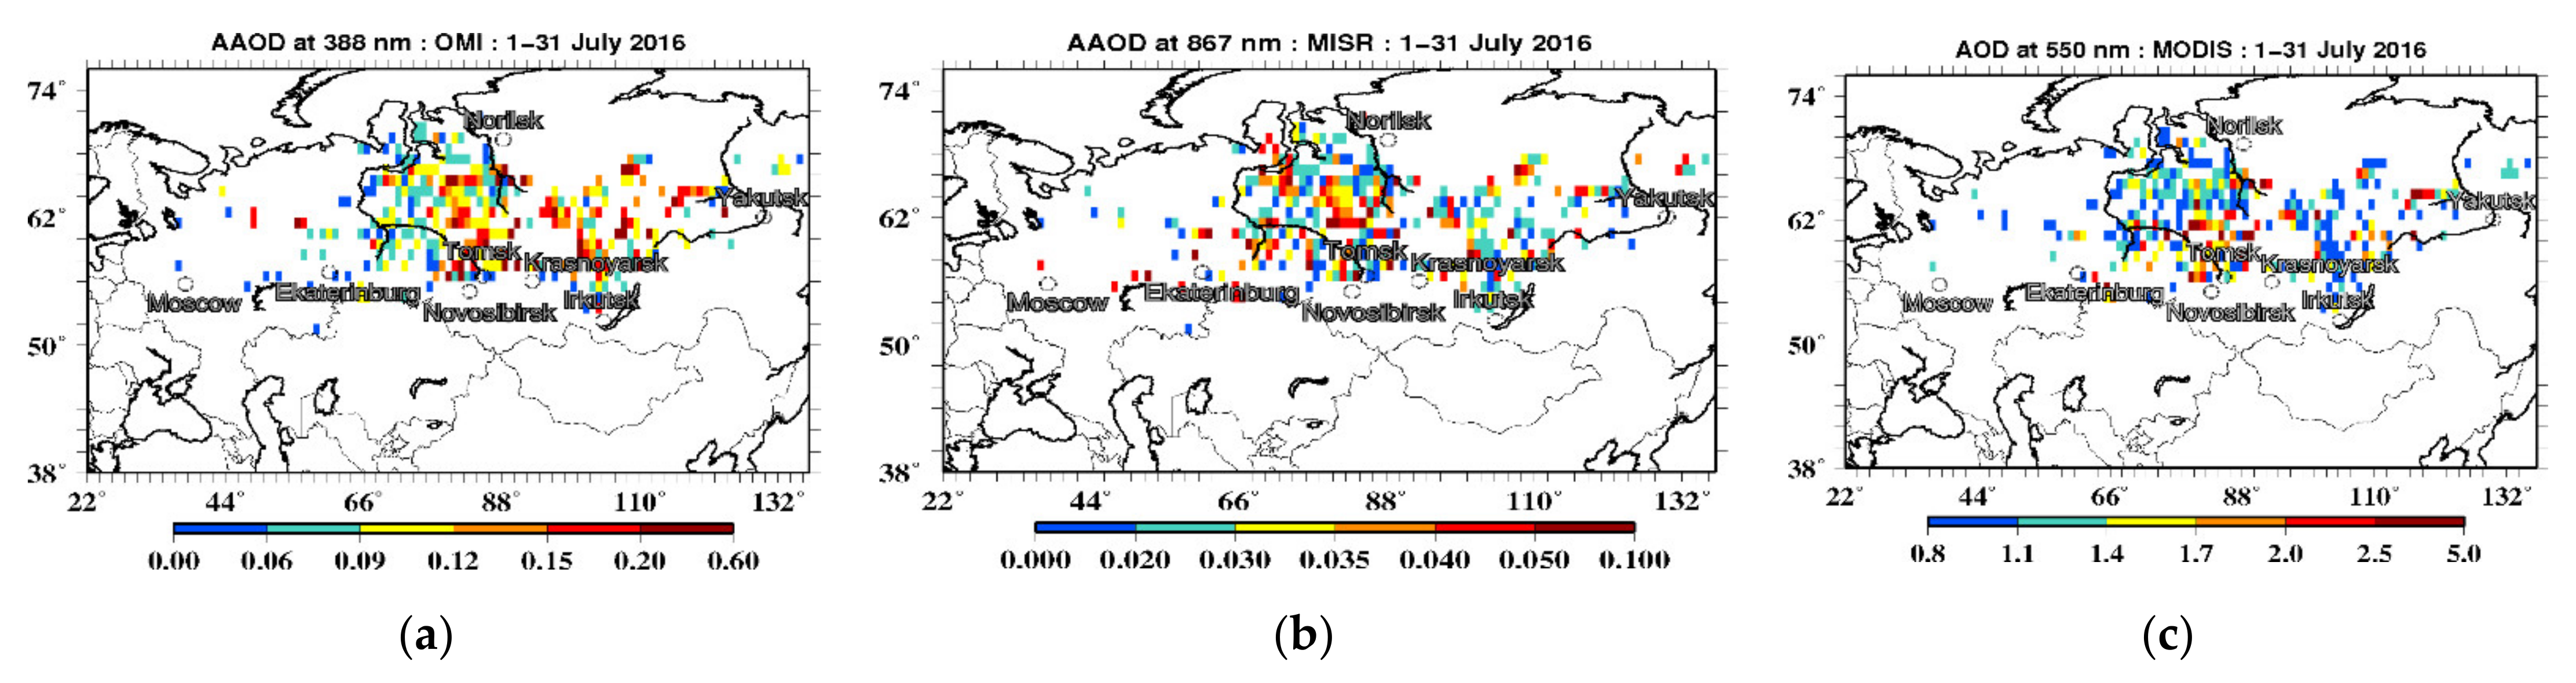
2.1.4. Validation of the Satellite Data against the AERONET Observations

Ground-based observations that are commonly employed to validate satellite retrievals are usually supposed to be matched to the satellite data, both in time and space. This common approach, however, turned out to be infeasible in this study because the MISR and OMI observations that are both representative of BB aerosol (according to the criteria formulated above) and coincident with the AERONET observations at the two Siberian sites (see Section 2.1.2) are extremely scarce. Given this limitation, instead of requiring the satellite and AERONET data to match in time and space, we only required that they represent Siberian BB aerosols of similar ages. Our underlying assumption was that a sufficiently large ensemble of the AERONET data from the two Siberian sites situated in Western and Eastern Siberia was representative, on average, of the typical intensive optical properties of Siberian BB aerosol of the corresponding age, regardless of the fact that the observations were made at particular points in space and time. Accordingly, we expected that if both satellite and AERONET observations in Siberia were unbiased, the Siberian BB aerosol intensive optical properties derived from the satellite and AERONET in the same region should be quantitatively similar, even if they did not match in time and space. Consistent with this consideration and availability of the model estimates of the BB aerosol photochemical age, the AERONET data used in the analysis presented in this section included the observations for both 2012 and 2016.
Note that a similar approach to the validation of satellite observations of BB aerosol was previously used in Konovalov et al. [50], except that the satellite and AERONET data were compared there even regardless of the photochemical age of BB aerosol: it was found that the AER388/550 derived from the OMI and MODIS measurements over Siberia was, on average, close to that derived from ground-based measurements at the same AERONET sites as in this study (but only in 2012), and this finding was regarded as evidence that the satellite-derived values of AER388/550 for Siberian BB aerosol were sufficiently reliable.
To ensure the BB aerosol age consistency between the satellite and ground-based observations, we went through our data set of the pre-processed satellite observations (Section 2.1.1) and checked whether there was any AERONET observation that matched a given data point from the satellite data set with regard to photochemical age. The observations were considered as matching each other only if the relative difference between values of the BB aerosol photochemical age in the satellite and AERONET data would not exceed 10%. The combined set of data satisfying this condition included 347 satellite observations and 29 data points of the AERONET observations.
A comparison of the satellite and AERONET observations is presented in Figure 5. We characterized the AAOD388/AAOD867, AAOD867/AOD550, and AAOD388/AOD550 ratios by considering the slopes of the linear fits (through the origin) to the relationships between the corresponding pairs of the aerosol optical depths. A similar approach was used in our previous study [50]. As evidenced by Figure 5, the estimates based on the satellite and AERONET data agreed with each other within the 95% confidence intervals. That is, the probability of a type I error (in our case, the error of assuming that the slopes estimated using the satellite and AERONET data were different) was found to exceed at least 0.05 (and was actually much bigger). Furthermore, there was a close quantitative agreement between the mean values of the AAOD (at both wavelengths) estimated using, on the one hand, the OMI and MISR data and, on the other hand, the AERONET data. We regarded this occasional quantitative agreement for the extensive optical properties (which was not expected given that the satellites and ground-based photometers observed different BB plumes) as an additional indication that both the satellite and AERONET data selected for our comparison were equally representative of the major optical properties of Siberian BB aerosol.
Note, however, that the above comparison did not take into account a possible extrapolation error in the AAOD388 values derived from the AERONET observations. This error is likely to result in some underestimation of the derived AAOD388 values because AAE for BB (BrC-containing) aerosol is likely to increase at shorter wavelengths. The magnitude of this underestimation is difficult to quantify but to obtain a tentative idea about it, we considered the measurements of smoke aerosol absorption parameters in the Amazon region [42]. According to these measurements, using the AERONET observations at 440 and 870 nm to estimate AAOD at 388 nm would result, on average, in an underestimation of AAOD388 of about 15%. We regard this crude estimate as an indication that the systematic bias in the AAOD388 values derived from AERONET observations of BB burning plumes was unlikely to exceed the range of random uncertainties in the estimates of the AAOD388/AAOD867 ratio from the AERONET data (which was about 35%).
Overall, the comparison presented in this section did not reveal any evidence for major biases in the satellite data used in our analysis, although it should be kept in mind that this comparison did not distinguish between the observations of fresh and aged BB aerosol. Validation of the ability of the satellite data to adequately represent the atmospheric evolution of BB aerosol in the framework of this study was hampered by the scarcity of the AERONET data, especially those representing fresh BB aerosol.

2.2. Analysis Method

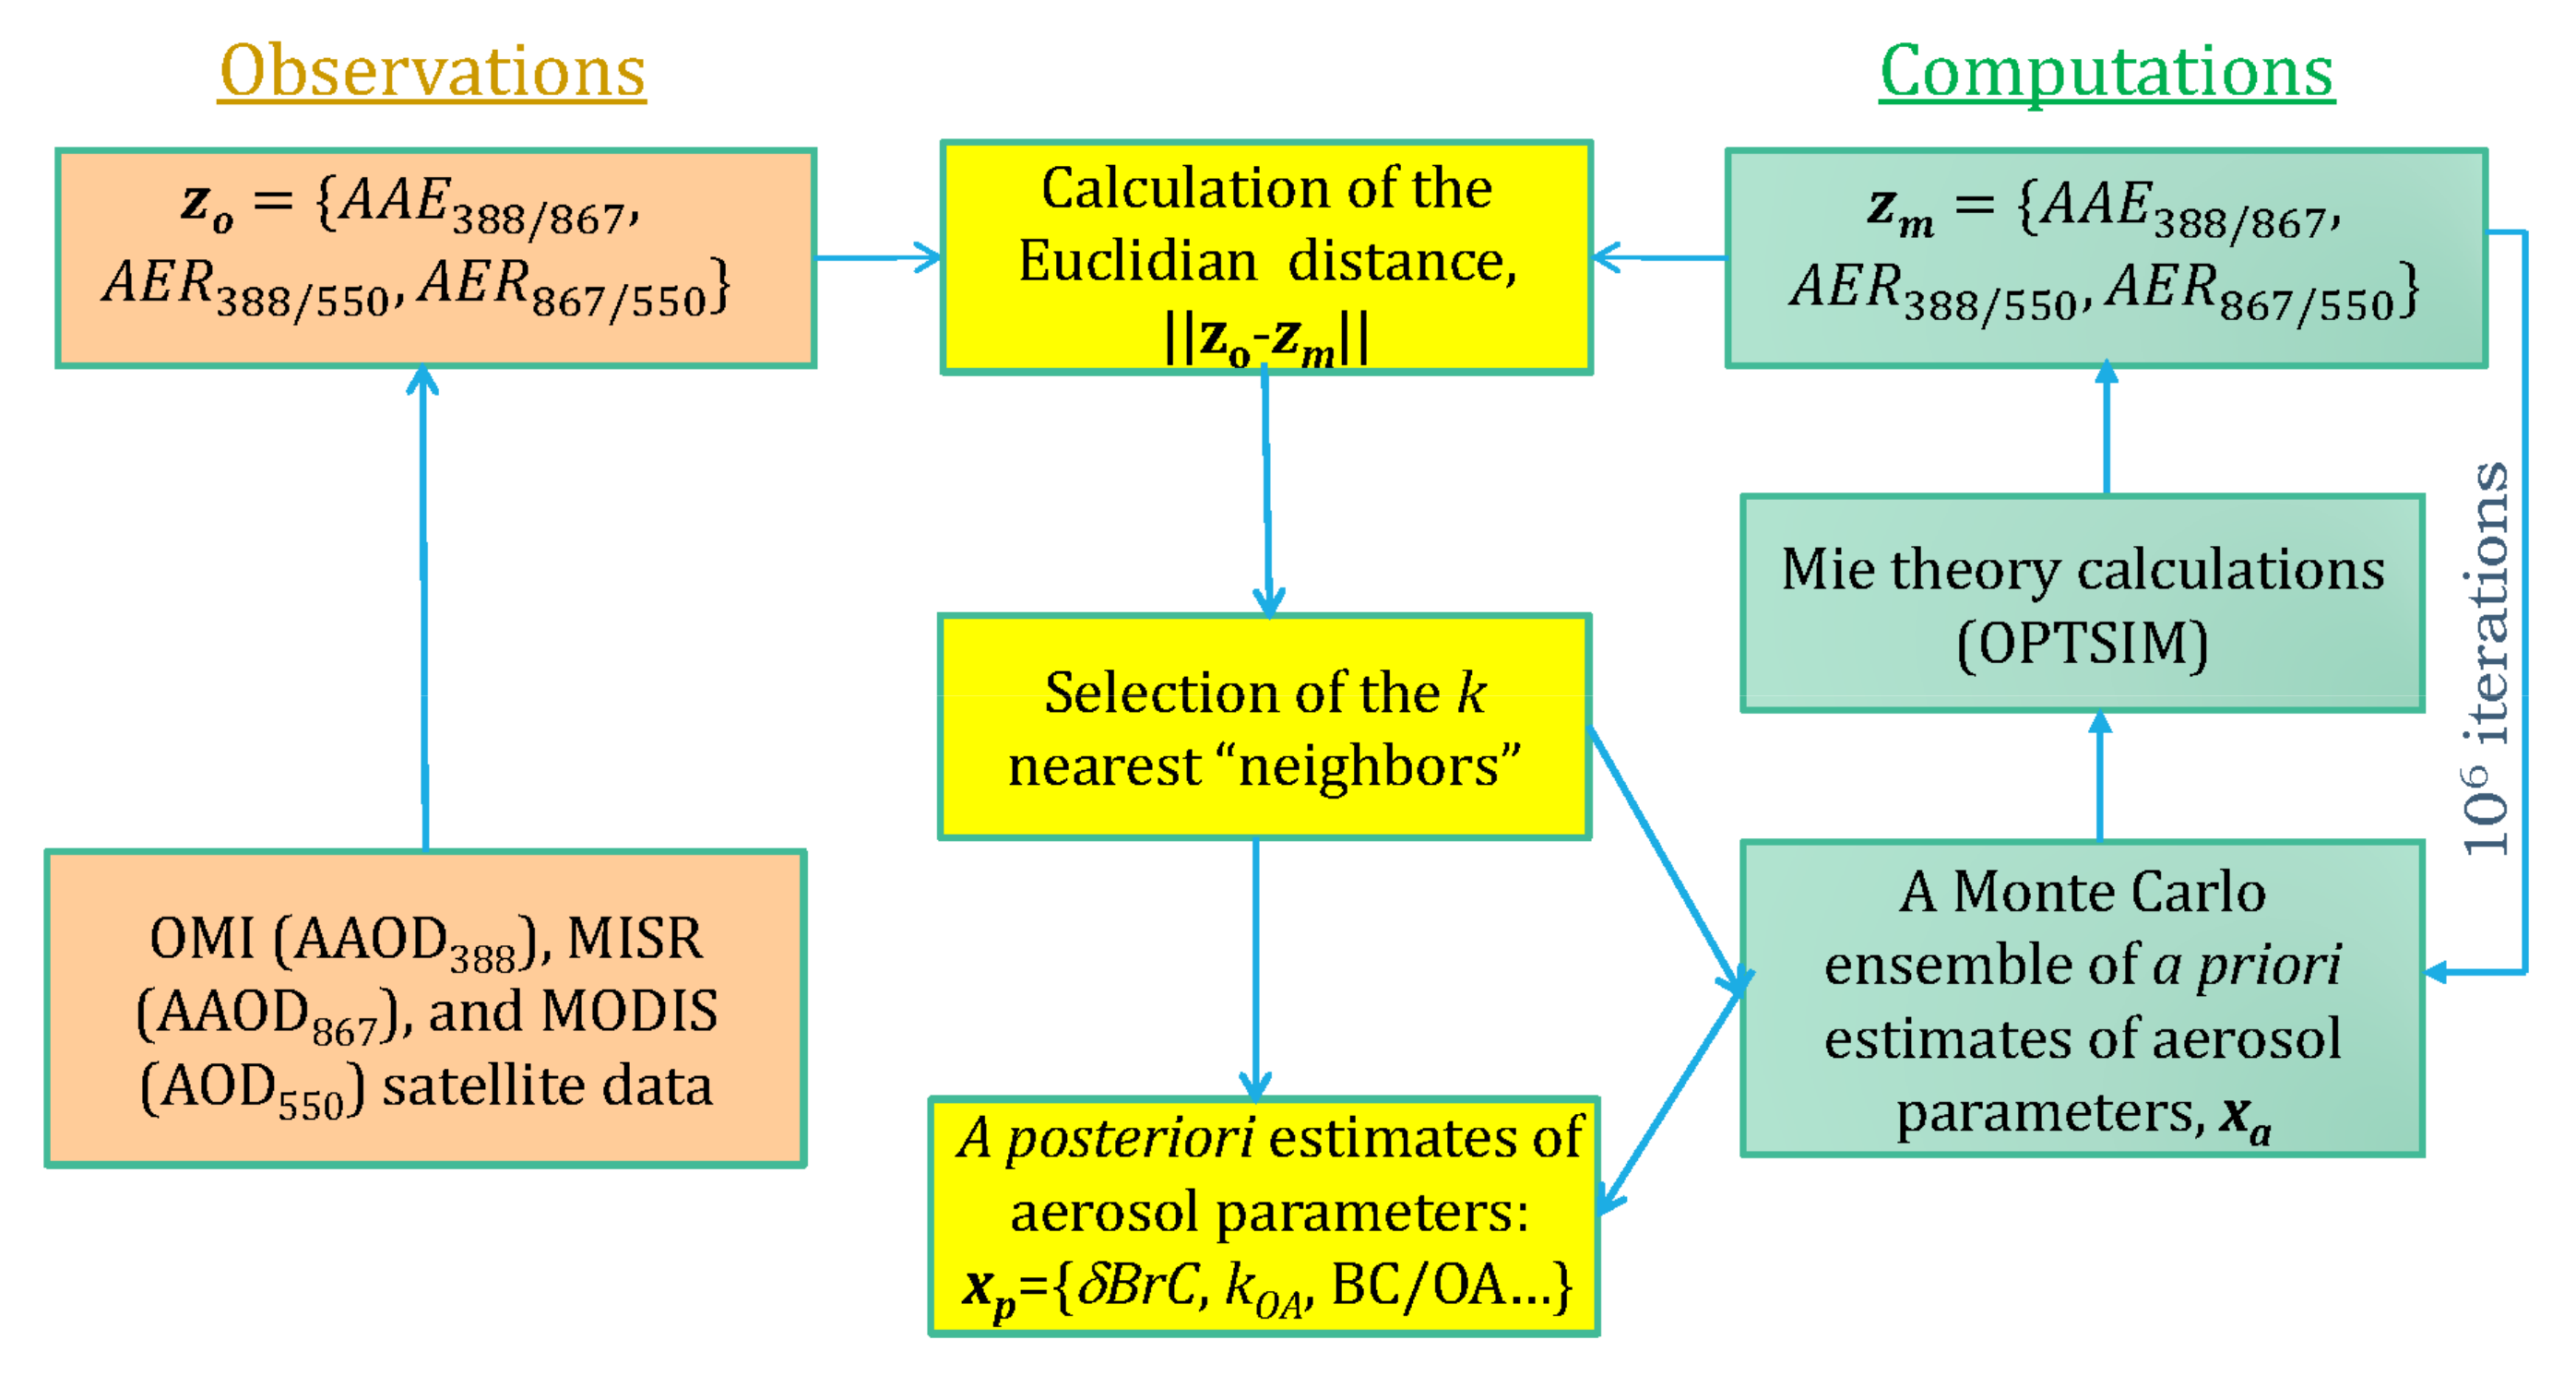
2.2.1. Monte Carlo Algorithm for Estimation of the BrC Absorption Parameters

Our algorithm described in this section was designed to derive estimates of the following three quantities: (1) the relative contribution of BrC to the light absorption by BB aerosol at the 388 nm wavelength (this quantity is denoted below as δBrC), (2) the IRI for the organic component of BB aerosol (kOA), and (3) the ratio of the BC and OA mass concentrations in BB aerosol particles (the BC/OA ratio) from satellite observations described in Section 2.1.1. Similar to Konovalov et al. [40], δBrC is defined through the mass absorption efficiency as follows:
δ BrC = 1 α a | k OA = 0 α a ,
where αa is the mass absorption efficiency of BB aerosol and αa|kOA = 0 is the same property in a hypothetical situation where the OA is non-absorbing (kOA = 0).
More formally, the algorithm was aimed at inferring the components of a control vector x, which characterizes the chemical composition and microphysical structure of BB aerosol, from an observation vector z, which characterizes the BB aerosol optical properties. The components of x were the aerosol parameters that included kOA and the BC/OA ratio, along with other multiple characteristics, whereas z included (in this study) only three components representing AAE388/867, AER388/550, and AER867/550.
As we found in our previous study [40], the values of AAE for Siberian BB aerosol are closely related to δBrC (such that, on average, the AAE increases with an increase in δBrC). Furthermore, we argued [40] that the use of complementary data (such as the SSA) characterizing the relationship between the absorption and scattering properties of BB aerosol, along with the AAE, enables constraining kOA and the BC/OA ratio. In this study, we closely followed the ideas and methodological developments of the mentioned previous study [40]. As argued below (see Section 2.2.3), the use of values of AAE388/867, along with values of AER388/550 and AER867/550 (which are used in this study instead of the SSA), in the framework of the method described in this section allowed us to constrain, to some extent, all three parameters of interest (δBrC, kOA, and the BC/OA ratio).
Note that δBrC is not a component of x but it is estimated according to Equation (4) as a function of kOA, the BC/OA ratio, and other aerosol parameters affecting the mass absorption efficiency. The components of z are normalized to the standard deviations (calculated using the harmonized satellite data described in Section 2.1.1) of the indicated characteristics. An overview of our algorithm is presented in Figure 6.
We looked for estimates of x that were consistent with a given (nth) observed realization of z, namely, z o n , by employing a Monte Carlo method. Note that a Monte Carlo method was previously used by Lu et al. [74] to estimate kOA for BB aerosol using various field and laboratory observations. A key difference in our method from the method used by Lu et al. [74] is that we used a k-nearest neighbor algorithm, explained below, while Lu et al. [74] looked for optimal estimates. Our estimation method involved three main steps: (1) generation of a large ensemble of samples of x (referred to below as “a priori” estimates of x and denoted as xa); (2) computation of the modeled counterpart, namely, zm, of the observation vector for each sample of xa; and (3) obtaining of the “a posteriori” estimates of x (xp). The first two steps are explained in detail below in Section 2.2.2. Briefly, the first step involved the random sampling of several parameters representing the refractive indexes, relative mass fractions, and microphysical states of major components of BB aerosol particles from the corresponding a priori probability distributions. These samples were then used as input data for the Mie theory calculations of the BB aerosol optical properties.
In the third step, the a posteriori estimates of x, namely, x p n , were computed as a linear superposition of the fixed number (k) of the selected samples of xa, namely, { x a i n } i = 1 k , following a k-nearest neighbor algorithm [75]:
x p n = 1 k i = 1 k x a i n ,
In our case, the algorithm involved finding k nearest neighbors of z o n , namely, { z m i n } i = 1 k , among all the samples of zm in terms of the Euclidian distance dj between z o n and the sample z m i n :
d i = ( z o n z m i n ) T z o n z m i n 1 / 2 ,
where T denotes the transpose. The same k samples that corresponded to the nearest neighbors of zo could yield an estimate of any scalar function F(x), namely, F p n :
F p n = 1 k i = 1 k F x a i n ,
In particular, we applied Equation (7) to estimate δBrC according to Equation (4).
The results reported in this paper were obtained using a k value equal to 80, i.e., the 80 nearest neighbors were chosen, and their results averaged. Our choice of this particular number is explained below in Section 2.2.3. The total Monte Carlo ensemble of the xa and zm values included 106 samples.
The estimation procedure described by Equations (5)–(7) implies that the selected samples { z m i n } i = 1 k were sufficiently representative of the observation. Ideally, given a sufficiently large ensemble of random samples, the distance di should approach zero for any i. However, because the observations can be affected by various errors, the distances can remain big, meaning that the available simulations are not representative of the observation and cannot provide reliable estimates of the aerosol parameters. To identify such situations in which the k-nearest neighbor algorithm can fail, we introduced a special criterion for the distances di. Specifically, we required the distances di to be less than one:
d i < 1 ,   i [ 1 , k ]
We recall that the distances are defined in the space of the normalized variables. Observation data points that do not satisfy this criterion were excluded from further analysis. Hence, the condition given by Equation (8) was used as a filter that excluded potentially unreliable observation data points and the corresponding estimates of the aerosol properties.
Note that the same properties of Siberian BB aerosol (δBrC, kOA, and the BC/OA ratio), which were estimated in this study using satellite observations, were inferred in Konovalov et al. [40] from AERONET data. The methods used in these two studies were similar but not identical. A key difference is that the analysis performed in our previous study involved an explicit formulation of the conditional probability distribution function for x in accordance with the Bayesian formalism. The application of the same approach to the satellite observations is hardly feasible because the conditional probability distribution function depends on the observation errors that are not practically known for the absorption characteristics derived from the OMI and MISR observations. A drawback of the k-nearest neighbor algorithm employed in this study is that it cannot provide confidence intervals for each inferred estimate. However, we are interested here only in the average (typical) absorption properties of BB aerosol as a function of the photochemical age and obtain the required confidence intervals for such properties by considering an ensemble of the estimates for different observations.
The estimates of the BB aerosol characteristics, which were inferred from the satellite observations according to Equations (5)–(8), were processed using a simple algorithm of the nonlinear trend analysis to examine the dependences of these characteristics on the BB aerosol photochemical age. The algorithm (which is described more in detail in Konovalov et al. [43]) involves a nonlinear approximation of the dependence of an available set of M uncertain estimates p i i = 1 M of any parameter p on the BB aerosol photochemical age τa with a sum of N sigmoids as follows:
p i τ a = j = 1 N w j 1 ( 1 + exp w j 2 τ a i + w j 3 ) + w 0 + ε i ,   i [ 1 , M ]
where the w are the weight coefficients and εi is the approximation error (which is assumed to be a random variable with a zero mean). Following Konovalov et al. [43] and for definiteness, we set N = 2. The weight coefficients were optimized using the Nelder–Mead simplex algorithm [76] by minimizing the variance for the errors ε, and the confidence intervals were obtained using the bootstrapping technique [77]. The spread of the “bootstrapped” estimates was used to calculate the 95% confidence intervals.
Note again that the analysis of transformations in the properties of BB aerosol due to its aging was not done previously in Konovalov et al. [41]. Such analysis was not feasible, particularly because too few AERONET observations in Siberia are representative of relatively fresh BB aerosol. In contrast to the AERONET data, the OMI observations of BB aerosol (which were used in this study as a primary source of information on the BrC absorptions) were abundantly taken over relatively fresh BB plumes [50].

2.2.2. Mie Theory Computations

In this study, an ensemble of probable values of the optical properties (zm) of BB aerosol was obtained in almost the same way as in Konovalov et al. [40], where the corresponding simulations are explained in detail. Hence, our computations are described below only briefly.
Following Lu et al. [72] and Wang et al. [18], we assumed that BB aerosol particles were composed of a strongly absorbing core and weakly absorbing shell. More specifically, we assumed that the core consisted of BC, while the shell was mostly composed of organic matter and, to a minor extent, inorganic salts and water. The computations were made using the OPTSIM software [78], which allows for simulating the absorption and scattering properties of an ensemble of multidisperse spherical particles that have homogeneous or core–shell structures. Water content was calculated based on the κ-Köhler theory [79] as a function of relative humidity (RH). The particle components were log-normally distributed among 20 bins representing particle diameters ranging from 10 nm to 10 μm. The parameters of the particle size distribution (the median and the geometric standard deviation) were chosen to be representative of the accumulation mode.
To generate an ensemble of possible realizations of optical properties and microphysical states of BB aerosol (see Section 2.2.1), we randomly varied several aerosol parameters (Table 1), as well as the relative humidity (RH). The variable parameters used were the median and the standard deviation of the volume size distributions for the core and shell, kOA at 550 nm, the BC/OA ratio, the hygroscopicity parameter κ, and the mass fraction of the inorganic material (represented by ammonium sulfate). Assuming kOA to be a power function of the wavelength, we also randomly perturbed the exponent of the wavelength dependence (w). The variations in most of these parameters were specified using a truncated Gaussian distribution, except for kOA and κ, which were assumed to follow uniform distributions. Consistent with the condition that relative humidity (RH) corresponding to the selected satellite observations should not exceed 70% (see Section 2.1.1), the RH was kept to be less than 70% in our computations. This limitation resulted in a rather small water content in the particles (typically, less than 15%). Further details about the sampling of the variable parameters can be found in Konovalov et al. [40].
In the framework of our Monte Carlo algorithm (Section 2.2.1), the variable parameters mentioned above constituted the components of the control vector x. The parameter values were randomly sampled 106 times, and OPTSIM was run independently with each sample. The results of the computations (that is, values of the components of zm) and the a priori samples of x (xa) constituted a look-up table that provided a discrete quantification of the complex relationships between the vector of parameters x and the vector of observations z.
Note that because of the lack of knowledge about the optical and physical properties of the coarse particles of typical BB aerosol (as discussed in Konovalov et al. [40]), the coarse mode was not taken into account in our calculations as a distinct mode. The possible effects of the coarse mode on estimates of the optical properties considered here were tentatively examined by Konovalov et al. [40] and were found to result in larger mean values of the estimates of δBrC and kOA and a smaller mean value of the estimate of the BC/OA ratio. The differences between the estimates of these characteristics for the cases with and without accounting for the coarse mode were found to be small (a few percent) when related to their a priori values but, because the organic component of Siberian BB aerosol turned out to be weakly absorbing, were found to be more considerable (tenths of a percent) when related to the a posteriori estimates. Hence, we considered our estimates of δBrC and kOA obtained in this study as the lower limits for the most probable values of these parameters.

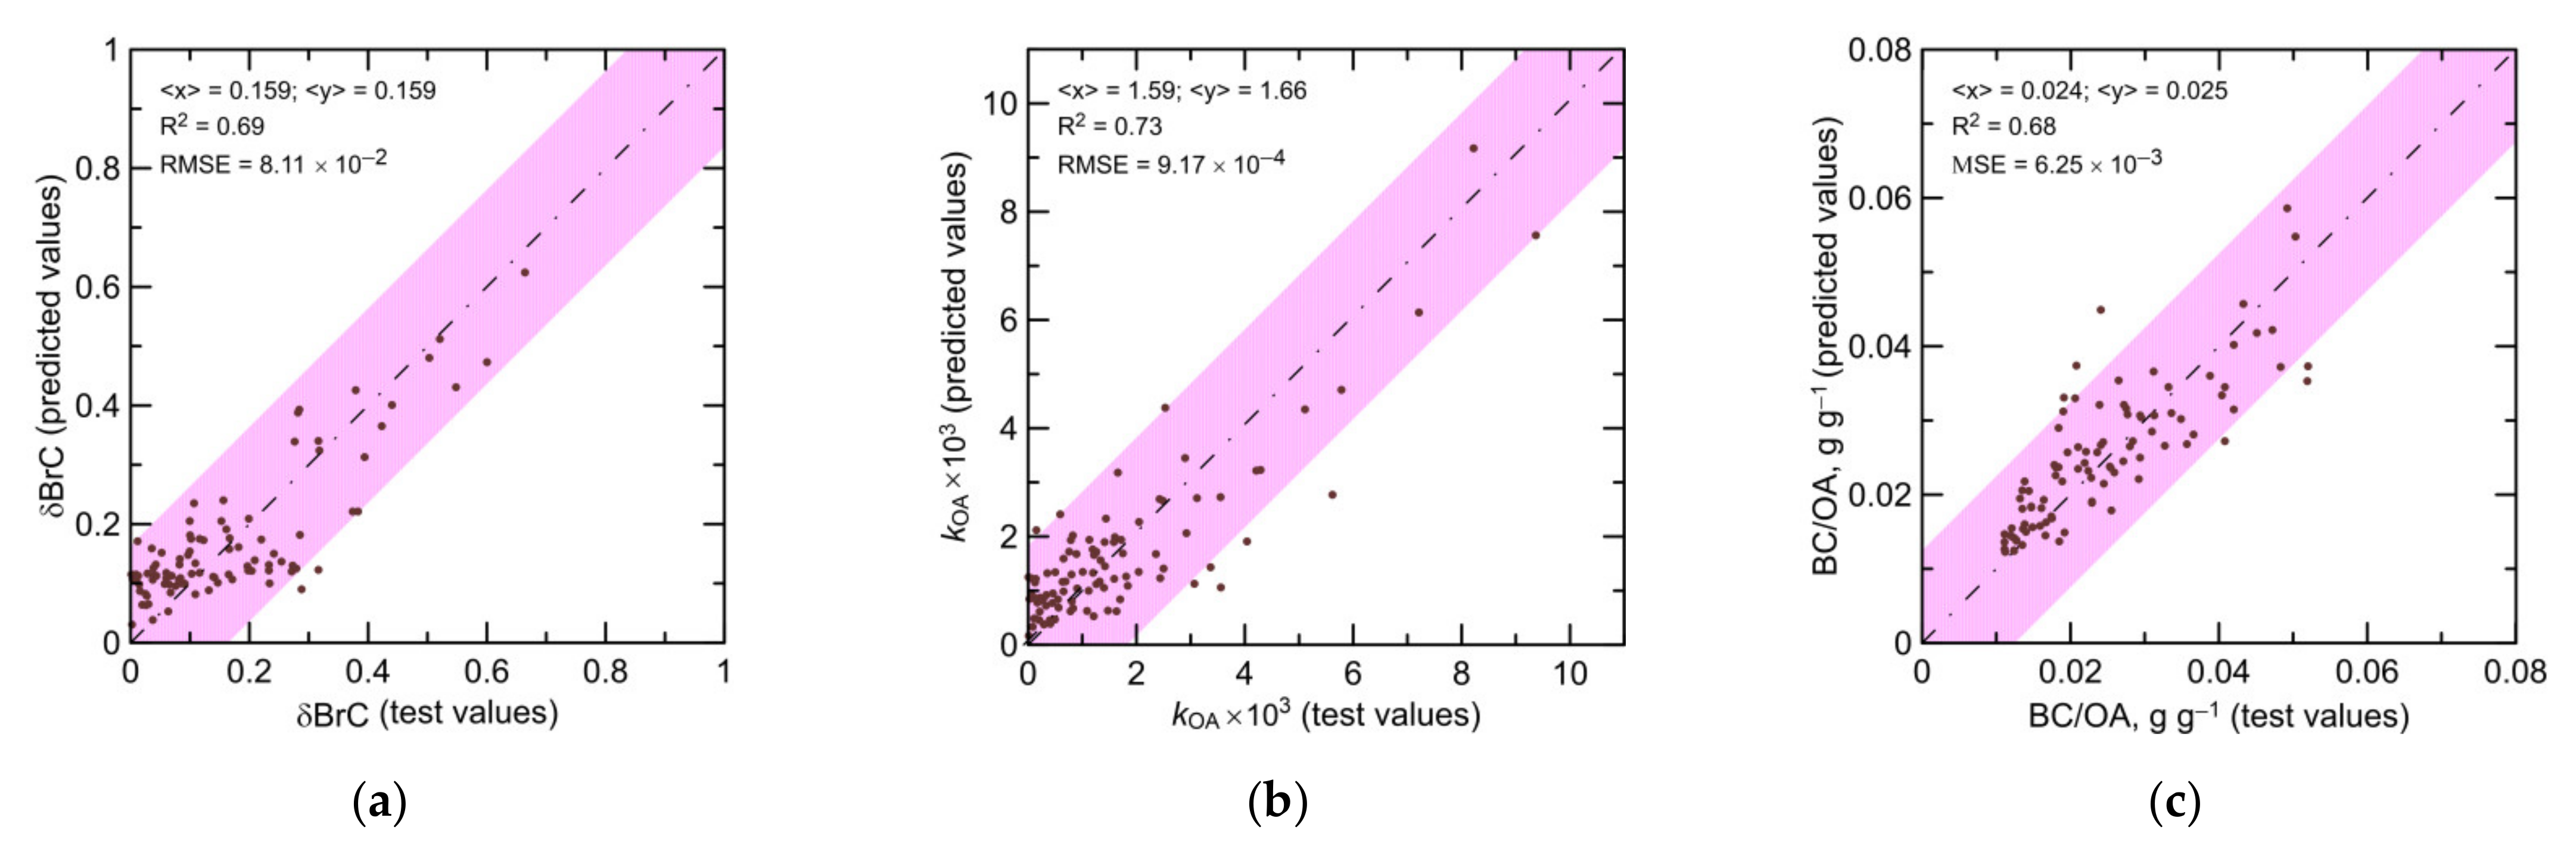
2.2.3. Optimization and Validation of the Monte Carlo Estimation Algorithm
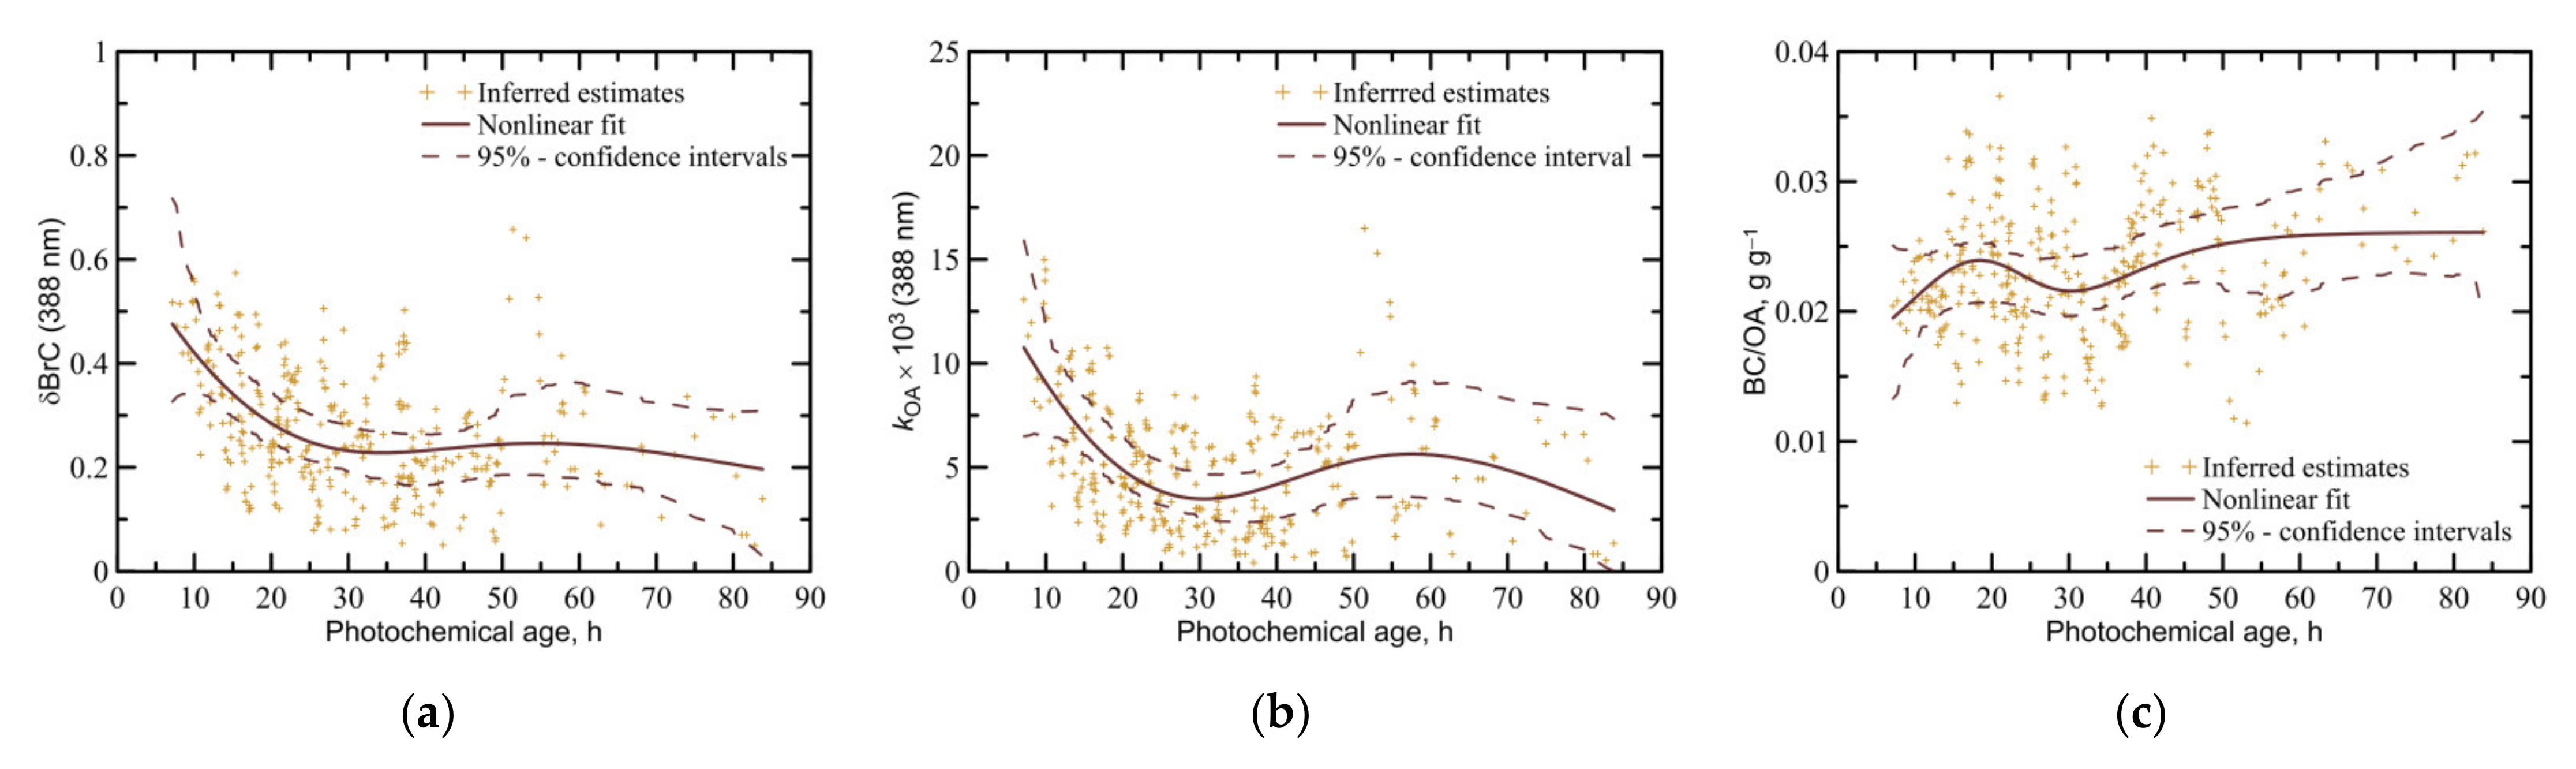
The estimates defined by Equations (5) and (7) are dependent on the value of k (the number of the nearest neighbors). Choosing a too small k can be expected to result in large uncertainties in xp, which would reflect the possibility for the same values of z to correspond to different combinations of the components of x. On the other hand, with k approaching the total number of samples, the estimates of x would approach the mean of the ensemble of the samples of x and would become almost independent of the observations. Hence, there should be some optimal value of k, which would depend on the complexity and ambiguity of the relationships between x and z, as well as on the observation errors.
To optimize k, we applied our algorithm to a synthetic data set. Again following our previous study [40], we obtained such a dataset using the AERONET observations. In this study, we used the observations and the look-up table described in Section 2.1.2 and Section 2.2.2, respectively. For each observation zo, we found a unique vector zm (along with a corresponding vector xa) that was closest to zo (in terms of the distance given by Equation (6)). In other words, we first used our algorithm with k equal to 1. The selected samples of zm (satisfying the condition given by Equation (8)), along with the corresponding values of xa constituted the synthetic data set in which the values of xa were considered as surrogates of true (unknown) values of x and were excluded from the main set of the random samples. Next, we applied our algorithm to the synthetic data set iteratively, each time increasing the number k by one and calculating the root-mean-square error (RMSE) of the xp. The iterations were repeated until RMSE reached a minimum.
Note that this procedure does not account for the observational errors (which are not known) but rather elucidates only the uncertainties in x due to the complexity of the relationships between the multiple aerosol parameters and the three observed characteristics. Hence, the RMSE estimated using the surrogate data should be regarded as the lower limit for uncertainties in xp derived from the satellite data. Furthermore, the described procedure would likely result in an underestimation of the “optimal” value of k. However, this underestimation was not expected to entail any major issues for the results of this study. Indeed, since the uncertainties in the satellite data were likely to be dominated by random errors (as indicated by the analysis presented above in Section 2.1.4), the uncertainties in xp were also predominantly random and could be manifested in the corresponding confidence intervals for the dependencies given by Equation (9).
The results of the application of our estimation algorithm to the surrogate data (see Figure 7) indicated that based on the “observed” values of AAE388/867, AER388/550, and AER867/550, the algorithm was capable of providing reasonable (albeit not perfect) estimates of δBrC, kOA, and the BC/OA ratio. Specifically, the coefficient of determination was higher or only slightly lower than 0.7 in all three cases, indicating that the obtained estimates could explain the major part of the variability of the inferred properties. Importantly, the estimates of all three characteristics exhibited very small biases (less than 5%).

3. Results

Our analysis method, described in Section 2.2, was applied to 355 observation data points satisfying the selection criteria explained in Section 2.1.1, as well as the condition given by Equation (8). Figure 8 demonstrates values of the components of the observation vector zo (that is, AAE388/867, AER388/550, and AER867/550) as a function of the BB aerosol photochemical age (τa). It also shows the non-linear approximations for these values according to Equation (9) and the corresponding confidence intervals.
The values of AAE388/867 (Figure 8a) were found to gradually decrease with the photochemical age from ~2.5 at τa ≅ 7 h to ~1.5 at τa ≅ 40 h and then to ~1.2 for τa ≅ 80. Although the satellite data considered here do not provide any information on the optical properties of fresh BB aerosol, the nonlinear approximation suggests that AAE388/867 is likely to be around 3 when τa is close to zero. Since larger values of the absorption Ångström exponent are typically associated with stronger BrC absorption (e.g., [18]), this behavior of AAE388/867 suggested that the contribution of BrC to the overall absorption of light by BB aerosol at the 388 nm wavelength decreased with the BB aerosol age.
Similar to AAE388/867, AER388/550 (Figure 8b) initially exhibited a decreasing behavior, but after about 35 h, the decreasing trend was replaced by an increasing tendency, which was, however, barely significant at the 95% confidence level (although it was significant at lower confidence levels). The downward part of the trend in AER388/550, similar to the decreasing behavior of AAE388/867, was indicative of a weakening of BrC absorption and was likely associated with an increase in the SSA at 388 nm (SSA388). An increasing part of the trend in AER388/550 may have been due to volatilization and photochemical destruction of the SOA [43], as well as due to photobleaching of primary and secondary organic compounds [21].
In contrast to AAE388/867 and AER388/550, AER867/550 (Figure 8c) did not exhibit any significant changes (at least, at the 95% confidence level), although there was weak evidence that it decreased as τa increased from 15 h to 30 h. Since AAOD867 was likely not sensitive to the BrC content, the lack of strong changes in AER867/550 could be regarded as an additional indication that the strong changes in AAE388/867 and AER388/550 were primarily due to changes in BrC absorption. At the same time, a weakly pronounced non-monotonous behavior of AER867/550 (specifically, its decrease after ~15 h and increase after ~30 h) was consistent with the notion that the atmospheric evolution of BB aerosol was associated with the formation and eventual destruction of weakly absorbing SOA [43].
The main outcomes (in other words, the end products) of our analysis were the nonlinear dependencies of δBrC, kOA, and BC/OA on the BB aerosol photochemical age (Figure 9). It was found that δBrC was a decreasing function of the BB aerosol photochemical age (Figure 9a): on average, δBrC dropped by about a factor of two (from 0.50 to 0.23) as τa increased from 7 h to 30 h. Furthermore, since the retrieved tendency tentatively suggested that δBrC for fresh aerosol was considerably larger (more than 0.6) than that at 7 h, the results shown in Figure 9a indicated that the contribution of BrC to light absorption by fresh aerosol originating from Siberian wildfires at 388 nm was predominant and that it eventually decreased by a factor of almost 3. It should be noted, however, that the estimates of δBrC for relatively fresh aerosol (τa < 12 h) were highly uncertain. Importantly, our analysis provided strong evidence that BrC did not fully disappear in Siberian BB aerosol even after 70 h of the atmospheric daylight exposure (~4 full days during the summertime in Siberia).
According to our estimates shown in Figure 9b, kOA behaved very similarly to δBrC. That is, it initially decreased with the e-folding time scale of about 19 h, but the decreasing behavior did not extend beyond 30 h of the daylight evolution. Furthermore, similar to δBrC, kOA remained distinctly different from zero, even after 70 h of the evolution, again suggesting that the organic fraction of BB aerosol retained some absorption properties during almost the whole lifespan of BB aerosol in Siberia (which was about 5–7 days in summer [80]). The mean value of kOA at the second stage of the evolution was found to be about 4.4 × 10⁻³. At the same time, the BC/OA ratio (Figure 9c) did not manifest any significant changes. It should be noted that the lack of statistically significant changes in this or other characteristics in our analysis did not necessarily mean that such changes did not occur in reality: it is possible that they were not identified simply because of an insufficient amount of the observational data and large uncertainties in them.
Taken together, our estimates of kOA and the BC/OA ratio suggested that the decrease in BrC absorption (Figure 9a) was primarily due to a weakening of the absorption properties of the organic component of BB particles rather than due to changes in the relative mass fraction of the organic component. However, our analysis did not allow us to determine the exact factors underlying the changes in kOA. Such factors may include (i) the destruction of organic chromophores within particles by UV irradiation [21] or (ii) aqueous oxidation [20], as well as (iii) the volatilization of primary (strongly absorbing) organic compounds and their replacement by more weakly absorbing secondary compounds [43]. Since a typical time scale of photo-destruction of the organic chromophores in BB aerosol particles is likely to exceed several tenths of hours [21] and the analyzed observations were made in a relatively dry atmosphere (see Section 2.1.1), we supposed that the third mechanism indicated above was the most probable. That is, the evaporation and subsequent gas-phase photochemical destruction of a semi-volatile absorbing fraction of primary OA (POA) as a result of dilution of BB plumes was likely a primary reason for the decreases in both kOA and δBrC during the initial approximately 30 h of the evolution. In other words, the loss of BrC was mostly determined by the loss of POA, and these processes had almost the same rate. We also supposed that the residual BrC absorption was probably associated with low-volatility (and, therefore, very slowly evaporating) POA and SOA species (with the volatility of about 10 μg m−3 or less), which was consistent with our simulations of the evolution of Siberian BB plumes [43], as well as with in situ observations that show the dominance of low-volatility compounds in aged BB aerosol (e.g., [81]).
It can be useful to note that the trends in δBrC and kOA could be estimated in this study owing to the availability of satellite observations of relatively fresh BB aerosol, along with those of more aged aerosol. Specifically, our satellite dataset included 46 and 11 data points featuring the BB aerosol age of less than 15 and 10 h, respectively, and these points constituted sizeable fractions (13% and 3%) of the whole data set. For comparison, the AERONET data set, which was used in this study for validation purposes (see Section 2.1.4), included only 2 (out of 29) data points (that is, less than 7%) representing BB aerosol with the age of less than 15 h, and did not include any observations of BB aerosol with the age of less than 10 h. The lack of the AERONET data representing fresh BB aerosol was the main obstacle to the successful application of our algorithm to these data.
To examine the robustness of our findings reported above, we performed an additional analysis in which we changed the number of the components of the observation vector. In particular, we repeated our estimation procedure while using only one component—AAE388/867—instead of the three components in the “base” case. We found a decreasing behavior of δBrC as in the base case but the estimates of kOA became highly uncertain and did not manifest any statistically significant changes. These findings were consistent with our previous analysis [40] that indicated a strong dependence of δBrC on the absorption Ångström exponent, as well as the need for SSA-related observations to constrain kOA. We also considered the test cases where the observation vector included only two components, namely, AAE388/867 and either AER388/550 or AER867/550. In those cases, we did not detect any statistically significant differences in the dependencies of δBrC and kOA on the BB aerosol photochemical age relative to the base case; qualitatively, these dependencies remained the same as those shown in Figure 9. Hence, we could conclude that our main findings were sufficiently robust and were unlikely to be significantly affected by possible covariances of uncertainties in the different components of our observation vector.

4. Discussion

The aim of this study was to investigate the feasibility of using multiplatform satellite observations to study the changes in absorption of light by the organic fraction of BB aerosol as a result of its atmospheric evolution. We believe that the overall results of our investigation, which included not only quantitative insights into the evolution of three quantities characterizing the absorption properties of the organic component of BB aerosol (Section 3) but also the development of a robust technique to infer the BrC absorption characteristics from available multiplatform satellite observations (Section 2.2) and demonstration of the reliability of the combined satellite data (Section 2.1.4), have important implications for atmospheric research. Indeed, presently, the information about the absorption properties of the organic component of BB aerosol and atmospheric evolution of these properties is available mainly from in situ measurements (e.g., [17,22,29]), ground-based remote sensing observations [33,34,35,36,37,38,39,40], and lab studies [19,20,21,25,26,27]. This information, while very insightful, is severely limited in terms of the representativeness of very diverse properties of BB aerosol that can form from different fuels under widely varying environmental conditions. Satellite observations can provide a broad spatial and temporal coverage that can greatly enhance our understanding of the spatio-temporal patterns and atmospheric evolution of the BB OA absorption properties. In this sense, the “multiplatform” approach proposed in this study can complement recent promising developments in partitioning BC and BrC contributions to the light absorption based on single-instrument, such as MISR, measurements [44]. Note that the analysis of MISR retrievals [44] has not provided quantitative estimates of any of the aerosol characteristics discussed in this paper and that the OMI observations involved in our analysis had an important advantage of being performed at 388 nm, where the BrC absorption is typically much stronger than at the shortest wavelength (446 nm) of the MISR measurements. However, although our study demonstrated the feasibility of the proposed multiplatform approach to studying the BrC absorption, further work involving larger datasets from different regions of the world is needed to examine the capabilities and limitations of this approach, as well as possible limitations and biases of the suggested Monte Carlo method for the retrieval of the BrC absorption properties.
Although this study represents just one of the initial steps toward the systematic use of satellite observations to infer BrC absorption by BB aerosol, the results of our analysis are scientifically meaningful and have implications for a better understanding of BrC absorption in such a vast and remote region as Siberia, where the absorption properties of BB aerosol and especially their atmospheric evolution are rather poorly known.
In particular, we identified a decrease in the absorption Ångström exponent (AAE) of BB aerosol due to its atmospheric aging (Figure 8a). Similar behavior of the AAE was previously reported based on field data [82] and analysis of AERONET observations [18] in other regions of the world. Therefore, on the one hand, the derived dependence of the AAE on the BB aerosol photochemical age is not contradictory to the current knowledge about the evolution of the AAE. On the other hand, to the best of our knowledge, this is the first evidence of the decreasing behavior of the AAE of Siberian BB aerosol. Values of the AAE exceeding 1 are typically associated with a considerable contribution of BrC to BB aerosol absorption [18,40]. Therefore, the decreasing trend in the AAE is indicative of a weakening of BrC absorption in aged BB plumes from Siberian fires, although the AAE is not unambiguously related to δBrC or the IRI for the organic fraction of aerosol, with it being dependent also on other aerosol parameters, such as the size distribution and volume fractions of the both absorbing and scattering aerosol components [40,83].
We also identified the downward and upward parts of the trend in AER388/550 (Figure 8b). As noted above, the downward part of the trend was also indicative of a weakening of BrC absorption due to the atmospheric aging of BB aerosol. Assuming that the extinction Ångström exponent is not changing significantly during the atmospheric evolution of BB aerosol, a decrease in the AER388/550 is likely associated with an increase in the SSA at 388 nm (SSA388). An increasing trend in SSA388 was previously deduced from the OMI AAOD388 and MODIS AOD550 observations in Konovalov et al. [43] and was interpreted mainly through the formation of weakly absorbing secondary organic aerosol (SOA), which tends to increase AOD550. An increasing part of the trend in AER388/550 may be indicative of volatilization of SOA: an indication of the SOA loss after ~35 h of BB aerosol evolution in the daytime was also found in Konovalov et al. [43], although a corresponding decrease in SSA388 was not identified.
The main end-products of this study were the estimated nonlinear tendencies in the contribution of BrC to Siberian BB aerosol absorption at 388 nm (δBrC) and in the IRI for the organic fraction of BB aerosol (kOA), as well as evidence that the changes in δBrC and kOA were not accompanied by strong changes in the BC/OA ratio. These end products complement each other by bringing insights into the inter-related aspects of the BB aerosol evolution. More specifically, our most important findings were that the contribution of BrC to Siberian BB aerosol absorption at 388 nm (δBrC) first decreased with the photochemical age of BB aerosol and that it then stabilized at a non-zero level. These findings were coherent with the findings from the previous analysis of the AERONET observations in the Amazon region: specifically, Wang et al. [18] found that the mass absorption coefficient for organic carbon dropped almost twofold after about 1-day evolution of BB aerosol in sunlight, but remained nearly constant afterward. The decrease in BrC absorption as a result of photochemical aging of BB aerosol was coherent with multiple studies based on the analysis field (e.g., [17,82]) and laboratory data (e.g., [19,20,21,84]) but was not a trivial finding given evidence that BrC absorption may also initially increase [20,22], apparently as a result of the formation of strongly absorbing SOA.
The estimated values of δBrC and their changes can be used as constraints on the simulations of BB aerosol absorption with chemistry transport models, e.g., [13,43]. However, the detected decrease in δBrC could, in principle, have been due to various reasons. In particular, it could have been a result of loss of the absorption properties by the organic components of BB aerosol, but it could have also been caused by volatilization of the most strongly absorbing organic components or by the formation of a weakly absorbing SOA fraction. To distinguish between these possibilities, and thus, to ensure a more realistic representation of the evolution of BB aerosol in the models, it would be helpful to complement the observational constraints on the behavior of δBrC with constraints on the evolution of both kOA and the BC/OA ratio. Our findings, useful in this context, were that the changes in δBrC were accompanied by corresponding changes in kOA, while there were no statistically significant changes in the BC/OA ratio (even though there may have been actual changes that fell into the confidence intervals but could not be discerned in our analysis). Specifically, kOA first substantially decreased (with the e-folding time scale of ~19 h) but then (after about 30 h) remained at a nearly constant (non-zero) level (~4.4 × 10⁻³). These findings indicated that transformations of BB aerosol due to volatilization, condensation, and oxidation processes did not play a major role in the evolution of the BrC absorption in Siberian BB plumes, or, at least, that the effects of volatilization and SOA formation on δBrC were likely to compensate each other. Note that the estimates of the BC/OA ratio complemented the estimates of δBrC and kOA by providing a useful constraint on the BB aerosol composition, thereby facilitating the consistent model representation of both the absorption and scattering properties of BB aerosol. Overall, our findings and estimates can help represent BrC absorption in BB plumes from Siberian fires in chemistry transport and climate models, where the absorption properties of aerosols are usually determined using assumed values of the IRI for all individual components of aerosol particles, as well as using assumed mass fractions of different components of aerosol particles.
Finally, it is worth mentioning that the mean values of the quantitative estimates of δBrC, kOA, and the BC/OA ratio—0.27, 5.0 × 10⁻³, and 2.3 × 10⁻², respectively—were comparable to the mean values of the corresponding estimates derived from the AERONET observations—0.21, 2.3 × 10⁻³, and 1.9 × 10⁻², respectively [40] (Table 2 therein). Some differences in the mean values of the same characteristics in the two studies are expected to take place not only as a result of random uncertainties in the inferred estimates but also because of likely differences between the BB plumes observed from satellites and at the AERONET sites with respect to the photochemical age. Furthermore, the differences in the mean values of δBrC and kOA could have been due to a probable wavelength dependence of BrC absorption (as the estimates based on the AERONET data were reported for the 440 nm wavelength). Even though the mean values of the estimates of δBrC, kOA, and the BC/OA ratio, which were derived from the satellite data, seemed to be rather meaningful, we do not report them as part of the main results of this study since they were not necessarily fully representative of the average values of the addressed characteristics in Siberia. Furthermore, these mean values could have been affected by various systematic uncertainties. The possible sources of such uncertainties in our analysis were basically the same as those discussed in detail in Konovalov et al. [40]. They include a poorly known contribution of the coarse mode of BB aerosol particles to the AAOD and AOD, a priori assumptions about the wavelength dependence of kOA, and the mixing state of BB aerosol particles. In addition, some uncertainties, which were especially difficult to quantify, may be caused by possible error covariances between the components of the observation vector. These uncertainties need to be examined in dedicated studies and carefully addressed in future applications of the approach suggested in this study. However, they can hardly explain our main findings (most of which are qualitative) concerning the evolution of the BB aerosol characteristics.

5. Conclusions

In this study, we examined the feasibility of deriving useful information on the atmospheric evolution of brown carbon (BrC) absorption of Siberian biomass burning (BB) aerosol from remote sensing observations performed by three different satellite instruments (OMI, MISR, and MODIS). Specifically, we focused on inferring three characteristics: (i) the relative contribution of BrC (that is, light-absorbing organic compounds) to the overall absorption of light by BB aerosol (δBrC), (ii) the imaginary refractive index of the organic fraction of BB aerosol (kOA), and (iii) the BC/OA mass concentration ratio in the particles. Both δBrC and kOA were estimated at the 388 nm wavelength. Note that the BC/OA ratio indirectly characterizes the BrC absorption, as δBrC is inversely dependent on this ratio if kOA is kept constant. We used the absorption aerosol optical depths at the 388 nm and 867 nm wavelengths (AAOD388 and AAOD867) obtained from the standard data products based on the OMI and MISR retrievals, respectively, as well as the extinction aerosol optical depth at the 550 nm wavelength (AOD550), which was available from the MODIS retrievals. We selected the data that characterized BB aerosol released from intense Siberian wildfires in July 2016. The selected and harmonized satellite retrievals were combined to constitute the three components of the observation vector—the absorption Ångström exponent (AAE388/867), the AAOD388/AOD550 ratio (AER388/550), and the AAOD867/AOD550 ratio (AER867/550)—for the subsequent analysis. The relationships between the satellite-derived values of AAOD388, AAOD867, and AOD550 were found to be in good agreement with similar relationships between the ground-based remote sensing data from AERONET.
Our analysis method was to a large extent adapted from Konovalov et al. [40], where it was applied to AERONET data. The extension to satellite data is crucial, as it allowed for a much larger spatial (over Siberia and European Russia) and temporal (from several hours to several days after fire emissions) coverage of our analysis. The method was designed to relate the input (“observed”) data to a set of multiple aerosol parameters through a Monte Carlo algorithm involving the Mie theory calculations for 106 scenarios. In this study, the set of parameter values that matched the input data was identified using a robust k-nearest neighbor algorithm, which did not involve any quantitative assumptions about observation errors. The method was tested and optimized using synthetic data based on the AERONET retrievals. As part of our analysis method, changes in the input parameters and the derived estimates were identified as a nonlinear function of the duration of BB aerosol daylight evolution (or, in other words, as a function of the BB aerosol photochemical age).
The results of our analysis indicate that BrC absorption (δBrC) substantially (at least twofold) decreased, while Siberian BB aerosol aged during the first 30 h of the daylight evolution, although it should be noted that we did not have any information about changes in any characteristics considered during the initial 7 h of the smoke evolution and that the changes derived for the period from 7 h to ~12 h were highly uncertain. The changes in δBrC mirrored a decrease in AAE388/867 from ~2.2 at 7 h to ~1.6 at 30 h, as well as a decrease in AER388/550 from 0.12 to 0.07 during the same period, whereas AER867/550 did not exhibit any statistically significant changes with time.
One of our most important findings was that BrC absorption did not disappear entirely as the BB aerosol aged, but was likely to remain considerable (δBrC ≈ 0.2), even when the BB aerosol photochemical age reached 70 h. This finding may have important implications for modeling the radiative effects of Siberian BB aerosol in the Arctic, as it is then more absorbing than if only black carbon was taken into account.
While δBrC may, in principle, be due to changes in both kOA and the BC/OA ratio, we found that the detected changes in δBrC were primarily due to similar changes in kOA: as the BB aerosol aged, kOA decreased (the organic compounds become less absorptive) but the BC/OA ratio (indicative of the relative mass fraction of the organic matter) remained nearly constant. Similar to δBrC, kOA was found to be statistically different from zero even after 70 h of the BB aerosol evolution in daylight. The changes in both δBrC and kOA were found to be reflected in the evolution of the “observed” AAE388/867.
Overall, this study demonstrated the feasibility of deriving meaningful quantitative information on the atmospheric evolution of BrC absorption in BB plumes from available multiplatform satellite observations of atmospheric aerosol and provided tentative observational constraints on representations of the BrC absorption parameters for Siberian BB aerosol in chemistry transport and climate models. To explore the potential of the proposed “multiplatform” approach to studying the absorption properties of BB aerosol, future studies should involve much larger data sets and address possible systematic uncertainties in the derived properties due to a priori assumptions about the BB aerosol parameters and due to possible biases in satellite data, specifically those depending on the BB aerosol age.

Author Contributions

Conceptualization and methodology; I.B.K.; formal analysis, N.A.G. and I.B.K.; investigation, I.B.K.; writing—original draft preparation, I.B.K.; writing—review and editing, M.B. and S.T.; funding acquisition, I.B.K. and M.B. All authors have read and agreed to the published version of the manuscript.

Funding

This research was funded by the Russian Science Foundation (RSF) under grant agreement no. 19-77-20109 (development of the analysis method, investigation of the atmospheric evolution of BrC absorption). The pre-preprocessing and validation of the MISR data and the analysis of the evolution of the BC/OA ratio were supported by the Russian Foundation for Basic Research (project no. 21-55-15009) and CNRS International Emerging Actions program no. 304365 (project MERSI).

Data Availability Statement

The OMI AAOD, MISR SSA and AOD, and MODIS AOD data are available as parts of the OMAERUV, MIL2ASAE_L2.002, and MOD04/MYD04 data products, respectively, from the NASA EarthData portal at https://search.earthdata.nasa.gov/ (accessed on 15 February 2022). The AERONET data are available through the AERONET download tool at https://aeronet.gsfc.nasa.gov/cgi-bin/webtool_inv_v3 (accessed on 21 October 2021).

Conflicts of Interest

The authors declare no conflict of interest.

References

  1. Penner, J.E.; Dickinson, R.E.; O’Neil, C.A. Effects of aerosol from biomass burning on the global radiation budget. Science 1992, 256, 1432–1434. [Google Scholar] [CrossRef] [PubMed]
  2. Abel, S.J.; Highwood, E.J.; Haywood, J.M.; Stringer, M.A. The direct radiative effect of biomass burning aerosols over southern Africa. Atmos. Chem. Phys. 2005, 5, 1999–2018. [Google Scholar] [CrossRef] [Green Version]
  3. Chang, D.Y.; Yoon, J.; Lelieveld, J.; Park, S.K.; Yum, S.S.; Kim, J.; Jeong, S. Direct radiative forcing of biomass burning aerosols from the extensive Australian wildfires in 2019–2020. Environ. Res. Lett. 2021, 16, 044041. [Google Scholar] [CrossRef]
  4. Hobbs, P.V.; Radke, L.F. Cloud Condensation Nuclei from a Simulated Forest Fire. Science 1969, 163, 279–280. [Google Scholar] [CrossRef] [PubMed]
  5. Brioude, J.; Cooper, O.R.; Feingold, G.; Trainer, M.; Freitas, S.R.; Kowal, D.; Ayers, J.K.; Prins, E.; Minnis, P.; McKeen, S.A.; et al. Effect of biomass burning on marine stratocumulus clouds off the California coast. Atmos. Chem. Phys. 2009, 9, 8841–8856. [Google Scholar] [CrossRef] [Green Version]
  6. Ajoku, O.F.; Miller, A.J.; Norris, J.R. Impacts of aerosols produced by biomass burning on the stratocumulus-to-cumulus transition in the equatorial Atlantic. Atmos. Sci. Lett. 2021, 22, e1025. [Google Scholar] [CrossRef]
  7. Moreira, D.S.; Longo, K.M.; Freitas, S.R.; Yamasoe, M.A.; Mercado, L.M.; Rosário, N.E.; Gloor, E.; Viana, R.S.M.; Miller, J.B.; Gatti, L.V.; et al. Modeling the radiative effects of biomass burning aerosols on carbon fluxes in the Amazon region. Atmos. Chem. Phys. 2017, 17, 14785–14810. [Google Scholar] [CrossRef] [Green Version]
  8. Myhre, G.; Samset, B.H.; Schulz, M.; Balkanski, Y.; Bauer, S.; Berntsen, T.K.; Bian, H.; Bellouin, N.; Chin, M.; Diehl, T.; et al. Radiative forcing of the direct aerosol effect from AeroCom Phase II simulations. Atmos. Chem. Phys. 2013, 13, 1853–1877. [Google Scholar] [CrossRef] [Green Version]
  9. Hamilton, D.S.; Hantson, S.; Scott, C.E.; Kaplan, J.O.; Pringle, K.J.; Nieradzik, L.P.; Rap, A.; Folberth, G.A.; Spracklen, D.V.; Carslaw, K.S. Reassessment of pre-industrial fire emissions strongly affects anthropogenic aerosol forcing. Nat. Commun. 2018, 9, 3182. [Google Scholar] [CrossRef] [Green Version]
  10. Brown, H.; Liu, X.; Pokhrel, R.; Murphy, S.; Lu, Z.; Saleh, R.; Mielonen, T.; Kokkola, H.; Bergman, T.; Myhre, G.; et al. Biomass burning aerosols in most climate models are too absorbing. Nat. Commun. 2021, 12, 277. [Google Scholar] [CrossRef]
  11. Feng, Y.; Ramanathan, V.; Kotamarthi, V.R. Brown carbon: A significant atmospheric absorber of solar radiation? Atmos. Chem. Phys. 2013, 13, 8607–8621. [Google Scholar] [CrossRef] [Green Version]
  12. Lin, G.; Penner, J.E.; Flanner, M.G.; Sillman, S.; Xu, L.; Zhou, C. Radiative forcing of organic aerosol in the atmosphere and on snow: Effects of SOA and brown carbon. J. Geophys. Res. Atmos. 2014, 119, 7453–7476. [Google Scholar] [CrossRef] [Green Version]
  13. Wang, X.; Heald, C.L.; Liu, J.; Weber, R.J.; Campuzano-Jost, P.; Jimenez, J.L.; Schwarz, J.P.; Perring, A.E. Exploring the observational constraints on the simulation of brown carbon. Atmos. Chem. Phys. 2018, 18, 635–653. [Google Scholar] [CrossRef] [Green Version]
  14. Zhang, A.; Wang, Y.; Zhang, Y.; Weber, R.J.; Song, Y.; Ke, Z.; Zou, Y. Modeling the global radiative effect of brown carbon: A potentially larger heating source in the tropical free troposphere than black carbon. Atmos. Chem. Phys. 2020, 20, 1901–1920. [Google Scholar] [CrossRef] [Green Version]
  15. Pokhrel, R.P.; Beamesderfer, E.R.; Wagner, N.L.; Langridge, J.M.; Lack, D.A.; Jayarathne, T.; Stone, E.A.; Stockwell, C.E.; Yokelson, R.J.; Murphy, S.M. Relative importance of black carbon, brown carbon, and absorption enhancement from clear coatings in biomass burning emissions. Atmos. Chem. Phys. 2017, 17, 5063–5078. [Google Scholar] [CrossRef] [Green Version]
  16. McClure, C.D.; Lim, C.Y.; Hagan, D.H.; Kroll, J.H.; Cappa, C.D. Biomass-burning-derived particles from a wide variety of fuels—Part 1: Properties of primary particles. Atmos. Chem. Phys. 2020, 20, 1531–1547. [Google Scholar] [CrossRef] [Green Version]
  17. Forrister, H.; Liu, J.; Scheuer, E.; Dibb, J.; Ziemba, L.; Thornhill, K.L.; Anderson, B.; Diskin, G.; Perring, A.E.; Schwarz, J.P.; et al. Evolution of brown carbon in wildfire plumes. Geophys. Res. Lett. 2015, 42, 4623–4630. [Google Scholar] [CrossRef] [Green Version]
  18. Wang, X.; Heald, C.L.; Sedlacek, A.J.; de Sá, S.S.; Martin, S.T.; Alexander, M.L.; Watson, T.B.; Aiken, A.C.; Springston, S.R.; Artaxo, P. Deriving brown carbon from multiwavelength absorption measurements: Method and application to AERONET and Aethalometer observations. Atmos. Chem. Phys. 2016, 16, 12733–12752. [Google Scholar] [CrossRef] [Green Version]
  19. Sumlin, B.J.; Pandey, A.; Walker, M.J.; Pattison, R.S.; Williams, B.J.; Chakrabarty, R.K. Atmospheric Photooxidation Diminishes Light Absorption by Primary Brown Carbon Aerosol from Biomass Burning. Environ. Sci. Tech. Lett. 2017, 4, 540–545. [Google Scholar] [CrossRef]
  20. Wong, J.P.S.; Nenes, A.; Weber, R.J. Changes in light absorptivity of molecular weight separated brown carbon due to photolytic aging. Environ. Sci. Technol. 2017, 51, 8414–8421. [Google Scholar] [CrossRef]
  21. Fleming, L.T.; Lin, P.; Roberts, J.M.; Selimovic, V.; Yokelson, R.; Laskin, J.; Laskin, A.; Nizkorodov, S.A. Molecular composition and photochemical lifetimes of brown carbon chromophores in biomass burning organic aerosol. Atmos. Chem. Phys. 2020, 20, 1105–1129. [Google Scholar] [CrossRef] [Green Version]
  22. Wu, H.; Taylor, J.W.; Langridge, J.M.; Yu, C.; Allan, J.D.; Szpek, K.; Cotterell, M.I.; Williams, P.I.; Flynn, M.; Barker, P.; et al. Rapid transformation of ambient absorbing aerosols from West African biomass burning. Atmos. Chem. Phys. 2021, 21, 9417–9440. [Google Scholar] [CrossRef]
  23. Samset, B.H.; Stjern, C.W.; Andrews, E.; Kahn, R.; Myhre, G.; Schulz, M.; Schuster, G.L. Aerosol absorption: Progress towards global and regional constraints. Curr. Clim. Change Rep. 2018, 4, 65–83. [Google Scholar] [CrossRef] [Green Version]
  24. Andreae, M.O. Emission of trace gases and aerosols from biomass burning—An updated assessment. Atmos. Chem. Phys. 2019, 19, 8523–8546. [Google Scholar] [CrossRef] [Green Version]
  25. Saleh, R.; Robinson, E.S.; Tkacik, D.S.; Ahern, A.T.; Liu, S.; Aiken, A.C.; Sullivan, R.C.; Presto, A.A.; Dubey, M.K.; Yokelson, R.J.; et al. Brownness of organics in aerosols from biomass burning linked to their black carbon content. Nat. Geosci. 2014, 7, 647–650. [Google Scholar] [CrossRef]
  26. Zhong, M.; Jang, M. Dynamic light absorption of biomass-burning organic carbon photochemically aged under natural sunlight. Atmos. Chem. Phys. 2014, 14, 1517–1525. [Google Scholar] [CrossRef] [Green Version]
  27. Zhao, R.; Lee, A.K.Y.; Huang, L.; Li, X.; Yang, F.; Abbatt, J.P.D. Photochemical processing of aqueous atmospheric brown carbon. Atmos. Chem. Phys. 2015, 15, 6087–6100. [Google Scholar] [CrossRef] [Green Version]
  28. Akagi, S.K.; Craven, J.S.; Taylor, J.W.; McMeeking, G.R.; Yokelson, R.J.; Burling, I.R.; Urbanski, S.P.; Wold, C.E.; Seinfeld, J.H.; Coe, H.; et al. Evolution of trace gases and particles emitted by a chaparral fire in California. Atmos. Chem. Phys. 2012, 12, 1397–1421. [Google Scholar] [CrossRef] [Green Version]
  29. Sedlacek, A.J., III; Buseck, P.R.; Adachi, K.; Onasch, T.B.; Springston, S.R.; Kleinman, L. Formation and evolution of tar balls from northwestern US wildfires. Atmos. Chem. Phys. 2018, 18, 11289–11301. [Google Scholar] [CrossRef] [Green Version]
  30. Vakkari, V.; Beukes, J.P.; Dal Maso, M.; Aurela, M.; Josipovic, M.; van Zyl, P.G. Major secondary aerosol formation in southern African open biomass burning plumes. Nat. Geosci. 2018, 11, 580–583. [Google Scholar] [CrossRef]
  31. Kleinman, L.I.; Sedlacek, A.J., III; Adachi, K.; Buseck, P.R.; Collier, S.; Dubey, M.K.; Hodshire, A.L.; Lewis, E.; Onasch, T.B.; Pierce, J.R.; et al. Rapid evolution of aerosol particles and their optical properties downwind of wildfires in the western US. Atmos. Chem. Phys. 2020, 20, 13319–13341. [Google Scholar] [CrossRef]
  32. Van der Werf, G.R.; Randerson, J.; Giglio, L.; van Leeuwen, T.T.; Chen, Y.; Rogers, B.M.; Mu, M.; van Marle, M.J.E.; Morton, D.C.; Collatz, G.J.; et al. Global fire emissions estimates during 1997–2016. Earth Syst. Sci. Data 2017, 9, 697–720. [Google Scholar] [CrossRef] [Green Version]
  33. Arola, A.; Schuster, G.; Myhre, G.; Kazadzis, S.; Dey, S.; Tripathi, S.N. Inferring absorbing organic carbon content from AERONET data. Atmos. Chem. Phys. 2011, 11, 215–225. [Google Scholar] [CrossRef] [Green Version]
  34. Bahadur, R.; Praveen, P.S.; Xu, Y.; Ramanathan, V. Solar absorption by elemental and brown carbon determined from spectral observations. Proc. Natl. Acad. Sci. USA 2012, 109, 17366–17371. [Google Scholar] [CrossRef] [PubMed] [Green Version]
  35. Chung, C.E.; Ramanathan, V.; Decremer, D. Observationally constrained estimates of carbonaceous aerosol radiative forcing. Proc. Natl. Acad. Sci. USA 2012, 109, 11624–11629. [Google Scholar] [CrossRef] [PubMed] [Green Version]
  36. Cazorla, A.; Bahadur, R.; Suski, K.J.; Cahill, J.F.; Chand, D.; Schmid, B.; Ramanathan, V.; Prather, K.A. Relating aerosol absorption due to soot, organic carbon, and dust to emission sources determined from in-situ chemical measurements. Atmos. Chem. Phys. 2013, 13, 9337–9350. [Google Scholar] [CrossRef] [Green Version]
  37. Lack, D.A.; Langridge, J.M. On the attribution of black and brown carbon light absorption using the Ångström exponent. Atmos. Chem. Phys. 2013, 13, 10535–10543. [Google Scholar] [CrossRef] [Green Version]
  38. Golovushkin, N.A.; Kuznetsova, I.N.; Konovalov, I.B.; Kozlov, V.S.; Nakhaev, M.I. Analysis of brown carbon content and evolution in smokes from Siberian forest fires using AERONET measurements. Atmos. Ocean Opt. 2020, 33, 267–273. [Google Scholar] [CrossRef]
  39. Kim, S.-W.; Cho, C.; Rupakheti, M. Estimating contributions of black and brown carbon to solar absorption from aethalometer and AERONET measurements in the highly polluted Kathmandu Valley, Nepal. Atmos. Res. 2021, 247, 105164. [Google Scholar] [CrossRef]
  40. Konovalov, I.B.; Golovushkin, N.A.; Beekmann, M.; Panchenko, M.V.; Andreae, M.O. Inferring the absorption properties of organic aerosol in biomass burning plumes from remote optical observations. Atmos. Meas. Tech. 2021, 14, 6647–6673. [Google Scholar] [CrossRef]
  41. Jethva, H.; Torres, O. Satellite-based evidence of wavelength-dependent aerosol absorption in biomass burning smoke inferred from Ozone Monitoring Instrument. Atmos. Chem. Phys. 2011, 11, 10541–10551. [Google Scholar] [CrossRef] [Green Version]
  42. Mok, J.; Krotkov, N.A.; Arola, A.; Torres, O.; Jethva, H.; Andrade, M.; Labow, G.; Eck, T.F.; Li, Z.; Dickerson, R.R.; et al. Impacts of brown carbon from biomass burning on surface UV and ozone photochemistry in the Amazon Basin. Sci. Rep.-UK 2016, 6, 36940. [Google Scholar] [CrossRef] [Green Version]
  43. Konovalov, I.B.; Golovushkin, N.A.; Beekmann, M.; Andreae, M.O. Insights into the aging of biomass burning aerosol from satellite observations and 3D atmospheric modeling: Evolution of the aerosol optical properties in Siberian wildfire plumes. Atmos. Chem. Phys. 2021, 21, 357–392. [Google Scholar] [CrossRef]
  44. Junghenn Noyes, K.; Kahn, R.; Sedlacek, A.; Kleinman, L.; Limbacher, J.; Li, Z. Wildfire smoke particle properties and evolution, from space-based multi-angle imaging. Remote Sens. 2020, 12, 769. [Google Scholar] [CrossRef] [Green Version]
  45. Garay, M.J.; Witek, M.L.; Kahn, R.A.; Seidel, F.C.; Limbacher, J.A.; Bull, M.A.; Diner, D.J.; Hansen, E.G.; Kalashnikova, O.V.; Lee, H.; et al. Introducing the 4.4 km spatial resolution Multi-Angle Imaging SpectroRadiometer (MISR) aerosol product. Atmos. Meas. Tech. 2020, 13, 593–628. [Google Scholar] [CrossRef] [Green Version]
  46. Evangeliou, N.; Balkanski, Y.; Hao, W.M.; Petkov, A.; Silverstein, R.P.; Corley, R.; Nordgren, B.L.; Urbanski, S.P.; Eckhardt, S.; Stohl, A.; et al. Wildfires in northern Eurasia affect the budget of black carbon in the Arctic—A 12-year retrospective synopsis (2002–2013). Atmos. Chem. Phys. 2016, 16, 7587–7604. [Google Scholar] [CrossRef] [Green Version]
  47. Sand, M.; Berntsen, T.K.; von Salzen, K.; Flanner, M.G.; Langner, J.; Victor, D.G. Response of Arctic temperature to changes in emissions of short-lived climate forcers. Nat. Clim. Change 2016, 6, 286–289. [Google Scholar] [CrossRef]
  48. Hegg, D.A.; Warren, S.G.; Grenfell, T.C.; Doherty, S.J.; Clarke, A.D. Sources of light-absorbing aerosol in arctic snow and their seasonal variation. Atmos. Chem. Phys. 2010, 10, 10923–10938. [Google Scholar] [CrossRef] [Green Version]
  49. Konovalov, I.B.; Beekmann, M.; Berezin, E.V.; Formenti, P.; Andreae, M.O. Probing into the aging dynamics of biomass burning aerosol by using satellite measurements of aerosol optical depth and carbon monoxide. Atmos. Chem. Phys. 2017, 17, 4513–4537. [Google Scholar] [CrossRef] [Green Version]
  50. Konovalov, I.B.; Lvova, D.A.; Beekmann, M.; Jethva, H.; Mikhailov, E.F.; Paris, J.-D.; Belan, B.D.; Kozlov, V.S.; Ciais, P.; Andreae, M.O. Estimation of black carbon emissions from Siberian fires using satellite observations of absorption and extinction optical depths. Atmos. Chem. Phys. 2018, 18, 14889–14924. [Google Scholar] [CrossRef] [Green Version]
  51. Konovalov, I.B.; Berezin, E.V.; Ciais, P.; Broquet, G.; Beekmann, M.; Hadji-Lazaro, J.; Clerbaux, C.; Andreae, M.O.; Kaiser, J.W.; Schulze, E.-D. Constraining CO2 emissions from open biomass burning by satellite observations of co-emitted species: A method and its application to wildfires in Siberia. Atmos. Chem. Phys. 2014, 14, 10383–10410. [Google Scholar] [CrossRef] [Green Version]
  52. Sitnov, S.A.; Mokhov, I.I.; Likhosherstova, A.A. Exploring large-scale blackcarbon air pollution over Northern Eurasia in summer 2016 using MERRA-2 reanalysis data. Atmos. Res. 2020, 235, 104763. [Google Scholar] [CrossRef]
  53. Gorchakov, G.I.; Golitsyn, G.S.; Sitnov, S.A.; Karpov, A.V.; Gorchakova, I.A.; Gushchin, R.A.; Datsenko, O.I. Large- Scale Haze over Eurasia in July 2016. Dokl. Earth Sci. 2018, 482, 1212. [Google Scholar] [CrossRef]
  54. Torres, O.; Tanskanen, A.; Veihelmann, B.; Ahn, C.; Braak, R.; Bhartia, P.K.; Veefkind, P.; Levelt, P. Aerosols and surface UV products from Ozone Monitoring Instrument observations: An overview. J. Geophys. Res. 2007, 112, D24S47. [Google Scholar] [CrossRef] [Green Version]
  55. Torres, O.; Ahn, C.; Chen, Z. Improvements to the OMI near-UV aerosol algorithm using A-train CALIOP and AIRS observations. Atmos. Meas. Tech. 2013, 6, 3257–3270. [Google Scholar] [CrossRef] [Green Version]
  56. Ahn, C.; Torres, O.; Jethva, H. Assessment of OMI near-UV aerosol optical depth over land. J. Geophys. Res.-Atmos. 2014, 119, 2457–2473. [Google Scholar] [CrossRef] [Green Version]
  57. Jethva, H.; Torres, O.; Ahn, C. Global assessment of OMI aerosol single-scattering albedo using ground-based AERONET inversion. J. Geophys. Res.-Atmos. 2014, 119, 9020–9040. [Google Scholar] [CrossRef]
  58. Kahn, R.A.; Gaitley, B.J.; Garay, M.J.; Diner, D.J.; Eck, T.F.; Smirnov, A.; Holben, B.N. Multiangle Imaging SpectroRadiometer global aerosol product assessment by comparison with the Aerosol Robotic Network. J. Geophys. Res.-Atmos. 2010, 115, D23209. [Google Scholar] [CrossRef]
  59. Mishchenko, M.I.; Liu, L.; Geogdzhayev, I.V.; Travis, L.D.; Cairns, B.; Lacis, A.A. Toward unified satellite climatology of aerosol properties. J. Quant. Spectrosc. Rad. Trans. 2010, 111, 540–552. [Google Scholar] [CrossRef]
  60. Cheng, T.; Chen, H.; Gu, X.; Yu, T.; Guo, J.; Guo, H. The intercomparison of MODIS, MISR and GOCART aerosol products against AERONET data over China. J. Quant. Spectrosc. Rad. Trans. 2012, 113, 2135–2145. [Google Scholar] [CrossRef]
  61. Petrenko, M.; Ichoku, C. Coherent uncertainty analysis of aerosol measurements from multiple satellite sensors. Atmos. Chem. Phys. 2013, 13, 6777–6805. [Google Scholar] [CrossRef] [Green Version]
  62. Kahn, R.A.; Gaitley, B.J. An analysis of global aerosol type as retrieved by MISR. J. Geophys. Res.-Atmos. 2015, 120, 4248–4281. [Google Scholar] [CrossRef]
  63. Salomonson, V.V.; Barnes, W.L.; Maymon, P.W.; Montgomery, H.E.; Ostrow, H. MODIS: Advanced facility instrument for studies of the Earth as a system. IEEE Trans. Geosci. Remote 1989, 27, 145–153. [Google Scholar] [CrossRef]
  64. Levy, R.C.; Mattoo, S.; Munchak, L.A.; Remer, L.A.; Sayer, A.M.; Patadia, F.; Hsu, N.C. The Collection 6 MODIS aerosol products over land and ocean. Atmos. Measur. Tech. 2013, 6, 2989–3034. [Google Scholar] [CrossRef] [Green Version]
  65. Konovalov, I.B.; Lvova, D.A.; Beekmann, M. Estimation of the elemental to organic carbon ratio in biomass burning aerosol using AERONET retrievals. Atmosphere 2017, 8, 122. [Google Scholar] [CrossRef] [Green Version]
  66. Holben, B.; Eck, T.; Slutsker, I.; Tanre, D.; Buis, J.; Setzer, A.; Vermote, E.; Reagan, J.; Kaufman, Y.; Nakajima, T.; et al. AERONET—A federated instrument network and data archive for aerosol characterization. Remote Sens. Environ. 1998, 66, 1–16. [Google Scholar] [CrossRef]
  67. Giles, D.M.; Sinyuk, A.; Sorokin, M.G.; Schafer, J.S.; Smirnov, A.; Slutsker, I.; Eck, T.F.; Holben, B.N.; Lewis, J.R.; Campbell, J.R.; et al. Advancements in the Aerosol Robotic Network (AERONET) Version 3 database—Automated near-real-time quality control algorithm with improved cloud screening for Sun photometer aerosol optical depth (AOD) measurements. Atmos. Measur. Tech. 2019, 12, 169–209. [Google Scholar] [CrossRef] [Green Version]
  68. Mailler, S.; Menut, L.; Khvorostyanov, D.; Valari, M.; Couvidat, F.; Siour, G.; Turquety, S.; Briant, R.; Tuccella, P.; Bessagnet, B.; et al. CHIMERE-2017: From urban to hemispheric chemistry transport modeling. Geosci. Model Dev. 2017, 10, 2397–2423. [Google Scholar] [CrossRef] [Green Version]
  69. Skamarock, W.C.; Klemp, J.B.; Dudhia, J.; Gill, D.O.; Barker, D.M.; Duda, M.G.; Huang, X.-Y.; Wang, W.; Powers, J.G. A description of the advanced research WRF version 3. In NCAR Tech. Notes–475CSTR; NCAR: Boulder, CO, USA, 2008; pp. 1–113. [Google Scholar]
  70. Konovalov, I.B.; Beekmann, M.; Kuznetsova, I.N.; Yurova, A.; Zvyagintsev, A.M. Atmospheric impacts of the 2010 Russian wildfires: Integrating modelling and measurements of an extreme air pollution episode in the Moscow region. Atmos. Chem. Phys. 2011, 11, 10031–10056. [Google Scholar] [CrossRef] [Green Version]
  71. Giglio, L.; Schroeder, W.; Justice, C.O. The collection 6 MODIS active fire detection algorithm and fire products. Remote Sens. Environ. 2016, 178, 31–41. [Google Scholar] [CrossRef] [Green Version]
  72. Sofiev, M.; Ermakova, T.; Vankevich, R. Evaluation of the smoke-injection height from wild-land fires using remote-sensing data. Atmos. Chem. Phys. 2012, 12, 1995–2006. [Google Scholar] [CrossRef] [Green Version]
  73. Mazzoni, D.; Logan, J.A.; Diner, D.; Kahn, R.A.; Tong, L.; Li, Q. A data-mining approach to associating MISR smoke plume heights with MODIS fire measurements. Remote Sens. Environ. 2007, 107, 138–148. [Google Scholar] [CrossRef]
  74. Lu, Z.; Streets, D.G.; Winijkul, E.; Yan, F.; Chen, Y.; Bond, T.C.; Feng, Y.; Dubey, M.K.; Liu, S.; Pinto, J.P.; et al. Light absorption properties and radiative effects of primary organic aerosol emissions. Environ. Sci. Technol. 2015, 49, 4868–4877. [Google Scholar] [CrossRef] [PubMed] [Green Version]
  75. Altman, N.S. An introduction to kernel and nearest-neighbor nonparametric regression. Am. Stat. 1992, 46, 175–185. [Google Scholar]
  76. Press, W.H.; Teukolsky, S.A.; Vetterling, W.T.; Flannery, B.P. Numerical Recipes, 2nd ed.; Cambridge University Press: Cambridge, UK, 1992; pp. 402–406. [Google Scholar]
  77. Efron, B.; Tibshirani, R.J. An Introduction to the Bootstrap; Chapman & Hall: New York, NY, USA, 1993; pp. 45–56. [Google Scholar]
  78. Stromatas, S.; Turquety, S.; Menut, L.; Chepfer, H.; Péré, J.C.; Cesana, G.; Bessagnet, B. Lidar signal simulation for the evaluation of aerosols in chemistry transport models. Geosci. Model Dev. 2012, 5, 1543–1564. [Google Scholar] [CrossRef] [Green Version]
  79. Petters, M.D.; Kreidenweis, S.M. A single parameter representation of hygroscopic growth and cloud condensation nucleus activity. Atmos. Chem. Phys. 2007, 7, 1961–1971. [Google Scholar] [CrossRef] [Green Version]
  80. Paris, J.-D.; Stohl, A.; Nédélec, P.; Arshinov, M.Y.; Panchenko, M.V.; Shmargunov, V.P.; Law, K.S.; Belan, B.D.; Ciais, P. Wildfire smoke in the Siberian Arctic in summer: Source characterization and plume evolution from airborne measurements. Atmos. Chem. Phys. 2009, 9, 9315–9327. [Google Scholar] [CrossRef] [Green Version]
  81. Andreae, M.O.; Afchine, A.; Albrecht, R.; Holanda, B.A.; Artaxo, P.; Barbosa, H.M.J.; Borrmann, S.; Cecchini, M.A.; Costa, A.; Dollner, M.; et al. Aerosol characteristics and particle production in the upper troposphere over the Amazon Basin. Atmos. Chem. Phys. 2018, 18, 921–961. [Google Scholar] [CrossRef] [Green Version]
  82. Selimovic, V.; Yokelson, R.J.; McMeeking, G.R.; Coefield, S. In situ measurements of trace gases, PM, and aerosol optical properties during the 2017 NW US wildfire smoke event. Atmos. Chem. Phys. 2019, 19, 3905–3926. [Google Scholar] [CrossRef] [Green Version]
  83. Schuster, G.L.; Dubovik, O.; Arola, A.; Eck, T.F.; Holben, B.N. Remote sensing of soot carbon—Part 2: Understanding the absorption Ångström exponent. Atmos. Chem. Phys. 2016, 16, 1587–1602. [Google Scholar] [CrossRef] [Green Version]
  84. Cappa, C.D.; Lim, C.Y.; Hagan, D.H.; Coggon, M.; Koss, A.; Sekimoto, K.; de Gouw, J.; Onasch, T.B.; Warneke, C.; Kroll, J.H. Biomass-burning-derived particles from a wide variety of fuels—Part 2: Effects of photochemical aging on particle optical and chemical properties. Atmos. Chem. Phys. 2020, 20, 8511–8532. [Google Scholar] [CrossRef]
Figure 1. Schematic overview of the study design.
Remotesensing 14 02625 g001
Figure 2. Spatial fields of the temporal averages of (a) AAOD at 388 nm, (b) AAOD at 867 nm, and (c) AOD at 550 nm in the period from 1 to 31 July 2016 according to OMI, MISR, and MODIS observations, respectively. The figure illustrates the satellite data sets used in this study before applying the data harmonization procedure described in Section 2.1.1.
Remotesensing 14 02625 g002
Figure 3. The same as in Figure 2 but after applying the data harmonization procedure. Note that any data pixel shown in Figure 1 and Figure 2 can correspond to several observations taken on different days during the study period.
Remotesensing 14 02625 g003
Figure 4. Spatial distribution of the mean BB aerosol photochemical aerosol age (h) in July 2016 according to simulations performed with the CHIMERE chemistry transport model [43,50]. The gridded estimates of the photochemical age were selected in time and space consistently with the pre-processed satellite data (see Figure 3).
Remotesensing 14 02625 g004
Figure 5. Comparison of the relationships between (a) AAOD388 and AAOD867, (b) AAOD388 and AOD550, and (c) AAOD867 and AOD550 according to the satellite data (blue symbols and lines) and the AERONET observations (red symbols and lines) in Siberia. The lines show linear fits through the origin, with the 95% confidence intervals indicated by shading. Note that the confidence intervals for the satellite data are narrower than those for AERONET data because the number of points in the satellite dataset (347) was much bigger than in the AERONET dataset (29).
Remotesensing 14 02625 g005
Figure 6. Schematic representation of the Monte Carlo algorithm for the estimation of the BrC absorption characteristics.
Remotesensing 14 02625 g006
Figure 7. Results of the validation of the Monte Carlo algorithm for the estimation of BrC absorption against a synthetic data set based on the AERONET observations in Siberia: the predicated (inferred) values vs. the test (“true”) values of (a) δBrC, (b) kOA, and (c) the BC/OA ratio. Values of δBr and kOA correspond to the 388 nm wavelength. Shaded bands depict the two-sigma intervals.
Remotesensing 14 02625 g007
Figure 8. Different components of the observation vector—(a) AAE388/867, (b) AER388/550, and (c) AER867/550—as a function of the BB aerosol photochemical age. Each panel shows the values according to satellite observations, nonlinear approximations of these values, and the corresponding confidence intervals in terms of the 95th percentile.
Remotesensing 14 02625 g008
Figure 9. Estimates of (a) the relative contribution of BrC to the total light absorption by BB aerosol, (b) the imaginary refractive index of the organic fraction of BB aerosol, and (c) the ratio of black carbon and organic matter mass concentrations as a function of the BB aerosol photochemical age. Each panel shows the estimates inferred from satellite observations, nonlinear approximations of these estimates, and the corresponding confidence intervals in terms of the 95th percentile.
Remotesensing 14 02625 g009
Table 1. Values of the key aerosol parameters and the characteristics of the corresponding probability distribution functions assumed in the Monte Carlo estimation algorithm, including the ranges of the possible parameter values and (in brackets) the mean and standard deviation of the truncated Gaussian distributions. Notations are explained in the footnotes. The values of the real and imaginary parts of the refractive index are given for the 550 nm wavelength. Note that uniform probability distributions within the reported ranges were assumed for k and κ in the case of the OA. Information on the choice of the parameter values can be found in Konovalov et al. [40].
ParameterOABC(NH4)2SO4
n11.551.951.52
k20–0.0350.790
GMD 3 (µm)0.22–0.35
(0.28, 0.06)
0.02–0.3
(0.16, 0.14)
Same as for OA
σ 41.3–1.9
(1.6, 0.3)
1.4–2.2
(1.8, 0.4)
Same as for OA
w 50.5–6.0
(w0 7, 0.25 × w0)
--
κ 60–0.2700.61
BC/OA
mass ratio (g g−1)
-0.011–0.071
(0.041, 0.03)
-
(NH4)2SO4/OA mass ratio (g g−1)0.05–0.15
(0.1, 0.05)
--
1 Real part of the refractive index. 2 Imaginary part of the refractive index. 3 Geometric mean diameter of the BB aerosol particles. 4 Standard deviation of the particle volume size distribution. 5 Wavelength dependence of k for organic aerosol. 6 Hygroscopicity parameter. 7 The most probable value (estimated as a function of the BC/OA ratio according to Lu et al. [74]) of the wavelength dependence.
Publisher’s Note: MDPI stays neutral with regard to jurisdictional claims in published maps and institutional affiliations.

