Abstract
PALSAR2 polarimetric distortion matrix is measured using corner reflectors deployed in the Amazonian forest. The Amazonian forest near the geomagnetic equator provides ideal sites for the assessment of L-band PALSAR2 antenna parameters, at free Faraday rotation. Corner reflectors (CRs) deployed at free Faraday rotation provide accurate estimation of antenna cross-talks in contrast to the biased measurements obtained with CRs deployed at significant Faraday rotation. The extended Freeman–Van Zyl calibration method introduced and validated for ALOS-PALSAR calibration is used for the assessment of PALSAR-2 calibration parameters. Six datasets collected over the Amazonian rainforests (with CRs) are used to assess PALSAR-2 distortion matrix for five beams (FP6-3 to FP6-7) with incidence angle varying from 25° to 40°. It is shown that the PALSAR2 antenna is highly isolated with very low cross-talks (lower than −40 dB). Finally, the impact of a significant Faraday rotation on antenna cross-talk measurements using CR is discussed.
1. Introduction
ALOS2, which was launched on the 24th of May 2014, is equipped with a fully polarimetric L-band SAR, PALSAR2 [1,2,3]. Unlike ALOS-PALSAR, which used to collect polarimetric data at only one off-nadir angle (21.5°) [4], PALSAR-2 offers the possibility of providing polarimetric measurements at various beams (seven beams, with incidence angle varying from 25° to 40°) [1,2]. The active antenna uses 180 transmit-receive (T/R) modules; each T/R excites a single subarray [1]. The requirement on the overall antenna array cross-talk is low (better than −30 dB [1,2]), and this should permit the measurement of pure HV (at low Faraday conditions) [5,6]. However, different distortion matrices might be required for the extraction of pure HH, HV, VH, and VV from the PALSAR2 PLR measurements at the various beams. Calibration residual errors should be minimized since PALSAR-2 is expected to have a signal-to-noise ratio (S/N) 3-dB better than PALSAR. The latter was already operating at low noise floor (NESZ better than −34 dB [5]).
Like L-band JERS-1 SAR and ALOS PALSAR, PALSAR-2 measurements might be affected by Faraday rotation. In the past, the use of corner reflector (CR) measurements in the presence of Faraday rotation led to mixed conclusions regarding the actual isolation of the ALOS-PALSAR antenna [7,8,9]. PALSAR antenna measurements using CR deployed in Germany and Australia led to the conclusion that the PALSAR antenna is not highly isolated (−23 dB isolation) [7,8]. However, the use of the CR measurements collected in the Amazonian rainforests, at low Faraday rotation conditions, led to the conclusion that PALSAR antenna is highly isolated, with a cross-talk lower than −37 dB [3,5,6,9,10].
In Section 2, the lessons learned from PALSAR calibration are first presented. The sites of calibration in the Amazonian rainforests and the polarimetric PALSAR2 images used for the assessment of PALSAR2 calibration, are described in Section 3. The extended Freeman–VanZyl calibration method [6] is briefly presented in Section 4 and used for the assessment of polarimetric PALSAR2 transmit-receive distortion matrices. In Section 5, an estimation of PALSAR-2 distortion matrix is provided for five beams (FP6-3 to FP6-7) with incidence angle varying between 25° and 40°. Measurement of the Faraday rotation during PALSAR2 acquisition is conducted to confirm the legitimacy of the estimation of antenna cross-talks under negligible Faraday rotation. Finally, the impact of a significant Faraday rotation on CR-based measurements of antenna cross-talks is discussed using PALSAR2 images collected over the CCRS calibration site in Ottawa (Canada).
2. Lessons Learned from ALOS-PALSAR Calibration
ALOS-PALSAR, launched in 2006, was the first polarimetric L-band SAR satellite mission. The use of various calibration sites led to confusion that arose at the 2006 ALOS Calibration/Validation meeting regarding the actual PALSAR antenna isolation. The presence of Faraday rotation in addition to the uncertainty regarding the actual isolation of the PALSAR antenna, led to mixed conclusions regarding the actual isolation of the H-V PALSAR antenna [8,9,11].
The use of the CR measurements obtained at the DLR calibration site led to the following misleading conclusion regarding PALSAR antenna isolation; PALSAR antenna is not well isolated with significant antenna cross-talks varying between −18 dB and −23 dB [7,11]. Such significant cross-talk would have made the use of PALSAR HV in dual-pol (HH-HV) useless since the contamination of HV by the like polarization (HH and VV) cannot be corrected for, as discussed in [12]. In fact, PALSAR antenna is higly isolated and this permits an excellent exploitation of PALSAR dual-pol (HH-HV) systematic coverage for global forest mapping and monitoring [3,13,14].
Using CR deployed in the Amazonian rainforests, Touzi and Shimada [6] showed that the PALSAR antenna is highly isolated (−37 dB isolation) [9,10]. The thorough investigation they conducted in [6] using PALSAR data collected over various calibration sites (with CRs), in Japan (JAXA, Sweden (Chalmers University), Germany (DLR), and Canada (CCRS), in addition to the ones collected over the Amazonian rainforests, led to the following conclusions:
- PALSAR2 CR measurements in the Amazonian rainforests, collected at free Faraday rotations [15], revealed insignificant return at HV and VH CR measurements. These CR measurements integrated in two different calibration methods led to the conclusion that ALOS-PALSAR is highly isolated with a cross-talk lower than −37 dB [5,6];
- The presence of small but still significant Faraday rotation (2–3°), at the JAXA (Japan), CCRS, DLR and, Chalmers U. calibration sites, induces a significant CR return at the cross-polarization (cross-pol) HV and VH. The integration of these contaminated CR response in the conventional polarimetric calibration methods [16,17,18] led to erroneous (i.e., biased) estimates of the antenna cross-talks.
These lessons learned with the calibration of ALOS-PALSAR has encouraged JAXA to deploy CRs in the Amazonian rainforests. The latter should permit accurate assessment of ALOS2-PALSAR2 calibration parameters, as discussed in Section 3.
However, the impact of a significant Faraday rotation on CR response in addition to the antenna cross-talks related contamination was not thoroughly investigated in [6]. This is conducted in the following Section 4. The analytical response of CR is derived as a function of the Faraday rotation and antenna cross-talks, and the cross-pol (HV and VH) contamination with the like-pol (HH and VV) due to the Faraday rotation is demonstrated using PALSAR2 data collected over the CCRS calibration site in Ottawa.
3. The Extended Freeman-Van Zyl Calibration Method for Accurate Assessment of Antenna Cross-Talks
The van Zyl calibration, which offers a more convenient solution than the conventional method that requires the deployment of many reference point targets across the swath, has become the standard method for estimation and calibration of antenna distortion matrix variations with incidence angle [17,18,19]. However, the van Zyl algorithm is limited to symmetric SAR systems. This problem has been circumvented by Freeman [17] who introduced a symmetrization method to adapt the van Zyl calibration to non-symmetric SAR systems. The Freeman–van Zyl calibration technique [17], which symmetrizes the system prior to the estimation of the distortion matrix elements, uses the van Zyl iterative method [16] for antenna cross-talk estimation. Recently, the accuracy of the van Zyl method [16] has been questioned [6,18] for azimuthally symmetric targets of low HV return in comparison with HH, VV, and the HH-VV cross-correlation. The van Zyl algorithm [16] was reconsidered [6] and an extension of van Zyl algorithm was introduced to solve this problem. An entity was introduced to quantify the importance of the HV return in comparison with HH, VV, and the HH-VV cross-correlation. The van Zyl equations of [16] were expressed in terms of , and this led to the development of an iterative method for accurate estimation of antenna X-talk, at low and significant conditions, using azimuthally symmetric targets. The method was validated using PALSAR data collected over the Amazonian forest [6]. Errors higher than 10 dB can occur when is ignored. The iterative method corrects for these errors, and permits the demonstration of ALOS-PALSAR high isolation (better than −37 dB) [6].
The extended Freeman–van Zyl calibration method [6] includes two steps:
- Data symmetrization using the Freeman symmetrization method [17];
- Generation of the required calibration parameters and calibration using an extended version of van Zyl calibration method that leads to unbiased estimation of antenna X-talk for all azimuthally symmetric targets, including the ones with low HV return in comparison with HH, VV, and the HH-VV cross-correlation.
3.1. The FREEMAN Symmetrization Method
The “Uncalibrated” PALSAR2 data provided by JAXA were in fact calibrated for the transmit-receive antenna gain variations with incidence angle, as well as for slant range variations [2,20]. At free Faraday rotations, the following model can be used to express the voltage measurements, as a function of the illuminated target scattering matrix [17,21]:
where the measured voltage matrix is given by:
and the actual target scattering matrix is given by:
In Equation (1), denotes the matrix transpose; and are the channel imbalances between the H and V channels on receive and transmit, respectively. and are the cross-talks when a vertically polarized wave is transmitted and received, respectively. and are the cross-talks when a horizontally polarized wave is transmitted and received, respectively. The van Zyl calibration method assumes that the SAR system is symmetric; the transmitting and receiving distortion matrices are identical with , , and . Such assumptions may not be satisfied in general, and as result, the van Zyl calibration method might be of limited use in certain applications. Freeman introduced the symmetrization method to extend the use of the van Zyl algorithm to non-symmetric systems. After application of the Freeman symmetrization [17], the symmetrized measured voltage matrix is related to the actual scattering matrix by the following equation (with under target reciprocity assumption):
where ; and and are expressed in [17] as functions of () and () [6]. The van Zyl algorithm can then be applied to the symmetrized system of Equation (4), as follows [16]:
- Apply the van Zyl iterative process to derive and using an azimuthally symmetric target;
- Deduce F, , and using the additional information provided by a trihedral.
3.2. Reconsideration of Van Zyl Algorithm
The accuracy of van Zyl’s algorithm [16] has been questioned for azimuthally symmetric reference targets of low HV return in comparison with HH, VV, and their cross-correlation [6,18]. This issue was taken into account during the development of the calibration method specific for the Convair-580 SAR [19]. The Convair-580 SAR system, which uses different receiving configurations depending on the transmitted (horizontal or vertical) polarization, required a more complex calibration method than the ones developed for systems with one receiving configuration (such as the JPL AIRSAR system, for example). To quantify the residual relative error that would result if the entities , , and were ignored during the cross-talk estimation process, the following entity (of Equation (23) in [19]) was introduced [6,19]:
where and C is a calibration constant [19]. The actual cross-polarized intensity mean is expressed as a function of the measured voltage and as:
For an azimuthally symmetric target of that is significant in comparison with , , , and , is close to zero, and the measured and actual cross-polarized intensity means are identical (modulo a multiplicative coefficient). Since the calibration of the Convair-580 X-band polarimetric SAR becomes too complex if is not negligible [19], only azimuthally symmetric targets with close to zero are used [19]. PALSAR2, like PALSAR and most of the conventional polarimetric SARs, requires the use of a calibration model much simpler than the Convair-580 SAR (whose receiver is adapted to the transmitted polarization [19]). The van Zyl model can then be retained for PALSAR2 calibration, and the van Zyl equations [16] are expressed as a function of , which takes into account all the required terms for unbiased estimation of antenna X-talks [6].
3.3. Assessment of Antenna Cross-Talks Using an Iterative Method
Van Zyl’s Equations in Terms of for Azimuthally Symmetric Target
Under the assumption of an azimuthally symmetric target, the following equations are derived from [16] as a function of RR and the cross-talk estimate and [6]:
The two unknowns and can be determined by solving the two equations above as a function of the voltages , , , and their cross-correlations measured over the azimuthally symmetrical reference target [6]. The two unknowns are determined using an analytical equation or an iterative method depending on the values:
- Case 1: close to zero. The solutions are obtained by solving an analytical equation of 1st order. This analytical method is named Method 1;
- Case 2: of significant value (not negligible): In this case, an additional equation is needed to solve for the two unknowns. An iterative method similar to the one suggested by van Zyl can be applied to solve the problem.
The iterative method is applied as follows:
- Derive and using Method 1, under the approximation that ;
- Compute the corresponding by inserting the two solutions and in Equation (5);
- If is close to zero or if is larger than the one computed in the previous iteration, or Test1 and Test2 are too low, stop the iterative process, and retain the solutions for and ;
- If not, update Equation (6) of with the actual value and apply Method 1 again with the new estimate;
- Repeat 1–3 until condition 4 is satisfied.
After the estimation of and , all the required calibration parameters , , , and can be deduced using the additional equations provided by the corner reflector, as shown in [16].
In the following, the iterative method described above is adopted for the assessment of PALSAR2 system parameters using datasets collected over the Amazonian rainforest sites (with CRs), at free Faraday rotation conditions.
4. Assessment of PALSAR2 System Parameters at Low Faraday Rotation Conditions Using Amazonian Rainforests
4.1. Calibration Sites
The Amazonian rainforest near the geomagnetic equator, at free Faraday rotation [15], has been used as the ideal site for the assessment and calibration of L-band ALOS-PALSAR and PALSAR2 [3,5,6,22]. CRs deployed at free Faraday rotation provide accurate estimation of antenna cross-talks in contrast to the biased measurements obtained with CRs deployed at significant Faraday rotation, as shown in [6]. In 2014, five CRs were deployed by JAXA in the Amazonian rainforests [23], and used in support of polarimetric PALSAR2 calibration. Six polarimetric images collected over the Amazonian rainforests (near Rio Branco, Brazil) at various incidence angles are used in the following to assess PALSAR-2 distortion matrix for five beams (FP6-3 to FP6-7) with incidence angle varying from 25° to 40°. The CR measurements are also used to confirm the very low Faraday rotation conditions during PALSAR2 data acquisition.
4.2. Assessment of Polarimetric PALSAR2 Distortion Matrix
Figure 1, Figure 2, Figure 3 and Figure 4 present the response (in range) of a CR covered with the FP6-3 polarimetric mode on the 8th of August, 2014. According to Figure 3 and Figure 4, there is no CR (HV and VH) return at the HH and VV peak location. This shows that the PALSAR2 cross-talk is very low, and the ALOS2 acquisition took place at very low Faraday rotation conditions. The various PALSAR2 modes considered herein, the dates of the acquisition, and the incidence angle (in degree) at the CR location are indicated in Table 1. Channel imbalance ( and ) (magnitude and phase) are also given in Table 1. The following observations can be noted:
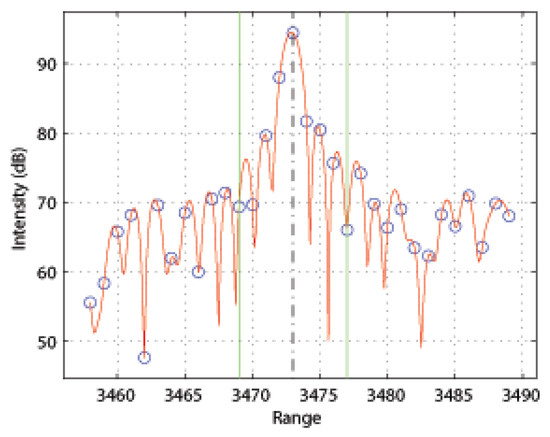
Figure 1.
Corner reflector reflector HH response (in range expressed in pixel numbers).
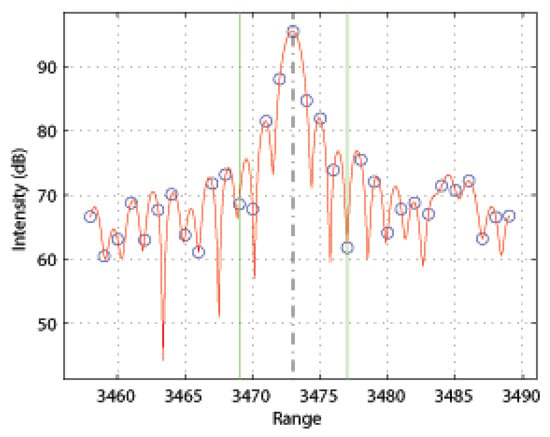
Figure 2.
Corner reflector VV response (in range).
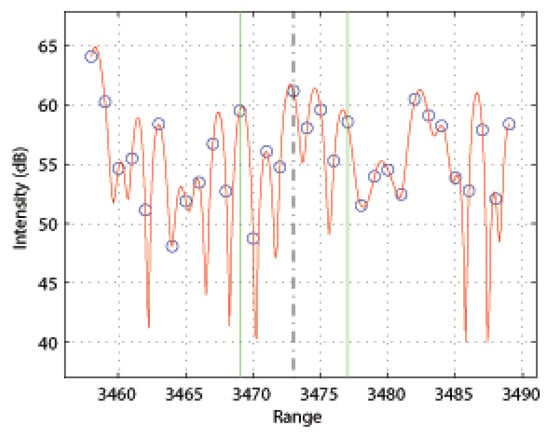
Figure 3.
Corner reflector HV response (in range).
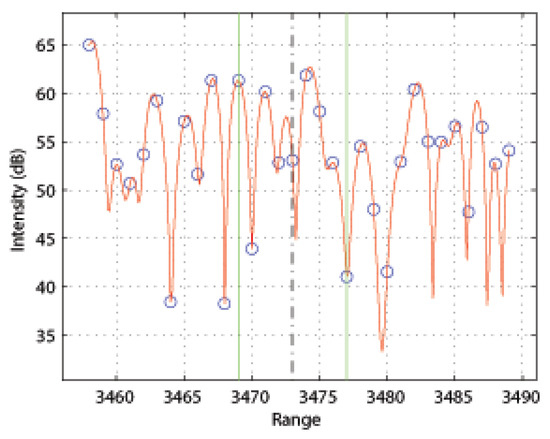
Figure 4.
Corner reflector VH response (in range).

Table 1.
PALSAR2 channel imbalance (magnitude and phase (in degree)).
- and vary (slightly) with incidence angle, as might be expected. The magnitude of the ratio varies between 1.021 and 1.044; which corresponds to a variation in intensity ratio within 0.2 dB;
- Channel imbalance are very stable (in time) for the same mode, as can be noted for the 2 acquisitions in FP6-7 (last rows of Table 1);
- Channel imbalance phase varies with incidence angle, as might be expected. However, it remains stable (in time) for the same mode at different acquisitions, as can be noted for the two acquisitions in FP6-7.
The extended Freeman–van Zyl iterative method is applied for the generation of PALSAR2 antenna cross-talks. and are given (in dB) in Table 2. The residual error is computed using Equation (5). The final error computed at the last iteration corresponds to the residual error. All the cross-talks given in the table were obtained with a very low residual error ( lower than −43 dB).

Table 2.
PALSAR2 Antenna Cross-Talks (in dB) and Faraday Rotation (in degree).
As can be noted in Table 2, the PALSAR2 antenna is highly isolated with cross-talk lower than −40 dB. The CR-measurements permit demonstrating the very high isolation of the PALSAR2 antenna: cross-talks lower than −40 dB [24]. Similar results were obtained in [3,22,25] using different calibration approaches.
4.3. Measurement of the Actual Faraday Rotation during PALSAR2 Acquisition
Many studies have shown that Faraday rotation is low near the equator [15,26]. These results are confirmed in the following for the five PALSAR2 images collected over the JAXA sites of calibration in the Amazonian rainforests. Several methods can be used to measure the Faraday rotation [26,27,28]. We have adopted herein the Bickel and Bates method [29] which calculates the Faraday rotation at the circular basis as follows:
where is given as a function of the Faraday rotation angle and the scattering matrix [S] of Equation (3) by:
is given by [27,29]:
where is the argument of the complex Z, and denotes spatial averaging.
Equation (11) is used to measure the Faraday rotation for the five PALSAR images. The measurements obtained at the CRs are given in Table 2. As expected, the Faraday rotation angle is very low (lower than 0.24°) during the 5 PALSAR2 acquisitions. This confirms the accuracy of the PALSAR2 antenna distortion matrix measurements obtained above, under the assumption of negligible Faraday rotation.
5. Impact of Significant Faraday Rotation on PALSAR2 Polarimetric Distortion Matrix Measurement
The model of Equation (1) can be extended to take into account the Faraday rotation. Channel imbalances can also be separated from the polarimetric distortion matrices as done in [21]. This leads to the following equation [21,30]:
with , , and is given by Equation (10) as a function of the scattering matrix and the Faraday rotation angle . It is worth noting that Equation (12), which is an extension of the van Zyl calibration model that takes into account the Faraday rotation, is expressed as a function of the conventional scattering matrix in contrast to the Freeman model [30] expressed as a function of the transposes of and matrices.
The CR response combined with the channel imbalance phase difference, which can be derived using the Zebker method [31], permits the measurement of the channel imbalance and ([6,17,31]). After the channel imbalance correction, the measured voltages can be expressed (using Equation (12)) as a function of the antenna cross-talks and matrix elements in the following equation:
where
For a CR, and , and Equation (13) can be used to derive the CR-measured voltage vector as a function of the Faraday rotation angle and the antenna cross-talks :
In 2014, several PALSAR2 images were collected over the CCRS calibration site in Ottawa. The PALSAR2 image collected on the 9th of September is used herein. Figure 5, Figure 6, Figure 7 and Figure 8 present the polarimetric response of the CCRS (2.5 m CR) at HH, VV, HV, and VH. In contrast to the low return at cross-pol of the JAXA CR deployed in the Amazonian rainforests (Figure 3 and Figure 4), the Ottawa CR presents a significant return at HV and VH polarization as seen in Figure 7 and Figure 8.
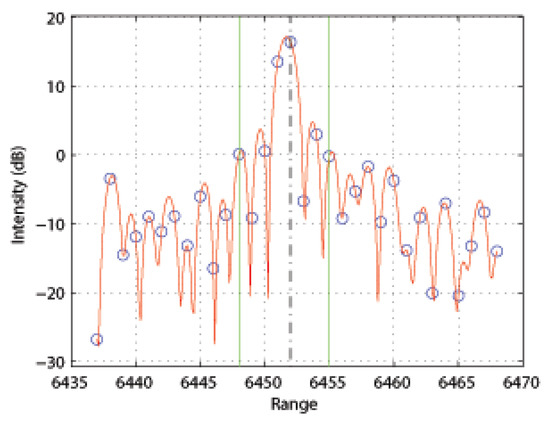
Figure 5.
Corner reflector HH response (in range expressed in pixel numbers).
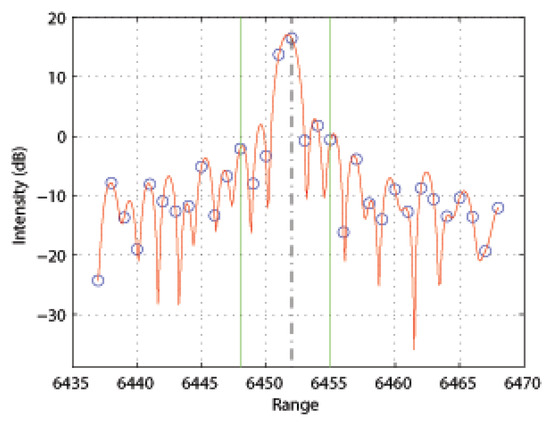
Figure 6.
Corner reflector VV response (Ottawa).
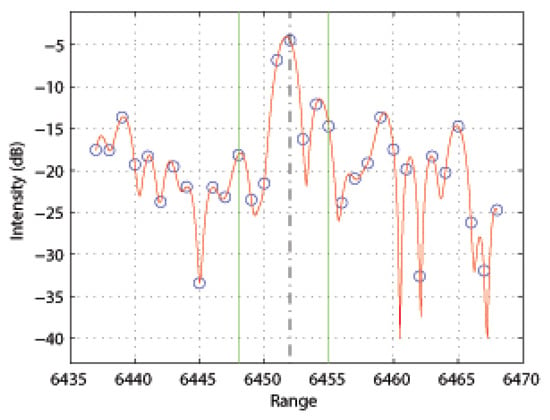
Figure 7.
Corner reflector HV response (Ottawa).
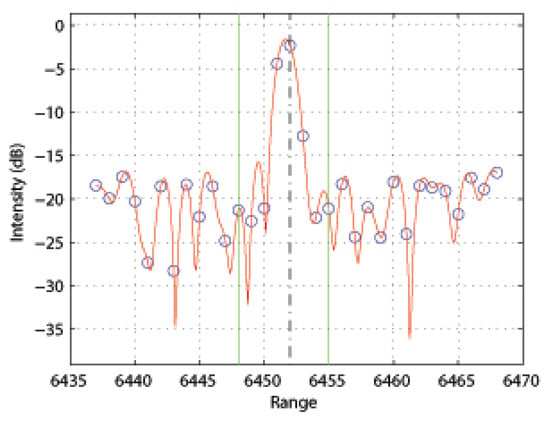
Figure 8.
Corner reflector VH response (Ottawa).
The results obtained in the previous section show that the PALSAR2 antenna is highly isolated with cross-talks lower than −40 dB. The analysis of the CR voltage Equation (15) with negligible cross-talks (cross-talks lower than −40 dB) leads to the following conclusions:
- The ratios of the cross-like polarization voltage, −20.03 dB and −19.95 dB do not correspond to the actual antenna cross-talk contamination of the cross-pol (HV and VH) by the like polarization (HH and VV), as could be misinterpreted if the Faraday rotation contamination is ignored ([7]). In fact, these cross-like polarization voltage ratios lead to an estimation of the Faraday rotation angle for a highly isolated antenna, as can be shown using Equation (15):Equation (16) is used to estimate the Faraday rotation during PALSAR2 acquisitions. The results obtained are similar (within 0.2) with the ones obtained with the Bickel and Bates method (Equation (11)); = 2.8° with , = 2.9° with in comparison with = 3.1° obtained over a forested area using Equation (11).
- The sum of the CR cross-pol voltages cancels the Faraday rotation contamination.This can be shown using the following equation derived from (15):Since the cross-talks are negligible, should be close to zero. Figure 9 presents the CR response of the averaged PALSAR2 image ()/2. The significant peaks that occur at HV and VH images of Figure 6 and Figure 7 vanish in Figure 9. At the HH and VV peak location, the intensity of the averaged cross-pol return vanishes in the CR surrounding clutter of radar backscattering (−18.23 dB) which is much lower than HH and VV retro-diffusion (about 15 dB).
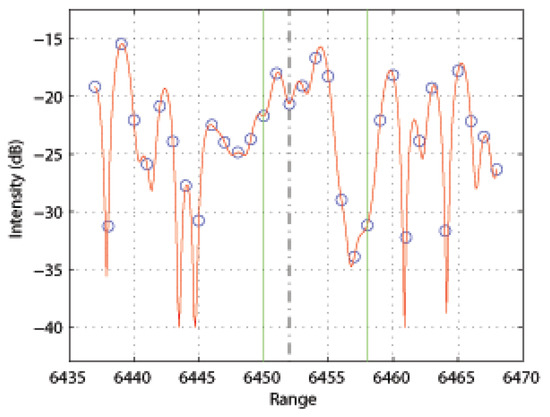 Figure 9. Corner reflector (HV + VH)/2 response (Ottawa).
In summary, the analytical presentation of the CR voltage as a function of the antenna cross-talks and Faraday rotation leads to the conclusion that the HV and VH contaminations, which can be measured from SAR images collected with a highly isolated antenna, are mainly due to the actual Faraday rotation. In the case that the antenna is not highly isolated, Equation (13) obtained after the channel imbalance correction (using the CR) shows that additional reference point targets (of scattering response different from the CR) should be used for the measurement of the 5 unknowns; the 4 antenna cross-talks and the Faraday rotation.
6. Conclusions
In summary, the PALSAR antenna is highly isolated. Both the antenna subarray and T/R are highly isolated, and as a result, the global antenna is highly isolated for all the modes considered. The excellent performances of the polarimetric PALSAR2 in terms of NESZ (better than −37 dB ([1,3]) combined with the high antenna isolation permit the demonstration of the unique L-band long-penetration SAR capabilities at low incidence angles (25°) for subsurface peatland hydrology monitoring and discontinuous permafrost mapping [32,33]. The high isolation of the polarimetric ALOS2-PALSAR2 permits a simplification of the assessment and calibration of the ALOS2-Compact experimental mode, as discussed in [34].
Author Contributions
Concepts and Methodology, R.T. and M.S.; ALOS2-PALSAR2 raw data processing and Calibration, M.S. and T.M.; writing—original draft preparation, R.T. and M.S.; writing—review and editing, R.T., M.S. and T.M. All authors have read and agreed to the published version of the manuscript.
Funding
This research received no external funding.
Data Availability Statement
The ALOS-2 original data are provided by JAXA under ALOS-2 Calibration Validation and Science Team (CVST) and the Research Announcement on the Earth Observations (EO-RA).
Acknowledgments
The authors would like to thank the anonymous reviewers for their helpful comments and suggestions. We would like to express our special thanks to JAXA for data observation and provisions. S. Nedelcu from CCRS is thanked for his help in PALSAR2 data processing.
Conflicts of Interest
The authors declare no conflict of interest.
References
- Okada, Y.; Hamasaki, T.; Tsuji, M.; Iwamoto, M.; Hariu, K.; Kankaku, Y.; Suzuki, S.; Osawa, Y. Hardware performance of L-band SAR system onboard ALOS2. In Proceedings of the IGARSS 2011, Vancouver, BC, Canada, 24–29 July 2011. [Google Scholar]
- Shimada, M. PALSAR-2 beam calibration. In Proceedings of the ALOS2 Cal-Val Meeting CVST2, Tsukuba, Japan, 25–26 November 2013. [Google Scholar]
- Shimada, M. Imaging from Spaceborne and Airborne SARs, Calibration, and Applications; Taylor and Francis, CRC Press: Boca Raton, FL, USA, 2018. [Google Scholar]
- Ito, N.; Hamazaki, T.; Tomioka, K. ALOS/PALSAR chracteristics and status. In Proceedings of the CEOS SAR Workshop Proceedings, Tokyo, Japan, 2–5 April 2001; pp. 191–194. [Google Scholar]
- Shimada, M.; Isoguchi, O.; Tadono, T.; Isono, K. PALSAR Radiometric and Geometric Calibration. IEEE Trans. Geosci. Rem. Sens. 2009, 47, 3951–3959. [Google Scholar] [CrossRef]
- Touzi, R.; Shimada, M. polarimetric PALSAR Calibration. IEEE Trans. Geosci. Rem. Sens. 2009, 47, 3951–3959. [Google Scholar] [CrossRef]
- Papathanassiou, K.P.; Zandona-Schneider, R. ALOS PALSAR- PolInSAR data analysis: First results. In Proceedings of the Pol-InSAR 2007, Frascatti, Italy, 22–26 January 2007. [Google Scholar]
- Cloude, S. PALSAR- PolInSAR calibration results for Australian test sites polarimetric evaluation. In Proceedings of the ALOS Cal-Val Meeting CVST5, Tokyo, Japan, 19 October 2006. [Google Scholar]
- Touzi, R.; Shimada, M.; Nedelcu, S.; Hawkins, R.K.; Murnagham, K. Calibration of PALSAR polarimetric modes: SAR system model assessment using the Amazonian and Ottawa calibration site data. In Proceedings of the ALOS Cal-Val Meeting CVST5, Tokyo, Japan, 19 October 2006. [Google Scholar]
- Touzi, R.; Shimada, M. Assessment and Calibration of polarimetric PALSAR. In Proceedings of the PolinSAR’09 Workshop Proceedings, Frascatti, Italy, 26–30 January 2009. [Google Scholar]
- Papathanassiou, K.P.; Zandona-Schneider, R. ALOS PALSAR- PolInSAR data analysis: First results. In Proceedings of the ALOS Cal-Val Meeting CVST5, Tokyo, Japan, 19 October 2006. [Google Scholar]
- Touzi, R.; Vachon, P.W.; Wolfe, J. Requirement on antenna isolation for operational use of future C-band SAR Constellations missions in maritime surveillance. IEEE Trans. Geosci. Rem. Sens. Lett. 2010, 7, 861–865. [Google Scholar] [CrossRef]
- Shimada, M.; Itoh, T.; Motooka, T.; Watanabe, M.; Shiraishi, T.; Thapa, R.; Lucas, R. New global forest/non-forest maps from ALOS PALSAR data (2007–2010). Remote. Sens. Environ. 2014, 155, 13–31. [Google Scholar] [CrossRef]
- Rosenqvist, A.; Shimada, M.; Suzuki, S.; Ohgushi, F.; Tadono, T.; Watanabe, M.; Tsuzuku, K.; Watanabe, T.; Kamijo, S.; Aoki, E. Operational performance of the ALOS global systematic acquisition strategy and observation plans for ALOS-2 PALSAR-2. Remote. Sens. Environ. 2014, 155, 3–12. [Google Scholar] [CrossRef]
- Wright, P.; Quegan, S.; Wheadon, N.; Hall, D. Faraday rotation effects on L-band spaceborne SAR data. IEEE Trans. Geosci. Rem. Sens. 2003, 41, 2735–2744. [Google Scholar] [CrossRef]
- Zyl, J.J.V. Calibration of polarimetric radar images using only image parameters and trihedral corner reflectors responses. IEEE Trans. Geosci. Rem. Sens. 1990, 28, 337–348. [Google Scholar]
- Freeman, A.; Zyl, J.J.V.; Klein, J.D.; Zebker, H.A.; Shen, Y. Calibration of Stokes and scattering matrix format polarimetric SAR data. IEEE Trans. Geosci. Rem. Sens. 1992, 30, 531–539. [Google Scholar] [CrossRef]
- Quegan, S.; Rhodes, I. Statistical models for polarimetric data: Consequences, testing and validity. Int. J. Rem. Sens. 1995, 16, 1183–1210. [Google Scholar] [CrossRef]
- Touzi, R.; Livingstone, C.E.; Lafontaine, J.R.C.; Lukowski, T.I. Consideration of antenna gain and phase patterns for calibration of polarimetric SAR data. IEEE Trans. Geosci. Rem. Sens. 1993, 31, 1132–1145. [Google Scholar] [CrossRef]
- Shimada, M. PALSAR-2 initial calibration results. In Proceedings of the ALOS2 Cal-Val Meeting CVST4, Tsukuba, Japan, 20 November 2014. [Google Scholar]
- Zyl, J.J.V.; Zebker, H.A. Imaging Radar Polarimetry. In Progress in Electromagnetics Research, PIER 3; Kong, J.A., Ed.; Elsevier: New York, NY, USA, 1990; Chapter 5. [Google Scholar]
- Shimada, M.; Watanabe, M.; Motooka, T.; Kankaku, Y.; Suzuki, S. Calibration and validation of PALSAR2. In Proceedings of the 2015 International Geoscience and Remote Sensing Symposium (IGARSS’15), Milano, Italy, 26–31 July 2015. [Google Scholar]
- Sano, E.E. CALVAL of ALOS-2 multi-polarized and time series for monitoring deforestation in the Brazilian Amazon. In Proceedings of the ALOS2 Cal-Val Meeting CVST3, Tsukuba, Japan, 25–26 October 2014. [Google Scholar]
- Touzi, R.; Shimada, M. Assessment and Calibration of polarimetric PALSAR-2. In Proceedings of the 2015 International Geoscience and Remote Sensing Symposium (IGARSS’15), Milano, Italy, 26–31 July 2015. [Google Scholar]
- Moriyama, T. Polarimetric calibration of PALSAR2. In Proceedings of the 2015 International Geoscience and Remote Sensing Symposium (IGARSS’15), Milano, Italy, 26–31 July 2015. [Google Scholar]
- Meyer, F.J.; Nicoll, J.B. Prediction, detection and correction of Faraday rotation in full-polarimetric L-band SAR data. IEEE Trans. Geosci. Rem. Sens. 2008, 46, 3076–3086. [Google Scholar] [CrossRef]
- Freeman, A. SIR-C/X data quality and calibration results. IEEE Trans. Geosci. Rem. Sens. 1995, 33, 848–857. [Google Scholar] [CrossRef]
- Sandberg, G.; Eriksson, L.E.B.; Ulander, L.M.H. Measurement of Farady rotation using polarimetric PALSAR images. IEEE Geosci. Rem. Sens. Lett. 2009, 6, 142–146. [Google Scholar] [CrossRef]
- Bickel, S.H.; Bates, R.H. Effects of magneto-ionic on the propagation of the polarization scattering matrix. Proc. IRE 1965, 53, 1089–1091. [Google Scholar] [CrossRef]
- Freeman, A. Calibration of linearly polarized SAR data subject to Faraday rotation. IEEE Trans. Geosci. Rem. Sens. 2004, in press. [Google Scholar] [CrossRef]
- Zebker, H.A.; Lou, Y. Phase calibration of imaging radar polarimeter stokes matrices. IEEE Trans. Geosci. Rem. Sens. 1990, 28, 246–252. [Google Scholar] [CrossRef]
- Touzi, R.; Omari, K.; Sleep, B.; Jiao, X. Scattered and received wave polarization optimization for enhanced peatland classification and fire damage assessment using polarimetric PALSAR. IEEE J. Sel. Top. Appl. Earth Obs. Remote. Sens. 2018, 11, 4452–4477. [Google Scholar] [CrossRef]
- Touzi, R.; Pawley, S.; Hosseini, M.; Jiao, X. Polarimetric L-band PALSAR2 for Discontinuous Permafrost Mapping In Peatland Regions. In Proceedings of the 2015 International Geoscience and Remote Sensing Symposium (IGARSS’19), Yokohama, Japan, 28 July–2 August 2019. [Google Scholar]
- Touzi, R.; Shimada, M.; Motohka, T.; Nedelcu, S. Assessment of ALOS-2 Compact non circularity using the Amazonian rainforests. IEEE Trans. Geosci. Rem. Sens. 2020, 58, 7472–7482. [Google Scholar] [CrossRef]
Publisher’s Note: MDPI stays neutral with regard to jurisdictional claims in published maps and institutional affiliations. |
© 2022 by the authors. Licensee MDPI, Basel, Switzerland. This article is an open access article distributed under the terms and conditions of the Creative Commons Attribution (CC BY) license (https://creativecommons.org/licenses/by/4.0/).