Article

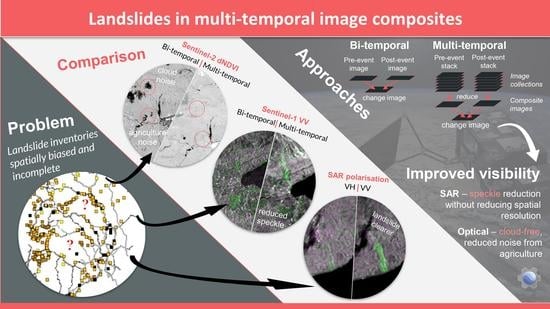
Multi-Temporal Satellite Image Composites in Google Earth Engine for Improved Landslide Visibility: A Case Study of a Glacial Landscape

1
Department of Civil and Environmental Engineering, Norwegian University of Science and Technology (NTNU), 7491 Trondheim, Norway
2
Norwegian Geotechnical Institute (NGI), 0806 Oslo, Norway
3
Department Environmental Sciences, Western Norway University of Applied Sciences (HVL), 5063 Bergen, Norway
4
Machine Intelligence and Slope Stability Laboratory, Department of Geosciences, University of Padova, 35129 Padua, Italy
5
Geohazard and Earth Observation, Norwegian Geological Survey (NGU), 7040 Trondheim, Norway
6
Department of Arctic Geology, University Centre of Svalbard (UNIS), 9171 Longyearbyen, Norway
*
Author to whom correspondence should be addressed.
Remote Sens. 2022, 14(10), 2301; https://doi.org/10.3390/rs14102301
Submission received: 25 March 2022 / Revised: 29 April 2022 / Accepted: 2 May 2022 / Published: 10 May 2022
(This article belongs to the Special Issue Remote Sensing Analysis of Geologic Hazards)

Abstract

:
Regional early warning systems for landslides rely on historic data to forecast future events and to verify and improve alarms. However, databases of landslide events are often spatially biased towards roads or other infrastructure, with few reported in remote areas. In this study, we demonstrate how Google Earth Engine can be used to create multi-temporal change detection image composites with freely available Sentinel-1 and -2 satellite images, in order to improve landslide visibility and facilitate landslide detection. First, multispectral Sentinel-2 images were used to map landslides triggered by a summer rainstorm in Jølster (Norway), based on changes in the normalised difference vegetation index (NDVI) between pre- and post-event images. Pre- and post-event multi-temporal images were then created by reducing across all available images within one month before and after the landslide events, from which final change detection image composites were produced. We used the mean of backscatter intensity in co- (VV) and cross-polarisations (VH) for Sentinel-1 synthetic aperture radar (SAR) data and maximum NDVI for Sentinel-2. The NDVI-based mapping increased the number of registered events from 14 to 120, while spatial bias was decreased, from 100% of events located within 500 m of a road to 30% close to roads in the new inventory. Of the 120 landslides, 43% were also detectable in the multi-temporal SAR image composite in VV polarisation, while only the east-facing landslides were clearly visible in VH. Noise, from clouds and agriculture in Sentinel-2, and speckle in Sentinel-1, was reduced using the multi-temporal composite approaches, improving landslide visibility without compromising spatial resolution. Our results indicate that manual or automated landslide detection could be significantly improved with multi-temporal image composites using freely available earth observation images and Google Earth Engine, with valuable potential for improving spatial bias in landslide inventories. Using the multi-temporal satellite image composites, we observed significant improvements in landslide visibility in Jølster, compared with conventional bi-temporal change detection methods, and applied this for the first time using VV-polarised SAR data. The GEE scripts allow this procedure to be quickly repeated in new areas, which can be helpful for reducing spatial bias in landslide databases.

Graphical Abstract

1. Introduction

The frequency and intensity of severe precipitation events are expected to continue increasing as a result of climate change [1,2]. In turn, precipitation-triggered disasters, including landslides and floods, are also becoming more frequent [3]. Landslide early warning systems (LEWSs) aim to reduce loss of life and damage, by giving people advanced warning so that emergency responders may prepare resources and warn the public to avoid high-risk areas [4]. Existing LEWSs rely on knowledge of past events in order to improve the understanding of landslide triggering processes, develop warning thresholds and prediction models, and finally verify warnings issued and evaluate performance [5]. Landslide inventory data are also needed to produce landslide susceptibility and hazard maps used for spatial planning, and emergency responders need detailed information to assess damages and save lives [6].
However, for operators of LEWSs, collecting landslide data and verifying warnings is a difficult and tedious task [7]. Generally, the registration of events and preparation of landslide inventories are not performed systematically [8]. Presently, single-landslide event data are collected mainly from ground observations, including reports from road and rail authorities, and to a lesser degree from the public, or mined from social media and news reports [9,10]. For triggering events (e.g., extreme precipitation or earthquake) with multiple resulting landslides, mapping using aerial or satellite optical images may be undertaken on a case-by-case basis, depending on motivation and resources [11,12,13]. Such mapping is most commonly limited to areas that are already known to have been affected by landslides (e.g., [14,15,16]), or to verify the exact location of landslides that may have been reported without precise coordinates, for example, in media reports [17]. Systematic mapping is generally not yet carried out over large areas or to identify previously unknown landslides in remote areas.
The resulting landslide databases, however, tend to show clusters of observations around linear infrastructure and populated areas, thus not giving a realistic representation of the true spatial distribution of landslides, as can be seen in Figure 1. Additionally, landslide inventories tend to be rather incomplete. For example, in Europe, a comparison between landslide density based on landslide records from the Geological Surveys of Europe and the European landslide susceptibility map (ELSUS 1000 v1) reveals that only three countries (Poland, Italy, and Slovakia) have inventories considered to be over 50% complete [18]. These issues with spatial bias and missing data limit how the landslide data can be used for predictive models [19].
Using earth observation images (EO images) to detect unknown single landslide events is akin to finding a needle in a haystack. Hence, such surveys tend to focus on mapping landslides within areas that are known to have multiple landslides, due to a specific triggering event [20]. However, the ongoing and rapid developments in the fields of computer vision and cloud computing, as well as in the quality, range, and availability of EO images, mean that continuous, automated landslide monitoring may soon be feasible. Today, deep-learning models enable machines to accomplish image recognition tasks that were not possible a few years ago. Such a system is being developed for monitoring changes in forests and land cover (e.g., Global Forest [21], and Continuous Change Detection and Classification (CCDC) of land cover [22]). These operate at a global scale, using 30 m resolution Landsat images and the processing power of Google Earth Engine (GEE). Globally trained (also known as generalised) models for detecting landslides from EO images have begun to emerge recently [23,24], building on the results of locally trained models (e.g., [25,26]). These are not yet capable of outperforming humans in the tasks of landslide detection or mapping, and preliminary trials have found that they did not perform well in a glacial landscape [27]. With the exception of two landslides occurring in Fiordland, New Zealand [24], the globally trained models for landslide detection mentioned above have not, for the most part, included events from fjord landscapes. Based on the progress being made in other image recognition tasks, with additional training data and development, there appears to be good potential for computers to outperform humans in these tasks in the near future.
While research continues on fine-tuning machine-learning model architectures and classifiers, other options for improving landslide detectability using EO data are immediately available. Google Earth Engine (GEE) is a cloud-based platform, designed to simplify geospatial analyses, by improving the process of accessing and processing data. With a free researcher account, GEE provides instant access to 37 years of satellite images, with a plethora of publicly available geospatial datasets, including optical image collections (e.g., MODIS, Landsat, and Sentinel-2), synthetic aperture radar (SAR) data from Sentinel-1, land cover classifications, and precipitation data, to name a few. Analysis of large areas while detecting changes over time can be performed very efficiently, using Google’s cloud infrastructure [28].
Several researchers have begun to use GEE for improving landslide detection. HazMapper is a GEE app designed to facilitate the mapping of natural hazard events [29]. For landslides, images showing the relative difference in the normalised difference vegetation index (rdNDVI) calculated from cloud-free composites using Sentinel-2 or Landsat images can be used to map landslides for an event of interest (e.g., earthquake, or extreme precipitation event) [29]. SAR data can also be used for landslide detection [30]. SAR data have an advantage over optical images for rapid landslide detection, as the sensor is cloud-penetrating and measures the earth’s surface independently of lighting conditions. However, it is rather underutilised due to the level of expertise needed to pre-process SAR data [31] and generally lower visibility of landslides. GEE opens doors for more widespread exploration of SAR data, as the Sentinel-1 GRD image collection has already accomplished much of the pre-processing [32]. A method for landslide detection using SAR data on GEE has been proposed by [31] using VH-polarised Sentinel-1 data to detect changes in radar backscatter that could be associated with landslides.
One aspect that both these methods have in common is the use of multi-temporal image stacks from pre- and post-events that are used to create difference images, from which landslides can be identified (Figure 2). Outside of GEE, such analysis would generally require downloading, storing, and locally processing vast quantities of data that could easily exceed the storage capacity of a personal computer (e.g., [33]). Hence, most change detection methods for landslide detection have used a single set of pre- and post-event images to make a difference image [34]. The advantage of multi-temporal images for change detection is that they reduce noise, compared with bi-temporal images, thus allowing for clearer visualisation of changes on the earth’s surface. For optical images, the greenest-pixel method accomplishes this by selecting the maximum value NDVI pixel within the stack to produce an aggregate image. This effectively removes cloudy pixels and smoothens over temporarily reduced NDVI signals from agricultural activity. In comparison, for SAR images, speckle noise is reduced by aggregating across multi-temporal stacks. This is achieved without loss of spatial resolution, as occurs in the more common practice of speckle filtering across spatially neighbouring pixels from a single date image [35].
The main objective of this study was to investigate how multi-temporal image-composite approaches can be used to improve landslide visibility in change detection images, thereby improving spatial bias and completeness of landslide databases. As part of this study, a landslide inventory for Jølster was created from Sentinel-2 images, then verified with fieldwork, drone images, and helicopter observations. Then, we explored the difference in landslide visibility between bi-temporal and multi-temporal change detection approaches, with Sentinel-1 images with VV- and VH-polarised data, and with NDVI in Sentinel-2 images. We also aimed to improve knowledge of how these approaches perform in a glacial landscape, considering the role of local vegetation. We used the Jølster case study as an example of a multiple landslide event occurring in a glacially formed landscape, at a northern latitude.
The main questions involved are as follows:
  • To what extent can spatial bias in the NLDB be improved using EO images and change detection approaches to detect landslides?
  • How can multi-temporal, image-composite change detection approaches using GEE improve landslide visibility, compared with bi-temporal change detection approaches?
  • In which data types (S2-NDVI, S1-VV, S1-VH) are the landslides most visible?
This study focused on the performance of manual approaches. Results of tests of the globally trained landslide detection models for the Jølster case study will be presented in a separate paper [27]. The term landslide is applied generally throughout, to refer to rapid landslides that occur in soil, i.e., debris flows and debris avalanches. However, the techniques discussed could potentially also be used for deeper landslides occurring due to bedrock failure, so long as there is a removal of surface vegetation. Details on triggers, landslide classification, and failure mechanisms in Jølster are available in [36].

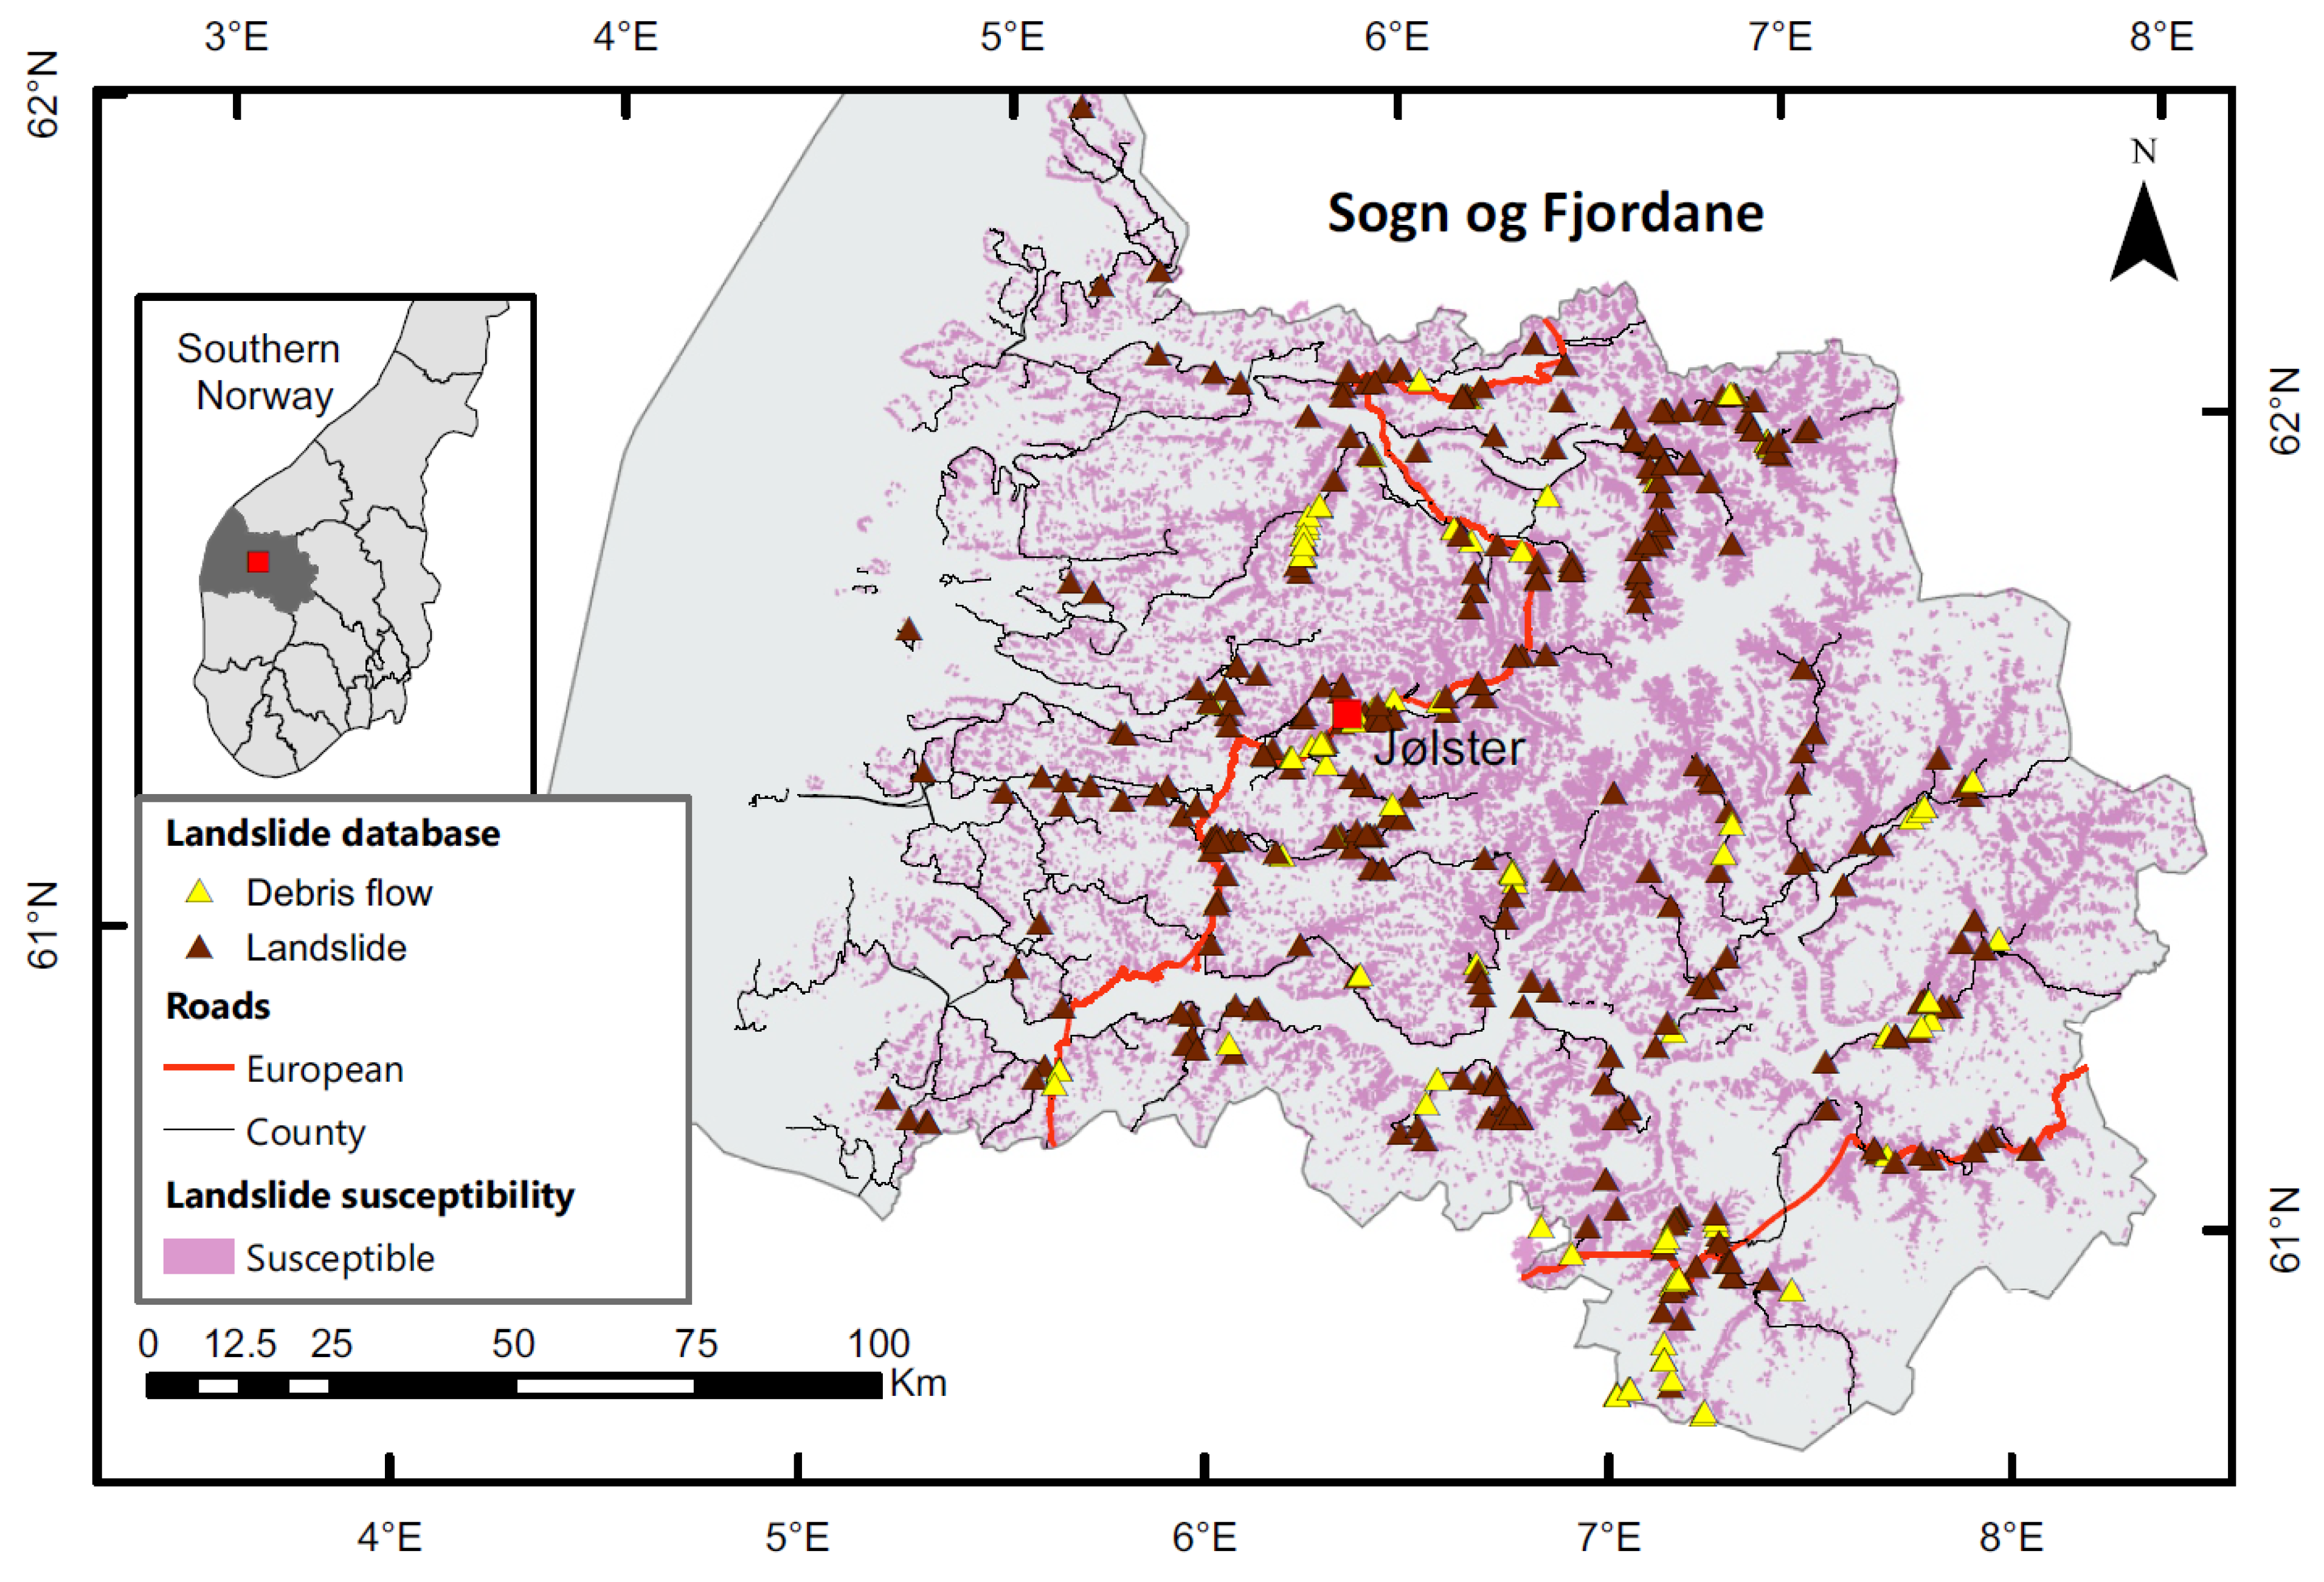
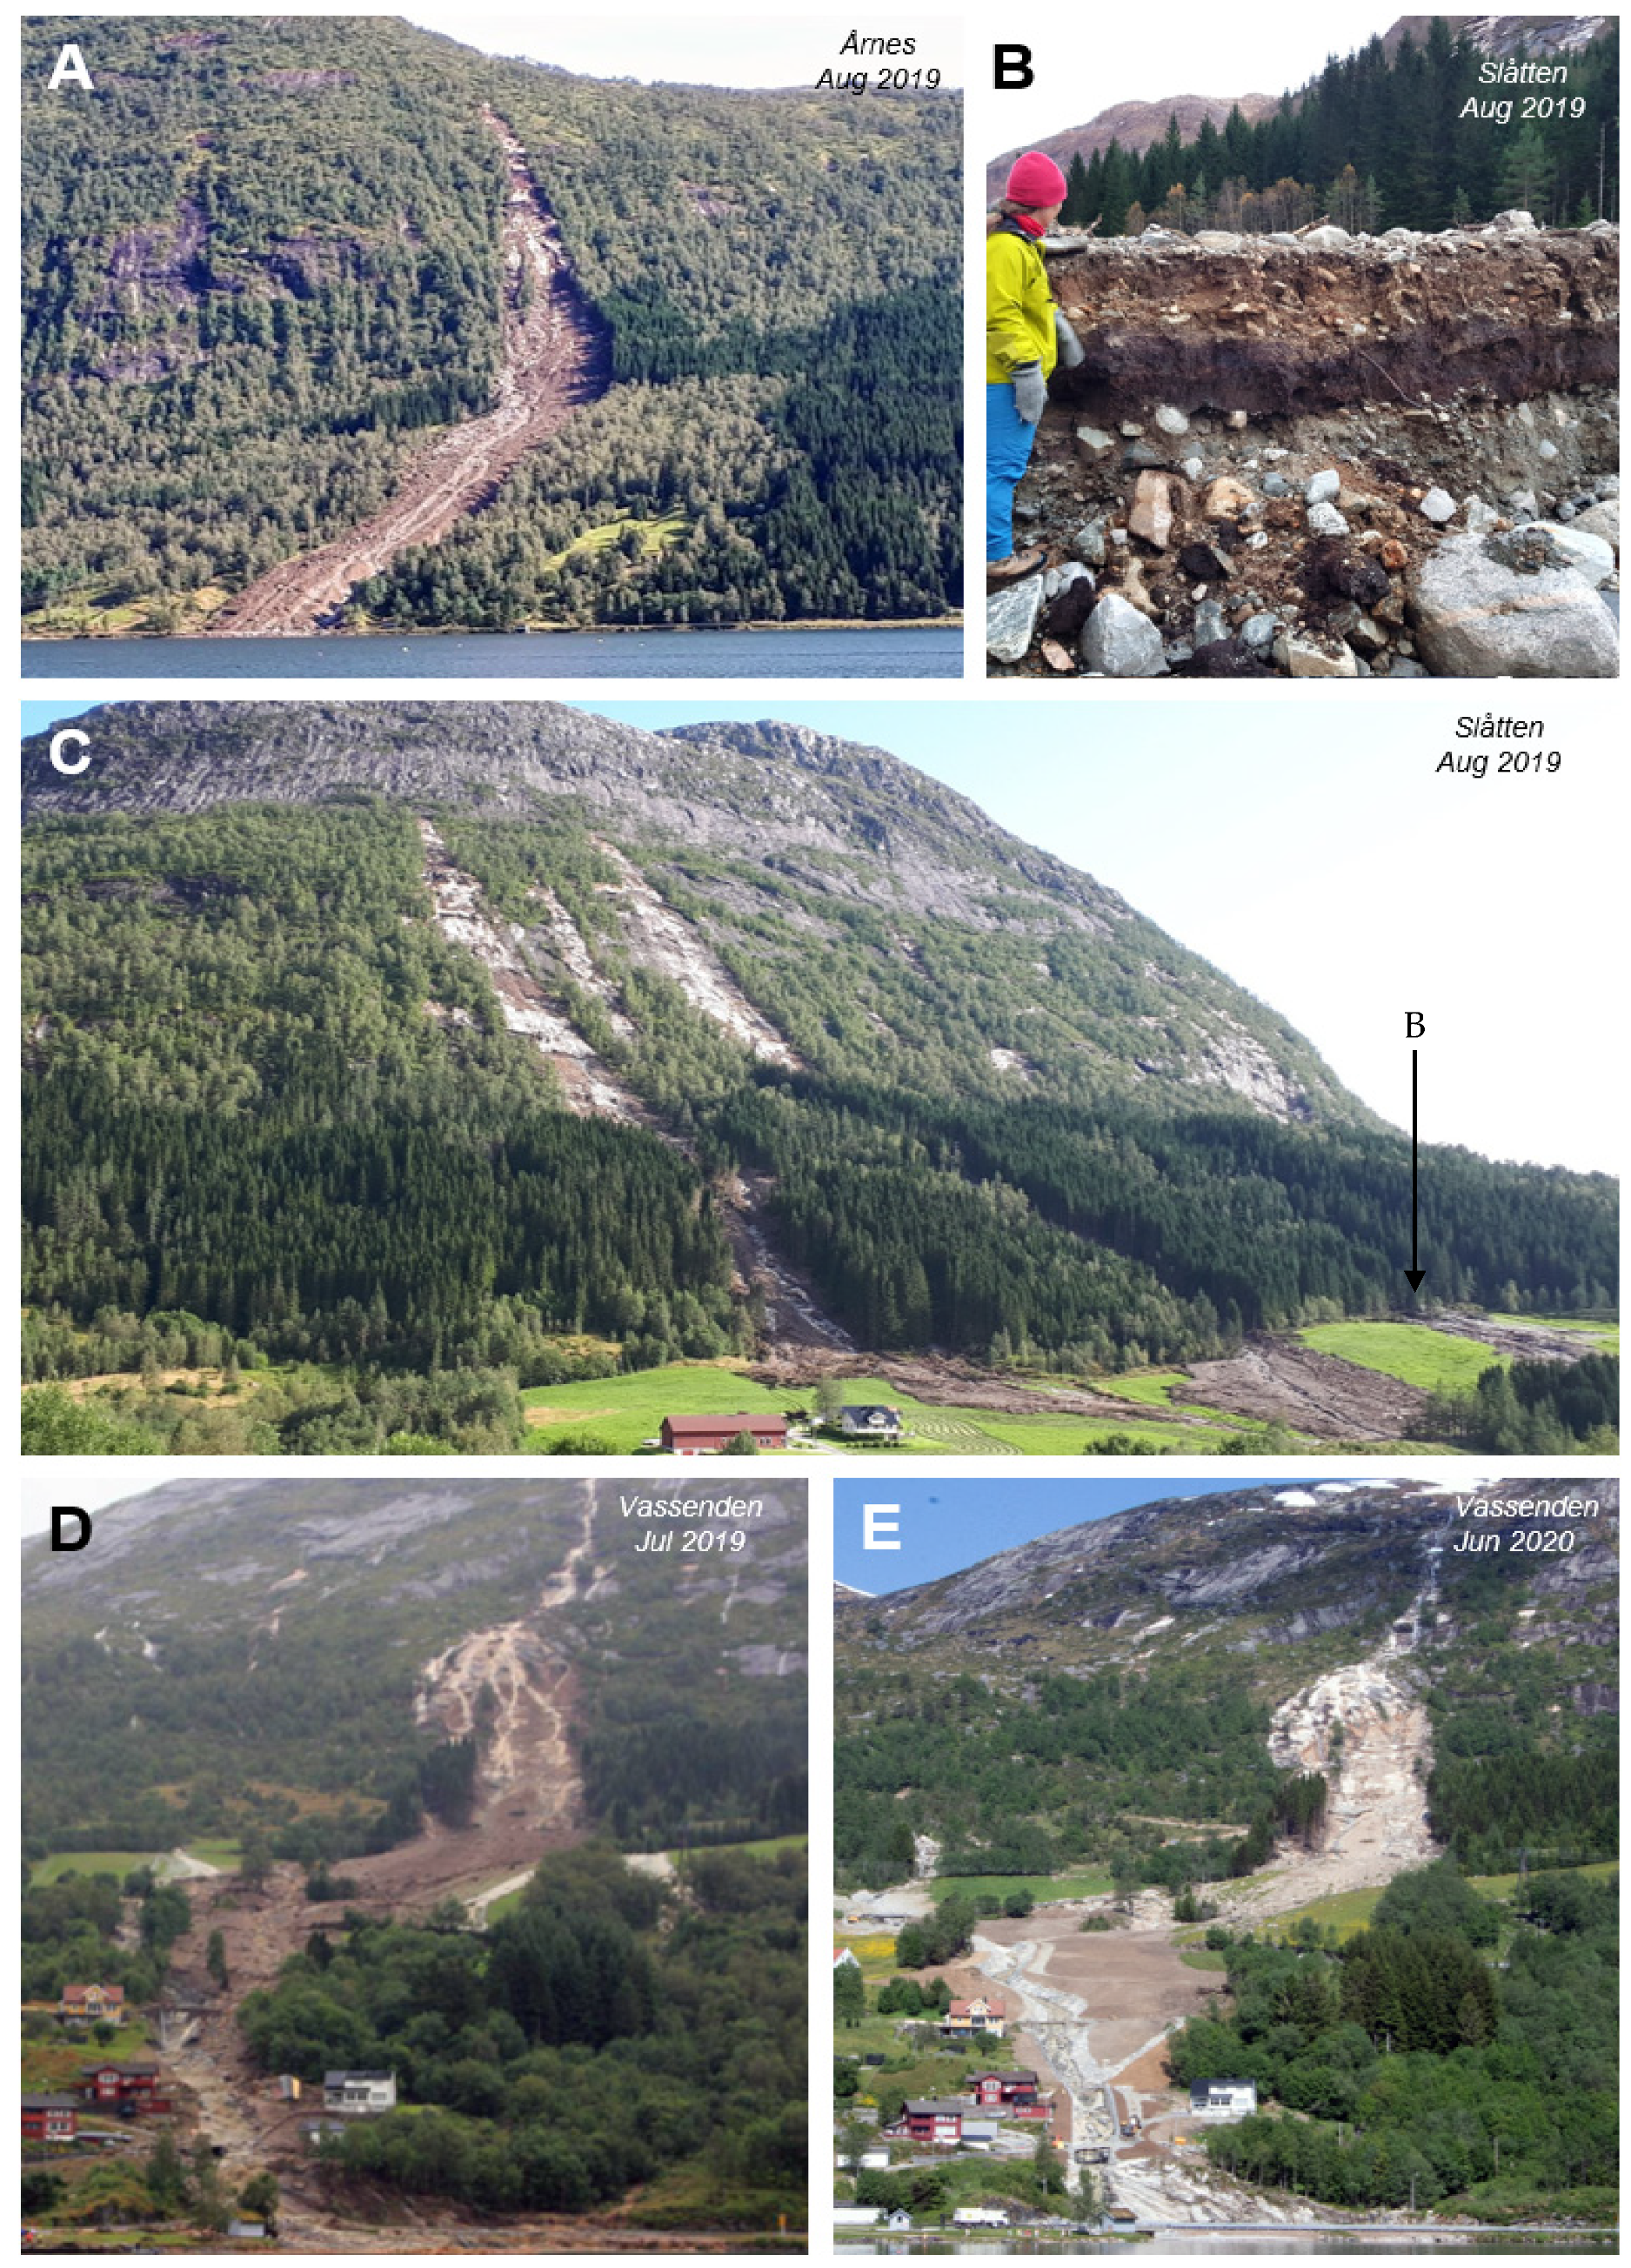
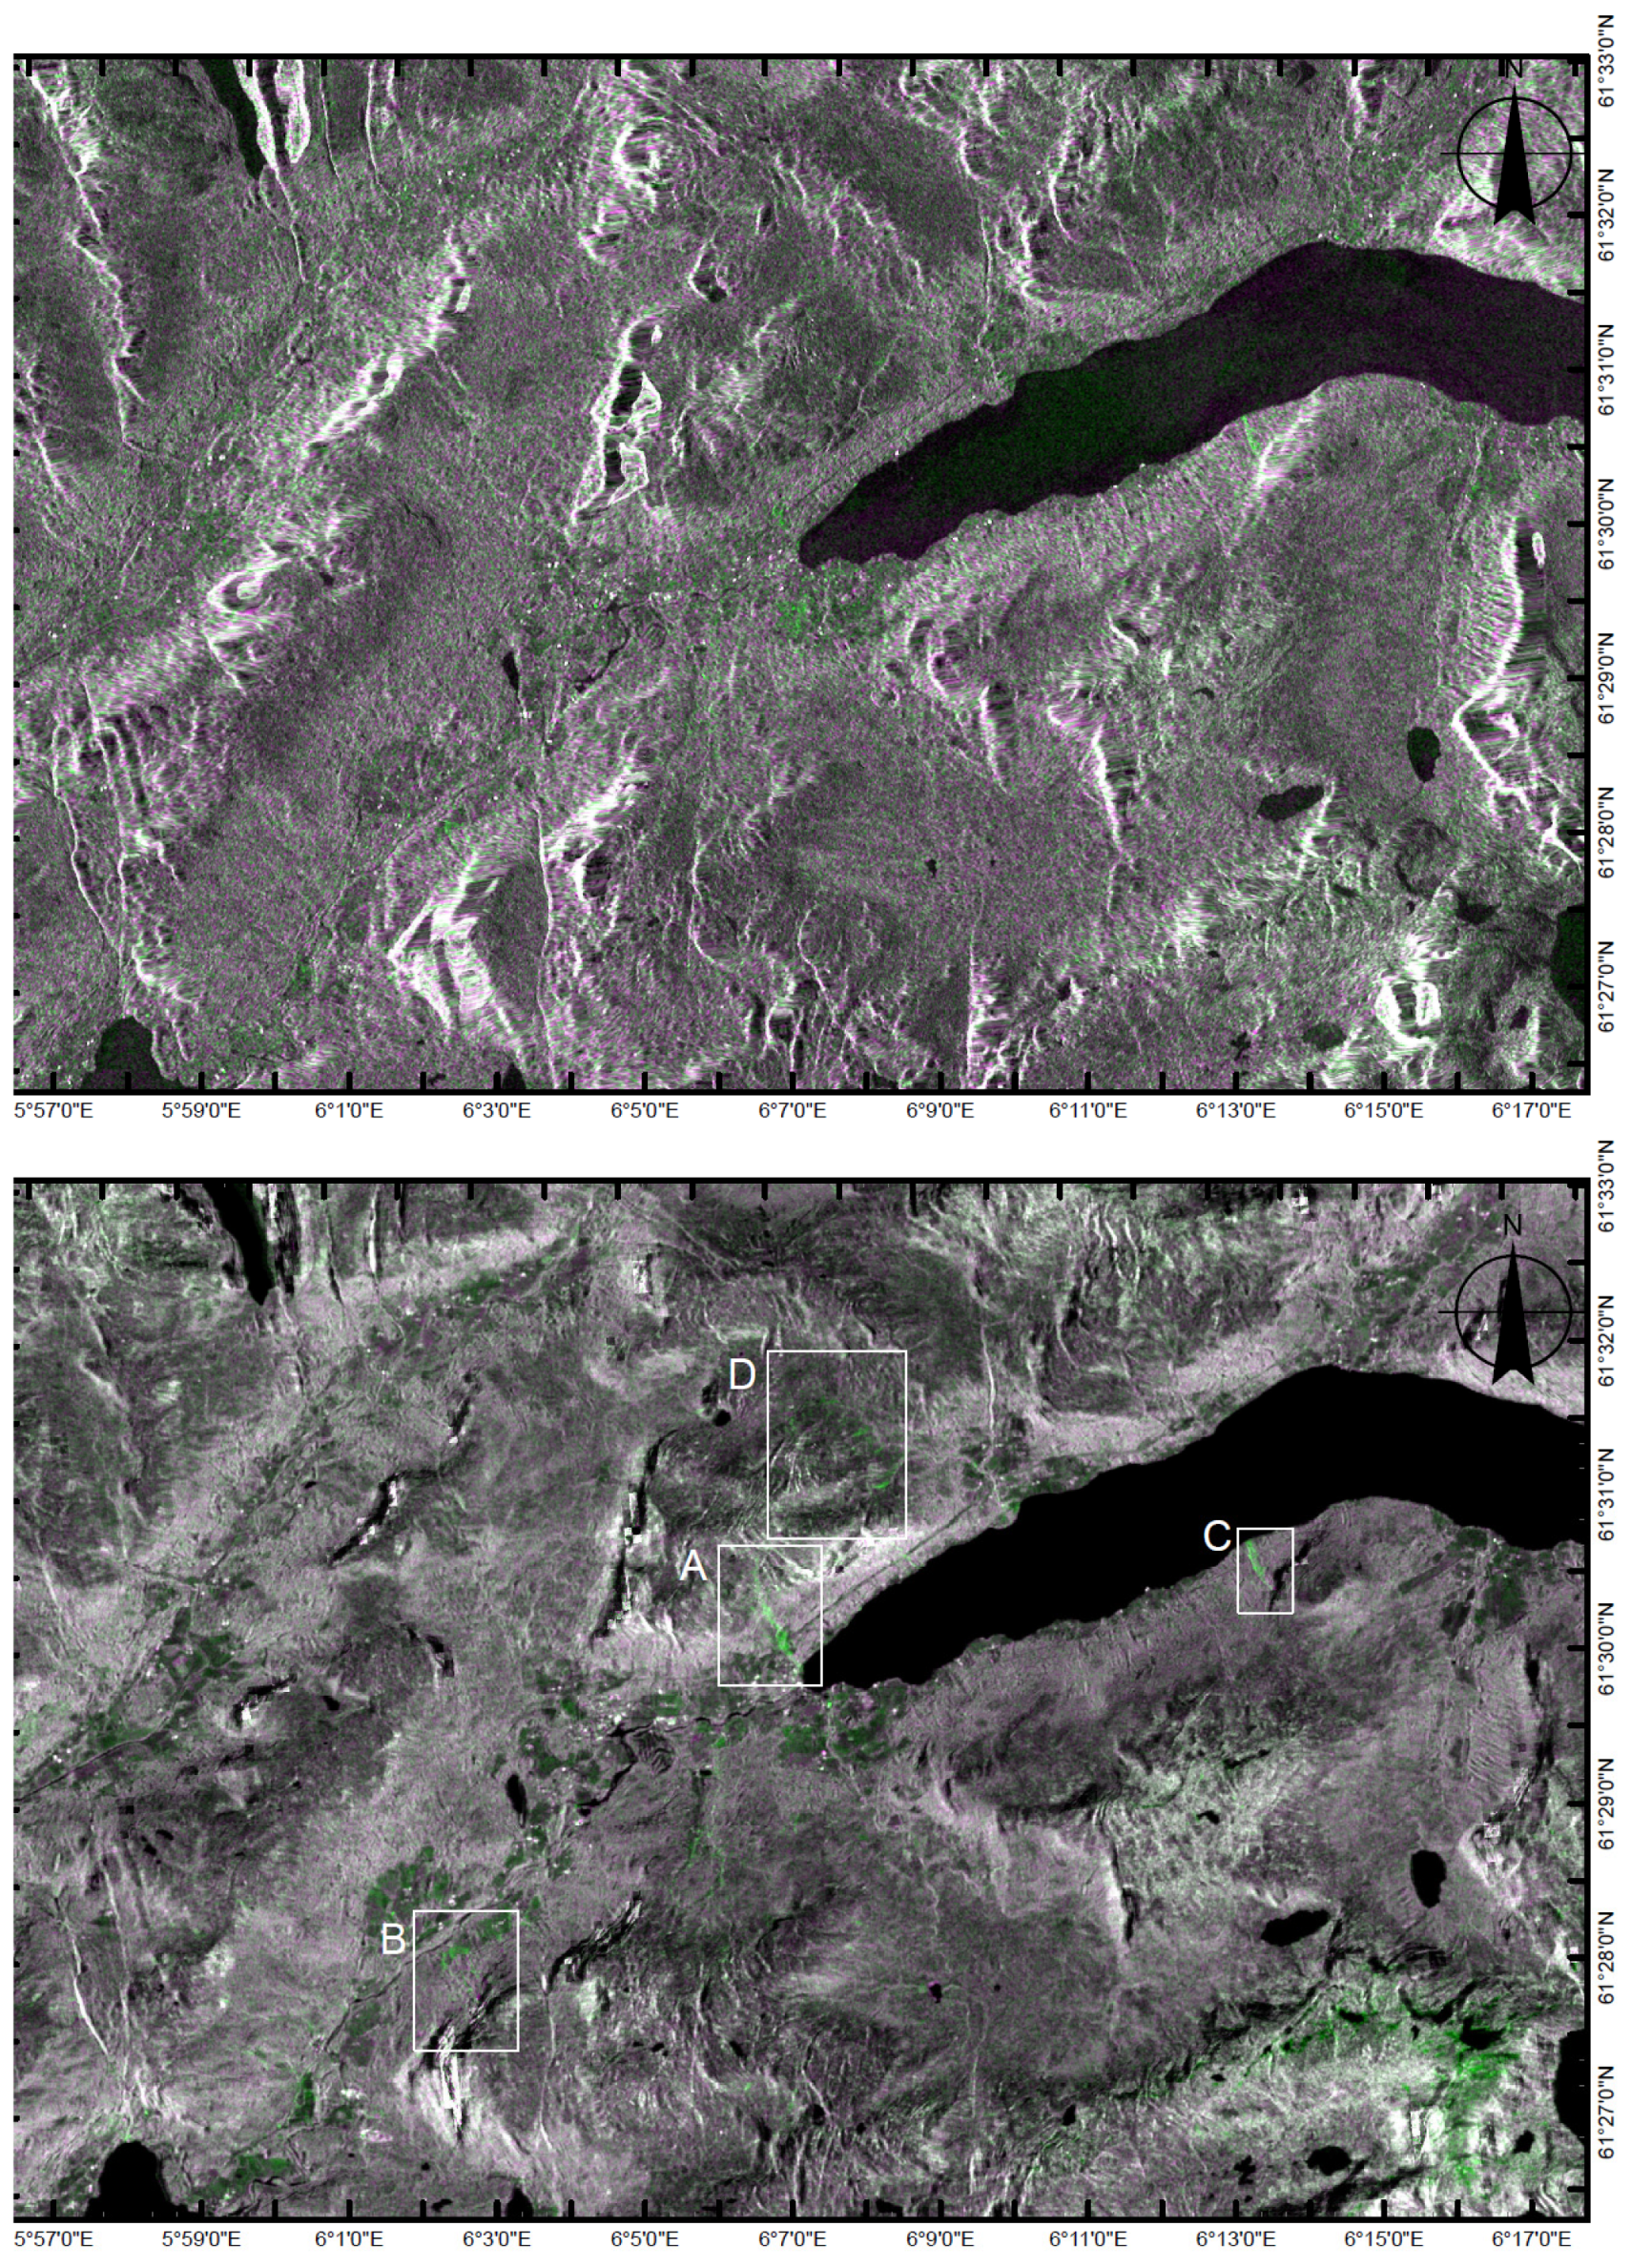
2. Case Study: Jølster Rainstorm Event on 30 July 2019, Western Norway

On 30 July 2019, the town of Vassenden, west of Lake Jølster, in western Norway, was hit by a heavy summer rainstorm. The maximum recorded rainfall of the event was 113 mm in 24 h, exceeding the 200-year event magnitude at the two nearest precipitation weather stations, Botnen and Haukedalen [37]. This resulted in numerous landslides and floods, causing severe impacts on infrastructure, damage to private property, and one fatality (Figure 3 and Figure 4). The majority of landslides occurred on open slopes, initiating as debris avalanches [36]. Some of these developed downslope into channelised or partially channelised debris flows, including the large landslide in Vassenden, shown in Figure 3D,E.
Over 150 people were evacuated from the area, and Highway E39—the main transport route between the capital city Oslo and the city of Bergen—was closed in six places due to flooding and debris. Works to remove debris and secure the area following this event cost 17 million kroner (ca. 1.65 million euro) [38].
The study area shown in Figure 5 extends 22 km W–E from Førde to Årnes and 18 km N–S. The landscape consists of steep glacial valleys, lakes, and mountains over 1500 m.a.s.l. The bedrock geology in the area is predominantly relatively competent Precambrian basement orthogneiss, affected locally by the Caledonian orogeny (400 Ma). Geomorphologically, the study area is strongly altered by the glacial history of the region. The Scandes mountain range is composed of very varying bedrock types but in all areas has been subjected to repeated hard physical erosion by ice sheets, stripping almost all sediments (including weathering residuals) from the bedrock. At the last glacial maximum, ice sheets reached over 1800 m a.s.l. [39]. The area was likely deglaciated around 12-11 ka [40], with much of the moraine in the region formed during this period, although there may have been a remnant ice sheet in the valley for some time after.
The landscape consists of U-shaped valleys with flat, angled, polished bedrock surfaces that are favourable for the formation of sliding planes. Other signatures of the strong linear, glacial erosion in competent rock are visible in the area, including roche moutonnée, crag, and tail features. These types of bedrock features are exposed in the upper half of the Jølster landscape. A few remnant small-scale brittle faults are visible in the landscape [41]. Most of the study area has a surface cover of glacial moraine sediments [42]. The moraine is often highly consolidated on slopes overlying the bedrock. At high altitudes in the mountains, small pockets of moraine can be found within depressions in the exposed bare bedrock. A loose veneer of colluvium extends downslope on the valley sides, increasing to several metres thick at the valley bottom.
Buried hummus layers show evidence of previous landslides, seen in the stratigraphy exposed by a debris flow at Slåtten (Figure 3B). There are at least 40 historical landslide events registered as points in the Norwegian national landslide database (NLDB, at www.skredregistering.no, accessed on 18 January 2022, hence referred to as registered events) in the study area, and several instances of rock falls. Registered events are dated from 1625 to 2019. The majority of the registered events in the NLDB are derived from observations along the road network.
The modern climate of the study area is temperate, with relatively mild winters and wet summers due to the proximity to the coast. Glaciers are still active in the region, with Jostedalsbreen National Park, located 30 km east of the study area. Vegetation in the study area ranges from sparse moss and shrubs or light birch forest at high elevations, to spruce forest and agricultural fields lower in the valleys. Roads and built areas are mainly located in the flatter main valleys.

3. Data Used

The main input data were satellite images from Sentinel-1 and -2 missions of the European Space Agency (ESA), acquired either by downloading from Copernicus Open Access Hub (COAH, https://scihub.copernicus.eu/dhus/#/home, accessed 10 August 2019) or used directly within the GEE code editor (https://code.earthengine.google.com/, accessed 10 August 2019). Sentinel-1 SAR data are dual-polarised (VV and VH), with C-band (5.405 GHz), and available in Level 1 single-look complex (SLC) or ground-range-detected (GRD) scenes. We used data acquired in interferometric wide (IW) acquisition mode. Terrain corrections were applied using a 10 m resolution digital terrain model (DTM), downloaded from Høydedata, as shown in Table 1. For Sentinel-2, we used the Level 2A product, bottom of atmosphere (BOA) reflectance images, pre-processed from Level 1C products using sen2cor. In addition, historic landslide data from the NLDB and road data were used in the analysis of spatial bias, with source details shown in Table 1.

4. Methods

This section describes the approaches used to produce change detection images for the Jølster case study, from which new landslides were manually mapped or detected. These are summarised in Table 2. Broadly, these are split according to the following features:
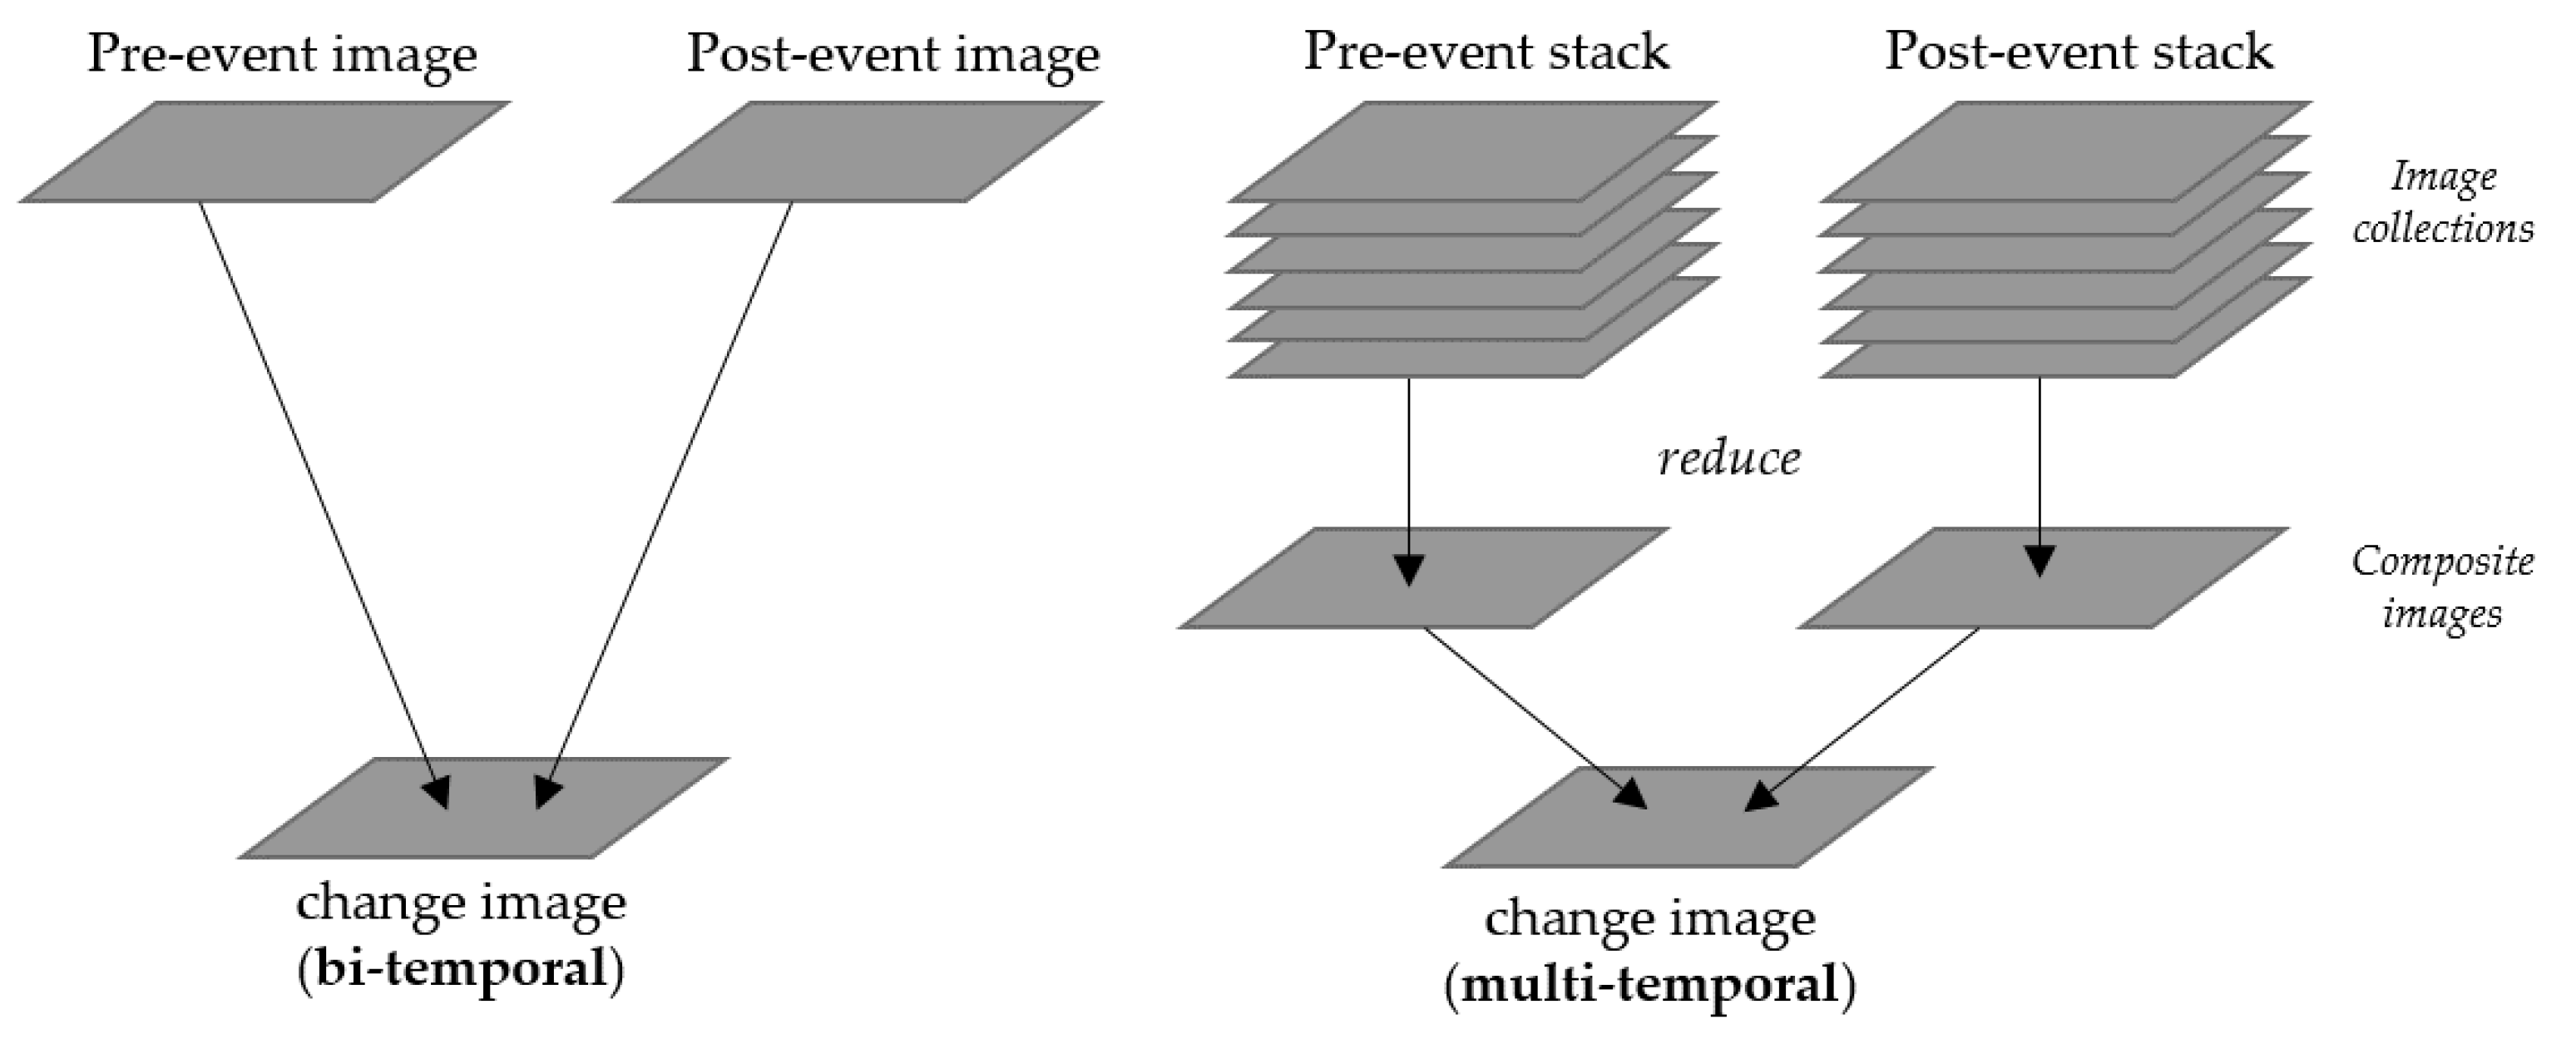
  • Technique: bi-temporal or multi-temporal (Figure 2);
  • Input data: Sentinel-1 SAR backscatter intensity values using either cross (VH) or co-polarised (VV) data, or Sentinel-2 optical data using NDVI values.
Bi-temporal approaches refer to change detection images produced by subtracting a single pre-event image from a single post-event image. By contrast, multi-temporal methods refer to change detection images produced in Google Earth Engine, using one month of images from before and after the events, composited into a single set of pre-and post-event images, prior to the difference being calculated.
In order to avoid introducing noise from the seasonal effects occurring in September, we used a relatively short time period to filter images. One month of images was deemed appropriate for our case study, due to the following reasons:
  • There was a relatively high frequency of image acquisition at a northern latitude location;
  • The optical images were not all cloud-covered in this period;
  • With the coming of fall, the conditions changed significantly between August and September in the study area, including more shadows on north-facing slopes and a reduction in green vegetation at high altitudes.
For repeating this study in other locations, a longer time period could be used, for instance, when there is persistent cloud cover or lower frequency of image acquisition, so long as the vegetation and lighting conditions do not vary significantly.

4.1. Methods for Producing the Change Detection Images

4.1.1. Sentinel-2 bi-Temporal (S2-BT) Image

Level 2A tiles from the closest dates before and after 30 July 2019, with less than 50% cloud cover, were downloaded from COAH. The acquisition window between the pre- and post-event tiles used for the dNDVI map was five days (28 July and 2 August), with cloud covers of 0.64% and 27.19%, respectively. The difference images were produced using SNAP 7.0 software as follows: first, the pre- and post-event images were cropped to the area of interest using a spatial subset. These image pixels were then aligned using the collocation raster tool. Finally, the band math tool was used to calculate the dNDVI using the following equation:
dNDVI = B 8 RM B 4 R B 8 R + B 4 R B 8 S B 4 S B 8 S + B 4 S
where B8 is the near-infrared band, B4 is the red band, and the subsets R and S correspond to reference (post-event) and secondary (pre-event). The result is a raster with values from –2 to 2, where negative values show a loss of vegetation. The results are displayed as a single-band, black-and-white image. For display purposes, the colour scale was stretched across a range including 90% of the values [−0.6, 0.1].

4.1.2. Sentinel-2 Multi-temporal (S2-MT) Image

In GEE, first, separate pre- and post-event image collections were produced by filtering the entire Sentinel-2 level 2A collection, by location and date. Next NDVI bands were added to all images in the filtered collection. Then, ‘greenest-pixel’ pre- and post-event composite images were created by taking the maximum NDVI value for each pixel, within the image collection, using the quality mosaic function. Finally, a difference image (dNDVI) was produced by subtracting the pre-event composite from the post-event composite.

4.1.3. Sentinel-1 bi-Temporal (S1-BT)

Pre- and post-event scenes were downloaded from COAH. The selected scenes were acquired in interferometric wide (IW) acquisition mode, with Level 1 single-look complex (SLC) format, dual polarisation (VV and VH), and from ascending paths. The pre-event scene was from 25 July 2019, i.e., five days before the event, while the post-event scenes were from 31 July, 6 August, and 12 August, respectively, i.e., 1, 7, and 13 days after the onset of the event (cf. Table 1 for scene IDs). Three composite images were produced with the different post-event images using the steps outlined below. The downloaded SLC products were in slant-range geometry and geocoded prior to further analysis. Pre-processing steps included orbit-state vector refinement and atmospheric noise removal. Then, the scenes were multi-looked to suppress speckle noise and geocoded using a 10 m resolution digital terrain model (DTM). The final images were radar backscatter images, with a spatial ground resolution of approximately 10 m × 10 m, stored in GeoTIFF format. In order to facilitate the visual interpretation of the imagery, we applied multi-temporal change detection using enriched colour composites, which display changes in backscatter as red–green–blue (RGB) composites, following an approach developed for snow-avalanche detection [43,44]. These RGB composites include the pre-event scene in red and blue bands, and the post-event scene (with landslide activity) in the green band: (R, G, B) = (pre, post, pre). Finally, the composite was stretched from its full dynamic range [−35, 10] dB to [−25, 5] dB in order to enhance the dominant intensity ranges. The best of the three composite images was selected for further analyses, and the remaining two were discarded.

4.1.4. Sentinel-1 Multi-temporal (S1-MT)

Using GEE, Sentinel-1 GRD scenes were used. These are available as pre-processed images, in which steps such as calibration and ortho-correction have already been performed using the Sentinel-1 Toolbox [32]. Again, two separate image collections, one pre-event and one post-event, were created by filtering the entire Sentinel-1 collection by location, date, polarisation (VV, and VH), satellite acquisition geometry (the mean of ascending and descending images were calculated separately, then combined into a single image using a median) and acquisition mode (IW). Next, a topographic correction function [45] was applied to all images within the collections, using a 10 m resolution digital terrain model (DTM) that was uploaded as a GEE asset (details Table 1). Then, the two image collections were reduced to two single mean images. Finally, RGB composites were created for each of the VV, and VH polarisations, with the pre-event image in the red and green channels, and the post-event image in the blue channel. For visualisation, the S1-MT image was displayed with a stretch range of [−21, 0.5], with a gamma value of 0.65.

4.2. Analyses of the Different Approaches

4.2.1. Preliminary Landslide Mapping S2-BT and Spatial Bias Analysis

Preliminary landslide mapping was conducted using the conventional S2-BT approach. This was completed within a week of the landslide occurrences and took approximately three hours. Polygons delimiting assumed landslides, typically represented by dark elongated clusters of pixels, were drawn manually in SNAP. In analysing spatial bias, a comparison was made of the minimum distance between landslides and roads, between the S2-BT landslide inventory, and the landslides reported in the national database, RegObs. The Vbase roads dataset was used. The minimum distance was estimated using the Near (analysis toolbox) tool in ArcMap, using the reported landslide points from RegObs, and points generated from the centre of the mapped landslide polygons using the Feature-to-Point (data management toolbox) tool.

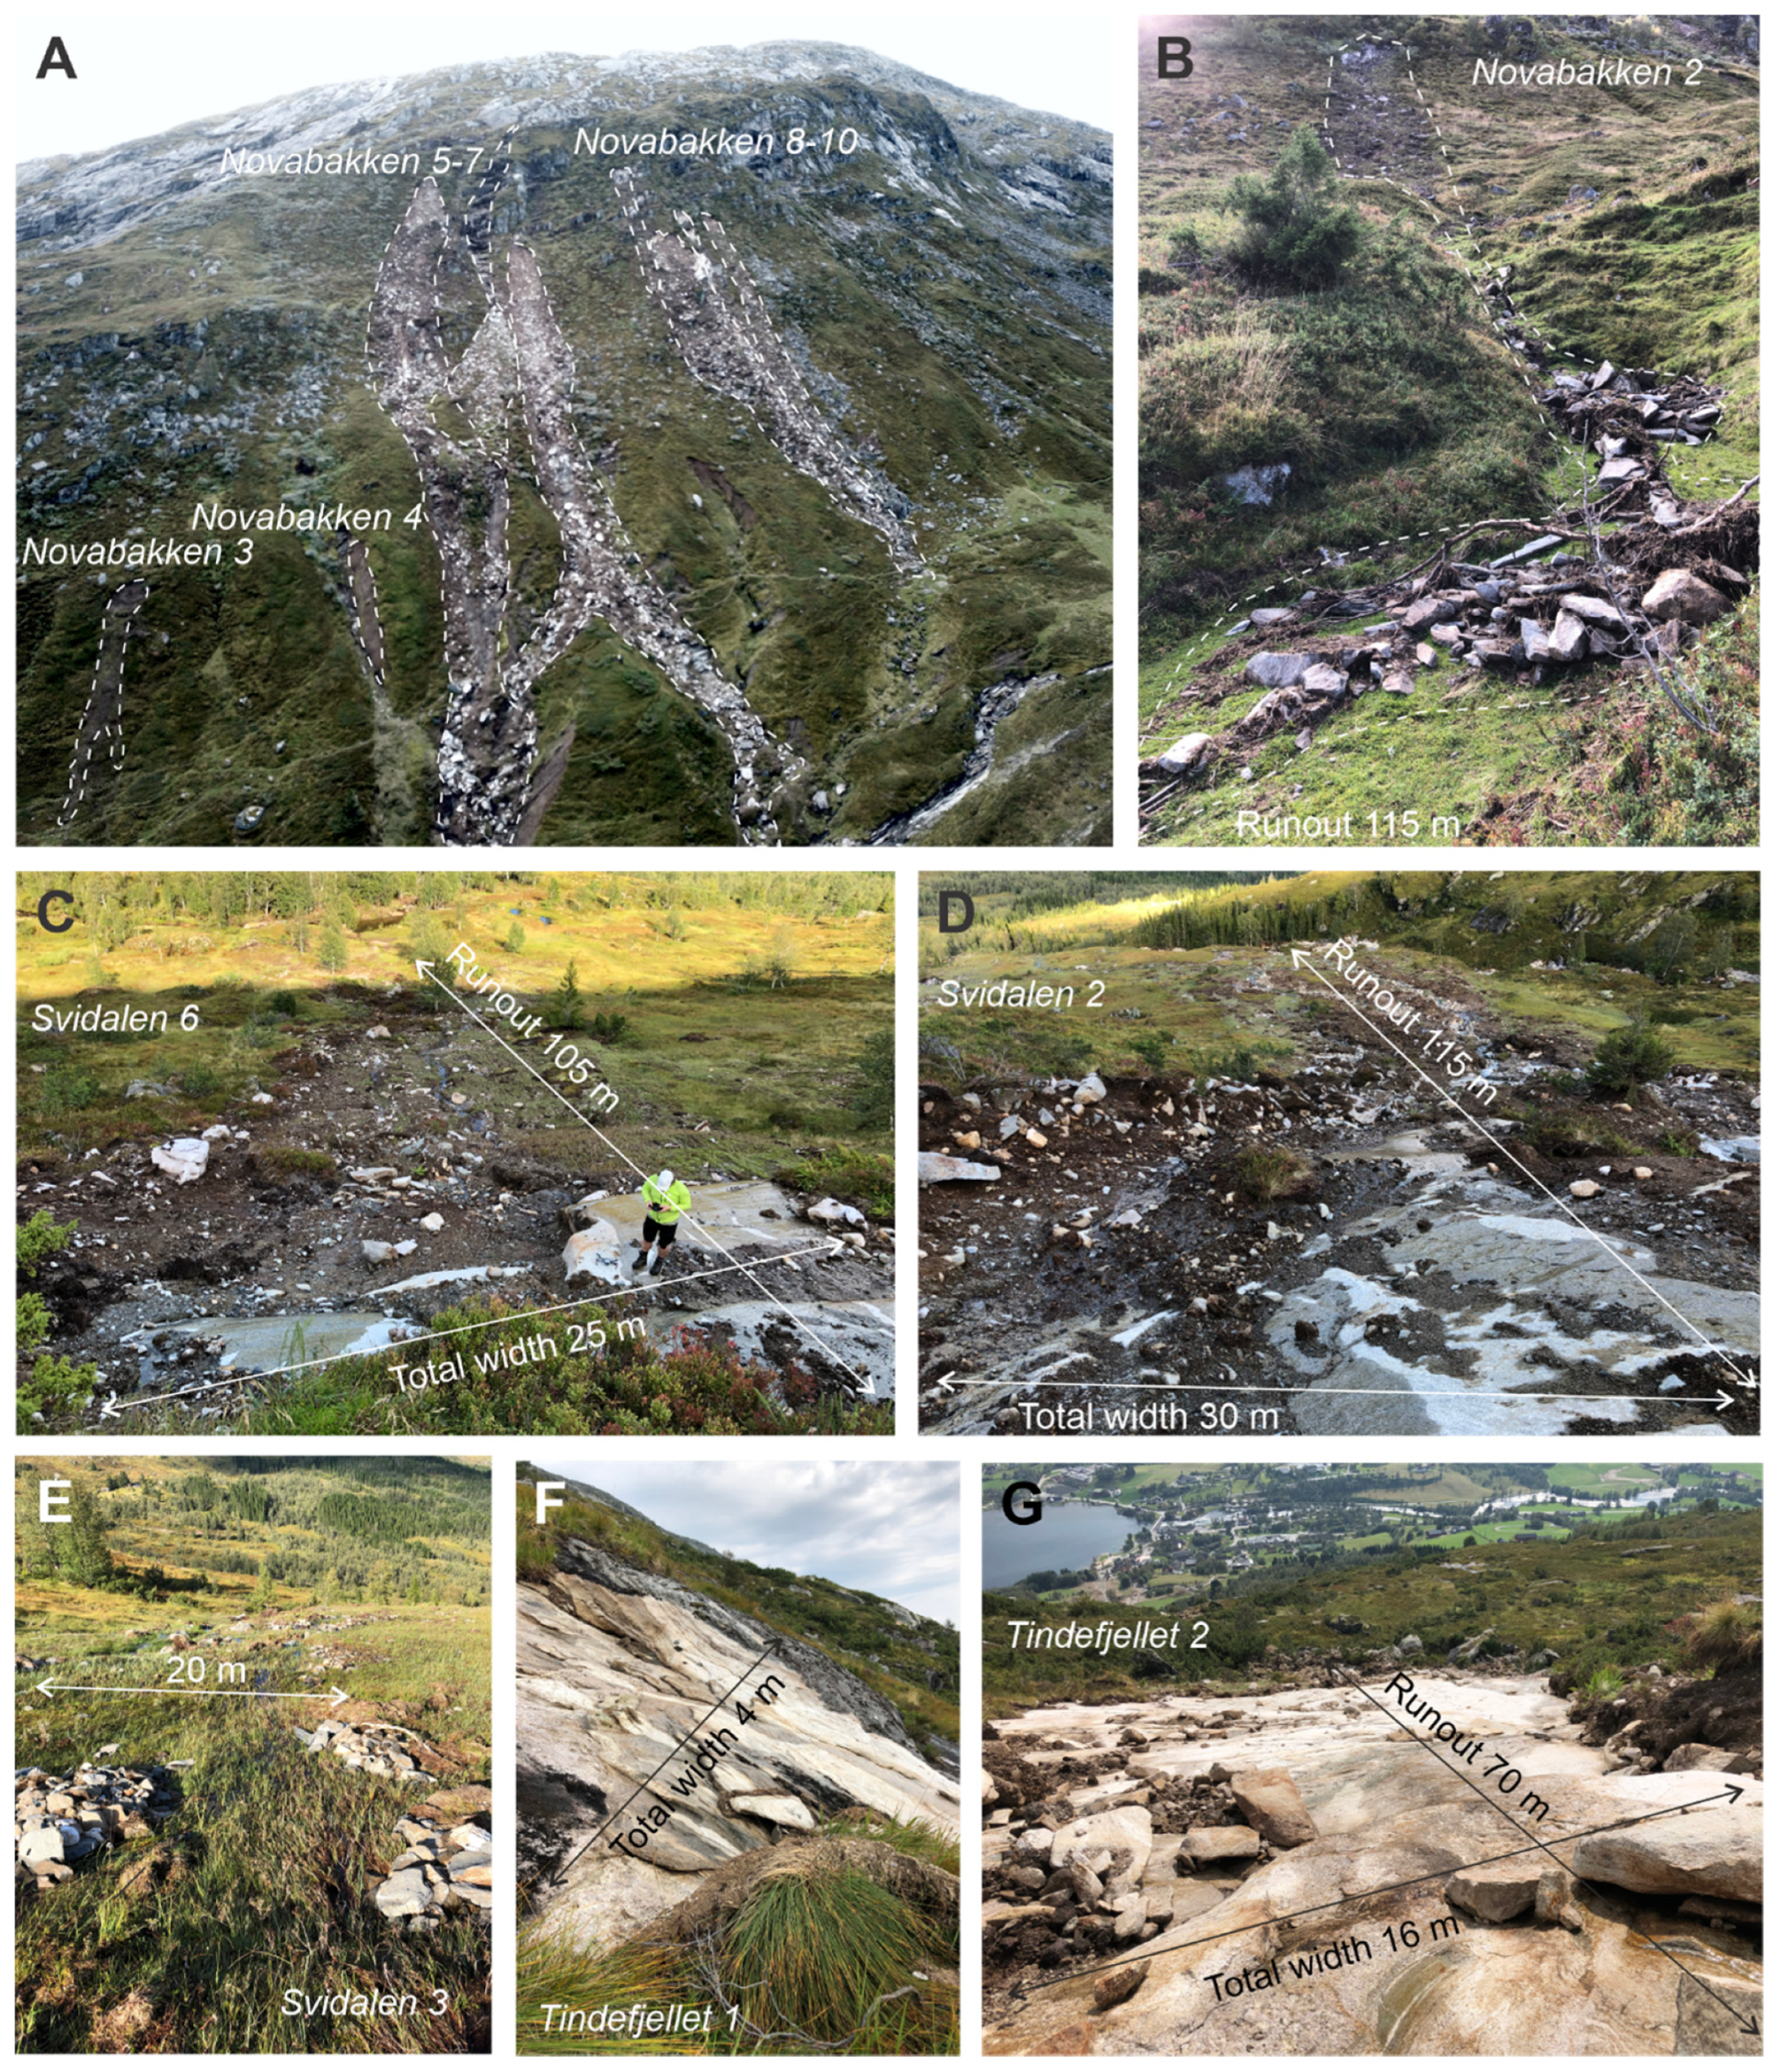
4.2.2. Preliminary Field Mapping and Verification

Verification of the preliminary map was conducted through field visits (in August and October 2019) and a helicopter flight (October 2019). The preliminary map was then updated to include several small landslide scarps observed during the helicopter flight, which were visible in the image but had not been included in the preliminary mapping due to uncertainty. Finally, a comparison was made with a detailed map of the landslides produced by co-author D. Rüther. The detailed field map by Rüther was initially produced by visual comparison of pre- and post-event Sentinel-2 images, then updated based on extensive field investigations (in August and September 2019, and May, June, and August 2020), along with drone orthophotos. A selection of photos from this fieldwork is shown in Figure 4, and a detailed report of field observations is also available [36]. This inventory shows the landslides divided into release, transport, and deposition zones and has a much higher resolution than the S2-BT inventory outlines.

4.2.3. Comparison between the Four Manual Mapping Approaches

The verified landslide inventory produced from the S2-BT image was used as a baseline for comparing the three other approaches. The other images were first visually inspected for visible landslides. Then, the S2-BT landside inventory was used to systematically search for traces of the prior known landslides in each of the other images. Following the classification system used by [46], the prior known landslides were classified into one of three sets—namely, in Set 1, landslides were not visible in the SAR-RGB image; in Set 2, landslides were hardly visible, recognisable only given prior knowledge of the location; in Set 3, landslides were clearly visible.

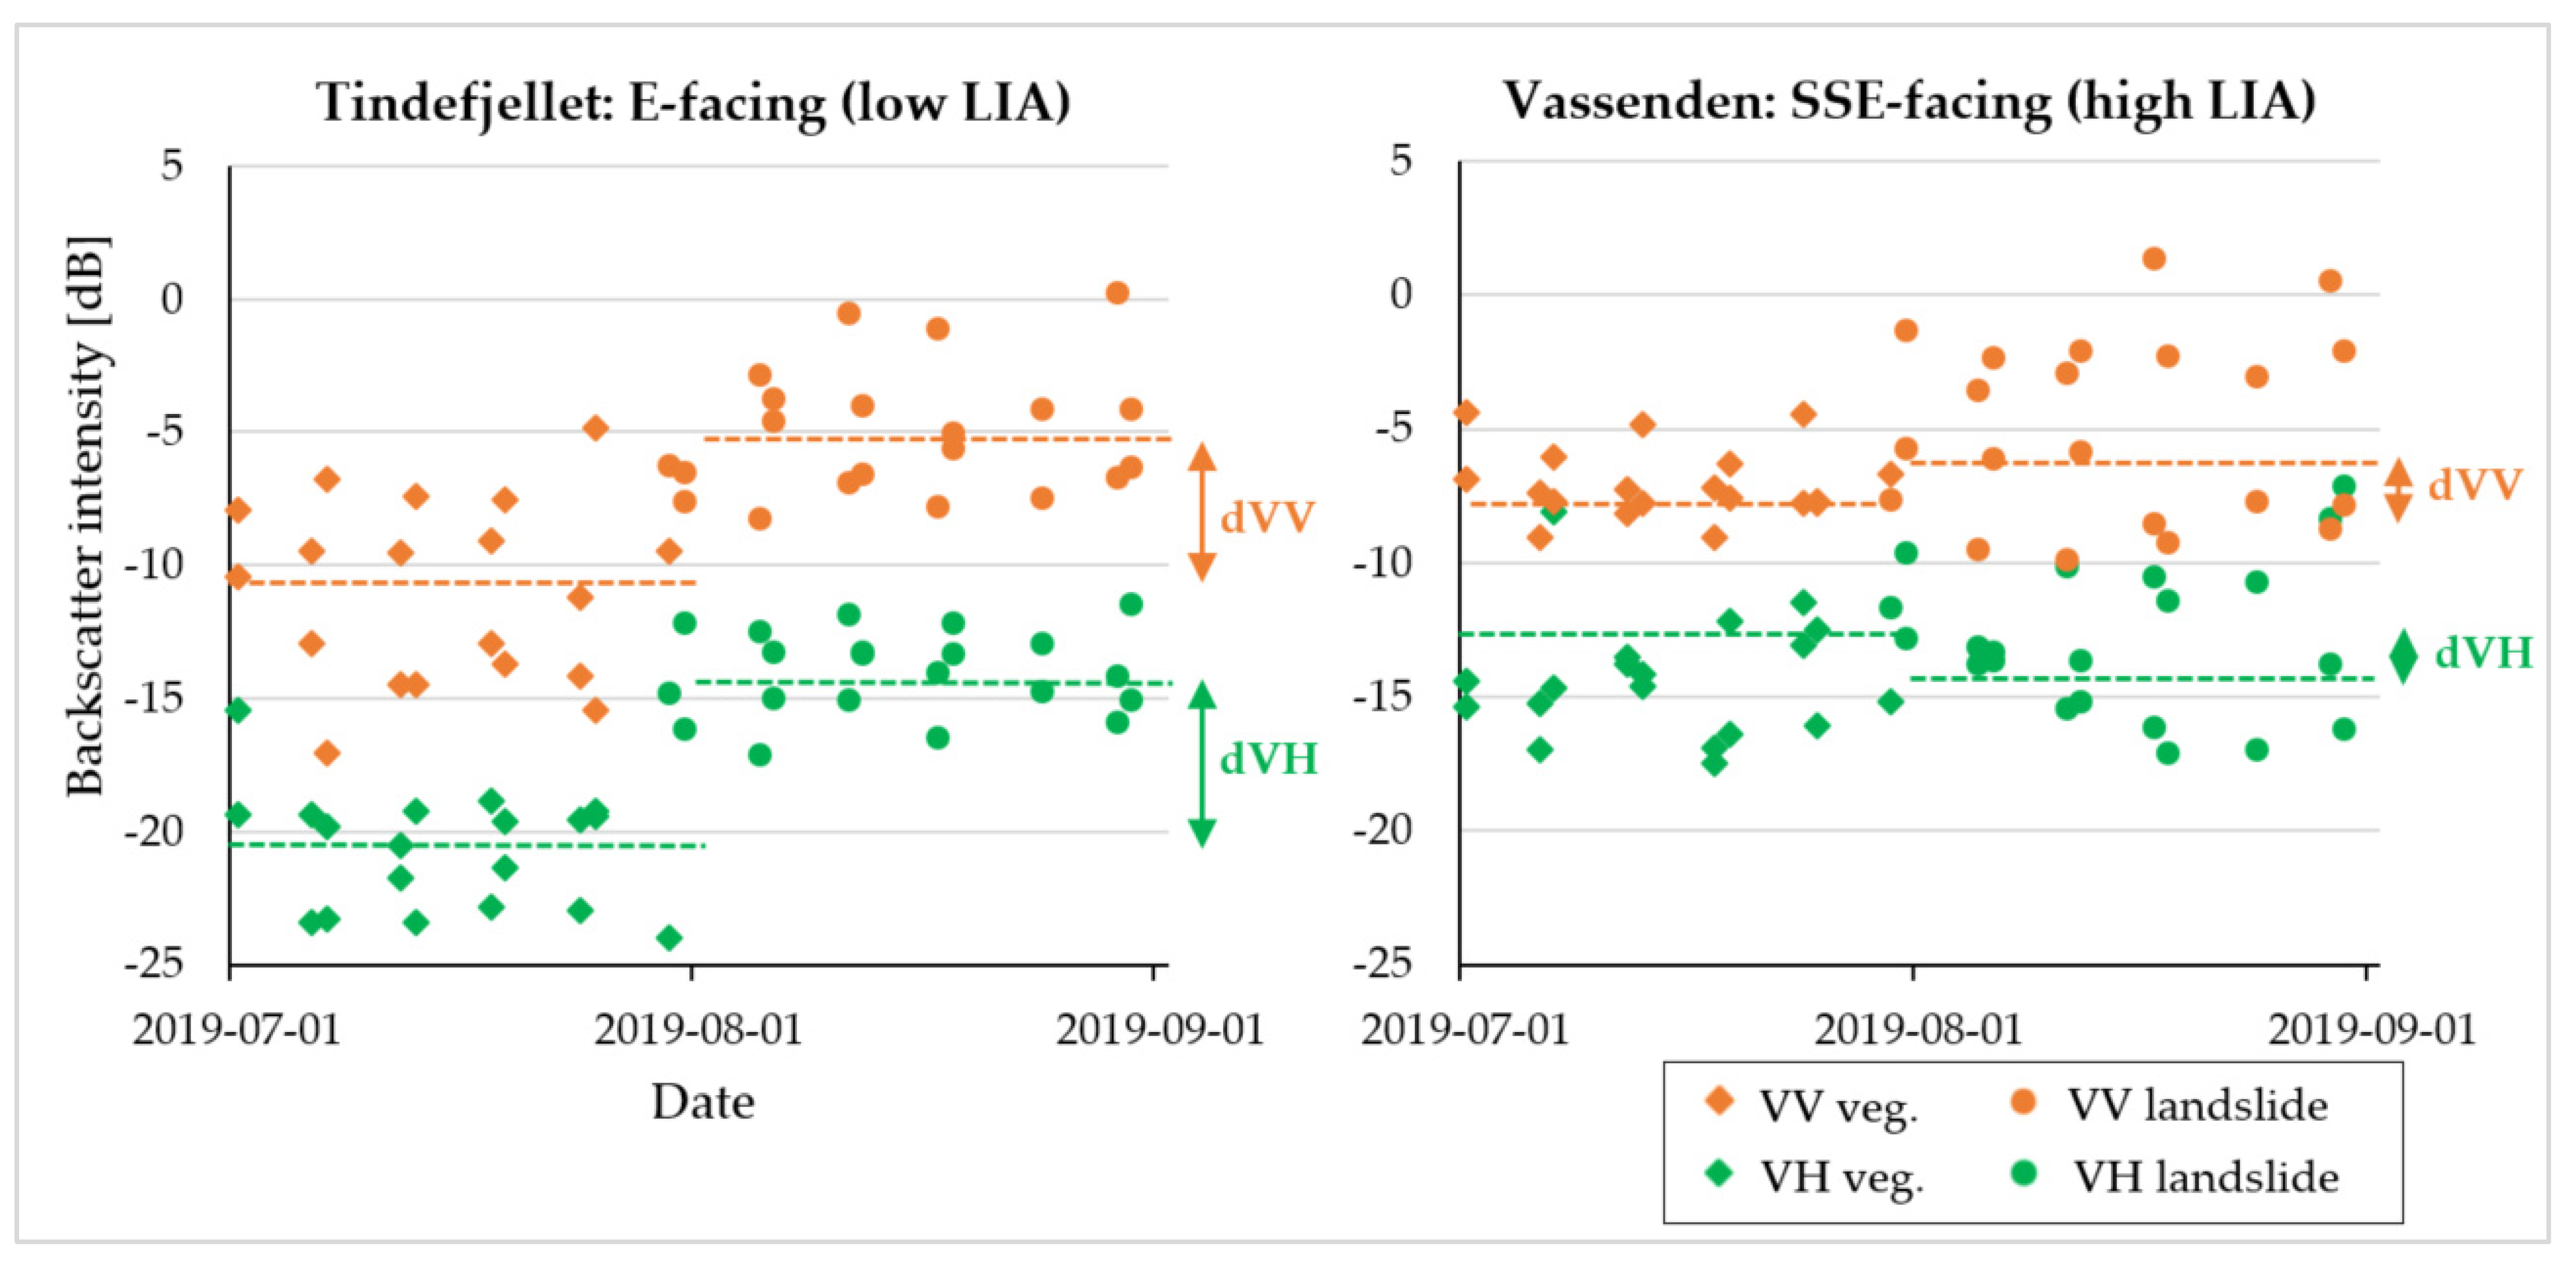
4.2.4. Landslide Visibility in VV and VH Polarisations and Effect of Local Incidence Angle

To analyse the difference in landslide visibility in VV and VH polarisations, first, a qualitative approach for comparison was used, by examining a selection of individual landslides in subplots in detail. Next, time-series data showing the backscatter intensity values of two landslides, with low and high local-incident angles were analysed.

5. Results

5.1. Analysis of Spatial Bias with Preliminary Landslide Mapping Using Sentinel-2 dNDVI

Figure 5 shows the spatial distribution of landslides mapped from the S2-BT image and registered landslides from the NLDB, available at www.skredregistrering.no (downloaded from NVE, 18 December 2019), that occurred on 30 July 2019 in Jølster, Norway. During verification, minor differences were found between the two inventories due to the coarser, 10 m resolution of the S2-BT image (e.g., clustering small landslides into one large), compared with the higher-resolution inventory of Rüther; however, overall, they were relatively consistent.
It also shows the locations that were investigated in more detail, using helicopter or drone, or by foot. Based on the consistency of the observations, along with the short acquisition window (five days) between pre- and post-event images, the authors have high confidence in the results of the Sentinel-2 mapping, within the limits of the 10 m spatial resolution. A total of 120 landslides ranging from <0.01 km2 to nearly 1 km2 in area (Figure 6) were mapped across the area, over an eightfold increase from the 14 registered landslides. The majority of these (>80%) were small landslides (<0.01 km2). The results of the spatial bias analysis are presented in Figure 6. It is seen that nearly all of the registered landslides were located within 500 m of a road (100% of events from Jølster and 94.9% of all landslides for the whole county), while only one-third of the mapped landslides were within 500 m of a road. While detailed analyses of trigger and failure mechanisms are beyond the scope of this paper, we note again that the majority of the landslides occurred on open slopes and shallowly eroded till overlying polished bedrock. The spatial distribution of landslides appeared to be strongly controlled by the location of the highest rainfall intensities of the highly localised thunderstorm [27], with minor local topographic variations (submetre scale) determining exact initiation zones [36].

5.2. Comparison of Landslide Visibility between the Approaches

Figure 7 shows the dNDVI images, S2-BT, and S2-MT, covering the study area. The landslides are very clear in both images; however, the cloud-free greenest-pixel composite, S2-MT, had less noise from clouds, high water levels in rivers, and agricultural fields. The co-polarised (VV) SAR-RGB composite images, S1-BT and S1-MT, are shown in Figure 8. Again, a significant improvement in landslide visibility is observed in the multi-temporal image, S1-MT, as well as significantly less background noise and reduced terrain artefacts (mainly foreshortening), compared with S1-BT. However, other signals that appear bright green must still be differentiated from landslides. These include changes in agricultural areas and snow cover, as well as some topographical features and general speckling. Different types of vegetation can also be seen in this image. Commercially planted spruce appears as bright areas at lower elevations in the valleys, while birch and alpine scrub vegetation are darker, typically at higher elevations. Farmland and grass appear as darker green or purple patches in the lower valleys. Landslides must be distinguished from other bright green areas, for example, due to new snow cover on the mountain tops (Figure 8, S2-MT, SE corner), or reaping of grass fields.
To quantitatively compare the detectability of landslides between these images, the landslide inventory produced using the S2-BT image was used as a baseline for comparison. The landslide visibility in S2-MT was not significantly different, compared with S2-BT, so this was not included in the following results. Each landslide was searched for systematically within the Sentinel-1 images and classified in an adaptation of the system used by [46], according to their detectability. As shown in Table 3, the detectability of landslides was improved significantly using the S1-MT image, compared with the S1-BT image; however, the landslides considered detectable, respectively, represent only 7.5% and 43% of the 120 landslides mapped with the S2-BT image.
Figure 9 shows a subset of the landslides that were detectable in the S1-BT image, including, from top to bottom, S2-BT, S2-MT, and S1-MT in VV polarisation, and S1-MT in VH polarisation. A short description of the landslide visibility in the S2 images is given, followed by more detailed observations for the S1 images. In the S2 images, it is seen that the landslides are clearly distinguishable from the background, and even the small, shallow landslides on Tindefjellet (column 4) stand out rather clearly.
Overall, the S2-MT image was considered the best for detecting landslides. The difference in landslide visibility, compared with BT, is not significant; however, the reduction in noise from clouds and agriculture shows improvement over the BT image. There is some noise from agriculture visible in the S2-BT subplot of Vassenden, which is significantly reduced in the S2-MT image. In true colour Sentinel-2 level 2A images (not shown), distinguishing new landslides from older landslides is difficult. Landslide visibility is also limited by shadows, particularly on the north-facing slopes, although this is improved significantly in the Level 2A image, compared with the Level 1C image. Furthermore, the smaller landslides in Tindefjellet are not as easily distinguishable from the background vegetation as they are in the dNDVI image.

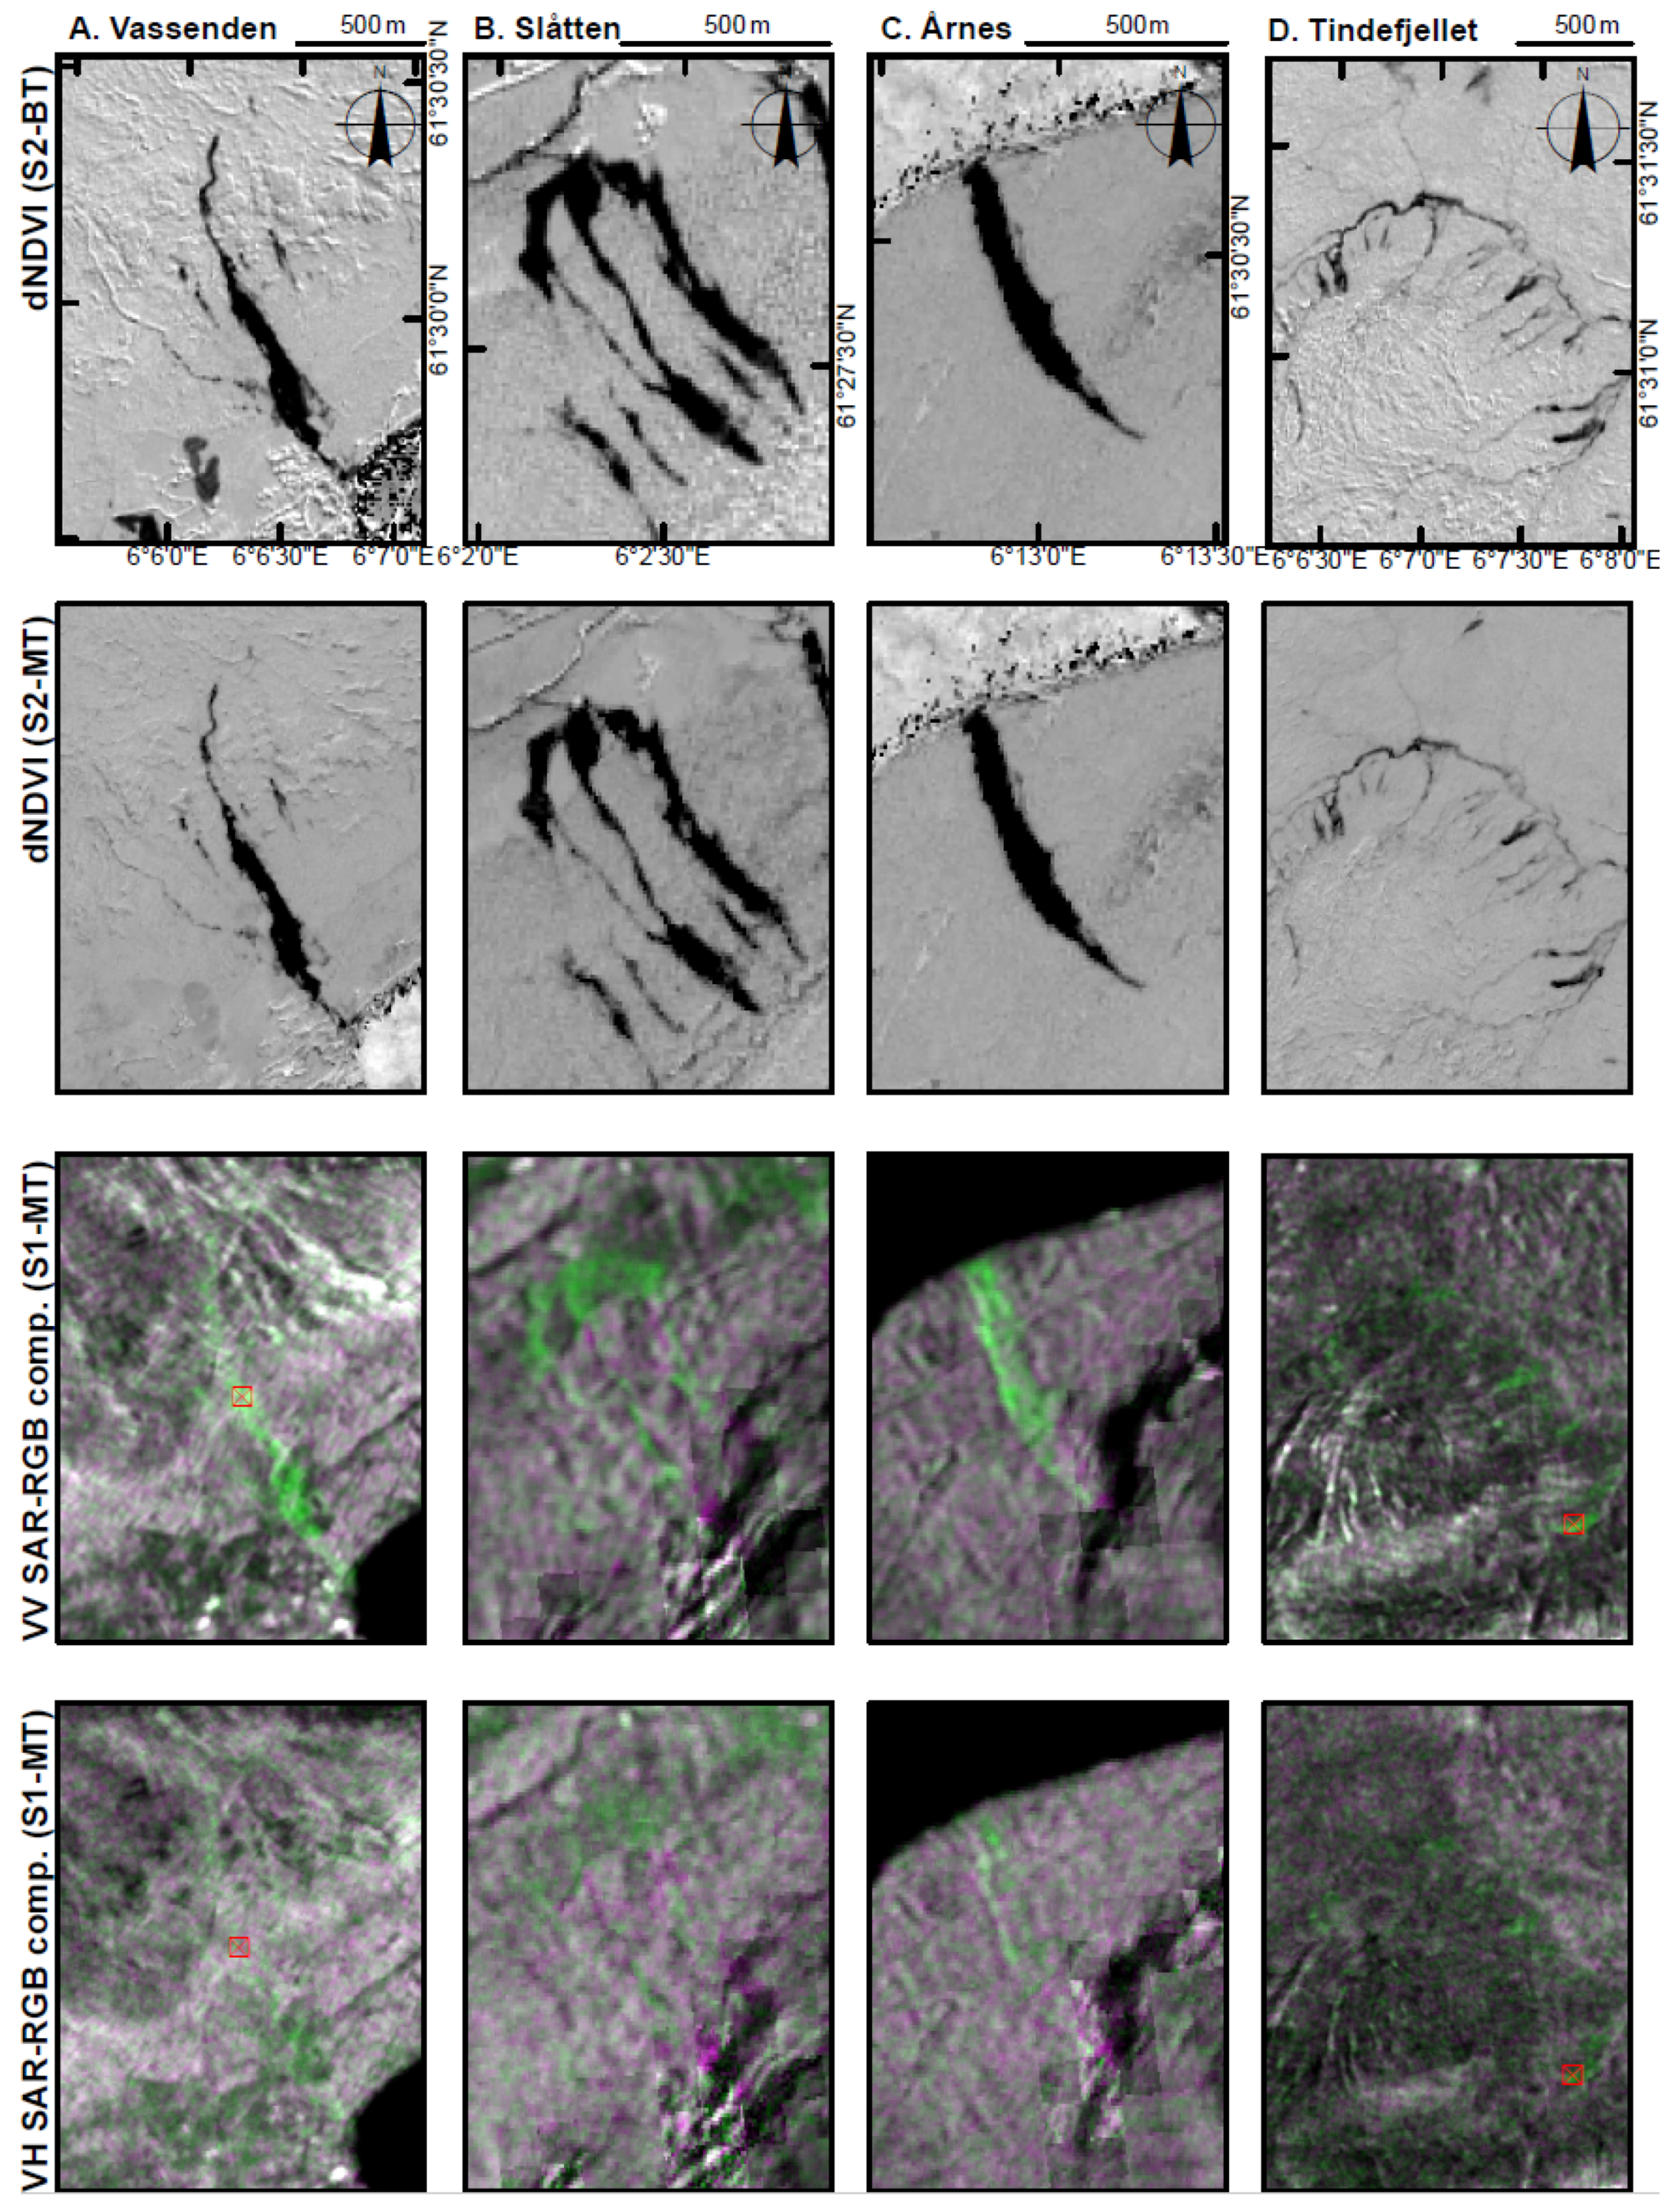
5.3. Landslide Visibility in VV and VH Polarisations

In the lower two rows of Figure 9, S1-MT images are shown, using VV and VH polarisations. The landslides shown in the subplots are described in more detail as follows:
  • The Vassenden landslide appears clearly in VV polarisation from top to tail; however, it is barely visible in the VH polarisation. In VH polarisation, the landslide is not easily distinguishable from surrounding vegetated areas, especially grass. The upper section is slightly visible in the VH image; however, this would not be picked out without prior knowledge.
  • Apart from an area with image distortion due to terrain correction at the initiation zone of the landslides, the large Slåtten landslides are mostly visible in the S1-MT VV image. However, the boundaries between the separate landslides are less clear than those in the S2 images. The smaller landslides to the west of the large ones are barely visible. Again, in the VH image, the deposit areas of the landslides are barely distinguishable from the surrounding grass. However, some of the eroded channels are slightly visible within the landslide area in the western and centre of the large landslides.
  • At Årnes, the landslide appears clearly in the VV polarisation aside from the distortion in the initiation zone, while in the VH polarisation, again only some of the channelised areas are visible.
  • At Tindefjellet, the small landslides are visible in both VV and VH polarisations, although appear brighter in VV.
The difference in visibility is shown quantitatively in Figure 10 and Table 4. Figure 10 shows a general increase in backscatter intensity as the land cover changes from vegetated to non-vegetated. Overall, the backscatter intensity at Tindefjellet is higher than at Vassenden. It is seen that, for the landslide sampled on Tindefjellet, there is a clear difference between the mean backscatter intensity in both VV (5.8 dB) and VH (6.4 dB), with the greatest change within VH. For the landslide sampled at Vassenden, the differences in means are lower than those at Tindefjellet, for both VV (2.2 dB) and VH (1.2 dB); however, the largest difference is in VV.
Figure 10. Sentinel-1 data time-series plots from pixels within landslides that changed from alpine scrub and birch to bare soil on 30 July 2019. VV refers to the co-polarised backscatter and VH to cross-polarised backscatter. Tindefjellet (6.129393, 61.514124); Vassenden (6.105213, 61.500352). Dashed lines show the mean for the month, also shown in Table 4.
Remotesensing 14 02301 g010

6. Discussion

6.1. Improving Landslide Visibility with Multi-temporal Composites and Decreasing Spatial Bias

Detection of landslides in remote areas is a necessary step in creating non-spatially biased landslide inventories, from which predictive models used in landslide early warning systems are tuned and verified, and which inform landslide risk and hazard evaluations. The results from this case study showed great potential for using freely available, medium resolution (10 m) Sentinel-2 images for landslide mapping. S2-dNDVI images could be produced from both Level 1C and Level 2A products, and landslides could be easily mapped at a 10 m resolution, regardless of slope orientation, vegetation type, and erosion depth. Using this approach, the number of landslides detected was increased by over 8 times, and size information could be quickly obtained. Furthermore, the spatial bias was significantly reduced in this case study, with only one-third of landslides located within 500 m of a road, compared with 95% for the region. The additional information needed for the verification of landslide warnings (type and consequences) was not determined in this study. However, such information could possibly be added to the remotely mapped landslides, by comparison with reported landslides or building maps to determine consequences, or by investigating the proximity to channels and landslide shape for determining types.
The multi-temporal image composites produced with GEE significantly improved the clarity of S1 and S2 images, compared with bi-temporal images, by reducing noise from speckle and clouds, respectively. Furthermore, the code is fast to run, images can easily be reproduced for different dates and locations, no software is required, and there is no need to download and store large quantities of data. For the Jølster case study, the detectability of landslides in the S2-MT images was greater than that in the S1-MT images. However, the S2-MT approach is very seasonally dependent. Changes in snow cover, darkness, lack of green vegetation, loss of vegetation due to non-landslide processes, and long periods of cloudy weather are the main limitations of this method.
On the other hand, the visibility of landslides in the S1-MT (VV) image for Jølster exceeded our expectations. The large landslides in the study area were clearly visible and, in some cases, could be mapped with reasonable accuracy. Furthermore, even some of the small shallow landslides that were not in the NLDB were visible, although mostly on east-facing slopes. This method has considerably more potential for rapid detection of landslides that occur outside of the summer season than the S2-MT approach, due to the lack of green vegetation needed for effective dNDVI results. Some quick tests beyond the study area (e.g., the event shown at https://www.regobs.no/Registration/278548, accessed 18 January 2022) showed that this method could be used to detect landslides that occurred in winter, i.e., when there is no cloud-free data available. However, due to noise from changes in snow cover, this approach seems more useful for verifying reported landslides where only approximate locations are given (e.g., from news reports), rather than for mapping landslides over large areas.

6.2. How the Approaches Differ to Similar Methods

Our approach for creating the S2-MT images is very similar to that used in the HazMapper GEE app [29], with one difference: the HazMapper app uses a normalised percentage value of dNDVI, while we used the conventional dNDVI. Additionally, with the HazMapper GEE app, the results are visualised using a red-to-blue colour scale, while we used black and white. Both work well for detecting landslides. However, an advantage of HazMapper over the approach in this paper is that HazMapper tools are available in an app format, which is useful for those who are not comfortable using scripts.
With regard to Sentinel-1, our approach for creating the S1-BT image was inspired by the method in [46], with some differences in the pre-processing and visualisation. However, our results were in stark contrast with those of the study in ref [46], according to which 83% of landslides (n. test cases = 27/32) were considered detectable. By comparison, in this study fewer than 10% of the S2-BT mapped landslides were considered detectable in the S1-BT composite (9/120). This discrepancy is largely explainable due to the size of landslides included in [46] where the majority of successful cases were over 0.05 km2 in area, and only four examples of landslides smaller than this were included. The Jølster landslide inventories, by contrast, have a majority of landslides with less than 0.01 km2 in size. The largest landslides from the Jølster study (over 0.03 km2) were also all at least partially visible in the S1-RGB composite. The smaller landslides did not have any direct consequences for the local population, so taking this into account, these findings do not disaffirm the conclusions of [46], i.e., that Sentinel-1 data have the potential as sources to identify rapid landslides in emergency situations when there is cloud cover.
With further regard to [46], a major limitation of their method was the speckle filtering; they discussed that better results could have been obtained with parameter tuning on a case-by-case basis. In our S1-MT image, no specific speckle filtering was applied; however, we found that averaging pixel values over time effectively eliminates the need for this step. Indeed, aside from the time saved by using the GEE data catalogue, this is the greatest advantage of the S1-MT approach, compared with using single images—the speckle is significantly reduced by averaging across time instead of space, without compromising spatial resolution and losing detail on object boundaries.
A caveat, however, remains, in that this method is most appropriate when pixel reflectivity can be assumed to be temporally homogenous. Where seasonal changes significantly affect the scattering properties of the ground cover over time, e.g., from loss of leaves or snow cover, then better results may be obtained by using pre-event images from the same month in the previous year, instead of the previous month. This was also observable in [31], in which the accuracy of predictions generally increased, by averaging across an increasing number of images (with the rate of increase showing exponential decay with an increasing number of images), except for when fall and winter images are included.
The generation of the S1-MT image was relatively similar to the method presented by [31]. The differences between the methods included slightly different terrain correction calculations (a tutorial covering SAR basics in GEE by Dr. Eric Bullock is available: https://www.youtube.com/watch?v=JZbLokRI8as&t=1213s, accessed 18 January 2022) and visualisation of results. We found the RGB-composite provided more contextual terrain information for visual identification of landslides than the single-band difference results. However, as input for automatic change detection, the single-band format is possibly more appropriate.
Finally, we note that the SAR approaches appeared to work particularly well in the glacial landscape in Jølster. Most of the landslides occurred on open slopes and, therefore, are relatively visible in relation to their surroundings. The smoothly eroded valley sides also likely resulted in better terrain corrected SAR images than areas with younger, more tectonically complex, faulted bedrock morphology. Additionally, the globally available DEMs in Google Engine are currently only available at 30 m resolution, so areas with more frequent angular ridges and valleys may have reduced performance, compared with our results. The few faults in our study area do not appear to have any effect on landslide distribution; rather, their location appears to be strongly related to the distribution of heavy precipitation, with initiation influenced by very localised bedrock variations [36]. In tectonically active landscapes, narrower, angular valleys, and fault-controlled sliding planes, it could be more difficult to see landslide occurrences. This may be improved in the near future with higher resolution DTMs and SAR data.

6.3. Polarimetric Scattering Properties of Vegetation and Landslides

Perhaps the most interesting difference from [31], however, was that we tested landslide visibility in both VV and VH polarisations and found much better results using VV (Figure 9), while they tested only VH. Their reason for using VH was that cross-polarisations are more sensitive to biomass forest structure and would, therefore, be useful for identifying landslides in vegetated areas. They encouraged other studies to explore the use of other polarisations. Similarly, from a forestry perspective, ref [47] wrote “cross-polarised [VH] observations are essential for identifying changes from volume to surfaces”. On the other hand, ref [46] also tested landslide detection with both VV and VH, stating, “we noticed a better definition of the changes in the VH polarisation when landslides occurred in previously deeply vegetated areas, while VV offers sometimes more definition and contrast in presence of glaciers or snow”.
In order to better understand the discrepancy between our results and the expectations that VH would be more useful for landslide detection, we present a conceptual model in Figure 11 and discuss some key elements affecting SAR backscatter intensity response. Backscattering intensity in VV and VH polarisations depends on the reflections of surface (bare soil) and volumetric (vegetation) scattering mechanisms. For landslides with planar scarps, the angle of the landslide surface relative to the plane of the radar determines the relative density of the signal received, and the degree to which the signal is reflected toward or away from the sensor. For channelised landslides, with high LIA, changes in vegetation on the side of the channel that faces towards the sensor are more likely to be detected. VH backscatter intensity is less affected by the LIA due to the 3D scattering behaviour of vegetation. The difference between VV and VH is more pronounced at smaller local incidence angles (up to 30°), while it becomes difficult to distinguish between forest and landslides at higher incidence angles (over 60°).
The surface scattering mechanism and local angle of incidence are most relevant in determining the intensity of backscatter in co- and cross-polarisation. Dielectric properties, including surface water content, are also relevant [48]. However, we assumed that this did not vary significantly between the locations being compared.
Landslides and vegetation both showed components of surface and volumetric scattering mechanisms (Table 4). The landslides behaved as expected [47], as predominantly a rough surface with some volumetric scattering, reflecting a strong co-polarised (VV) signal and a low to moderately low cross-polarised (VH) signal back to the receiver. However, for vegetation, instead of a predominantly volumetric scattering response, we observed that the vegetated areas also gave a stronger signal in VV than in VH polarisation. This is considered to be due to the sparseness of vegetation, allowing more reflection from the ground surface.
The intensity of backscatter was reduced at a higher angle of incidence in the Vassenden example, compared with the Tindefjellet landslide. This is due to the landslide receiving a lower density of energy across the surface. The difference in backscatter intensity was most pronounced in vegetated areas, both in VV and VH polarisations, while bare soil produced similar strength signals in both polarisations. This is presumably because the very rough surface of fresh landslides provides an abundance of reflective surfaces, while the reflective strength of backscatter from vegetation seems to be more affected by the initial density of energy received.
These findings, however, are opposite to the conclusions of a study on the polarimetric scattering properties of landslides in forested areas [49], where it was found “…in landslide areas, polarimetric indices ps [VV], pv [VH] change drastically with the local incidence angle, whereas in forested areas, those indices are stable regardless of the local incidence angle change”. Nevertheless, the difference could be due to the use of L-band PALSAR-2 data, with longer wavelengths (λ∼25 cm) that penetrate deeper into the canopy than the Sentinel-1 C band (λ = 5.6 cm). Furthermore, the forested areas referred to by [49] in Japan appear to be much denser and woodier than the vegetation areas in our comparison. Thus, more investigation is needed on the influence of vegetation type and wavelength on the visibility of landslides in cross- and co-polarised SAR data.

6.4. Recommendations and Future Research Directions

The change detection images using S1 and S2 can be easily reproduced for different date ranges and locations using GEE. For manual landslide detection, the S2-MT approach is recommended when green vegetation is present, and a combined S1-MT and S2-MT approach is recommended in other cases, or when a satisfactory cloud-free composite cannot be obtained. Further research is needed to understand how well these methods can be applied in different vegetation and seasonal conditions. However, it is likely that the SAR-RGB composites could be used to detect landslides when the S2-dNDVI image does not yield good results, i.e., when clouds, snow, or darkness obscure the vegetation, or due to a seasonal lack of green vegetation. Alternatively, for mapping purposes, S2-MT images can be created using images from summer periods in consecutive years, in order to detect landslides that occurred outside of the summer months. However, the longer time interval introduces additional negative dNDVI signals that can make detecting landslides more difficult.
Ongoing developments in data availability and pre-processing of images will provide many more options to explore. These include a harmonised optical collection combining Sentinel-2 and Landsat images [50], and the NISAR satellites due to be launched in 2023 with L- and S-band SAR capabilities [51].
In working towards developing a system for continuous detection of landslides over large areas, the most appropriate platform is GEE, as multiple datasets (e.g., optical, SAR, soil moisture, precipitation, slope, land cover type) can be combined and analyses performed quickly over large areas. Furthermore, there is a possibility to run the full process of image pre-processing, classifier training, and running the classification model within this platform. We are currently creating a database of verified landslides visible in satellite images across Norway, and we hope that the landslide inventory produced in this study will be included in training datasets in the future development of globally trained landslide detection models.

7. Conclusions

This study sought to investigate satellite-image-based change detection approaches for landslide detection, in order to improve the spatial bias and completeness of landslide inventories. A preliminary landslide inventory was produced using a conventional NDVI-based change detection approach, subsequently verified by helicopter, drone, and field observations. We demonstrated how spatial bias and inventory completeness could be improved using this method, compared with current practice. We then compared how landslide visibility in change detection images could be further improved with multi-temporal image composites instead of bi-temporal (i.e., pre- and post-event pair of images) methods, using both Sentinel-1 and Sentinel-2 images within Google Earth Engine. Finally, we examined in detail how the effect of polarity on landslide visibility in SAR images. The main findings are summarised as follows:
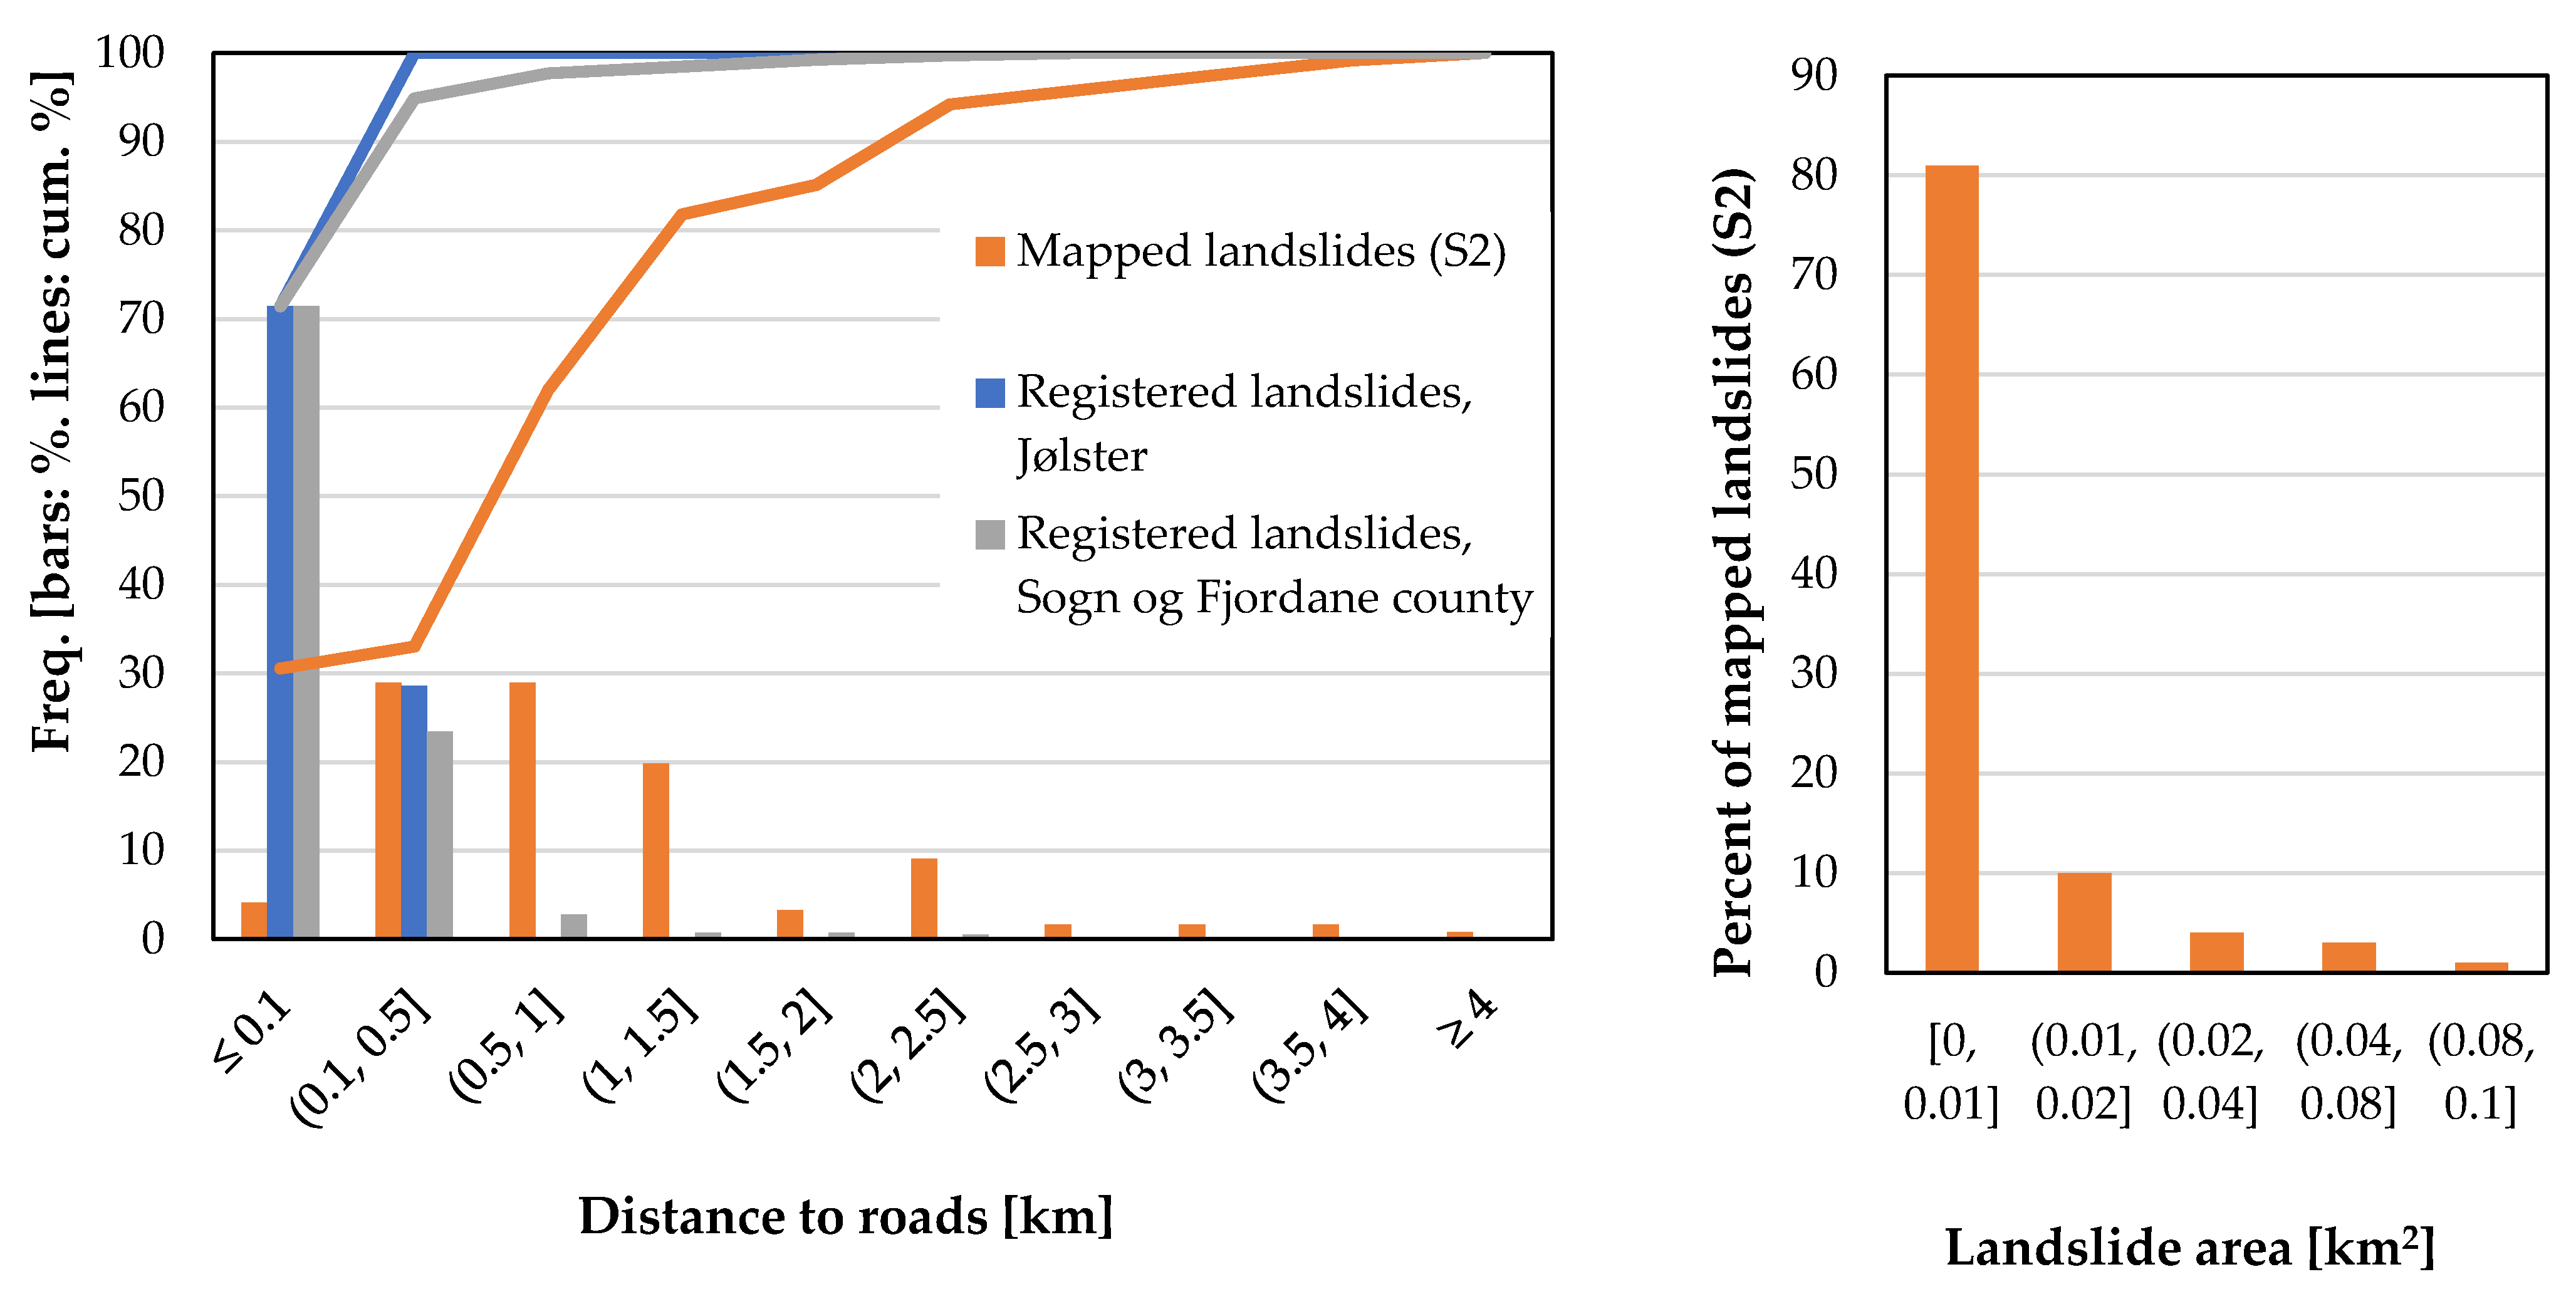
  • The landslide event inventory for Jølster produced in this study consists of 120 landslides mapped from the Sentinel-2 bi-temporal change detection image with a 10 m resolution. This represents a significant improvement in inventory completeness, with the initial 14 landslides reported in the NLDB for this event.
  • Spatial bias towards roads was also significantly reduced, with the percentage of landslides located within 500 m of a road reduced from 100% in the NLDB from ground-based landslide reporting to ca. 30% in the remotely mapped landslide inventory.
  • Landslide visibility was improved for both Sentinel-1 and Sentinel-2, using multi-temporal image composites instead of bi-temporal composites. For Sentinel-1, this was due to noise reduction from speckle and the removal of clouds for Sentinel-2.
  • Landslides appeared most clearly in the S2 dNDVI images. For this case study, as a relatively cloud-free image was available very soon after the event, there was not a great advantage improvement in landslide visibility observed in using the MT approach, compared with the BT approach for Sentinel-2 data.
  • On the other hand, significant improvements in the clarity of the Sentinel-1 image were achieved by applying this method, with the number of detectable landslides increasing from 9 in the S1-BT image to 52 in the S1-MT image. The MT image composites were also significantly faster to produce than the BT images, without the need for downloading large quantities of data. In the S1-MT and S1-BT images, respectively, 52 and 9 out of the 120 mapped landslides were considered detectable. We note that, although the rates of landslide detection using S1-MT images were lower than that in other studies using BT methods (e.g., 83% in [46]), the average size of the landslides in our set was significantly smaller than those investigated in the aforementioned study, and several of these were visible in the S1-MT image but not the S1-BT image.
  • Contrary to other studies, landslides in our investigation area appeared much more clearly using VV polarisation, compared with VH polarisation. We presented a conceptual model to help explain these results.
Our results indicate that (a) manual or automated landslide detection could significantly be improved by analysing multi-temporal image composites, using freely available earth observation images and Google Earth Engine, and (b) a systematic application of these methods could significantly improve spatial bias and landslide inventory completeness.

Author Contributions

Conceptualisation, E.L.; methodology, E.L. and R.F.; software, E.L. and R.F.; validation, E.L., D.R. and R.F.; formal analysis, E.L.; investigation, E.L., D.R., R.F. and L.R.; resources, E.L., D.R., R.F. and L.R.; data curation, E.L. and D.R.; writing—original draft preparation, E.L.; writing—review and editing, E.L., R.F. and L.N.; visualisation, E.L. and D.R.; supervision, R.F., L.R., J.S. and S.N.; project administration, E.L.; funding acquisition, E.L., D.R. and R.F. All authors have read and agreed to the published version of the manuscript.

Funding

This research was funded by the Research Council of Norway and several partners through the Centre for Research-based Innovation Klima 2050 (Grant No 237859), and by the NGI core research funding provided by the Research Council Norway (GBV 2020–2022). Denise Rüther’s contribution was funded by NORADAPT (Norwegian Research Centre on Sustainable Climate Change Adaption), and Lena Rubensdotter’s by NGU (Norges Geologiske Undersøkelse).

Data Availability Statement

The GEE scripts are available on the following GitHub page: https://github.com/erin-ntnu/Change-detection-images-GEE (accessed 1 May 2022).

Acknowledgments

We would like to thank journalists Hallstein Dvergsdal from Firda Tidend, and Oddleif Løset from NRK, for providing images of the Vassenden landslide, Dagrun Arsten, for assisting with the interpretation of agricultural activity, and co-supervisors James Strout and Graziella Devoli for much appreciated support and feedback. This paper contains modified Copernicus Sentinel data [2020] processed by Sentinel Hub.

Conflicts of Interest

The authors declare no conflict of interest.

References

  1. Field, C.B.; Barros, V.; Stocker, T.F.; Dahe, Q. Managing the Risks of Extreme Events and Disasters to Advance Climate Change Adaptation: Special Report of the Intergovernmental Panel on Climate Change; Cambridge University Press: Cambridge, UK, 2012. [Google Scholar]
  2. Myhre, G.; Alterskjær, K.; Stjern, C.W.; Hodnebrog, Ø.; Marelle, L.; Samset, B.H.; Sillmann, J.; Schaller, N.; Fischer, E.; Schulz, M.; et al. Frequency of extreme precipitation increases extensively with event rareness under global warming. Sci. Rep. 2019, 9, 1–10. [Google Scholar] [CrossRef] [PubMed] [Green Version]
  3. Hanssen-Bauer, I.; Drange, H.; Førland, E.J.; Roald, L.A.; Børsheim, K.Y.; Hisdal, H.; Lawrence, D.; Nesje, A.; Sandven, S.; Sorteberg, A.; et al. Climate in Norway 2100: Background information to NOU Climate Adaptation. In Klima i Norge 2100: Bakgrunnsmateriale til NOU Klimatilplassing; Norsk Klimasenter: Stavanger, Norway, 2009. [Google Scholar]
  4. UNISDR (United Nations International Strategy for Disaster Reduction). Terminology on Disaster Risk Reduction; Geneva, Switzerland, 2009. Available online: http://www.unisdr.org (accessed on 1 May 2022).
  5. Krøgli, I.K.; Devoli, G.; Colleuille, H.; Boje, S.; Sund, M.; Engen, I.K. The Norwegian forecasting and warning service for rainfall- and snowmelt-induced landslides. Nat. Hazards Earth Syst. Sci. 2018, 18, 1427–1450. [Google Scholar] [CrossRef] [Green Version]
  6. Guzzetti, F.; Mondini, A.C.; Cardinali, M.; Fiorucci, F.; Santangelo, M.; Chang, K.-T. Landslide inventory maps: New tools for an old problem. Earth Sci. Rev. 2012, 112, 42–66. [Google Scholar] [CrossRef] [Green Version]
  7. Devoli, G.; Colleuille, H.; Sund, M.; Wasrud, J. Seven Years of Landslide Forecasting in Norway—Strengths and Limitations. In Understanding and Reducing Landslide Disaster Risk: Monitoring and Early Warning; Casagli, N., Tofani, V., Sassa, K., Bobrowsky, P.T., Takara, K., Eds.; Springer International Publishing: Cham, Germany, 2021; Volume 3, pp. 257–264. ISBN 978-3-030-60311-3. [Google Scholar]
  8. Devoli, G.; (NVE, Oslo, Norway). Personal Communication, 2022.
  9. Taylor, F.E.; Malamud, B.D.; Freeborough, K.; Demeritt, D. Enriching Great Britain’s National Landslide Database by searching newspaper archives. Geomorphology 2015, 249, 52–68. [Google Scholar] [CrossRef] [Green Version]
  10. Kirschbaum, D.B.; Adler, R.; Hong, Y.; Hill, S.; Lerner-Lam, A. A global landslide catalog for hazard applications: Method, results, and limitations. Nat. Hazards 2010, 52, 561–575. [Google Scholar] [CrossRef] [Green Version]
  11. Damm, B.; Klose, M. The landslide database for Germany: Closing the gap at national level. Geomorphology 2015, 249, 82–93. [Google Scholar] [CrossRef]
  12. Foster, C.; Pennington, C.V.L.; Culshaw, M.G.; Lawrie, K. The national landslide database of Great Britain: Development, evolution and applications. Environ. Earth Sci. 2012, 66, 941–953. [Google Scholar] [CrossRef] [Green Version]
  13. Zhao, C.; Lu, Z. Remote Sensing of Landslides—A Review. Remote Sens. 2018, 10, 279. [Google Scholar] [CrossRef] [Green Version]
  14. Massey, C.I.; Townsend, D.T.; Lukovic, B.; Morgenstern, R.; Jones, K.; Rosser, B.; de Vilder, S. Landslides triggered by the MW7.8 14 November 2016 Kaikōura earthquake: An update. Landslides 2020, 17, 2401–2408. [Google Scholar] [CrossRef]
  15. Bessette-Kirton, E.K.; Cerovski-Darriau, C.; Schulz, W.H.; Coe, J.A.; Kean, J.W.; Godt, J.W.; Thomas, M.A.; Hughes, K.S. Landslides triggered by Hurricane Maria: Assessment of an extreme event in Puerto Rico. Geol. Soc. Am. Today 2019, 29, 4–10. [Google Scholar]
  16. Meena, S.R.; Tavakkoli Piralilou, S. Comparison of earthquake-triggered landslide inventories: A case study of the 2015 Gorkha earthquake, Nepal. Geosciences 2019, 9, 437. [Google Scholar] [CrossRef] [Green Version]
  17. Devoli, G.; Jarsve, K.T.; Mongstad, H.H.J.; Sandboe, K.S.; Are, O. Control of Registered Mass-Movement Events and Determination of Quality Level; Report 31/2022; NVE: Oslo, Norway, 2020; 73p, Available online: https://publikasjoner.nve.no/rapport/2020/rapport2020_31.pdf (accessed on 1 May 2022).
  18. Herrera, G.; Mateos, R.M.; Garcia-Davalillo, J.C.; Grandjean, G.; Poyiadji, E.; Maftei, R.; Filipciuc, T.-C.; Auflič, M.J.; Jež, J.; Podolszki, L.; et al. Landslide databases in the Geological Surveys of Europe. Landslides 2018, 15, 359–379. [Google Scholar] [CrossRef]
  19. Steger, S.; Brenning, A.; Bell, R.; Glade, T. The influence of systematically incomplete shallow landslide inventories on statistical susceptibility models and suggestions for improvements. Landslides 2017, 14, 1767–1781. [Google Scholar] [CrossRef] [Green Version]
  20. Van Den Eeckhaut, M.; Hervás, J. State of the art of national landslide databases in Europe and their potential for assessing landslide susceptibility, hazard and risk. Geomorphology 2012, 139–140, 545–558. [Google Scholar] [CrossRef]
  21. Strickland, E. Big data comes to the forest. IEEE Spectr. 2014, 51, 11–12. [Google Scholar] [CrossRef] [Green Version]
  22. Arévalo, P.; Bullock, E.L.; Woodcock, C.E.; Olofsson, P. A Suite of Tools for Continuous Land Change Monitoring in Google Earth Engine. Front. Clim. 2020, 2, 26. [Google Scholar] [CrossRef]
  23. Prakash, N.; Manconi, A.; Loew, S. A new strategy to map landslides with a generalized convolutional neural network. Sci. Rep. 2021, 11, 1–15. [Google Scholar] [CrossRef]
  24. Tehrani, F.S.; Santinelli, G.; Herrera, M.H. Multi-Regional landslide detection using combined unsupervised and supervised machine learning. Geomat. Nat. Hazards Risk 2021, 12, 1015–1038. [Google Scholar] [CrossRef]
  25. Ghorbanzadeh, O.; Blaschke, T.; Gholamnia, K.; Meena, S.R.; Tiede, D.; Aryal, J. Evaluation of Different Machine Learning Methods and Deep-Learning Convolutional Neural Networks for Landslide Detection. Remote Sens. 2019, 11, 196. [Google Scholar] [CrossRef] [Green Version]
  26. Đurić, D.; Mladenović, A.; Pešić-Georgiadis, M.; Marjanović, M.; Abolmasov, B. Using multiresolution and multi-temporal satellite data for post-disaster landslide inventory in the Republic of Serbia. Landslides 2017, 14, 1467–1482. [Google Scholar] [CrossRef]
  27. Lindsay, E.; Frauenfelder, R.; Nava, L.; Furuseth, J.I.; Nordal, S. Applying ML-models for landslide detection on a northern, glacially-formed landscape: Jølster case study. Remote Sens. 2022. in preparation. [Google Scholar]
  28. Gorelick, N.; Hancher, M.; Dixon, M.; Ilyushchenko, S.; Thau, D.; Moore, R. Google Earth Engine: Planetary-scale geospatial analysis for everyone. Remote Sens. Environ. 2017, 202, 18–27. [Google Scholar] [CrossRef]
  29. Scheip, C.M.; Wegmann, K.W. HazMapper: A global open-source natural hazard mapping application in Google Earth Engine. Nat. Hazards Earth Syst. Sci. 2021, 21, 1495–1511. [Google Scholar] [CrossRef]
  30. Mondini, A.C.; Guzzetti, F.; Chang, K.-T.; Monserrat, O.; Martha, T.R.; Manconi, A. Landslide failures detection and mapping using Synthetic Aperture Radar: Past, present and future. Earth Sci. Rev. 2021, 216, 103574. [Google Scholar] [CrossRef]
  31. Handwerger, A.L.; Huang, M.-H.; Jones, S.Y.; Amatya, P.; Kerner, H.R.; Kirschbaum, D.B. Generating landslide density heatmaps for rapid detection using open-access satellite radar data in Google Earth Engine. Nat. Hazards Earth Syst. Sci. 2022, 22, 753–773. [Google Scholar] [CrossRef]
  32. Google Sentinel-1 Algorithms-Earth Engine-Google Developers. Available online: https://developers.google.com/earth-engine/guides/sentinel1 (accessed on 1 May 2022).
  33. Ochtyra, A.; Marcinkowska-Ochtyra, A.; Raczko, E. Threshold- and trend-based vegetation change monitoring algorithm based on the inter-annual multi-temporal normalized difference moisture index series: A case study of the Tatra Mountains. Remote Sens. Environ. 2020, 249, 112026. [Google Scholar] [CrossRef]
  34. Mondini, A.C.; Guzzetti, F.; Reichenbach, P.; Rossi, M.; Cardinali, M.; Ardizzone, F. Semi-automatic recognition and mapping of rainfall induced shallow landslides using optical satellite images. Remote Sens. Environ. 2011, 115, 1743–1757. [Google Scholar] [CrossRef]
  35. Di Martino, G.; di Simone, A.; Iodice, A.; Riccio, D.; Ruello, G. Assessing Performance of Multi-temporal SAR Image Despeckling Filters via a Benchmarking Tool. In Proceedings of the IGARSS 2020-2020 IEEE International Geoscience and Remote Sensing Symposium, Waikoloa, HI, USA, 26 September–2 October 2020; pp. 1536–1539. [Google Scholar]
  36. Ruther, D.; Hefre, H.; Rubensdotter, L. Extreme precipitation-induced landslide event on June 30, 2019 in Jølster, western Norway. Nor. J. Geol. 2022, submitted.
  37. Meteorologisk Institutt. Intense Byger Med Store Konsekvenser i Sogn og Fjordane 30. Juli 2019; Meteorologisk Institutt: Bergen, Norway, 2019.
  38. Løset, O. For Ett År Siden Gikk Det 30 Skred i Jølster, Førde Og Gloppen. Slik Ser Det Ut Nå. Available online: https://www.bt.no/nyheter/lokalt/i/K3OLk5/slik-ser-det-ut-ett-aar-etter-jordskredene (accessed on 1 May 2022).
  39. Olsen, L.; Sveian, H.; Bergstrøm, B.; Ottesen, D.; Rise, L. Quaternary Glaciations and Their Variations in Norway and on the Norwegian Continental Shelf. In Quaternary Geology of Norway; Olsen, L., Fredin, O., Olesen, O., Eds.; Norges Geologiske Undersøkelse: Trondheim, Norway, 2013; pp. 27–78. ISBN 0801-5961. [Google Scholar]
  40. Hughes, A.L.C.; Gyllencreutz, R.; Lohne, Ø.S.; Mangerud, J.; Svendsen, J.I. The last Eurasian ice sheets--a chronological database and time-slice reconstruction, DATED-1. Boreas 2016, 45, 1–45. [Google Scholar] [CrossRef]
  41. Norges Geologiske Undersøkelse. Bedrock. Available online: https://geo.ngu.no/kart/berggrunn_mobil/ (accessed on 1 May 2022).
  42. Norges Geologiske Undersøkelse. Løsmasser-Nasjonal Løsmassedatabase. Available online: http://geo.ngu.no/kart/losmasse_mobil/ (accessed on 1 May 2022).
  43. Wiesmann, A.; Wegmuller, U.; Honikel, M.; Strozzi, T.; Werner, C.L. Potential and Methodology of Satellite Based SAR for Hazard Mapping. In Proceedings of the IGARSS 2001. Scanning the Present and Resolving the Future, IEEE 2001 International Geoscience and Remote Sensing Symposium (Cat. No.01CH37217), Sydney, NSW, Australia, 9–13 July 2001; Volume 7, pp. 3262–3264. [Google Scholar]
  44. Eckerstorfer, M.; Malnes, E. Manual detection of snow avalanche debris using high-resolution Radarsat-2 SAR images. Cold Reg. Sci. Technol. 2015, 120, 205–218. [Google Scholar] [CrossRef]
  45. Vollrath, A.; Mullissa, A.; Reiche, J. Angular-Based Radiometric Slope Correction for Sentinel-1 on Google Earth Engine. Remote Sens. 2020, 12, 1867. [Google Scholar] [CrossRef]
  46. Mondini, A.; Santangelo, M.; Rocchetti, M.; Rossetto, E.; Manconi, A.; Monserrat, O. Sentinel-1 SAR Amplitude Imagery for Rapid Landslide Detection. Remote Sens. 2019, 11, 760. [Google Scholar] [CrossRef] [Green Version]
  47. Kellndorfer, J.; Flores-Anderson, A.I.; Herndon, K.E.; Thapa, R.B. Using SAR Data for Mapping Deforestation and Forest Degradation. In SAR Handbook: Comprehensive Methodologies for Forest Monitoring and Biomass Estimation; National Space Science and Technology Center: Hunstville, AL, USA, 2019; pp. 65–79. [Google Scholar]
  48. Mouginis-Mark, P. Effects of Surface Cover. Available online: http://satftp.soest.hawaii.edu/space/hawaii/vfts/kilauea/radar_ex/page4.html (accessed on 1 May 2022).
  49. Shibayama, T.; Yamaguchi, Y.; Yamada, H. Polarimetric Scattering Properties of Landslides in Forested Areas and the Dependence on the Local Incidence Angle. Remote Sens. 2015, 7, 15424–15442. [Google Scholar] [CrossRef] [Green Version]
  50. Claverie, M.; Ju, J.; Masek, J.G.; Dungan, J.L.; Vermote, E.F.; Roger, J.-C.; Skakun, S.V.; Justice, C. The Harmonized Landsat and Sentinel-2 surface reflectance data set. Remote Sens. Environ. 2018, 219, 145–161. [Google Scholar] [CrossRef]
  51. National Aeronautics and Space Administration. Quick Facts. Available online: https://nisar.jpl.nasa.gov/mission/quick-facts/ (accessed on 1 May 2022).
Figure 1. Historic landslide events in the former county of Sogn og Fjordane (now part of Vestland county), as registered in the Norwegian national landslide database (NLDB) on www.skredregistrering.no (accessed: 18 November 2019). Spatial bias is evident, as the events appear clustered along major roads, instead of being evenly distributed across susceptible areas (source: Norwegian Geological Survey, NGU). The location of the study area, Jølster, is shown with the red square.
Remotesensing 14 02301 g001
Figure 2. Approaches for creating bi-temporal and multi-temporal change detection images.
Remotesensing 14 02301 g002
Figure 3. Photo collage of the largest landslides in the study: (A) the fatal Årnes debris avalanche (length 850 m); (B) evidence of historic debris with avalanche deposits (buried humus layers) in the western-most eroded debris flow channel at Slåtten (NGU); (C) overview of the Slåtten debris flows (lengths between 850 and 1100 m); (D,E) the compound debris avalanche/flow at Vassenden (length 1500 m), in July 2019, and following remedial work in June 2020 (Source: Hallstein Dvergsdal/Firda Tidend, 2019, and Oddleif Løset/NRK, 2020, in [38], used with permission).
Remotesensing 14 02301 g003
Figure 4. Selection of photos of ‘shallow’ landslides triggered by the 30 July 2019 extreme precipitation event: (A) Novabakken overview on the northern side of Tindefjellet mountain; (B) superficial landslide deposits from landslide in thin soil; (CE) shallow landslides in the Svidalen valley with erosion of grass-bound topsoil and thin soil profiles, down to bedrock in places and superficial deposits; (F,G) small landslide scarps on Tindefjellet mountain, west of the main Vassenden landslide. These occurred at higher elevations, in areas with thin soil cover, and sparse vegetation. In many cases, the erosion is limited to grass-bound topsoil that has eroded right from bedrock, and only a thin layer of material is deposited over vegetation, partially covering but not burying it. The landslide naming system stems from the landslide inventory based on detailed field mapping [36].
Remotesensing 14 02301 g004
Figure 5. Study area showing landslides mapped with Sentinel-2 dNDVI images (orange polygons), registered landslides (triangles; source: NLDB, 18 December 2019), and ground-truth locations, including drone survey areas (shaded light blue) and helicopter and field visit GPS tracks (green and black dashed lines, respectively). Background: Sentinel-2 image.
Remotesensing 14 02301 g005
Figure 6. Left: Histogram showing size distribution of the landslides mapped with Sentinel-2 images. Right: Histogram and cumulative percentage, showing the shortest distance between a landslide to a road, for landslides mapped with Sentinel-2 images (n = 120), and landslides registered in the RegObs database for Jølster (n = 14), and Sogn og Fjordane county (n = 392, see Figure 1).
Remotesensing 14 02301 g006
Figure 7. Sentinel-2 dNDVI images of study area: (Top) S2-BT, a single set of pre- and post-event images; (Bottom) S2-MT, cloud-free greenest-pixel composite, created using Google Earth Engine, with all images from within one month before and after the landslide events. Black corresponds to areas with vegetation loss, i.e., negative NDVI.
Remotesensing 14 02301 g007
Figure 8. Sentinel-1 SAR RGB composite images of study area: (Top) S1-BT, a single set of pre- and post-event images; (Bottom) S1-MT, median composite, created using Google Earth Engine, with all images from within one month before and after the landslide events. Fresh landslide debris is characterised by an increase in backscatter in green. The numbered squares show the locations of subplots used in Figure 9—(A) Vassenden, (B) Slåtten, (C) Årnes, and (D) Tindefjellet.
Remotesensing 14 02301 g008
Figure 9. Comparison of landslide visibility in S2-BT, S2-MT S1-MT-VV, and S1-MT-VH images. Locations of subplots include (A) Vassenden, (B) Slåtten, (C) Årnes, and (D) Tindefjellet. The red markers show the locations of time-series data in Figure 10.
Remotesensing 14 02301 g009
Figure 11. Conceptual model showing how local incidence angle (LIA) affects the visibility of landslides in VV and VH polarisations.
Remotesensing 14 02301 g011
Table 1. Additional data used for pre-processing and geospatial analyses.
Data ID/Description/Source LinkSource
DTM, 10 m 6800_1 to 6800_4, accessed 10 August 2019, raster: https://hoydedata.no/LaserInnsyn/ Høydedata
Registered landslides‘Skredhendelser’, accessed 18 November 2019, point data with attributes: https://nedlasting.nve.no/gis/ NVE, RegObs
Roads‘Vbase’, accessed 10 August 2019, polyline data: https://kartkatalog.geonorge.no/ NMA
DTM—digital terrain map. NVE—Norwegian Directorate of Water and Energy. NMA—Norwegian Mapping Authority.
Table 2. The four change detection image composites used for manual landslide detection.
ImageValuePre-Image DatesPost-Image Dates
S2-BTNDVI28.07.201902.02.2019
S2-MTMax NDVI01.07.2019–29.07.2019
(n = 12)
31.07.2019–30.08.2019
(n = 12)
S1-BTVV & VH25.07.201931.07.2019
S1-MTMean VV & mean VH01.07.2019–29.07.2019
(n = 25)
31.07.2019–30.08.2019
(n = 27)
Sentinel-2 (S2), Sentinel-1 (S2), bi-temporal (BT), multi-temporal stack (MT), normalised difference vegetation index (NDVI), vertical–vertical polarisation (VV), vertical–horizontal polarisation (VH).
Table 3. Results of landslide detection using the S1-BT and S1-MT images, with respect to the 120 landslides mapped with the S2-BT image.
Set:1—Undetectable 2—Detectable with Prior Knowledge3—Detectable without Prior Knowledge
S1-BT11154
S1-MT684111
Table 4. Mean, standard deviation, and difference in means, from the data shown in Figure 10.
LandslideTindefjellet Vassenden
Polarisation VHVVVH VV
Surface TypeVeg.Landslide Veg.Landslide Veg.LandslideVeg. Landslide
Mean −20.7−14.0−11.0−5.0−14.3−12.9−7.0−5.0
std. dev2.21.63.42.42.32.81.33.5
Diff. Mean6.76.01.42.1
Publisher’s Note: MDPI stays neutral with regard to jurisdictional claims in published maps and institutional affiliations.

