
Signal-to-Noise Ratio Analyses of Spaceborne GNSS-Reflectometry from Galileo and BeiDou Satellites


1
GNSS Research Center, Wuhan University, Wuhan 430079, China
2
School of Marine Science and Technology, Tianjin University, Tianjin 300072, China
3
College of Geology Engineering and Geomantic, Chang’an University, Xi’an 710054, China
4
Institute of Space Sciences (ICE-CSIC), 08193 Barcelona, Spain
5
Institut d’Estudis Espacials de Catalunya (IEEC), 08034 Barcelona, Spain
*
Author to whom correspondence should be addressed.
Remote Sens. 2022, 14(1), 35; https://doi.org/10.3390/rs14010035
Submission received: 15 November 2021
/
Revised: 16 December 2021
/
Accepted: 18 December 2021
/
Published: 22 December 2021
(This article belongs to the Special Issue Applications of GNSS Reflectometry for Earth Observation II)
Abstract
:In recent years, Global Navigation Satellite System Reflectometry (GNSS-R) technology has made considerable progress with the increasing of GNSS-R satellites in orbit, the improvements of GNSS-R data processing technology, and the expansion of its geophysical applications. Meanwhile, with the modernization and evolution of GNSS systems, more signal sources and signal modulation modes are available. The effective use of the signals at different frequencies or from new GNSS systems can improve the accuracy, reliability, and resolution of the GNSS-R data products. This paper analyses the signal-to-noise ratio (SNR) of the GNSS-R measurements from Galileo and BeiDou-3 (BDS-3) systems, which is one of the important indicators to measure the quality of GNSS-R data. The multi-GNSS (GPS, Galileo and BDS-3) complex waveform products generated from the raw intermediate frequency data from TechDemoSat-1 (TDS-1) satellite and Cyclone Global Navigation Satellite System (CYGNSS) constellation are used for such analyses. The SNR and normalized SNR (NSNR) of the reflected signals from Galileo and BDS-3 satellites are compared to these from GPS. Preliminary results show that the GNSS-R SNRs from Galileo and BDS-3 are ∼1–2 dB lower than the GNSS-R measurements from GPS, which could be due to the power of the transmitted power and the bandwidth of the receiver. In addition, the effect of coherent integration time on GNSS-R SNR is also assessed for different GNSS signals. It is shown that the SNR of the reflected signals can be improved by using longer coherent integration time (∼0.4–0.8 dB with 2 ms coherent integration and ∼0.6–1.2 dB with 4 ms coherent integration). In addition, it is also shown that the SNR can be improved more efficiently (∼0.2–0.4 dB) for reflected BDS-3 and Galileo signals than for GPS. These results can provide useful references for the design of future spaceborne GNSS-R instrument compatible with reflections from multi-GNSS constellations.
1. Introduction
Global navigation satellite system reflectometry (GNSS-R) is a L-band bistatic radar technique to retrieve geophysical parameters by receiving GNSS signals reflected from the earth’s surface. The use of reflected GNSS signals for sensing the Earth’s surface was proposed in [1,2]. With the technological innovations of receiving platform and transmitting platform, GNSS-R has developed continuously. At the part of receiving platform, after some successful ground-based [3,4] and airborne platform [5,6] experiments, spaceborne GNSS-R satellite missions have been launched one after another. The feasibility of GNSS-R at Low Earth Orbit (LEO) is firstly verified on UK Disaster Monitoring Constellation (UK-DMC) mission developed by Surrey Satellite Technology Ltd (Surrey Research Park Guildford, Surrey GU2 7YE, UK). [7]. TechDemoSat-1 (TDS-1) [8] and Cyclone Global Navigation Satellite System (CYGNSS) [9], which provide vast amounts of GNSS-R data, pushed the spaceborne GNSS-R to a new stage. The retrievals of a broad spectrum of geophysical parameters over ocean [10], land [11], cryosphere [12] have been attempted, which greatly expands the application of spaceborne GNSS-R. In addition, BuFeng-1 (BF-1) A/B constellation [13], Spire GNSS-R satellites [14], Federated Satellite System Scatterometer (FSSCat) mission [15], Fengyun-3E satellite [16] and Dot-1 satellite [17] are all already in orbit for GNSS-R earth observation. These spaceborne missions make the GNSS-R advantages (low power, low cost, fast revisit, synchronous measurement, and high spatial sampling capability) further displayed on the spaceborne platform.
Meanwhile, continuous evolution of GNSS constellations can also provide new opportunities for future GNSS-R systems. In addition to the modernization of GPS system, Beidou and Galileo satellites, as latecomers, are also providing global services with new civil signals with the binary offset carrier (BOC) modulation. BeiDou Global Navigation Satellite System (BDS-3) constellation is composed of 30 satellites, including 3 geosynchronous equatorial orbit (GEO) satellites, 3 inclined geosynchronous orbit (IGSO) satellites and 24 medium earth orbit (MEO) satellites [18]. So far, the operating Galileo satellite number has been increased to 26 and there are 20 available Full Operational Capability (FOC) satellites. The full constellation with 30 satellites is expected to be realized in the future [19,20]. In total, the increase in the number of GNSS satellites provides more signal sources for GNSS-R, and thus can further improve by folding the spatial-temporal sampling efficiency of the GNSS-R systems. In principle, reflected signals from Galileo and BDS-3 can also be used for different GNSS-R applications by their nature. However, the signal modulations and signal transmission powers of BDS-3 and Galileo satellite are different from GPS, resulting in different signal-to-noise ratio (SNR) of the GNSS-R measurements. As the SNR of the GNSS-R measurements can determine the minimum resolvable change in GNSS-R observations (waveform or DDM) and thus the geophysical retrieval performance, it needs to be further studied whether these new reflected signals from BDS-3 and Galileo could be received with sufficient SNR.
At present, the open access data products of spaceborne GNSS-R missions can only provide the GNSS-R observations measured from reflected GPS signals. Fortunately, both TDS-1 and CYGNSS have been collecting raw IF (Intermediate Frequency) signals occasionally to fully explore the potentials of spaceborne GNSS-R technique. These raw IF signal data sets are signal samples before any demodulation and down-linked directly to the ground station, and thus include the direct and reflected signals from all visible GNSS satellites within the receiver bandwidth. These raw IF signal data sets have been processed on ground by Institut d’Estudis Espacials de Catalunya (IEEC) with its software defined GNSS-R instrument, and the main data products, i.e., the complex waveforms of the reflected signal, are publicly available through IEEC’s GPS Open Loop Differential Real-Time Receiver (GOLD-RTR) data server [21,22]. This paper makes use of the complex waveform products from GPS, Galileo and BDS-3 satellites available through the GOLD-RTR server, and mainly focuses on the comparison of the GNSS-R measurements SNR from different GNSS systems. The rest of this paper is organized as follows: Section 2 introduces the employed datasets, processing of complex waveform and quality control. the statistic results of signal-to-noise and normalized-SNR from different GNSS systems are shown in Section 3. Finally, we conclude and discuss our work in Section 4.
2. Dataset and Processing
2.1. Dateset
Both the TDS-1 satellite and the CYGNSS constellation are designed to observe near surface wind speed over the ocean, and the main data products (Level 1 and L1 product) are the delay-Doppler map (DDM) of the forward scattered power of the GPS signal. In addition to the Level 1 data products, the TDS-1 and CYGNSS instruments also record the raw IF signal samples of the direct and reflected signals. The raw IF data are obtained under raw acquisition mode when the receiver aboard only down-converts and samples the antennas’ voltages without any tracking or demodulation of the transmitted signal structure. Each raw IF data consists of raw signal sample streams (30–90 s) received by the zenith and nadir antennas. The bandwidth of the GNSS-R receivers are 2.5 to 4.2 MHz, which can cover the main components of the Galileo E1 B/C signal [23] and the BDS-3 B1C signal [24].
These raw IF data sets have been processed by software receivers on ground by IEEC, from which different new geophysical applications have been attempted [12,25,26]. In [25,26], the processing procedures of the raw IF data are explained in details. The data products “Complex Waveform Product” is used in this study, which can be obtained from IEEC GOLD-RTR server (https://www.ice.csic.es/gold_rtr_mining/, accessed on 12 Octorber 2021). Basically, the complex waveform of the reflected signal is generated by cross-correlating the reflected signal with the local code replicas, which is operated by software receiver in the ground. The cross-correlation process can be expressed as:
in which is the complex waveform of reflected signal; denotes the coherent integration time and here is set to 1ms; is the raw IF signal samples from nadir antennas; is the local code; is the modulated navigation data bit or the secondary code; is the code phase of the local generated code replicas, is the time delay between the direct and reflected signals, and are the frequency and phase of the local generated carrier replica. The code phase, carrier frequency and phase of the local replicas are computed from the direct signal processing results and the bistatic geometry.
The Complex Waveform Product of IEEC GOLD-RTR includes the in-phase and quadrature component reflect signal. Currently, the products at receiver module includes two GNSS-R constellations: TDS-1 and CYGNSS, while three navigation systems at transmitter module: GPS L1 C/A, Galileo E1B/E1C and BDS-3 B1C. Therefore, there are six types of data including CYGNSS-GPS, CYGNSS-Galileo, CYGNSS-BDS, TDS-GPS, TDS-Galileo and TDS-BDS. It is noted that both the Galileo E1 B/C signals and the BDS-3 B1C signals consist of a data component and a pilot component modulated by the navigation data bits and the secondary code [23,24]. The reflected complex waveforms from these two signal components (data and pilot) are combined together coherently after the compensations of the navigation data bits and the secondary codes extracted from the direct signal processing.
The main objective of this work is to analyse the SNRs of the reflected signal from different GNSS systems, which also depend on different receiver, geometrical and reflected surface features. As the power of the reflected signals from the land surface depend on different land surface parameters (e.g., land topography, vegetation and soil moisture), which are difficult to be characterized accurately, only the reflected signals from the ocean are used in this study. The TDS-1 raw IF datasets used in this study were collected between September 2014 to March 2019, and the CYGNSS raw IF data sets used in this study is collected between September 2017 to September 2020. The raw IF data collection periods from TDS-1 and CYGNSS are presented in Figure 1 together with the evolutions of the Galileo and BDS-3 constellations.
In addition to the Galileo and BDS-3 complex waveforms products, the other available CYGNSS and TDS-1 data products are also used in the analysis, such as CYGNSS Level-1 v2.1 products from PODAAC [27] (https://podaac-opendap.jpl.nasa.gov/opendap/allData/cygnss/L1/v2.1, 2 Octorber 2021), TDS-1 Level-1B products [28] from MERRByS (ftp.merrbys.co.uk/Data/L1B/, 10 Octorber 2021), and the antenna patterns of the TDS-1 and CYGSNS science antennas. In addition, the sea surface wind speeds measurements are collected from the European Centre for Medium-range Weather Forecast/Copernicus Climate Change Service (ECMWF/C3S) ERA-5 (ECMWF Reanalysis 5th Generation) data [29] with spatial resolution and 1 h on time resolution. And the co-located wind speed measurements along each complex waveform tracks can be interpolated from the ERA-5 data.
2.2. Processing of the Complex Waveforms
2.2.1. Coherent and Incoherent Integrations
The complex waveform of the reflected signal provided in the GOLD-RTR server is generated with a fixed coherent integration time of 1 ms. To improve the SNR and reduce the speckle noise, these 1-ms integrated complex waveforms can be integrated coherently with longer integration times by:
in which ms is the coherent integration time of the original GOLD-RTR complex waveforms, is the number of complex waveforms integrated coherently in post-processing.
The coherently integrated waveforms need to be averaged incoherently to reduce the speckle noise by
in which is the number of incoherent average, and is the coherent integration time of the post-processed complex waveforms, i.e., . In addition, the incoherent average time can be also computed by
In this study, three types of integration strategies are used in the post-processing of the complex waveforms:
- Case 1:, ; , and
- Case 2:, ; , and
- Case 3:, ; , and
Figure 2 shows an example of the GPS L1 C/A, Galileo E1 B/C and BDS-3 B1C normalized power waveforms over the ocean. The waveform is generated from the CYGNSS raw IF data collected over the Gulf of Mexico on 11 October 2018. To better demonstrate the shape of the power waveforms, a longer incoherent average time of is used. The wind speeds correspond to the positions of the specular points and at the power waveform generation epoch are 5.2 m/s, 2.1 m/s and 4.5 m/s for the GPS, Galileo and BDS-3 waveforms, respectively.
It can be seen that the power waveforms from GPS, Galileo and BDS-3 show a similar shape with clear trailing edge due to the roughness of the sea surface. Moreover, the waveforms of Galileo E1 B/C and BDS-3 B1C show narrower main-lobe width and two side-lobes comparing to the GPS L1 C/A, which is mainly due to the auto-correlation features of the BOC modulation.
2.2.2. Signal-to-Noise (SNR) and Normalized-SNR (NSNR)
Here, we use the Peak-SNR of the averaged power waveform to evaluate the GNSS-R measurements from different GNSS constellations, which is defined as:
where is the peak value of the incoherently averaged power waveforms, and is the thermal noise floor computed by averaging the first 100 delay bins of the power waveforms.
For GNSS-R ocean scatterometry, the total reflected echo is a sum of the reflected signals from all the surface facets within the glistening zone. And the DDM of the scattered power is normally the basic product containing geophysical information of reflecting surface. A theoretical model of the DDM of the reflected GNSS signal has been previously derived by Zavorotny and Voronovich [30]:
in which D is the glistening zone over the sea surface, is the spatial coordinate of each sea surface facet in D, is the transmitted power, and are the transmitter and receiver antenna gains, and are the ranges between the sea surface point and the GNSS satellite and receiver, respectively, is the sea surface normalized bistatic radar cross section (NBRCS), and are the components of the Woodward Ambiguity Function (WAF) or spreading functions in delay (Autocorrelation function (ACF) of the pseudorandom noise (PRN) code ) and Doppler frequency (sinc function ).
According to Equation (5), the power of the reflected signal depends on different parameters, including the transmitted power, the receiver antenna gain, the bistatic free space path loss, the surface bistatic radar cross section (BRCS), and the auto-correlation properties of the GNSS signal. To make a proper comparison of the GNSS-R measurements SNR from different GNSS constellations (GPS, Galileo and BDS-3), the effects due to the receiver antenna gain, the free space path loss and the surface BRCS should be removed. Based on this consideration, a similar parameter to [11], known as the Normalized-SNR (NSNR), is introduced to this study
where the is peak SNR in dB, is the receiver antenna gain towards the specular point direction, is the distance between the transmitter and the specular reflection point, is the distance between the specular reflection point and the receiver. Note that the effect of the surface BRCS on the reflected power is still included in the NSNR (or the sea surface condition), which should be considered in the following analyses.
2.2.3. Quality Control and Col-Location
In order to get more reliable statistical analyses, the following pre-processing and data quality control steps are applied:
- (1)
- Spaceborne GNSS-R receiver antenna gain in the specular direction >3 dBi;The Complex Waveform Product does not provide receiver antenna gain towards the specular point direction, but only the positions of the transmitter, receiver and specular point. As a result, we need to calculate the antenna gain. In this study, the attitude information of GNSS-R satellite, which is provided by CYGNSS L1 and TDS-1 L1b with a three-element array corresponding to: Roll angle, Pitch angle, Yaw angle, were applied. Moreover, the antenna pattern map and the position of receiver and specular point are also used to calculate the antenna gain. The detailed calculation process is given in [28]. The 3 dB threshold is set to remove the samples with low antenna gain, which is also normally applied in different ocean wind speed retrieval algorithms and products.
- (2)
- The Range Corrected Gain (RCG) ;According to [27], the RCG is can be computed by:in which denotes the receiver antenna gain in the specular direction; and are the transmitter and receiver ranges from the specular point, respectively. The RCG is an improved definition of gain, which considers both the effect of the receiver antenna and the effect of the attenuation due to range losses. is to mitigate the effect of noise.
- (3)
- The TDS-1 is in a quasi-Sun synchronous orbit with an inclination of 98.4. To remove strong coherent reflections from sea ice, the data of TDS-1 has been filtered by only keeping specular point latitude between 55 degrees South and 55 degrees North.
- (4)
- For the CYGNSS measurements, the blackbody calibration is performed every 60 s, when the instrument is connected to the internal load instead of the science antennas. During the blackbody calibration, there is no valid reflected signal in the raw IF data sets. However, there is no flag in the “Complex Waveform Product” indicating the blackbody calibration measurements. Here in this study, the complex waveforms are synchronized to the standard Level 1 DDM products by using the GPS time variable, so that the complex waveforms generated during the period flagged by the “black_body_ddm” of variable “quality_flags” can be removed.
By applying the data filtering and quality control, Figure 3 (bottom) shows all the tracks of the specular point used in the analysis, which there are 42,703 valid 1-s power waveform measurements generated from the complex waveforms product.
From Equations (5) and (6), it can also be seen that the SNR of the reflected signal, both absolute and normalized, is sensitive to the surface NBRCS, which is a function of the wind speed. Indeed, such dependence is the theoretical basis for GNSS-R sea surface wind retrieval. As the main objective of this work is to compare the SNR of the reflected signals from different GNSS systems, the effects of the wind speed on the SNR should be also taken into account. In this study, the complex waveform data sets are divided into groups following the collocated wind speed measurements from ERA-5 data. Table 1 shows the number of samples co-located with ERA-5 wind speed, within windows of 2 m/s. It is noteworthy that the cell of CYGNSS-Galileo & [30,32) is one sample which considered no statistical significance. So, we don’t discuss this cell below.
3. Results and Analysis
To compare the SNR of the GNSS-R measurements from different GNSS systems, the probability density functions (PDFs) and average values of the SNR are computed and compared in this paper. The comparison of multi-GNSS are presented for both SNR and Normalized SNR. In addition, the impacts of the coherent integration time on the SNR are also analysed.
3.1. SNR
3.1.1. Comparison between TDS-1 and CYGNSS
Figure 4 shows the PDF of the SNR of reflected signal with 1ms coherent integration. The SNR of the reflected signal measured by TDS-1 are overall lower than these from CYGNSS, no matter the reflected signal comes from GPS, Galileo or BDS-3. The line of TDS-GPS is on the left of CYGNSS-GPS. And it is the same as TDS-Galileo and CYGNSS-Galileo, TDS-BDS and CYGNSS-BDS. Such differences are shown more clearly in Figure 5, which the mean SNR of the reflected signals at different wind speeds are compared directly. It is clearly shown that the mean SNRs of TDS-1 GNSS-R measurements is ∼2–4 dB lower than those from the CYGNSS. There are two possible reasons for such differences:
- (1)
- Receiver orbit altitude. The altitude of TDS-1 is 635 km while CYGNSS is 510 km [27]. Clearly, term of in the Equation (5) for TDS-1 is larger than for CYGNSS, which result in lower SNR from TDS-1 than from CYGNSS. The loss of propagation path caused by orbit altitude is one of the factors to be considered in future spaceborne GNSS-R missions.
- (2)
- Receiver antenna gain toward specular point. TDS-1 has a nadir-pointing antenna with a peak gain of 13.3 dBi, while CYGNSS has two nadir antennas (port and starboard) with the peak gain of 14 dBi. Figure 6 (Top-left and Top-right) show the mean of antenna gain at different wind speed batches from TDS-1 and CYGNSS respectively. It is clearly shown that the antenna gain of TDS-1 is lower than CYGNSS for most of the GNSS-R measurements.
In addition, the RCG is a parameter that combines range losses and receiver antenna gain. The mean of RCG at different wind speed batches from TDS-1 and CYGNSS is also presented in Figure 6 (Bottom-left and Bottom-right). Similar to antenna gain, the TDS-1 (Filled circle) is also lower than CYGNSS (triangle symbols) under the same color.
3.1.2. Comparison between GPS, Galileo and BDS-3
The SNRs of GNSS-R measurements from different GNSS systems also show clear differences. The comparison of SNR from different GNSS system is also shown in Figure 4 and Figure 5. The SNR of TDS-BDS and CYGNSS-BDS are all on the left-most in Figure 4 and bottom-most in Figure 5, which indicates that the SNR of BDS-3 is lower than GPS and Galileo when receiving with the same GNSS-R receiver. By contrast, the SNRs of the reflected signals from GPS satellites are higher than these from the other two GNSS systems. Besides, there are also other factors influence the SNR, such as antenna gain error caused by attitude error, sometimes ERA5 wind speed not accurate in measuring surface roughness and thermal noise of instrument. But we think these factors have the similar impacts to the statistics of different GNSS signals.
3.2. Normalized SNR
There are also some other reason that influence the SNR except for analysis in Section 3.1.1, such as the receiver antenna gain and the free space path loss. According to Equation (6), Normalized SNR can remove both the influence of the receiver antenna and the orbit altitude of receiver and transmitter, and thus can be used to indicate the potential quality of the GNSS-R measurements from different GNSS constellations.
In a similar way as in Section 3.1, the PDFs and mean NSNRs are presented in Figure 7 and Figure 8, from which the following aspects are noted:
- (1)
- (2)
- The NSNR of the reflected signals from Galileo is similar to that from GPS for TDS-1 but ∼1–2 dB lower for CYGNSS. As mentioned in the [31], this may be due to the bandwidths of the receivers onboard the TDS-1 and CYGNSS satellites. The receiver bandwidth for TDS-1 is ∼4.2 MHz, which can cover the main components of the Galileo E1 B/C signals. While the receiver bandwidth for CYGNSS is only ∼2.5 MHz, which can induce a significant power loss (∼0.7 dB) of the received Galileo E1 B/C signals.
- (3)
- The NSNR of the reflected signals from BDS-3 is much lower (∼4 dB) than these from GPS and Galileo for the TDS-1 case except for most of the points. However, the BDS-3 measurements show similar NSNRs with Galileo for the CYGNSS case. The main reason could be the evolution of the BDS-3 constellation. As shown in Figure 1, most of the BDS-3 GNSS-R measurements from TDS-1 were collected during the beginning of the construction of the BDS-3 system, when the BDS-3 satellites can transmit less power just for testing purpose. While most of the BDS-3 GNSS-R measurements from CYGNSS were collected during the experimental operational to fully operational stages of the BDS-3 system, when the BDS-3 satellites can transmit the navigation signals at their nominal power levels.
3.3. Coherent Integration Time
For the spaceborne case, the coherence time of the reflected signal mainly depends on the geometry and the bandwidth of the transmitted signal. For Galileo and BDS-3 systems, the E1 B/C and B1C signal’s bandwidth are longer than that of the GPS L1 C/A code, and thus the coherence time of the reflected signals should be longer due to the smaller footprint size and narrow Doppler bandwidth.
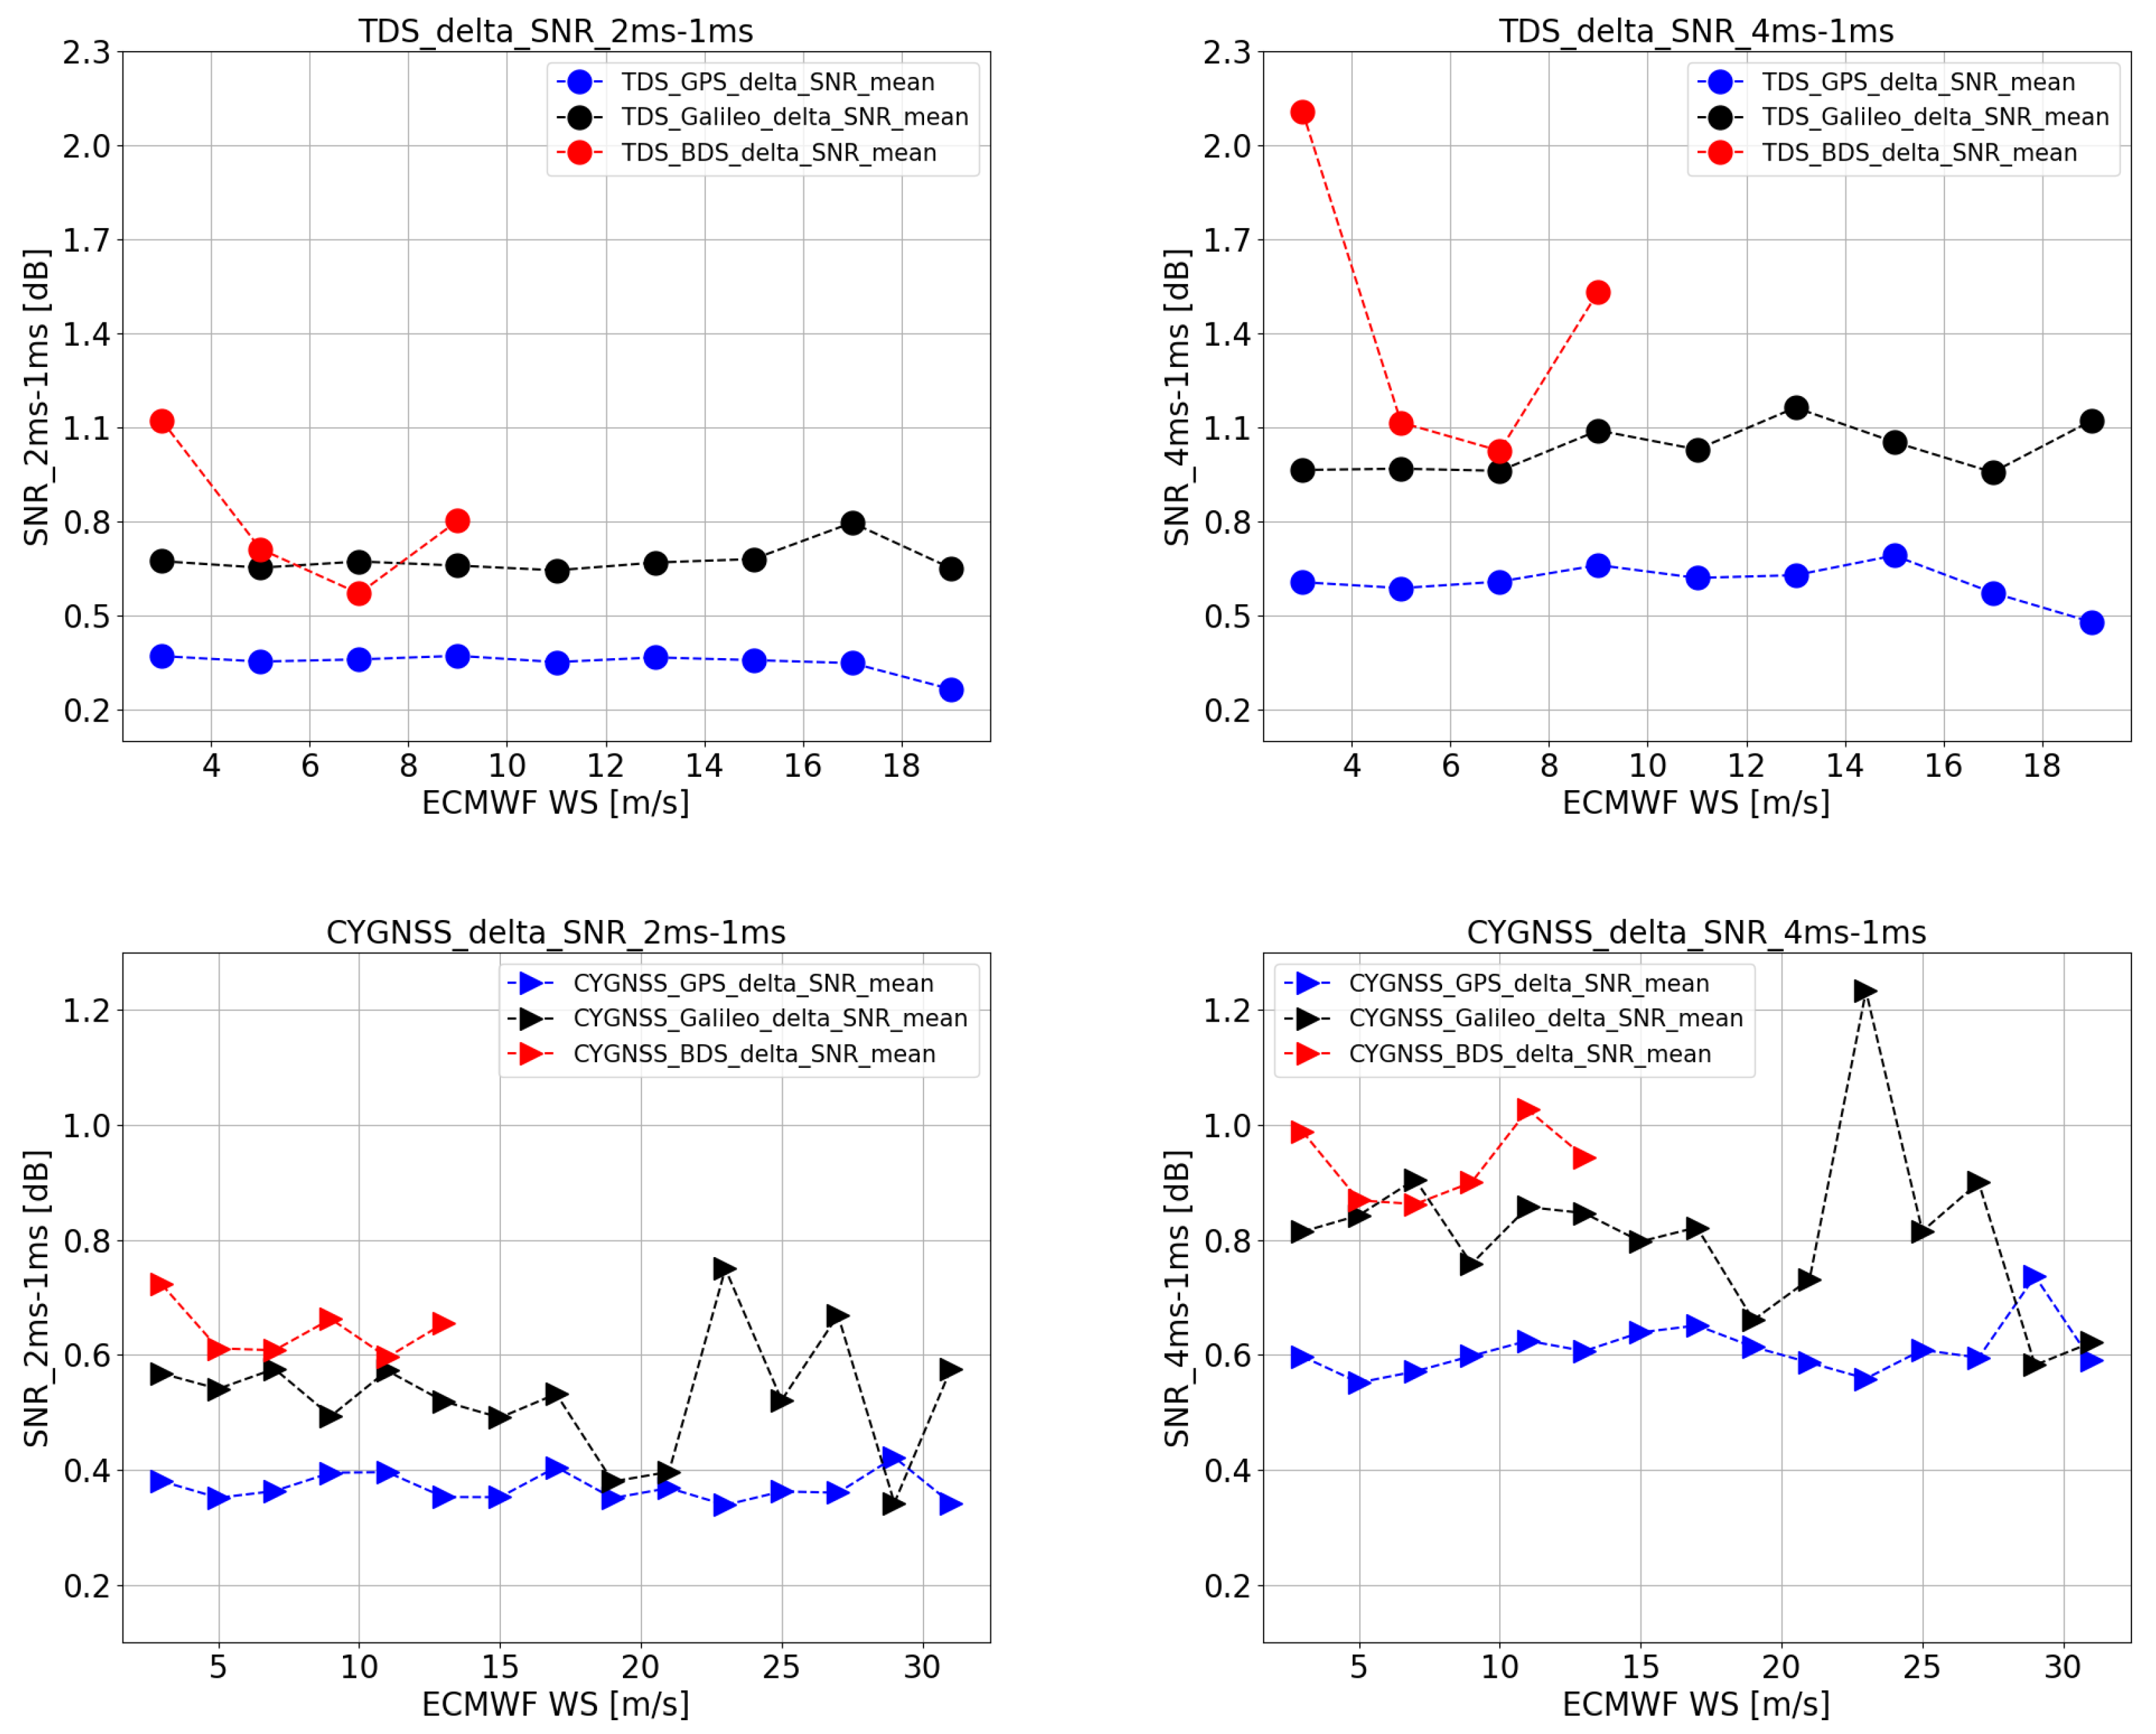
In order to evaluate the SNR improvements for the reflected GNSS signals with longer coherent integration times, a parameter, , is defined
In this work, we use the SNR with 1 ms coherent integration time as a reference, which is compared to the SNR with coherent integration times of 2 ms and 4 ms. Figure 9 show the the SNR improvements and for the reflected signals from GPS, Galileo and BDS-3, respectively. The following aspects are remarkable from Figure 9.
- (1)
- (2)
- Similar SNR improvements can be seen for GPS L1 C/A signal for TDS-1 and CYGNSS, i.e., ∼0.4 dB improvement from 1 ms to 2 ms and ∼0.6 dB improvement from 1 ms to 4 ms.
- (3)
- The increasing of the coherent integration time has different effects on different GNSS signals. The SNR of the reflected signal can be improved more efficiently for Galileo and BDS-3 than for GPS. The SNR improvement for BDS-3 B1C signal and Galileo E1 B/C signal is ∼0.6–0.8 dB with 2 ms coherent integration time and is ∼0.8–1.2 dB with 4 ms coherent integration time (except for some outliers), which is ∼0.3–0.5 dB higher than for GPS L1 C/A code signal. It is mainly due to the relative narrower Doppler bandwidth of the reflected BDS-3 and Galileo E1 B/C signals.
- (4)
- The SNR improvements of Galileo and BDS-3 signals are more significant for TDS-1 than for CYGNSS (e.g., ∼0.8 dB for CYGNSS-Galileo and ∼1.0 dB for TDS-Galileo), which is also mainly due to the wider receiver bandwidth of the TDS-1 instrument.
4. Conclusions
In this paper, we analyze the quality indicator, i.e., the SNR, of the reflected signals from different GNSS constellations. The main objective of this study is to characterize if the reflected signal from the other GNSS systems, e.g., Galileo and BDS-3, can be received with enough SNR with the current GNSS-R instrument configurations.
By using the complex waveform products processed on-ground from the TDS-1 and CYGNSS raw IF sample data, 42,703 GNSS-R power waveforms are extracted from ocean reflected GPS, Galileo and BDS-3 signals. The SNR and normalized SNR are compared among different GNSS systems at different wind speeds. It is clearly shown that the reflected signal from Galileo and BDS-3 satellites show a overall lower SNR (2–4 dB) comparing to that from GPS satellites, which could be mainly due to the effective isotropic radiated power (EIRP) of the transmitted signals. In addition, it is also shown that the SNR of the reflected signal from BDS-3 satellites has been significantly improved during the system construction stage, which is evidenced by the fact that the SNR of reflected BDS-3 signal received by the CYGNSS constellation is much higher than that received by TDS-1.
To assess the SNR improvements by increasing the coherent integration time, the SNR of the reflected signal with different coherent integration times of 1 ms, 2 ms and 4 ms are compared for different GNSS systems. It is shown that the SNR can be improved more efficiently (∼0.2–0.4 dB) for reflected BDS-3 and Galileo signals than for GPS, which is mainly due to the narrower Doppler bandwidth and longer coherent time of the reflected BDS-3 and Galileo signals. Such improvement can compensate the most of part of the SNR degradation due to the EIRP of the transmitted signals. It is suggested that the receiver bandwidth and the receiver processing chain should be further optimized in future spaceborne GNSS-R missions compatible with reflected signals from multi-GNSS constellations.
Author Contributions
Conceptualization, W.L.; methodology, Y.N., W.L., S.Y. and J.L.; software, Y.N., W.L. and B.G.; validation, Y.N., W.L. and B.G.; formal analysis, Y.N. and B.G.; investigation, Y.N., W.L. and B.G.; data curation, Y.N., B.G. and W.L.; writing—original draft preparation, Y.N. and S.Y.; writing—review and editing, W.L., B.G., Y.N. and S.Z.; visualization, Y.N.; supervision, S.Y., J.L. and W.L.; funding acquisition, S.Y., S.Z. and Y.N. All authors have read and agreed to the published version of the manuscript.
Funding
This work of Yang Nan and Shirong Ye Jingnan Liu was supported in part by a grant from the National Natural Science Foundation of China (No. 41974031). This work of Weiqiang Li was supported by the Spanish Ministry of Science, Innovation and Universities through the Ramón y Cajal Program (No. RYC2019-027000-I). This work of Shuangcheng Zhang was supported in part by a grant from the National Natural Science Foundation of China (No. 42074041). This work of Yang Nan was supported in part by the China Scholarship Council (CSC) through a State Scholarship Fund (No.201906270212).
Institutional Review Board Statement
Not applicable.
Informed Consent Statement
Not applicable.
Data Availability Statement
Not applicable.
Acknowledgments
The authors would like to thank the ICE-CSIC/IEEC (Institute of Space Sciences (ICE, CSIC), Barcelona, Spain,) for dataset of GLOD-RTR. The authors are also grateful to the Cyclone Global Navigation Satellite System (CYGNSS) team for making the Level1 (L1) data publicly available through the NASA’s Physical Oceanography Distributed Active Archive Center. The authors would like to thank CYGNSS science team for providing the CYGNSS antenna pattern. W. Li are the members of the CYGNSS mission’s extended science team. The authors are grateful to the TDS-1 Team at SSTL (Surrey Satellite Technology Ltd., Surrey Satellite Technology Limited Tycho House 20 Stephenson Road Surrey Research Park Guildford GU2 7YE United Kingdom) for making the TDS-1 L1 data and antenna pattern publicly available. ERA-5 data were generated using Copernicus Climate Change Service Information [2019] neither the European Commission nor ECMWF is responsible for any use that may be made of the Copernicus Information or Data it contains.
Conflicts of Interest
The authors declare no conflict of interest. The funders had no role in the design of the study; in the collection, analyses, or interpretation of data; in the writing of the manuscript, or in the decision to publish the results.
Abbreviations
The following abbreviations are used in this manuscript:
| ACF | Autocorrelation Function |
| BDS | BeiDou Global Navigation Satellite System |
| BF-1 | BuFeng-1 |
| BOC | Binary Offset Carrier |
| BRCS | Bistatic Radar Cross Section |
| CYGNSS | Cyclone Global Navigation Satellite System |
| DDM | Delay Doppler Map |
| ECMWF | European Centre for Medium-range Weather Forecast |
| EIRP | Effective Isotropic Radiated Power |
| ERA-5 | ECMWF Reanalysis 5th Generation |
| ECMWF/C3S | ECMWF/Copernicus Climate Change Service |
| FOC | Full Operational Capability |
| FSSCAT | Federated Satellite System Scatterometer |
| Galileo | Galileo Satellite Navigation System |
| GEO | Geosynchronous Equatorial Orbit |
| GNSS | Global Navigation Satellite System |
| GNSS-R | GNSS Reflectometry |
| GOLD-RTR | GPS Open Loop Differential Real-Time Receiver |
| GPS | Global Positioning System |
| IEEC | Institut d’Estudis Espacials de Catalunya |
| IF | Intermediate Frequency |
| IGSO | Inclined Geosynchronous Orbit |
| LEO | Low Earth Orbit |
| MEO | Medium Earth Orbit |
| MERRByS | Measurement of Earth Reflected Radio-navigation signals By Satellite |
| NASA | National Aeronautics and Space Administration |
| NBRCS | Normalized Bistatic Radar Cross Section |
| NSNR | Normalized SNR |
| NWP | Numerical Weather Prediction |
| PODAAC | NASA’s Physical Oceanography Distributed Active Archive Center |
| PDFs | Probability Density Functions |
| PRN | Pseudorandom Noise |
| QC | Quality Control |
| RCG | Range Corrected Gain |
| SGR-ReSI | Space GNSS Receiver-Remote Sensing Instrument |
| SNR | Signal-to-Noise Ratio |
| TDS-1 | UK TechDemoSat-1 |
| UK-DMC | UK Disaster Monitoring Constellation |
| WAF | Woodward Ambiguity Function |
References
- Hall, C.D.; Cordey, R.A. Multistatic scatterometry. In Proceedings of the International Geoscience and Remote Sensing Symposium, ‘Remote Sensing: Moving Toward the 21st Century’, Edinburgh, UK, 12–16 September 1988; pp. 561–562. [Google Scholar] [CrossRef]
- Martin-Neira, M. A passive reflectometry and interferometry system (PARIS): Application to ocean altimetry. ESA J. 1993, 17, 331–355. [Google Scholar]
- Martin-Neira, M.; Caparrini, M.; Font-Rossello, J.; Lannelongue, S.; Vallmitjana, C.S. The paris concept: An experimental demonstration of sea surface altimetry using gps reflected signals. IEEE Trans. Geosci. Remote Sens. 2001, 39, 142–150. [Google Scholar] [CrossRef] [Green Version]
- Treuhaft, R.N.; Lowe, S.T.; Zuffada, C.; Chao, Y. 2-cm gps altimetry over crater lake. Geophys. Res. Lett. 2001, 28, 4343–4346. [Google Scholar] [CrossRef]
- Garrison, J.L.; Katzberg, S.J.; Hill, M.I. Effect of sea roughness on bistatically scattered range coded signals from the global positioning system. Geophys. Res. Lett. 1998, 25, 2257–2260. [Google Scholar] [CrossRef] [Green Version]
- Rius, A.; Aparicio, J.M.; Cardellach, E.; Martín-Neira, M.; Chapron, B. Sea surface state measured using gps reflected signals. Geophys. Res. Lett. 2002, 29, 37-1–37-4. [Google Scholar] [CrossRef] [Green Version]
- Gleason, S.; Hodgart, S.; Sun, Y.; Gommenginger, C.; Mackin, S.; Adjrad, M.; Unwin, M. Detection and processing of bistatically reflected GPS signals from low earth orbit for the purpose of ocean remote sensing. IEEE Trans. Geosci. Remote Sens. 2005, 43, 1229–1241. [Google Scholar] [CrossRef] [Green Version]
- Unwin, M.; Jales, P.; Tye, J.; Gommenginger, C.; Foti, G.; Rosello, J. Spaceborne GNSS-Reflectometry on TechDemoSat-1: Early Mission Operations and Exploitation. IEEE J. Sel. Top. Appl. Earth Obs. Remote Sens. 2016, 9, 4525–4539. [Google Scholar] [CrossRef]
- Ruf, C.S.; Atlas, R.; Chang, P.S.; Clarizia, M.P.; Garrison, J.L.; Gleason, S.; Katzberg, S.J.; Jelenak, Z.; Johnson, J.T.; Majumdar, S.J.; et al. New ocean winds satellite mission to probe hurricanes and tropical convection. Bull. Am. Meteorol. Soc. 2016, 97, 385–395. [Google Scholar] [CrossRef]
- Foti, G.; Gommenginger, C.; Jales, P.; Unwin, M.; Shaw, A.; Robertson, C.; Roselló, J. Spaceborne GNSS reflectometry for ocean winds: First results from the UK TechDemoSat-1 mission. Geophys. Res. Lett. 2015, 42, 5435–5441. [Google Scholar] [CrossRef] [Green Version]
- Chew, C.; Shah, R.; Zuffada, C.; Hajj, G.; Masters, D.; Mannucci, A.J. Demonstrating soil moisture remote sensing with observations from the UK TechDemoSat-1 satellite mission. Geophys. Res. Lett. 2016, 43, 3317–3324. [Google Scholar] [CrossRef] [Green Version]
- Li, W.; Cardellach, E.; Fabra, F.; Rius, A.; Ribó, S.; Martín-Neira, M. First spaceborne phase altimetry over sea ice using techdemosat-1 gnss-r signals. Geophys. Res. Lett. 2017, 44, 8369–8376. [Google Scholar] [CrossRef]
- Jing, C.; Niu, X.; Duan, C.; Lu, F.; Di, G.; Yang, X. Sea surface wind speed retrieval from the first Chinese GNSS-R mission: Technique and preliminary results. Remote Sens. 2019, 11, 3013. [Google Scholar] [CrossRef] [Green Version]
- Jales, P.; Esterhuizen, S.; Masters, D.; Nguyen, V.; Correig, O.N.; Yuasa, T.; Cartwright, J. The new Spire GNSS-R satellite missions and products. In Image and Signal Processing for Remote Sensing XXVI; Bruzzone, L., Bovolo, F., Santi, E., Eds.; International Society for Optics and Photonics: Bellingham, WA, USA, 2020; Volume 11533. [Google Scholar] [CrossRef]
- Munoz-Martin, J.F.; Fernandez, L.; Perez, A.; Ruiz-De-azua, J.A.; Park, H.; Camps, A.; Domínguez, B.C.; Pastena, M. In-orbit validation of the fmpl-2 instrument—The gnss-r and l-band microwave radiometer payload of the fsscat mission. Remote Sens. 2021, 13, 121. [Google Scholar] [CrossRef]
- Sun, Y.; Wang, X.; Du, Q.; Bai, W.; Xia, J.; Cai, Y.; Qiao, H. The status and progress of fengyun-3e gnos ii mission for gnss remote sensing. In Proceedings of the IGARSS 2019—2019 IEEE International Geoscience and Remote Sensing Symposium, Yokohama, Japan, 28 July–2 August 2019; pp. 5181–5184. [Google Scholar]
- SSTL Demonstrates New GNSS-R Payload Capabilities. 2020. Available online: https://www.sstl.co.uk/media-hub/latest-news/2020/sstl-demonstrates-new-gnss-r-capabilities (accessed on 12 Octorber 2021).
- Yang, Y.; Liu, L.; Li, J.; Yang, Y.; Zhang, T.; Mao, Y.; Ren, X. Featured services and performance of bds-3. Sci. Bull. 2021, 66, 2135–2143. Available online: https://www.sciencedirect.com/science/article/pii/S2095927321004187 (accessed on 12 Octorber 2021). [CrossRef]
- Montenbruck, O.; Steigenberger, P.; Prange, L.; Deng, Z.; Zhao, Q.; Perosanz, F.; Romero, I.; Noll, C.; Stürze, A.; Weber, G.; et al. The Multi-GNSS Experiment (MGEX) of the International GNSS Service (IGS)—Achievements, prospects and challenges. Adv. Space Res. 2017, 59, 1671–1697. [Google Scholar] [CrossRef]
- Sośnica, K.; Prange, L.; Kaźmierski, K.; Bury, G.; Drożdżewski, M.; Zajdel, R.; Hadas, T. Validation of Galileo orbits using SLR with a focus on satellites launched into incorrect orbital planes. J. Geod. 2018, 92, 131–148. [Google Scholar] [CrossRef]
- Nogués-Correig, O.; Cardellach, E.; Campderros, J.S.; Rius, A. A gps-reflections receiver that computes doppler/delay maps in real time. IEEE Trans. Geosci. Remote Sens. 2007, 45, 156–174. [Google Scholar] [CrossRef]
- Cardellach, E.; Fabra, F.; Nogués-Correig, O.; Oliveras, S.; Ribó, S.; Rius, A. Gnss-r ground-based and airborne campaigns for ocean, land, ice, and snow techniques: Application to the gold-rtr data sets. Radio Sci. 2011, 46. [Google Scholar] [CrossRef] [Green Version]
- Galileo. Signal-in-Space Interface Control Document. Available online: https://www.gsc-europa.eu/sites/default/files/sites/all/files/Galileo-OS-SIS-ICD.pdf (accessed on 12 Octorber 2021).
- China Satellite Navigation Office. BeiDou Navigation Satellite System Open Service Performance Standard (Version 2.0). 2018. Available online: http://en.beidou.gov.cn/SYSTEMS/Officialdocument/ (accessed on 12 Octorber 2021).
- Li, W.; Cardellach, E.; Fabra, F.; Ribo, S.; Rius, A. Assessment of Spaceborne GNSS-R Ocean Altimetry Performance Using CYGNSS Mission Raw Data. IEEE Trans. Geosci. Remote Sens. 2020, 58, 238–250. [Google Scholar] [CrossRef]
- Li, W.; Cardellach, E.; Ribó, S.; Rius, A.; Zhou, B. First spaceborne demonstration of BeiDou-3 signals for GNSS reflectometry from CYGNSS constellation. Chin. J. Aeronaut. 2021, 34, 1–10. [Google Scholar] [CrossRef]
- University of Michigan. CYGNSS Handbook; Michigan Publishing: Ann Arbor, MI, USA, 2016; ISBN 978-1-60785-380-0. Available online: https://clasp-research.engin.umich.edu/missions/cygnss/reference/cygnss-mission/CYGNSS_Handbook_April2016.pdf (accessed on 12 Octorber 2021).
- Jales, P. MERRByS Product Manual: GNSS-Reflectometry on TDS-1 with the SGR-ReSI. 2015. Available online: http://merrbys.co.uk/resources/documentation (accessed on 12 Octorber 2021).
- European Centre for Medium-range Weather Forecast (ECMWF) Copernicus Climate Change (C3S). ERA5: Fifth Generation of ECMWF Atmospheric Reanalyses of the Global Climate. 2020. Available online: https://confluence.ecmwf.int/display/CKB/ERA5%3A+data+documentation (accessed on 12 Octorber 2021).
- Zavorotny, V.U.; Voronovich, A.G. Scattering of GPS signals from the ocean with wind remote sensing application. IEEE Trans. Geosci. Remote Sens. 2000, 38, 951–964. [Google Scholar] [CrossRef] [Green Version]
- Hammond, M.L.; Foti, G.; Rawlinson, J.; Gommenginger, C.; Srokosz, M.; King, L.; Unwin, M.; Roselló, J. First assessment of geophysical sensitivities from spaceborne Galileo and BeiDou GNSS-reflectometry data collected by the UK TechDemoSat-1 Mission. Remote Sens. 2020, 12, 2927. [Google Scholar] [CrossRef]
Figure 1.
The timelines of TDS-1 Raw IF data, CYGNSS Raw IF data and evaluations of the Galileo and BDS-3 navigation systems.
Figure 1.
The timelines of TDS-1 Raw IF data, CYGNSS Raw IF data and evaluations of the Galileo and BDS-3 navigation systems.
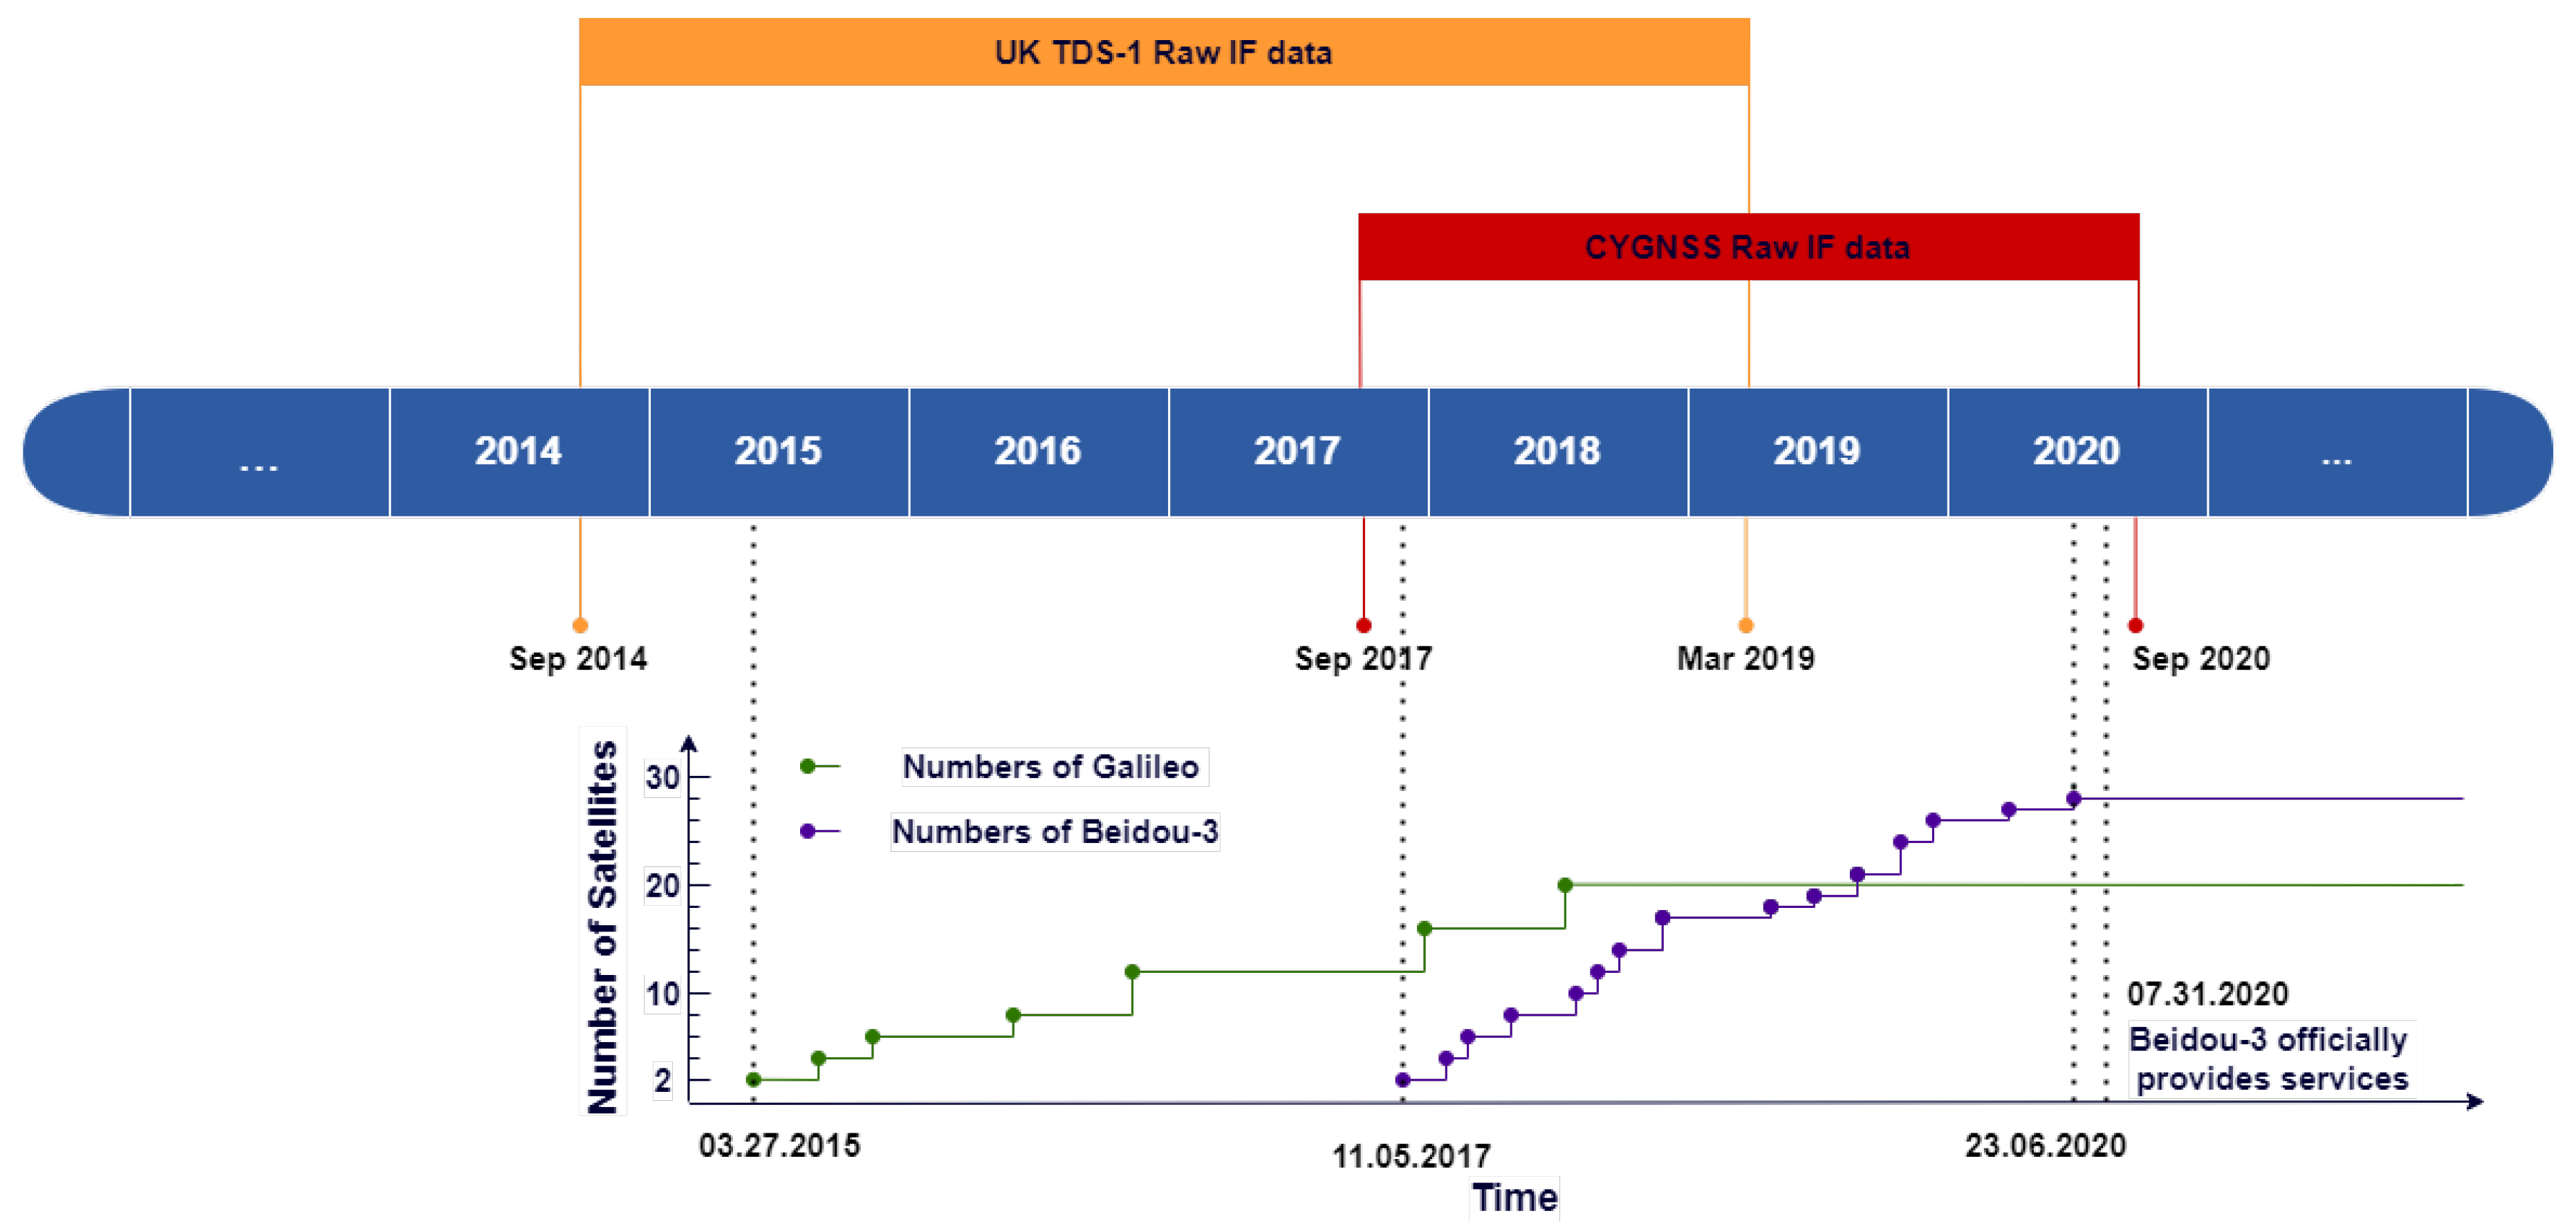
Figure 2.
The normalized power waveforms are generated from the CYGNSS raw IF data collected over the Gulf of Mexico on 11 October 2018. (Top) shows the CYGNSS track and Specular Point track of reflected signals from GPS, Galileo and BDS-3 received in parallel. The power waveforms of direct and reflect signal from GPS (Left), Galileo (Middle) and BDS-3 (Right) are shown in (Middle) and (Bottom), respectively. The coherent integration time is 1 ms and the incoherent average time is 4 s.
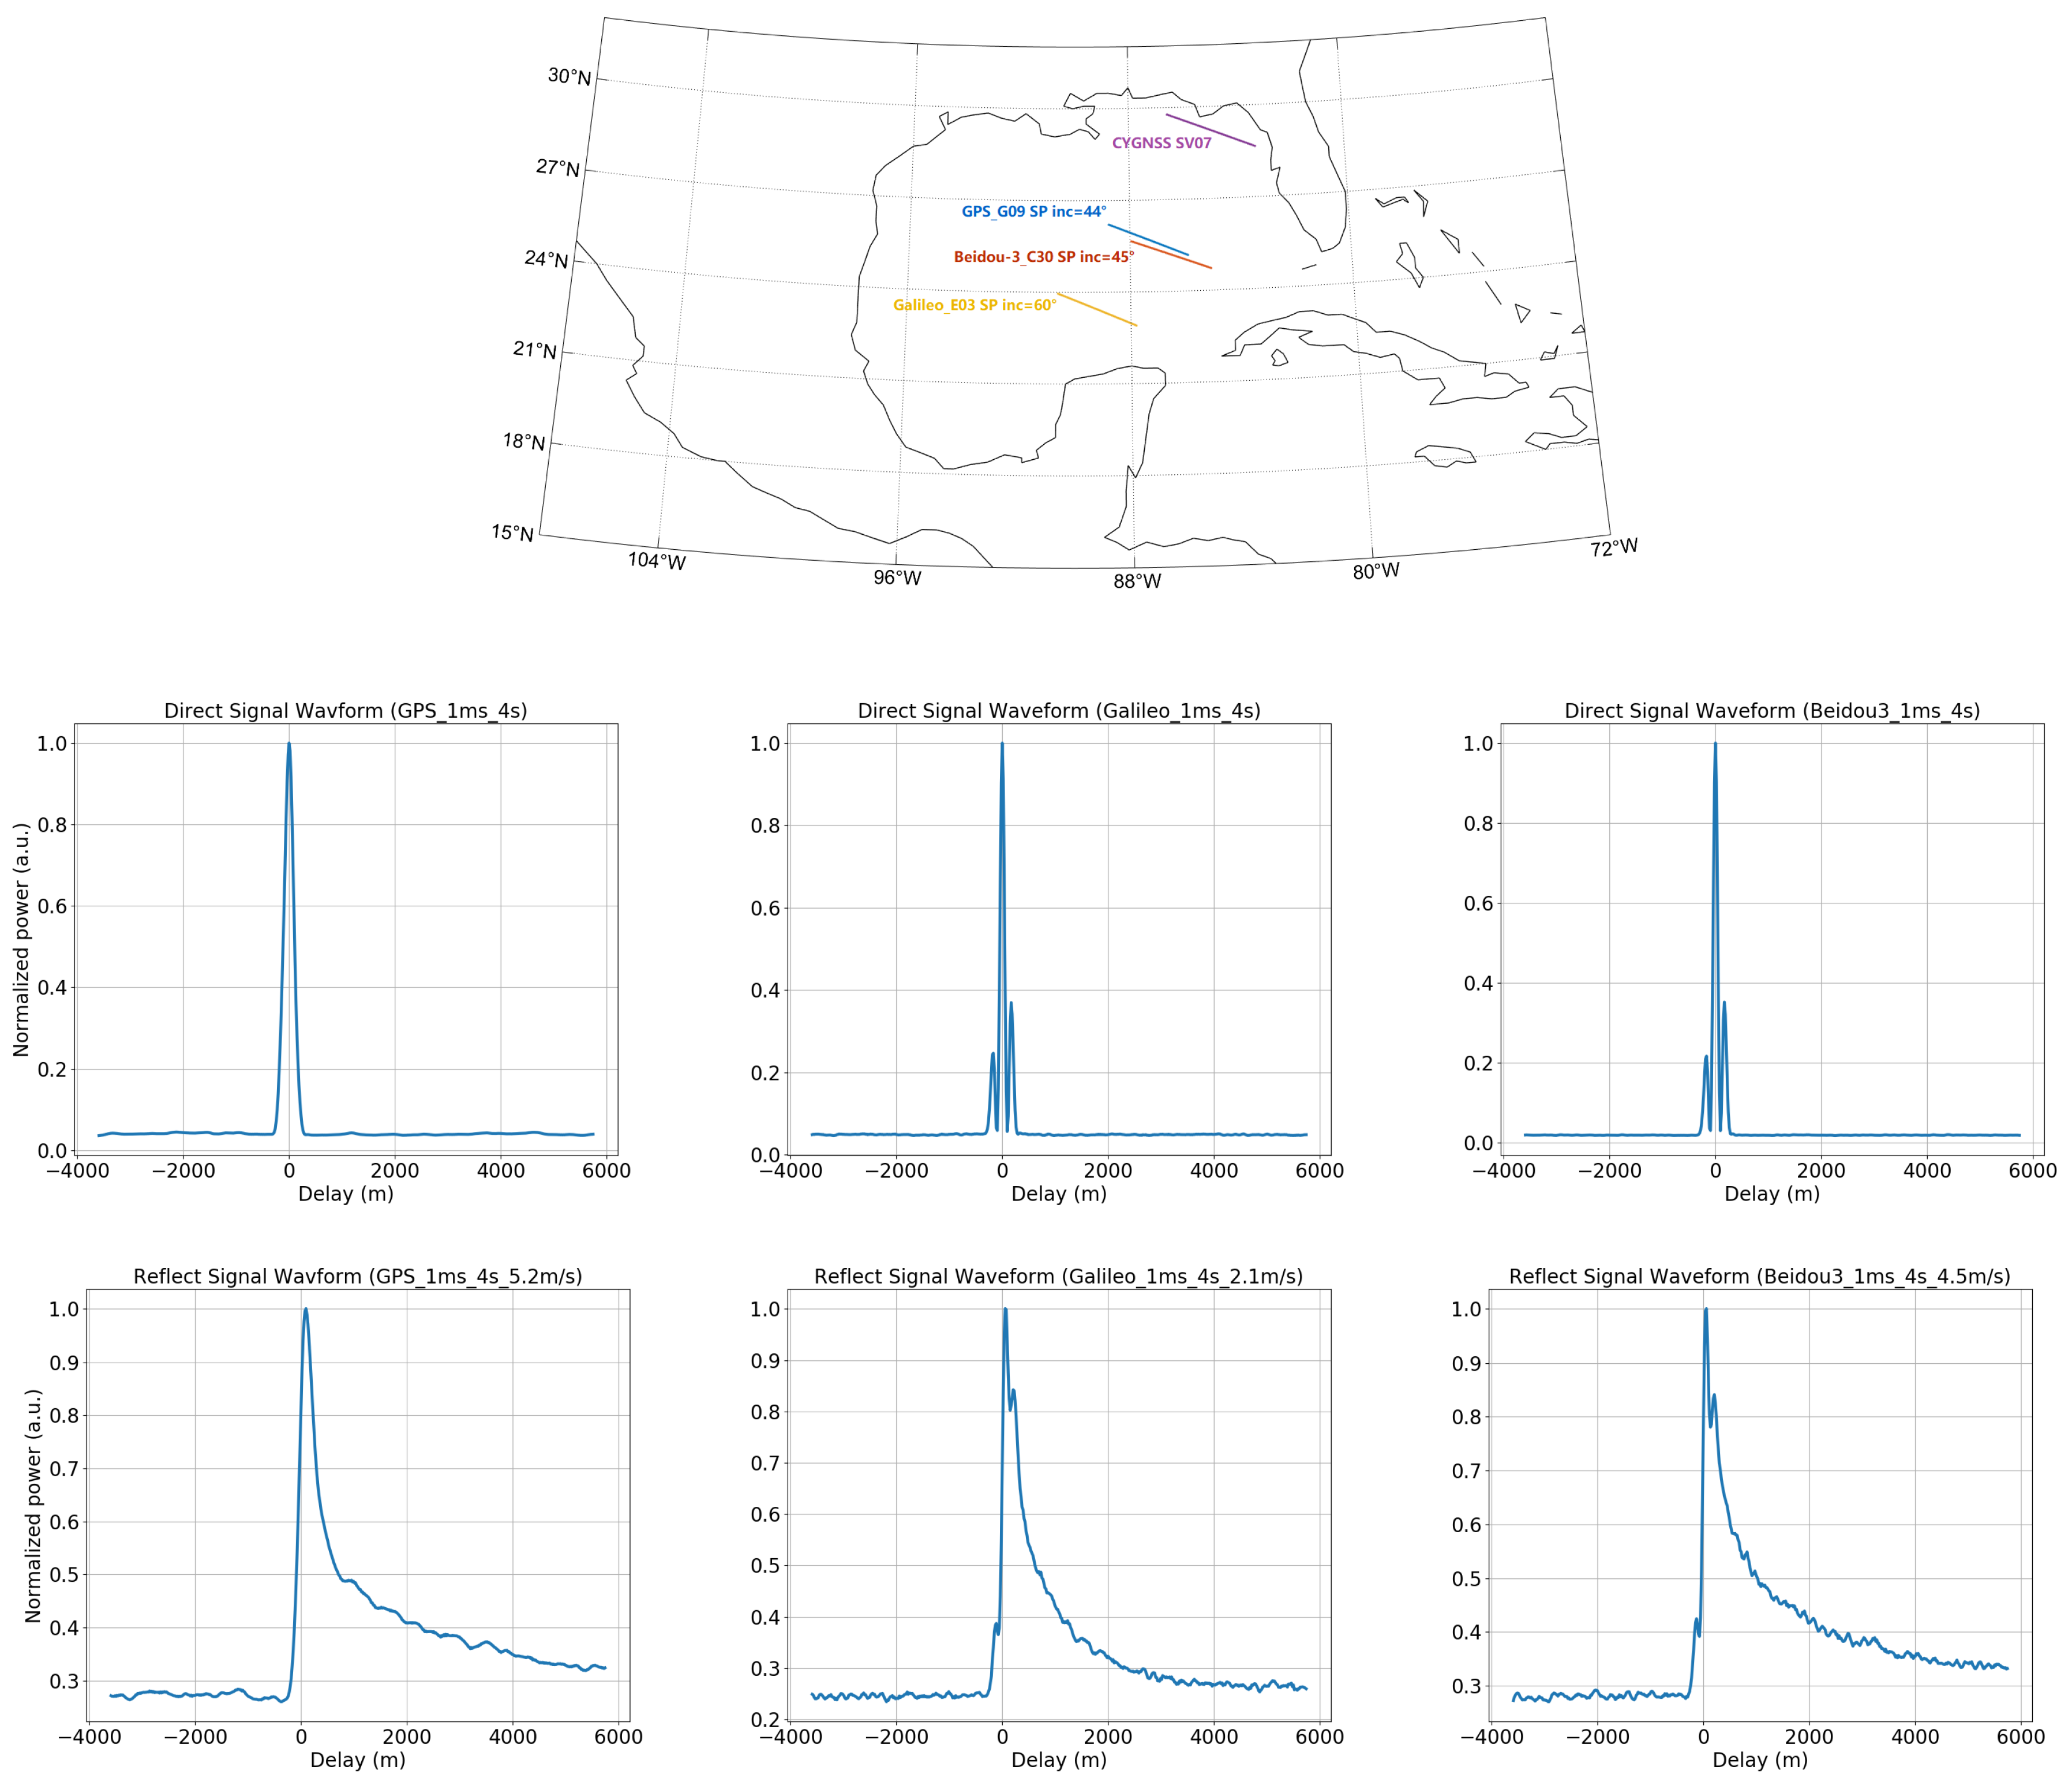
Figure 3.
Map of the specular points location of the Complex Waveform Product. CYGNSS from September 2017 to September 2018 and TDS-1 from September 2014 to March 2019.The specular points from different GNSS-R constellations (TDS-1, CYGNSS) and GNSS systems (GPS, Galileo, and BDS-3) are identified with different colors. (Top) all the raw IF data samples. (Bottom) the available data after QC. There are totally 42,703 samples of the specular points used in the study. the numbers identify the samples in Table 1.

Figure 4.
Probability distribution function (PDF) of the SNR of the reflected signal with 1ms coherent integration. The blue, black and red lines indicate the reflected signals from GPS, Galileo and BDS-3, respectively. Solid line and dotted line indicate TDS-1 and CYGNSS respectively. (Left) PDF of the SNR from TDS-1. (Right) PDF of the SNR from CYGNSS.

Figure 5.
Mean SNRs of the reflected signals from GPS, Galileo and BDS-3 at different wind speeds. The wind speed measurements are from co-located ECMWF ERA-5 data in batches of 2 m/s. Different colors indicate different GNSS systems, while different symbols are for different GNSS-R satellites (TDS-1 or CYGNSS). The blue, black and red symbols indicate GPS, Galileo and BDS-3 respectively. Filled circle and triangle symbols indicate TDS-1 and CYGNSS respectively. (Left) PDF of the mean SNR from TDS-1. (Right) PDF of the mean SNR from CYGNSS.
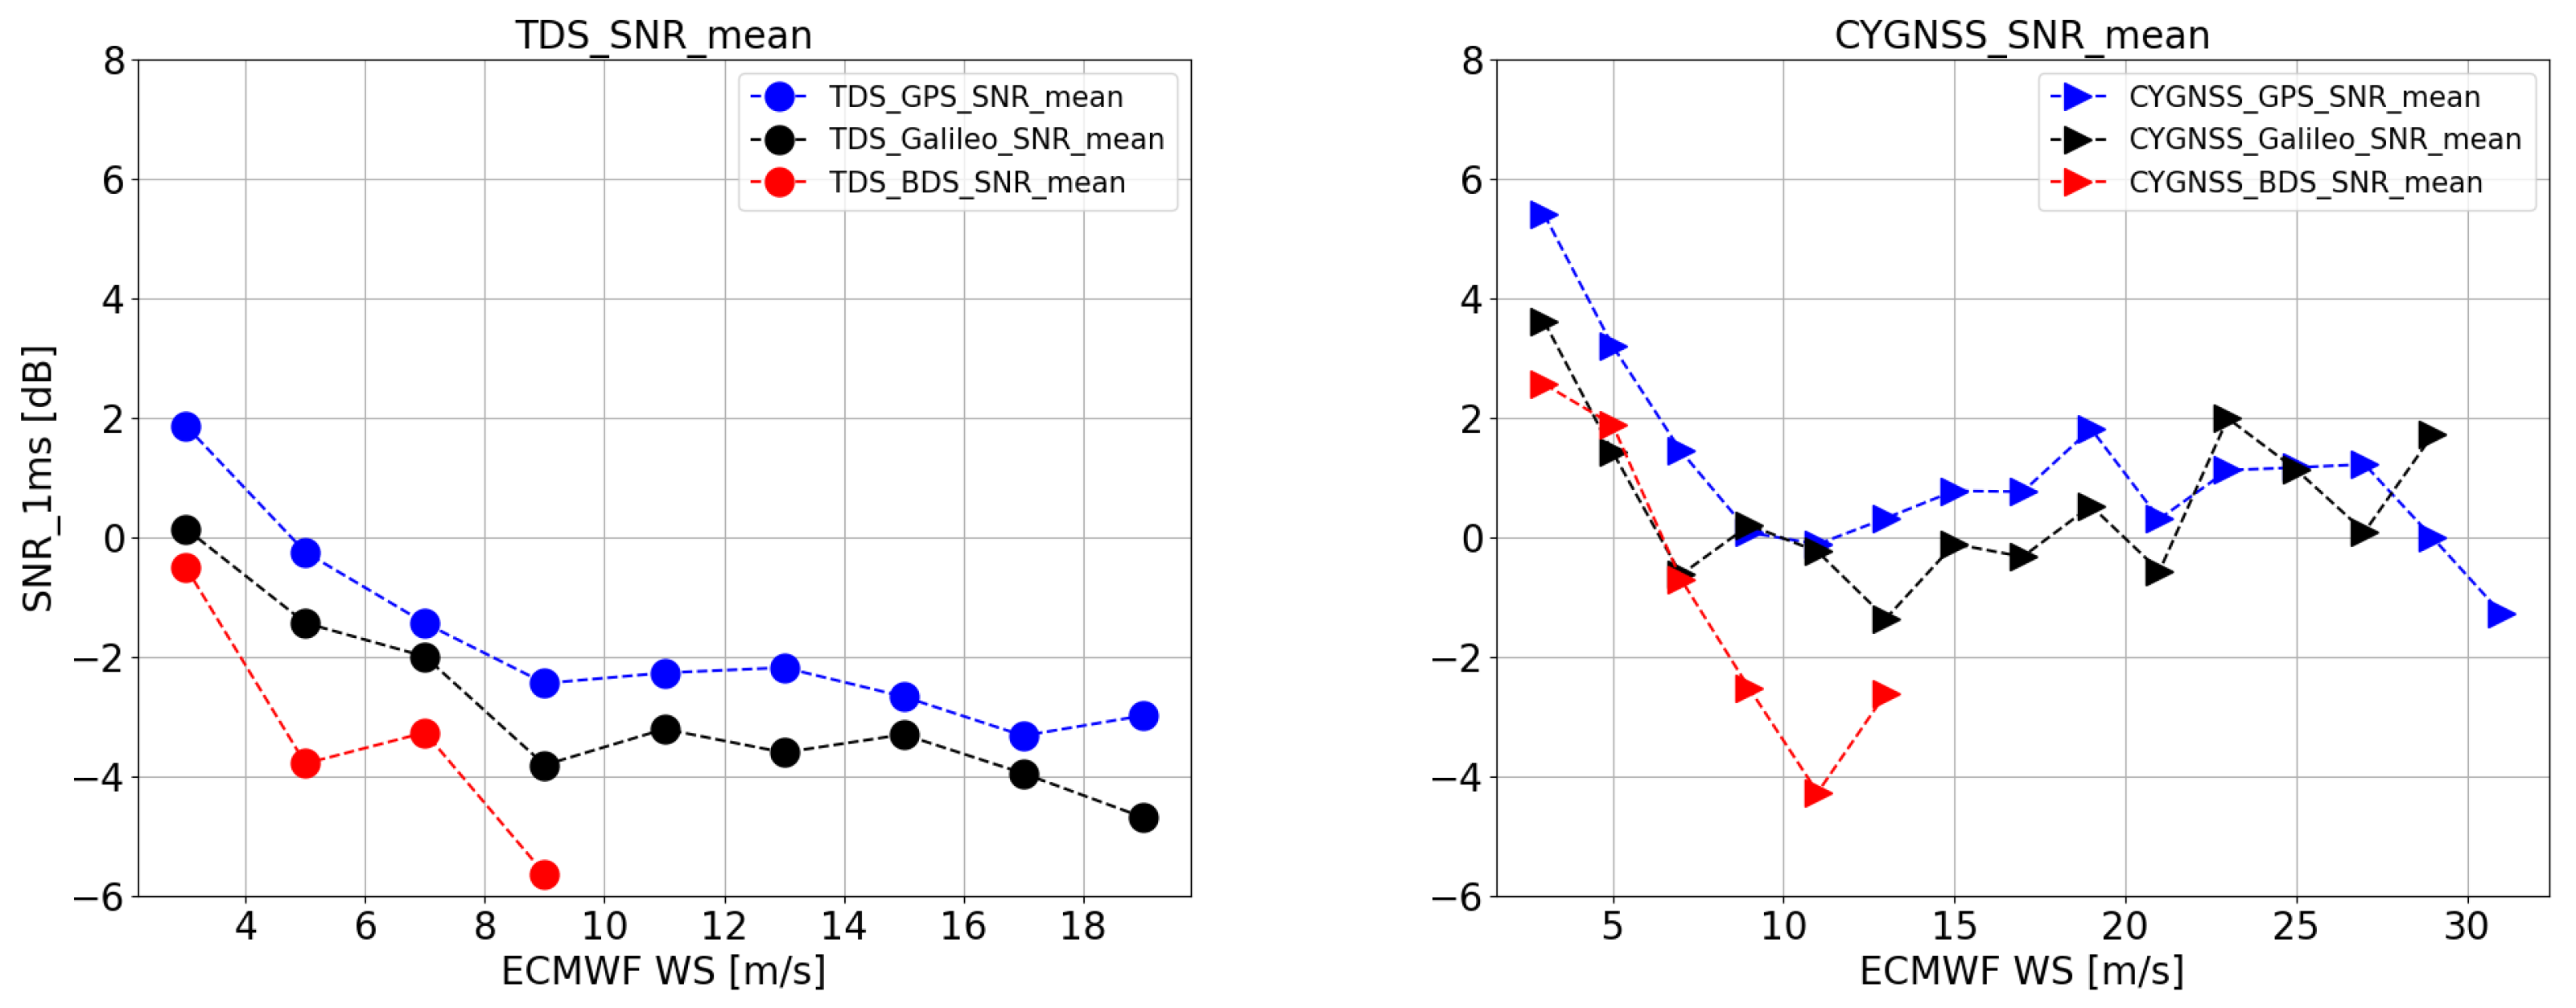
Figure 6.
Mean of receiver antenna gain and RCG with co-located ECMWF ERA-5 sea surface wind speed, in batches of 2 m/s. (Top-left) mean of antenna gain from TDS-1. (Top-right) mean of antenna gain from CYGNSS. (Bottom-left) mean of RCG from TDS-1. (Bottom-right) mean of RCG from CYGNSS.
Figure 6.
Mean of receiver antenna gain and RCG with co-located ECMWF ERA-5 sea surface wind speed, in batches of 2 m/s. (Top-left) mean of antenna gain from TDS-1. (Top-right) mean of antenna gain from CYGNSS. (Bottom-left) mean of RCG from TDS-1. (Bottom-right) mean of RCG from CYGNSS.
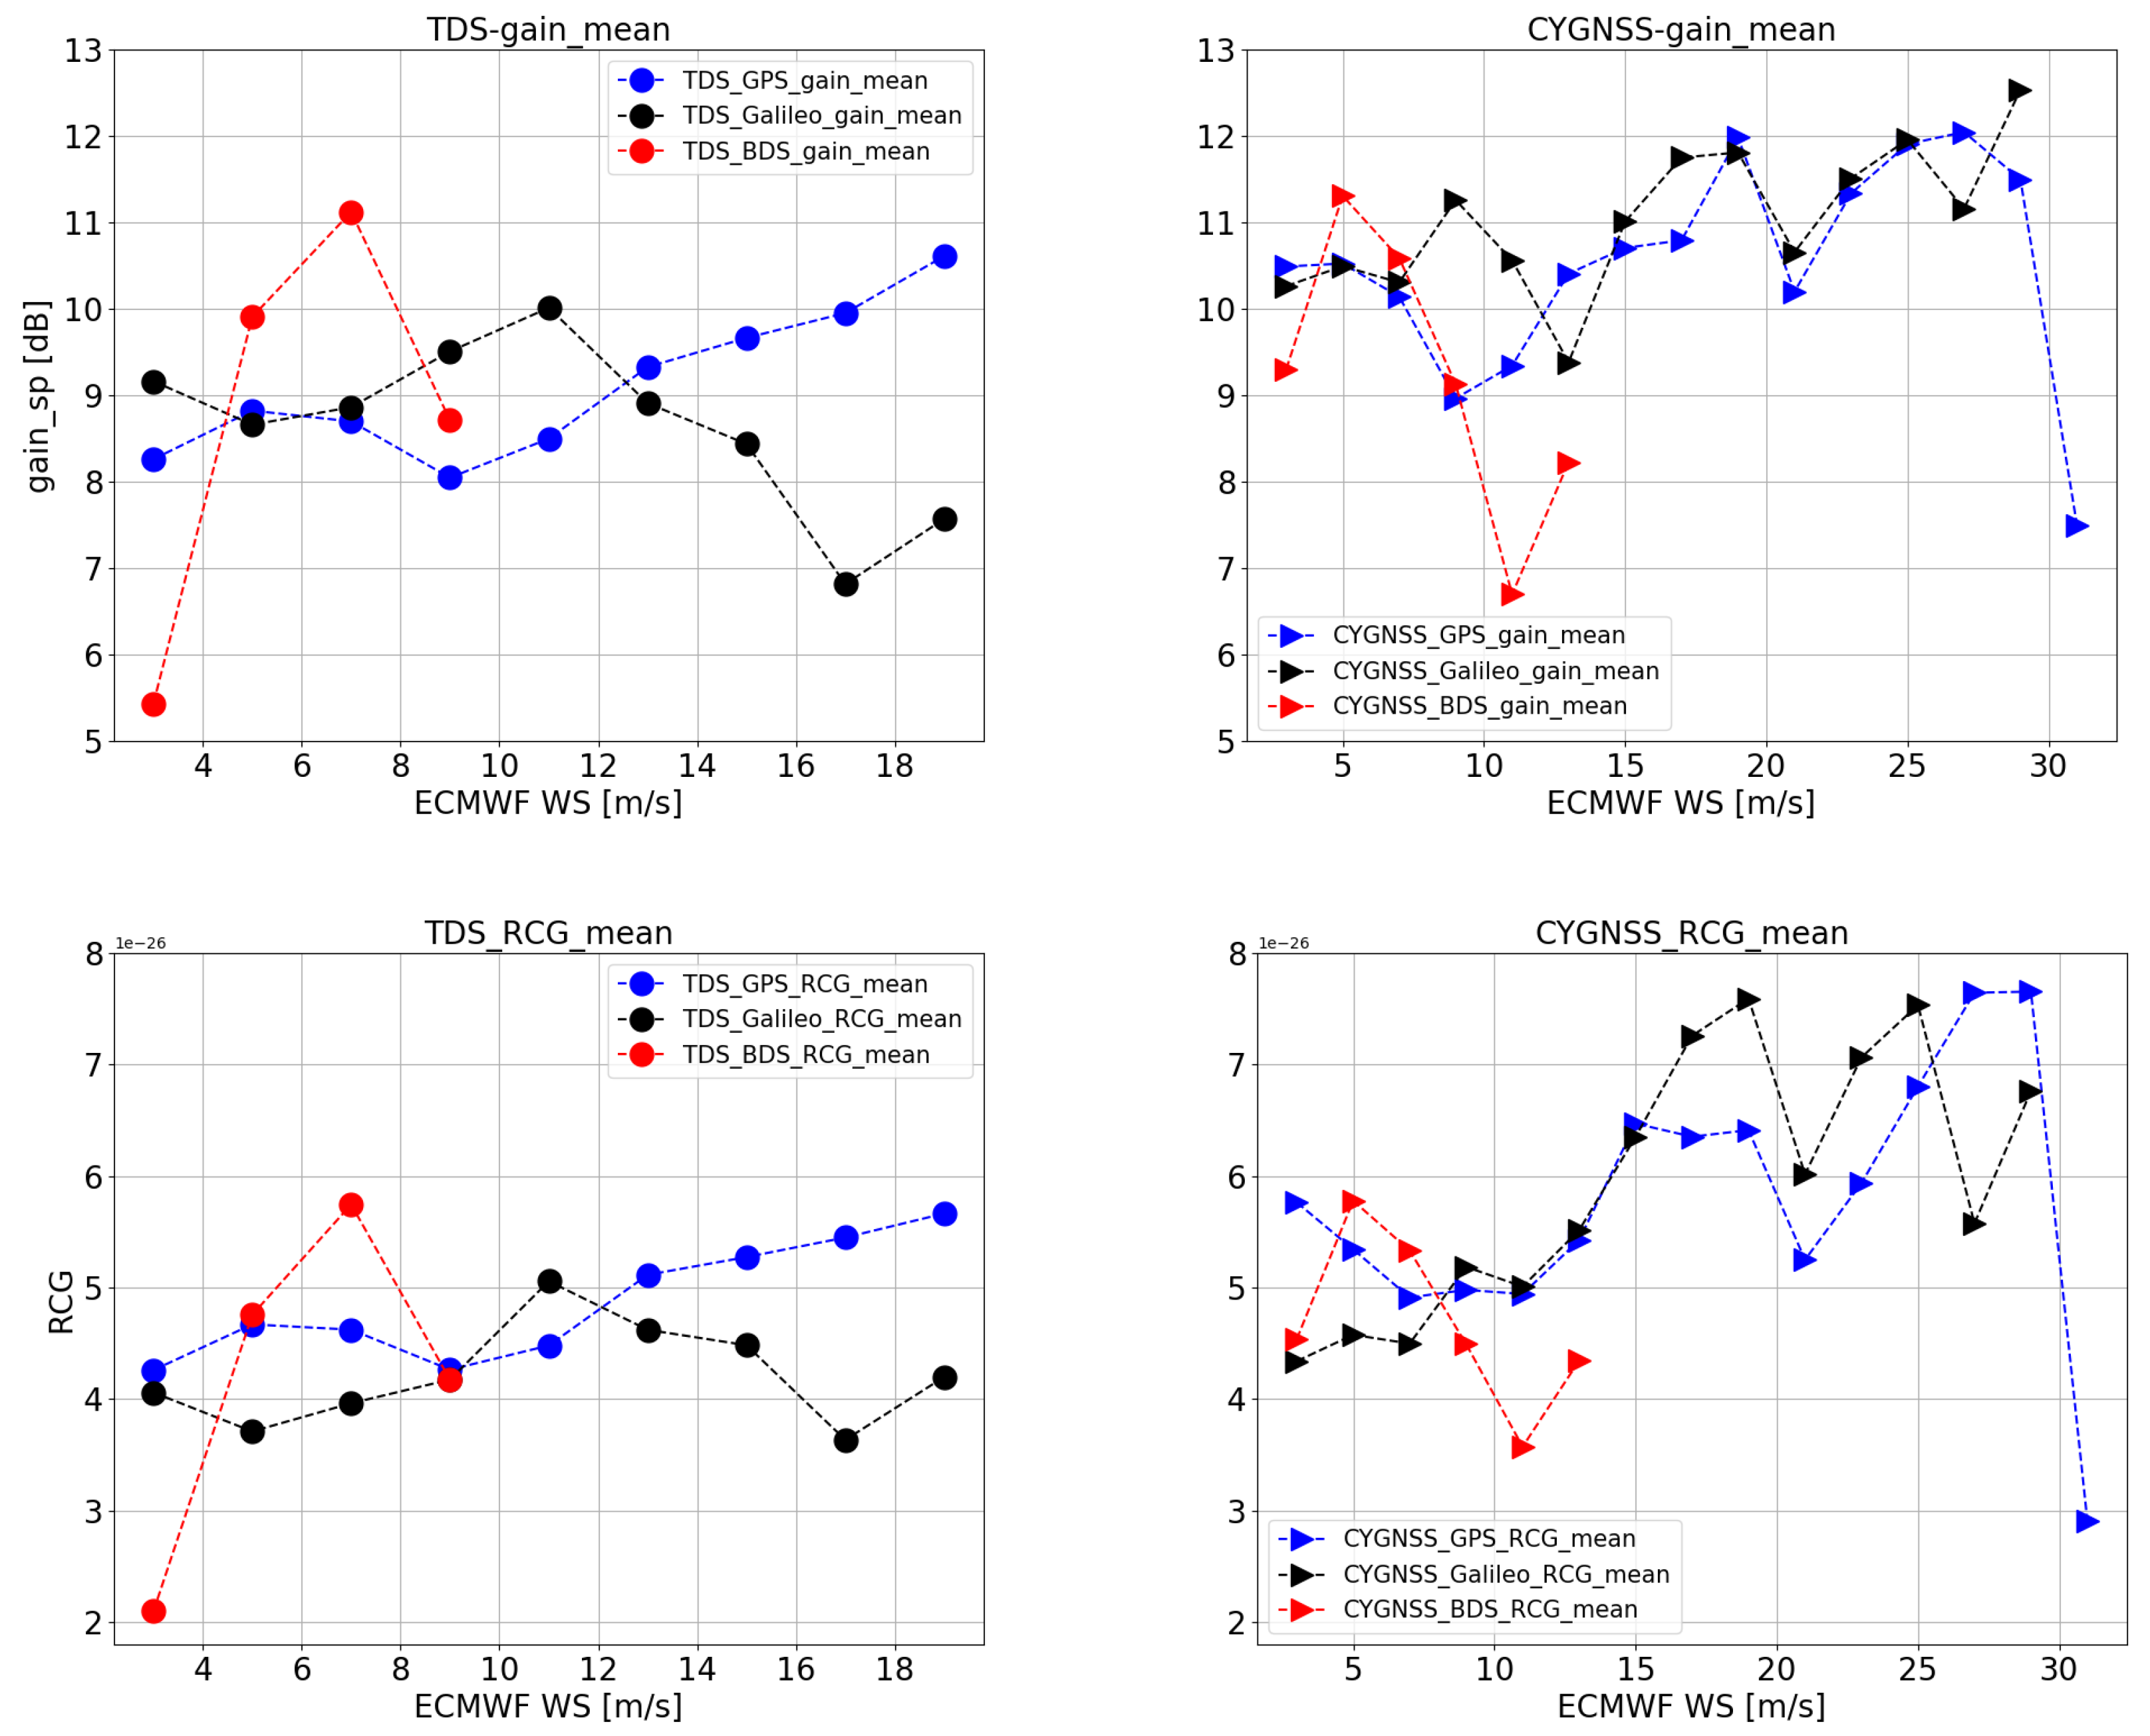
Figure 7.
Probability distribution function (PDF) of the Normalized SNR with 1ms coherent integration. The blue, black and red lines indicate GPS, Galileo and BDS-3 respectively. Solid line and dotted line indicate TDS-1 and CYGNSS respectively. (Left) PDF of the NSNR from TDS-1. (Right) PDF of the NSNR from CYGNSS.
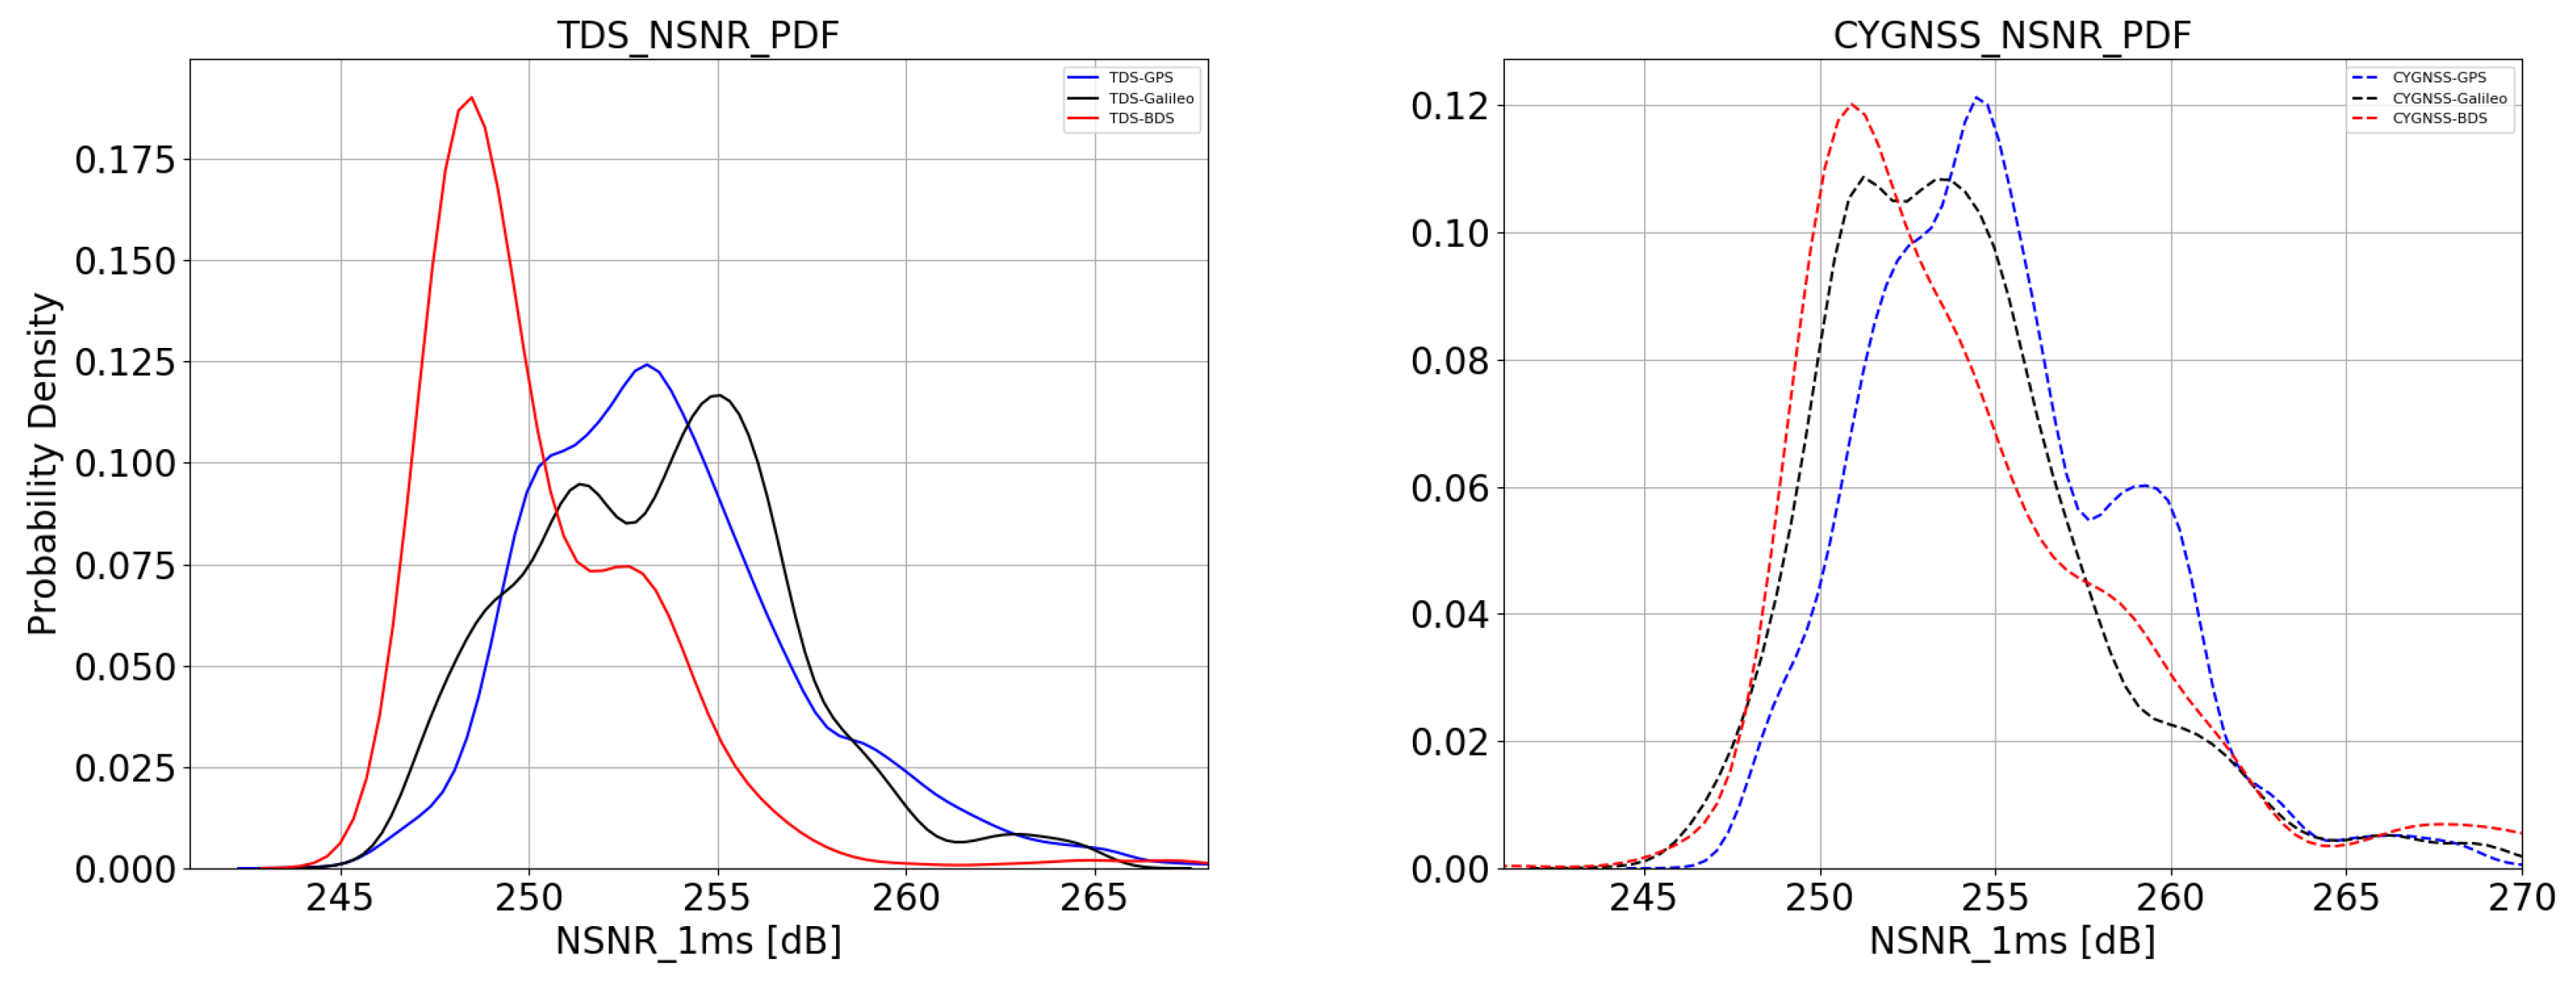
Figure 8.
Mean normalized SNRs (NSNRs) of the reflected signals from GPS, Galileo and BDS-3 at different wind speeds. The wind speed measurements are from co-located ECMWF ERA-5 data in batches of 2 m/s. Different colors indicate different GNSS systems, while different symbols are for different GNSS-R satellites (TDS-1 or CYGNSS). The blue, black and red symbols indicate GPS, Galileo and BDS-3 respectively. Filled circle and triangle symbols indicate TDS-1 and CYGNSS respectively. (Left) PDF of the mean NSNR from TDS-1. (Right) PDF of the mean NSNR from CYGNSS.
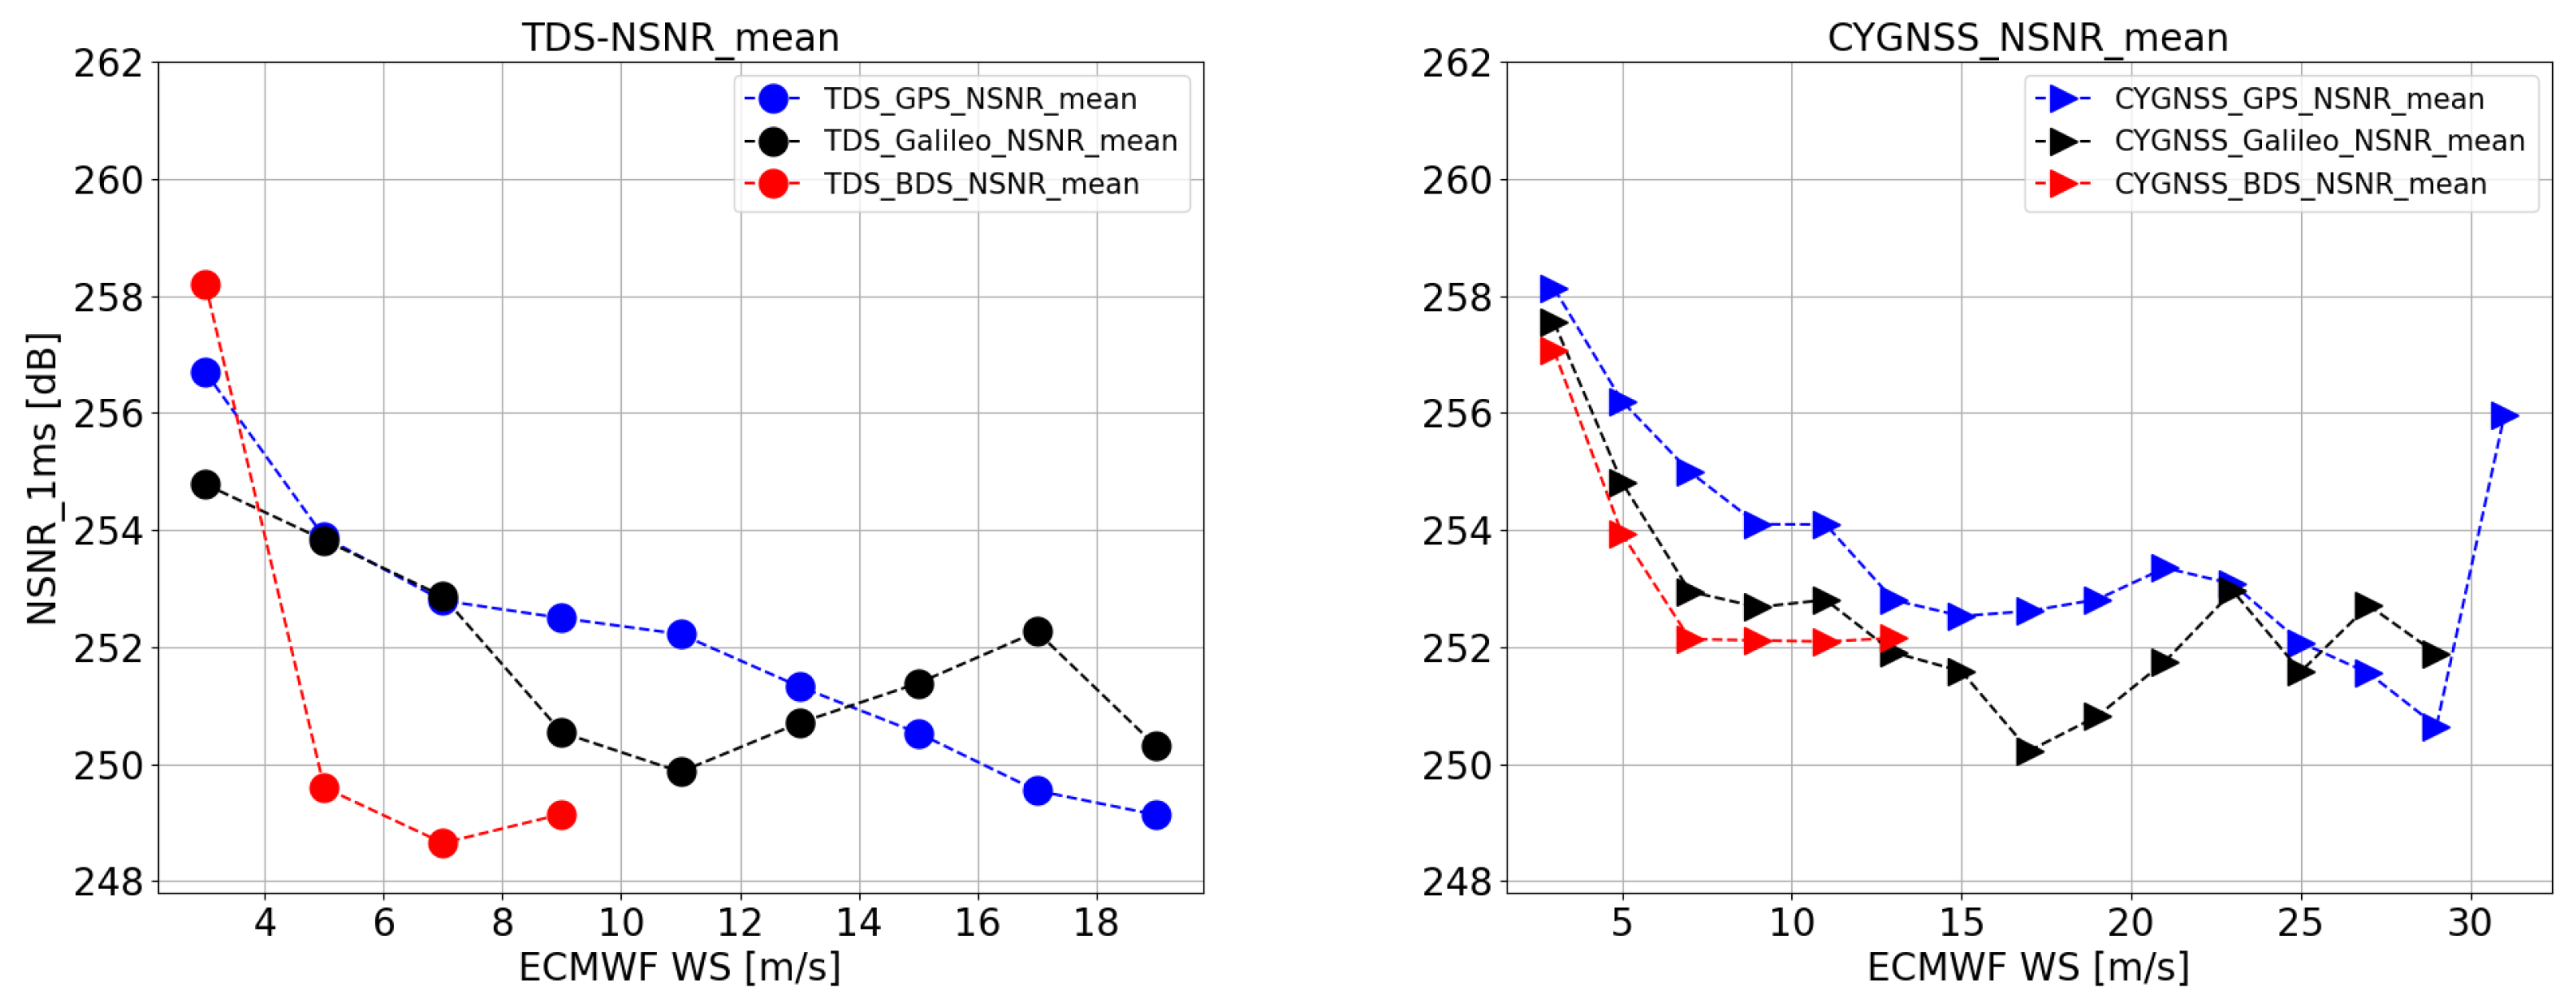
Figure 9.
SNR improvements for different GNSS signals with coherent integration times 2 ms and 4 ms with respect to that with 1 ms coherent integration time. The (left) figures are the SNR improvement values between 2 ms and 1 ms coherent integration time for TDS-1 (Top) and CYGNSS (Bottom) measurements, while the (right) figures are the SNR improvement values between 4 ms and 1 ms coherent integration time for TDS-1 (Top) and CYGNSS (Bottom) measurements. color and symbols are the same as Figure 5.

Table 1.
Number of samples after quality control and selection criteria are applied. There is the batched statistics by co-located ERA-5 wind speed values, within windows of 2 m/s (first then rows) and using the whole set (bottom row). And the wind speed from 2 m/s to 32 m/s.
Table 1.
Number of samples after quality control and selection criteria are applied. There is the batched statistics by co-located ERA-5 wind speed values, within windows of 2 m/s (first then rows) and using the whole set (bottom row). And the wind speed from 2 m/s to 32 m/s.
| Windspeed (ECMWF) | TDS-GPS | TDS-Galileo | TDS-BDS | CYGNSS-GPS | CYGNSS-Galileo | CYGNSS-BDS |
|---|---|---|---|---|---|---|
| [2,4) | 3451 | 1190 | 27 | 671 | 619 | 388 |
| [4,6) | 5936 | 1205 | 150 | 1673 | 1073 | 662 |
| [6,8) | 7238 | 1459 | 191 | 1639 | 600 | 436 |
| [8,10) | 4935 | 743 | 81 | 982 | 797 | 147 |
| [10,12) | 1993 | 60 | – | 583 | 345 | 158 |
| [12,14) | 501 | 59 | – | 238 | 340 | 66 |
| [14,16) | 383 | 75 | – | 228 | 176 | – |
| [16,18) | 161 | 25 | – | 143 | 158 | – |
| [18,20) | 19 | 26 | – | 97 | 102 | – |
| [20,22) | – | – | – | 95 | 53 | – |
| [22,24) | – | – | – | 70 | 47 | – |
| [24,26) | – | – | – | 51 | 34 | – |
| [26,28) | – | – | – | 37 | 30 | – |
| [28,30) | – | – | – | 24 | 20 | – |
| [30,32) | – | – | – | 12 | 1 | – |
| total | 24,617 | 4842 | 449 | 6543 | 4395 | 1857 |
Publisher’s Note: MDPI stays neutral with regard to jurisdictional claims in published maps and institutional affiliations. |
© 2021 by the authors. Licensee MDPI, Basel, Switzerland. This article is an open access article distributed under the terms and conditions of the Creative Commons Attribution (CC BY) license (https://creativecommons.org/licenses/by/4.0/).
Share and Cite
MDPI and ACS Style
Nan, Y.; Ye, S.; Liu, J.; Guo, B.; Zhang, S.; Li, W. Signal-to-Noise Ratio Analyses of Spaceborne GNSS-Reflectometry from Galileo and BeiDou Satellites. Remote Sens. 2022, 14, 35. https://doi.org/10.3390/rs14010035
AMA Style
Nan Y, Ye S, Liu J, Guo B, Zhang S, Li W. Signal-to-Noise Ratio Analyses of Spaceborne GNSS-Reflectometry from Galileo and BeiDou Satellites. Remote Sensing. 2022; 14(1):35. https://doi.org/10.3390/rs14010035
Chicago/Turabian StyleNan, Yang, Shirong Ye, Jingnan Liu, Bofeng Guo, Shuangcheng Zhang, and Weiqiang Li. 2022. "Signal-to-Noise Ratio Analyses of Spaceborne GNSS-Reflectometry from Galileo and BeiDou Satellites" Remote Sensing 14, no. 1: 35. https://doi.org/10.3390/rs14010035
Note that from the first issue of 2016, this journal uses article numbers instead of page numbers. See further details here.