Article

RS-DARTS: A Convolutional Neural Architecture Search for Remote Sensing Image Scene Classification

1
School of Information Science and Engineering, Lanzhou University, Lanzhou 730000, China
2
School of Physical Science and Technology, Lanzhou University, Lanzhou 730000, China
3
Supercomputing Center, Lanzhou University, Lanzhou 730000, China
*
Author to whom correspondence should be addressed.
These authors contributed equally to this work.
Remote Sens. 2022, 14(1), 141; https://doi.org/10.3390/rs14010141
Submission received: 19 November 2021 / Revised: 26 December 2021 / Accepted: 28 December 2021 / Published: 29 December 2021

Abstract

:
Due to the superiority of convolutional neural networks, many deep learning methods have been used in image classification. The enormous difference between natural images and remote sensing images makes it difficult to directly utilize or modify existing CNN models for remote sensing scene classification tasks. In this article, a new paradigm is proposed that can automatically design a suitable CNN architecture for scene classification. A more efficient search framework, RS-DARTS, is adopted to find the optimal network architecture. This framework has two phases. In the search phase, some new strategies are presented, making the calculation process smoother, and better distinguishing the optimal and other operations. In addition, we added noise to suppress skip connections in order to close the gap between trained and validation processing and ensure classification accuracy. Moreover, a small part of the neural network is sampled to reduce the redundancy in exploring the network space and speed up the search processing. In the evaluation phase, the optimal cell architecture is stacked to construct the final network. Extensive experiments demonstrated the validity of the search strategy and the impressive classification performance of RS-DARTS on four public benchmark datasets. The proposed method showed more effectiveness than the manually designed CNN model and other methods of neural architecture search. Especially, in terms of search cost, RS-DARTS consumed less time than other NAS methods.

1. Introduction

With the development of technology, it has become easier to obtain remote sensing images, which offers unprecedented conveniences and opportunities for many research directions. These fields include remote sensing image scene classification, change detection, geographic imaging, video retrieval, land-use classification, and automatic target recognition [1,2,3,4,5,6,7,8,9,10]. As an essential problem in remote sensing images, the scene classification task aims to accurately classify satellite images to the correct category (e.g., airplane, river, highway, and farm) for unlabeled aerial images, which has been applied to some image interpretation tasks such as environmental monitoring, residential planning, and land resource management [11,12]. However, the remote sensing scene images have small target objects, dense distribution, different target orientations, and higher image resolution than natural images [13,14]. For example, an airport area consists of many different geographic structures such as airplanes with different orientations and sizes, airstrips, and terminals, which can lead these images to have different semantic classes. These features result in low interclass disparity and high within-class variability in aerial images [15]. Therefore, remote scene images with the same semantic label may have a high difference, making scene classification more complex than natural images.
Usually, the scene classification of the remote-sensing image method needs to first extract global low-level features as the visual descriptor [15]. In this phase, the bag-of-visual-words (BOVW) model is a common and promising tool to extract visual descriptors. A set of visual words is acquired by the BOVW. The image is represented by simple statistical values for each visual word occurrence based on the visual dictionary. The method can narrow the gap between low-level features and high-level semantics [15]. These statistical results are regarded as training data to improve classification performance. Several improved variants of BOVW have been developed to further the ability to describe these complex images, such as spatial pyramid match kernel (SPMK) [16], randomized spatial partition (RSP) [17], spatial pyramid co-occurrence kernel (SPCK) [18], and pyramid of spatial relations (PSR) [19]. However, these methods rely heavily on handcrafted low-level features and the design of mid-level feature representation. Gaining these features requires a large amount of prior information, limiting portability across domains and datasets. In addition, using these methods cannot model the spatial relationship of an image by simply counting the occurrences of the local features. The method based on BOVW has limited descriptive ability for these features, which makes it difficult to achieve further remote sensing scene classification performance.
In recent years, deep learning (DL) has been widely used in many image tasks. From deep confidence networks (DBN) and deep restricted Boltzmann machines (DBM) to deep convolutional neural networks (CNN), dramatic improvements have been obtained in different image domains. In particular, CNNs are acknowledged as the most popular method due to their ability to learn hierarchical level abstraction of input data by encoding input data on different layers [20]. Compared with the traditional method, CNN methods have achieved far better classification performance. The early method of CNN for scene classification prefers to train from scratch. However, CNN is a data-oriented model, and the quality of data determines the performance of the CNN model. Thus, during the training phase, a quantity of well-annotated data is necessary for the CNN model. Unfortunately, compared with natural images, remote sensing image data are tricky to obtain and annotate. The few high-quality annotated data are easily overfitted when training a CNN model, which affects the final classification accuracy. To solve this problem, pretrained CNN models as extractors for deep features have gained considerable attention [21]. Recently, some works demonstrated that existing CNN models pretrained on large dataset such as ImageNet can be transferred to other image tasks [20]. This transfer strategy can avoid most drawbacks in training a CNN from scratch, especially the problem of lack of training data. Various models based on ImageNet have achieved many competitive results compared to early state-of-the-art work [2].
However, the ImageNet dataset is a natural image dataset, and it has only a small amount of remote sensing images. A recent survey [22] revealed that the model trained from random initialization was not worse than the ImageNet pretrained model. Although the research demonstrated that pretraining with ImageNet could speed up convergence, training from random initialization can achieve the same performance after enough iterations. The pretrained model does not automatically give better regularization, and the fine-tuned phase needs sufficient data and new hyperparameters need to be selected to avoid overfitting. In other words, it is not convenient to use ImageNet for pretraining. For example, ImageNet pretrained models show no benefit when the target tasks/metrics are more sensitive to spatial predictions [22]. Compared with natural images, aerial images have more spatial features, including highly complex geometrical structures, and the content of the image varies greatly in scale, shape, and orientation. These characteristics show that CNN models based on natural images are not necessarily suitable for the specific spatial patterns of remote sensing images. ImageNet pretrained models limit the scene classification performance of aerial images. Therefore, it is urgent to design an original model to solve aerial images instead of using pretrained CNN models directly.
Nevertheless, designing a neural network architecture directly for remote sensing images requires expert knowledge and takes ample time. Trial and error is a time-consuming process. Most recently, there has been a focus on designing a CNN model for image tasks using a machine automatically. This approach can save time and manpower compared to the manual design of neural architectures. Neural architecture search (NAS) [23], a rapidly developing research direction in automated machine learning, aims to automatically design a CNN model with good performance and high accuracy. Early NAS methods have achieved impressive empirical performance in various tasks, such as image classification, but these approaches are still time-consuming and computationally expensive. In addition, most of the current methods of NAS are performed on natural images, and few works in the literature have solved high spatial resolution aerial image tasks because these tasks require many computing resources in the search phase. Gradient-based NAS has been proposed in recent years, which has reduced time consumption and computational cost. It is possible to apply gradient-based NAS to solve remote sensing images with few computational resources.
In this paper, we conclude the limitation of the high-level features extracted from a pretrained model and confirm the effectiveness of large-scale datasets for training NAS methods. To address these constraints from pretrained methods and create a suitable aerial image model, a new paradigm is proposed to automatically design a CNN model for remote sensing scene classification. The contributions to this paper are summarized as follows.
(1) We present a novel framework called RS-DARTS and use it to search optimal cells, stacking a new CNN model to improve remote sensing scene classification performance. The method in the paper can help to automatically design a more suitable CNN model for aerial images, which solves problems faced by existing handcrafted CNNs based on natural images. It can also handle the collapse issue in searched phases of neural architecture search methods based on remote sensing images.
(2) Some efficient architecture regularization schemes are proposed to improve the efficiency of the search process and reduce the advantage of skip connections to avoid model collapse. Some new strategies are presented to promise a high correlation between the search and evaluation phases. In addition, a noise is added to suppress the skip connections and ensure classification accuracy.
(3) To reduce the consumption of computing resources in the searched phases, we sample the neural architecture in a particular proportion to speed up these search phases. Compared with other previous methods, our method needs less time in the searched phases while still obtaining better classification accuracy.
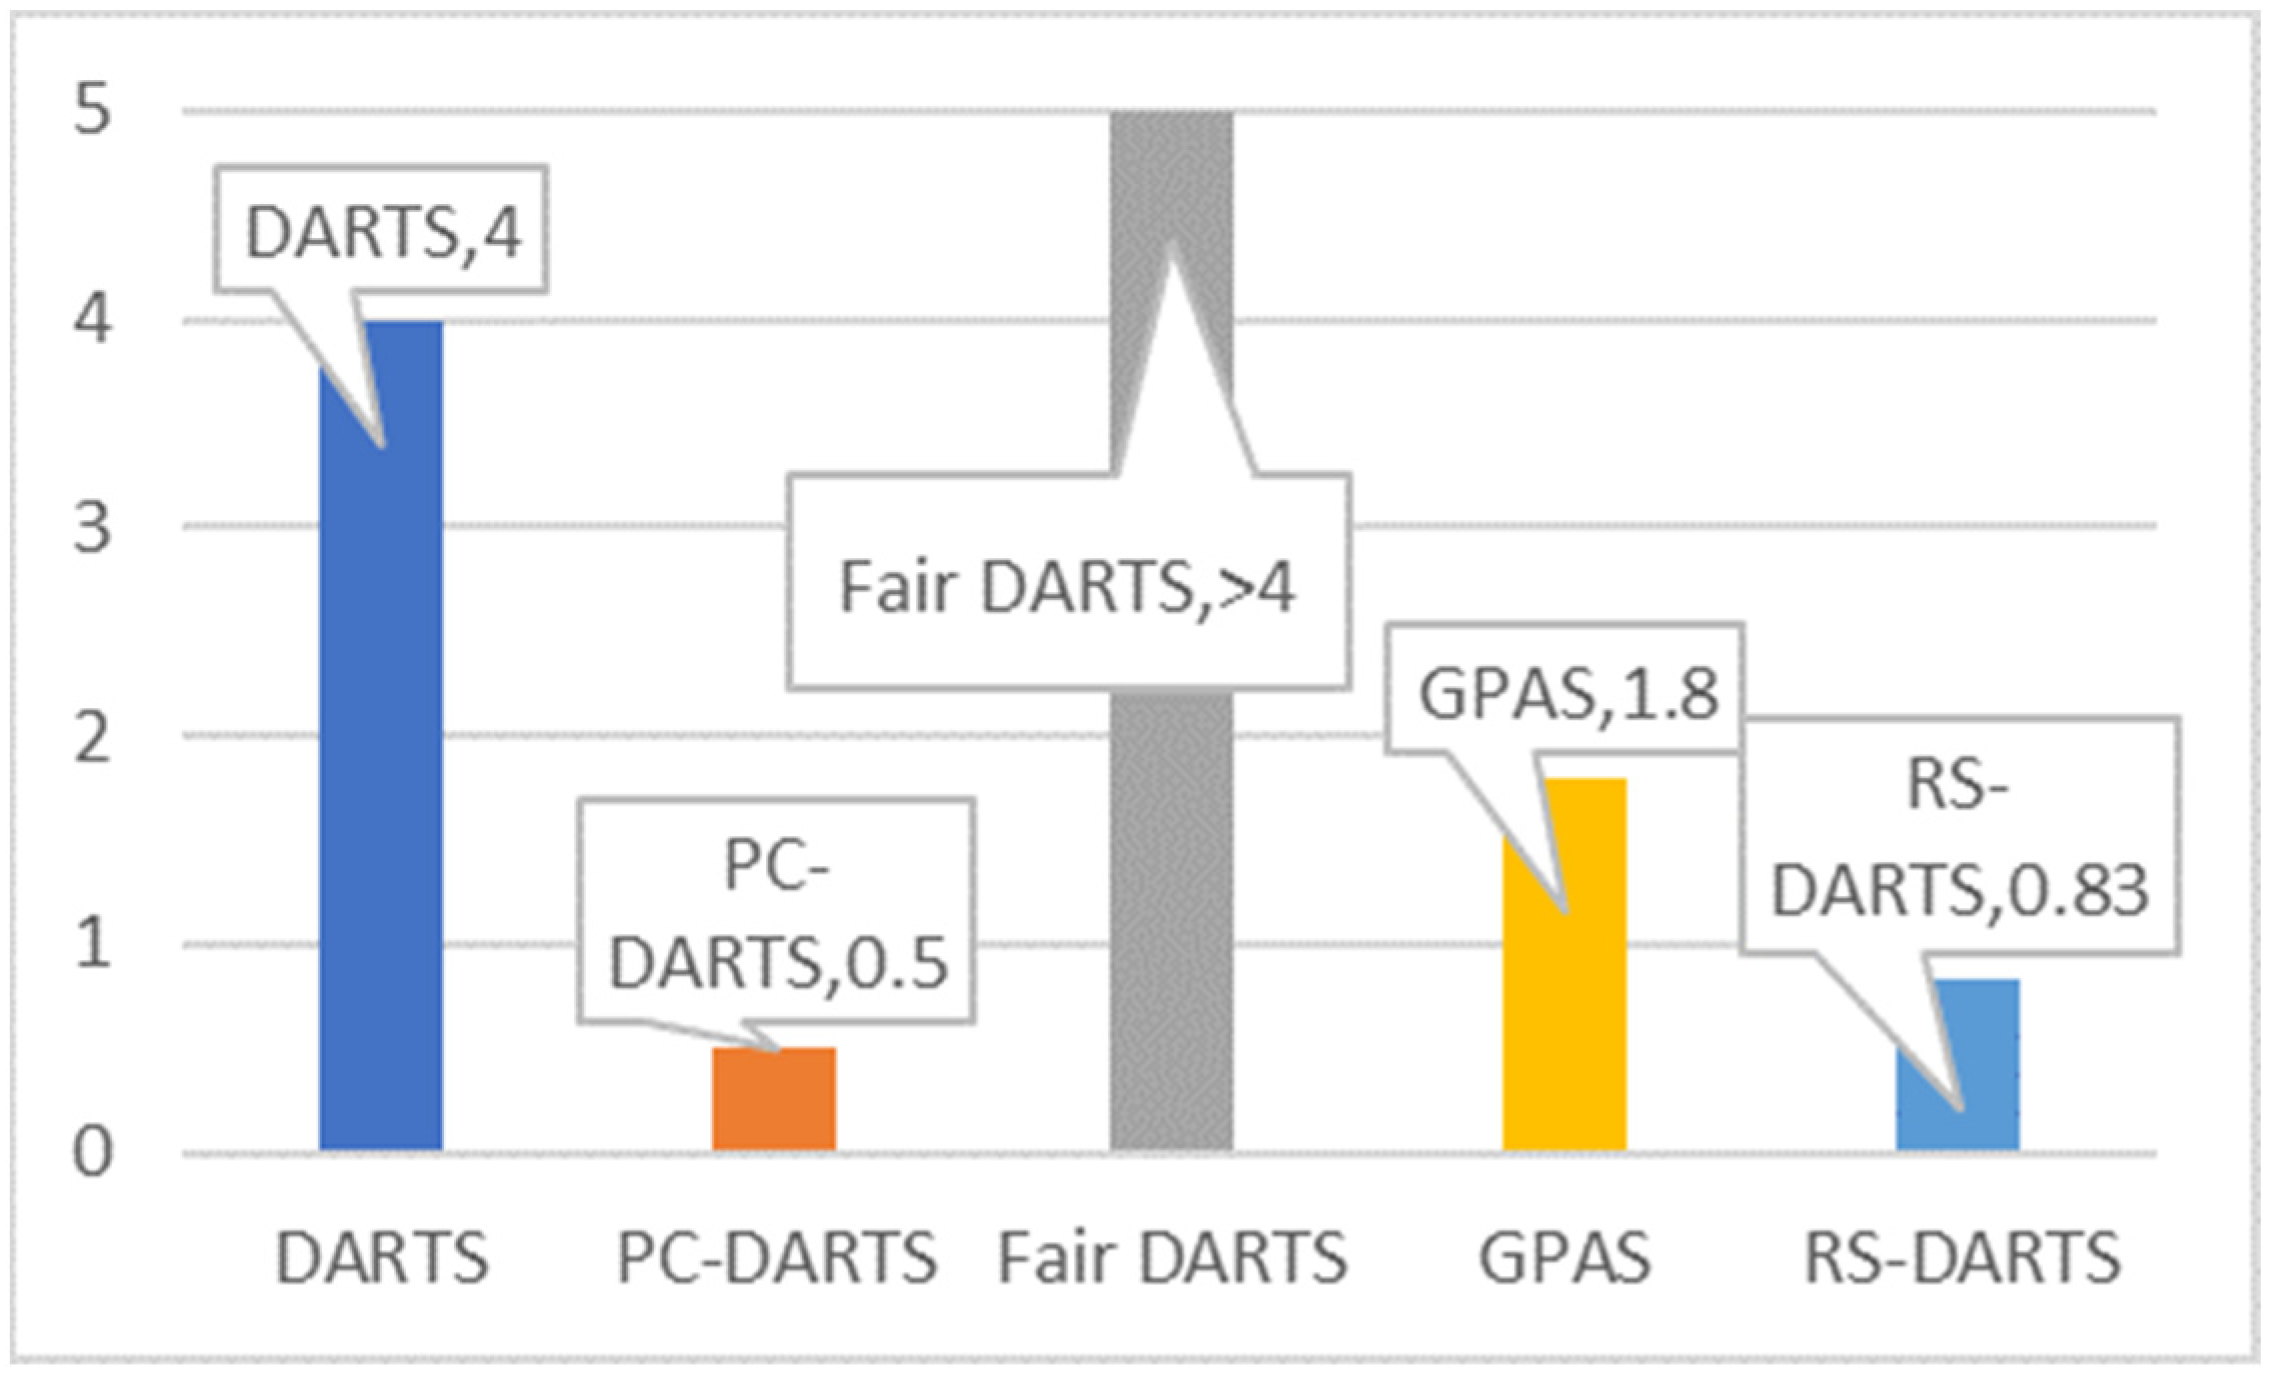
(4) The effectiveness of the proposed RS-DARTS framework is demonstrated on four public benchmark datasets. Extensive experiments reveal that the final discovered optimal CNN model achieves better classification than the fully trained and pre-trained CNN model. Moreover, the framework performance is better than that of other NAS methods (includes some NAS methods applied to natural images and remote images, respectively) in terms of search efficiency and time consumption. By comparison, RS-DARTS achieved state-of-the-art accuracy of remote sensing image scene classification and improved search time cost by nearly five times compared to DARTS.
The remainder of this article is organized as follows. Section 2 discusses and summarizes CNN models and development of the NAS frameworks. Section 3 describes the principle of differentiable architecture search methods, then we present our approach. In Section 4 and Section 5, the description of dataset, experiment setup, and classification result are shown. Finally, the conclusion is shown in Section 6.

2. Related Works

In past years, CNN-based methods have become the most popular method, with a powerful ability to extract features for aerial images. A suitable CNN architecture decides the performance of scene classification. Nevertheless, designing a new suitable model starting from scratch is a time-consuming process. NAS, as a framework for automatically designed model architecture, has gained wide attention in recent years. The NAS method has an impressive performance in many image tasks, including scene classification. This section provides a brief introduction about CNN-based and NAS methods and how to apply remote sensing scene classification.

2.1. CNN-Based Methods

CNN has shown astounding performance in image understanding tasks due to the advantage of automatic feature extraction.
Some methods directly use existing CNN models (pretrained, using CNNs as feature extractors). For instance, Fang et al. [24] proposed a MACP-based classification framework consisting of three steps. First, a pretrained CNN model was used to extract multilayer feature maps. Then, the feature maps were stacked, and a covariance matrix was calculated for the stacked features. Finally, the extracted covariance matrices were used as features for classification by a support vector machine. In reference [25], the author proposed a novel dataset, namely, NWPU-RESISC45, and several representative methods were evaluated with the dataset without using any data augmentation technique, including pretrained AlexNet, GoogLeNet, and VGGNet-16. Zheng et al. [13] attempted to extract CNN activations from the last convolutional layer of pretrained CNN. Then, the method performed multiscale pooling on these activations and made contact with the Fisher vector [26] approach to build a holistic representation. The work [27] utilized pretrained CNN such as VGG to extract dense convolutional features, flatten these features into a vector to generate visual words, and finally use these visible words for classification.
Some methods train a new CNN model from scratch for the scene classification task. For instance, Liu et al. [28] introduced a triplet network from scratch, where the network used weakly labeled images as network inputs. Besides, a new loss function was constructed to improve classification accuracy. F. Zhang et al. [29] proposed a gradient-boosting random convolutional network framework and introduced a multiclass softmax into the framework for scene classification. The paper [30] presented a fast regional-based CNN to detect ships from remote sensing images. It adopted an effective target detection framework and improved the structure of its original CNN. The results showed that training the model from scratch made the feature extraction procedure more effective.
In recent years, some new strategies have been proposed. These methods aim to address several special issues, such as spatial features, limited data, and interclass similarity [31]. For instance, [32] imposed a metric learning regularization term on CNN features, which can boost remote sensing image scene classification performance. Zhu et al. [33] proposed an attention-based deep feature fusion framework. The deep features derived from original images and attention maps were fused by multiplicative fusion, improving the ability to distinguish scenes of repeated texture and salient regions. Li et al. [34] raised the level of model learning from the sample to the task by organizing training in a meta way. The method learned a metric space that could help the model classify remote sensing scenes. The work in [35] developed a deep few-shot learning method based on prototypical deep neural networks combined with a SqueezeNet pretrained CNN for image embedding.
Most of these methods based on CNNs are designed directly for natural images. Unfortunately, the significant differences between natural and aerial images limit the performance of these methods when dealing with remote sensing scene classification directly. In other words, using existing CNNs or modifying modules in the CNN is not the optimal approach to further improve the classification performance.

2.2. NAS Methods

Neural architecture search as an automatic framework for designing the model architecture has attracted much attention. NAS aims to find an optimal architecture in a predefined search space and has a better performance in image classification in the validation phase. Although earlier NAS approaches can simplify the process of designing CNN models, reinforcement learning-based (RL-based) NAS [36] and evolutionary algorithm-based (EA-based) NAS [37] are still time-consuming and computationally expensive. In the search phase, these methods require many computing resources and consume hundreds of GPU days. In recent years, the demand for computing resources has decreased for NAS [38]. In [39], DARTS (Differentiable Architecture Search) used a new strategy to search the architecture over a continuous domain, which relaxed the search space to be continued and allowed the efficient search of the architecture by gradient descent. DARTS only consumed a few GPU days in the search phase and obtained a high classification accuracy in CIFAR10 and ImageNet. However, the DARTS performance often collapsed due to overfitting in the search phase, which resulted in a large gap between training and validation error [40]. To avoid these problems, researchers have made the following attempts.
GPAS [41] and Auto-RSISC [42] were based on a gradient descent framework to solve remote sensing scene classification. These methods aim to find more suitable convolution network models. GPAS used a greedy and progressive search strategy to strengthen the correlation between the search and evaluation phases [41]. Auto-RSISC sampled the neural architecture in a particular proportion to reduce the redundancy in the search space [42].
Although GPAS and Auto-RSISC have applied NAS to remote sensing scene classification, there are still some snags. GPAS considers the problem of model collapse, but it requires many computational resources during the training process. Auto-RSISC reduces the redundancy in the search space by sampling the neural architecture in a certain proportion. However, it limits the performance of the model and reduces the diversity of the model structure. To solve these drawbacks, a novel gradient descent-based paradigm method is proposed to design a suitable architecture for scene classification. Using the collaboration mechanism, the binarization of structural parameters and adding noise to the skip connection guarantee a much higher correlation between the search and evaluation phases. Then, we sample the neural architecture in a particular proportion to reduce the redundancy in the search space. Compared with GPAS and Auto-RSISC, the RS-DARTS method not only produces a state-of-the-art performance in remote sensing scene classification but also reduces GPU days in the search phase.

3. The Proposed Method

In this section, the differentiable architecture search methods (DARTS) are introduced, and the limitations of the methods are analyzed [
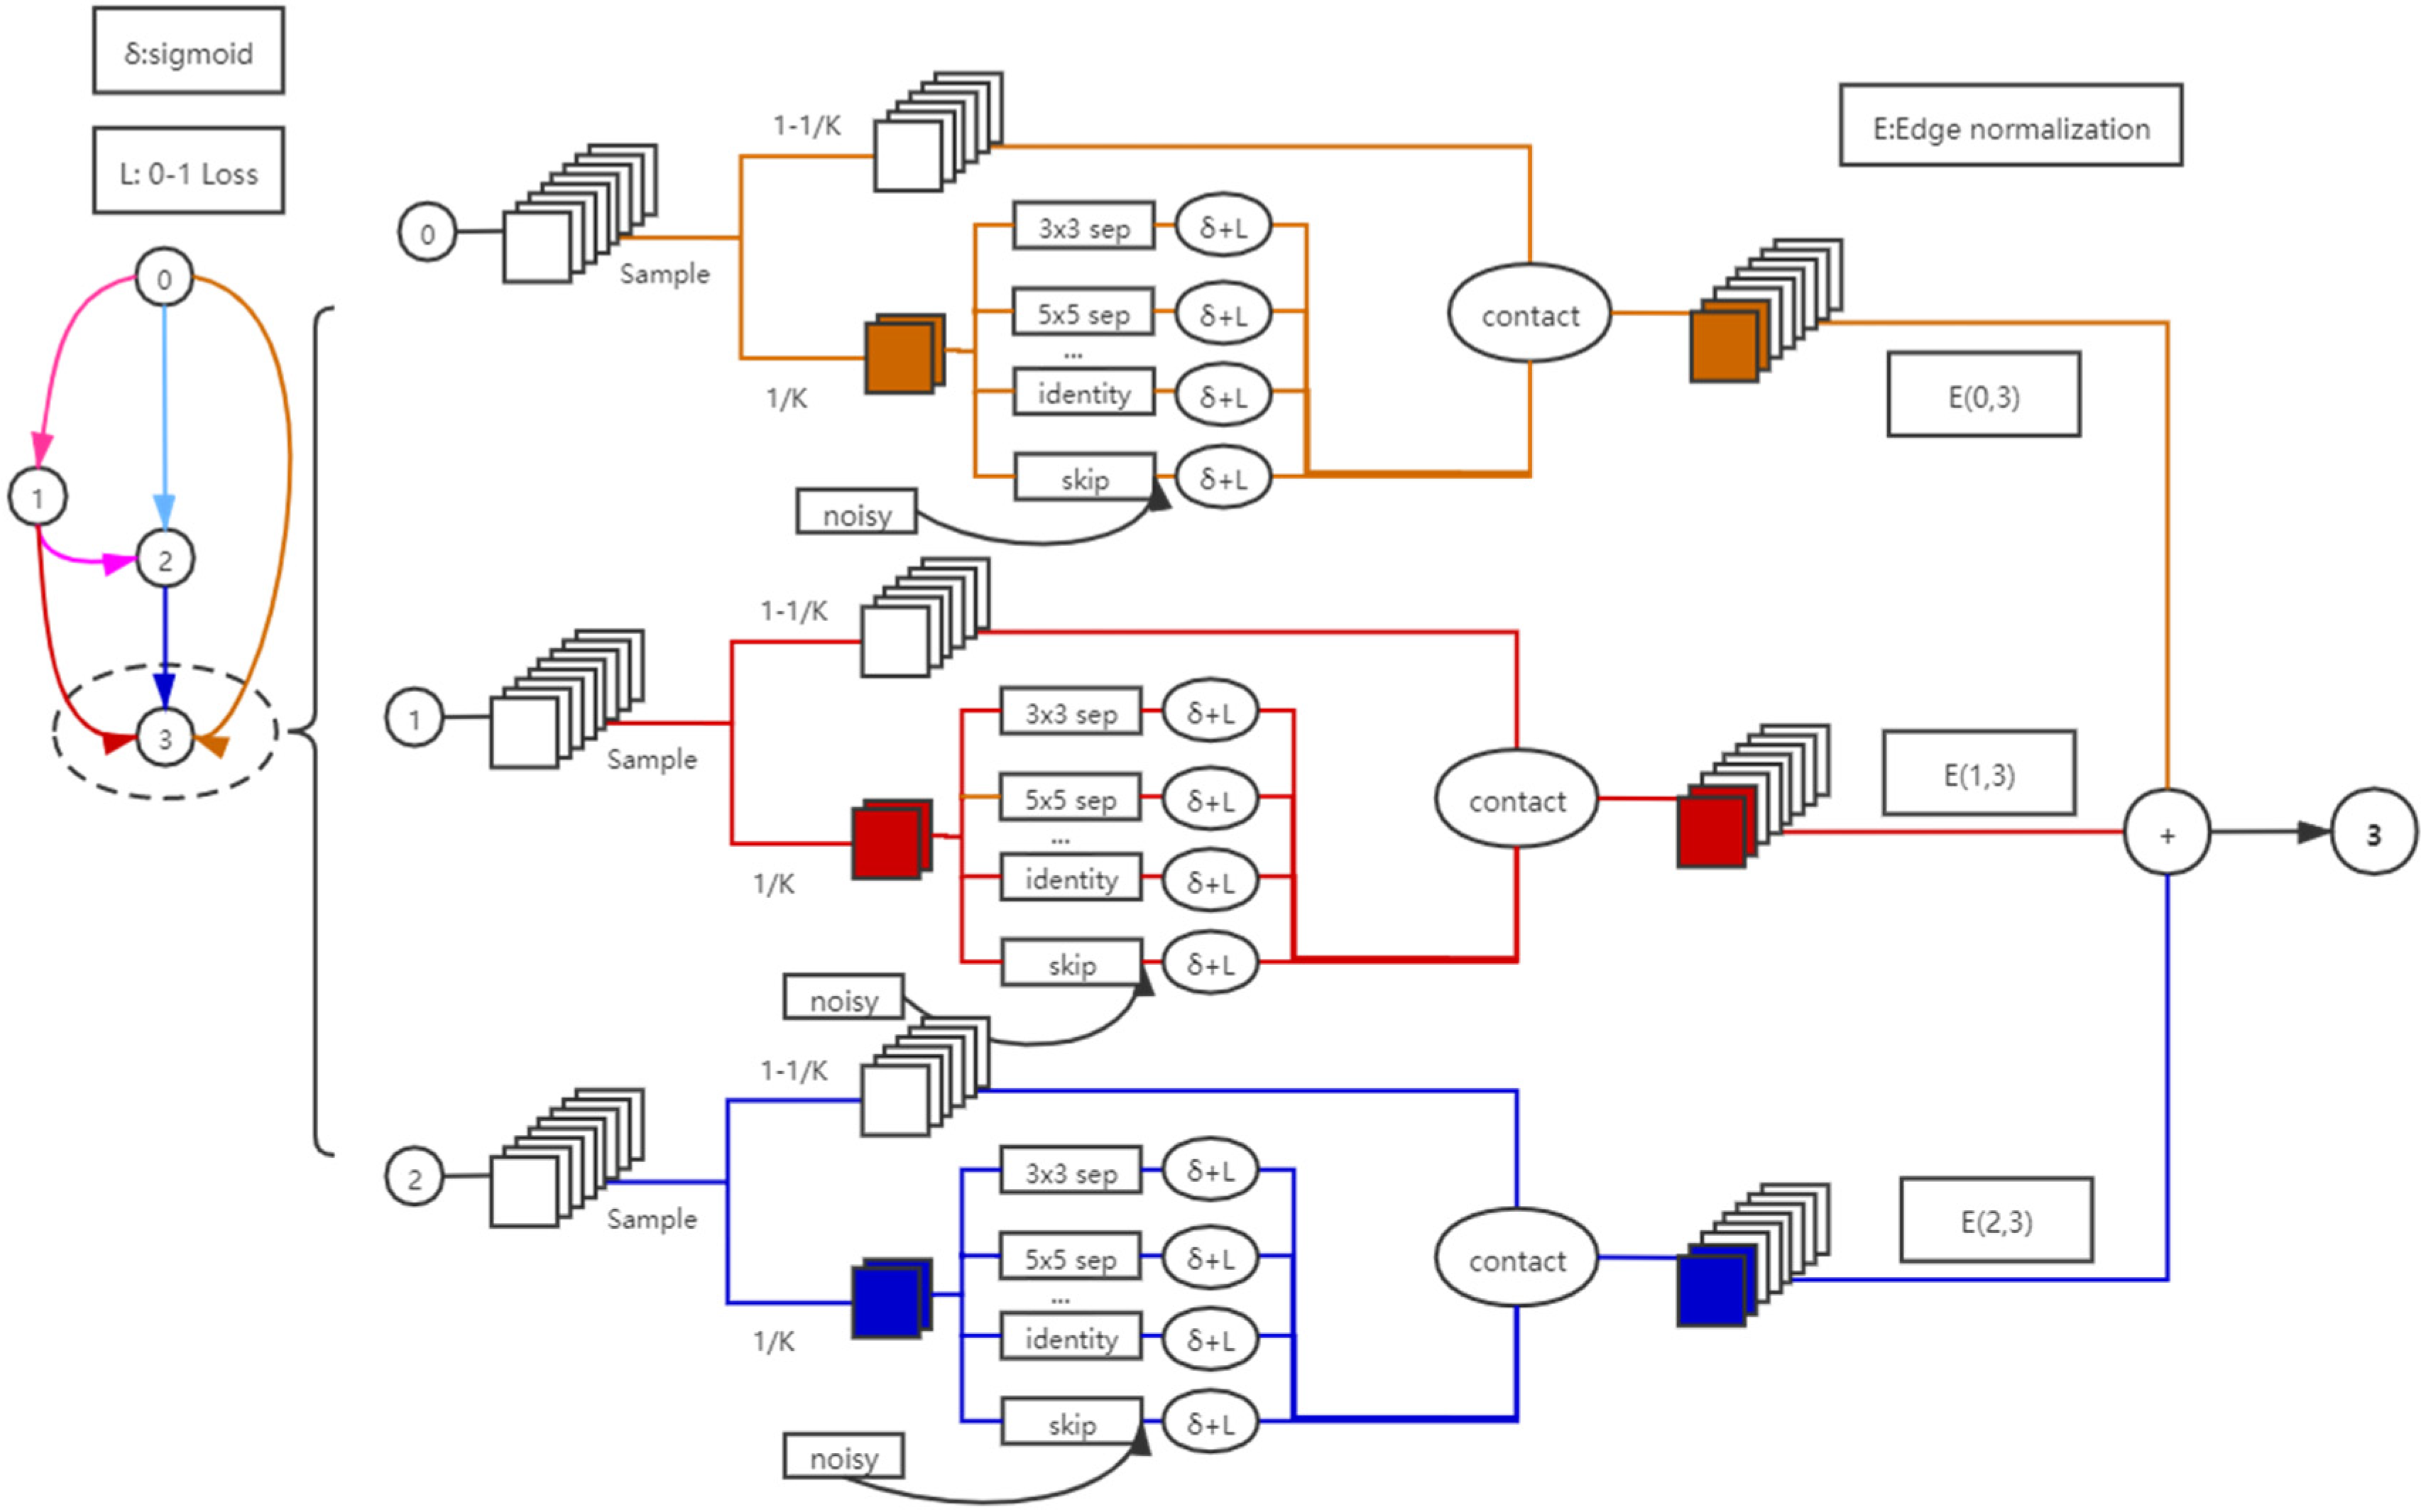
41]. Then, the proposed search framework is described, and some rules are introduced to strengthen the correlation between the search and evaluation phases. In addition, noise is added to alleviate the collapse in the search phase, and the sample rule is proposed to reduce redundancy in the search phase. The overall framework of the algorithm in this work is illustrated in Figure 1.
As an example, we investigate how information is propagated to node   3. There are three symbols during the search phase, namely, δ , L and E . Here, δ represents the sigmoid function. L represents the 0–1 Loss function, and E represents edge normalization. These functions and symbols are explained in Section 3.2. To determine the calculation results, we only sample a subset, 1 / K , of channels and connect them to the next stage so that the memory consumption is reduced by K times [42,43]. During sample processing, δ and L are used to make the calculation smoother and distinguish candidate operations easily. Meanwhile, noise was added to the skip connection to reduce competitiveness with other operations. Then, to minimize the uncertainty incurred by sampling, we use E for normalization.

3.1. Preliminary: DARTS

As a gradient-based approach, DARTS is much simpler than other search frameworks and can produce high-performance architectures in many tasks. Compared with RL-based and EA-based NAS methods, DARTS does not use the controller [36,44], hypernetworks [45], and performance predictors [46]. Gradient descent mechanism allows DARTS to find suitable network architectures with few GPU days.
Following these works [33,40,41], DARTS first searched for an optimal computation cell in the search phase. The searched optimal cells stack to form a convolutional network or are recursively connected to form a recurrent network. A cell, as a directed acyclic graph (DAC), consists of an ordered sequence of N nodes. Each node x ( i ) is a latent representation, which represents a feature map in a convolutional neural network. Each directed edge (i,j) in the DAG represents a candidate computational operation o ( i , j ) that transforms x ( i ) . In DARTS, it sets the cell to have two input nodes and one output node. Each intermediate node is calculated based on its predecessor nodes [39]. Node x ( j ) is obtained by calculating node x ( i ) via Equation (1).
x ( j ) = i j o ( i , j ) ( x ( i ) ) ,
where o represents the candidate computing operation (e.g., convolution, max pooling, zero) for edge ( i , j ) . To make the search space continuous, DARTS uses the softmax function to relax the categorical choice of a particular operation. The softmax function calculation formula is as follows.
o ¯ ( i , j ) = o O e x p ( α o ( i , j ) ) o ` O e x p ( α o ` ( i , j ) ) o ( x ) ,
where the operation mixing weights for o ( i , j ) are parameterized by a vector α ( i , j ) of dimension | O | . The task of the search method reduces learned a set of continuous variables α = { α ( i , j ) } . After of the relaxation, the architecture α and the weights w are jointly learned within all the mixed operations (e.g., weights of the convolution filters). The L t r a i n and L v a l denote loss function for training and validation in the search phase, and determine both the architecture parameters α and the weight w in the network. The goal for architecture search is to find α * that minimizes the validation loss L v a l ( w * , α * ) , where the weights w * associated with the architecture are obtained by minimizing training loss w * = a r g min w L t r a i n ( w , α * ) [31]. DARTS uses a bilevel optimization approach to realize this goal, shown in Equations (3) and (4), where α is the higher-level variable, and w is the lower-level variable.
min α L v a l ( w * ( α ) , α ) ,
s . t . w * ( α ) = a r g min w L t r a i n ( w , α ) ,
Bilevel optimization is more complex than other optimization methods, which requires lots of computation resources. DARTS applies an approximate approach to solve the problem. The approximation scheme as follows:
α L v a l ( w * ( α ) , α ) α L v a l ( w ε w L t r a i n ( w , α ) , α ) ,
where w denotes current weights maintained by the algorithm, and ε is learning rate for a step of the inner optimization. If w has reached the local partial optimum, namely w L t r a i n ( w , α ) = 0 , Equation (5) can be simplified as w L v a l ( w , α ) = 0 . In other words, we update the training parameters by the crossover method and finally achieve convergence. For instance, we first update α and used it to update the network weight ω . Then, the new network weight ω * is used to update the operations weight α . The method has been applied to many works, such as meta-learning for model migration [47], gradient-based hyperparameter fine-tuning [48], and unfolded generative adversarial networks [49].
Although DARTS dramatically reduces the search time, there are still some problems. First, the optimal normal cell seared by DARTS involves many skip connections in the selected architecture, making the architecture shallow and exhibiting poor performance. First, a shallow network has fewer learnable parameters than a deep network, and thus, it has weaker expressive power. Second, the redundant space of network architecture causes heavy memory and computation overheads. At the same time, the problem is exacerbated by processing high-resolution remote sensing images. These problems prevent the search process from using a larger batch size to either speed up or obtain higher stability [43]. A novel search framework is proposed to address these drawbacks, which is more efficient and suitable to solve remote sensing image tasks. The details of our presented framework are shown in Section 3.2.

3.2. Remote Sensing DARTS for Scene Classfication

3.2.1. Collaboration Mechanism and Binarization of Structural Parameters

In the search phase of DARTS, the skip connection is similar to the residual connection of ResNet [50]. It can help the framework obtain superior accuracy in the search phase. However, the α value of the skip connection becomes large when the number of search epochs is large. Thus, the number of skip connections increases in the selected architecture, which can cause collapse in the search phases. Meanwhile, the softmax function is based on exclusive competition, and it enhances the growth of the unfair competitive advantage of the skip-connection [51].
To solve the unfair competition between skip-connections and other operations, we use a cooperative mechanism to limit it. The sigmoid function ( δ ( x ) ) is used to replace softmax function to calculation parameter α o ( i , j ) . It can help each operation selected independently without any competition. Equation (2) is modified as follows,
δ ( x ) = 1 1 + e x ,
o ¯ ( i , j ) ( x ) = o ϵ O δ ( α o ( i , j ) ) o ( x ) ,
At the same time, when discretizing continuous encoding, DARTS suffers from discrepancies [39]. In the search phases of DARTS, the structure parameter α takes a value in the range of 0.1 0.3 . The range is too narrow to distinguish between good and bad candidate operations [51]. For instance, we select an edge of the cell, [0.1310, 0.1193, 0.1164, 0.1368, 0.1247, 0.1205, 0.1304, 0.1210], and these values are very close to each other. The highest value is 0.1368, and the next highest value is 0.1310, so it is hard to say an operation weighted by 0.1368 is better than another weighted by 0.1310. To solve the problem, the 0–1 loss function is proposed to restrict the sigmoid function results produced. The value of the structure weight can only be 0 or 1. Therefore, when selecting the final operation, we will choose the operation with a weight value of 1. If there are multiple weights of 1 in a set of data, these operations are tried and selected as the most profitable operation. The processing is similar to DARTS, where the two operations with the highest weight are selected [39]. The 0–1 loss function is expressed as follows.
L 0 1 = 1 N i N ( δ ( α i ) 0.5 ) 2 ,
where the Equation (8) is like L2-norm, it easily makes the weight of operations achieved 0 or 1 and helps distinguish between good and bad operations. A control variable w 0 1 is added to control the strength of the L 0 1 function. The final loss function is as follows:
L = L v a l ( w * ( α ) , α ) + w 0 1 L 0 1 ,
Then, Equation (3) will be modified to 10.
min α L v a l ( w * ( α ) , α ) + w 0 1 L 0 1 ,

3.2.2. Adding Noise in Skip-Connection

Using only a collaboration mechanism is not an excellent solution to solve the unfair competition in search phases. The collapse of the model still occurs when searching computation cells. Unbiased random noise is applied in the output of skip connects [52]. This not only suppresses unfair competition but also helps the training of deep models [53]. Thus, a small and unbiased noise is introduced, which has zero mean and small variance.
As random noise x ˜ adds to the output of skip connection, and α s k i p represents the structural weight of skip connection. The expression of the loss function for skip connection can be written as,
L = L v a l ( y * ) ,   y * = δ ( α s k i p ) ( x + x ˜ ) ,
where L v a l ( y * ) represents the validated loss function and δ ( α s k i p ) represents the sigmoid function to calculate α s k i p . If the noise is much smaller than the output values, then we can get Equation (12),
y * δ ( α s k i p ) x   when   ( x ˜ x ) ,
In the noisy scenario, the derivation of the skip connection is expressed in Equation (13).
L α s k i p = L y y α s k i p = L y δ ( α s k i p ) α s k i p ( x ˜ + x ) ,
As mentioned above, if x ˜ x , there is no effect on the computed output. In this work, the Gaussian noise is used to attenuate the unfair competition of the skip connection. Equation (6) should be modified to (14),
o ¯ ( i , j ) ( x ) = k = 1 M 1 δ ( α o k ( i , j ) ) o k ( x ) + δ ( α o s k i p ( i , j ) ) o s k i p ( x ˜ + x ) ,

3.2.3. Sample 1/K of All Channels into Mixed Computation

Despite its sophisticated design, DARTS still has a spatial redundancy problem in search phases and suffers from heavy memory and computation overheads [48]. To solve this problem, we randomly sample a subset while bypassing the rest directly in a shortcut [43]. The ideal method avoids sending all channels into the operation selection. The computation on this subset is an approximate agent and calculation on all channels. It can cause a tremendous reduction in the memory and computation costs and help to avoid getting stuck in local optima.
Using the strategy can significantly increase the batch size and speed up the trained processing. Specifically, as only 1/K of channels are randomly sampled for an operation selection, it reduces the memory burden by almost K times [42,43]. The rule allows using a K times large batch size during training, which not only speeds up the network search but also makes the process, particularly for large scale datasets, more stable. The parameter S ( i , j ) is introduced to define whether the channel is marked or not. The selected channel is marked as 1, and the unselected channel is marked as 0. Therefore, Equation (14) in determining the channel is expressed as follows.
o - ( i , j ) = k = 1 M 1 [ ( δ ( α o k ( i , j ) ) o k ( S ( i , j ) × x i ) + ( 1 S ( i , j ) × x i ) ) + ( δ ( α o s k i p ( i , j ) ) o s k i p ( S ( i , j ) × ( x ˜ + x i ) ) + ( 1 S ( i , j ) ) × x i ) ] ,
where S ( i , j ) × x i represents the selected channels and ( 1 S ( i , j ) ) × x i represents the unselected channels. But the sampled strategy can cause undesired fluctuation in the resultant network architecture [43]. To alleviate the problem, we introduce edge normalization, the computation of x j becomes:
x ( j ) = i < j e x p β ( i , j ) i < j e x p β ( i , j ) o ( i , j ) ( x ( i ) )   ,
where β ( i , j ) represents the normalization operation on ( i , j ) . These parameter β ( i , j ) and α o ( i , j ) decide the connectivity of edge ( i , j ) . The modified optimization process codenamed RS-DARTS is shown in Algorithm 1. Paying attention to the value of ε , it is assigned to the learning rate for the optimizer of the network weight w .
Algorithm 1 Remote Sensing DARTS for Scene Classification algorithm
  • Input: Initialize the following parameters: Architecture parameter α ( i , j ) , network weight   w , noise control parameter φ , 0–1 Loss control parameter w ( 0 1 ) , learning rate ε , Epoch Max
  • While: not reach Epoch Max do
  • Data segmentation:
    •  1: Initialize the network weight w , learning rate ε ;
    •  2: Sample 1/K feature map using computation;
    •  3: Inject random Gaussian noise x ˜ into the skip connection output;
    •  4: Update architecture α by descending α L v a l ( w ε × w L t r a i n ( w , α ) , α ) ;
    •  5: Update the network weight w by w L t r a i n ( w , α ) ;
  • Endwhile
  • Derive the final architecture and output the architecture parameter α ( i , j )

4. Experiments

In this section, the experimental setup for evaluating the proposed method is described. First, Section 4.1 introduces the used data sets. Then, in Section 4.2, the metric for quantitative evaluation is described. In Section 4.3, a new large-scale dataset is merged and explains the reasons for merging the dataset. Finally, the implementation of the proposed method is shown in Section 4.4.

4.1. Datasets Description

In the experiments, four remote sensing scene datasets, namely, AID [54], NWPURE-SISC(NWPU) [25], RSI-CB [55], and PatternNet [56] datasets (These data resources can be obtained from https://captain-whu.github.io/AID/AIDscene.html, http://www.escience.cn/people/JunweiHan/NWPU-RESISC45.html, https://github.com/lehaifeng/RSI-CB and https://sites.google.com/view/zhouwx/dataset, accessed on 19 November 2020, respectively), are used to validate the performance of the proposed method. Since these datasets are collected from different satellite sensors, they show rich diversities, such as image size and resolution. The description of these datasets is shown in Table 1. The table shows that the maximum of the total images is for the NWPU dataset. For images/classes, the PatternNet dataset has the largest number with 800. In addition, Figure 2 shows some examples of different datasets. The first column is random sampled from AID; Scend column is from NWPU-RESISC45; The third and the last column are sampled from PatternNet and RSI-CB, respectively.

4.2. A Metric for Evaluation

In this paper, to assess the classification accuracy of the proposed method, overall accuracy (OA) is employed as a criterion. The OA is defined as follows.
O A = 1 N i = 1 N j = 1 B x ( i , j ) ,
where x ( i , j ) represents the accuracy for the ( i , j ) th result, and N is the total number of the recording results. B represents the number of the image for each batch size.

4.3. Prepared Data Sets

As mentioned in Section 4.1, NWPU has the maximum number of total images, but in a single class, PatternNet has the largest number of images. These two datasets can be used as training sets in the search phase of RS-DARTS. Forty percent of the sample data are selected as the training set in the search phase to obtain the final network. The network is trained in the four benchmark datasets. The classification results are shown in Table 2, where the results of the final network from NWPU-based search achieve 86.77%, 90.06%, 99.02%, and 98.93%, respectively. However, the accuracy of PatternNet-based search is better than that of NWPU-based search. This illustrates that the size of the amount of data in a single category directly affects the performance of the searched final CNN models. A large dataset can help find a suitable and robust CNN model for remote sensing image scene classification.
However, compared with the ImageNet dataset, the AID, NWPU, etc., datasets are smaller. In addition, remote sensing images from different datasets are collected by different sensors at different surface locations. This leads to some differences between these datasets [11]. Therefore, we use these rules to merge the four large benchmark remote sensing scene datasets to obtain a large dataset called Large-RS, which consists of 96,252 images with 80 classes. As the merged dataset and the GPAS model [11] are not open sources, we merged Large-RS using the same rules and divided it according to the same scale. These rules of merging are as follows.
(1) Since these datasets are from different institutions, the same scene from different datasets may be labelled with another name. A new uniform class names rule is used.
(2) We reclassified and merged some of the images that contained overlapping scene content but did not belong to the same category.
(3) Due to some ambiguous category definitions or a small number of images in different datasets, we directly removed these category data.

4.4. Implementation Details

To evaluate the effectiveness of the presented method, the experiment is split into two parts. In the search phase, the optimal cell architecture is searched by the proposed RS-DARTS on the Large-RS dataset. This is divided into three subsets based on stratified sampling, i.e., 40% (60%) samples for training, 20% samples for validation, and 40% (20%) samples for testing. In the evaluation phase, the final CNN model is constructed by the optimal cell. Then the final network uses these four benchmark datasets (e.g., AID, NWPU, RSI-CB, and PatternNet) through the full-training method to train from scratch. The hardware and software environments are shown in Table 3.
In the search phase, we predetermine the search space O , which contains 3 × 3 and 5 × 5 separable convolution, 3 × 3 and 5 × 5 dilated separable convolution, 3 × 3 max-pooling, 3 × 3 average pooling, identity and none. All of the training images are resized to 224 × 224 pixels to capture more image information. Some data augmentation technologies are used to avoid overfitting and ensure the robustness of the searched architectures. These augmentation technologies include random cropping, rotation and flip, and cutmix. The hyperparameters are shown in Table 4.
In the evaluation phase, the optimal searched cell is stacked to construct the final CNN model and trained in the four benchmark datasets. We train the final optimal model from scratch for 500 epochs to ensure convergence. In this phase, we also employ cutmix and cutout regularization to add the number of images. The hyperparameters are shown in Table 5. Except for the hyperparameter settings mentioned in the above table, all the hyperparameters are the same as in Table 4.

5. Results and Analysis

In order to verify the validity of RS-DARTS, the experimental results of the proposed method are analyzed. At first, the performance of RS-DARTS contrasts with classical CNN models. Next, the proposed RS-DARTS compares with four state-of-the-art NAS methods to confirm the efficiency and robustness. Finally, the architecture search visual results are presented.

5.1. Compared with CNN Models

In the experiments, to validate the classification performance of the final search network, it is compared with the classical CNN models (i.e., fully trained and pretrained) on remote sensing images. The final searched network is stacked by the best search cell. These classical CNN models include VGG-16 [57], GoogleNet [58], and ResNet-50 [50], which are often used as feature extractors in various CNN-based approaches on remote sensing scene classification. For the training datasets, the proportions of training samples in the AID, NWPU, RSI-CB, and PatternNet datasets are set to 50%, 60%, 60%, and 50%, respectively. The final classification results are illustrated in Table 6, where the fifth to the seventh rows of the list presents the classical CNN models with pretrained results. For a fair comparison, these pretrained models are initialized based on ImageNet and fine-tuned on the target datasets. All others row lists are randomly initialized and trained from scratch.
In Table 6, for the AID dataset, the accuracy of the fully trained method is 93.37%, and that of the pretrained method is 93.90%. However, the classification accuracy of the final network searched by RS-DARTS achieves 94.14%. Compared with that of the fully trained and pretrained methods, our proposed approach achieves the highest classification accuracy. For the NWPU, RSI-CB, and PatternNet datasets, the accuracy of the proposed RS-DARTS compared with that of fully trained models is improved by 6%, 2%, and 2%, and contrasted with that of pretrained classical model methods, the accuracy of classification is improved by 1%. In the experiments, in the case of fewer training samples (40% training samples), the final network obtained from RS-DARTS has slightly lower accuracy than other pretrained CNN models in the AID dataset but has a significant improvement in the accuracy of different datasets. This reveals that the proposed NAS-based method can help improve the remote sensing scene classification performance. The pretrained classical CNN method is not the optimal method for remote sensing scene classification. Meanwhile, the classification accuracy for the RSI-CB, and PatternNet datasets is higher than that for the AID, and NWPU datasets. The reason is that each category amount of data for the former is relatively larger compared to the latter, thus making the CNN model easier to identify the image category. This is why merging the Large-RS dataset could help the final CNN model achieve better accuracy of scene classification.

5.2. Compared with Other NAS Methods

In the second experiment, the efficiency and robustness of RS-DARTS are verified by comparison with four state-of-the-art gradient NAS methods, which include DARTS [39], PC-DARTS [43], Fair DARTS [51], and GPAS [41]. For these selected NAS methods, the configuration is the same as in previous works [35,37,46,48]. The merged dataset Large-RS (40% training samples) is used for training in the search phase. The OA, the search cost (the number of GPU days), and the number of parameters are used as the criteria to judge the effectiveness of the NAS methods and RS-DARTS. Among them, the number of parameters determines the size of the final CNN model. Table 7 presents the OA results. Compared with the classification performance of the final CNN model from NAS methods on four datasets, the proposed RS-DARTS achieves the highest accuracy. For the NWPU dataset, RS-DARTS reaches 93.56%, which is much better than other gradient NAS methods. For other datasets, RS-DARTS achieves state-of-the-art accuracy. Compared with GPAS [41], the proposed RS-DARTS exhibits a 1% improvement in the NWPU, RSI-CB, and PatternNet datasets. Although the OA of RS-DARTS is weaker than that of GPAS in the AID dataset, the performance of the proposed method achieves state-of-the-art accuracy in other datasets. These results demonstrated that the benefit of the proposed rule prevents the collapse of the model during the searched phase and maintains the final network depth, which can guarantee the availability of the final network to address remote scene sensing classification.
Table 8 shows the results of the comparison of the number of parameters. For the AID dataset, DARTS produces the number of parameters of 2.3M, and PC-DARTS and GPAS have the number of parameters of 3.6M. However, the proposed RS-DARTS parameter number is 3.3M, which is a reduction of 0.3M compared to the PC-DARTS and GPAS parameter numbers. This may be due to limiting the advantage of the skip connections so that other operations are selected and increase the model parameters. It shows the effectiveness of our restriction on skip connections. Although more parameters were generated than DARTS, RS-DARTS spends significantly less time (0.83 GPU days) than DARTS (4 GPU days) in the search phase. The searched cost results are shown in Figure 3. RS-DARTS only costs 0.83 GPU days to find a competitive cell architecture, significantly reducing the search process time compared to DARTS (4 GPU days) and GPAS (1.8 GPU days). Although the number of parameters of the final CNN model obtained by RS-DARTS is increased by 1M, the search cost is lower and the method can guarantee higher classification accuracy.

5.3. Searched the Cell’s Result

In the NAS method, the architecture of the searched cell decides the effectiveness of the final CNN model. However, the inevitable aggregation of skip-connections in normal cells can collapse in the search phase [44]. To demonstrate the ability to control skip connections of RS-DARTS, in this section, RS-DARTS, DARTS, and PCDARTS are used to search the optimal cell architecture on the Large-RS dataset, and then these optimal cell architectures are compared with each other. Meanwhile, GPAS is compared with the proposed RS-DARTS method.
The detailed search results with DARTS and PCDARTS are shown in Figure 4. The normal cell architecture shown in Figure 4a,c,e is obtained from DARTS, PCDARTS, and RS-DARTS. These results reveal that the normal cell searched by RS-DARTS tends to preserve deep connections (e.g., connections) and pooling layers rather than shallow connections (e.g., skip connections). This promises that the normal cells from RS-DARTS contain more learnable parameters. Thus, the final CNN model searched by RS-DARTS has a stronger expressive ability. In other words, the normal cell searched by RS-DARTS guarantees the depth of the final network, which leads to better performance. For reduction cells (Figure 4b,d,f), it is found that the reduction cell searched by RS-DARTS reserves the skip connection in many deep connections, which guarantees solving the gradient explosion and gradient disappearance problems in the deeper network [50].
To further validate the effectiveness of RS-DARTS, GPAS and Auto-RSISC are compared with our proposed method. The results of the searched normal cell architectures of GPAS and Auto-RSISC are shown in Figure 5a and Figure 6a. The normal cell searched by RS-DARTS (Figure 4e) further reduces the number of skip connections which ensures the depth and expressiveness of the final network. For the reduction cell (Figure 4f, Figure 5b and Figure 6b), RS-DARTS provides the skip connection reserved in reduction cells. These results illustrate that the proposed method not only eliminates the enrichment of skip connections in a normal cell but also ensures the presence of skip connections in a reduction cell to make the network training more stable.

6. Conclusions

In this paper, we summarize the limitation of the features extracted from pre-trained CNN models and investigate the performance of the Neural Architecture Search for remote sensing scene classification. We find the drawback of GPAS and Auto-RSISC and propose a novel NAS framework applied to the task. Our framework uses a collaboration mechanism and binarization of the structural parameters search strategy with gradient-based optimization. These rules can alleviate the unfair competition between skip connections and others. However, we found that this strategy does not entirely avoid the problem of unfair competition. So we add a simple method that adds noise to skip connection to suppress the unfair competition further. To promote the speed of the search and reduce the memory and computation costs, we use a random sampling method to select feature channels. Moreover, to make the search model more generalizable, we merge a large-scale scene data set similar to VHRRS, namely Large-RS, using the combined dataset as the training validation dataset in the search process.
Extensive experiments demonstrate the efficiency of RS-DARTS framework and the impressive classification performance of searched CNN architectures on four public benchmark data sets. It shows that the framework is practical for remote sensing scene images. Then, our subsequent work applies the method to more remote sensing image problems. We believe that the NAS method will provide a new idea for model design in remote sensing images.

Author Contributions

Conceptualization, Z.Z.; Data curation, Z.Z.; Formal analysis, Z.Z.; Funding acquisition, W.C.; Investigation, Z.Z.; Methodology, Z.Z.; Project administration, Z.Z.; Resources, Z.Z.; Software, Z.Z.; Supervision, Y.Z. and W.C.; Validation, Z.Z. and S.L.; Visualization, Z.Z. and S.L.; Writing—original draft, Z.Z.; Writing—review & editing, Y.Z. All authors will be informed about each step of manuscript processing including submission, revision, revision reminder, etc. via emails from our system or assigned Assistant Editor. All authors have read and agreed to the published version of the manuscript.

Funding

This research received no external funding.

Data Availability Statement

The data presented in this study are available on request from the corresponding author.

Acknowledgments

We thank the researchers of the methods cited in this article for making their work available to the public. We are also grateful to the reviewers for their helpful comments and suggestions for improving the manuscript. The authors will also wish to thank the supercomputing center of Lanzhou University for providing computational resources.

Conflicts of Interest

The authors declare no conflict of interest.

References

  1. Cheriyadat, A.M. Unsupervised Feature Learning for Aerial Scene Classification. IEEE Trans. Geosci. Remote Sens. 2014, 52, 439–451. [Google Scholar] [CrossRef]
  2. Hu, F.; Xia, G.-S.; Hu, J.; Zhang, L. Transferring Deep Convolutional Neural Networks for the Scene Classification of High-Resolution Remote Sensing Imagery. Remote Sens. 2015, 7, 14680–14707. [Google Scholar] [CrossRef] [Green Version]
  3. Rogan, J.; Chen, D. Remote sensing technology for mapping and monitoring land-cover and land-use change. Prog. Plan. 2004, 61, 301–325. [Google Scholar] [CrossRef]
  4. Joint Dictionary Learning for Multispectral Change Detection|IEEE Journals & Magazine|IEEE Xplore. Available online: https://ieeexplore.ieee.org/document/7422756 (accessed on 30 July 2021).
  5. Nogueira, K.; Penatti, O.A.; dos Santos, J.A. Towards better exploiting convolutional neural networks for remote sensing scene classification. Pattern Recognit. 2017, 61, 539–556. [Google Scholar] [CrossRef] [Green Version]
  6. Densely Based Multi-Scale and Multi-Modal Fully Convolutional Networks for High-Resolution Remote-Sensing Image Semantic Segmentation|IEEE Journals & Magazine|IEEE Xplore. Available online: https://ieeexplore.ieee.org/abstract/document/8684908 (accessed on 30 July 2021).
  7. Zhu, X.X.; Tuia, D.; Mou, L.; Xia, G.-S.; Zhang, L.; Xu, F.; Fraundorfer, F. Deep Learning in Remote Sensing: A Comprehensive Review and List of Resources. IEEE Geosci. Remote Sens. Mag. 2017, 5, 8–36. [Google Scholar] [CrossRef] [Green Version]
  8. A Novel System for Content-Based Retrieval of Single and Multi-Label High-Dimensional Remote Sensing Images|IEEE Journals & Magazine|IEEE Xplore. Available online: https://ieeexplore.ieee.org/document/8391715 (accessed on 30 July 2021).
  9. Li, Y.; Peng, C.; Chen, Y.; Jiao, L.; Zhou, L.; Shang, R. A Deep Learning Method for Change Detection in Synthetic Aperture Radar Images. IEEE Trans. Geosci. Remote Sens. 2019, 57, 5751–5763. [Google Scholar] [CrossRef]
  10. Sun, W.; Liu, K.; Ren, G.; Liu, W.; Yang, G.; Meng, X.; Peng, J. A simple and effective spectral-spatial method for mapping large-scale coastal wetlands using China ZY1-02D satellite hyperspectral images. Int. J. Appl. Earth Obs. Geoinf. 2021, 104, 102572. [Google Scholar] [CrossRef]
  11. Wang, Z.; Du, L.; Zhang, P.; Li, L.; Wang, F.; Xu, S.; Su, H. Visual Attention-Based Target Detection and Discrimination for High-Resolution SAR Images in Complex Scenes. IEEE Trans. Geosci. Remote. Sens. 2017, 56, 1855–1872. [Google Scholar] [CrossRef]
  12. Ghamisi, P.; Maggiori, E.; Li, S.; Souza, R.; Tarablaka, Y.; Moser, G.; De Giorgi, A.; Fang, L.; Chen, Y.; Chi, M.; et al. New Frontiers in Spectral-Spatial Hyperspectral Image Classification: The Latest Advances Based on Mathematical Morphology, Markov Random Fields, Segmentation, Sparse Representation, and Deep Learning. IEEE Geosci. Remote Sens. Mag. 2018, 6, 10–43. [Google Scholar] [CrossRef]
  13. Zheng, X.; Yuan, Y.; Lu, X. A Deep Scene Representation for Aerial Scene Classification. IEEE Trans. Geosci. Remote. Sens. 2019, 57, 4799–4809. [Google Scholar] [CrossRef]
  14. Sun, W.; Ren, K.; Meng, X.; Xiao, C.; Yang, G.; Peng, J. A Band Divide-and-Conquer Multispectral and Hyperspectral Image Fusion Method. IEEE Trans. Geosci. Remote Sens. 2021, 60, 5502113. [Google Scholar] [CrossRef]
  15. Zhu, Q.; Zhong, Y.; Liu, Y.; Zhang, L.; Li, D. A Deep-Local-Global Feature Fusion Framework for High Spatial Resolution Imagery Scene Classification. Remote. Sens. 2018, 10, 568. [Google Scholar] [CrossRef] [Green Version]
  16. Yang, Y.; Newsam, S. Bag-of-visual-words and spatial extensions for land-use classification. In Proceedings of the 18th SIGSPATIAL International Conference on Advances in Geographic Information Systems, San Jose, CA, USA, 3–5 November 2010; pp. 270–279. [Google Scholar] [CrossRef]
  17. Jiang, Y.; Yuan, J.; Yu, G. Randomized Spatial Partition for Scene Recognition. In Computer Vision–ECCV 2012; Springer: Singapore, 2012; pp. 730–743. [Google Scholar]
  18. Yang, Y.; Newsam, S. Spatial pyramid co-occurrence for image classification. In Proceedings of the 2011 International Conference on Computer Vision, Barcelona, Spain, 6–13 November 2011; pp. 1465–1472. [Google Scholar]
  19. Chen, S.; Tian, Y. Pyramid of Spatial Relatons for Scene-Level Land Use Classification. IEEE Trans. Geosci. Remote Sens. 2015, 53, 1947–1957. [Google Scholar] [CrossRef]
  20. Li, E.; Xia, J.; Du, P.; Lin, C.; Samat, A. Integrating Multilayer Features of Convolutional Neural Networks for Remote Sensing Scene Classification. IEEE Trans. Geosci. Remote Sens. 2017, 55, 5653–5665. [Google Scholar] [CrossRef]
  21. Peng, J.; Sun, W.; Li, W.; Li, H.-C.; Meng, X.; Ge, C.; Du, Q. Low-Rank and Sparse Representation for Hyperspectral Image Processing: A Review. IEEE Geosci. Remote Sens. Mag. 2021, 2–35. [Google Scholar] [CrossRef]
  22. He, K.; Girshick, R.; Dollar, P. Rethinking ImageNet Pre-Training. 2019. Available online: https://openaccess.thecvf.com/content_ICCV_2019/html/He_Rethinking_ImageNet_Pre-Training_ICCV_2019_paper.html (accessed on 1 August 2021).
  23. Zoph, B.; Vasudevan, V.; Shlens, J.; Le, Q.V. Learning transferable architectures for scalable image recognition. In Proceedings of the IEEE Conference on Computer Vision and Pattern Recognition, Salt Lake City, UT, USA, 18–23 June 2018; pp. 8697–8710. [Google Scholar]
  24. He, N.; Fang, L.; Li, S.; Plaza, A.; Plaza, J. Remote Sensing Scene Classification Using Multilayer Stacked Covariance Pooling. IEEE Trans. Geosci. Remote. Sens. 2018, 56, 6899–6910. [Google Scholar] [CrossRef]
  25. Cheng, G.; Han, J.; Lu, X. Remote Sensing Image Scene Classification: Benchmark and State of the Art. Proc. IEEE. 2017, 105, 1865–1883. [Google Scholar] [CrossRef] [Green Version]
  26. Sánchez, J.; Perronnin, F.; Mensink, T.; Verbeek, J. Image Classification with the Fisher Vector: Theory and Practice. Int. J. Comput. Vis. 2013, 105, 222–245. [Google Scholar] [CrossRef]
  27. Zhao, W.; Du, S. Scene classification using multi-scale deeply described visual words. Int. J. Remote. Sens. 2016, 37, 4119–4131. [Google Scholar] [CrossRef]
  28. Liu, Y.; Huang, C. Scene Classification via Triplet Networks. IEEE J. Sel. Top. Appl. Earth Obs. Remote Sens. 2018, 11, 220–237. [Google Scholar] [CrossRef]
  29. Zhang, F.; Du, B.; Zhang, L. Scene Classification via a Gradient Boosting Random Convolutional Network Framework. IEEE Trans. Geosci. Remote Sens. 2016, 54, 1793–1802. [Google Scholar] [CrossRef]
  30. Zhang, S.; Wu, R.; Xu, K.; Wang, J.; Sun, W. R-CNN-Based Ship Detection from High Resolution Remote Sensing Imagery. Remote. Sens. 2019, 11, 631. [Google Scholar] [CrossRef] [Green Version]
  31. Zhu, Q.; Zhong, Y.; Zhang, L.; Li, D. Adaptive Deep Sparse Semantic Modeling Framework for High Spatial Resolution Image Scene Classification. IEEE Trans. Geosci. Remote Sens. 2018, 56, 1–16. [Google Scholar] [CrossRef]
  32. Cheng, G.; Yang, C.; Yao, X.; Guo, L.; Han, J. When Deep Learning Meets Metric Learning: Remote Sensing Image Scene Classification via Learning Discriminative CNNs. IEEE Trans. Geosci. Remote Sens. 2018, 56, 2811–2821. [Google Scholar] [CrossRef]
  33. Chen, H.; Shi, Z. A spatial-temporal attention-based method and a new dataset for remote sensing image change detection. Remote. Sens. 2020, 12, 1662. [Google Scholar] [CrossRef]
  34. Li, H.; Cui, Z.; Zhu, Z.; Chen, L.; Zhu, J.; Huang, H.; Tao, C. RS-MetaNet: Deep Metametric Learning for Few-Shot Remote Sensing Scene Classification. IEEE Trans. Geosci. Remote Sens. 2020, 1–12. [Google Scholar] [CrossRef]
  35. Alajaji, D.; Alhichri, H.S.; Ammour, N.; Alajlan, N. Few-Shot Learning for Remote Sensing Scene Classification. In Proceedings of the 2020 Mediterranean and Middle-East Geoscience and Remote Sensing Symposium (M2GARSS), Tunis, Tunisia, 9–11 March 2020; pp. 81–84. [Google Scholar]
  36. Zoph, B.; Le, Q.V. Neural Architecture Search with Reinforcement Learning. arXiv 2016, arXiv:1611.01578. [Google Scholar]
  37. Real, E.; Aggarwal, A.; Huang, Y.; Le, Q.V. Regularized Evolution for Image Classifier Architecture Search. In Proceedings of the Association for the Advancement of Artificial Intelligence, Honolulu, HI, USA, 27 January–1 February 2019; pp. 4780–4789. [Google Scholar]
  38. Pham, H.; Guan, M.; Zoph, B.; Le, Q.; Dean, J. Efficient Neural Architecture Search via Parameters Sharing. In Proceedings of the International Conference on Machine Learning, Stockholm, Sweden, 10–15 July 2018; pp. 4095–4104. Available online: http://proceedings.mlr.press/v80/pham18a.html (accessed on 30 July 2021).
  39. Liu, H.; Simonyan, K.; Yang, Y. DARTS: Differentiable Architecture Search. arXiv 2018, arXiv:1806.09055. [Google Scholar]
  40. Liang, H.; Zhang, S.; Sun, J.; He, X.; Huang, W.; Zhuang, K.; Li, Z. DARTS+: Improved Differentiable Architecture Search with Early Stopping. arXiv 2019, arXiv:1909.06035. [Google Scholar]
  41. Peng, C.; Li, Y.; Jiao, L.; Shang, R. Efficient Convolutional Neural Architecture Search for Remote Sensing Image Scene Classification. IEEE Trans. Geosci. Remote. Sens. 2021, 59, 6092–6105. [Google Scholar] [CrossRef]
  42. Jing, W.; Ren, Q.; Zhou, J.; Song, H. AutoRSISC: Automatic design of neural architecture for remote sensing image scene classification. Pattern Recognit. Lett. 2020, 140, 186–192. [Google Scholar] [CrossRef]
  43. Xu, Y.; Xie, L.; Zhang, X.; Chen, X.; Qi, G.J.; Tian, Q.; Xiong, H. PC-DARTS: Partial Channel Connections for Memory-Efficient Architecture Search. arXiv 2019, arXiv:1907.05737. [Google Scholar]
  44. Baker, B.; Gupta, O.; Naik, N.; Raskar, R. Designing Neural Network Architectures using Reinforcement Learning. arXiv 2016, arXiv:1611.02167. [Google Scholar]
  45. Brock, A.; Lim, T.; Ritchie, J.M.; Weston, N. SMASH: One-Shot Model Architecture Search through HyperNetworks. arXiv 2017, arXiv:1708.05344. [Google Scholar]
  46. Liu, C.; Zoph, B.; Neumann, M.; Shlens, J.; Hua, W.; Li, L.-J.; Li, F.-F.; Yuille, A.; Huang, J.; Murphy, K. Progressive Neural Architecture Search. 2018. Available online: https://openaccess.thecvf.com/content_ECCV_2018/html/Chenxi_Liu_Progressive_Neural_Architecture_ECCV_2018_paper.html (accessed on 31 July 2021).
  47. Finn, C.; Abbeel, P.; Levine, S. Model-agnostic meta-learning for fast adaptation of deep networks. arXiv 2017, arXiv:1703.03400. [Google Scholar]
  48. Luketina, J.; Berglund, M.; Greff, K.; Raiko, T. Scalable Gradient-Based Tuning of Continuous Regularization Hyperparameters. In Proceedings of the International Conference on Machine Learning, New York, NY, USA, 19–24 June 2016; pp. 2952–2960. [Google Scholar]
  49. Metz, L.; Poole, B.; Pfau, D.; Sohl-Dickstein, J. Unrolled Generative Adversarial Networks. arXiv 2016, arXiv:1611.02163. [Google Scholar]
  50. He, K.; Zhang, X.; Ren, S.; Sun, J. Deep Residual Learning for Image Recognition. In Proceedings of the IEEE Conference on Computer Vision and Pattern Recognition, Las Vegas, NV, USA, 27–30 June 2016; pp. 770–778. [Google Scholar] [CrossRef] [Green Version]
  51. Chu, X.; Zhou, T.; Zhang, B.; Li, J. Fair DARTS: Eliminating Unfair Advantages in Differentiable Architecture Search. In Computer Vision–ECCV 2020; Springer: Berlin/Heidelberg, Germany, 2020; pp. 465–480. [Google Scholar]
  52. Chu, X.; Zhang, B.; Li, X. Noisy Differentiable Architecture Search. arXiv 2020, arXiv:2005.03566. [Google Scholar]
  53. Zhuo, L.; Zhang, B.; Chen, C.; Ye, Q.; Liu, J.; Doermann, D. Calibrated Stochastic Gradient Descent for Convolutional Neural Networks. Proc. Conf. AAAI Artif. Intell. 2019, 33, 9348–9355. [Google Scholar] [CrossRef]
  54. Xia, G.-S.; Hu, J.; Hu, F.; Shi, B.; Bai, X.; Zhong, Y.; Zhang, L.; Lu, X. AID: A Benchmark Data Set for Performance Evaluation of Aerial Scene Classification. IEEE Trans. Geosci. Remote Sens. 2017, 55, 3965–3981. [Google Scholar] [CrossRef] [Green Version]
  55. Li, H.; Dou, X.; Tao, C.; Hou, Z.; Chen, J.; Peng, J.; Deng, M.; Zhao, L. RSI-CB: A Large Scale Remote Sensing Image Classification Benchmark via Crowdsource Data. Sensors 2017, arXiv:1705.1045020, 1594. [Google Scholar] [CrossRef] [Green Version]
  56. Zhou, W.; Newsam, S.; Li, C.; Shao, Z. PatternNet: A benchmark dataset for performance evaluation of remote sensing image retrieval. ISPRS J. Photogramm. Remote Sens. 2018, 145, 197–209. [Google Scholar] [CrossRef] [Green Version]
  57. Simonyan, K.; Zisserman, A. Very Deep Convolutional Networks for Large-Scale Image Recognition. arXiv 2014, arXiv:1409.1556. [Google Scholar]
  58. Szegedy, C.; Liu, W.; Jia, Y.; Sermanet, P.; Reed, S.; Anguelov, D.; Erhan, D.; Vanhoucke, V.; Rabinovich, A. Going deeper with convolutions. In Proceedings of the 2015 IEEE Conference on Computer Vision and Pattern Recognition (CVPR), Boston, MA, USA, 7–12 June 2015. [Google Scholar]
  59. Zhang, J.; Zhang, M.; Shi, L.; Yan, W.; Pan, B. A Multi-Scale Approach for Remote Sensing Scene Classification Based on Feature Maps Selection and Region Representation. Remote Sens. 2019, 11, 2504. [Google Scholar] [CrossRef] [Green Version]
  60. Deep Feature Fusion for VHR Remote Sensing Scene Classification|IEEE Journals & Magazine|IEEE Xplore. Available online: https://ieeexplore.ieee.org/document/7934005 (accessed on 15 December 2021).
Figure 1. Illustration of the proposed approach (best viewed in color), RS-DARTS.
Remotesensing 14 00141 g001
Figure 2. Some images random sampled from four benchmark datasets.
Remotesensing 14 00141 g002
Figure 3. Searched time cost in searched phase.
Remotesensing 14 00141 g003
Figure 4. Searched cell architectures of three methods on Large-RS data set. (a) Normal cell searched by DARTS. (b) Reduction cell searched by DARTS. (c) Normal cell searched by PCDARTS. (d) Reduction cell searched by PCDARTS. (e) Normal cell searched by RS-DARTS. (f) Reduction cell searched by RS-DARTS.
Remotesensing 14 00141 g004aRemotesensing 14 00141 g004b
Figure 5. Searched cell architectures of GPAS [41]. (a) Normal cell searched by GPAS. (b) Reduction cell searched by GPAS.
Remotesensing 14 00141 g005
Figure 6. Searched cell architectures of Auto-RSISC [42]. (a) Normal cell searched by Auto-RSISC. (b) Reduction cell searched by Auto-RSISC.
Remotesensing 14 00141 g006
Table 1. Description of the dataset for the experimental application.
NameClassesTotal ImagesImages/ClassImage Size
NWPURESISC45 [25]4531,500700256
PatternNet [56]3830,400800256
RSI-CB256 [55]3524,747~690256
AID [54]3010,000220~420600
Table 2. The OA of four benchmark datasets is computed by the optimal model which searched the structure using the NWPU/PatternNet datasets as the training data for search phase.
In Search PhaseAIDNWPURSI-CBPatternNet
NWPU86.77%90.06%99.02%98.93%
PatternNet92.78%94.58%98.81%99.56%
Table 3. The hardware and software of the experimental environment.
Versions
GPUsNVIDIA Tasla V100
Pytorch1.6.0
Python3.7.7
Table 4. Hyperparameter setting for structural search phase of neural network.
Hyperparameters
Epoch50
Initialization Channel16
Batch Size32
L1/L2 weighted decline rate10.0
Sample channels0.5
Learning rate in Adam0.0006
Weighted decline rate in Adam0.003
Learning rate in SGDCosine annealing
SGD’s momentum0.9
Weighted decline rate in SGD0.0003
Table 5. Hyperparameter setting for structural verification phase of neural network.
Hyperparameters
Epoch500
Initialization Channel36
Layers20
Batch size128
Cutout’s length16
Cutout’s path dropout0.2
Cutmix’s bate1
Cutmix’s threshold value1
Table 6. The classification accuracy (OA) of the classical CNNs model is compared with the final CNN model obtained by RS-DARTS.
AIDNWPURSI-CBPatternNetTraining Model
VGG-16 [57]88.56%85.97%96.53%97.31%Fully Trained
GoogleNet [58]84.27%83.29%96.21%96.12%Fully Trained
ResNet-50 [50]86.94%86.96%97.09%96.71%Fully Trained
MDFR [59]93.37%86.89%--Fully Trained
DCA [60]89.71%---Fully Trained
VGG-16 [57]92.03%91.32%97.26%98.31%Pretrained
GoogleNet [58]90.31%89.42%98.14%97.56%Pretrained
ResNet-50 [50]92.14%91.63%98.12%98.23%Pretrained
MSCP(AlexNet) [24]88.99%85.58%--Pretrained
Conv5-MSP5-FV [13]93.90%---Pretrained
RS-DARTS
(40% training samples)
90.43%93.56%99.30%99.43%Fully trained
RS-DARTS
(60% training samples)
94.14%93.68%99.42%99.52%Fully trained
Table 7. Comparison results of the classification accuracy of the final CNN model searched by RS-DARTS and other NAS methods. When trained this searched model, we sampled 40% images as training set (These boldface numbers indicate the highest accuracy).
AIDNWPURSI-CBPatternNetSearch Strategy
DARTS [39]79.42%74.56%97.32%95.58%Grandient
PC-DARTS [43]84.46%90.27%98.46%99.10%Grandient
Fair DARTS [51]89.46%91.38%99.14%98.88%Grandient
GPAS [41]93.85%92.57%98.25%99.01%Grandient
RS-DARTS90.43%93.56%99.30%99.43%Grandient
Table 8. Comparison of the number of model parameters during training of the optimal structural network model searched by RS-DARTS and other NAS methods (These boldface numbers represent the least number of model parameters).
AIDNWPURSI-CBPatternNet
DARTS [39]2.3M2.3M2.3M2.3M
PC-DARTS [43]3.6M3.6M3.6M3.6M
Fair DARTS [51]2.4M2.4M2.4M2.4M
GPAS [41]3.6M3.7M--
RS-DARTS3.3M3.3M3.3M3.3M
Publisher’s Note: MDPI stays neutral with regard to jurisdictional claims in published maps and institutional affiliations.

