Article

Evaluation of BRDF Information Retrieved from Time-Series Multiangle Data of the Himawari-8 AHI

1
State Key Laboratory of Remote Sensing Science, Beijing Normal University, Beijing 100875, China
2
Beijing Engineering Research Center for Global Land Remote Sensing Products, Institute of Remote Sensing Science and Engineering, Faculty of Geographical Science, Beijing Normal University, Beijing 100875, China
3
College of Water Sciences, Beijing Normal University, Beijing 100875, China
4
State Key Laboratory of Remote Sensing Science, Aerospace Information Research Institute of Chinese Academy of Sciences, Beijing 100101, China
5
School of Geographic and Environmental Sciences, Tianjin Normal University, Tianjin 300387, China
*
Author to whom correspondence should be addressed.
Remote Sens. 2022, 14(1), 139; https://doi.org/10.3390/rs14010139
Submission received: 17 November 2021 / Revised: 27 December 2021 / Accepted: 27 December 2021 / Published: 29 December 2021

Abstract

:
Recently, much attention has been given to using geostationary Earth orbit (GEO) meteorological satellite data for retrieving land surface parameters due to their high observation frequencies. However, their bidirectional reflectance distribution function (BRDF) information content with a single viewing angle has not been sufficiently investigated, which lays a foundation for subsequent quantitative estimation. In this study, we aim to comprehensively evaluate BRDF information from time-series observations from the Advanced Himawari Imager (AHI) onboard the GEO satellite Himawari-8. First, ~6.2 km monthly multiangle surface reflectances from POLDER onboard a low-Earth-orbiting (LEO) satellite with good angle distributions over various land types during 2008 were used as reference data, and corresponding 0.05° high-quality MODIS (i.e., onboard LEO satellites) and AHI datasets during four months in 2020 were obtained using cloud and aerosol property products. Then, indicators of angle distribution, BRDF change, and albedos were retrieved by the kernel-driven Ross-Li BRDF model from the three datasets, which were used for comparisons over different time spans. Generally, the quality of sun-viewing geometries varies dramatically for accumulated AHI observations according to the weight-of-determination, and wide-ranging anisotropic flat indices are obtained. The root-mean-square-errors of white sky albedos between AHI and MODIS half-month data are 0.018 and 0.033 in the red and near-infrared bands, respectively, achieving smaller values of 0.004 and 0.007 between the half-month and daily AHI data, respectively, due to small variances in sun-viewing geometries. The generally wide AHI BRDF variances and good consistency in albedo with MODIS show their potential for retrieving anisotropy information and albedo, while angle accumulation quality of AHI time-series observations must be considered.

Graphical Abstract

1. Introduction

The intrinsic reflectance anisotropy has been of great concern for decades and is usually described as a bidirectional reflectance distribution function (BRDF), which plays a key role in quantitative remote sensing inversion [1,2,3]. Considering that only limited angles are available in practice, the pattern of sun-viewing geometry has a critical influence on BRDF reconstruction across the whole illumination and viewing of hemispherical space. In early laboratory experiments, manually controlled multiangle observations show reflectances at the principal plane, and hotspots can help to better fit the BRDF variance [4,5,6]. A noise amplification factor was designed to quantitatively evaluate the quality of the sun-viewing angle distribution, which was called the weight-of-determination (WoD) [7,8,9]. When observations are limited, a median sampling density of view zenith angle (VZA) every 15 degrees and relative azimuth angle (RAA) every 30 degrees can capture the primary BRDF characteristic [6]. A series of studies have confirmed these conclusions regarding BRDF properties [10,11,12,13,14,15,16,17] which provide important guidance in further applications of multiangle data [18,19].
For global monitoring, numerous BRDF studies have been performed that are based on multiangle data from low-Earth-orbiting (LEO) satellites. For polarization and directionality of the Earth’s reflectances (POLDER) onboard polarization and anisotropy of reflectances for atmospheric science coupled with observations from a Lidar (PARASOL), multiangle observations are collected by multiangle plane array scanning and two monthly accumulative multiangle surface reflectance datasets, including a total of approximately 20,000 homogeneous pixels worldwide at 6 × 7 km (~6.2 km) in 2006 and 2008, have been released [20,21]. In each set of POLDER data, there are usually hundreds of observations with few WoDs that indicate a high-quality angle distribution. Unfortunately, only the two datasets are available due to instrument malfunction. The Moderate Resolution Imaging Spectroradiometer (MODIS) onboard Terra and Aqua with a daily passing frequency is another important BRDF data source. Based on accumulated multiangle observations at a moving window of 16 days, the 500-m spatiotemporally continuous archive of BRDF parameter products that are retrieved from the widely used kernel-driven Ross-Li model has been generated since 2000 [22,23]. There are usually a few to a dozen high-quality observations under clear-sky conditions over 16 days, and the WoD is used as one of the quality indicators [7]. Based on a series of BRDF indicators, a previous study showed that MODIS can capture more BRDF variances than POLDER, which is attributed to the finer spatial resolution [24]. BRDF datasets from the two sensors have been widely used for BRDF-related research, such as BRDF characteristics and sensitive land surface parameter inversions [25,26,27,28,29,30,31]. However, due to limitations in the revisit cycle of LEO satellites, these multiangle data are collected once a day or every few days at a particular time and can hardly acquire the intradaily variations in reflectance anisotropy.
Compared with the LEO satellites, geostationary Earth orbit (GEO) satellites have significantly higher revisit frequencies on hourly or even shorter timescales, where multiangle reflectances can also be obtained considering varying solar angles over time [32]. In particular, cloud coverage of LEO satellite observations may further reduce the available data number, while much more effective observations can be obtained from the high temporal resolution of the GEO satellites [33,34]. GEO satellites initially serve to monitor rapid meteorological changes and more applications have recently been performed to retrieve land surface parameters, such as land surface temperature, solar incident radiation, and surface albedo [35]. In particular, the World Meteorological Organization (WMO) is leading activities on sustained, coordinated processing of environmental satellite data for climate monitoring (SCOPE-CM), where the operational meteorological satellite agencies of the European Organisation for the Exploitation of Meteorological Satellites (EUMETSAT), National Oceanic and Atmospheric Administration (NOAA), and the Japan Meteorological Agency (JMA) have been involved to coordinate the generation of the essential climate variable (ECV) land surface albedo including global daily climate data records (CDRs) and 10-day composites except for the poles [36,37] as well as validation [38]. Currently, benefiting from the high temporal, spatial, and spectral resolutions, the new generation of GEO meteorological satellites that were developed in Europe (Meteosat), the United Sates (Geostationary Operational Environment Satellite-R (GOES-R)), Japan (Himawari), China (Fengyun (FY) series), and Korea (Geo-KOMPSAT-2A (GK-2A)) [39] have garnered much attention. Among these satellites, the time-series reflectance product of the Advanced Himawari Imager (AHI) that is onboard Himawari-8, obtained every 10 min since July 2015, has been widely used. These accumulated multiangle data are promising for revealing the intradaily variation in BRDF and all the daily clear-sky observations were input into the Ross-Li model to reconstruct BRDF and then used for retrieving the land surface albedo [33] and vegetation phenology [34] for the AHI. In addition, instantaneous bidirectional observations were also used for snow detection [40] and fraction of absorbed photosynthetically active radiation (FAPAR) estimation [41].
However, these simple compositions of daily-scale GEO satellite data for reconstructing BRDF in current studies may result in uncertainties because the different sun-viewing geometries would highly affect the accuracy of BRDF inversion [6,9,42]. In addition, the overall angle pattern and BRDF variances have not been sufficiently investigated which strongly impacts a series of further applications that are associated with the intrinsic reflectance anisotropy. Therefore, there is a high demand to investigate the quality of angle combinations from GEO satellites as well as evaluate the subsequent retrieval accuracy of BRDF and other parameters.
In this study, we aimed to systematically evaluate the BRDF information underlying the time-series bidirectional observations from GEO satellites by using a series of BRDF indicators and using AHI data as an example. Snow-free POLDER multiangle data within the AHI observation scope were selected as reference data, and concurrent AHI and MODIS monthly accumulated multiangle data were obtained. Cross comparisons were performed between the three sensors over different time spans, including angle distribution, BRDF fitting, BRDF indicators, and albedo estimations, with the help of the hotspot-revised Ross-Li BRDF model. We analysed the BRDF changes in AHI and MODIS using a series of BRDF indicators, as well as the results for AHI-like diurnal time-series nadir measurements. Finally, explanations and limitations of this paper, as well as future works, are discussed.

2. Data

In this study, BRDF information that was retrieved from the AHI was compared with those of POLDER and MODIS in the red and near-infrared (NIR) bands. The relative spectral responses for POLDER [20], MODIS [22], and AHI [32] in the two bands are shown in Figure 1, and extremely similar responses in the NIR band can be observed. In the red band, the band range of AHI covers that of POLDER and MODIS, and the central wavelengths for AHI and MODIS are very close. These similar spectral responses for the three sensors indicate the data comparability in the two bands.
To investigate the overall change in AHI BRDF information, 1815 fine-screened sets of multiangle surface reflectance datasets of POLDER were referenced [24]. These ~6.2 km POLDER data at “pure and homogeneous” pixels that were selected by the MODIS Vegetation Continuous Fields (VCF) product (i.e., MOD44B) were accumulated monthly in 2008 and have good angle distributions; therefore, they can act as reference data for BRDF analysis. Considering that there were no AHI data before July 2015, 361 sets of diurnal AHI data from the same location and during the closest months with the 2020 POLDER data that were gridded at 0.05° were utilized within the effective observation scope of the AHI. Notably, the cloud and aerosol property products were also used for selecting high-quality observations. In addition, MODIS data in the composite Climate Modelling Grid (CMG) archive at 0.05° were also used for cross comparison.
After performing quality control by removing data with a large solar zenith angle (SZA) (i.e., >85°), cloud cover, and poor aerosol optical depth (AOD), there were 213 sets of monthly accumulated AHI datasets in total among the 361 sets. After 6S atmospheric correction [43] to obtain the AHI surface reflectances from these top of atmosphere (TOA) observations, 198 sets of monthly accumulated data with reasonable surface reflectances (i.e., >0) for the two bands remained. For MODIS CMG, all 361 pixels can collect effective monthly multiangle data. The overlapping data for AHI and MODIS CMG were used for analysis which included 198 sets of data in total, as shown in Figure 2 and Table 1. According to Figure 2, these selected pixels are spread over the effective observation scope of the AHI (−60°S~60°N, 80°E~160°W, red rectangle in Figure 2), except in the western hemisphere. From Table 1, we can see that these selected high-quality AHI data come from various land cover types that are based on the MODIS IGBP classification product over four actual seasons in both the northern and southern hemispheres. Specifically, a vegetation pixel in a mixed forest area of northeast China (48.81°N, 122.94°E) during the summer was selected for the case study (red circle in Figure 2).

2.1. POLDER Multiangle Reflectance

Benefitting from good angle sampling, the POLDER multiangle observations were used as reference data in the BRDF analysis. The wide field of view optics and the matrix array detector of POLDER provide two-dimensional pictures of the Earth, and up to 16 (average is 14) observations of the target are available for every overpass at 13:30 local time [20,21]. Generally, POLDER can collect hundreds of multiangle observations across a month, especially to capture BRDF-sensitive angles near the principal plane and hotspot with a maximum view angle of 70°. Therefore, POLDER multiangle data have been widely used for BRDF analyses [24], hotspot reflectance analyses [16,44,45], and sensitive parameter estimations [27,30,46,47,48]. According to a previous study [24], 1815 fine-screened sets of monthly accumulated multiangle reflectances for snow-free POLDER pixels were utilized in this study. These ~6.2 km POLDER data at homogeneous pixels were accumulated monthly in 2008, and there were 361 sets of data in total that were located within the observation scope of the AHI. The data in the optical bands, including the red (channel 3, 670 nm) and NIR (channel 5, 865 nm) bands, were used to investigate BRDF properties.

2.2. AHI Time-Series Observations

The AHI onboard the Japanese GEO satellite Himawari-8 is positioned above 140.7°E and 0.02°S, and the 10-min TOA reflectance product from July 2015 to the present was released from the Japan Aerospace Exploration Agency (JAXA) P-Tree system (ftp://ftp.ptree.jaxa.jp/, accessed on 16 November 2021) [32]. The AHI can scan the Asia-Pacific region every 10 min through 16 channels, where the nadir spatial resolution is 500 m for the red band (channel 3, 640 nm) and 1000 m for the NIR band (channel 4, 860 nm). The AHI observes the same target from a constant angle, resulting in a fixed VZA and view azimuth angle (VAA) for each pixel. The spatial distribution of viewing angles for the AHI is shown in Figure 3, and the VZA increases with distance to the satellite position while the VAA changes with azimuth. Considering that the effective observation scopes of the AHI (−60°S~60°N, 80°E~160°W) are approximately one-third of the Earth except for the poles, the furthest four pixels away from the position point can achieve the largest VZA of 84.5°.
The full-disk L1 AHI data that were gridded at 0.05° were used for cross comparison, which has a spatial resolution that is closest to POLDER. The pixel size expansions in the north–south and west–east directions are nonnegligible and increase with the distance to the nadir position of the AHI [40]. The expansion rate is less than 5 for most pixels within the AHI observation scope, so the pixel size in the boundary can be enlarged to 2.5 and 5 km given the nadir spatial resolution in the red (500 m) and NIR (1 km) bands. Therefore, the coarse resolution at the grid size of 0.05° (~5.2 km) should sufficiently mitigate the geolocation errors, especially in the scope boundary, which was reported as average values of 150 m (north–south) and 500 m (east–west) [34,49]. Moreover, the corresponding 10-min cloud (V1.0) and aerosol (V3.1) properties (i.e., aerosol optical thickness (AOT), also called AOD) products at 0.05° were also collected. To investigate the overall data characteristics during a year, AHI data in four typical months (i.e., January, April, July, and October) of different seasons in 2020 were used for analysis. Specifically, AHI data in the whole month that were closest to the 361 sets of POLDER data were collected and discussed in Section 2.1.
First, the 10-min diurnal TOA reflectances during the four months were filtered by cloud and aerosol property products. The detailed filtering indicators are shown in Table 2, with the aim of obtaining high-quality observations in cloud-free conditions with reliable AOT values. After removing data at large SZA (i.e., >85°), cloud cover, and poor AOD data from the 361 sets of AHI data, 213 sets of monthly accumulated multiangle data remained. Then, these high-quality diurnal AHI TOA reflectances that were obtained every 10 min were transferred into surface reflectances through the 6S atmospheric correction model [43] by inputting the AOD at 550 nm, and 198 sets of monthly accumulated snow-free AHI surface reflectances were obtained with reasonable values ranging from 0 to 1 in the red and NIR bands. Finally, the obvious outliers were filtered to reduce uncertainty, where one set of observations was removed in this study. As shown in Figure 2, these selected AHI data were widely distributed in the whole effective observation scope, and the largest VZA reached 66.1°. Among the 198 sets, a vegetation pixel in the mixed forest area of the Inner Mongolia Autonomous Region, Northeast China (48.81°N, 122.94°E) in July 2020 was selected for the case study, and the POLDER data were obtained in August 2008.

2.3. MODIS CMG Multiangle Reflectance

In addition, the Collection 6 daily MODIS land surface reflectance product (i.e., MOD09CMG & MYD09CMG) for the composite CMG archive at 0.05° was also used for cross comparison (https://search.earthdata.nasa.gov/, accessed on 16 November 2021). The across-track scan angle of MODIS ranges from 0 to 55°, and the curvature of the Earth elongates the scan line and makes the VZA as large as 65°. The gridded MODIS product actually represents information from a larger area as the VZA increases [50,51], and, therefore, 0.05° CMG data that are aggregated from finer products can theoretically contain a larger region. The CMG data combine MODIS observations from Terra (overpass at 10:30 local time) and Aqua (overpass at 13:30 local time), and observations over 16 days have always been accumulated to obtain multiangle reflectances for retrieving BRDF properties [22,23]. Only data that were retained after performing atmospheric corrections with the highest quality for the first seven bands were used, as shown in Table 3, and these data were obtained under snow-free and clear-sky conditions. Consistent with POLDER and AHI, data in the red (channel 1, 645 nm) and NIR (channel 2, 858 nm) bands were used. Finally, all 361 sets of MODIS data at the same locations as the POLDER pixels have high-quality multiangle observations for monthly accumulations.

2.4. Field Measurements of Diurnal Time-Series Nadir Reflectance

Based on AHI-like daily automatic continuous measurement experiments of nadir surface reflectances in a previous study [52], we attempted to preliminarily validate the BRDF change in sensors onboard GEO satellites. The experimental area was in Gucheng, Baoding, China (39.14455°N, 115.73785°E), and the plot was a 2 m × 4 m area that was planted with maize. Field measurements on four clear days were selected from July to August 2020 (i.e., 20 July, 2 August, 11 August, and 21 August), which covered the main growth stages of maize. Although apparent scaling issues between these field sites and AHI pixels are non-negligible, these valuable automatic measurements remain promising to provide evidence considering the similar observation mode to that of the GEO satellites. A spectrally and radiometrically calibrated spectrometer QE65Pro (Ocean Optics Inc., Dunedin, FL, USA) was embedded in this automatic measurement system to collect spectral reflectance, which included effective surface nadir reflectance from 480 nm to 800 nm with a resolution of 0.9 nm.
The red band (channel 1, 670 nm) and NIR band (channel 2, 800 nm) were used for analysis. In addition, simultaneously measured photosynthetically active radiation (PAR) data were used to determine the stability of surface reflectance observations, and abnormal reflectances were replaced by a linear interpolation of their closest measurements when a sudden change in PAR appeared. Finally, to guarantee the same temporal resolution as the AHI, the field data were reprocessed to be values every 10 min from the initial measurement frequency ranging from 5 to 10 min.

3. Methods

The flowchart of the evaluation of BRDF information for time-series AHI data is shown in Figure 4, including ~6.2 km POLDER, 0.05° MODIS CMG, and 0.05° AHI monthly collected multiangle data at 198 pixels, as shown in Figure 2. As reference data with high-quality angle sampling, the POLDER dataset contains the monthly accumulated bidirectional reflectances, which are also simply called bidirectional reflectance factors (BRFs) [20]. Then, the MODIS data that are spatiotemporally synchronous with the AHI data were also collected for a whole month that is same as POLDER, which were also accumulated for half a month considering the 16-day collections in the MODIS BRDF parameter product [22,23]. For the AHI, the monthly collected dataset was divided into three accumulation spans: a day, half a month, and a month. Before applying AHI data, the AHI TOA reflectances were processed into surface values using the 6S atmospheric correction model by inputting the corresponding AOD data as introduced in Section 2.2.
In this study, the evaluation of AHI BRDF information was mainly performed based on cross comparison. A hotspot-revised version of the Ross-Li model called RossThick-LiSparseReciprocal-Chen (RTLSR_C) [16,53] was used to calculate a series of evaluation indicators. The WoD was used to analyse the angle sampling quality of these multiangle data from the three sensors. Before analysing a series of BRDF indicators that were retrieved from the RTLSR_C model, model fitting accuracies were obtained by the root mean square error (RMSE) between the remotely sensed and the fitted multiangle reflectances. Based on data with a small WoD and fitting RMSE values, the BRDF variables for concurrent AHI and MODIS data were derived to perform cross comparisons, and AHI BRDF archetypes were extracted to investigate their dominant anisotropy characteristics. Finally, black sky albedo (BSA) and white sky albedo (WSA) for the two sensors were used to investigate the albedo estimation ability of the AHI.

3.1. The Hotspot-Revised Kernel-Driven Ross-Li Model

The semi-empirical linear kernel-driven Ross-Li BRDF model has been widely employed for BRDF analysis, and robust RossThick-LiSparseReciprocal (RTLSR) combination models [54,55] have been selected as the operational algorithm for retrieving MODIS BRDF parameter product [22,23] with good accuracies [51,56,57] among a series of kernel combinations [8,58,59]. Therefore, this study applied the Ross-Li model to evaluate the BRDF information of the AHI, and a hotspot-revised model called RTLSR_C was used [16,53]. The general model expression is given in Equation (1), where R refers to the surface bidirectional reflectance as a function of three angles (SZA (θs), VZA (θv), and RAA (φ)) and the waveband λ, which is composed of three scattering types: isotropic scattering kernel (1.0), volumetric scattering kernel (Kvol), and geometric-optical scattering kernel (Kgeo). fiso, fvol, and fgeo are weight coefficients of the three scattering kernels. By applying a corrected exponential hotspot function that was developed by Chen and Cihlar [11] to the volumetric and geometric-optical scattering kernels, the hotspot-revised RTLSR_C model has significantly enhanced the hotspot fitting capability compared with the RTLSR model and shows the best fitting accuracy among various hotspot-revised kernel combinations [60]. The kernel models are presented in Equations (A1)–(A9) in Appendix A and observations at phase angles ξ ≤ 5° in Equation (A2) are usually used as hotspot data.
R(θs,θv,φ,λ) = fiso(λ) + fvol(λ)Kvol(θs,θv,φ) + fgeo(λ)Kgeo(θs,θv,φ)
The best hotspot parameters of the hotspot reflectance height (C1) and width (C2) in the RTLSR_C model at several typical bands have been given based on a wide search from sufficient hotspot observations of POLDER [53], and the average optimal hotspot parameters in the red band (C1 = 0.5, C2 = 3.4°) and NIR band (C1 = 0.5, C2 = 3.0°) were used in model inversion. By inputting multiangle reflectances to the model, the three weight coefficients of fiso, fvol, and fgeo can be determined where the fitting RMSEs between the observed and modelled multiangle reflectances achieve the minimum, such as the global MODIS BRDF parameter products [22,23]. Subsequently, directional reflectance at arbitrary solar-view orientations can be simulated.

3.2. Calculation of BRDF Evaluation Indicators Based on the RTLSR_C Model

By inputting these time-accumulated surface multi-angle reflectances of POLDER, MODIS CMG, and AHI to the RTLSR_C model, a series of BRDF evaluation indicators were calculated for comparisons.
The WoD was used to evaluate the angle sampling quality of the multiangle data from the three space-borne sensors as shown in Equation (2), which reflects the amplification of noise from reflectance observations to WSA inversions, where K and U refer to the kernel values and their weights, respectively. A WoD that is less than 2.0 shows good angle sampling [42]. The WoD indicates the overall patterns of sun-view angle distribution, which was used to preliminarily diagnose the potential of retrieving high-quality BRDF information from the AHI.
WOD = [U]T[KTK] − 1[U]
In addition, the fit-RMSE was used to assess the fitting accuracy of the RTLSR_C model as shown in Equation (3), which calculates the discrepancies between the observed directional reflectances Robs and the fitted results Rmodel. fit-RMSE less than 0.02 and 0.05 in the red and NIR bands, respectively, can meet a general accuracy requirement [61]. That is, if there is a small fitting RMSE in the inversion of the RTLSR_C model, the retrieved BRDF change in the whole sun-view hemisphere space shows good reliability.
f i t R M S E = j = 1 n ( R obs j ( θ s , θ v , φ , λ ) R model j ( θ s , θ v , φ , λ ) ) 2 n 3
After quality control by WoD and fitting RMSE, a series of BRDF indicators were retrieved by the RTLSR_C model to investigate BRDF information. The first kind of indicator includes the three kernel coefficients (fiso, fvol, and fgeo), which describe the weight of scattering types. The second kind of indicator refers to the anisotropic flat index (AFX) calculated as the ratio of WSA to fiso [15], which is sensitive to the scattering type. An AFX value that is larger than 1.0 means that volumetric scattering is prominent, while an AFX value of less than 1.0 indicates dominant geometric-optical scattering. Based on these BRDF indicators, we explored the difference in BRDF between the AHI and MODIS accumulated multiangle data for half a month and a whole month, considering the 16-day and monthly collections of MODIS [22,23] and POLDER [20], respectively. Then, the discrepancies between the AHI data at different accumulation spans including a day, half a month, and a whole month were also investigated.
In addition, several BRDF archetypes for daily accumulated AHI data were extracted by classifying their AFXs using an iterative self-organizing data analysis technique algorithm (ISODATA) [24]. The fit-RMSEs between multiangle reflectances that were modelled by each set of BRDF parameters and their average for each AFX class were counted, and the optimal classification number was determined when the fit-RMSEs decreased to 80% compared to the errors of non-classification. Consequently, the average BRDF parameters for each AFX class were called BRDF archetypes, which represent the dominant BRDF shapes and can usually capture ~90% of the total variance in these AHI BRDF data.
Finally, BSA and WSA can be calculated by integrating the simulated bi-directional reflectances over the viewing radiation hemisphere and over both the viewing and incident radiation hemispheres, respectively [23]. Formulas of BSA, WSA, and AFX are shown in Equations (A10)–(A12) in Appendix A. Similar to the BRDF analysis, the difference in albedos between AHI and MODIS as well as AHI data at different accumulation spans were examined, and statistical parameters of RMSE, Bias, and R2 are shown in Equations (A13)–(A15).

4. Results and Analysis

4.1. AHI BRDF Information at a Typical Vegetation Pixel

4.1.1. Angle Distribution of AHI Time-Accumulated Observations

Angle distributions were compared between POLDER, MODIS CMG, and AHI for the selected typical vegetation pixels in the mixed forest area (48.81°N, 122.94°E) at the coarse spatial resolution. The basic information for the three sets of data is shown in Table 4, where the POLDER data were collected in August 2008, and the MODIS and AHI data were collected in July 2020. In addition, the statistics and distribution of the monthly accumulated sun-viewing angles for the three sensors are shown in Figure 5.
From Table 4, the AHI achieves the maximum number of high-quality monthly accumulated observations (i.e., 214) benefiting from its 10-min revisit frequency [Figure 5n], while MODIS has the least (i.e., 27) with a revisit cycle of a day at 10:30 and 13:30 local time [Figure 5d]. POLDER obtains a middle rank (i.e., 72) with a two-day cycle at 13:30 local time and multiangle observations at approximately 14 angles each time [Figure 5a]. The POLDER and MODIS data that were obtained at fixed local times show a smaller change in solar angles than the time-series AHI data. Considering that the SZAs are symmetrical in the morning and afternoon, the SAAs of POLDER are only larger than 180° for its overpass in the afternoon, while MODIS has a wider range of SZAs because it can scan the Earth in the morning and afternoon. The AHI has the widest range of solar angles, including the SZA and solar azimuth angle (SAA), owing to the 10-min revisit frequency, and the viewing angles are constant. POLDER VAAs are widely distributed from 0° to 360°, while few viewing azimuths can be obtained for MODIS, and the two sensors can capture a similar VZA range. Significantly, POLDER can obtain multiangle data at much wider viewing azimuths than MODIS and AHI, and, therefore, it has more potential to provide sufficient BRDF information [20].
Monthly accumulated sun-viewing geometries for the AHI are analysed in detail in Figure 5e–n. First, there is only a small change in the SZA and SAA between different days in a month along with the local time, as shown in Figure 5e–f; thus, the accumulated sun-viewing geometries during a day can be mostly equivalent to those during a month. The number of diurnal cloud-free multiangles of the AHI pixel ranges from 0 to 33 [Figure 5g], and there are 12 days in July 2020 where the data can meet the full-inversion requirements of the Ross-Li model (i.e., num. obs. ≥ 7) [7]. In addition, there are six days where the observation number of high-quality accumulations changes from one to six, for which the Ross-Li model cannot be used. Notably, there are no high-quality accumulated AHI data for the remaining 13 days ascribed to cloud cover or low-quality aerosol properties.
The angle distribution on four typical days [Figure 5h–k)] as well as half a month and the whole month [Figure 5l–n)] are presented. The temporal accumulated solar angles for the AHI are close to the cross plane of the sensor, and a wide SZA change can be collected if the day presents a mostly clear sky, such as 14 July [Figure 5j]. Although the AHI observes the Earth every 10 min, the final high-quality diurnal multiangle reflectances that are collected under clear skies usually remain limited because of clouds or other unfavourable atmospheric conditions. High-quality observations are always collected during a continuous span that is concurrent with weather conditions. In terms of half-month and monthly accumulated geometries, there is only a small difference between them due to similar solar angles, as shown in Figure 5e–f, as well as with daily accumulations, although many more angles can be collected for a half-month or a month than a day.
Figure 5 shows that the AHI can provide angles that are similar to the MODIS pattern that are obtained by the Terra or Aqua satellites, while the geometries for the solar angles and viewing angles are opposite. Considering the reciprocal property of the RTLSR_C model [62], the model inversion results are invariant when the solar angles and viewing angles are changed. Therefore, the AHI is expected to provide BRDF information that is similar to that of MODIS at 0.05°. The final AHI accumulated angles are closely related to weather conditions, which leads to a dense distribution of solar angles during a continuous span under clear-sky conditions.

4.1.2. Retrieval Accuracy of BRDF and Albedo for AHI

AHI data for 12 days in July 2020 were input into the RTLSR_C model to retrieve BRDF and albedos, where the effective observation numbers are larger than seven. Comparisons of bidirectional reflectances between the RTLSR_C fitting results and observations from POLDER, MODIS, and AHI at typical pixels are shown in Figure 6, and the BRDF in the principal plane and the modelled WSAs and BSAs at 5 SZAs are shown. In addition, the total inversion accuracies of the RTLSR_C model are listed in Table 5, including the results for the three sensors at half-month and monthly scales and for the AHI on four typical days [Figure 5h–k].
From Table 5, the WoDs decreased dramatically as the observation numbers of AHI increased. Notably, although observation number 12 can meet the full-inversion requirement, the WoD remained much larger than 2.0 on 3 July because the solar angles were gathered at one side of the viewing plane, as shown in Figure 5i. Similarly, for the high-quality angle distribution on 1 July with a WoD of 0.29 [Figure 5h and Table 5], the WoD would increase up to 99.31 when removing only the solar angle on the left of the viewing plane. These results show that the accumulated observations of the AHI on only one side of the viewing plane can usually represent an unqualified angle distribution with a large WoD, and, therefore, these observations that are collected from a short continuous span of clear sky cannot be further used to model sufficient BRDF information. Among all 12 days, there were 5 days where the WoDs were less than 2.0. For half-month and monthly accumulations, all the WoDs were less than 2.0 for the POLDER, MODIS, and AHI data, and the WoD for the monthly accumulated AHI data was 0.03. These qualified WoDs indicate that accumulative time-series AHI observations have the potential to achieve good angle sampling quality.
In addition, the RTLSR_C-modelled bidirectional reflectances and observations from the three sensors show a high consistency in the red and NIR bands [Figure 6a,d]. Small fit-RMSEs of 0.0055 and 0.0235 were obtained in the red and NIR bands, respectively, for the monthly accumulated AHI data in Table 5, and the fit-RMSEs for diurnal data were always less than those for half-month and monthly data. These small fitting errors of the Ross-Li model also indicate the good ability of the AHI multiangle data to describe BRDF variation.
In the principal plane [Figure 6b,e], only the POLDER data have captured hotspot observations at two angles with VZAs (i.e., 33.9° and 40.3°) close to the SZA of 38° as well as small RAAs, while there are no data among the high-quality monthly accumulations for MODIS and AHI. The BRDF shapes that were retrieved from the monthly data of the three sensors are similar to the AFXs, and the results of concurrent MODIS and AHI data in July 2020 show a high consistency in the NIR band. The modelled BRDF shapes from the daily accumulated AHI data with large WoDs (i.e., >2.0) are shown as black dashed lines, and some of them present an obvious difference from the results of the monthly accumulations, especially in the red band. Therefore, the accumulated AHI multiangle data that gain large WoDs are not recommended for further use following quality control of the MODIS BRDF parameter product [7]. In addition, in the Ross-Li model inversion from the AHI multiangle observations, some inverted kernel coefficients only contained anisotropic scattering, while the results for volumetric and geometric-optical scattering are zero. This situation occurs more frequently in the red band (eight days) than in the NIR band (three days) among all 12 days, which leads to constant bidirectional reflectance fittings that are generally close to the results from the monthly data (i.e., blue lines).
In terms of albedos, similar BSAs and WSAs were estimated from monthly accumulated multiangle data for MODIS CMG and AHI [Figure 6c,f], and a high consistency that can be seen in the NIR band complied with BRDF comparisons in Figure 6e. In addition, the range of albedos that were estimated from diurnal AHI data for all 12 days (light blue area) covered those from monthly accumulations for MODIS and AHI, and narrower albedo ranges with good angle distributions (i.e., WoD ≤ 2.0, light yellow area) were closer to the monthly results of the AHI (blue dots) for 5 days. Regarding the AHI data that only have retrieved coefficients of isotropic scattering, the estimated BSAs and WSAs are constant, including the results in the red band on 1 July 2020, shown in Table 5.
Based on the results from the mixed forest pixel, the daily accumulated AHI multiangle data with good angle distributions (i.e., WoD ≤ 2.0) can achieve stable BRDF fittings and albedo estimations, while large uncertainties between AHI and MODIS easily occur when using AHI daily data in a low-quality angle distribution (i.e., WoD > 2.0). Considering the reciprocal property of the RTLSR_C model [62], accumulated AHI multiangles are similar to those of MODIS onboard the Terra or Aqua.

4.2. AHI BRDF Variance at 198 Snow-Free Homogeneous Pixels

4.2.1. BRDF Fitting

Based on high-quality atmospheric-corrected AHI multiangle surface reflectances accumulated for a month at 198 POLDER pixels, as introduced in Section 2.2, the BRDF fitting accuracies of the AHI were examined. Moreover, the concurrent monthly accumulated observations of MODIS were used for cross comparison. The numbers of accumulated observations for the three sensors at 198 pixels over different time spans are listed in Table 6. POLDER only provides monthly accumulations and MODIS collects data for half a month to a whole month. In contrast, the AHI can collect data at multiple time scales from a day to a month. The time resolution advantage of AHI data makes it convenient to investigate the subtle changes in BRDF over time.
Similar to the results for the case study in Section 4.1, the average numbers of accumulated observations for the three sensors show the same pattern. The AHI can usually collect the largest number of observations during a month for the 198 pixels, with an average number of 231 ranging from 1 to 1294, while the MODIS obtains the least number (i.e., 33) ranging from 3 to 48. The large difference in the AHI data number reflects the dramatic changes in weather conditions [32]. Moreover, the POLDER attains a medium average number of 128 for monthly accumulated data, ranging from 42 to 243. In terms of data accumulations for half a month, the average data numbers for AHI and MODIS are 114 and 16, respectively. Surprisingly, only seven high-quality observations can be obtained for the daily AHI data, which is in accord with previous results [33] and appears to be a much lower data number considering the 10-min observation frequency. All the POLDER data have met the full-inversion requirements of the Ross-Li model [23], which benefits from its multiangle observation mode. For MODIS and AHI, 99.5% (i.e., 197) and 75.8% (i.e., 150) of the 198 sets of monthly accumulations can obtain high-quality data of more than seven respectively, and the lower percentage of AHI may be ascribed to our critical quality control with respect to cloud and aerosol properties, as shown in Table 2 in Section 2.2. On a half-month scale, most MODIS data numbers are more than seven, with a percentage of 95.5% compared with a total of 396 sets, while the result for AHI can only achieve 59.8%. There are 220 sets of data with more than seven observations for both MODIS and AHI. In terms of daily scale for all 6506 days, approximately one-fourth of the AHI observations (i.e., 23.8%, 1548 sets) can obtain high-quality observations of more than seven.
Overall, the AHI can obtain multiangle data at a finer time resolution, such as a daily scale, than POLDER and MODIS. Considering that critical quality control was performed in this study, most of the data were lacking in multiangle data as the aim was to perform a full inversion of the Ross-Li model for AHI. At both the month and half-month scales, the AHI has a significantly larger amount for the average observation number for each set of accumulations. The time resolution advantages of AHI have enabled a gain in the quantity of the accumulated data, which is promising to support BRDF analysis on a fine time scale.
Based on the accumulated multiangle data with angle combinations greater than seven for all three sensors, the modelled BRDF and albedos were compared following the case study. The case study in Section 4.1 demonstrated that the WoD can act as an effective indicator to guarantee the quality in further BRDF and albedo estimation; therefore, it was also used here. All the monthly POLDER data attain small WoDs of less than 0.7, and the WoDs for the monthly accumulated MODIS data are less than 1.6. For AHI, 24 out of 150 sets of data have a WoD that is larger than 2.0, with some as high as 3102. In terms of the half-month scale of 220 sets, 7 sets of MODIS data have a WoD that is larger than 2.0 with a maximum of 19.9, as well as 35 sets of AHI data where values reach 8149.4 for the most undesirable angle distribution. For the 1548 sets of AHI daily accumulations, there are 474 sets of data with a WoD that is larger than 2.0 up to 164,756.2, which also shows the dramatic change in AHI data that are affected by atmospheric conditions. Overall, the accumulated observations with small WoDs were further used for BRDF and albedo analyses, including 126, 181, and 1066 sets of observations at monthly, half-month, and daily scales, respectively.
Although all the AHI observations with SZAs less than 85° [Table 2] could be used for the final analysis, only data with SZAs that were less than 75° remained after removing the abnormal data of the retrieved surface reflectances, as introduced in Section 2.2. In addition, the VZAs are also less than 66.1°, as introduced in Section 2.2. Thus, these reasonable snow-free AHI surface multiangle data are more applicable for the Ross-Li model, which has a potential issue regarding large angles [60,63].
The typical angle distribution among 126 sets of high-quality monthly AHI data with a WoD that is less than 2.0 is shown in Figure 7, which is associated with the accumulated AHI data in the summer and winter along with several sets of latitude and longitude. Considering the data integrity in collecting a relatively complete change in the angle distribution of the AHI during a month, several sets of data that were affected by fewer disturbances of undesirable atmospheric conditions were selected and used to investigate the typical characteristics of AHI angle variances. Figure 7a–f refers to the results in the southern hemisphere, and Figure 7g–h shows those in the north, which present the pattern of solar angles [31,34] and viewing angles along with the seasons and locations.
Figure 7b,d show that the solar angles are invariant with longitude at a fixed latitude, where changeable viewing angles follow the patterns in Figure 3. For different seasons, significantly higher SZAs were obtained in winter [Figure 7c] than in summer [Figure 7b] for the same position, showing straight line and circular arc shapes, respectively. The winter possesses overall lower solar altitudes at local noon (i.e., larger SZA near 45° in Figure 7c) than those in summer (i.e., smaller SZA near 0° in Figure 7b), and thus, it leads to a slow change in the SZA from the values at noon to 90° at dawn and twilight in winter. In terms of the results in spring and autumn, there is a medium change in the solar angles between those in winter and summer. As the latitude approaches the equator, the overall shapes of the solar angles remain similar in summer [Figure 7a,b,e] and winter [Figure 7c,f], and the SZAs at local noon change based on the relative distance between the latitude and the solar angle. In the northern hemisphere, a symmetrical distribution of solar angles about the azimuth lines of 90° and 270° can be obtained, including comparisons in summer [Figure 7c,g] and winter [Figure 7a,h)].
Based on these high-quality multiangle data with observation numbers that were greater than seven and small WoDs, comparisons of the reflectances between the accumulated observations and values that were fitted by the RTLSR_C model from the three sensors during a whole month, half a month, and a day are shown in Figure 8. POLDER has collected a certain number of hotspot observations (the red dots in Figure 8), and few hotspot observations are also obtained for MODIS. However, no hotspot data remained after quality selection for the AHI. From Figure 8a–f at the monthly scale, although the average observation numbers for the AHI are the highest in Table 6 without considering the WoD, the data number decreases to less than that of POLDER after further selecting high-quality data with small WoDs. This switch shows that the quality of the multiangle data cannot be simply measured by the data number and that the angle distribution quality also plays an essential role. Similarly, the MODIS data still attain the lowest data number among the three sensors before selection by WoD. Notably, the results at the half-month scale [Figure 8g–j] are highly consistent with those at the monthly scale [Figure 8c–f], which are attributed to similar angle distributions. Overall, all the data from the three sensors can achieve a good BRDF fitting accuracy from the RTLSR_C model with an R2 that is larger than 0.9, and all the fit-RMSEs are less than 0.02 in both the red and NIR bands. There are relatively large discrepancies for MODIS, with fit-RMSEs of approximately 0.02, while POLDER and AHI can better fit the observed reflectances with fit-RMSEs of less than 0.01. Among all the BRDF fitting results for the three sensors at three time scales, the fitted bidirectional reflectances from the daily scale for AHI show the optimal consistency with observations in the two bands (i.e., fit-RMSE ≤ 0.0050, bias = 0.0001, and R2 = 1.00).
Comparisons of the BRDF parameters that were retrieved from the AHI- and MODIS CMG-accumulated observations are shown in Figure 9, including the results between MODIS and AHI on a half-month scale and those between the half-month and daily scales for the AHI. For comparisons between the two sensors in the left two columns, fiso shows a much better consistency than the other two coefficients (i.e., fvol and fgeo), with R2 values that are greater than 0.82. The small discrepancies in the isotropic scattering kernel coefficient indicate that the two sensors can obtain similar reflectance magnitude results which implies close nadir reflectances that are further modelled. However, when the data for the two sensors are used to derive parameters that are sensitive to fvol and fgeo, the results would more likely be inconsistent. In contrast, the results between the AHI at half-month and daily scales in the right two columns show a significantly higher consistency than those between the two sensors. All the R2 values are larger than 0.77 for the three kinds of coefficients in the two bands and fiso still presents optimal agreement with R2 values that are greater than 0.95. These comparisons show a better consistency within one sensor, although in different time spans than those between different sensors in the same span, which may partly be ascribed to the small change in the angle distribution for sensors onboard the GEO satellites at a monthly scale. In addition, the results for the monthly data between the AHI and MODIS (not illustrated here) are similar to those on a half-month scale.

4.2.2. Retrieval of BRDF Variables and Archetypes

The statistics of the AFXs that were retrieved from these high-quality multiangle data of the three sensors are listed in Table 7, and Figure 10 presents the results comparison for these AFXs. Compared with POLDER, MODIS and AHI can obtain a wider number of changes in AFXs, especially for the AHI that attains the largest standard deviations from Table 7 and Figure 10a. The average AFXs for the AHI at the three time scales are highly consistent and close to the results of MODIS and POLDER. Similar to the comparisons of the three kernel coefficients in Figure 9, the results with regard to the AFX also show a better consistency in different time spans of the AHI than those from the AHI and MODIS. Specifically, the RMSEs of the half-month data between MODIS and AHI are 0.32 and 0.15 with small biases in the red and NIR bands, respectively, and the results between the daily and half-month AHI data are 0.07 and 0.05, respectively. As a composite index of the three kernel coefficients to describe the dominant scattering type, the overall agreement in the AFX between MODIS and AHI, in addition to some discrepancies, shows the BRDF similarity in the two sensors, which is attributed to similar angle patterns. Notably, the good consistency in these AHI AFXs between the daily and half-month scales also indicates subsequently similar BRDF information.
Considering that an adequate amount of dataset for the AHI was obtained only on the daily scale, BRDF archetypes were extracted from the 1066 sets of filtered high-quality daily accumulated AHI multiangle data, as shown in Figure 11 and Table 8. There are four and five archetypes in the red and NIR bands, respectively. Benefitting from the wide range of AFXs, the daily accumulated AHI multiangle observations can capture BRDF shapes that are dominated by geometric-optical scattering (AFX < 1.0) and volumetric scattering (AFX > 1.0), which also demonstrates that the AHI can capture wide changes in reflectance anisotropy. The number and range of archetypes are similar to those that are extracted from the MODIS data [15], where six BRDF archetypes were obtained with AFXs ranging 0.382 to 1.946 in the red band and from 0.541 to 1.361 in the NIR band. Therefore, the AHI accumulated multiangle data are promising as a new and essential BRDF source.

4.2.3. Estimations of WSA and BSA

A comparison of BSA and WSA is shown in Figure 12 and Table 9 and Table 10, which were retrieved from the AHI- and MODIS CMG-accumulated observations during months, half months, and one day at selected high-quality pixels with WoDs that were less than 2.0. Figure 12 shows comparisons of BSA and WSA between the half-month AHI and MODIS CMG data, as well as the results between the daily and half-month AHI data. Overall, the albedos agree with discrepancies less than 0.05, especially for the AHI data that were accumulated in different time spans. Despite the larger differences in BRDF shapes that are indicated by the AFX, as shown in Figure 10, the albedos present much higher consistencies, which may be attributed to the smoothing effect of the integral from bidirectional reflectances. However, the surface parameters that are highly sensitive to specific angles, such as the clumping index (CI) [25,27,29,47,64], may attain larger discrepancies between MODIS and AHI.
Table 9 lists the statistics of the comparisons between AHI and MODIS for half-month and monthly accumulated multiangle data. All the RMSEs are less than 0.02 and 0.05 in the red and NIR bands, respectively, compared with MODIS, except BSA at an SZA of 60°. The discrepancies in WSA at the half-month scale are shown here in the red band (RMSE = 0.018, bias = 0.004) and NIR band (RMSE = 0.033, bias = 0.016). These RMSEs have exactly met the general absolute accuracy requirement [7] which shows that the estimated albedos from the AHI data are comparable to the operational MODIS albedo product. The generally good consistencies in albedo between the two sensors comply with the results in a previous study [33] which shows the potential of albedo estimation from the AHI data. In addition, most results from the half months attain slightly higher consistencies than those under a monthly scale, which may be ascribed to the theoretically smaller BRDF change in a shorter time span.
Figure 5 presents a similar angle distribution pattern among months for the AHI so it is necessary to investigate the substitution among the massive time-series AHI data. The albedo discrepancies for AHI data between the daily and half-month spans, as well as the monthly spans, are listed in Table 10, and all the total RMSEs are less than 0.01 between the daily and the half-month and monthly time spans in the red and NIR bands. Compared with the results from longer spans (i.e., monthly), the albedos that were retrieved from the daily data are more consistent with those from shorter spans (i.e., half-month) in the red band (RMSE = 0.004, bias = 0.001) and NIR band (RMSE = 0.007, bias = 0.000). The results that are associated with time spans may be attributed to the small change in the SZA and surface dynamics over time during the day, and larger discrepancies are more likely to appear over a longer time span. Therefore, when high-quality observations are lacking due to cloud contamination and other undesirable atmospheric conditions, the daily accumulated AHI data can be used to present BRDF changes from half a month to a month.

4.3. BRDF Information on AHI-like Daily Time-Series Nadir Observations for Maize

Based on the AHI-like daily time-series measurements of nadir surface reflectance every 10 min for maize in the summer of 2020, as introduced in Section 2.4, we attempted to preliminarily validate the BRDF changes in sensors onboard GEO satellites. Because the observations over four days were collected over a month, highly similar results were obtained. Consequently, the results for one day are presented here in Figure 13, which refers to the results for the data that were collected on day 234 in 2020. Although large SZAs can be obtained to 90° at dawn and twilight, only data with SZAs that were less than 80° were used for analysis considering the potential issue of the Ross-Li model regarding large angles [60,63]. The angle distribution of diurnal accumulations is shown in Figure 13a, where arc-shaped solar angles can be observed with dense sampling due to a continuous clear sky. The viewing zenith angle of 0° conforms to that of the AHI in the nadir direction while there are few high-quality observations along the equator due to undesirable atmospheric conditions. Similar to the AHI in Section 4.1 and Section 4.2, this set of field measurements did not capture observations near the hotspot direction and a total of 75 sets of angles were collected by relatively complete time accumulations. The WoD is 2.58, which indicates an acceptable quality of angle distribution, although it is slightly more than the critical value of 2.0.
Comparisons between the observed and RTLSR_C-retrieved reflectances are shown in Figure 13b,c. Generally, good agreement can be seen in both the red and NIR bands, with RMSEs of 0.0042 and 0.0368, respectively. The biases are close to 0.0. The good performance of the RTLSR_C inversion for the AHI-like measurements also demonstrates the validity of the BRDF information that was retrieved from the AHI data.

5. Discussion

Over past decades, multiangle observations that were acquired by MODIS, POLDER, and other radiometers onboard LEO satellites have been widely used to produce routine BRDF products and validate models, where data at different viewing angles and solar angles with consistent overpass times during a day can be collected. Moreover, as another essential observation mode, sensors onboard GEO satellites, can monitor the Earth every few to dozens of minutes which can capture the change in the diurnal surface bidirectional reflectances along with solar angles at a high temporal resolution. With the increasing application of retrieving surface parameters that are based on these GEO satellites, there is an urgent need to comprehensively investigate their BRDF patterns as a foundation for subsequent parameter retrievals.
Thus, 10-min AHI diurnal time-series observations (0.05°, ~5.2 km) at the same locations and seasons in 2020 as POLDER homogeneous snow-free pixels in 2008 (~6.2 km) [24] were collected and screened by the observation scope and cloud and aerosol conditions. These selected pixels are widely distributed in the AHI scope, covering various vegetation and soil types across four seasons. Here, the monthly collected POLDER data acted as reference data for their acknowledged sufficient angle sampling [20]. Considering that the AHI data that were released since July 2015 cannot be directly compared with the POLDER data in 2008, concurrent MODIS CMG multiangle observations in 2020 (0.05°, ~5.2 km) were also used for cross comparison. First, AHI BRDF information at a typical vegetation pixel was investigated and compared with those for POLDER and MODIS, including the angle distribution patterns, BRDF fittings, and albedo estimations that were retrieved from the hotspot-corrected kernel-driven RTLSR_C model. Then, comparisons for all the selected high-quality AHI data were performed for a comprehensive analysis at the daily, half-month, and monthly scales, and the BRDF archetypes were extracted to explore their dominant BRDF change. Finally, the AHI-like daily time-series nadir measurements for maize were also used for auxiliary validation, where the angle distribution and BRDF fitting were investigated.
Our main findings indicate that the accumulated AHI multiangle data can capture a wide BRDF change, achieving good consistency in BRDF and albedo estimations with those of MODIS. Due to intensive observation, diurnal multiangle data with wide solar angles can be obtained for the AHI which is difficult for MODIS due to only two passes during the day. After removing data that were obtained in undesirable cloud and atmospheric conditions, only seven high-quality observations were obtained on average, which can exactly meet the full-inversion requirements of the Ross-Li model [7]. Notably, these AHI observations show similar angle distributions between different days of a month due to slow changes in solar angles. Similar to MODIS [16], the AHI cannot capture hotspot observations well, and, therefore, their reconstruction is highly dependent on the BRDF models with a good ability in hotspot modelling (e.g., the RTLSR_C model). By using the angle indicator WoD, sun-viewing geometries for partial daily accumulated AHI data attain undesirable quality and most AHI data at the half-month and month scales present acceptable angle quality. The wide range of AFX and BRDF archetypes indicates that the AHI can capture broad BRDF changes, although with constant viewing angles. The overall good consistency, especially for fiso, leads to more consistent WSA and BSA retrievals between AHI and MODIS at the half-month and monthly scales, which may also be ascribed to their comparable angle patterns by considering the reciprocal property of the Ross-Li model [62]. The results agree with the validation in shortwave albedo estimations in a previous study [33] and angle combination quality is recommended to be considered in future work. Particularly, small discrepancies for the AHI data that were accumulated between different time spans present coincident BRDF and albedo estimations from similar angle patterns. In addition, reductions in averaged BSAs and WSAs that were retrieved from the AHI data in summer compared with spring and autumn complies with a previous study [63], and BSAs increase as SZA increases. These phenomena indicate the AHI data can capture the general seasonal pattern of surface albedo.
Some potential limitations need to be discussed in this study. In terms of the accumulated sun-viewing geometries, the AHI can rarely capture observations directly along the principal plane, which always presents the most significant anisotropy [5], similar to MODIS [65], and observations along the cross-principal plane generally show a Lambertian reflectance with subtle anisotropy [66]. Subsequently, a certain amount of data may retrieve dominantly isotropic scattering without reflectance anisotropy, as described in Section 4.1, which does not accord with the actual conditions with a nonnegligible BRDF effect. In this study, the solar and viewing zenith angles are within a common range for these selected high-quality AHI data (SZA ≤ 75°, VZA ≤ 66.1°), while BRDF reconstruction at large zenith angles within the whole effective observation scope (75° < SZA ≤ 90°, 75° < VZA ≤ 84.5°) is a challenge for the Ross-Li model [60,63]. It should be noted that the reciprocity still yields failure over heterogeneous land surfaces, and thus can be negligible at the scale of remote sensing pixels [62,67,68]. Meanwhile, a dismatch of the spatial resolution between POLDER (~6.2 km) and the other two sensors (i.e., MODIS and AHI, ~5.2 km) needs to be noted, and homogeneous POLDER pixels and larger representative areas of MODIS and AHI pixels will reduce the influence that is induced by the scale differences. The POLDER data are mainly used to compare angle distributions, and only BRDF and albedo consistencies at MODIS and AHI pixels were investigated at the same spatial resolutions. In addition, the differences in the spectral responses of the three sensors in the red band should also be noted, although the central wavelengths are very close between MODIS and AHI.
This study illustrates and quantifies the pattern of sun-viewing geometries and the variability in the retrieved BRDF indicators and the subsequent albedos for the AHI, which reveals the potential of multiangle information from sensors onboard GEO satellites. According to the good consistency of the angle distribution and the BRDF and albedo retrievals for the AHI pixels during a month, angle combinations for multiple days at different diurnal local times are recommended to derive BRDF variances more accurately under the assumption of their subtle changes during a month [20,22]. Snow pixels that are mainly spread across the two poles in POLDER were not included in this study and are beyond the scope of the AHI, and the BRDF property needs to be investigated in the future based on observations in medium-low latitudes. In addition, this study focuses on a coarse spatial resolution of 0.05° considering the inter-comparison with the high-quality POLDER multiangle dataset [20] and the BRDF information in the AHI data at a finer spatial resolution should be further investigated. Inter-comparisons between the AHI and the successor of MODIS (i.e., Visible Infrared Imaging Radiometer Suite (VIIRS)) [69] also need be explored.

6. Conclusions

The intrinsic BRDF characteristic lays a foundation for wide applications that are associated with surface reflectance in quantitative remote sensing. Previous BRDF studies have mostly focused on LEO satellites and only a few results on multiangle information from GEO satellites have been reported. In this study, the onboard GEO satellite Himawari-8 AHI was taken as an example, for which a series of BRDF indicators and albedo retrievals were derived to evaluate the underlying BRDF information through the hotspot-revised kernel-driven RTLSR_C model. The GEO-LEO inter-comparisons were performed at a monthly scale between the AHI-, MODIS-, and POLDER-accumulated multiangle observations at a coarse spatial resolution of 0.05° over various land types and seasons, and concurrent AHI and MODIS data were also compared at a half-month scale. The results show that the AHI can attain much more clear-sky multiangle data than those of MODIS and even of POLDER, and an arc or straight line in the solar angle pattern with hardly any hotspot directions can be seen in summer and winter, respectively. Moreover, both the total observation number and angle symmetry about the viewing plane impact the quality of the AHI angle distribution, and accurate reflectance fittings (i.e., fit-RMSEs < 0.01) were reconstructed by the RTLSR_C model in both the red and NIR bands for well-distributed observations (i.e., WoD < 2.0). The derived BRDF parameters of the AHI are generally consistent with those from MODIS, especially for fiso. A total of four and five dominant BRDF archetypes were extracted from a wide range of AFXs for the AHI in the red and NIR bands, respectively. Particularly, the results at daily and monthly scales express a significantly high consistency, which may be attributed to the tiny variance in the angle distribution during a month. Similarly, the derived albedos also show agreement between the AHI and MODIS, with WSA RMSEs at the half-month scale of 0.018 and 0.033 in the red and NIR bands, respectively, as well as much smaller RMSEs of 0.004 and 0.007 between the half-month and daily scales for the AHI, respectively.
This study provides an overview of BRDF variances in the AHI, and their good consistency with those of MODIS shows the promising potential of BRDF data sources from sensors onboard GEO satellites. In particular, the AHI observations present a similar angle pattern with that from MODIS, and the angle indicator WoD is recommended to select high-quality angle combinations instead of simply and crudely employing all time accumulated observations. Meanwhile, the results provide evidence for the potential of retrieving albedo based on AHI multiangle observations as implemented in previous studies, and albedos that are retrieved from different days in a month can act as alternatives for each other to handle a lack of data for AHI and even for MODIS. Considering the AHI’s ability in capturing BRDF information, new methods for retrieving more surface parameters that are sensitive to reflectance anisotropy can be developed. The AHI and MODIS observations as well as the VIIRS data may be fused to improve current albedo product accuracy considering their complementarity in temporal resolution and sun-viewing geometries. In addition, BRDF and albedo change from the AHI data at finer spatial resolutions (e.g., 500 m and 1 km), intraday and seasonal scales, and terrain regions [70] also need to be further investigated.

Author Contributions

Conceptualization, X.Z. and Z.J.; data curation, X.Z.; formal analysis, X.Z., Z.J., C.Z., J.G., Z.Z., Z.L., Y.D., S.Y., H.Z., L.C., S.L., Y.T., and C.W.; methodology, X.Z. and Z.J.; funding acquisition, Z.J., X.Z., Y.D., and H.Z.; writing—original draft, X.Z.; and writing—review and editing, X.Z. and Z.J. All authors have read and agreed to the published version of the manuscript.

Funding

This work was supported in part by the National Natural Science Foundation of China (42090013 & 41971288), the China Postdoctoral Science Foundation under Grant (2021M690424), and the National Natural Science Foundation of China (41801237 & 41971306).

Data Availability Statement

All satellite remote sensing data used in this study are openly and freely available. The Collection 6 MODIS BRDF parameter product (MCD43A1 & MCD43A2) is available at https://search.earthdata.nasa.gov/search, accessed on 16 November 2021. The POLDER dataset of surface multiangle observations in 2008 is available at https://doi.pangaea.de/10.1594/PANGAEA.864090, accessed on 16 November 2021. The Himawari-8 AHI TOA reflectance product and cloud and aerosol property product are available at the Japan Aerospace Exploration Agency (JAXA) P-Tree system (ftp://ftp.ptree.jaxa.jp/, accessed on 16 November 2021).

Acknowledgments

We greatly appreciate the suggestions from Gongxue Wang (Information Engineering University) and the PhD student Fangbo Pan (Beijing Normal University) regarding preprocessing of the AHI data. We are also grateful for the careful review and valuable comments by the anonymous reviewers.

Conflicts of Interest

The authors declare no conflict of interest.

Appendix A

Some variables and statistical parameters of comparison discrepancies in the evaluation are shown as follows. First, formulas of the hotspot revised volumetric scattering kernel (i.e., RossThick-Chen, KRTC) [16] and geometric-optical scattering kernel (i.e., LiSparseReciprocal-Chen, KLSRC) [53] are shown in Equations (A1)–(A9). The term 1 + C1 exp (−ξ/C2) is the so-called hotspot function that are previously suggested by Chen and Cihlar [35] to represent a simplified version of the hotspot effect in the four-scale model, where C1 and C2 are two adjustable hotspot parameters that modify the height and width of the original shape of the two scattering kernels. Observations at phase angles ξ ≤ 5° in Equation (2) with respect to a specific SZA are usually used as hotspot data. In addition, h is the mean height from the center of the crown to the ground, and b and r are the mean vertical half-axis and mean horizontal radius, respectively, of the modelled ellipsoid crown. Therefore, h/b and b/r represent the shape and relative height, respectively, of the crown. In general, h/b and b/r are set to values of 2 and 1, respectively.
BSA and WSA are integrals of directional reflectances over only the reflected hemisphere or bi-hemisphere as given in Equations (A1) and (A2), where R, angles (i.e., θs, θv, and φ), and band λ are the same as Equation (1) in the main text. Then, AFX is defined as the ratio of WSA to fiso as shown in Equation (A3). The statistical parameters of RMSE, Bias and R2 in Equations (A4)–(A6) were used to measure discrepancies between reference data x and comparative data y. In addition, the abbreviations used in this study are listed in Table A1.
K R T C = ( π / 2 ξ ) cos ξ + sin ξ cos θ v + cos θ s × ( 1 + C 1 e ξ C 2 ) π 4
cos ξ = cos θ s cos θ v + sin θ s sin θ v cos φ
K L S R C = O ( θ s , θ v , t ) ( 1 + C 1 e ξ C 2 ) sec θ s sec θ v + 1 2 ( 1 + cos ξ ) sec θ v sec θ s
O ( θ s , θ v , t ) = 1 π ( t sin t cos t ) ( sec θ s + sec θ v )
cos t = h b D 2 ( tan θ s tan θ v sin φ ) sec θ s + sec θ v
D = tan 2 θ s + tan 2 θ v 2 tan θ s tan θ v cos φ
cos ξ = cos θ s cos θ v + sin θ s sin θ v cos φ
θ s = tan 1 ( b r tan θ s )
θ v = tan 1 ( b r tan θ v )
B S A ( θ s , λ ) = 1 π 0 2 π 0 π 2 R ( θ s , θ v , φ , λ ) sin θ v cos θ v d θ v d φ
W S A ( λ ) = 2 0 π 2 B S A ( θ s , λ ) sin θ s cos θ s d θ s
A F X ( λ ) = W S A ( λ ) f i s o ( λ )
R M S E = j = 1 n ( y j x j ) 2 n
B i a s = j = 1 n ( y j x j ) n
R 2 = ( j = 1 n ( x j x ¯ ) ( y j y ¯ ) j = 1 n ( x j x ¯ ) 2 j = 1 n ( y j y ¯ ) 2 ) 2
Table A1. Lists of abbreviations used in this paper.
AbbreviationsFull Name
AFXAnisotropic Flat Index
AHIAdvanced Himawari Imager
AODAerosol Optical Depth
AOTAerosol Optical Thickness
BRDFBidirectional Reflectance Distribution Function
BRFBidirectional Reflectance Factor
BSABlack Sky Albedo
CDRClimate Data Records
CIClumping Index
CMGClimate Modelling Grid
ECVEssential Climate Variable
EUMETSATEuropean Organisation for the Exploitation of Meteorological Satellites
FAPARFraction of Absorbed Photosynthetically Active Radiation
FYFengyun
GEOGeostationary Earth Orbit
GK-2AGeo-KOMPSAT-2A
GOES-RGeostationary Operational Environment Satellite-R
ISODATAIterative Self Organizing Data Analysis Technique Algorithm
JAXAJapan Aerospace Exploration Agency
JMAJapan Meteorological Agency
LEOLow-Earth-Orbiting
MODISModerate resolution Imaging Spectroradiometer
NIRNear Infrared
NOAANational Oceanic and Atmospheric Administration
PARPhotosynthetically Active Radiation
PARASOLPolarization and Anisotropy of Reflectances for Atmospheric Science coupled with Ob-servations from a Lidar
POLDERPolarization and Directionality of the Earth’s Reflectances
RAARelative Azimuth Angle
RMSERoot Mean Square Error
RTLSRRossThick-LiSparseReciprocal
RTLSR_CRossThick-LiSparseReciprocal-Chen
SAASolar Azimuth Angle
SCOPE-CMSustained, Coordinated Processing of Environmental Satellite Data for Climate Monitoring
SZASolar Zenith Angle
TOATop Of Atmosphere
VAAView Azimuth Angle
VCFVegetation Continuous Fields
VIIRSVisible Infrared Imaging Radiometer Suite
VZAView Zenith Angle
WMOWorld Meteorological Organization
WoDWeight Of Determination
WSAWhite Sky Albedo

References

  1. Nicodemus, F.E.; Richmond, J.C.; Hsia, J.J.; Ginsberg, I.W.; Limperis, T. Geometrical Considerations and Nomenclature for Reflectance; National Bureau of Standards: Washington, DC, USA, 1977. [Google Scholar]
  2. Schaepman-Strub, G.; Schaepman, M.E.; Painter, T.H.; Dangel, S.; Martonchik, J.V. Reflectance Quantities in Optical Remote Sensing-Definitions and Case Studies. Remote Sens. Environ. 2006, 103, 27–42. [Google Scholar] [CrossRef]
  3. Asner, G.P.; Braswell, B.H.; Schimel, D.S.; Wessman, C.A. Ecological Research Needs from Multiangle Remote Sensing Data. Remote Sens. Environ. 1998, 63, 155–165. [Google Scholar] [CrossRef]
  4. Sandmeier, S.R.; Strahler, A.H. BRDF Laboratory Measurements. Remote Sens. Rev. 2000, 18, 481–502. [Google Scholar] [CrossRef]
  5. Sandmeier, S.R.; Deering, D.W. Structure Analysis and Classification of Boreal Forests Using Airborne Hyperspectral BRDF Data from ASAS. Remote Sens. Environ. 1999, 69, 281–295. [Google Scholar] [CrossRef]
  6. Sandmeier, S.R.; Muller, C.; Hosgood, B.; Andreoli, G. Sensitivity Analysis and Quality Assessment of Laboratory BRDF Data. Remote Sens. Environ. 1998, 64, 176–191. [Google Scholar] [CrossRef]
  7. Jin, Y.F.; Schaaf, C.B.; Gao, F.; Li, X.W.; Strahler, A.H.; Lucht, W.; Liang, S.L. Consistency of MODIS Surface Bidirectional Reflectance Distribution Function and Albedo Retrievals: 1. Algorithm Performance. J. Geophys. Res.-Atmos. 2003, 108, 4158. [Google Scholar] [CrossRef]
  8. Lucht, W.W.; Schaaf, C.B.; Strahler, A.H. An Algorithm for the Retrieval of Albedo from Space Using Semiempirical BRDF Models. IEEE Trans. Geosci. Remote Sens. 2000, 38, 977–998. [Google Scholar] [CrossRef] [Green Version]
  9. Barnsley, M.J.; Strahler, A.H.; Morris, K.P.; Muller, J.P. Sampling the Surface Bidirectional Reflectance Distribution Function (BRDF): 1. Evaluation of Current and Future Satellite Sensors. Remote Sens. Rev. 1994, 8, 271–311. [Google Scholar] [CrossRef]
  10. Jupp, D.L.B.; Strahler, A.H. A Hotspot Model for Leaf Canopies. Remote Sens. Environ. 1991, 38, 193–210. [Google Scholar] [CrossRef]
  11. Chen, J.M.; Cihlar, J. A Hotspot Function in a Simple Bidirectional Reflectance Model for Satellite Applications. J. Geophys. Res. -Atmos. 1997, 102, 25907–25913. [Google Scholar] [CrossRef]
  12. Chen, J.M.; Leblanc, S.G. A Four-Scale Bidirectional Reflectance Model Based On Canopy Architecture. IEEE Trans. Geosci. Remote Sens. 1997, 35, 1316–1337. [Google Scholar] [CrossRef]
  13. Hapke, B. Bidirectional Reflectance Spectroscopy: 4. The Extinction Coefficient and the Opposition Effect. Icarus 1986, 67, 264–280. [Google Scholar] [CrossRef] [Green Version]
  14. Hapke, B.; DiMucci, D.; Nelson, R.F.; Smythe, W. The Cause of the Hot Spot in Vegetation Canopies and Soils: Shadow-Hiding versus Coherent Backscatter. Remote Sens. Environ. 1996, 58, 63–68. [Google Scholar] [CrossRef] [Green Version]
  15. Jiao, Z.T.; Hill, M.J.; Schaaf, C.B.; Zhang, H.; Wang, Z.S.; Li, X.W. An Anisotropic Flat Index (AFX) to Derive BRDF Archetypes from MODIS. Remote Sens. Environ. 2014, 141, 168–187. [Google Scholar] [CrossRef]
  16. Jiao, Z.T.; Schaaf, C.B.; Dong, Y.D.; Roman, M.O.; Hill, M.J.; Chen, J.M.; Wang, Z.S.; Zhang, H.; Saenz, E.; Poudyal, R.; et al. A Method for Improving Hotspot Directional Signatures in BRDF Models Used for MODIS. Remote Sens. Environ. 2016, 186, 135–151. [Google Scholar] [CrossRef] [Green Version]
  17. Qin, W.H.; Goel, N.S. An Evaluation of Hotspot Models for Vegetation Canopies. Remote Sens. Rev. 1995, 13, 121–159. [Google Scholar] [CrossRef]
  18. Roosjen, P.P.J.; Brede, B.; Suomalainen, J.M.; Bartholomeus, H.M.; Kooistra, L.; Clevers, J.G.P.W. Improved Estimation of Leaf Area Index and Leaf Chlorophyll Content of a Potato Crop Using Multi-Angle Spectral Data-Potential of Unmanned Aerial Vehicle Imagery. Int. J. Appl. Earth Obs. 2018, 66, 14–26. [Google Scholar] [CrossRef]
  19. Zhang, X.; Jiao, Z.; Dong, Y.; Zhang, H.; Li, Y.; He, D.; Ding, A.; Yin, S.; Cui, L.; Chang, Y. Potential Investigation of Linking PROSAIL with the Ross-Li BRDF Model for Vegetation Characterization. Remote Sens. 2018, 10, 437. [Google Scholar] [CrossRef] [Green Version]
  20. Bréon, F.M.; Maignan, F. A BRDF–BPDF Database for the Analysis of Earth Target Reflectances. Earth Syst. Sci. Data 2017, 9, 31–45. [Google Scholar] [CrossRef] [Green Version]
  21. Bacour, C.; Breon, F.M. Variability of Biome Reflectance Directional Signatures as Seen by POLDER. Remote Sens. Environ. 2005, 98, 80–95. [Google Scholar] [CrossRef]
  22. Schaaf, C.B.; Liu, J.C.; Gao, F.; Strahler, A.H. Aqua and Terra MODIS Albedo and Reflectance Anisotropy Products. In Land Remote Sensing and Global Environmental Change: NASA’s Earth Observing System and the Science of ASTER and MODIS.; Ramachandran, B., Justice, C.O., Abrams, M.J., Eds.; Springer: New York, NY, USA, 2011; Volume 11, pp. 549–561. [Google Scholar]
  23. Schaaf, C.B.; Gao, F.; Strahler, A.H.; Lucht, W.W.; Li, X.W.; Tsang, T.; Strugnell, N.C.; Zhang, X.Y.; Jin, Y.F.; Muller, J.P.; et al. First Operational BRDF, Albedo Nadir Reflectance Products from MODIS. Remote Sens. Environ. 2002, 83, 135–148. [Google Scholar] [CrossRef] [Green Version]
  24. Jiao, Z.T.; Zhang, X.N.; Breon, F.M.; Dong, Y.D.; Schaaf, C.B.; Roman, M.O.; Wang, Z.S.; Cui, L.; Yin, S.Y.; Ding, A.X.; et al. The Influence of Spatial Resolution on the Angular Variation Patterns of Optical Reflectance as Retrieved from MODIS and POLDER Measurements. Remote Sens. Environ. 2018, 215, 371–385. [Google Scholar] [CrossRef]
  25. Wei, S.; Fang, H. Estimation of Canopy Clumping Index from MISR and MODIS Sensors Using the Normalized Difference Hotspot and Darkspot (NDHD) Method: The Influence of BRDF Models and Solar Zenith Angle. Remote Sens. Environ. 2016, 187, 476–491. [Google Scholar] [CrossRef]
  26. He, T.; Liang, S.L.; Wang, D.D.; Cao, Y.F.; Gao, F.; Yu, Y.Y.; Feng, M. Evaluating Land Surface Albedo Estimation from Landsat MSS, TM, ETM Plus, and OLI Data Based On the Unified Direct Estimation Approach. Remote Sens. Environ. 2018, 204, 181–196. [Google Scholar] [CrossRef]
  27. Jiao, Z.T.; Dong, Y.D.; Schaaf, C.B.; Chen, J.M.; Román, M.; Wang, Z.S.; Zhang, H.; Ding, A.X.; Erb, A.; Hill, M.J.; et al. An Algorithm for the Retrieval of the Clumping Index (CI) from the MODIS BRDF Product Using an Adjusted Version of the Kernel-Driven BRDF Model. Remote Sens. Environ. 2018, 209, 594–611. [Google Scholar] [CrossRef]
  28. Jiao, Z.; Ding, A.; Kokhanovsky, A.; Schaaf, C.; Breon, F.; Dong, Y.; Wang, Z.; Liu, Y.; Zhang, X.; Yin, S.; et al. Development of a Snow Kernel to Better Model the Anisotropic Reflectance of Pure Snow in a Kernel-Driven BRDF Model Framework. Remote Sens. Environ. 2019, 221, 198–209. [Google Scholar] [CrossRef]
  29. Pisek, J.; Govind, A.; Arndt, S.K.; Hocking, D.; Wardlaw, T.J.; Fang, H.; Matteucci, G.; Longdoz, B. Intercomparison of Clumping Index Estimates from POLDER, MODIS, and MISR Satellite Data Over Reference Sites. ISPRS J. Photogramm. 2015, 101, 47–56. [Google Scholar] [CrossRef]
  30. Qu, Y.; Liu, Q.; Liang, S.L.; Wang, L.Z.; Liu, N.F.; Liu, S.H. Direct-Estimation Algorithm for Mapping Daily Land-Surface Broadband Albedo from MODIS Data. IEEE Trans. Geosci. Remote Sens. 2014, 52, 907–919. [Google Scholar] [CrossRef]
  31. Zhang, X.; Jiao, Z.; Dong, Y.; He, T.; Ding, A.; Yin, S.; Zhang, H.; Cui, L.; Chang, Y.; Guo, J.; et al. Development of the Direct-Estimation Albedo Algorithm for Snow-Free Landsat TM Albedo Retrievals Using Field Flux Measurements. IEEE Trans. Geosci. Remote Sens. 2020, 58, 1550–1567. [Google Scholar] [CrossRef]
  32. Bessho, K.; Date, K.; Hayashi, M.; Ikeda, A.; Imai, T.; Inoue, H.; Kumagai, Y.; Miyakawa, T.; Murata, H.; Ohno, T.; et al. An Introduction to Himawari-8/9-Japan’s New-Generation Geostationary Meteorological Satellites. J. Meteorol. Soc. Jpn. 2016, 94, 151–183. [Google Scholar] [CrossRef] [Green Version]
  33. He, T.; Zhang, Y.; Liang, S.; Yu, Y.; Wang, D. Developing Land Surface Directional Reflectance and Albedo Products from Geostationary GOES-R and Himawari Data: Theoretical Basis, Operational Implementation, and Validation. Remote Sens. 2019, 11, 2655. [Google Scholar] [CrossRef] [Green Version]
  34. Ma, X.; Huete, A.; Nguyen Tran, N.; Bi, J.; Gao, S.; Zeng, Y. Sun-Angle Effects On Remote-Sensing Phenology Observed and Modelled Using Himawari-8. Remote Sens. 2020, 12, 1339. [Google Scholar] [CrossRef] [Green Version]
  35. Fang, H. Retrieval of Land Surface Parameters from Geostationary Satellite Data: An Overview of Recent Developments. J. Remote Sens. (Chin.) 2021, 25, 109–125. [Google Scholar]
  36. Lattanzio, A.; Fell, F.; Bennartz, R.; Trigo, I.F.; Schulz, J. Quality Assessment and Improvement of the EUMETSAT Meteosat Surface Albedo Climate Data Record. Atmos. Meas. Tech. 2015, 8, 4561–4571. [Google Scholar] [CrossRef] [Green Version]
  37. Lattanzio, A.; Schulz, J.; Matthews, J.; Okuyama, A.; Theodore, B.; Bates, J.J.; Knapp, K.R.; Kosaka, Y.; Schueller, L. Land Surface Albedo from Geostationary Satellites: A Multiagency Collaboration within SCOPE-CM. Bull. Am. Meteorol. Soc. 2013, 94, 205–214. [Google Scholar] [CrossRef]
  38. Loew, A.; Bennartz, R.; Fell, F.; Lattanzio, A.; Doutriaux-Boucher, M.; Schulz, J. A Database of Global Reference Sites to Support Validation of Satellite Surface Albedo Datasets (SAVS 1.0). Earth Syst. Sci. Data 2016, 8, 425–438. [Google Scholar] [CrossRef]
  39. Lee, K.; Chung, S.; Lee, C.; Seo, M.; Choi, S.; Seong, N.; Jin, D.; Kang, M.; Yeom, J.; Roujean, J.; et al. Development of Land Surface Albedo Algorithm for the GK-2A/AMI Instrument. Remote Sens. 2020, 12, 2500. [Google Scholar] [CrossRef]
  40. Wang, G.; Jiang, L.; Shi, J.; Liu, X.; Yang, J.; Cui, H. Snow-Covered Area Retrieval from Himawari-8 AHI Imagery of the Tibetan Plateau. Remote Sens. 2019, 11, 2391. [Google Scholar] [CrossRef] [Green Version]
  41. Zhang, Y.; Fang, H.; Wang, Y.; Li, S. Variation of Intra-Daily Instantaneous FAPAR Estimated from the Geostationary Himawari-8 AHI Data. Agr. Forest Meteorol. 2021, 307, 108535. [Google Scholar] [CrossRef]
  42. Lucht, W.W.; Lewis, P.E. Theoretical Noise Sensitivity of BRDF and Albedo Retrieval from the EOS-MODIS and MISR Sensors with Respect to Angular Sampling. Int. J. Remote Sens. 2000, 21, 81–98. [Google Scholar] [CrossRef]
  43. Vermote, E.F.; Tanre, D.; Deuze, J.L.; Herman, M.; Morcette, J. Second Simulation of the Satellite Signal in the Solar Spectrum, 6S: An overview. IEEE Trans. Geosci. Remote Sens. 1997, 35, 675–686. [Google Scholar] [CrossRef] [Green Version]
  44. Maignan, F.; Breon, F.M.; Lacaze, R. Bidirectional Reflectance of Earth Targets: Evaluation of Analytical Models Using a Large Set of Spaceborne Measurements with Emphasis on the Hot Spot. Remote Sens. Environ. 2004, 90, 210–220. [Google Scholar] [CrossRef]
  45. Bréon, F.M.; Maignan, F.; Leroy, M.; Grant, I. Analysis of Hot Spot Directional Signatures Measured from Space. J. Geophys. Res.-Atmos. 2002, 107, AAC 1-1–AAC 1-15. [Google Scholar] [CrossRef]
  46. Pisek, J.; Chen, J.M.; Lacaze, R.; Sonnentag, O.; Alikas, K. Expanding Global Mapping of the Foliage Clumping Index with Multi-Angular POLDER Three Measurements: Evaluation and Topographic Compensation. ISPRS J. Photogramm. 2010, 65, 341–346. [Google Scholar] [CrossRef]
  47. Chen, J.M.; Menges, C.H.; Leblanc, S.G. Global Mapping of Foliage Clumping Index Using Multi-Angular Satellite Data. Remote Sens. Environ. 2005, 97, 447–457. [Google Scholar] [CrossRef]
  48. Leblanc, S.G.; Chen, J.M.; White, H.P.; Latifovic, R.; Lacaze, R.; Roujean, J. Canada-Wide Foliage Clumping Index Mapping from Multiangular POLDER Measurements. Can. J. Remote Sens. 2005, 31, 364–376. [Google Scholar] [CrossRef]
  49. Matsuoka, M.; Honda, R.; Nonomura, A.; Moriya, H.; Akatsuka, S.; Yoshioka, H.; Takagi, M. A Method to Improve Geometric Accuracy of Himawari-8/AHI “Japan Area” Data. J. Jpn. Soc. Photogramm. Remote Sens. 2016, 54, 280–289. [Google Scholar]
  50. Tan, B.; Woodcock, C.E.; Hu, J.; Zhang, P.; Ozdogan, M.; Huang, D.; Yang, W.; Knyazikhin, Y.; Myneni, R.B. The Impact of Gridding Artifacts on the Local Spatial Properties of MODIS Data: Implications for Validation, Compositing, and Band-To-Band Registration across Resolutions. Remote Sens. Environ. 2006, 105, 98–114. [Google Scholar] [CrossRef]
  51. Wang, Z.S.; Schaaf, C.B.; Strahler, A.H.; Chopping, M.J.; Roman, M.O.; Shuai, Y.M.; Woodcock, C.E.; Hollinger, D.Y.; Fitzjarrald, D.R. Evaluation of MODIS Albedo Product (MCD43A) Over Grassland, Agriculture and Forest Surface Types During Dormant and Snow-Covered Periods. Remote Sens. Environ. 2014, 140, 60–77. [Google Scholar] [CrossRef] [Green Version]
  52. Xu, S.; Liu, Z.; Zhao, L.; Zhao, H.; Ren, S. Diurnal Response of Sun-Induced Fluorescence and PRI to Water Stress in Maize Using a Near-Surface Remote Sensing Platform. Remote Sens. 2018, 10, 1510. [Google Scholar] [CrossRef] [Green Version]
  53. Dong, Y.; Jiao, Z.; Cui, L.; Zhang, H.; Zhang, X.; Yin, S.; Ding, A.; Chang, Y.; Xie, R.; Guo, J. Assessment of the Hotspot Effect for the PROSAIL Model with POLDER Hotspot Observations Based On the Hotspot-Enhanced Kernel-Driven BRDF Model. IEEE Trans. Geosci. Remote Sens. 2019, 57, 8048–8064. [Google Scholar] [CrossRef]
  54. Wanner, W.; Li, X.W.; Strahler, A.H. On the Derivation of Kernels for Kernel-Driven Models of Bidirectional Reflectance. J. Geophys. Res.-Atmos. 1995, 100, 21077–21089. [Google Scholar] [CrossRef]
  55. Roujean, J.L.; Leroy, M.M.; Deschamps, P.Y. A Bidirectional Reflectance Model of the Earth’s Surface for the Correction of Remote Sensing Data. J. Geophys. Res.-Atmos. 1992, 97, 20455–20468. [Google Scholar] [CrossRef]
  56. Jin, Y.F.; Schaaf, C.B.; Woodcock, C.E.; Gao, F.; Li, X.W.; Strahler, A.H.; Lucht, W.W.; Liang, S.L. Consistency of MODIS Surface Bidirectional Reflectance Distribution Function and Albedo Retrievals: 2. Validation. J. Geophys. Res.-Atmos. 2003, 108, 4159. [Google Scholar] [CrossRef] [Green Version]
  57. Che, X.; Feng, M.; Sexton, J.O.; Channan, S.; Yang, Y.; Sun, Q. Assessment of MODIS BRDF/Albedo Model Parameters (MCD43A1 Collection 6) for Directional Reflectance Retrieval. Remote Sens. 2017, 9, 1123. [Google Scholar] [CrossRef] [Green Version]
  58. Privette, J.L.; Eck, T.F.; Deering, D.W. Estimating Spectral Albedo and Nadir Reflectance through Inversion of Simple BRDF Models with AVHRR/MODIS-like Data. J. Geophys. Res.-Atmos. 1997, 102, 29529–29542. [Google Scholar] [CrossRef]
  59. Huang, X.Y.; Jiao, Z.T.; Dong, Y.D.; Zhang, H.; Li, X.W. Analysis of BRDF and Albedo Retrieved by Kernel-Driven Models Using Field Measurements. IEEE J.-Stars. 2013, 6, 149–161. [Google Scholar] [CrossRef]
  60. Chang, Y.X.; Jiao, Z.T.; Zhang, X.N.; Mei, L.L.; Dong, Y.D.; Yin, S.Y.; Cui, L.; Ding, A.X.; Guo, J.; Xie, R.; et al. Assessment of Improved Ross-Li BRDF Models Emphasizing Albedo Estimates at Large Solar Angles Using POLDER Data. IEEE Trans. Geosci. Remote Sens. 2021, 59, 9968–9986. [Google Scholar] [CrossRef]
  61. Roman, M.O.; Gatebe, C.K.; Schaaf, C.B.; Poudyal, R.; Wang, Z.S.; King, M.D. Variability in Surface BRDF at Different Spatial Scales (30 M-500 M) Over a Mixed Agricultural Landscape as Retrieved from Airborne and Satellite Spectral Measurements. Remote Sens. Environ. 2011, 115, 2184–2203. [Google Scholar] [CrossRef] [Green Version]
  62. Li, X.W.; Gao, F.; Chen, L.Z.; Strahler, A.H. Derivation and Validation of a New Kernel for Kernel-Driven BRDF Models. In Proceedings of the 44th International Society for Optics and Photonics, Denver, CO, USA, 18 July 1999; Volume 3868, pp. 368–379. [Google Scholar]
  63. Liu, J.C.; Schaaf, C.B.; Strahler, A.H.; Jiao, Z.T.; Shuai, Y.M.; Zhang, Q.L.; Roman, M.O.; Augustine, J.A.; Dutton, E.G. Validation of Moderate Resolution Imaging Spectroradiometer (MODIS) Albedo Retrieval Algorithm: Dependence of Albedo On Solar Zenith Angle. J. Geophys. Res.-Atmos. 2009, 114, D1106. [Google Scholar] [CrossRef]
  64. He, L.; Liu, J.; Chen, J.M.; Croft, H.; Wang, R.; Sprintsin, M.; Zheng, T.; Ryu, Y.; Piseke, J.; Gonsamo, A.; et al. Inter- and Intra-Annual Variations of Clumping Index Derived from the MODIS BRDF Product. Int. J. Appl. Earth Obs. 2016, 44, 53–60. [Google Scholar] [CrossRef]
  65. Jin, Y.F.; Gao, F.; Schaaf, C.B.; Li, X.W.; Strahler, A.H.; Bruegge, C.J.; Martonchik, J.V. Improving MODIS Surface BRDF/Albedo Retrieval with MISR Multiangle Observations. IEEE Trans. Geosci. Remote Sens. 2002, 40, 1593–1604. [Google Scholar]
  66. Deering, D.W.; Middleton, E.M.; Irons, J.R.; Blad, B.L.; Waltershea, E.A.; Hays, C.J.; Walthall, C.; Eck, T.F.; Ahmad, S.P.; Banerjee, B.P. Prairie Grassland Bidirectional Reflectances Measured by Different Instruments at the FIFE Site. J. Geophys. Res.-Atmos. 1992, 97, 18887–18903. [Google Scholar] [CrossRef]
  67. Li, X.W.; Wang, J.D.; Strahler, A.H. Apparent Reciprocity Failure in Directional Reflectance of Structured Surfaces. Prog. Nat. Sci. 1999, 9, 751–752. [Google Scholar]
  68. Gao, F.; Li, X.W.; Strahler, A.H.; Schaaf, C.B. Evaluation of the Li Transit Kernel for BRDF Modeling. Remote Sens. Rev. 2000, 19, 205–224. [Google Scholar] [CrossRef]
  69. Liu, Y.; Wang, Z.; Sun, Q.; Erb, A.M.; Li, Z.; Schaaf, C.B.; Zhang, X.; Roman, M.O.; Scott, R.L.; Zhang, Q.; et al. Evaluation of the VIIRS BRDF, Albedo and NBAR Products Suite and an Assessment of Continuity with the Long Term MODIS Record. Remote Sens. Environ. 2017, 201, 256–274. [Google Scholar] [CrossRef]
  70. Matsuoka, M.; Takagi, M.; Akatsuka, S.; Honda, R.; Nonomura, A.; Moriya, H.; Yoshioka, H. Bidirectional Reflectance Modelling of the Geostationary Sensor himawari-8/AHI Using a Kernel-Driven BRDF Model. In Proceedings of the 23rd ISPRS Congress, Commission 12th, Prague, Czech Republic, 13 July 2016; Volume 3, pp. 3–8. [Google Scholar]
Figure 1. Relative spectral responses for POLDER, MODIS, and AHI in the red and NIR bands. POLDER-Red, MODIS-Red and AHI-Red refer to the results for POLDER, MODIS and AHI data in the red band, respectively; POLDER-NIR, MODIS-NIR and AHI-NIR are the results for the three sensors in the NIR band.
Remotesensing 14 00139 g001
Figure 2. The spatial distribution for the 198 sets of concurrent POLDER, MODIS, and AHI pixels.
Remotesensing 14 00139 g002
Figure 3. The spatial distribution of viewing angles for the AHI. (a) VZA. (b) VAA. The red rectangles refer to the effective observation scope of AHI.
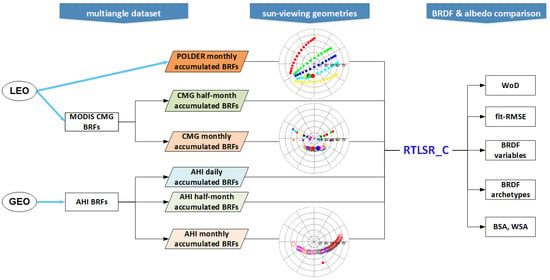
Remotesensing 14 00139 g003
Figure 4. Flowchart for evaluating the BRDF information of time-series AHI data.
Remotesensing 14 00139 g004
Figure 5. Statistics and distribution of the monthly accumulative sun-viewing angles for POLDER, MODIS, and AHI at a mixed forest pixel. The larger circles refer to the solar angles and the smaller circles refer to the viewing geometries. (a) refers to the angle distribution of POLDER in August 2008 and the colours indicate the different solar angles. (bd) refer to the accumulated angles for MODIS for the first half of the month, the second half of the month, and the whole month in July 2020, respectively; the colours indicate the different solar angles. (e,f) present the ranges of SZA and SAA during July 2020. (g) presents the number of AHI observations for each day in July 2020. (hk) refer to the accumulated angles for the AHI on four typical days, 1 July, 3 July, 14 July, and 22 July 2020, respectively. (ln) refer to the accumulated angles for the AHI for the first half of the month, the second half of the month, and the whole month in July 2020, respectively, and the colours indicate the different observation dates.
Remotesensing 14 00139 g005
Figure 6. Comparison of bi-directional reflectances and albedos between the RTLSR_C-modelled results and observations from POLDER, MODIS, and AHI at a mixed forest pixel. (ac) present comparisons of the modelled and observed bi-directional reflectances (i.e., BRFs) in the red band for all observation geometries and principal plane, as well as comparisons of BSA and WSA, respectively. The red dots in (b) refer to observations near the principal plane, and the two observations with VZAs that are close to the SZA of 38° are hotspot data. BSA_0 in (c) refers to the BSA when the SZA is zero (nadir), and BSA_15, BSA_30, BSA_45, and BSA_60 refer to the BSAs for SZAs of 15°, 30°, 45°, and 60°, respectively. (df) refer to the results that are similar to (ac) but in the NIR band.
Remotesensing 14 00139 g006aRemotesensing 14 00139 g006b
Figure 7. The typical angle distribution for the monthly accumulated AHI data within the observation scope. The latitude, longitude, and month are labelled in each plot. (af) refer to the results in the southern hemisphere, and (g,h) shows those in the north.
Remotesensing 14 00139 g007
Figure 8. Comparisons of reflectances between the observed and RTLSR_C-fitted values from AHI- and MODIS CMG-accumulated observations during a whole month, half a month, and a day. The red dots represent data near the hotspot direction, and the black dots are data at the remaining geometries. The sensors, bands, and time spans are labelled in each plot. (af) refer to the results at the month scale for the three sensors in the red and NIR bands, and (gj) refer to those for AHI and MODIS at the half-month scale. (k,l) refer to the results for AHI at daily scale.
Remotesensing 14 00139 g008
Figure 9. Comparisons of BRDF parameters that were retrieved from AHI- and MODIS CMG-accumulated observations during a day and half a month. (a) refers to comparisons of fiso that was retrieved from half-month (black circle) and daily (grey dot) AHI data with those from half-month MODIS data in the red band, and (b) is similar to (a) but in the NIR band. (c,d) refer to comparisons of fiso that were retrieved from the AHI data between the half-month scale and daily scale in the red and NIR bands, respectively. (eh) refer to the results similar to (ad) but for fvol, and (il) are those for fgeo.
Remotesensing 14 00139 g009
Figure 10. Comparison of AFXs that were retrieved from the accumulated observations of POLDER, MODIS CMG, and AHI during a day and half a month. (a) refers to the variance ranges of AFX that were retrieved from accumulated multiangle observations of the three sensors at different time spans. (b) refers to comparisons of AFX that were retrieved from half-month (black circle) and daily (grey dot) AHI data with those from half-month MODIS data in the red band, and (c) is similar to (b) but in the NIR band. (d,e) refers to comparisons of AFX that were retrieved from AHI data between the half-month scale and daily scale in the red and NIR bands, respectively.
Remotesensing 14 00139 g010aRemotesensing 14 00139 g010b
Figure 11. BRDF archetypes that were extracted from the 1066 sets of daily accumulated high-quality AHI observations. (a) Red band. (b) NIR band.
Remotesensing 14 00139 g011
Figure 12. Comparisons of BSA and WSA that were retrieved from the AHI- and MODIS CMG-accumulated observations during a day and half a month. (a,b) Comparisons of BSA that were retrieved from MODIS and AHI in the red and NIR bands, respectively, and the colours indicate the BSAs at different SZAs. (c,d) refer to similar results as (a,b) but for WSA. (eh) refer to similar results as (ad) but for those retrieved from half-month and daily accumulated AHI data.
Remotesensing 14 00139 g012
Figure 13. BRDF variances of the AHI-like daily time-series field measurements of nadir surface reflectances for maize. (a) The spatial distribution of the accumulated sun-viewing angles. (b,c) refers to the comparisons of reflectances between the observed and RTLSR_C-fitted values in the red and NIR bands, respectively.
Remotesensing 14 00139 g013
Table 1. Seasons and land cover types of the selected pixels.
SeasonIGBP
SpringSummerAutumnWinter12345678910111213141516
1672327802010125935331601601005
Table 2. Quality control for the AHI data.
FlagItemValue
AngleSZA0°~85°
Aerosol propertyAOD≥ 0
Data availability0—Available
Land/Water0—Land
Cloud flag0—Clear
Retrieval status0—Successful
AOD confidence00—Very good, 01—Good, 10—Marginal
Additional cloud flag (Near-by-cloud test)0—Clear
Snow/ice0—No for snow-free data
Turbid water0—No
Cloud propertyCloud retrieval algorithm flag010—Clear, 100—Successful: Low confidence, 101—Successful: High confidence
Cloud mask confidence level flag00—Clear, 01—Probably clear
Table 3. Quality control for the MODIS CMG data.
FlagItemValue
Coarse resolution QAAtmospheric correction performed1—yes
Band 1–7 data quality four bit range000—highest quality
MODLAND QA bits00—ideal quality all bands
Coarse resolution state QAMOD35 snow/ice flag0—no
Cloud state00—clear
Table 4. Information on multiangle data compared with POLDER and MODIS at a typical vegetation pixel.
DatasetSpatial ResolutionTimeMonthly Obs. NumberSZA (°)SAA (°)VZA (°)VAA (°)
POLDER~6.2 kmAugust 20087231.2–38.4186.0–215.88.2–65.90.8–356.5
MODIS CMG0.05°(~5.2 km)July 20202725.9–35.5131.8–225.29.3–59.269.7–293.2
AHI0.05°(~5.2 km)July 202021426.4–69.877.6–263.458.5157.0
Table 5. Inversion accuracy of the RTLSR_C model based on multiangle observations from POLDER, MODIS, and AHI.
BandDatasetDayNumber of AnglesWoDFit-RMSEBiasR2AFXWSA
RedPOLDER1–30720.080.00270.00000.850.990.032
MODIS CMG1–16120.940.01470.00000.241.190.036
17–31101.570.00990.00000.400.440.017
1–31220.590.01220.00000.270.880.029
AHI1–161740.040.00550.00000.010.890.036
17–31400.190.00310.00000.260.550.032
1–312140.030.00550.00000.040.800.034
1210.290.00320.0000-1.000.034
31266.280.00260.0000-1.000.035
14250.460.00510.00000.300.880.029
228468.700.00160.00000.870.260.022
NIRPOLDER1–30--0.00630.00000.990.910.305
MODIS CMG1–16--0.02720.00000.660.900.383
17–31--0.02010.00000.801.170.421
1–31--0.02480.00000.671.000.398
AHI1–16--0.02120.00000.601.000.421
17–31--0.00660.00000.890.630.408
1–31--0.02350.00000.590.930.411
1--0.00480.00000.940.830.421
3--0.00690.00000.501.050.430
14--0.01590.00000.860.950.360
22--0.00310.00000.911.200.402
Among the 31 days in July 2020, the number of days for collecting high-quality AHI observations of 0, 1~6, and ≥7 are 13, 6, and 12, respectively.
Table 6. Numbers of accumulated observations at 198 pixels over different time spans.
DatasetStatisticsMonthHalf a MonthDaily
Total 1983966506
POLDERmin42--
max243--
mean128--
MODIS CMGmin31-
max4826-
mean3316-
1–6 (%)0.54.5-
≥7 (%)99.595.5-
AHImin100
max129470956
mean2311147
0 (%)019.667.6
1–6 (%)24.220.68.6
≥7 (%)75.859.823.8
Table 7. AFXs retrieved from high-quality POLDER, MODIS CMG, and AHI multiangle data (number ≥ 7, WoD ≤ 2).
BandAccumulation Time SpansDatasetData NumberAFXminAFXmaxAFXmeanAFXstd
RedmonthPOLDER1260.5351.3020.7860.115
MODIS CMG0.3441.5230.8150.175
AHI0.4761.6460.8380.190
half a monthMODIS CMG1810.5071.6890.8210.164
AHI0.4262.0720.8740.305
dailyAHI10660.4662.2220.8030.139
NIRmonthPOLDER1260.7171.1500.9170.086
MODIS CMG0.7171.2160.9550.122
AHI0.4261.6810.9480.159
half a monthMODIS CMG1810.6211.2440.9720.131
AHI0.6221.7280.9630.145
dailyAHI10660.6981.7590.9630.111
Table 8. AFX ranges for the BRDF archetypes that were derived from the 1066 sets of daily accumulated high-quality multiangle observations.
BandsAFX RangeData NumberAFXmeanAFXstd
Red[0.466, 0.697]1910.6400.047
[0.697, 0.812]4320.7530.032
[0.812, 0.997]3810.8780.043
[0.997, 2.222]701.1480.189
NIR[0.698, 0.840]1350.7830.031
[0.840, 0.927]2640.8890.024
[0.927, 1.000]2780.9610.021
[1.000, 1.102]3031.0440.028
[1.102, 1.759]941.1730.083
Table 9. Discrepancies in the retrieved albedos between the high-quality AHI and MODIS CMG observations (number ≥ 7, WoD ≤ 2).
BandAccumulation Time SpansNumber of PixelsErrorBSA_0BSA_15BSA_30BSA_45BSA_60WSA
Redmonth126RMSE0.01520.01510.01510.01680.02420.0198
Bias−0.0024−0.0021−0.00110.00090.00480.0028
R20.930.930.930.920.860.90
half a month181RMSE0.01570.01540.01490.01560.02230.0181
Bias−0.0033−0.0029−0.00160.00100.00610.0035
R20.920.920.930.920.870.90
NIRmonth126RMSE0.03400.03350.03250.03340.04330.0369
Bias0.01010.01030.01100.01260.01570.0142
R20.690.700.720.740.660.72
half a month181RMSE0.02940.02900.02840.02960.03890.0330
Bias0.01130.01150.01230.01390.01710.0156
R20.780.790.800.800.710.77
BSA_0 refers to the BSA when the SZA is zero (nadir), and BSA_15, BSA_30, BSA_45, and BSA_60 refer to the BSAs for SZAs of 15°, 30°, 45°, and 60°, respectively.
Table 10. Discrepancies in the retrieved albedos between daily, half-month, and monthly accumulated high-quality AHI observations (number ≥ 7, WoD ≤ 2).
BandAccumulation Time SpansNumber of DataErrorBSA_0BSA_15BSA_30BSA_45BSA_60WSA
Redmonth1066RMSE0.00600.00570.00510.00440.00600.0048
Bias−0.0009−0.0008−0.00040.00030.00180.0010
R20.990.990.990.990.990.99
half a monthRMSE0.00380.00360.00310.00300.00520.0038
Bias−0.0003−0.0003−0.00010.00030.00090.0006
R20.990.991.001.000.990.99
NIRmonthRMSE0.00980.00940.00820.00700.01010.0077
Bias−0.0004−0.0003−0.00020.00000.00050.0002
R20.970.970.980.980.970.98
half a monthRMSE0.00720.00690.00590.00540.00910.0066
Bias−0.0003−0.0003−0.00020.00000.00030.0001
R20.980.980.990.990.980.99
Publisher’s Note: MDPI stays neutral with regard to jurisdictional claims in published maps and institutional affiliations.

