
Detection and Quantification of Irrigation Water Amounts at 500 m Using Sentinel-1 Surface Soil Moisture

 , , , , and
Abstract
:1. Introduction
2. Materials
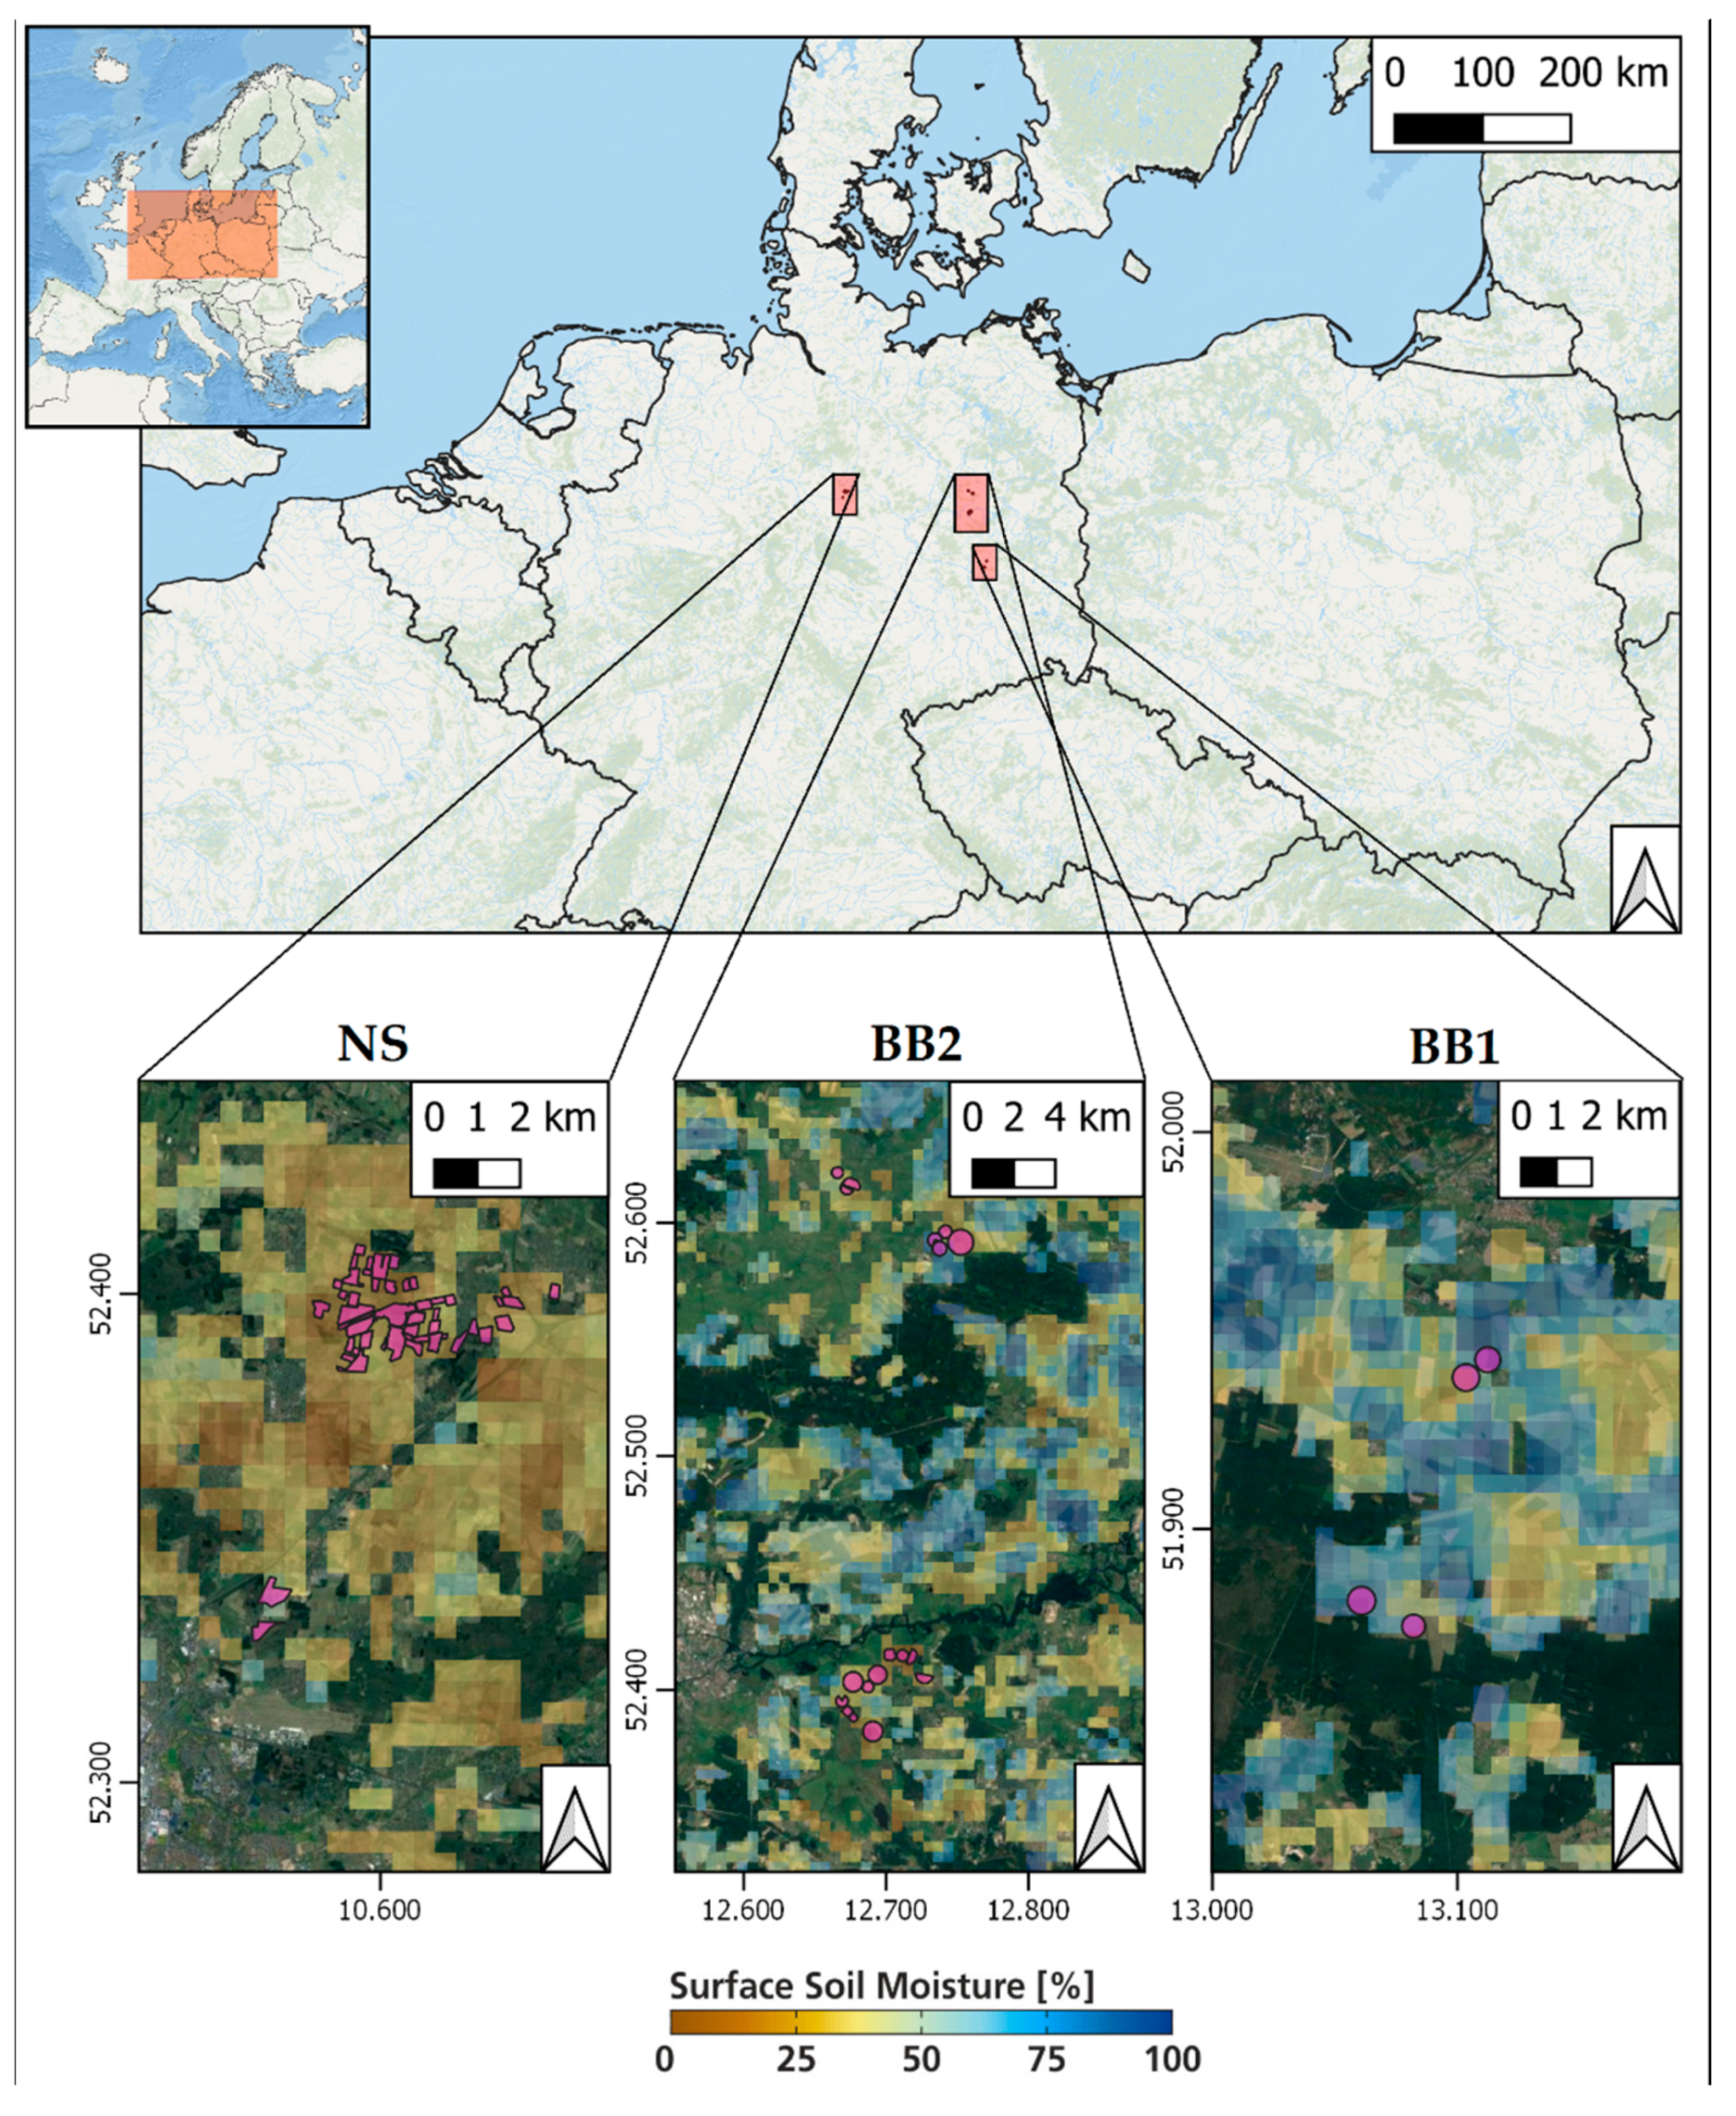
2.1. Study Sites
2.2. Sentinel-1 Surface Soil Moisture
2.3. Ancillary Datasets
3. Methods
3.1. Detection of Irrigation Events
3.1.1. Determining the Irrigation Period
3.1.2. Identifying Irrigation Events
3.2. Quantification of Irrigation Water Amounts
3.2.1. Accounting for Evapotranspiration
3.2.2. Accounting for Drainage
3.3. Evaluation
4. Results and Discussion
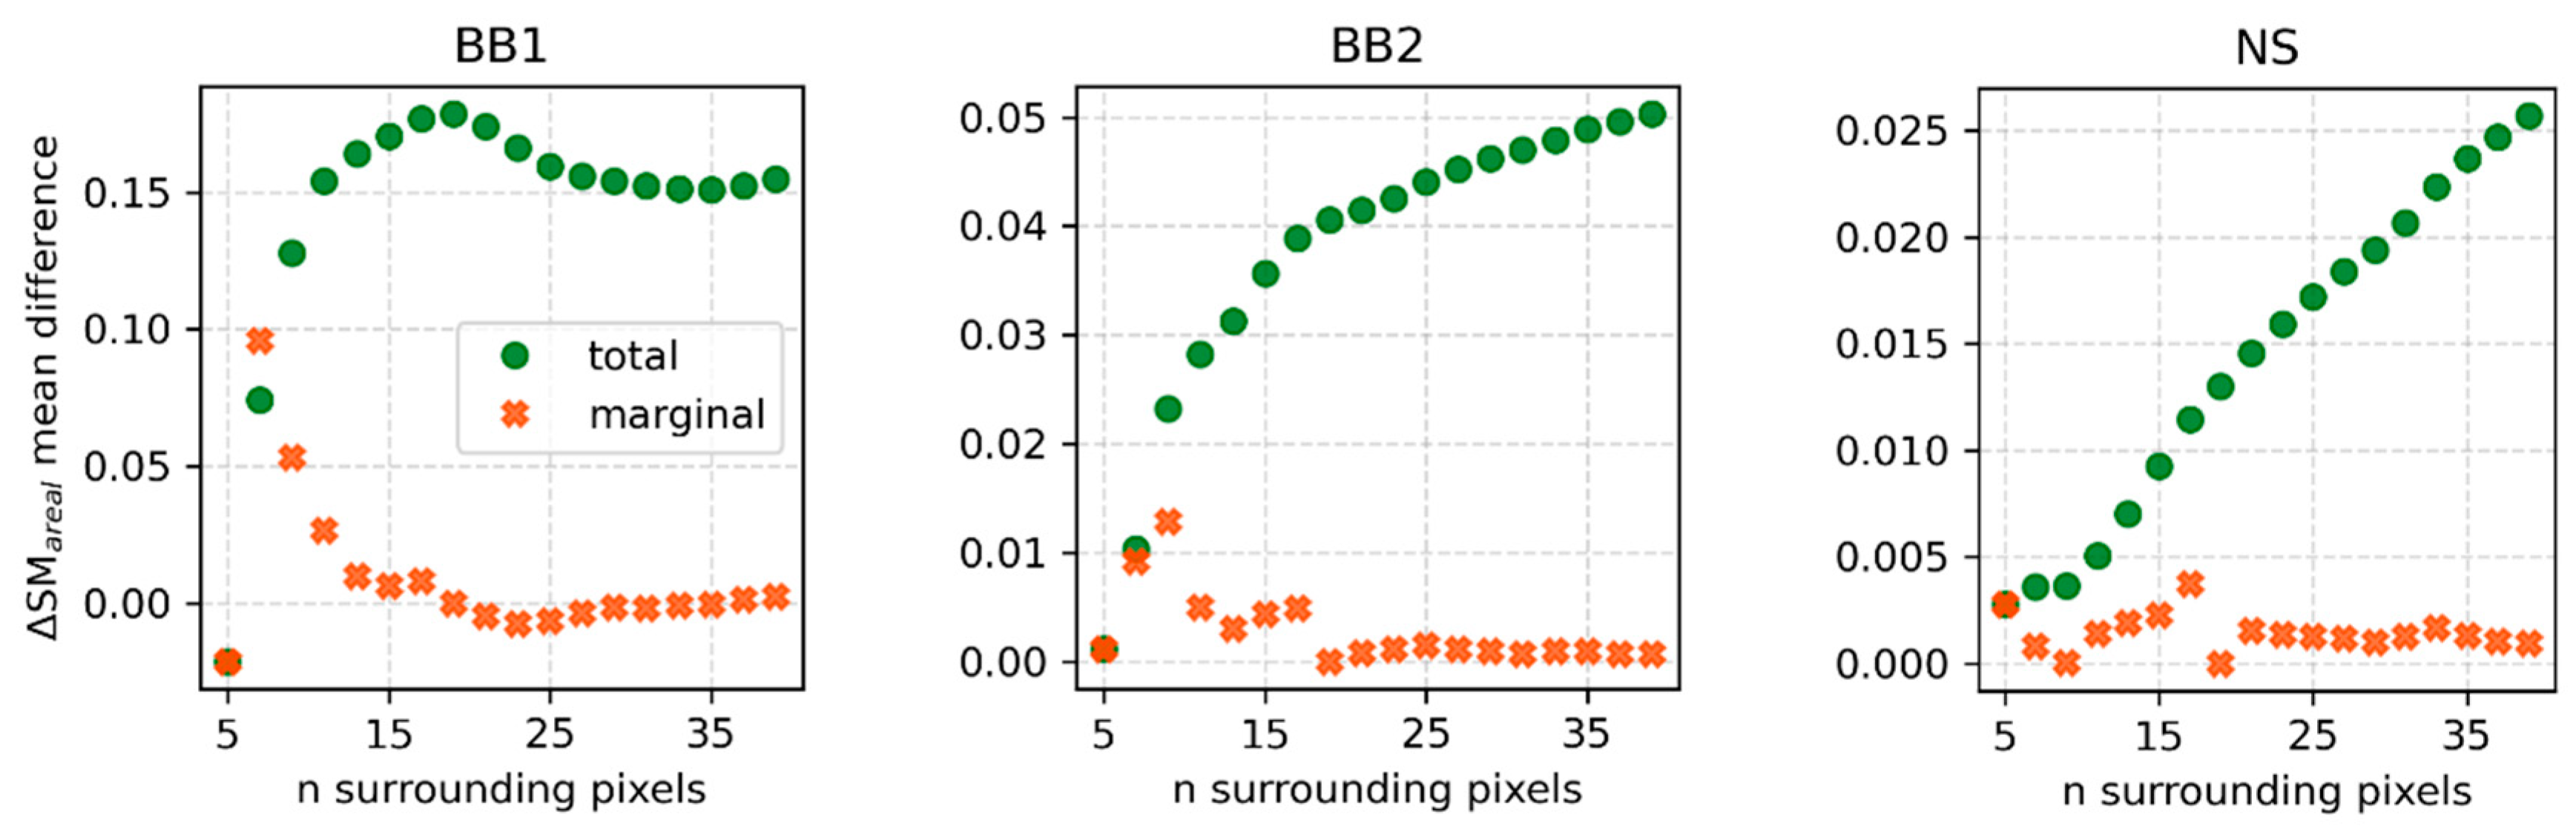
4.1. Selection of Optimal Grid Size
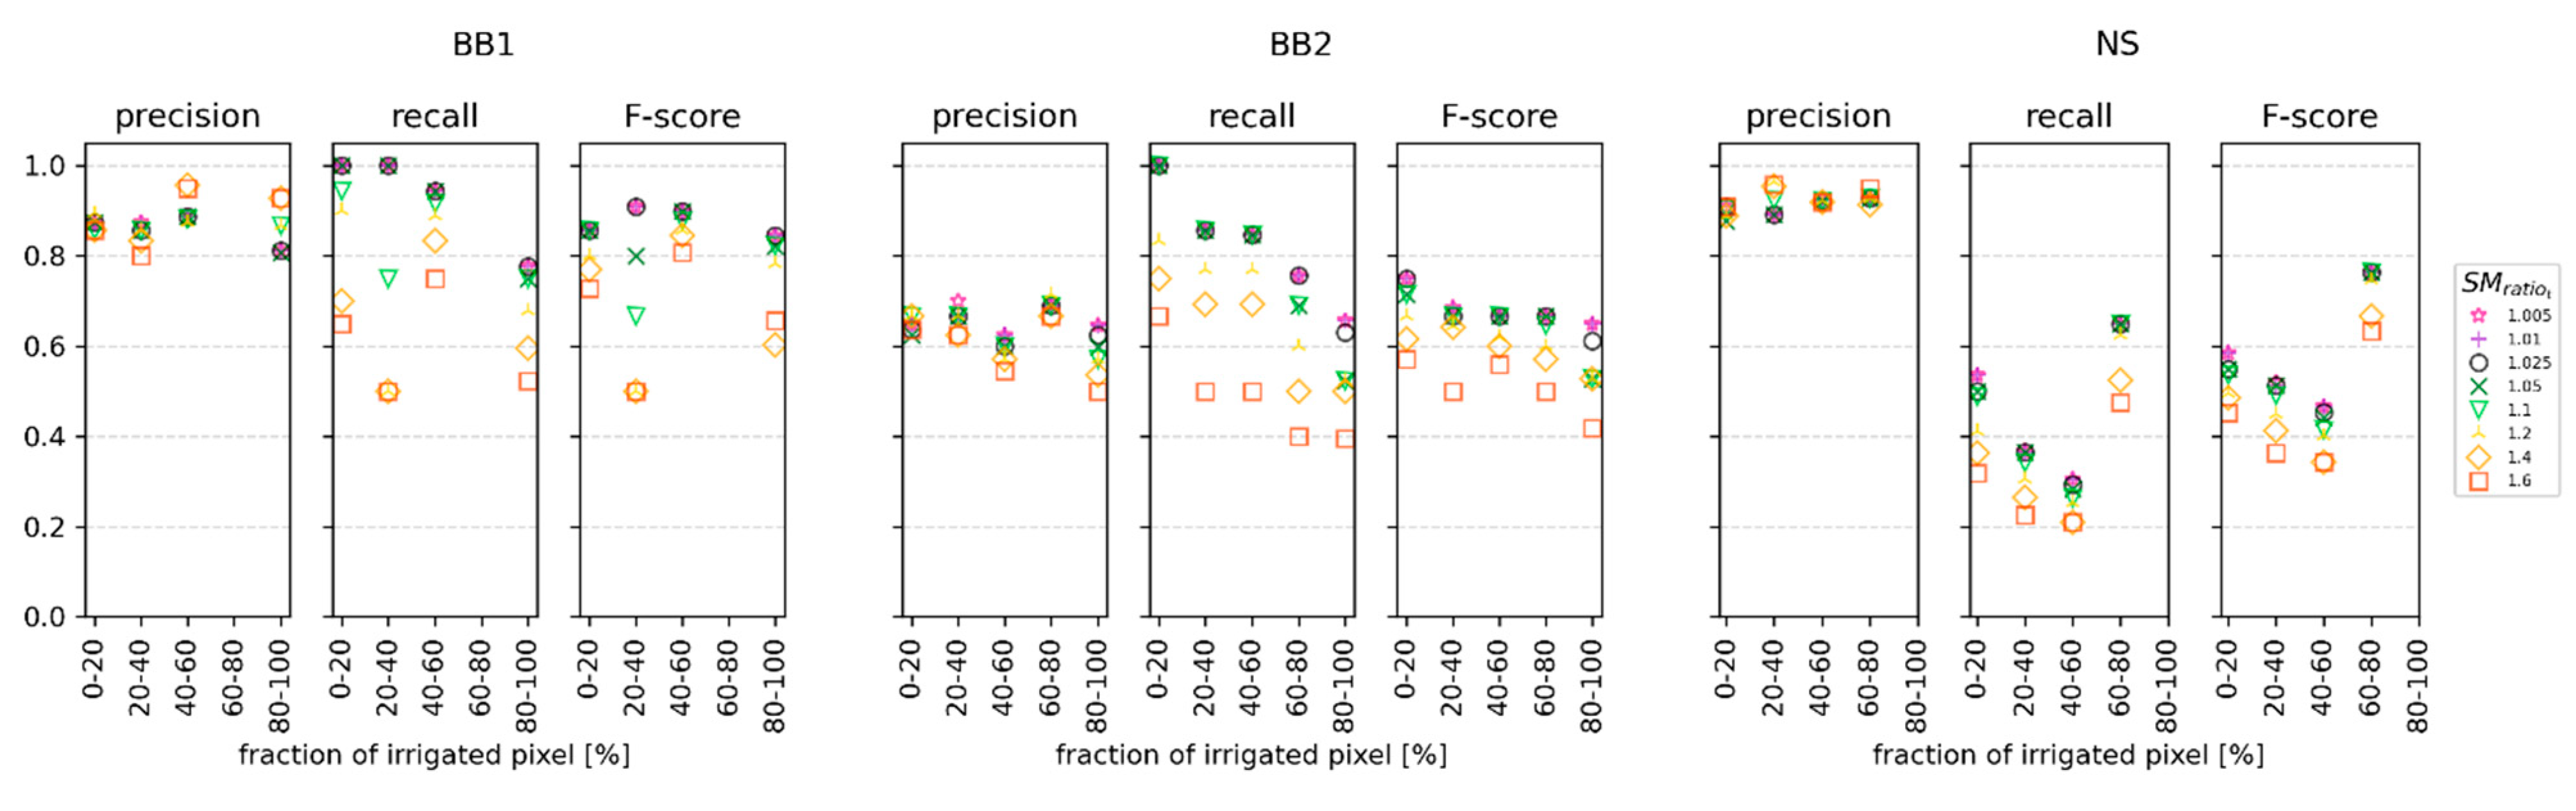
4.2. Detection of Irrigation Events
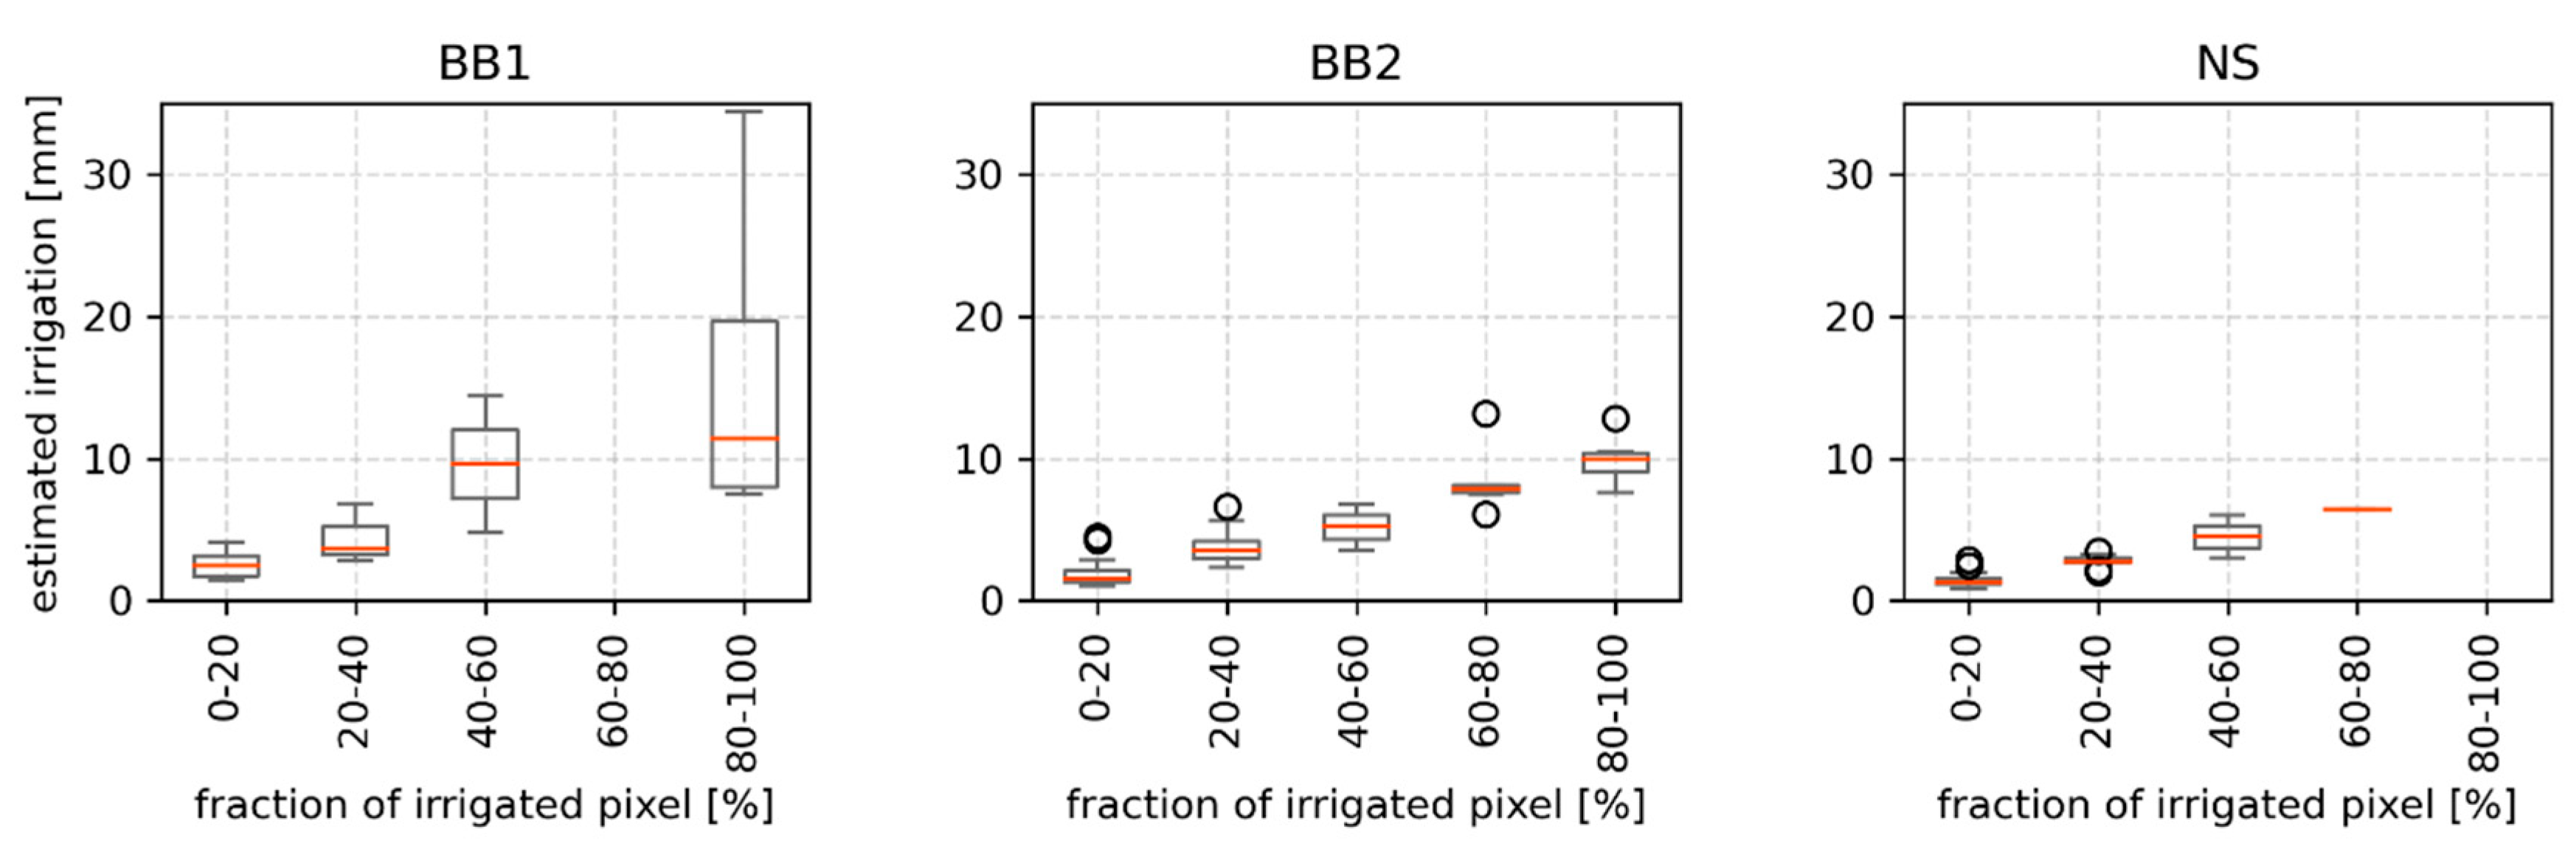
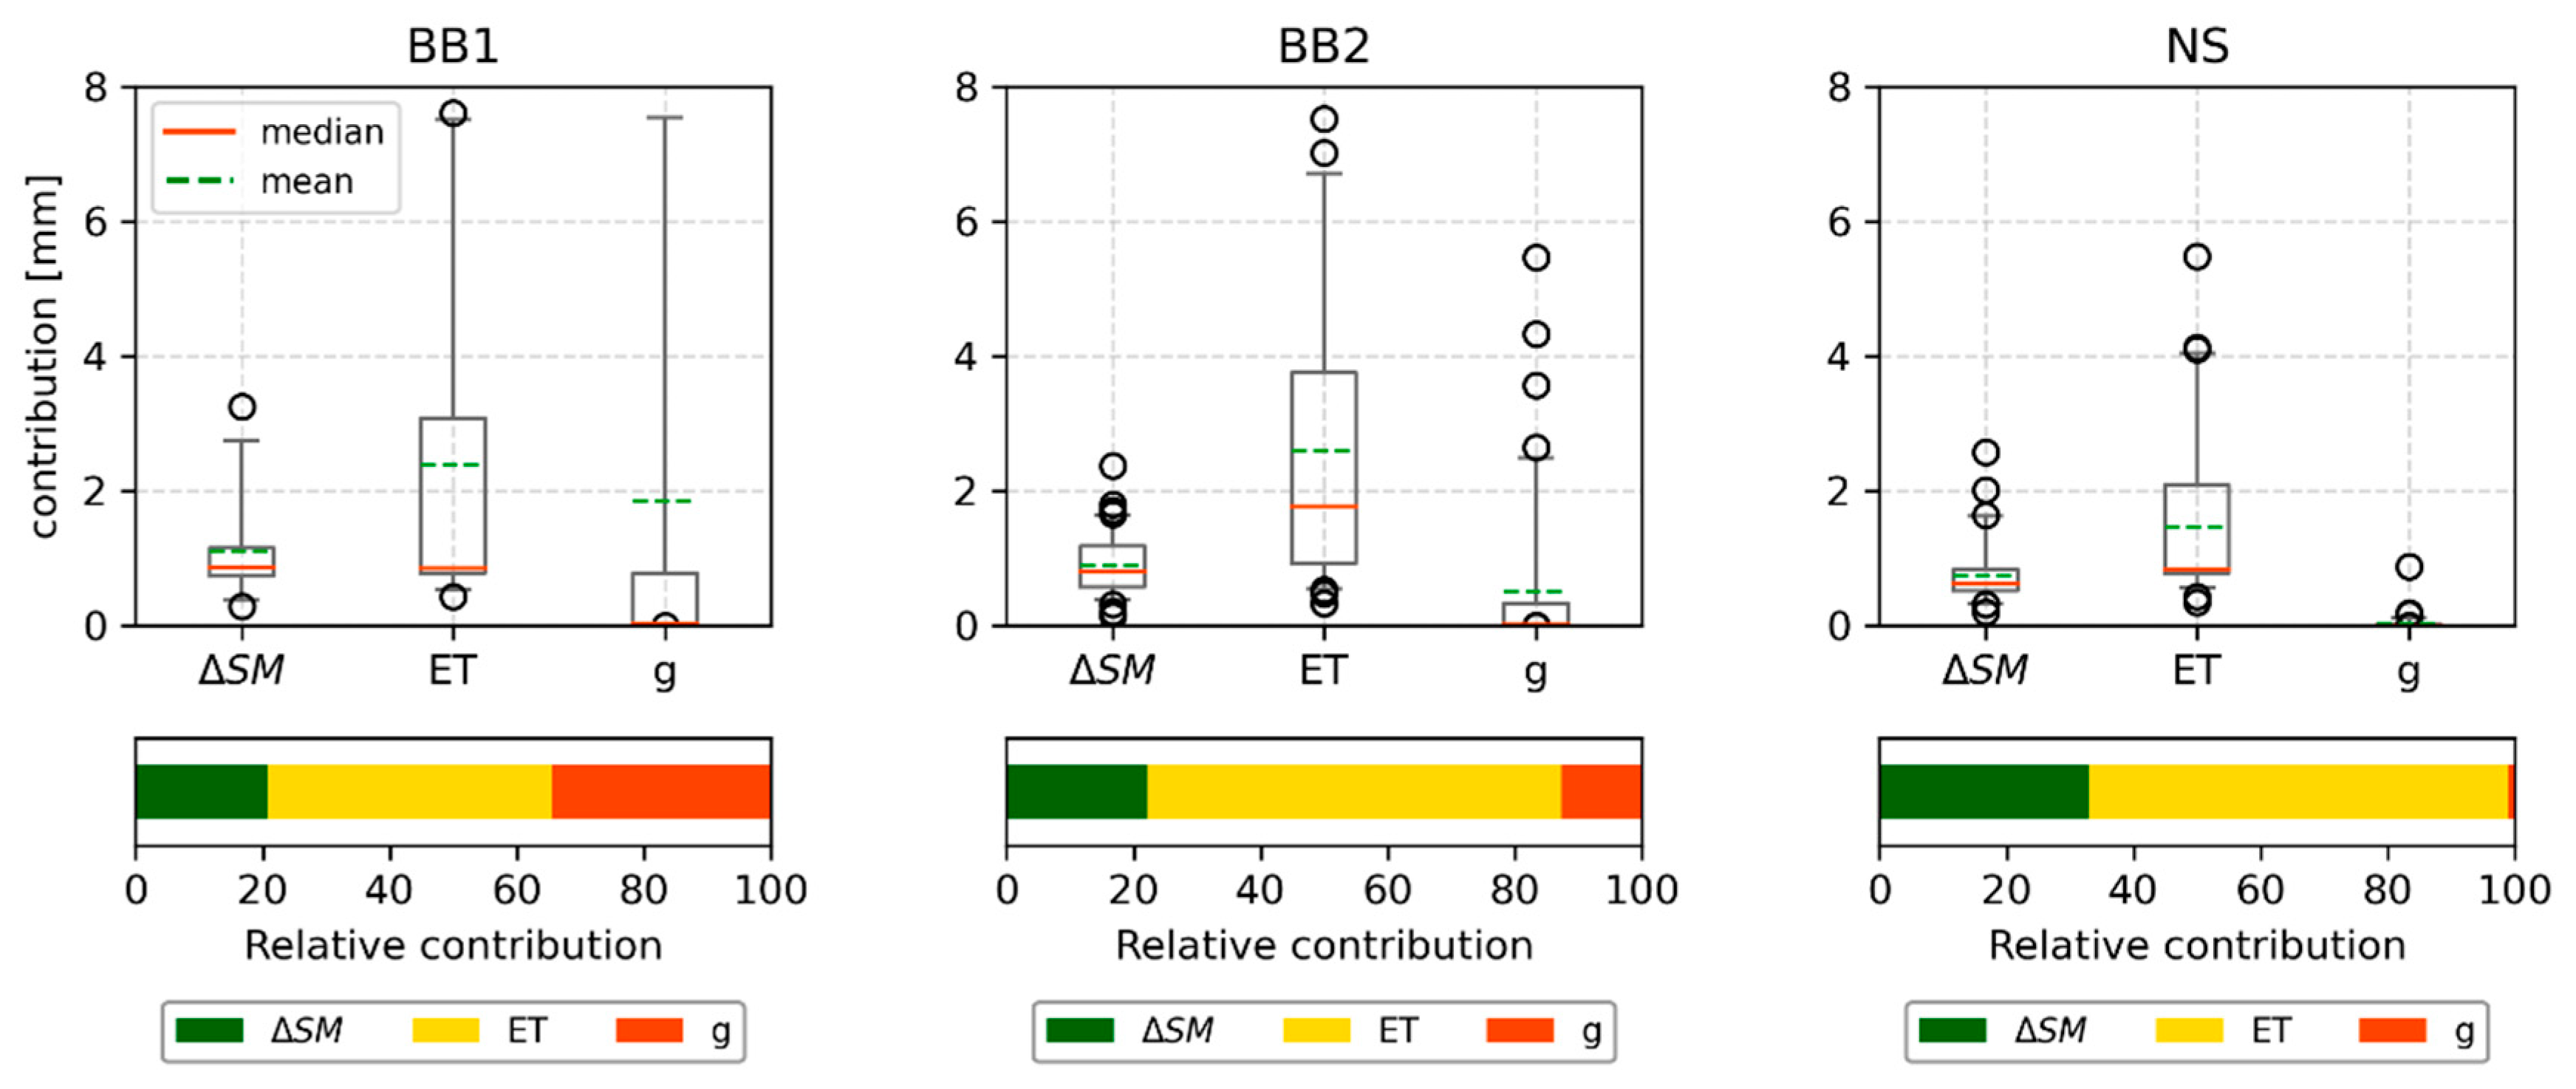
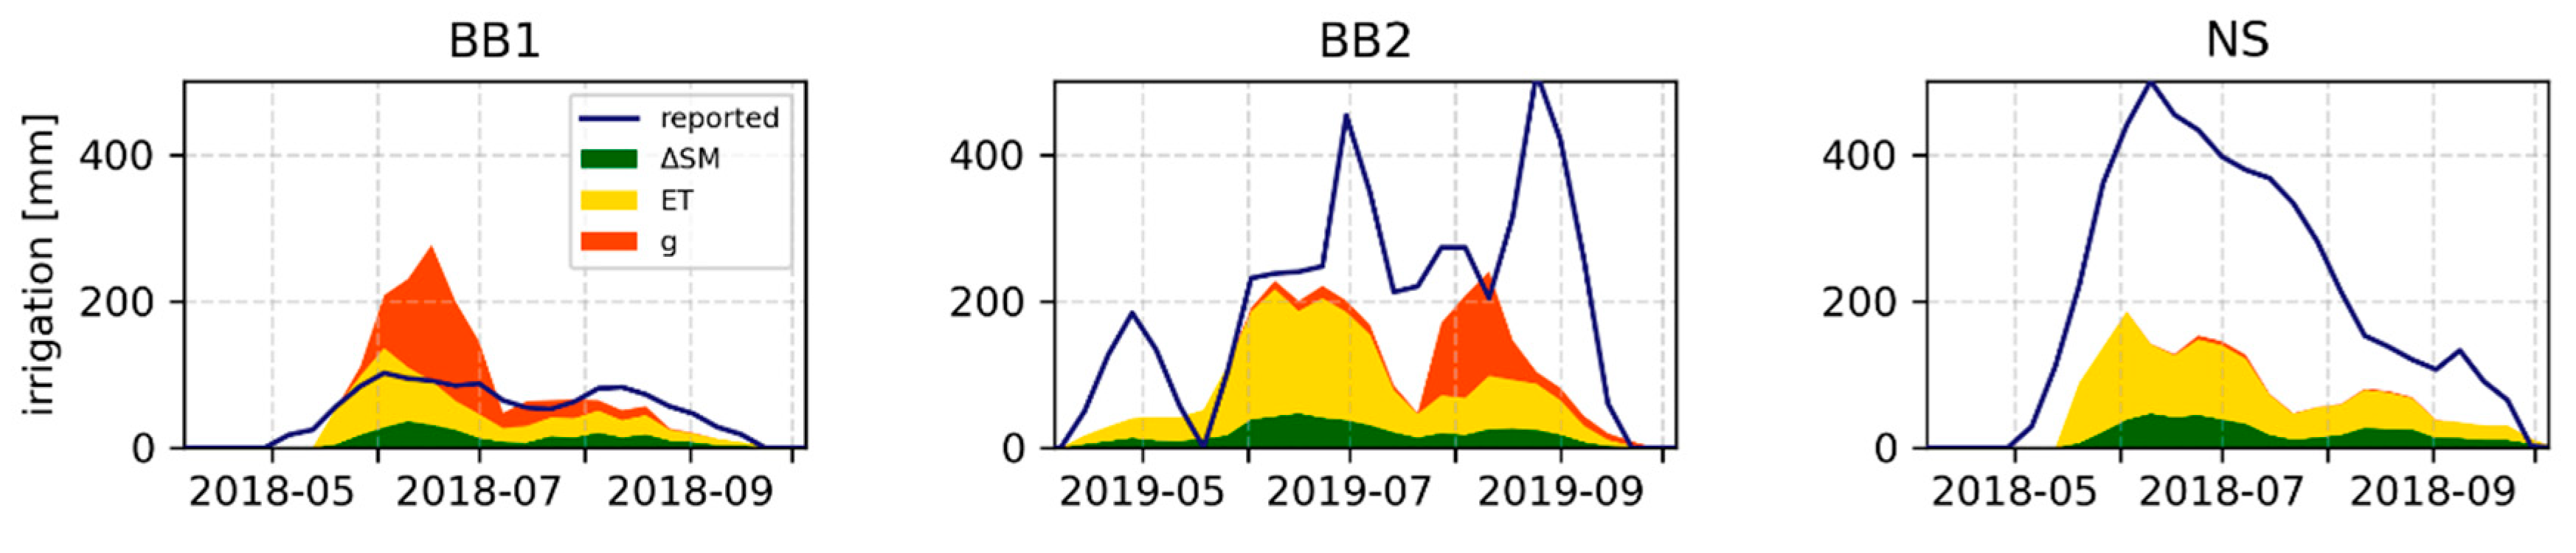
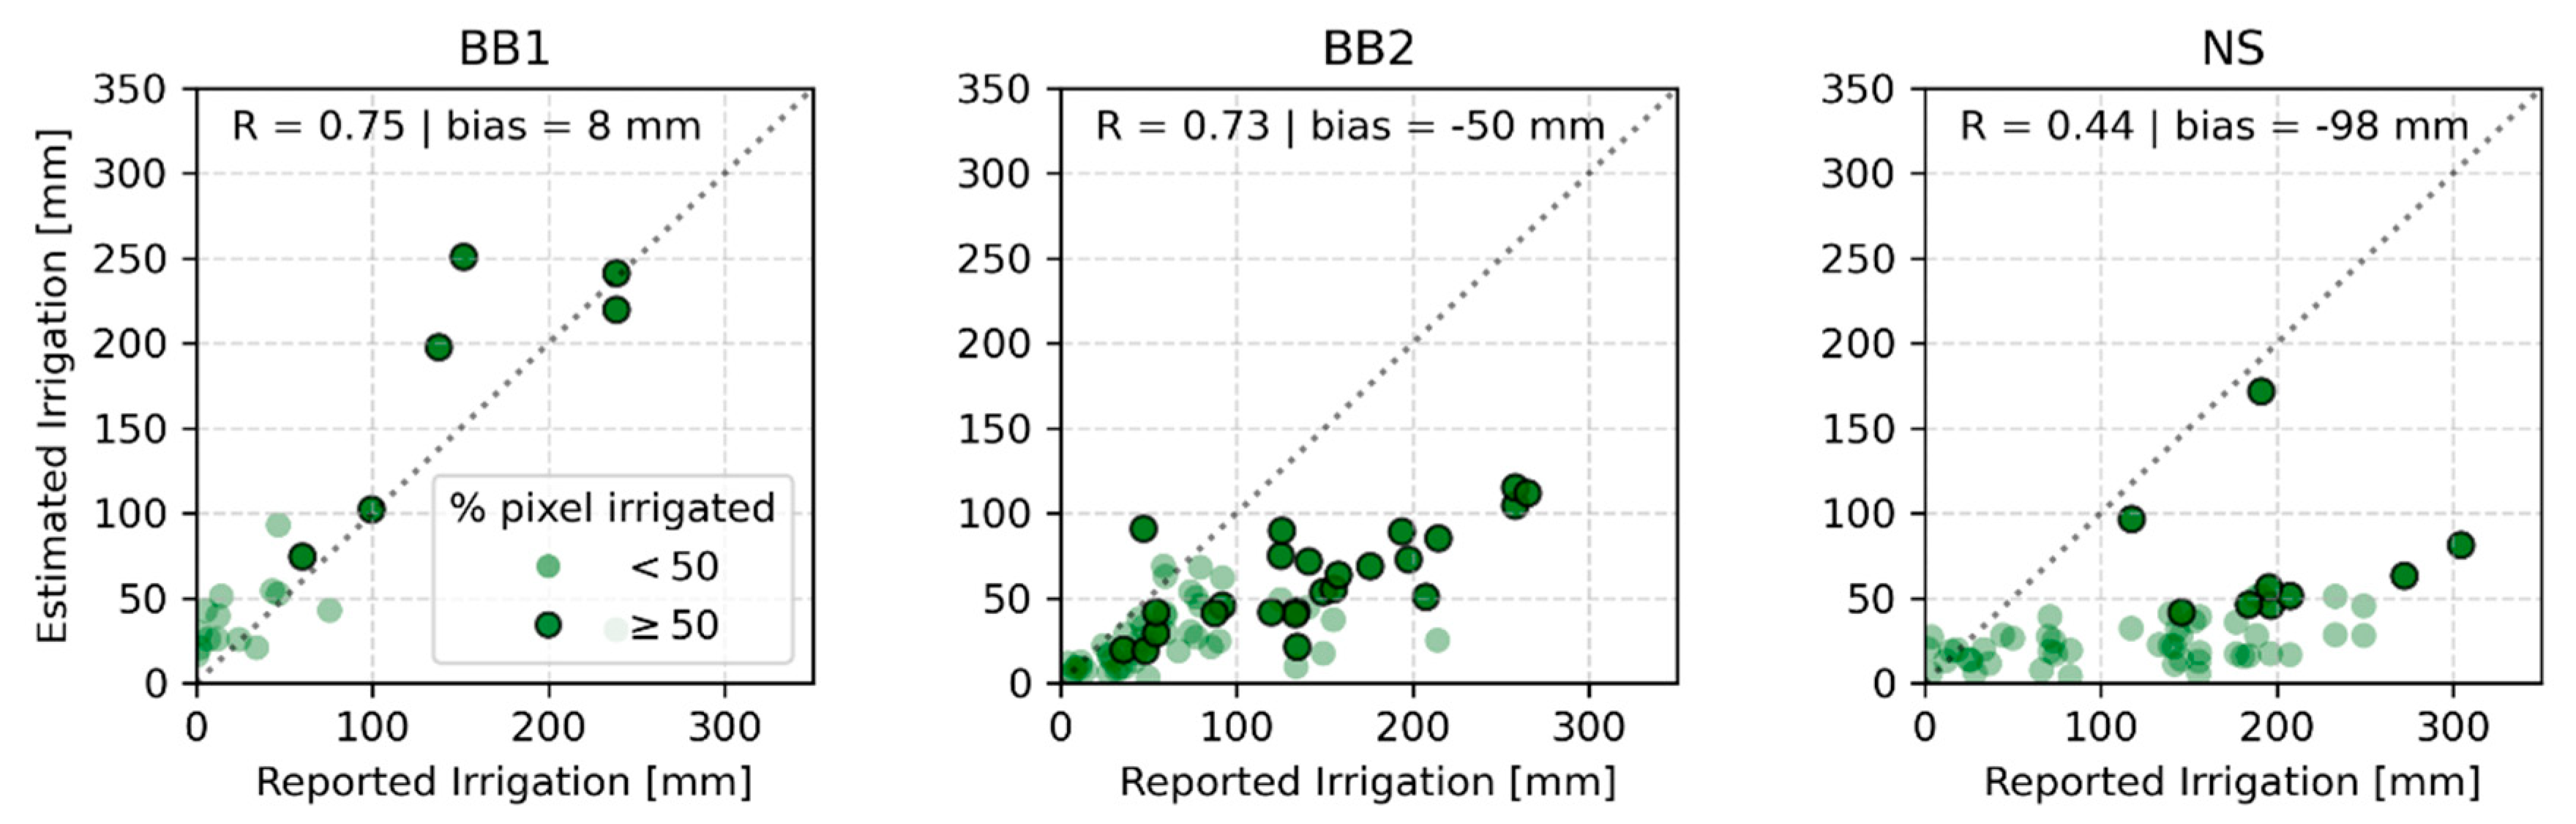
4.3. Quantification of Irrigation Water Amounts
4.4. Improvements and Transferability
5. Conclusions
- A correct definition of the irrigation period (typically only a subset of the whole year) is crucial as it leads to better discrimination of individual events.
- Simple formulations of evapotranspiration and drainage improved the irrigation estimates while ensuring the applicability to large regions and locations without meteorological stations. More sophisticated representations of these processes are expected to further improve the irrigation retrievals.
- The proposed approach can provide accurate irrigation estimates at a spatial resolution of 500 m regardless of field-specific characteristics (e.g., crop type).
Supplementary Materials
Author Contributions
Funding
Data Availability Statement
Acknowledgments
Conflicts of Interest
References
- Foley, J.; Prentice, C.; Ramankutty, N.; Levis, S.; Pollard, D.; Sitch, S.; Haxeltine, A. An Integrated Biosphere Model of Land Surface Processes, Terrestrial Carbon Balance, and Vegetation Dynamics. Glob. Biogeochem. Cycles 1996, 10, 603–628. [Google Scholar] [CrossRef]
- United Nations Educational. World Water Assessment & Water; Water in a Changing World; UNESCO: Paris, France, 2009. [Google Scholar]
- Siebert, S.; Döll, P. Quantifying Blue and Green Virtual Water Contents in Global Crop Production as Well as Potential Production Losses without Irrigation. J. Hydrol. 2010, 384, 198–217. [Google Scholar] [CrossRef]
- Foley, J.A.; Ramankutty, N.; Brauman, K.A.; Cassidy, E.S.; Gerber, J.S.; Johnston, M.; Mueller, N.D.; O’Connell, C.; Ray, D.K.; West, P.C.; et al. Solutions for a Cultivated Planet. Nature 2011, 478, 337–342. [Google Scholar] [CrossRef] [Green Version]
- Shiklomanov, I.A. Appraisal and Assessment of World Water Resources. Water Int. 2000, 25, 11–32. [Google Scholar] [CrossRef]
- Famiglietti, J.S. The Global Groundwater Crisis. Nat. Clim. Chang. 2014, 4, 945–948. [Google Scholar] [CrossRef]
- Wada, Y.; van Beek, L.P.H.; Bierkens, M.F.P. Nonsustainable Groundwater Sustaining Irrigation: A Global Assessment: Nonsustainable Groundwater Sustaining Irrigation. Water Resour. Res. 2012, 48. [Google Scholar] [CrossRef]
- Amezketa, E. An Integrated Methodology for Assessing Soil Salinization, a Pre-Condition for Land Desertification. J. Arid Environ. 2006, 67, 594–606. [Google Scholar] [CrossRef]
- Chaudhuri, S.; Roy, M. Irrigation Water Pricing in India as a Means to Conserve Water Resources: Challenges and Potential Future Opportunities. Environ. Conserv. 2019, 46, 99–102. [Google Scholar] [CrossRef] [Green Version]
- Deng, J.; Guo, L.; Salas, W.; Ingraham, P.; Charrier-Klobas, J.G.; Frolking, S.; Li, C. Changes in Irrigation Practices Likely Mitigate Nitrous Oxide Emissions from California Cropland. Glob. Biogeochem. Cycles 2018, 32, 1514–1527. [Google Scholar] [CrossRef]
- Cook, B.I.; Shukla, S.P.; Puma, M.J.; Nazarenko, L.S. Irrigation as an Historical Climate Forcing. Clim. Dyn. 2015, 44, 1715–1730. [Google Scholar] [CrossRef] [Green Version]
- Sacks, W.J.; Cook, B.I.; Buenning, N.; Levis, S.; Helkowski, J.H. Effects of Global Irrigation on the Near-Surface Climate. Clim. Dyn. 2009, 33, 159–175. [Google Scholar] [CrossRef] [Green Version]
- Gormley-Gallagher, A.M.; Sterl, S.; Hirsch, A.L.; Seneviratne, S.I.; Davin, E.L.; Thiery, W. Agricultural Management Effects on Mean and Extreme Temperature Trends. Earth Syst. Dynam. Discuss. 2020. [Google Scholar] [CrossRef]
- Kueppers, L.M.; Snyder, M.A.; Sloan, L.C. Irrigation Cooling Effect: Regional Climate Forcing by Land-Use Change. Geophys. Res. Lett. 2007, 34, L03703. [Google Scholar] [CrossRef] [Green Version]
- Eekhout, J.P.C.; Hunink, J.E.; Terink, W.; de Vente, J. Why Increased Extreme Precipitation under Climate Change Negatively Affects Water Security. Hydrol. Earth Syst. Sci. 2018, 22, 5935–5946. [Google Scholar] [CrossRef] [Green Version]
- Kummu, M.; Guillaume, J.H.A.; de Moel, H.; Eisner, S.; Flörke, M.; Porkka, M.; Siebert, S.; Veldkamp, T.I.E.; Ward, P.J. The World’s Road to Water Scarcity: Shortage and Stress in the 20th Century and Pathways towards Sustainability. Sci. Rep. 2016, 6, 38495. [Google Scholar] [CrossRef] [PubMed] [Green Version]
- Rockström, J.; Falkenmark, M.; Lannerstad, M.; Karlberg, L. The Planetary Water Drama: Dual Task of Feeding Humanity and Curbing Climate Change: Frontier. Geophys. Res. Lett. 2012, 39. [Google Scholar] [CrossRef]
- Vorosmarty, C.J. Global Water Resources: Vulnerability from Climate Change and Population Growth. Science 2000, 289, 284–288. [Google Scholar] [CrossRef] [PubMed] [Green Version]
- Ray, D.K.; Mueller, N.D.; West, P.C.; Foley, J.A. Yield Trends Are Insufficient to Double Global Crop Production by 2050. PLoS ONE 2013, 8, e66428. [Google Scholar] [CrossRef] [PubMed] [Green Version]
- Deines, J.M.; Kendall, A.D.; Hyndman, D.W. Annual Irrigation Dynamics in the U.S. Northern High Plains Derived from Landsat Satellite Data: Satellite-Derived Irrigation Dynamics. Geophys. Res. Lett. 2017, 44, 9350–9360. [Google Scholar] [CrossRef]
- Siebert, S.; Doll, P.; Hoogeveen, J. Development and Validation of the Global Map of Irrigation Areas. Hydrol. Earth Syst. Sci. 2005, 9, 535–547. [Google Scholar] [CrossRef]
- Novo, P.; Dumont, A.; Willaarts, B.A.; López-Gunn, E. More Cash and Jobs per Illegal Drop? The Legal and Illegal Water Footprint of the Western Mancha Aquifer (Spain). Environ. Sci. Policy 2015, 51, 256–266. [Google Scholar] [CrossRef]
- Foster, T.; Mieno, T.; Brozović, N. Satellite-Based Monitoring of Irrigation Water Use: Assessing Measurement Errors and Their Implications for Agricultural Water Management Policy. Water Resour. Res. 2020, 56. [Google Scholar] [CrossRef]
- Maselli, F.; Battista, P.; Chiesi, M.; Rapi, B.; Angeli, L.; Fibbi, L.; Magno, R.; Gozzini, B. Use of Sentinel-2 MSI Data to Monitor Crop Irrigation in Mediterranean Areas. Int. J. Appl. Earth Obs. Geoinf. 2020, 93, 102216. [Google Scholar] [CrossRef]
- Vanino, S.; Nino, P.; De Michele, C.; Falanga Bolognesi, S.; D’Urso, G.; Di Bene, C.; Pennelli, B.; Vuolo, F.; Farina, R.; Pulighe, G.; et al. Capability of Sentinel-2 Data for Estimating Maximum Evapotranspiration and Irrigation Requirements for Tomato Crop in Central Italy. Remote Sens. Environ. 2018, 215, 452–470. [Google Scholar] [CrossRef]
- Droogers, P.; Immerzeel, W.W.; Lorite, I.J. Estimating Actual Irrigation Application by Remotely Sensed Evapotranspiration Observations. Agric. Water Manag. 2010, 97, 1351–1359. [Google Scholar] [CrossRef]
- Senay, G.; Budde, M.; Verdin, J.; Melesse, A. A Coupled Remote Sensing and Simplified Surface Energy Balance Approach to Estimate Actual Evapotranspiration from Irrigated Fields. Sensors 2007, 7, 979–1000. [Google Scholar] [CrossRef] [Green Version]
- van Dijk, A.I.J.M.; Schellekens, J.; Yebra, M.; Beck, H.E.; Renzullo, L.J.; Weerts, A.; Donchyts, G. Global 5 Km Resolution Estimates of Secondary Evaporation Including Irrigation through Satellite Data Assimilation. Hydrol. Earth Syst. Sci. 2018, 22, 4959–4980. [Google Scholar] [CrossRef] [Green Version]
- Koch, J.; Zhang, W.; Martinsen, G.; He, X.; Stisen, S. Estimating Net Irrigation Across the North China Plain Through Dual Modeling of Evapotranspiration. Water Resour. Res. 2020, 56. [Google Scholar] [CrossRef]
- Khanal, S.; Fulton, J.; Shearer, S. An Overview of Current and Potential Applications of Thermal Remote Sensing in Precision Agriculture. Comput. Electron. Agric. 2017, 139. [Google Scholar] [CrossRef]
- Filippucci, P.; Tarpanelli, A.; Massari, C.; Serafini, A.; Strati, V.; Alberi, M.; Raptis, K.G.C.; Mantovani, F.; Brocca, L. Soil Moisture as a Potential Variable for Tracking and Quantifying Irrigation: A Case Study with Proximal Gamma-Ray Spectroscopy Data. Adv. Water Resour. 2020, 136, 103502. [Google Scholar] [CrossRef]
- Brocca, L.; Tarpanelli, A.; Filippucci, P.; Dorigo, W.; Zaussinger, F.; Gruber, A.; Fernández-Prieto, D. How Much Water Is Used for Irrigation? A New Approach Exploiting Coarse Resolution Satellite Soil Moisture Products. Int. J. Appl. Earth Obs. Geoinf. 2018, 73, 752–766. [Google Scholar] [CrossRef]
- Jalilvand, E.; Tajrishy, M.; Ghazi Zadeh Hashemi, S.A.; Brocca, L. Quantification of Irrigation Water Using Remote Sensing of Soil Moisture in a Semi-Arid Region. Remote Sens. Environ. 2019, 231, 111226. [Google Scholar] [CrossRef]
- Kumar, S.V.; Peters-Lidard, C.D.; Santanello, J.A.; Reichle, R.H.; Draper, C.S.; Koster, R.D.; Nearing, G.; Jasinski, M.F. Evaluating the Utility of Satellite Soil Moisture Retrievals over Irrigated Areas and the Ability of Land Data Assimilation Methods to Correct for Unmodeled Processes. Hydrol. Earth Syst. Sci. 2015, 19, 4463–4478. [Google Scholar] [CrossRef] [Green Version]
- Zaussinger, F.; Dorigo, W.; Gruber, A.; Tarpanelli, A.; Filippucci, P.; Brocca, L. Estimating Irrigation Water Use over the Contiguous United States by Combining Satellite and Reanalysis Soil Moisture Data. Hydrol. Earth Syst. Sci. 2019, 23, 897–923. [Google Scholar] [CrossRef] [Green Version]
- Zohaib, M.; Choi, M. Satellite-Based Global-Scale Irrigation Water Use and Its Contemporary Trends. Sci. Total Environ. 2020, 714, 136719. [Google Scholar] [CrossRef] [PubMed]
- Zappa, L.; Forkel, M.; Xaver, A.; Dorigo, W. Deriving Field Scale Soil Moisture from Satellite Observations and Ground Measurements in a Hilly Agricultural Region. Remote Sens. 2019, 11, 2596. [Google Scholar] [CrossRef] [Green Version]
- Geudtner, D.; Torres, R.; Snoeij, P.; Davidson, M.; Rommen, B. Sentinel-1 System Capabilities and Applications. In Proceedings of the 2014 IEEE Geoscience and Remote Sensing Symposium, Quebec City, QC, Canada, 13–18 July 2014; pp. 1457–1460. [Google Scholar]
- Panetti, A.; Rostan, F.; L’Abbate, M.; Bruno, C.; Bauleo, A.; Catalano, T.; Cotogni, M.; Galvagni, L.; Pietropaolo, A.; Taini, G.; et al. Copernicus Sentinel-1 Satellite and C-SAR Instrument. In Proceedings of the 2014 IEEE Geoscience and Remote Sensing Symposium, Quebec City, QC, Canada, 13–18 July 2014; pp. 1461–1464. [Google Scholar]
- Bauer-Marschallinger, B.; Freeman, V.; Cao, S.; Paulik, C.; Schaufler, S.; Stachl, T.; Modanesi, S.; Massari, C.; Ciabatta, L.; Brocca, L.; et al. Toward Global Soil Moisture Monitoring with Sentinel-1: Harnessing Assets and Overcoming Obstacles. IEEE Trans. Geosci. Remote Sens. 2019, 57, 520–539. [Google Scholar] [CrossRef]
- Bazzi, H.; Baghdadi, N.; El Hajj, M.; Zribi, M. Potential of Sentinel-1 Surface Soil Moisture Product for Detecting Heavy Rainfall in the South of France. Sensors 2019, 19, 802. [Google Scholar] [CrossRef] [Green Version]
- Brocca, L.; Ciabatta, L.; Massari, C.; Moramarco, T.; Hahn, S.; Hasenauer, S.; Kidd, R.; Dorigo, W.; Wagner, W.; Levizzani, V. Soil as a Natural Rain Gauge: Estimating Global Rainfall from Satellite Soil Moisture Data: Using the Soil as a Natural Raingauge. J. Geophys. Res. Atmos. 2014, 119, 5128–5141. [Google Scholar] [CrossRef]
- Frei, C.; Christensen, J.H.; Déqué, M.; Jacob, D.; Jones, R.G.; Vidale, P.L. Daily Precipitation Statistics in Regional Climate Models: Evaluation and Intercomparison for the European Alps: Daily Precipitation Statistics in Regional Climate Models. J. Geophys. Res. Atmos. 2003, 108. [Google Scholar] [CrossRef]
- Koch, J.; Cornelissen, T.; Fang, Z.; Bogena, H.; Diekkrüger, B.; Kollet, S.; Stisen, S. Inter-Comparison of Three Distributed Hydrological Models with Respect to Seasonal Variability of Soil Moisture Patterns at a Small Forested Catchment. J. Hydrol. 2016, 533, 234–249. [Google Scholar] [CrossRef]
- Shao, Y.; Henderson-Sellers, A. Modeling Soil Moisture: A Project for Intercomparison of Land Surface Parameterization Schemes Phase 2(b). J. Geophys. Res. Atmos. 1996, 101, 7227–7250. [Google Scholar] [CrossRef] [Green Version]
- Rubel, F.; Brugger, K.; Haslinger, K.; Auer, I. The Climate of the European Alps: Shift of Very High Resolution Köppen-Geiger Climate Zones 1800–2100. Meteorol. Z. 2017, 26, 115–125. [Google Scholar] [CrossRef]
- Hengl, T.; Mendes de Jesus, J.; Heuvelink, G.B.M.; Ruiperez Gonzalez, M.; Kilibarda, M.; Blagotić, A.; Shangguan, W.; Wright, M.N.; Geng, X.; Bauer-Marschallinger, B.; et al. SoilGrids250m: Global Gridded Soil Information Based on Machine Learning. PLoS ONE 2017, 12, e0169748. [Google Scholar] [CrossRef] [Green Version]
- Ballabio, C.; Panagos, P.; Monatanarella, L. Mapping Topsoil Physical Properties at European Scale Using the LUCAS Database. Geoderma 2016, 261, 110–123. [Google Scholar] [CrossRef]
- Bauer-Marschallinger, B.; Sabel, D.; Wagner, W. Optimisation of Global Grids for High-Resolution Remote Sensing Data. Comput. Geosci. 2014, 72, 84–93. [Google Scholar] [CrossRef]
- CORINE Land Cover—CLC 2018. Available online: https://land.copernicus.eu/pan-european/corine-land-cover/clc2018 (accessed on 24 February 2021).
- Al-Yaari, A.; Wigneron, J.-P.; Dorigo, W.; Colliander, A.; Pellarin, T.; Hahn, S.; Mialon, A.; Richaume, P.; Fernandez-Moran, R.; Fan, L.; et al. Assessment and Inter-Comparison of Recently Developed/Reprocessed Microwave Satellite Soil Moisture Products Using ISMN Ground-Based Measurements. Remote Sens. Environ. 2019, 224, 289–303. [Google Scholar] [CrossRef]
- Saxton, K.E.; Rawls, W.J. Soil Water Characteristic Estimates by Texture and Organic Matter for Hydrologic Solutions. Soil Sci. Soc. Am. J. 2006, 70, 1569–1578. [Google Scholar] [CrossRef] [Green Version]
- Riediger, J.; Breckling, B.; Svoboda, N.; Schröder, W. Modelling Regional Variability of Irrigation Requirements Due to Climate Change in Northern Germany. Sci. Total Environ. 2016, 541, 329–340. [Google Scholar] [CrossRef] [PubMed]
- Atzberger, C.; Klisch, A.; Mattiuzzi, M.; Vuolo, F. Phenological Metrics Derived over the European Continent from NDVI3g Data and MODIS Time Series. Remote Sens. 2013, 6, 257–284. [Google Scholar] [CrossRef] [Green Version]
- Beck, H.E.; Vergopolan, N.; Pan, M.; Levizzani, V.; van Dijk, A.I.J.M.; Weedon, G.P.; Brocca, L.; Pappenberger, F.; Huffman, G.J.; Wood, E.F. Global-Scale Evaluation of 22 Precipitation Datasets Using Gauge Observations and Hydrological Modeling. Hydrol. Earth Syst. Sci. 2017, 21, 6201–6217. [Google Scholar] [CrossRef] [Green Version]
- El Hajj, M.; Baghdadi, N.; Zribi, M.; Bazzi, H. Synergic Use of Sentinel-1 and Sentinel-2 Images for Operational Soil Moisture Mapping at High Spatial Resolution over Agricultural Areas. Remote Sens. 2017, 9, 1292. [Google Scholar] [CrossRef] [Green Version]
- Thornthwaite, C.W. An Approach toward a Rational Classification of Climate. Geogr. Rev. 1948, 38, 55–94. [Google Scholar] [CrossRef]
- Monteith, J.L. Evaporation and Environment. Symp. Soc. Exp. Biol. 1965, 19, 205–234. [Google Scholar] [PubMed]
- Camargo, A.P.; Marin, F.R.; Sentelhas, P.C.; Picini, A.G. Adjust of the Thornthwaite’s Method to Estimate the Potential Evapotranspiration for Arid and Superhumid Climates, Based on Daily Temperature Amplitude. Rev. Bras. Agrometeorol. 1999, 7, 251–257. [Google Scholar]
- Pereira, A.R.; Pruitt, W.O. Adaptation of the Thornthwaite Scheme for Estimating Daily Reference Evapotranspiration. Agric. Water Manag. 2004, 66, 251–257. [Google Scholar] [CrossRef]
- Famiglietti, J.S.; Wood, E.F. Multiscale Modeling of Spatially Variable Water and Energy Balance Processes. Water Resour. Res. 1994, 30, 3061–3078. [Google Scholar] [CrossRef] [Green Version]
- Brocca, L.; Ciabatta, L.; Moramarco, T.; Ponziani, F.; Berni, N.; Wagner, W. Use of Satellite Soil Moisture Products for the Operational Mitigation of Landslides Risk in Central Italy. In Satellite Soil Moisture Retrieval; Elsevier: Amsterdam, The Netherlands, 2016; pp. 231–247. ISBN 978-0-12-803388-3. [Google Scholar]
- Rawls, W.J.; Brakensiek, D.L.; Saxton, K.E. Estimation of Soil Water Properties. Trans. ASAE 1982, 25, 1316–1320. [Google Scholar] [CrossRef]
- Picciafuoco, T.; Morbidelli, R.; Flammini, A.; Saltalippi, C.; Corradini, C.; Strauss, P.; Blöschl, G. On the Estimation of Spatially Representative Plot Scale Saturated Hydraulic Conductivity in an Agricultural Setting. J. Hydrol. 2019, 570, 106–117. [Google Scholar] [CrossRef]
- Bazzi, H.; Baghdadi, N.; Fayad, I.; Zribi, M.; Belhouchette, H.; Demarez, V. Near Real-Time Irrigation Detection at Plot Scale Using Sentinel-1 Data. Remote Sens. 2020, 12, 1456. [Google Scholar] [CrossRef]
- Bazzi, H.; Baghdadi, N.; Fayad, I.; Charron, F.; Zribi, M.; Belhouchette, H. Irrigation Events Detection over Intensively Irrigated Grassland Plots Using Sentinel-1 Data. Remote Sens. 2020, 12, 4058. [Google Scholar] [CrossRef]
- El Hajj, M.; Baghdadi, N.; Bazzi, H.; Zribi, M. Penetration Analysis of SAR Signals in the C and L Bands for Wheat, Maize, and Grasslands. Remote Sens. 2018, 11, 31. [Google Scholar] [CrossRef] [Green Version]
- Biemans, H.; Siderius, C.; Mishra, A.; Ahmad, B. Crop-Specific Seasonal Estimates of Irrigation-Water Demand in South Asia. Hydrol. Earth Syst. Sci. 2016, 20, 1971–1982. [Google Scholar] [CrossRef] [Green Version]
- Lopez, O.; Johansen, K.; Aragon, B.; Li, T.; Houborg, R.; Malbeteau, Y.; AlMashharawi, S.; Altaf, M.U.; Fallatah, E.M.; Dasari, H.P.; et al. Mapping Groundwater Abstractions from Irrigated Agriculture: Big Data, Inverse Modeling and a Satellite-Model Fusion Approach. Hydrol. Earth Syst. Sci. 2020, 24, 5251–5277. [Google Scholar] [CrossRef]
- Le Page, M.; Jarlan, L.; El Hajj, M.M.; Zribi, M.; Baghdadi, N.; Boone, A. Potential for the Detection of Irrigation Events on Maize Plots Using Sentinel-1 Soil Moisture Products. Remote Sens. 2020, 12, 1621. [Google Scholar] [CrossRef]
- Dari, J.; Brocca, L.; Quintana-Seguí, P.; Escorihuela, M.J.; Stefan, V.; Morbidelli, R. Exploiting High-Resolution Remote Sensing Soil Moisture to Estimate Irrigation Water Amounts over a Mediterranean Region. Remote Sens. 2020, 12, 2593. [Google Scholar] [CrossRef]
- Calder, T.C. Efficiency of Sprinkler Irrigation Systems. J. Dep. Agric. West. Aust. 1976, 17, 4. [Google Scholar]
- Mu, Q.; Zhao, M.; Running, S.W. Improvements to a MODIS Global Terrestrial Evapotranspiration Algorithm. Remote Sens. Environ. 2011, 115, 1781–1800. [Google Scholar] [CrossRef]
- NASA MODIS Land Evapotranspiration. Available online: https://modis-land.gsfc.nasa.gov/ET.html (accessed on 15 April 2021).
- Muñoz-Sabater, J.; Dutra, E.; Agustí-Panareda, A.; Albergel, C.; Arduini, G.; Balsamo, G.; Boussetta, S.; Choulga, M.; Harrigan, S.; Hersbach, H.; et al. ERA5-Land: A State-of-the-Art Global Reanalysis Dataset for Land Applications. Earth Syst. Sci. Data Discuss. 2021. [Google Scholar] [CrossRef]
- Immitzer, M.; Vuolo, F.; Atzberger, C. First Experience with Sentinel-2 Data for Crop and Tree Species Classifications in Central Europe. Remote Sens. 2016, 8, 166. [Google Scholar] [CrossRef]
- Ji, S.; Zhang, C.; Xu, A.; Shi, Y.; Duan, Y. 3D Convolutional Neural Networks for Crop Classification with Multi-Temporal Remote Sensing Images. Remote Sens. 2018, 10, 75. [Google Scholar] [CrossRef] [Green Version]
- Kussul, N.; Lavreniuk, M.; Skakun, S.; Shelestov, A. Deep Learning Classification of Land Cover and Crop Types Using Remote Sensing Data. IEEE Geosci. Remote Sens. Lett. 2017, 14, 778–782. [Google Scholar] [CrossRef]
- Mathur, A.; Foody, G.M. Crop Classification by Support Vector Machine with Intelligently Selected Training Data for an Operational Application. Int. J. Remote Sens. 2008, 29, 2227–2240. [Google Scholar] [CrossRef] [Green Version]
- Van Tricht, K.; Gobin, A.; Gilliams, S.; Piccard, I. Synergistic Use of Radar Sentinel-1 and Optical Sentinel-2 Imagery for Crop Mapping: A Case Study for Belgium. Remote Sens. 2018, 10, 1642. [Google Scholar] [CrossRef] [Green Version]
- Meroni, M.; d’Andrimont, R.; Vrieling, A.; Fasbender, D.; Lemoine, G.; Rembold, F.; Seguini, L.; Verhegghen, A. Comparing Land Surface Phenology of Major European Crops as Derived from SAR and Multispectral Data of Sentinel-1 and -2. Remote Sens. Environ. 2021, 253, 112232. [Google Scholar] [CrossRef] [PubMed]
- d’Andrimont, R.; Taymans, M.; Lemoine, G.; Ceglar, A.; Yordanov, M.; van der Velde, M. Detecting Flowering Phenology in Oil Seed Rape Parcels with Sentinel-1 and -2 Time Series. Remote Sens. Environ. 2020, 239, 111660. [Google Scholar] [CrossRef] [PubMed]
- Song, Y.; Wang, J. Mapping Winter Wheat Planting Area and Monitoring Its Phenology Using Sentinel-1 Backscatter Time Series. Remote Sens. 2019, 11, 449. [Google Scholar] [CrossRef] [Green Version]
- Veloso, A.; Mermoz, S.; Bouvet, A.; Le Toan, T.; Planells, M.; Dejoux, J.-F.; Ceschia, E. Understanding the Temporal Behavior of Crops Using Sentinel-1 and Sentinel-2-like Data for Agricultural Applications. Remote Sens. Environ. 2017, 199, 415–426. [Google Scholar] [CrossRef]
- Vreugdenhil, M.; Wagner, W.; Bauer-Marschallinger, B.; Pfeil, I.; Teubner, I.; Rüdiger, C.; Strauss, P. Sensitivity of Sentinel-1 Backscatter to Vegetation Dynamics: An Austrian Case Study. Remote Sens. 2018, 10, 1396. [Google Scholar] [CrossRef] [Green Version]
- Bazzi, H.; Baghdadi, N.; Ienco, D.; El Hajj, M.; Zribi, M.; Belhouchette, H.; Escorihuela, M.J.; Demarez, V. Mapping Irrigated Areas Using Sentinel-1 Time Series in Catalonia, Spain. Remote Sens. 2019, 11, 1836. [Google Scholar] [CrossRef] [Green Version]
- Dari, J.; Quintana-Seguí, P.; Escorihuela, M.J.; Stefan, S.; Brocca, L.; Morbidelli, R. Detecting and Mapping Irrigated Areas in a Mediterranean Environment by Using Remote Sensing Soil Moisture and a Land Surface Model. J. Hydrol. 2021, 596, 126129. [Google Scholar] [CrossRef]
- Symbios CEOS EO HANDBOOK—MISSION SUMMARY—Sentinel-1 C. Available online: http://database.eohandbook.com/database/missionsummary.aspx?missionID=577 (accessed on 15 February 2021).
- Abowarda, A.S.; Bai, L.; Zhang, C.; Long, D.; Li, X.; Huang, Q.; Sun, Z. Generating Surface Soil Moisture at 30 m Spatial Resolution Using Both Data Fusion and Machine Learning toward Better Water Resources Management at the Field Scale. Remote Sens. Environ. 2021, 255, 112301. [Google Scholar] [CrossRef]

| Site | IP | Metric | SMratio_t | |||||||
|---|---|---|---|---|---|---|---|---|---|---|
| 1.005 | 1.01 | 1.025 | 1.05 | 1.1 | 1.2 | 1.4 | 1.6 | |||
| BB1 | default | p | 0, 81 | 0, 81 | 0, 81 | 0, 81 | 0, 80 | 0, 89 | 0, 91 | 0, 90 |
| r | 1, 00 | 1, 00 | 1, 00 | 1, 00 | 0, 93 | 0, 85 | 0, 69 | 0, 64 | ||
| F | 0, 90 | 0, 90 | 0, 90 | 0, 89 | 0, 86 | 0, 87 | 0, 79 | 0, 75 | ||
| NDVI | p | 0, 37 | 0, 39 | 0, 39 | 0, 41 | 0, 41 | 0, 41 | 0, 44 | 0, 62 | |
| r | 0, 91 | 0, 91 | 0, 86 | 0, 86 | 0, 74 | 0, 66 | 0, 61 | 0, 55 | ||
| F | 0, 53 | 0, 55 | 0, 54 | 0, 56 | 0, 53 | 0, 50 | 0, 51 | 0, 58 | ||
| actual | p | 0, 87 | 0, 87 | 0, 86 | 0, 86 | 0, 86 | 0, 88 | 0, 87 | 0, 87 | |
| r | 0, 98 | 0, 98 | 0, 97 | 0, 96 | 0, 89 | 0, 82 | 0, 67 | 0, 62 | ||
| F | 0, 92 | 0, 92 | 0, 91 | 0, 91 | 0, 87 | 0, 85 | 0, 76 | 0, 72 | ||
| BB2 | default | p | 0, 37 | 0, 37 | 0, 37 | 0, 37 | 0, 37 | 0, 35 | 0, 35 | 0, 39 |
| r | 0, 91 | 0, 91 | 0, 90 | 0, 89 | 0, 89 | 0, 86 | 0, 74 | 0, 61 | ||
| F | 0, 52 | 0, 53 | 0, 53 | 0, 52 | 0, 52 | 0, 49 | 0, 48 | 0, 48 | ||
| NDVI | p | 0, 21 | 0, 21 | 0, 21 | 0, 21 | 0, 22 | 0, 23 | 0, 22 | 0, 24 | |
| r | 0, 88 | 0, 88 | 0, 88 | 0, 87 | 0, 87 | 0, 76 | 0, 68 | 0, 54 | ||
| F | 0, 34 | 0, 34 | 0, 34 | 0, 34 | 0, 35 | 0, 35 | 0, 34 | 0, 33 | ||
| actual | p | 0, 67 | 0, 66 | 0, 64 | 0, 64 | 0, 65 | 0, 65 | 0, 63 | 0, 61 | |
| r | 0, 88 | 0, 88 | 0, 88 | 0, 87 | 0, 87 | 0, 76 | 0, 68 | 0, 54 | ||
| F | 0, 76 | 0, 75 | 0, 74 | 0, 74 | 0, 74 | 0, 70 | 0, 65 | 0, 58 | ||
| NS | default | p | 0, 66 | 0, 66 | 0, 66 | 0, 67 | 0, 68 | 0, 69 | 0, 69 | 0, 75 |
| r | 0, 54 | 0, 53 | 0, 52 | 0, 51 | 0, 49 | 0, 42 | 0, 37 | 0, 33 | ||
| F | 0, 59 | 0, 59 | 0, 58 | 0, 58 | 0, 57 | 0, 52 | 0, 48 | 0, 46 | ||
| NDVI | p | 0, 59 | 0, 59 | 0, 59 | 0, 61 | 0, 61 | 0, 62 | 0, 67 | 0, 67 | |
| r | 0, 55 | 0, 55 | 0, 53 | 0, 52 | 0, 50 | 0, 47 | 0, 38 | 0, 34 | ||
| F | 0, 57 | 0, 57 | 0, 56 | 0, 56 | 0, 55 | 0, 53 | 0, 49 | 0, 45 | ||
| actual | p | 0, 91 | 0, 91 | 0, 91 | 0, 89 | 0, 91 | 0, 91 | 0, 91 | 0, 92 | |
| r | 0, 48 | 0, 48 | 0, 45 | 0, 45 | 0, 44 | 0, 38 | 0, 33 | 0, 29 | ||
| F | 0, 63 | 0, 63 | 0, 60 | 0, 60 | 0, 59 | 0, 53 | 0, 48 | 0, 44 | ||
Publisher’s Note: MDPI stays neutral with regard to jurisdictional claims in published maps and institutional affiliations. |
© 2021 by the authors. Licensee MDPI, Basel, Switzerland. This article is an open access article distributed under the terms and conditions of the Creative Commons Attribution (CC BY) license (https://creativecommons.org/licenses/by/4.0/).
Share and Cite
Zappa, L.; Schlaffer, S.; Bauer-Marschallinger, B.; Nendel, C.; Zimmerman, B.; Dorigo, W. Detection and Quantification of Irrigation Water Amounts at 500 m Using Sentinel-1 Surface Soil Moisture. Remote Sens. 2021, 13, 1727. https://doi.org/10.3390/rs13091727
Zappa L, Schlaffer S, Bauer-Marschallinger B, Nendel C, Zimmerman B, Dorigo W. Detection and Quantification of Irrigation Water Amounts at 500 m Using Sentinel-1 Surface Soil Moisture. Remote Sensing. 2021; 13(9):1727. https://doi.org/10.3390/rs13091727
Chicago/Turabian StyleZappa, Luca, Stefan Schlaffer, Bernhard Bauer-Marschallinger, Claas Nendel, Beate Zimmerman, and Wouter Dorigo. 2021. "Detection and Quantification of Irrigation Water Amounts at 500 m Using Sentinel-1 Surface Soil Moisture" Remote Sensing 13, no. 9: 1727. https://doi.org/10.3390/rs13091727