Article

A 4-Year Climatological Analysis Based on GPM Observations of Deep Convective Events in the Mediterranean Region

1
Department of Civil, Chemical and Environmental Engineering (DICCA), University of Genoa, via Montallegro 1, 16145 Genoa, Italy
2
National Research Council of Italy, Institute of Atmospheric Sciences and Climate (CNR-ISAC), 00133 Rome, Italy
3
Department of Physical and Environmental sciences, Texas A&M University, Corpus Christi, TX 77843, USA
*
Author to whom correspondence should be addressed.
Remote Sens. 2021, 13(9), 1685; https://doi.org/10.3390/rs13091685
Submission received: 18 March 2021 / Revised: 23 April 2021 / Accepted: 23 April 2021 / Published: 27 April 2021
(This article belongs to the Special Issue Satellite Microwave Remote Sensing for Severe Storms Detection)

Abstract

:
Since early March 2014, the NASA/JAXA Global Precipitation Measurement Core- Observatory (GPM-CO) satellite has allowed analysis of precipitation systems around the globe, thanks to the capabilities of the GPM Microwave Imager (GMI) and Dual-Frequency Precipitation Radar (DPR). In this work, we demonstrate how GPM-CO measurements obtained from 4 years of observations over the Mediterranean area can be used as an extremely effective tool to study the main climatological characteristics of the most intense Mediterranean storm structures. DPR and GMI-based Precipitation Features (PFs) parameters are used as proxies of the vertical structure and microphysical properties of these events, and their statistical distribution is analyzed to identify extremes. The analysis of annual, seasonal and geographical distribution of the identified deep convective systems highlights substantial differences in their diurnal cycle and in the distribution between land-sea and summer-winter. There is a general shift of the convective systems from the south (mostly over the sea) in the cold season, to the north (mostly over land) in the warm season. The analysis shows also that the inferred convective intensity is not always related to heavy precipitation. Known DPR and GMI-based criteria were adopted to identify overshooting top events and potential hailstorms, identify extreme deep convection signatures, like those observed for tropical and subtropical systems, and the most intense occur mostly over the sea. Although the analysis is limited to four years, the results show that the GPM-CO offers unprecedented measurements to identify and characterize extreme weather events in the Mediterranean region, with unique potentials for future long-term climatology and interannual variability analysis.

Graphical Abstract

1. Introduction

The Mediterranean Sea is one of the most interesting areas of the world for what concerns extreme weather phenomena, and it is considered as one of the most cyclogenic basins [1], and as one of the main climate hot-spots [2]. During the year, several heavy precipitation systems develop over the sea, hitting the densely populated coastal areas, causing severe damages and sometimes casualties.
Several typologies of intense Mediterranean weather systems are reported in literature. The most common and dangerous, and often difficult to predict, are those associated with deep convection, i.e., characterized by strong updrafts, extending vertically to the troposphere and, sometimes, penetrating through it in the most intense cases (overshooting tops, e.g., Reference [3]). Severe deep convection is often responsible for most weather-related natural disasters, such as floods, landslides, intense damaging hailstorms, or tornadoes.
Other than the classic intense isolated thunderstorms, the Mediterranean area has other severe thunderstorm typologies. Enhanced V-shape systems, so-called because of the characteristic V-shape observed from VIS/IR satellite images due to deep convection interference with upper level flow (e.g., Reference [4]), are the most common intense types of thunderstorms. They often originate from the low-level convergence of winds along the line separating the cold air mass on the eastern edge of the ascending branch of a deep trough from the warm air of the anticyclone. These events are associated with regenerating thunderstorms, and are capable of producing a large amount of precipitation within few hours, together with high lightning flash rates, remaining stationary over the same affected areas (e.g., the Livorno flash flood in September 2017, described in Reference [5]). Although less common than in other parts of the world, several cases of thunderstorms with supercellular characteristics are also reported in the Mediterranean area [6,7,8,9]. The vast majority of reports of supercells is associated with large hail, with diameters greater than 5 cm, torrential rainfall, extremely high lightning flash rates, and strong wind gusts, sometimes associated with tornadoes [10]. For this reason, extreme damages to infrastructures, and fatalities are reported when supercells hit the coast. On 28 November 2012, for example, a multivortex tornado belonging to the third class of the Enhanced Fujita Scale (EF3, maximum wind speed of approximately 230 km h 1 ), associated with an intense supercell, hit the Apulia region, in Southern Italy, focusing over the city of Taranto [9] and causing one casualty and extensive damages. Sometimes, Mesoscale Convective Systems (MCS), i.e., clusters of several thunderstorms organizing at the mesoscale and creating structures with multiple cells in different stages of development, can be found in the Mediterranean area. This happens under specific ideal conditions for their development, in particular during a cold front outbreak or with the presence of a cut-off low [11]. These structures are associated with heavy rainfall and flooding events [5] because of their well-organized long-lasting activity due to the continuous replacement of old cells into young cells inside the MCS structure [11].
One of the main challenges associated with deep convective systems, especially when rapidly evolving and extremely localized, is their prediction using Numerical Weather Prediction (NWP) models. Moreover, it is becoming very important to understand their intensification and feedback mechanisms, especially in a climatic hot spot, such as the Mediterranean region, through a synergistic use of models and observations. It is, therefore, fundamental to increase the knowledge of these events, and to study their microphysical properties, even in areas not covered by ground-based instruments (e.g., weather radars). Satellites equipped with microwave sensors, are a valid tool to provide information about thunderstorms’ structure and intensity, especially when they develop over the sea, as it often happens in the Mediterranean area. Microwave radiation has the ability to directly interact with solid and liquid hydrometeors (raindrops, graupel, hail, snowflakes) within the clouds [12,13,14], since their sizes are comparable to the microwave radiation wavelength (at frequencies between 10 and 200 GHz). For example, the upwelling radiation measured by passive microwave (PMW) radiometers at the top of the atmosphere is the result of the background emission signal (surface and atmospheric gases) modulated by the cloud hydrometeors-radiation interactions within the cloud and, therefore, can be related to the precipitation structure. On the other hand, the backscattering signal measured by a spaceborne precipitation radar is the result of reflected echoes by the hydrometers within a given volume. This explains the great attention that microwave spaceborne instruments have acquired over the years for scientific and operational purposes. With the advent of the Tropical Rainfall Measurement Mission (TRMM) in 1997, it has been possible to study deep convective systems over tropical and subtropical areas by means of co-located active and passive microwave observations [15,16,17,18,19]. More specifically, hailstorms and severe deep convection penetrating the tropopause over the tropics and on global scale have been analyzed by means of measurements of passive microwave sensors onboard different platforms [20,21,22,23,24,25].
The Global Precipitation Measurement-Core Observatory (GPM-CO), launched on 27 February 2014 and covering latitudes up to 65 N/S, has started a new era not only for precipitation monitoring, but also for the analysis and characterization of precipitation events around the globe. In the present study, we aim at demonstrating the unique capabilities of the GPM-CO in the analysis of the climatology of deep convective systems in the Mediterranean area (i.e., seasonal and diurnal cycles, as well as geographical distribution), and to reveal how this region is often hit by extremely severe deep convection phenomena, also over the sea, with similar characteristics to those found in the tropics (e.g., References [26,27,28]). The GPM-CO is equipped with the two most advanced active and passive microwave sensors designed for precipitation retrieval from space: the Japan Aerospace Exploration Agency (JAXA) Dual-Frequency Precipitation Radar (DPR), and the National Aeronautics and Space Administration (NASA) GPM Microwave Imager (GMI) conically-scanning radiometer [29,30]. The DPR allows study of the three-dimensional structure of the precipitation and its microphysics parameters, while the multichannel GMI microwave measurements, available at unprecedented spatial resolution up to 5 km, allow for inferring information on precipitation microphysics processes. Detailed information provided by these two sensors has been exploited in several studies on the analysis of different typologies of deep convective systems on a global scale [26,27,28] but without focusing specifically on the Mediterranean area. In particular, passive microwave measurements, by combining observations of TRMM and GPM-CO, or of different GPM constellation radiometers (including the GMI), have been used globally to identify the scattering signature of hail in intense thunderstorms, observed as a strong depression of upwelling brightness temperatures measured by satellite radiometers [31,32,33]. Over the Mediterranean region, a climatological analysis of deep convection has been carried out by Reference [34] using long-term measurements of the Advanced Microwave Sounding Unit-B/Microwave Humidity Sounder (AMSU-B/MHS) cross-track scanning radiometer measurements. However, as demonstrated for specific events analyzed over the Mediterranean region [7,35], the GPM-CO offers new possibilities taking advantage of the larger channel assortment and higher spatial resolution of the GMI, and of the first spaceborne precipitation radar (in dual frequency) covering the mid-latitudes.
In this study, 4 years of GMI and DPR observations (March 2014–February 2018) are used as proxies to select and characterize deep convective systems in the Mediterranean area. The goal of this study is to evidence how the GMI and DPR unique and unprecedented capabilities are often complementary in depicting unique features of deep convective systems, including overshooting tops and potential hailstorms. The non-sun synchronous GPM-CO orbit allows for the first time to analyze the diurnal cycle over the whole area, evidencing the different forcing mechanisms of deep convection over land and over sea in the different seasons.
The dataset used and the methodology are described in Section 2, and the main results of the analysis are illustrated in Section 3, while the discussion and the conclusions are provided in Section 4.

2. Materials and Methods

The GPM-CO is a Low Earth Orbit (LEO) non-sun-synchronous satellite equipped with the two most advanced active and passive microwave sensors specifically designed for precipitation monitoring and estimation: the JAXA nadir-scanning DPR, operating at the Ku-band (13.6 GHz, 245 km swath) and at the Ka-band (35.55 GHz, 125 km swath), and the NASA GMI conical-scanning radiometer, with 53.1 viewing angle and a 885 km swath [29,30]. GMI offers the most appropriate set of microwave frequencies for precipitation retrieval, with 10 dual-polarization (V and H) window channels at 10 GHz, 19 GHz, 36.5 GHz, 89 GHz, and 166 GHz, and three single-polarization (V) channels in the microwave water vapour absorption bands, one at 23.8 GHz and two pass-bands located symmetrically about the peak of the 183.31 GHz (183.31 ± 3 GHz and 183.31 ± 7 GHz) [36].
In the GPM-CO database used for the analysis, each precipitating event is identified by the so-called precipitation feature (PF), a concept that was first introduced in late 1990s for other satellite-based observations. The PF database is freely available at http://atmos.tamucc.edu/trmm/data/ (accessed on 26 April 2021), and it is described in Reference [37]. The PF database V05 (covering the period from March 2014 through the year 2018) has been used in the study. PF definition involves two steps using Level-1 and Level-2 data. Level-1 data are obtained by processing both GMI and DPR products, after co-location of radiometer and radar data and a parallax correction (to account for their different scanning geometries). In order to identify the PFs, it is necessary to assemble the single Level-1 pixels into Level-2 data. Different criteria are used to assemble the Level-1 pixels, which can be based on DPR and GMI parameters, highlighting that there is more than one way to define PFs. For the following analysis, the PFs are defined by grouping all the adjacent Level-1 pixels with surface precipitation rate greater than 0.1 mm/h, as retrieved by the GPM-CO Ku-band radar. The number of adjacent pixels defines the area of a PF. This PF class (labeled as “kurpf” in the dataset) includes almost all events, from shallow rain to the deep convection or heavy precipitation cases, and it provides both radar-based and radiometer-based parameters for a better and more complete analysis of the different precipitation systems.

2.1. Proxies for the Deep Convection

The main parameters used in the analysis and associated with each PF are reported in Table 1. GMI-based parameters are indicated in bold, while DPR-based parameter are indicated in italic.
In the following, the main parameters used in the study, among those reported in Table 1, are described. The brightness temperatures (BTs) at 37 and 89 GHz are the most important proxies of the intensity of a deep convective system [19]. Their minimum value for each PF can be associated with the strength of the updraft in the convective core [16] because the BT depression is mostly due to the scattering of the upwelling radiation by the ice hydrometeors. In particular, the 89 GHz channels provide information about the presence of precipitating high density ice in the convective core (sustained by the intense updraft), such as graupel or hail. The 37 GHz channels are mostly sensitive to the absorption/emission by liquid water (rainfall). However, in presence of intense convective cores, the scattering by high-density, large ice particles (graupel or hail) can cause significant BT depression at this (or even lower) frequency, thus enabling the detection of large hail (e.g., References [7,38]). In Table 1, the Polarization Corrected Temperatures (PCTs) instead of BTs are used for 37 and 89 GHz channels. PCT has been introduced in previous studies to highlight the scattering signal of the cloud with respect to the signal associated with the radiatively cold background surface [39]. Cold BT signatures can result either from the low emissivity of sea or snow-covered surfaces, or from the scattering of ice particles within the clouds. The surface can contaminate the signal and BT response to the cloud in the low-medium frequency window channels (e.g., 37 and 89 GHz), and this effect is reduced with PCT defined in its general form as:
P C T f = β f · B T f h B T f v β f 1 ,
where B T f h and B T f v are, respectively, the horizontally and vertically polarized BTs at the frequency f, while β f is a parameter estimated in several studies for different frequencies [38,39,40]. The minimum PCT value at 37 GHz and 89 GHz associated with the PF (MIN37PCT and MIN89PCT in Table 1) are used as proxies for deep convection. In addition, the minimum BTs at 166.5 GHz (V and H polarization), 183 ± 3 GHz, and 183 ± 7 GHz (indicated as MIN165V, MIN165H, MIN1833, MIN1838 in Table 1) are also used in the analysis as additional proxies for the categorization of intense PFs, since they are sensitive also to the scattering of smaller ice particles found in the upper layers of the clouds (including the anvil). Some radar-based proxies, in Table 1, are the maximum heights reached by specific radar echoes. For example, MAXHT20 and MAXHT40 indicate the maximum radar echo height at 20 dBZ and 40 dBZ, respectively. These give information about the updraft strength of a storm and its convective nature since the deeper the convection, the more vertically developed the precipitation structure and, therefore, the higher the maximum height of a given radar echo [19].
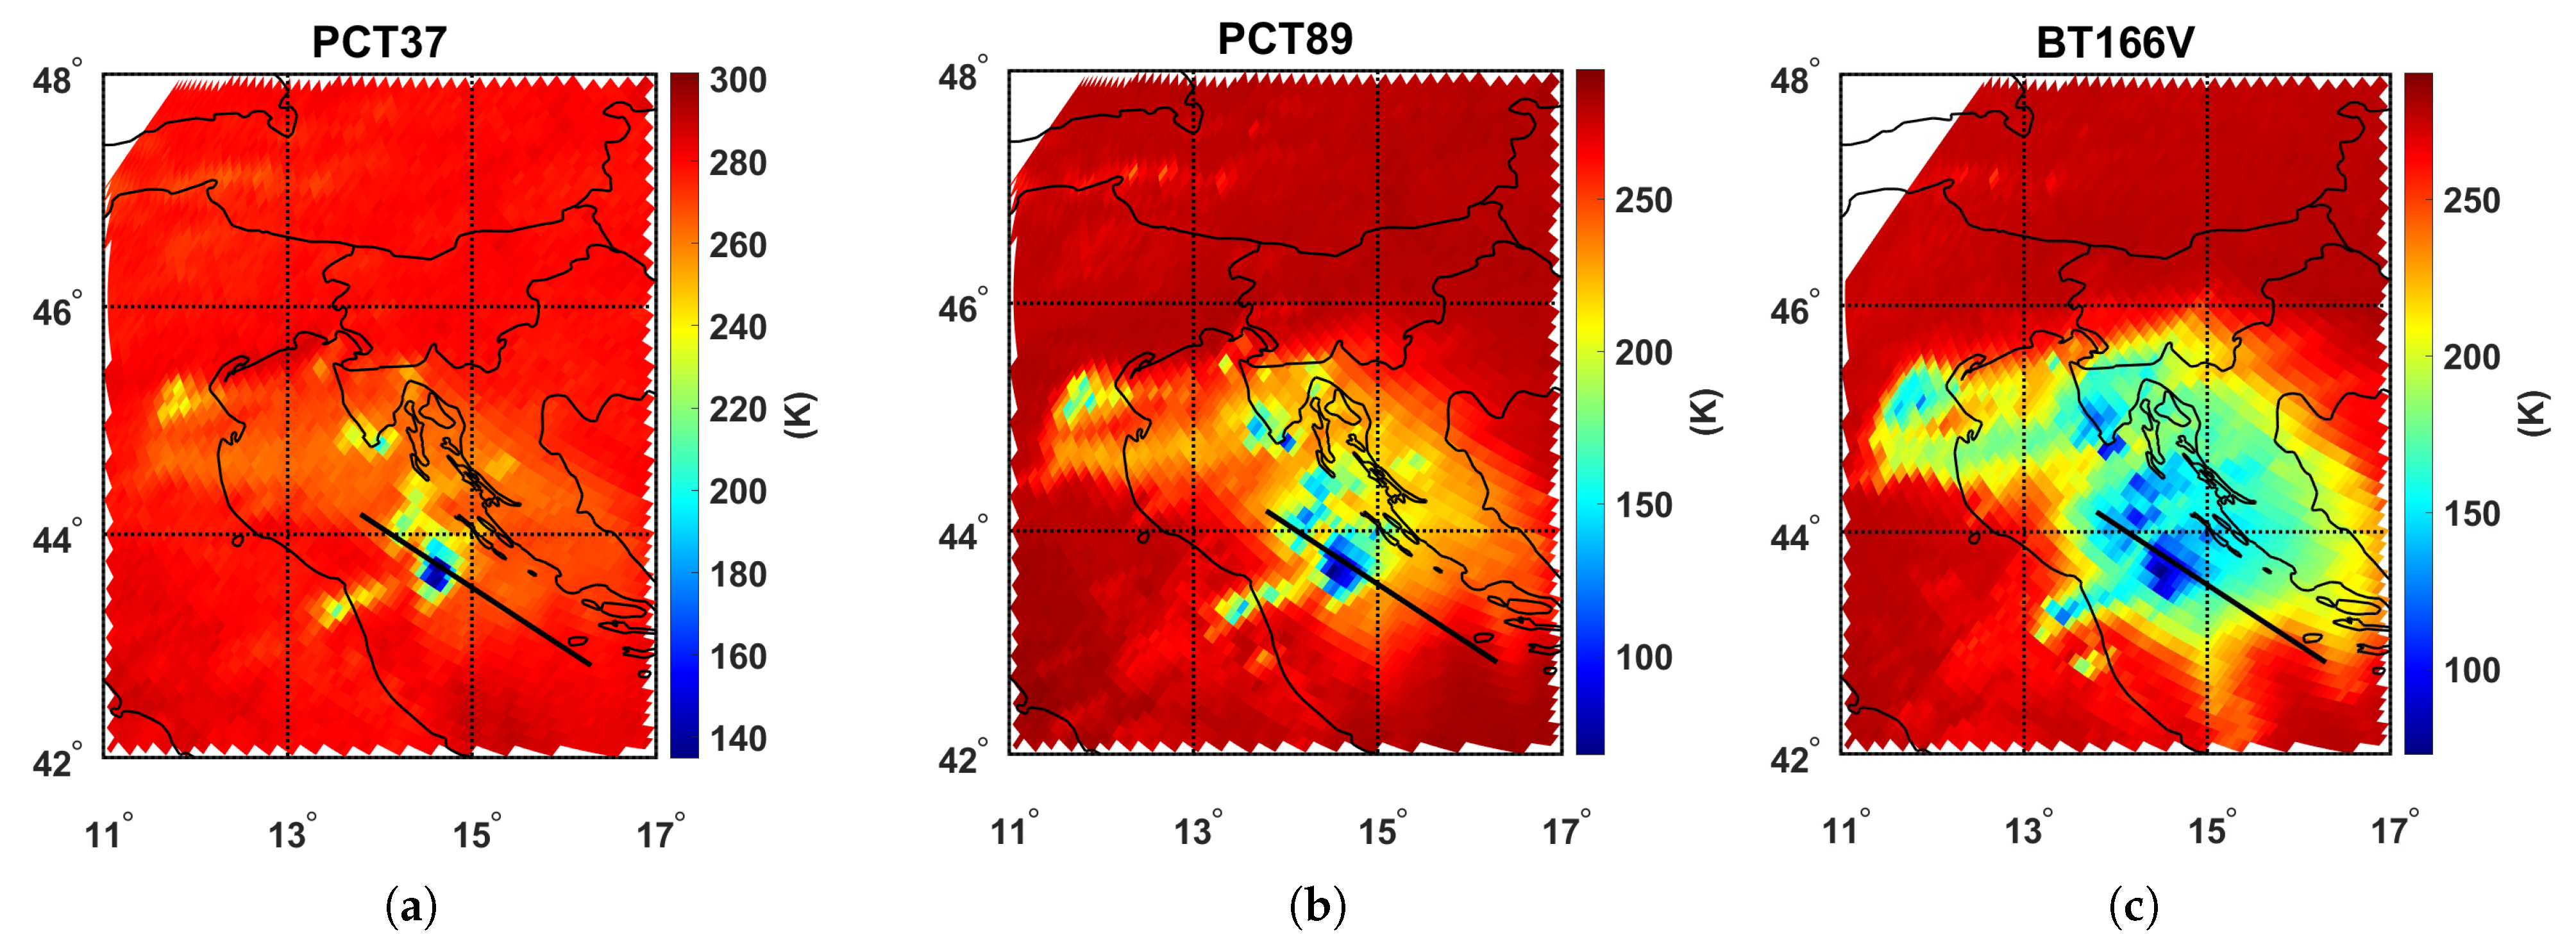
An example of the effectiveness of PCTs to identify convection over land and sea is provided for an intense MCS, that hit Emilia-Romagna region (Italy), causing extensive and intense rainfall and floods in several river basins and then moved to the Adriatic Sea and the coasts of Croatia, between 14 and 20 September 2014. Figure 1a–c show the maps of the 37 GHz PCT, the 89 GHz PCT, both obtained from Equation (1), and the BT at 166 GHz (V polarization), respectively, for the GMI overpass on 20 September 2014 over the Adriatic Sea.
The most intense region of the storm interested by deep convection are well highlighted by the marked PCT depressions compared to the warm background in Figure 1a,b, while the radiatively cold sea surface that would be visible in the BT images, is not contaminating the scene. In particular, the low values reached in the convective core confirm the extremely intense nature of the system, with minimum values of PCT at 37 GHz and 89 GHz of 135 K and 68 K, respectively. These values are comparable to the values reported by Marra et al. [7] for an extremely intense hailstorm occurred near Naples, Italy, on 5 September 2015, and are compatible with the presence of large and high density precipitating ice particles (hail) and strong updrafts. On the other hand, 166 GHz (V pol) BT shows the large extension of the system, including the anvil, with an extended area of cold brightness temperatures compared to the warm background, due to scattering from ice particles in the stratiform region, and lower values in correspondence to the convective cores (
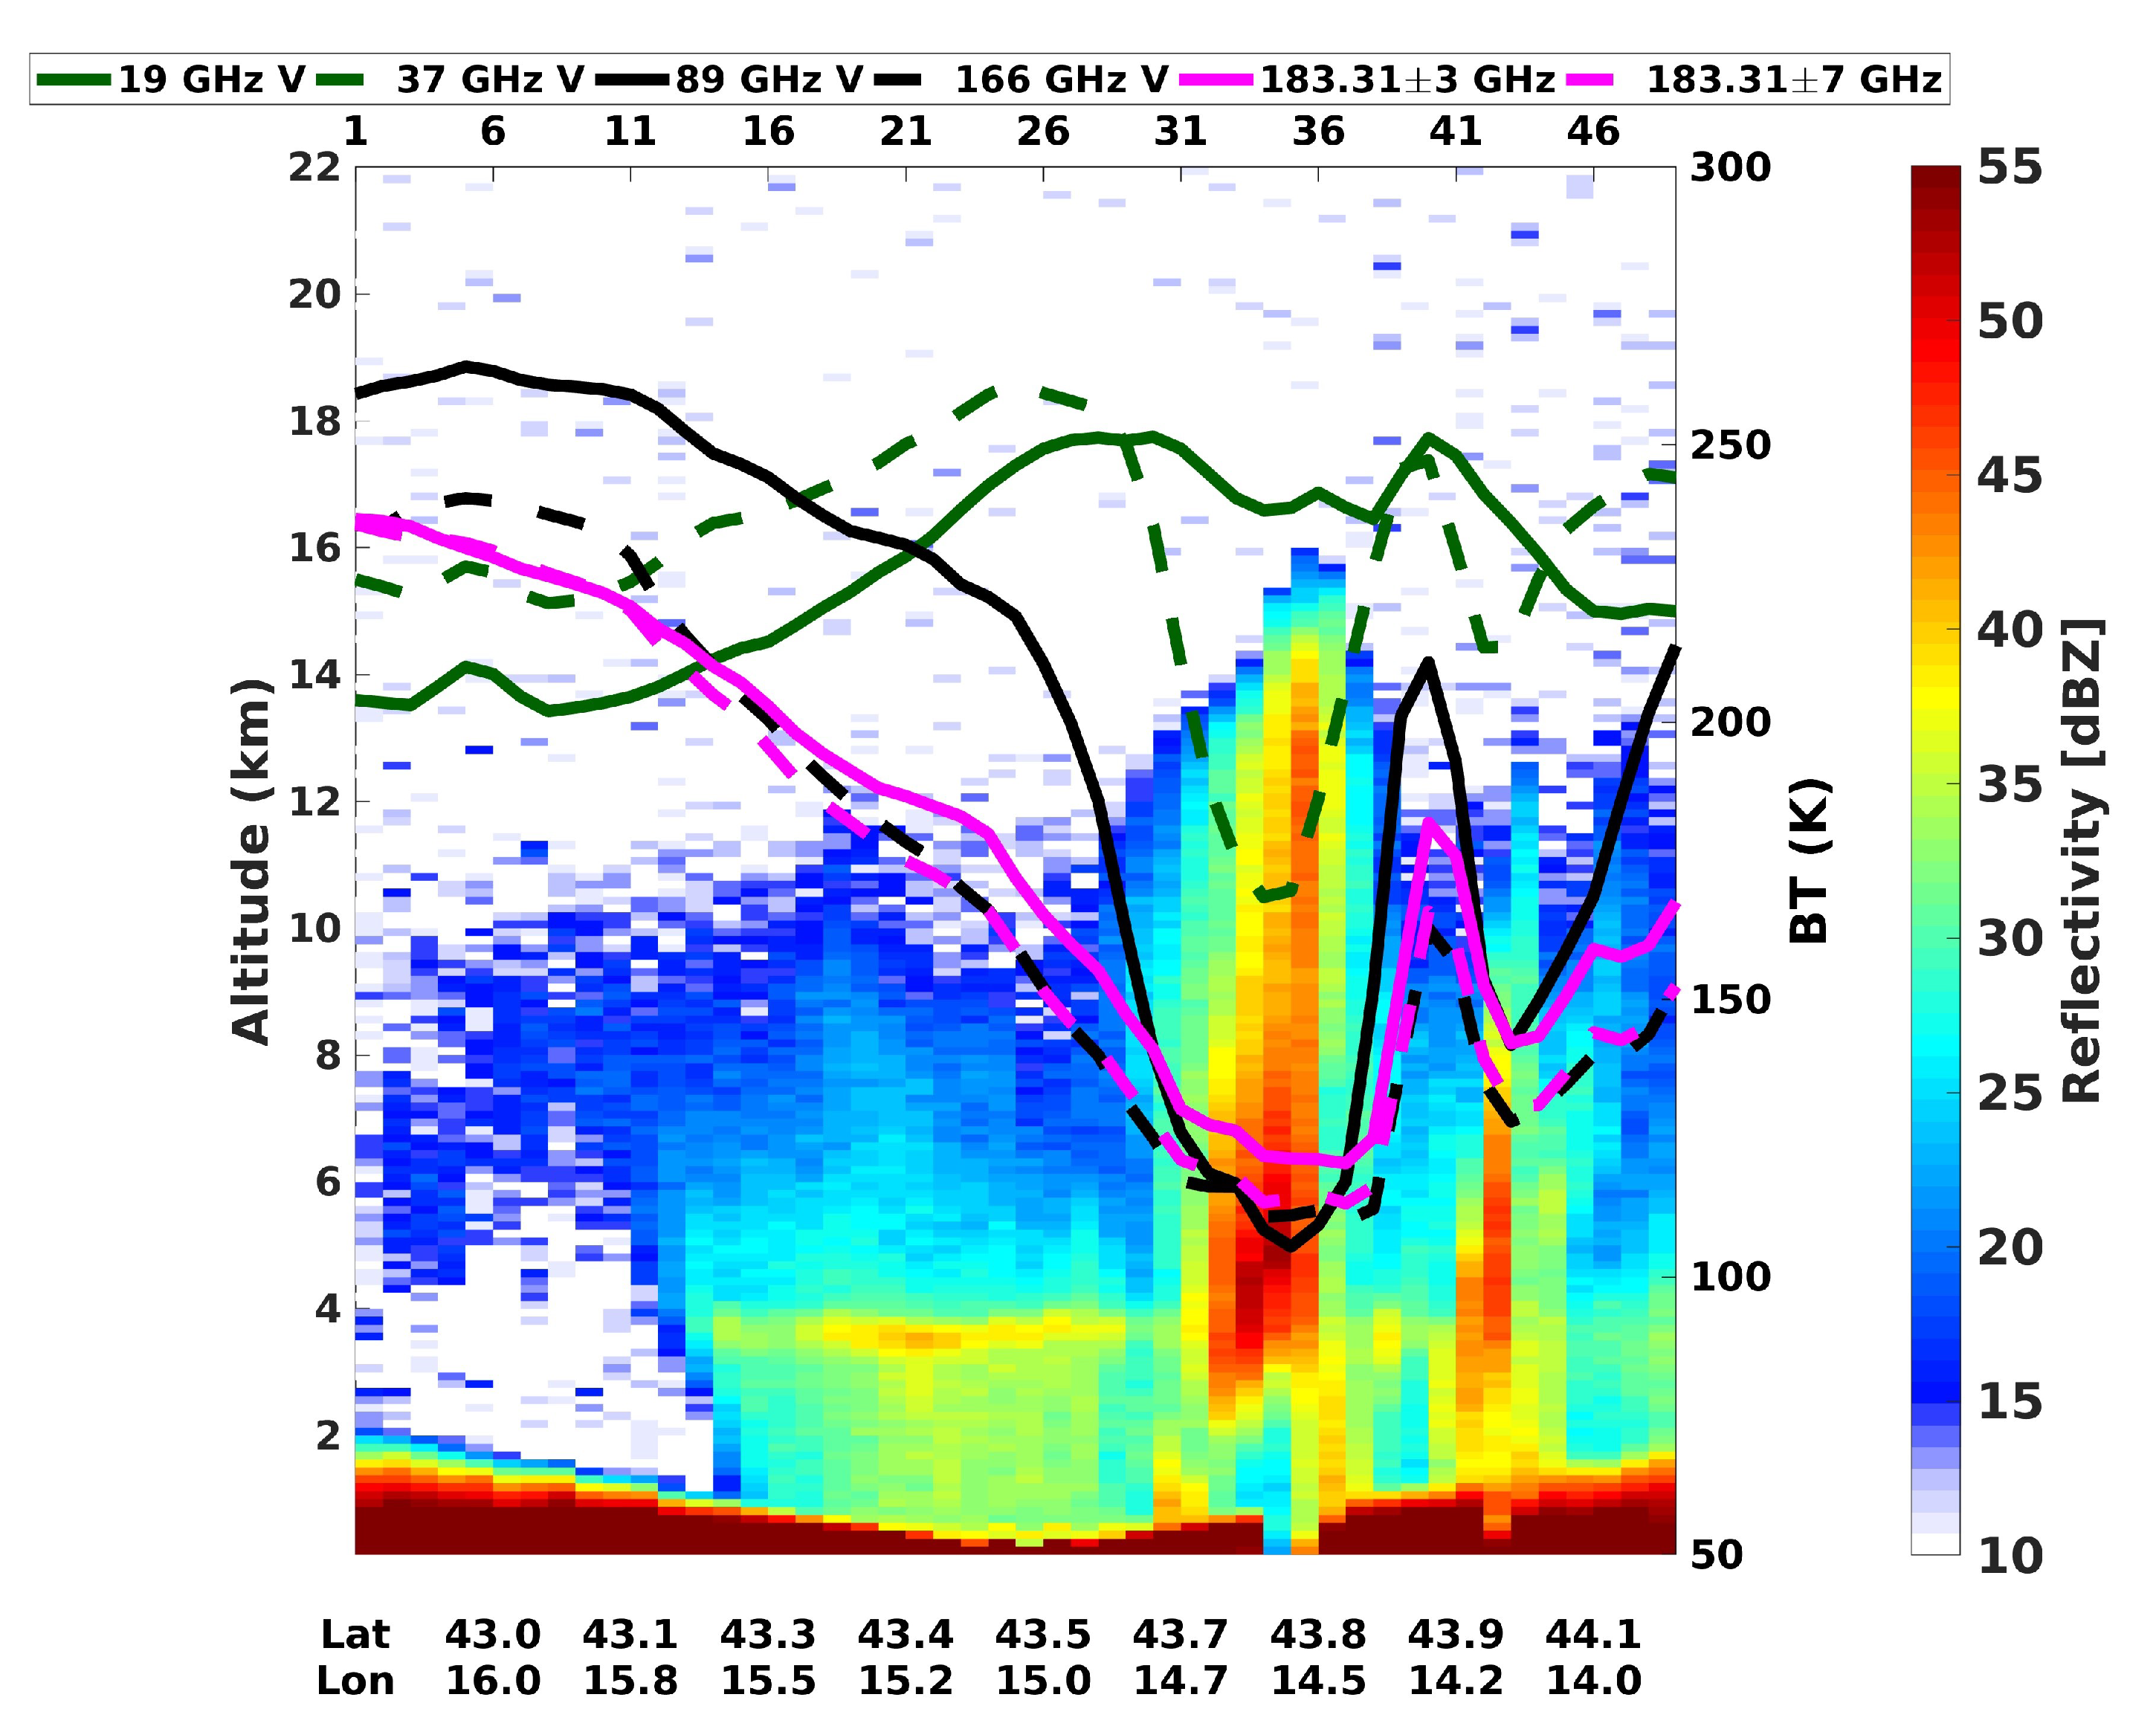
Figure 1c). The strength of the convection is also well depicted by a vertical cross section of DPR Ku-band measured reflectivity (reported in Figure 2 in correspondence of the black lines of Figure 1a–c). In addition, the BTs measured by GMI within the considered scan line are also reported. The strength of the updraft is confirmed by the maximum height of the minimum detectable radar echo (labeled as MAXHT in Table 1) above 16 km, as well as by the maximum height at 20 dBZ and 40 dBZ (reported in Table 1 as MAXHT20 and MAXHT40), around 15/16 km and 13/14 km, respectively. These variables are, indeed, good indicators of deep convection and of the updraft strength, since they respond to the presence of the solid and liquid hydrometeors lifted upwards in the upper levels of the cloud. They are proxies of the vertical extension of the deep convective core.
In 
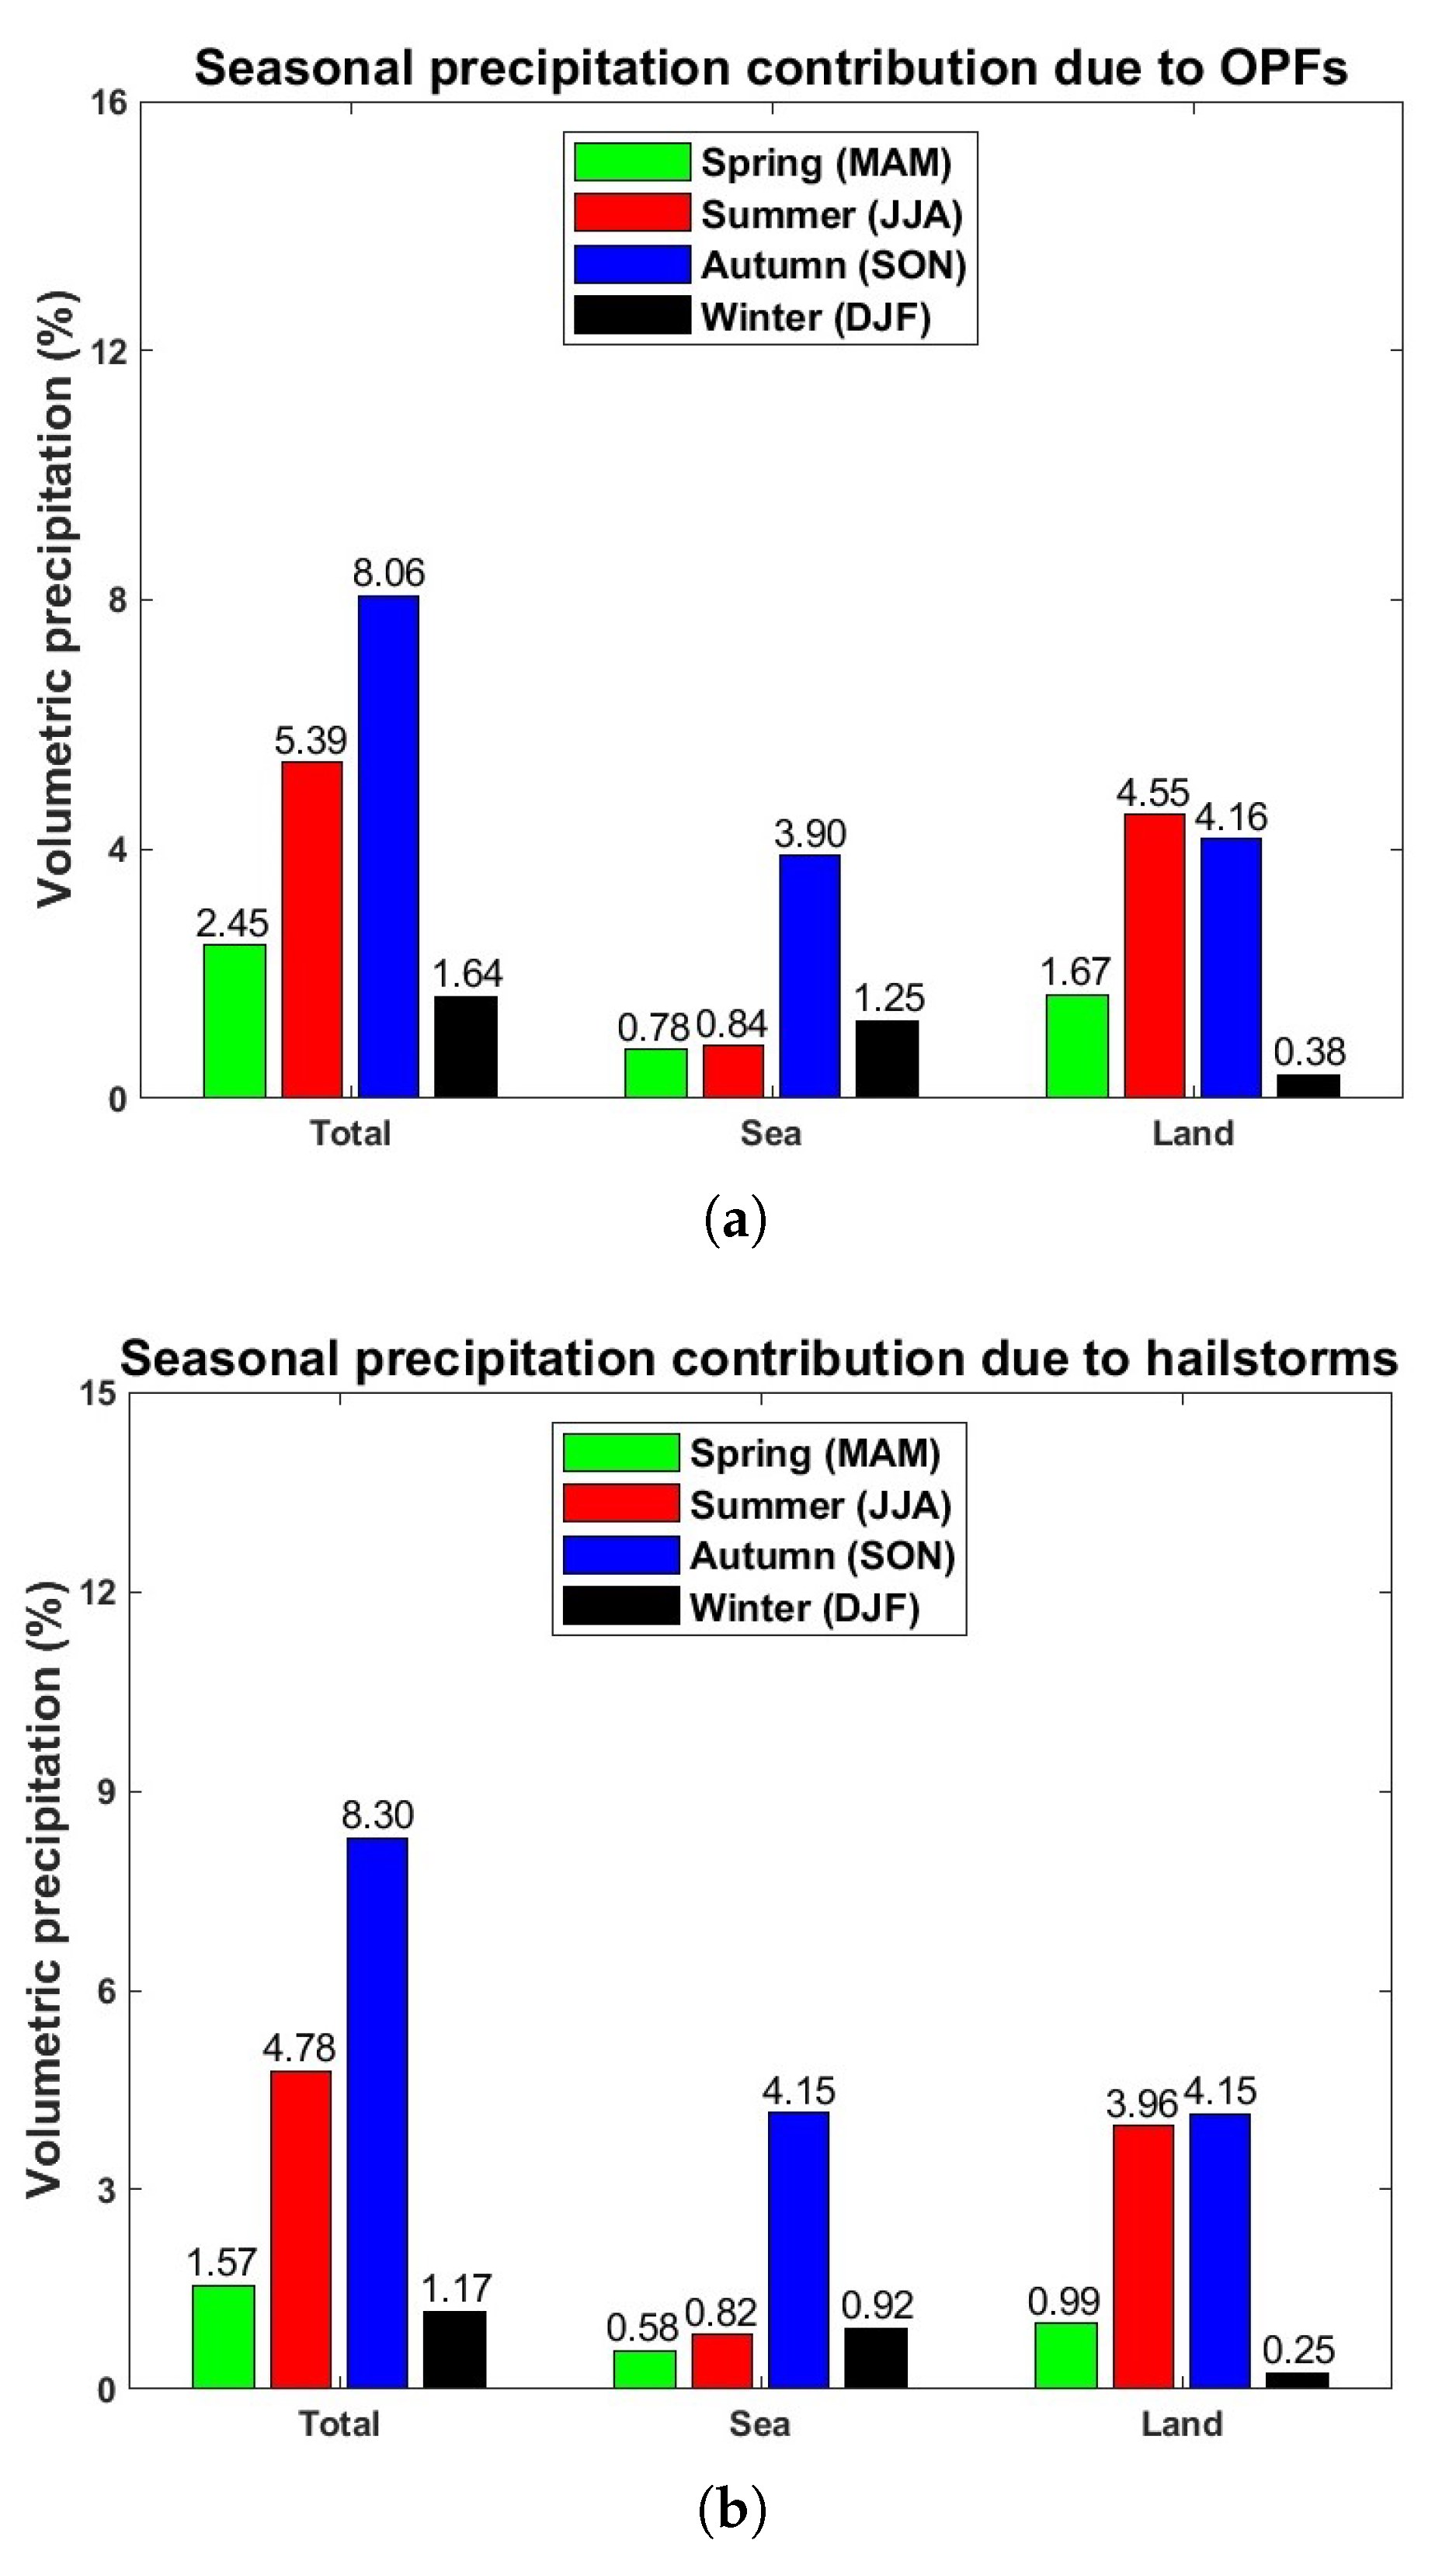
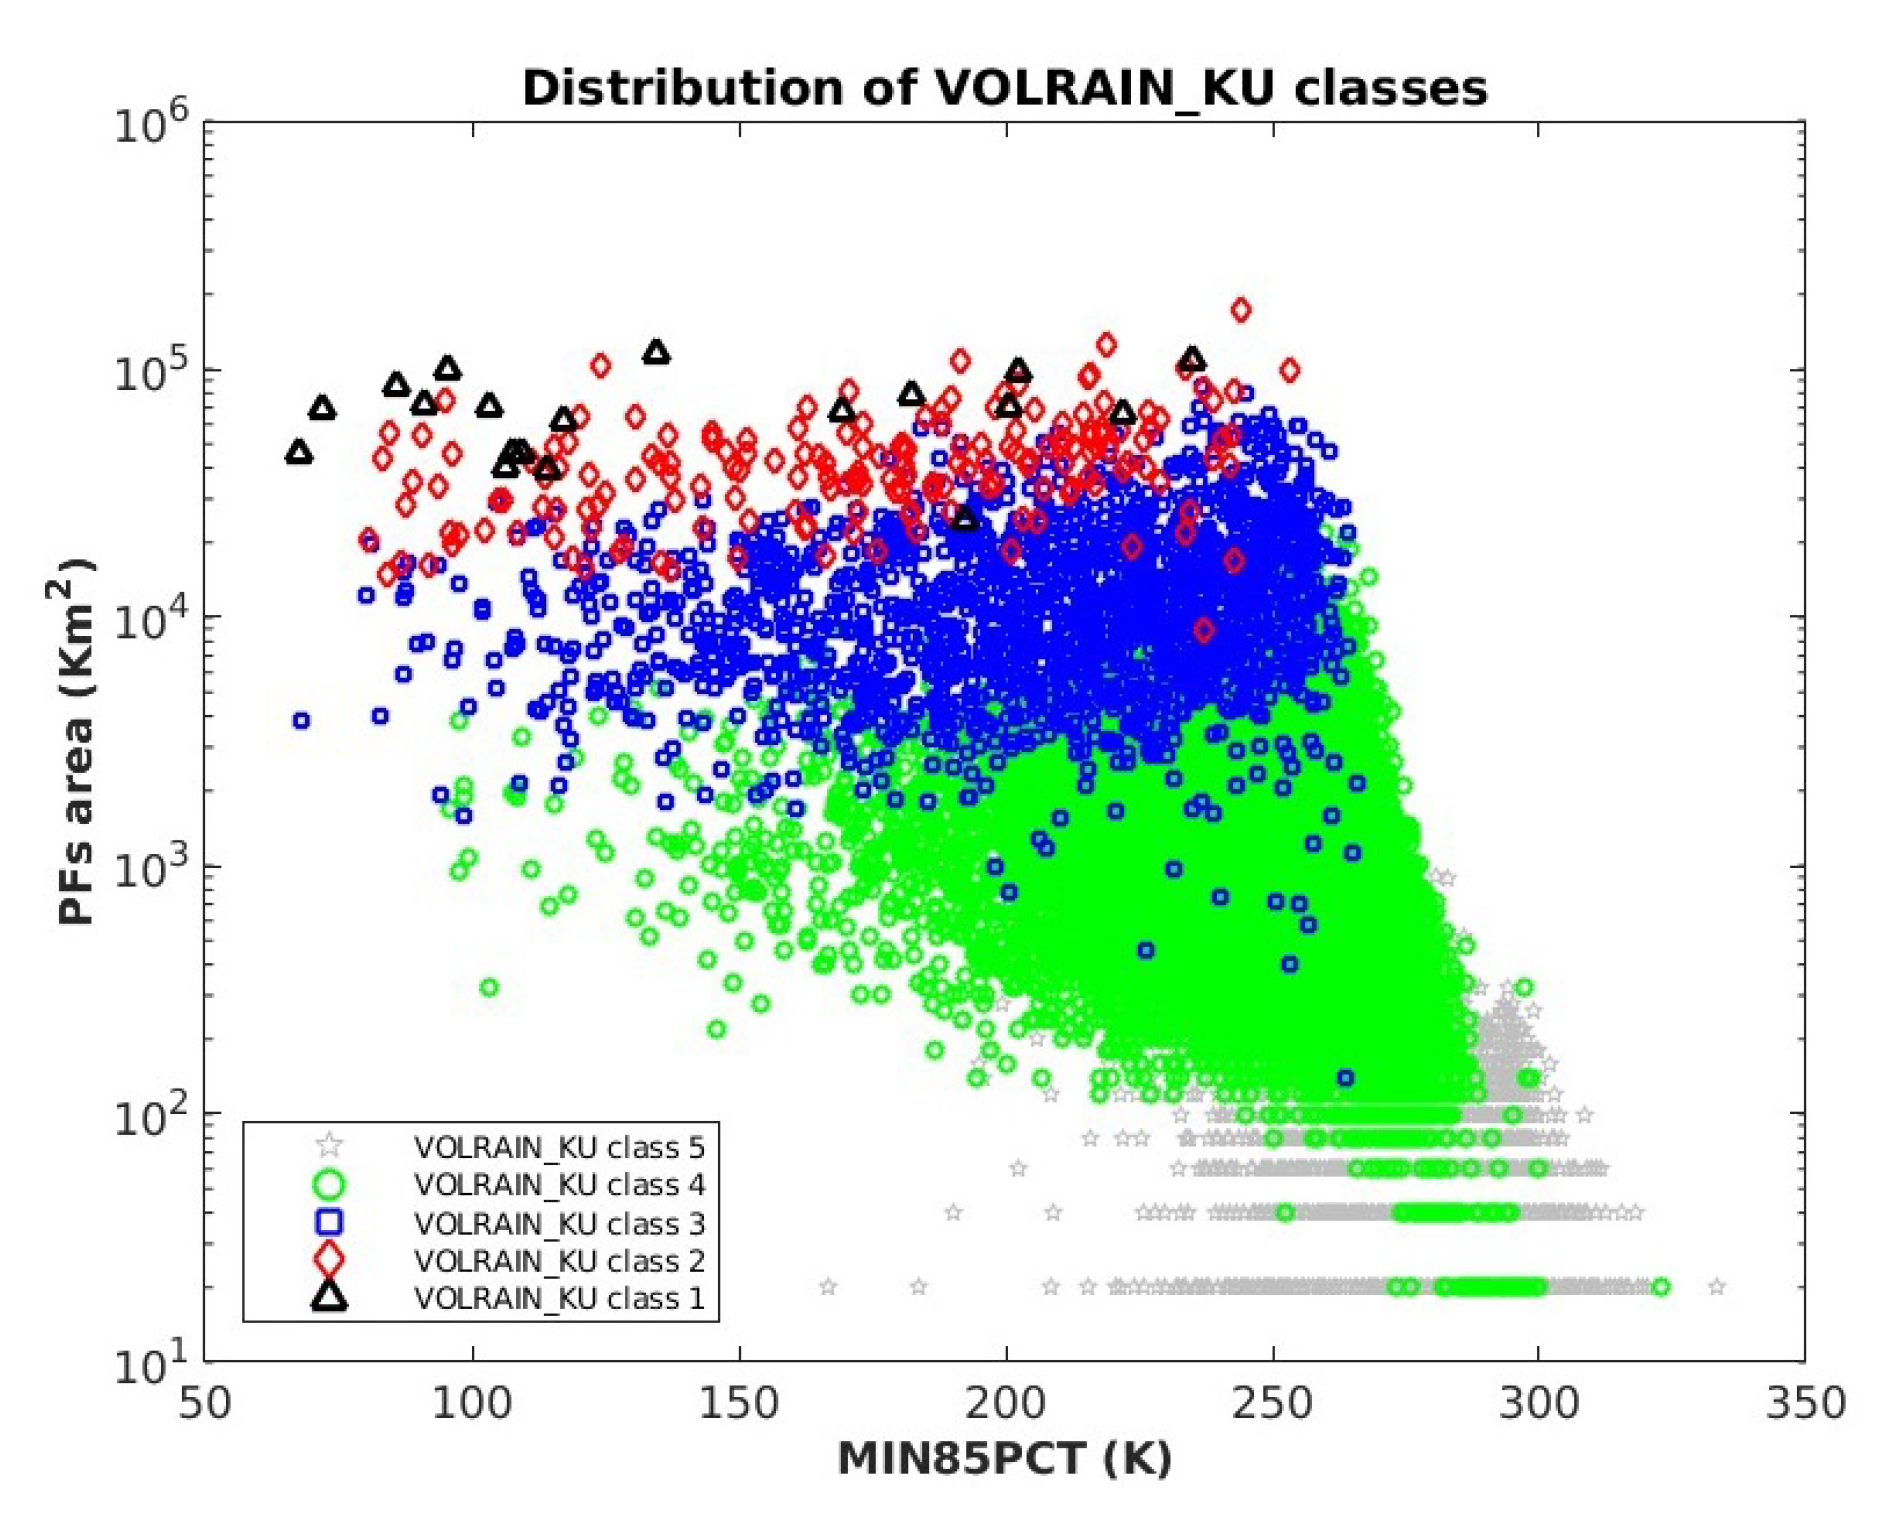
Table 1, besides the deep convection proxies described above, it is worth mentioning another important parameter called VOLRAIN_KU, which represents the rain rate observed at the time of GPM-CO overpass integrated over the PF area. This parameter is used to analyze the precipitation amount associated with the PFs (Section 3.2).

2.2. Characterization of Extreme Deep Convection Events

Prior to the actual analysis of the PF dataset, a selection has been made by applying a “noise” filter and a snow cover filter for the 4 years considered within the domain of interest. Only the PFs with latitude between 30 N and 48 N, and longitude between 6 W and 36 E (latitude/longitude vectors in the PF dataset represent the geographical center of each PF), have been selected. Although the Black Sea and a small part of the Atlantic Ocean (north of Spain and west of France) are included in the selected area, hereafter it will be referred to as Mediterranean area. The “noise” filter is applied to eliminate from the database spurious data often attributed to radar “mirror” echoes at very high altitude that may occur in presence of very intense convective systems [7]. Following Liu and Zipser [26], PFs having the MAXHT20 higher than 17 km, but minimum 89 GHz PCT warmer than 220 K, and less than 4 contiguous radar pixels (<80 km 2 ) in size, are discarded from the analysis, since such radar reflectivity altitude is unrealistic. The second filter is applied to account for snow-covered surface contamination of the scattering signal due to the cloud. Snow-covered areas appear as BT depression areas in the lower frequency channels (e.g., the 37 GHz used in the analysis), and the use of the PCT is not very effective in removing this spurious effect. The scattering of snow at the ground, during the winter or in mountainous regions, may be erroneously interpreted as deep convection. Therefore, in order to exclude PFs likely associated with snow cover from the analysis, the monthly snow depth data obtained by the latest reanalysis produced by ECMWF (https://cds.climate.copernicus.eu/cdsapp#!/dataset/reanalysis-era5-single-levels-monthly-means, accessed on 26 April 2021) has been considered. In particular, the ERA-5 monthly snow depth (expressed in meters of liquid water equivalent), available on a 0 . 25 × 0 . 25 regular grid, is associated with each PF using a nearest-neighbor approximation.
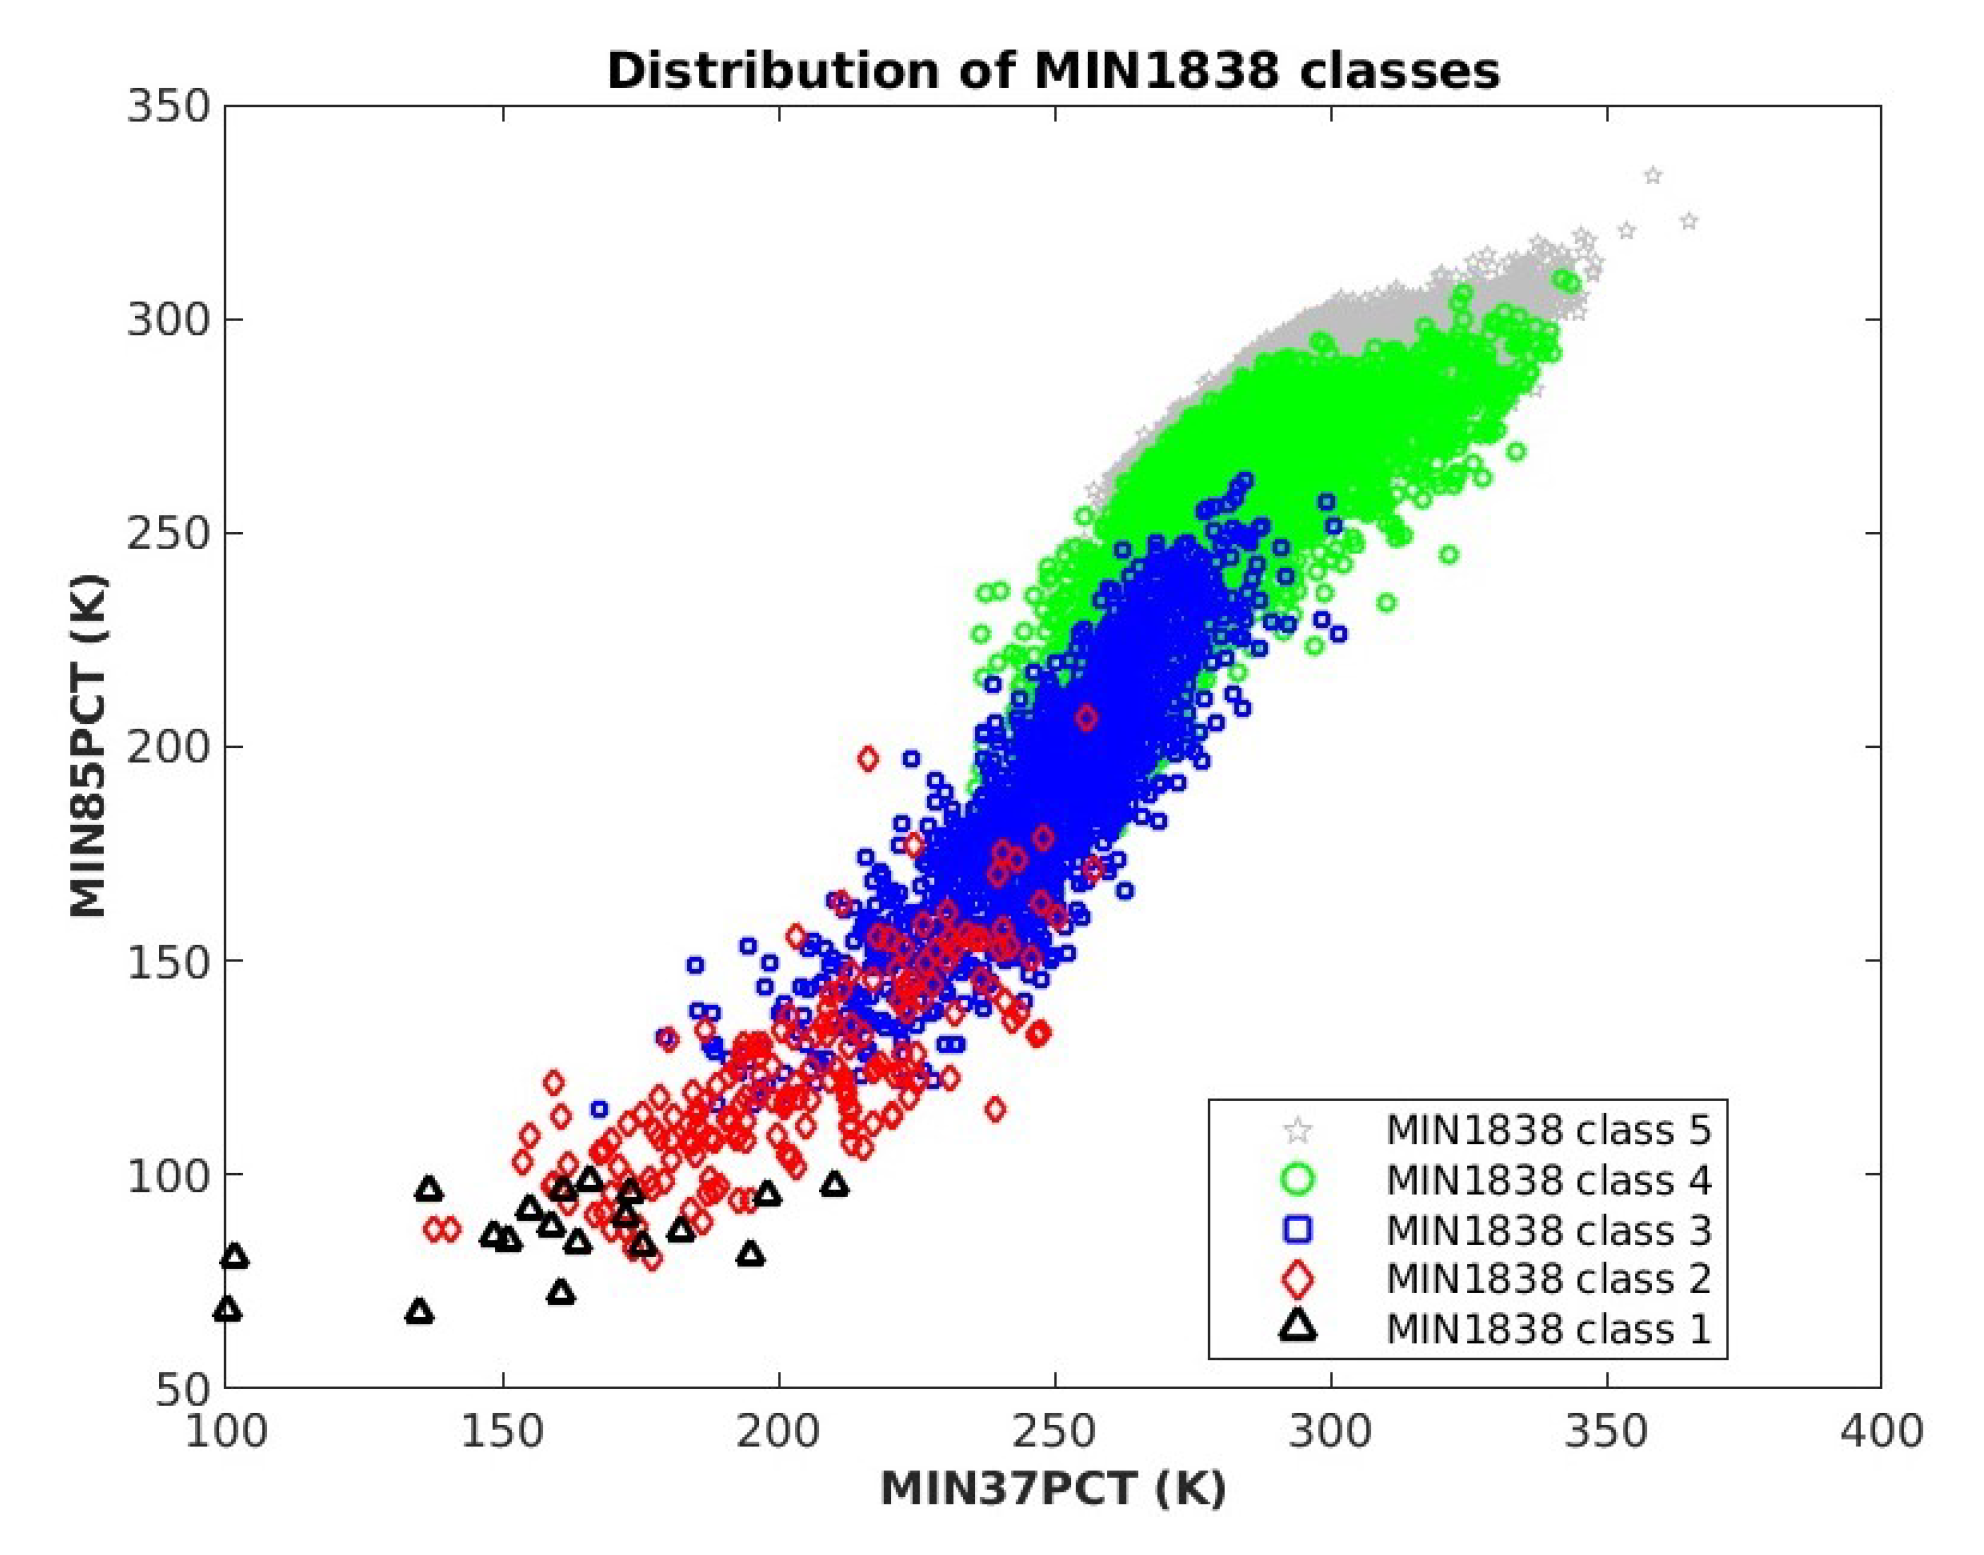
In order to identify the extreme events among all the selected elements, PFs are categorized from the top 10 % , 1 % , 0.1 % , and 0.01 % extreme (in terms of intensity) values of each parameters selected to study convection [16,19,26]. Then, the percentiles of the distribution of each parameter, corresponding to the cited percentages, have been calculated. In particular, for the parameters in which frequency in the distribution decreases as their value decreases (e.g., BTs or PCTs), these percentages correspond to the 0.01th, 0.1th, 1th and 10th percentiles of each distribution, respectively. For the parameters in which frequency decreases as their value increases (e.g., maximum radar echo top, or volumetric precipitation), these percentages correspond to the 99.99th, 99.9th, 99th, and 90th percentiles of each distribution, respectively. In this way, the most “extreme” values for a given parameter are those belonging to the top 0.01% (so, below the 0.01th percentile for GMI-based parameters, and above the 99.99th percentile for DPR-based parameters), with less and less extreme values being included as the top percentage increases.
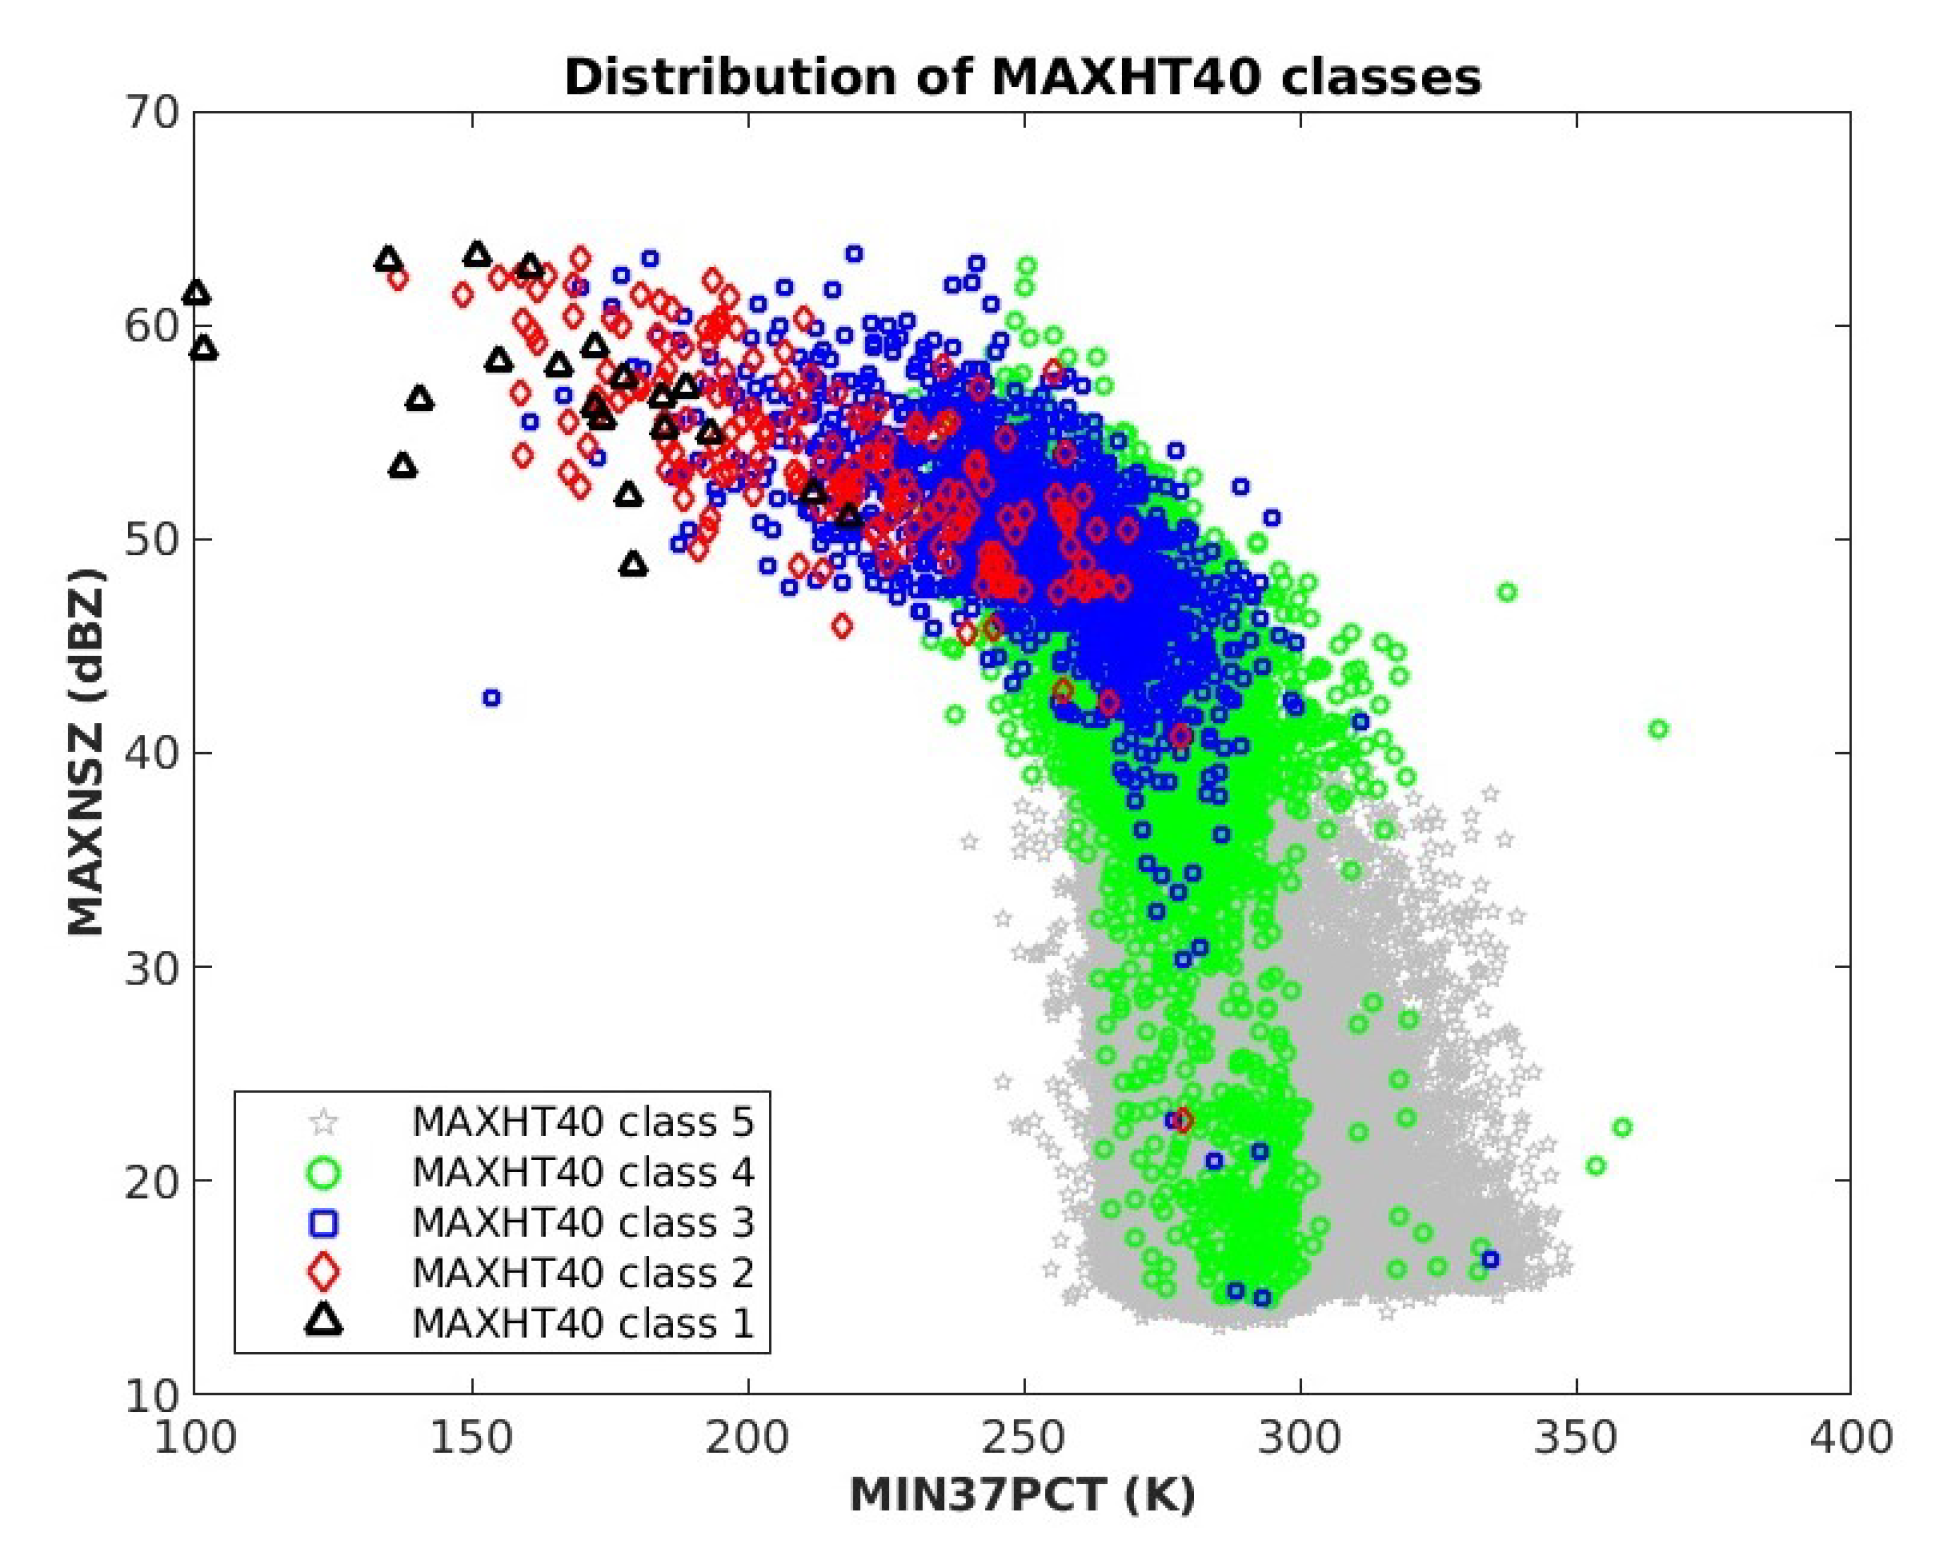
The distribution of each parameter reflects that of the PFs. Therefore, the number of PFs and the parameter values corresponding to each interval obtained by the top percentage categorization are determined, creating “intensity classes” for each parameter. These intensity classes depends on the considered variable, since each of them describes different convection-related properties. So, it is not obvious for the same PFs to belong to the same intensity class for different parameters: an intense deep convective storm, that has the MAXHT40 belonging to the top 0.01 % extreme values, might have the MIN37PCT between the top 0.1 % and the top 1 % extreme values. It is worth pointing out this aspect because such an approach allows analyzation of the deep convection intensity (and the associated phenomena) using several perspectives and exploiting all the available proxies related to this type of phenomenology. The distributions of the PFs obtained enable to focus, in particular, on the geographical distribution of extreme classes. Once PFs belonging to a certain top percentage of each proxy are selected (intense PFs), the seasonal distribution within the domain, and the diurnal and seasonal cycle, are mapped and analyzed.
Since different PF subsets are selected with the use of different proxies, it is fundamental to study the dispersion of the intensity classes based on one parameter as a function of the others. This is an aspect which will be clarified in the next two sections.
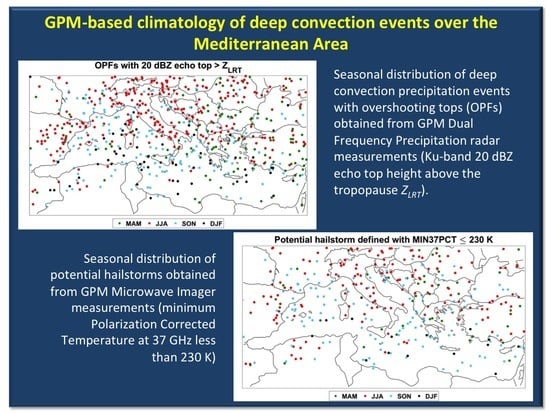
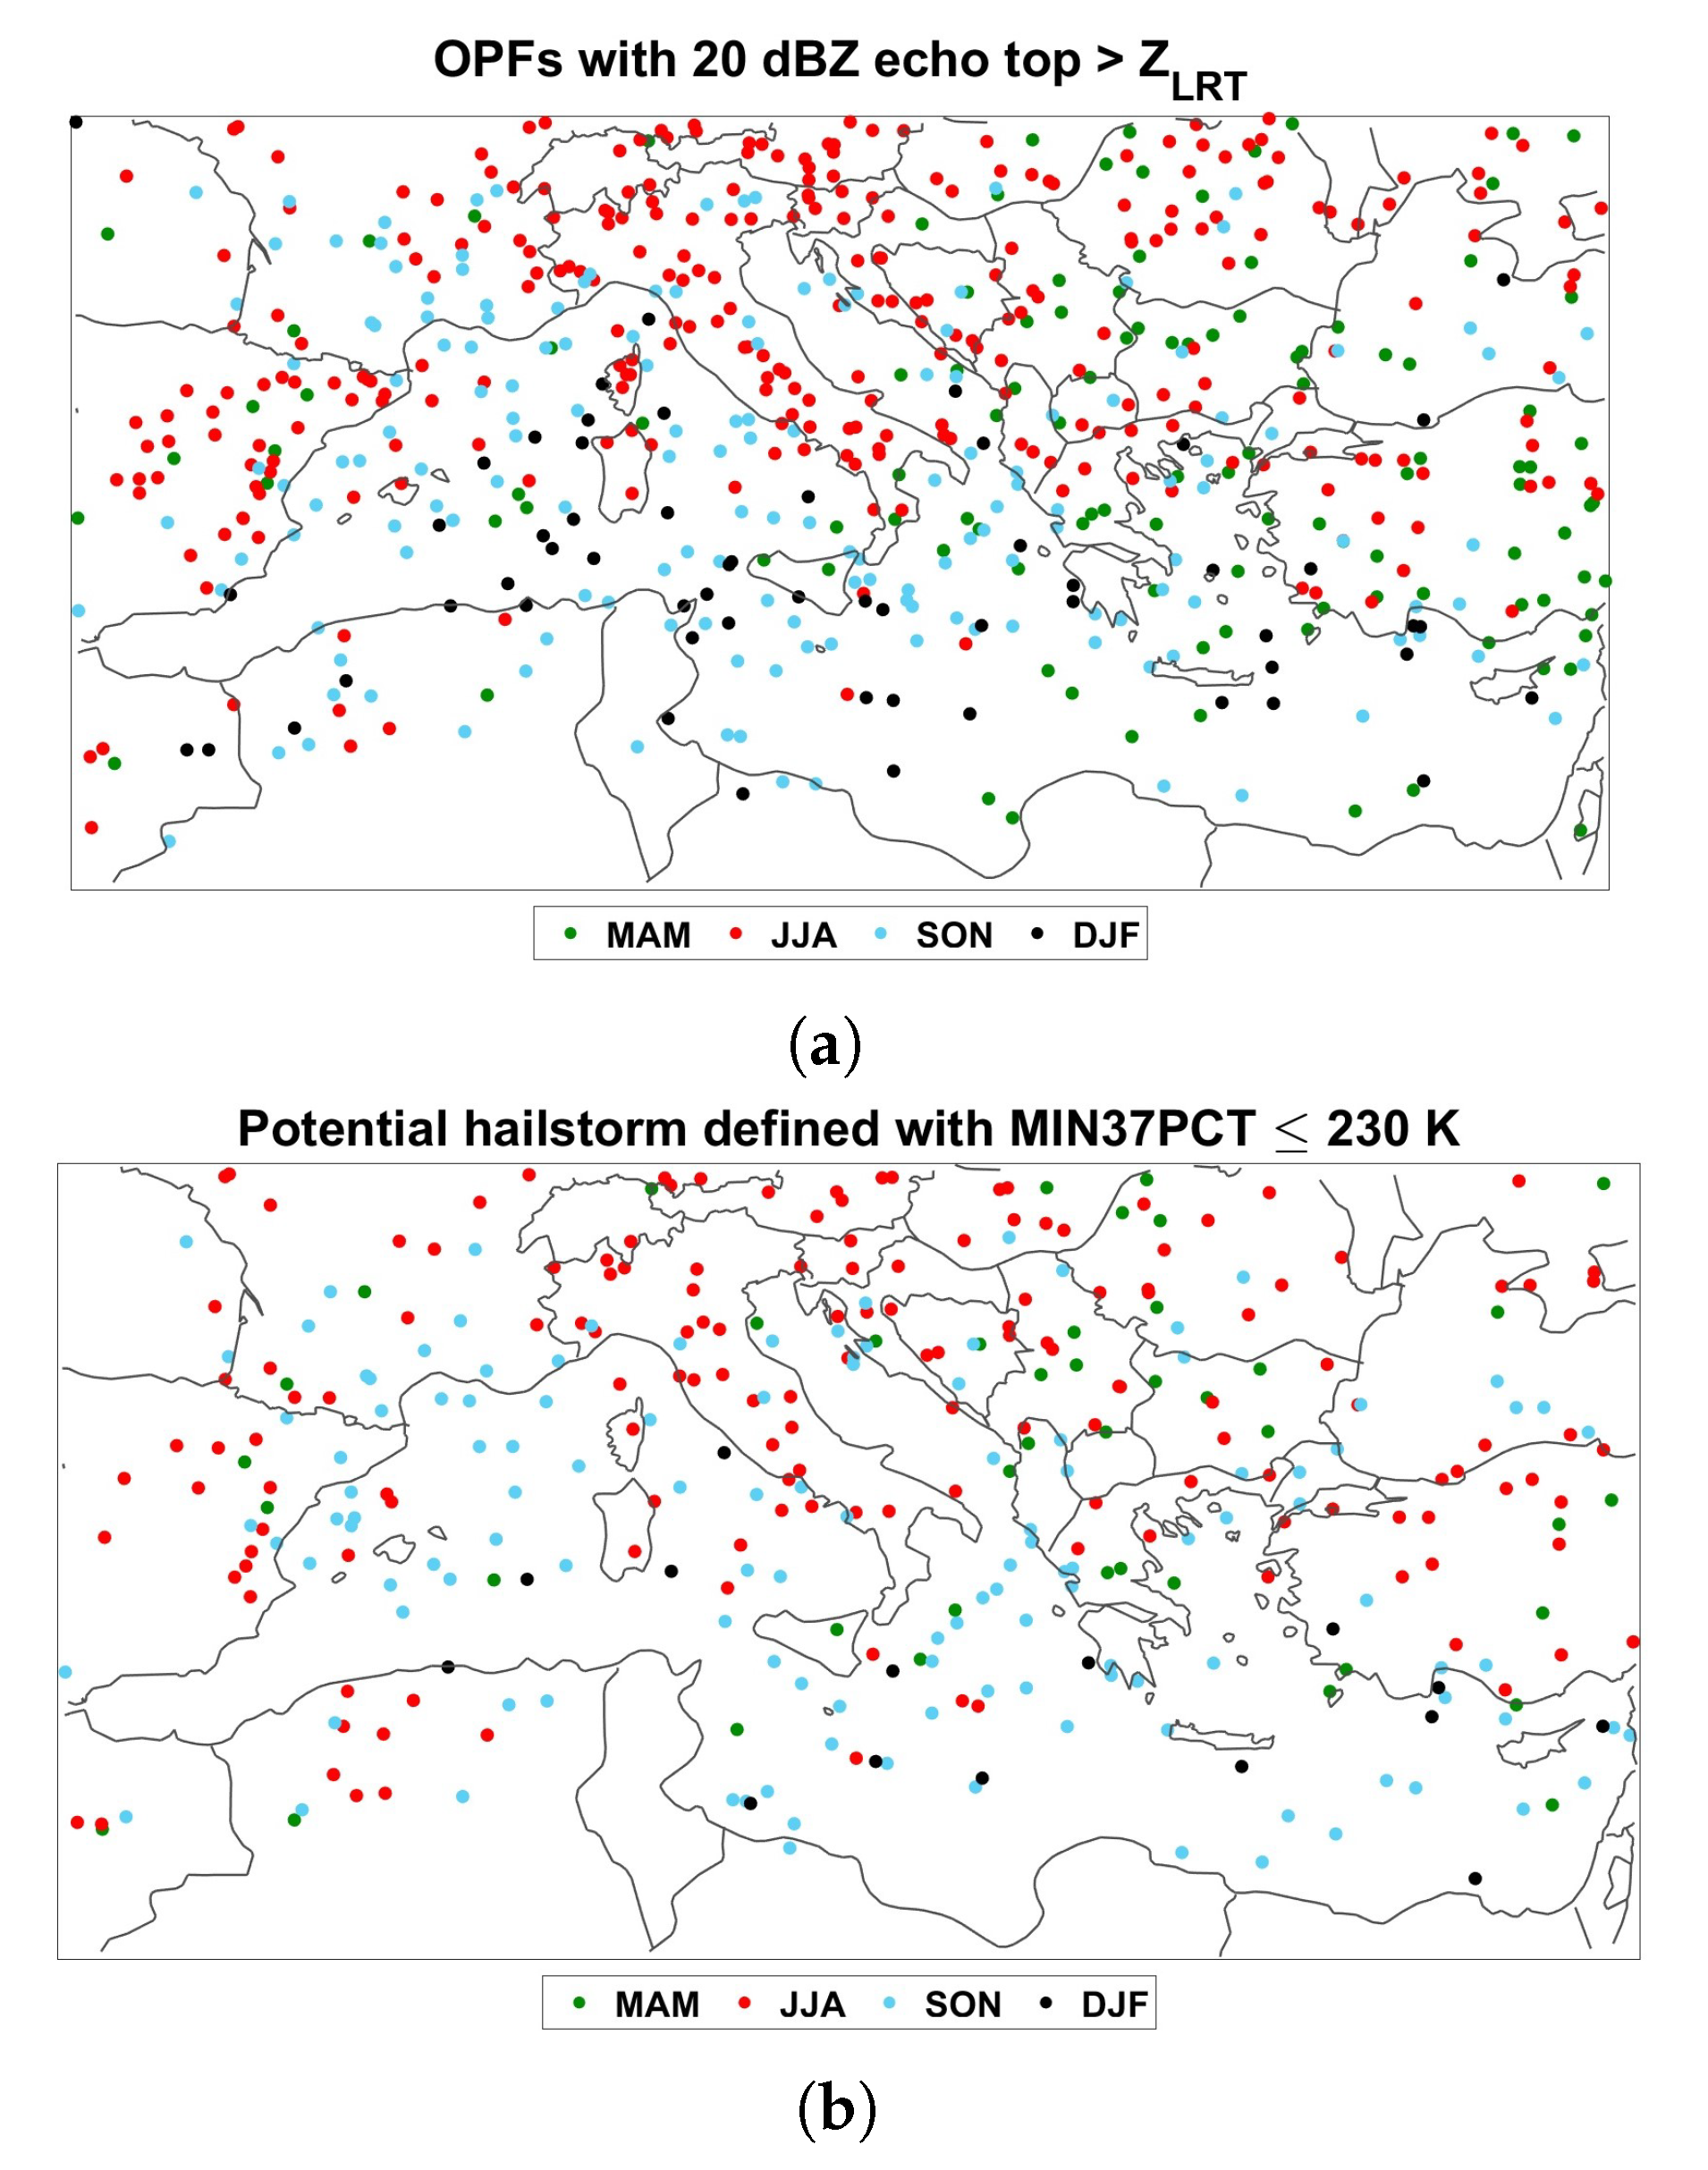
For the second part of the work, focused on the detection of PFs associated with overshooting tops (OPFs) and potential hailstorms, criteria similar to those applied in previous studies are followed [27,28]. In particular, the OPFs are identified as those PFs with the cloud top height (defined by maximum radar echo top heights found for different reflectivity thresholds) higher than the tropopause level (see Section 3.3 for details). For this latter quantity, two definitions have been adopted:
  • the lapse-rate tropopause, based on the WMO definition as the lowest height at which the lapse-rate decreases to 2 C/km or less, with the average lapse-rate between this level and all higher levels within 2 km does not exceed 2 C/km ( Z L R T );
  • the coldest point tropopause, obtained by the height of the coldest point of the temperature profile ( Z C P ).
The temperature profile is provided for each PF in the dataset. It is obtained from spatial and temporal interpolation of the ERA-Interim reanalysis available every 6 h at 0 . 75 horizontal resolution, at 37 pressure levels between 1000 hPa and 1 hPa [41]. In the PF dataset, the temperature profile is reported at 27 levels, between 1000 hPa (0.10 km) and 100 hPa (16.50 km). In accordance with Reference [27], besides the snow-cover filter and the mirror echo filter already described, for OPFs identification only PFs with at least 4 radar contiguous pixels with precipitation rate exceeding 0.1 mm/h at the surface are considered in order to have more significant precipitating events. Then, all those PFs with a MAXHT20 above 17 km and a MIN85PCT above 200 K and with the difference between maximum 15 dBZ and 20 dBZ radar echo top heights greater than 5 km, are excluded (following the idea of Reference [27]). This ensures that the OPFs selection is carried out only for radar reflectivity vertical profile free of spurious effects that could increase false OPFs identification.
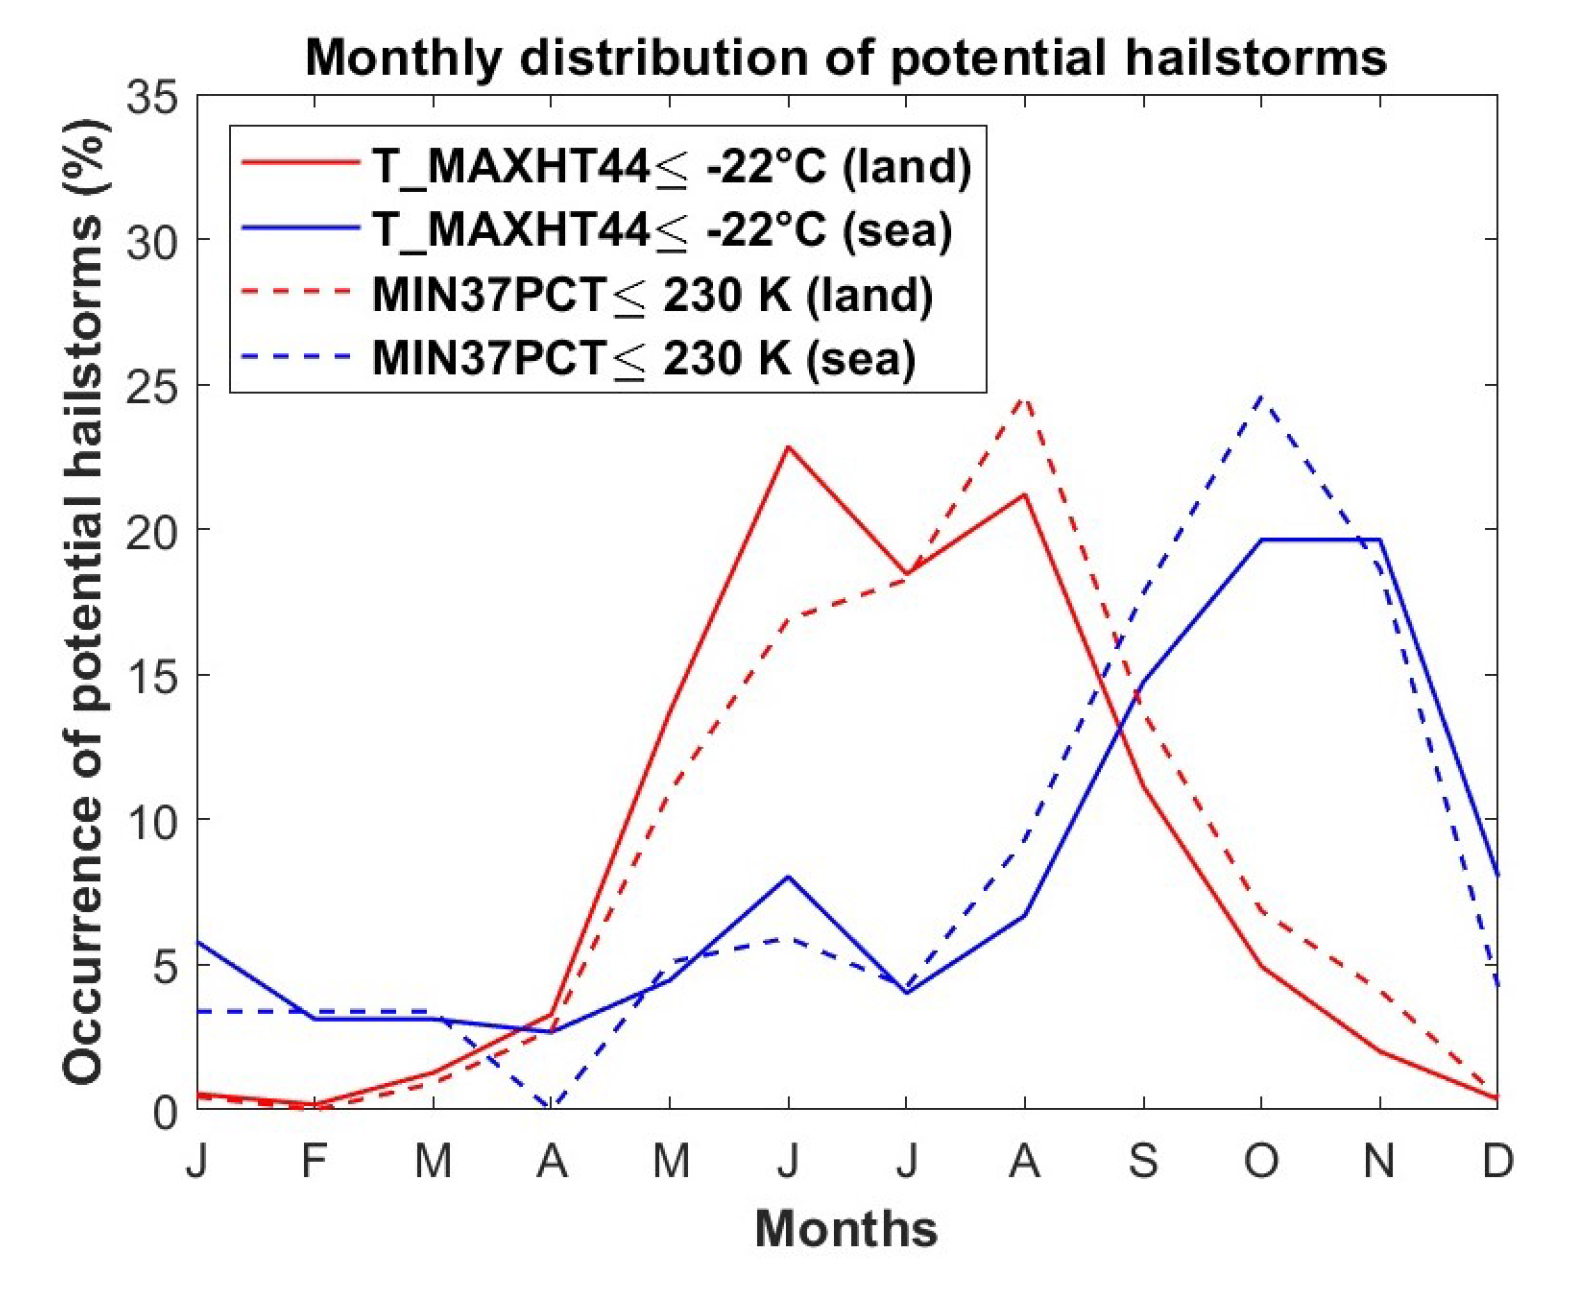
On the other hand, PFs associated with potential hailstorms are detected by applying two different criteria separately, one radar-based and one radiometer-based, following the analysis carried out by Ni et al. [28]. These criteria are associated with:
  • air temperature at the 44 dBZ radar echo top height (indicated as T_MAXHT44) less than or equal to −22 C (DPR-based criterion);
  • a minimum PCT at 37 GHz (MIN37PCT) less than 230 K (GMI-based criterion).
In order to apply the DPR-based criterion, the ERA-Interim temperature vertical profiles are linearly interpolated at 0.5 km intervals, between 0.5 km and 16.50 km. The 44 dBZ radar echo maximum heights in the Ku-band radar reflectivity profile are searched within each PF profile and associated with the corresponding temperature value. As filtering criteria, after the snow-cover filter and after taking only PFs with at least 4 radar contiguous pixels with precipitation rate exceeding 0.1 mm/h at the surface (as done for OPFs), only PFs with surface air temperature >10 C are considered to exclude potential winter snowstorms.

3. Results

3.1. Categorization of PFs with Deep Convection Proxies: Diurnal and Seasonal Distribution

The convective proxies reported in Table 1 are divided taking the top 0.01, 0.1, 1, and 10% values of the distributions. The intensity classes obtained are identified as reported in Table 2. In Figure 3a,b, the geographical distributions of PFs’ intensity classes of MIN37PCT and MAXHT40 parameters, respectively, are reported, with the extremes of each range indicated in the colorbar. It is worth mentioning the presence of several extreme precipitating systems with a MIN37PCT below 162 K (0.01% coldest values, class 1) and some MAXHT40 values reaching and exceeding 9.88 km (0.1% highest values, class 1 and class 2), indicating intense vertical updraft and suspended high-density large ice particles within the convective core.
It is interesting to note how, especially in Figure 3b, there is a tendency for precipitating events with strong convective signatures to occur more over land than over sea, similarly to what observed in the tropics and subtropics [19,26]. However, several PFs belonging to the top 0.01% classes of the two parameters (black dots) are found over sea. It is worth noting that the extreme PFs found with the two criteria do not always coincide.
Figure 4a–d show the distributions of these PFs in summer (June-July-August, JJA) and winter (December-January-February, DJF) on a 2 × 2 grid. In each panel, the top 3 intensity classes of the MIN37PCT or MAXHT40 proxies are considered (i.e., all PFs with the top 1% values for each selected proxy for the whole four year period). The colors represent the number of PFs in each grid box for the four-year period. Differences in the geographical distribution of the most intense PFs within the domain are observed between seasons, in accordance with the seasonal large scale circulation that characterizes the Mediterranean region. More densely populated grid boxes are found during the summer over northern Italy and generally over the Balkan Peninsula and in the areas between northern Spain and southern France. This confirms how the mechanism of deep convection is mainly driven by radiative heating, stronger during the summer season, and by the complex orography in this areas. During the winter, the number of PFs per grid box with the maximum 40 dBZ radar echo top heights >6 km does not exceed 4 (Figure 4d), due to the low energy available for precipitation systems, and because it is quite rare to find the conditions to have strong updrafts, except in few cases of synoptic origins where convection is forced by extra-tropical cyclones.
The number of PFs within each grid box is different when different proxies are considered, since different subsets of elements are selected from the entire dataset. However, the main result is the similarity in the geographical distributions obtained with DPR-based and GMI-based criteria for each considered season.
Deep convective PFs identified with different proxies (both radar-based and radiometer-based) have different behaviors in the diurnal cycle over land and over sea (Figure 5a,b). For each proxy for the 4 years of GPM observations, the number of elements in each hourly bin for land or sea, has been normalized by the total number of elements. Figure 5a,b show a well-defined diurnal cycle for the selected PFs identified over land by all the DPR-based and GMI-based proxies, particularly between 12 and 19 local time. The PFs found over the sea do not show an apparent peak during the day, except for a slight increase of the percentage late at night and early in the morning. The diurnal peak for PFs over land is mainly due to the summer radiative forcing of convection. For this reason, strong differences in the diurnal distributions between land and sea during the summer, and more homogeneous diurnal distributions during the winter, are observed (not shown).

3.2. Multiparameter Analysis

A single parameter (or proxy) is useful to understand the extreme nature of a PF associated with a certain property. However, every PF is unique, due to the different mechanisms involved in its development, and its behavior is better represented by multiple parameters and by the interconnections between them. It is expected that different proxies, associated with different characteristics of deep convection, are related to each other, and that extreme values of one proxy are found for PFs with extreme values of other proxies.
Figure 6 and Figure 7 highlight this aspect. They report the distributions of intensity classes of one parameter as functions of other two proxies. The most extreme classes (or categories) of MIN1838, or of MAXHT40, are associated with PFs with extreme signatures in terms of the minimum PCTs at 37 GHz and 89 GHz, as low as 100 K and 70 K, respectively. This shows how the presence of hail and graupel (indicated by low values of MIN37PCT and MIN85PCT) is usually found in clouds with significant BT depression at higher frequencies, due also to the scattering of the upwelling radation by the more complex and lighter ice particles (snowflakes and aggregates) found in the upper cloud layers. Similarly, extreme values of the 40 dBZ radar echo top height (MAXHT40) (indicating strong updrafts) are found in correspondence with very high values of maximum reflectivity near the surface (MAXNSZ), up to 50/60 dBZ (indicating intense surface precipitation rate), and low 37 GHz PCT values (below 200 K), indicating the presence of hail and suspended large ice particles. Such correspondence is not found for the volumetric precipitation VOLRAIN_KU, in which intensity distribution is reported in Figure 8 as a function of PCTs at 89 GHz and precipitation area, the latter estimated by the number of pixels associated with each PF.
Even the most extreme VOLRAIN_KU class is associated with a wide range of minimum PCT values at 89 GHz, between 60 K and 250 K, showing that deep convection is not always associated with large amounts of instantaneous precipitation. A similar behavior is also basically found for the other intensity categories of VOLRAIN_KU. The precipitation area, of course, is well correlated with the volumetric precipitation (the wider the precipitating area of a PF, the larger the amount of the available volumetric precipitation for the same PF).

3.3. Overshooting Tops and Hailstorms

With the criteria described in Section 2.2, the identification of PFs associated with overshooting tops (OPFs) and hailstorms has been carried out for all the PFs with at least 4 precipitating pixels. The two definitions of tropopause ( Z L R T and Z C P ) for the OPFs, and the two criteria, one radar-based and one radiometer-based, for the hailstorms have been used. A preliminary analysis has evidenced how the use of the Z C P tropopause definition tends to select many PFs with weak scattering signatures (high minimum PCT values at 37 and 89 GHz, not shown). Therefore, only the OPFs detected with the WMO lapse-rate tropopause definition Z L R T are analyzed in detail in this section. Table 3 reports the number of OPFs detected as a function of maximum heights of different radar echo thresholds.
However, our analysis is only focused on OPFs detected with the MAXHT20 proxy, considered as the storm top height [27], since this parameter is strongly related with the most active cloud layers.
Table 4 and Table 5 report the number of potential hailstorms selected with the radar-based and the radiometer-based criterion, respectively. The number of events found over land and over sea are also reported in each table. Since the minimum brightness temperatures or PCTs at 37 GHz and 89 GHz are good proxies for deep convection and presence of graupel/hail in the cloud, the 50th and the 10th percentiles of MIN37PCT and MIN85PCT for each class are reported.
It is worth observing that the number of events found with the DPR-based method is about twice as that found with the GMI-based method, although these look more intense (i.e., associated with lower minimum PCTs). In both cases, the number of events found over sea is almost 50% than those found over land. However, despite their lower number, the potential hailstorms over sea appear more intense (i.e., associated with lower minimum PCTs) than those found over land at the time of the satellite overpass. For both channels the lowest minimum PCT values for the same percentiles are found over sea.
The characteristics of potential hailstorms detected with the GMI-based criterion are analyzed more in detail, given the large number of events with weak scattering signatures (higher minimum PCT values) detected with the DPR-based criterion. The diurnal variability of the percentage of OPFs detected with the Z L R T criterion and the hailstorms detected with GMI-based criterion are reported, respectively, in Figure 9a,b. The plots evidence the same behaviors observed for all the deep convection PFs, with similar diurnal variability over land, with a peak observed in the afternoon, and no significant variability over sea. The noisy trend with large oscillations in the curves are due to the low number of available cases, especially for the hailstorms over the sea.
A similar behavior is found in the monthly distribution of potential hailstorms detected with the two criteria (DPR-based and GMI-based) reported in Figure 10. The trends are similar, with largest percentage of hailstorms (up to 25%) in the summer over land, and in the fall over sea. However, the trends and the intensity of the peaks obtained with the two criteria are not exactly the same. This is due to the lower number of potential hailstorms detected with the radiometer-based criterion, which, at the same time, detects the PFs with stronger convective signatures (e.g., MINPCT37 and MINPCT89). In the fall, the warm sea surface temperature and warm sea/cold air interaction lead to strong atmospheric instability. In the spring, the sea water is cooler, and such instability is generally weaker until mid-summer, when the sea surface temperature rises again due to solar radiation.
The geographical distribution and seasonality of overshooting top events and hailstorms are shown in Figure 11a,b. In addition, in this case, the behavior is similar to what already observed for all deep convection PFs detected using different proxies. Fewer OPFs, mainly located over the southeastern Mediterranean (and almost no hailstorms) are found during the winter. A larger number of both OPFs and hailstorms is observed in spring and fall, almost evenly distributed over land and over sea, while a large number of events is found in the summer mostly over land. These similarities in diurnal and seasonal behaviors can be considered as a sanity check of the procedures and methodologies adopted in the deep convection PF analysis.
Finally, the percentages of the volumetric precipitation associated with the OPFs and hailstorms in each season (normalized to total volumetric precipitation associated with all PFs for each season), are shown in Figure 12a,b. Both types of events contribute to the total precipitation (considering what satellite observes at the time of overpass) mostly during the fall in conjunction with the southward shift of the storms (also triggered over the sea by the thermal air-sea contrast), with similar contributions over land and over sea. Another peak observed in summer, and it is mostly due to the OPFs or hailstorms occurring over land because of the diurnal convective activity that characterizes this season, especially near the mountainous regions. The lowest contribution of these events to the total precipitation is observed in winter, due to the low frequency of such events and, more generally, of convective atmospheric structures, while the contribution is slightly higher in spring (and more significant over land than over sea). Table 6 reports, for each surface type, the percentage of volumetric precipitation associated with OPFs or potential hailstorms in each season, normalized to the total precipitation for all PFs in the same season. In summer, over land 21.4% (18.6%) of the precipitation is due to OPFs (potential hailstorms), while, over sea, their contribution is only around 4%. In autumn, the contribution is around 12% over land and sea. In spring, the OPFs or hailstorm contribution to the total precipitation is larger over land than over sea, while the opposite occurs in the winter.

4. Discussion and Conclusions

The analysis carried out in this work allows highlighting of the characteristics of deep convective systems in the Mediterranean area, based on the unique and unprecedented measurements provided by the GPM-CO active and passive microwave sensors. Despite the availability of a limited number of satellite overpasses and the limited swath size (245 km for the radar-based PF dataset used in this study), the results obtained seem to correspond to the main characteristics of deep convection systems, and, in particular, evidence similarities with previous studies based on GPM-CO measurements at global scale, or in other areas of the world.
The PF categorization based on the intensity of each main convection proxy allows extraction of the precipitation structures that have extreme values for the selected variable. By adopting the categorization based on the top percentages of proxy value distributions (0.01, 0.1, 1, and 10%), the geographical, diurnal, and seasonal analysis is carried out without relying on thresholds obtained from previous studies, with other sensors, or in other areas of the globe (e.g., References [16,19,26]). It is clear that the thresholds found for each category will never be univocal, since they will depend on the distribution itself, being determined a posteriori from the percentiles. The small deviations of the diurnal and seasonal trends of each single property is linked to the diversity of the subsets of the selected PFs, based on the chosen parameters: what is important is not the exact overlap of the trends, but the great similarities of distributions obtained using both radar- and radiometer-based properties.
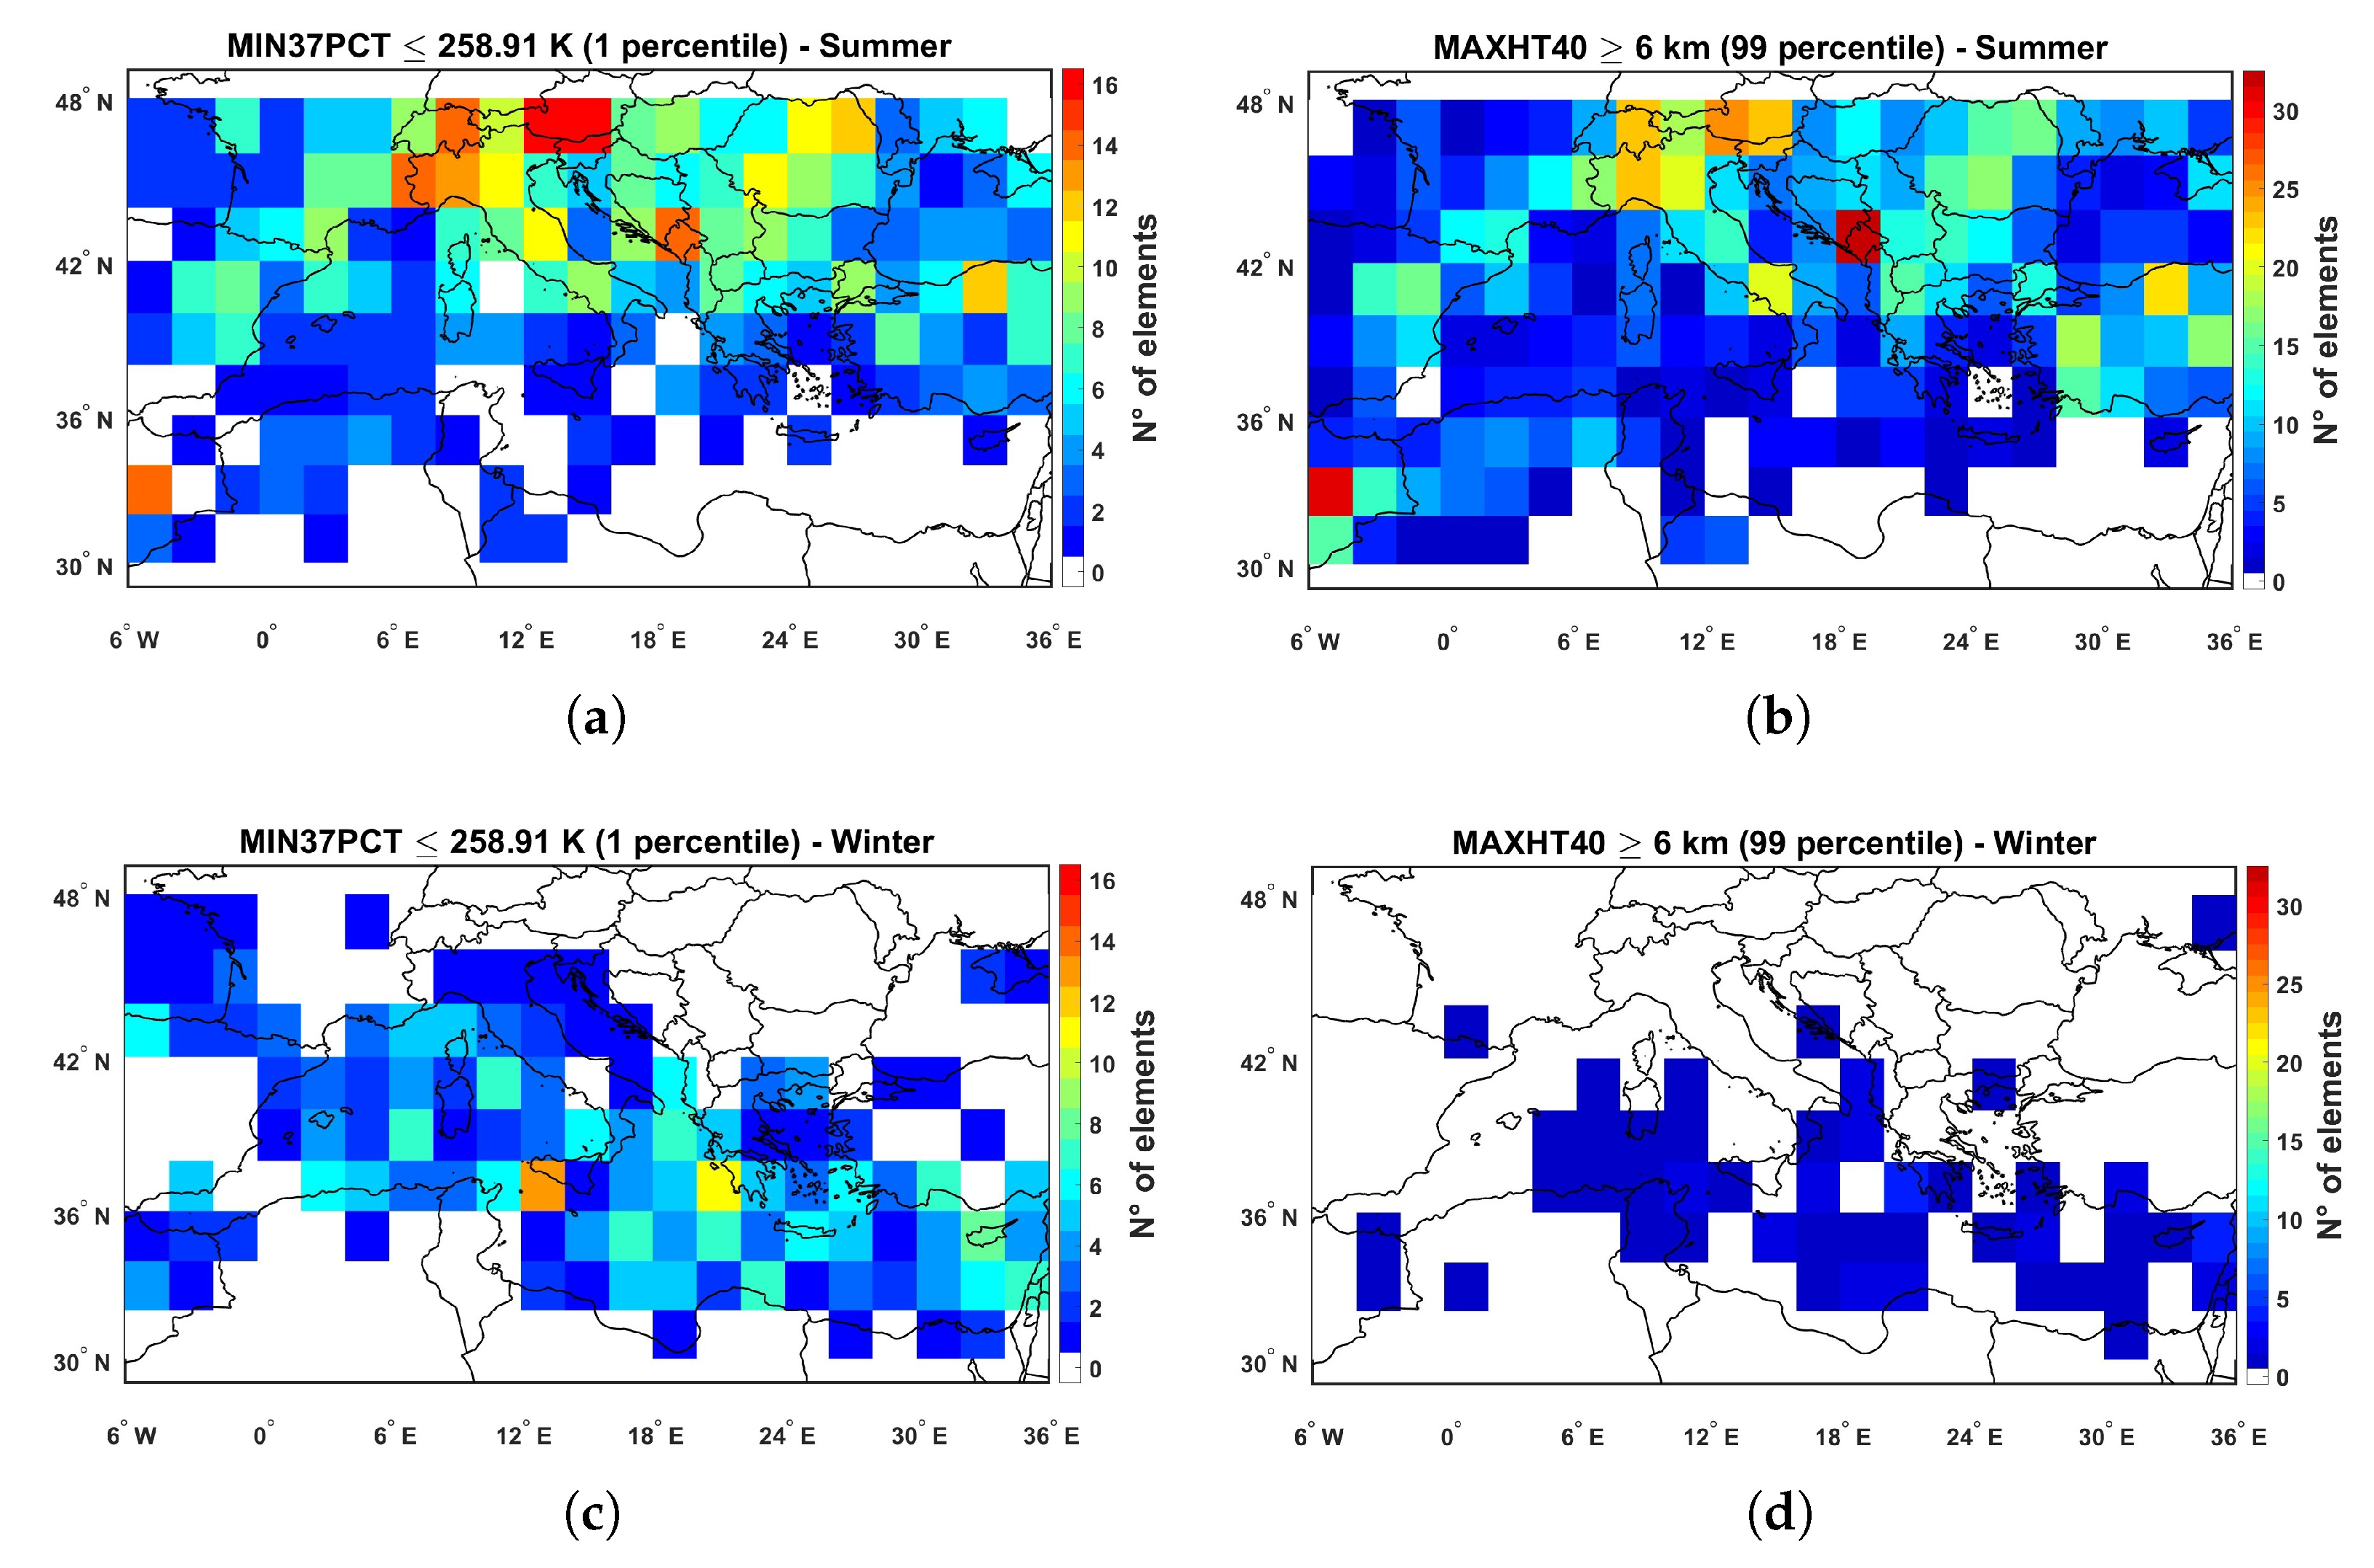
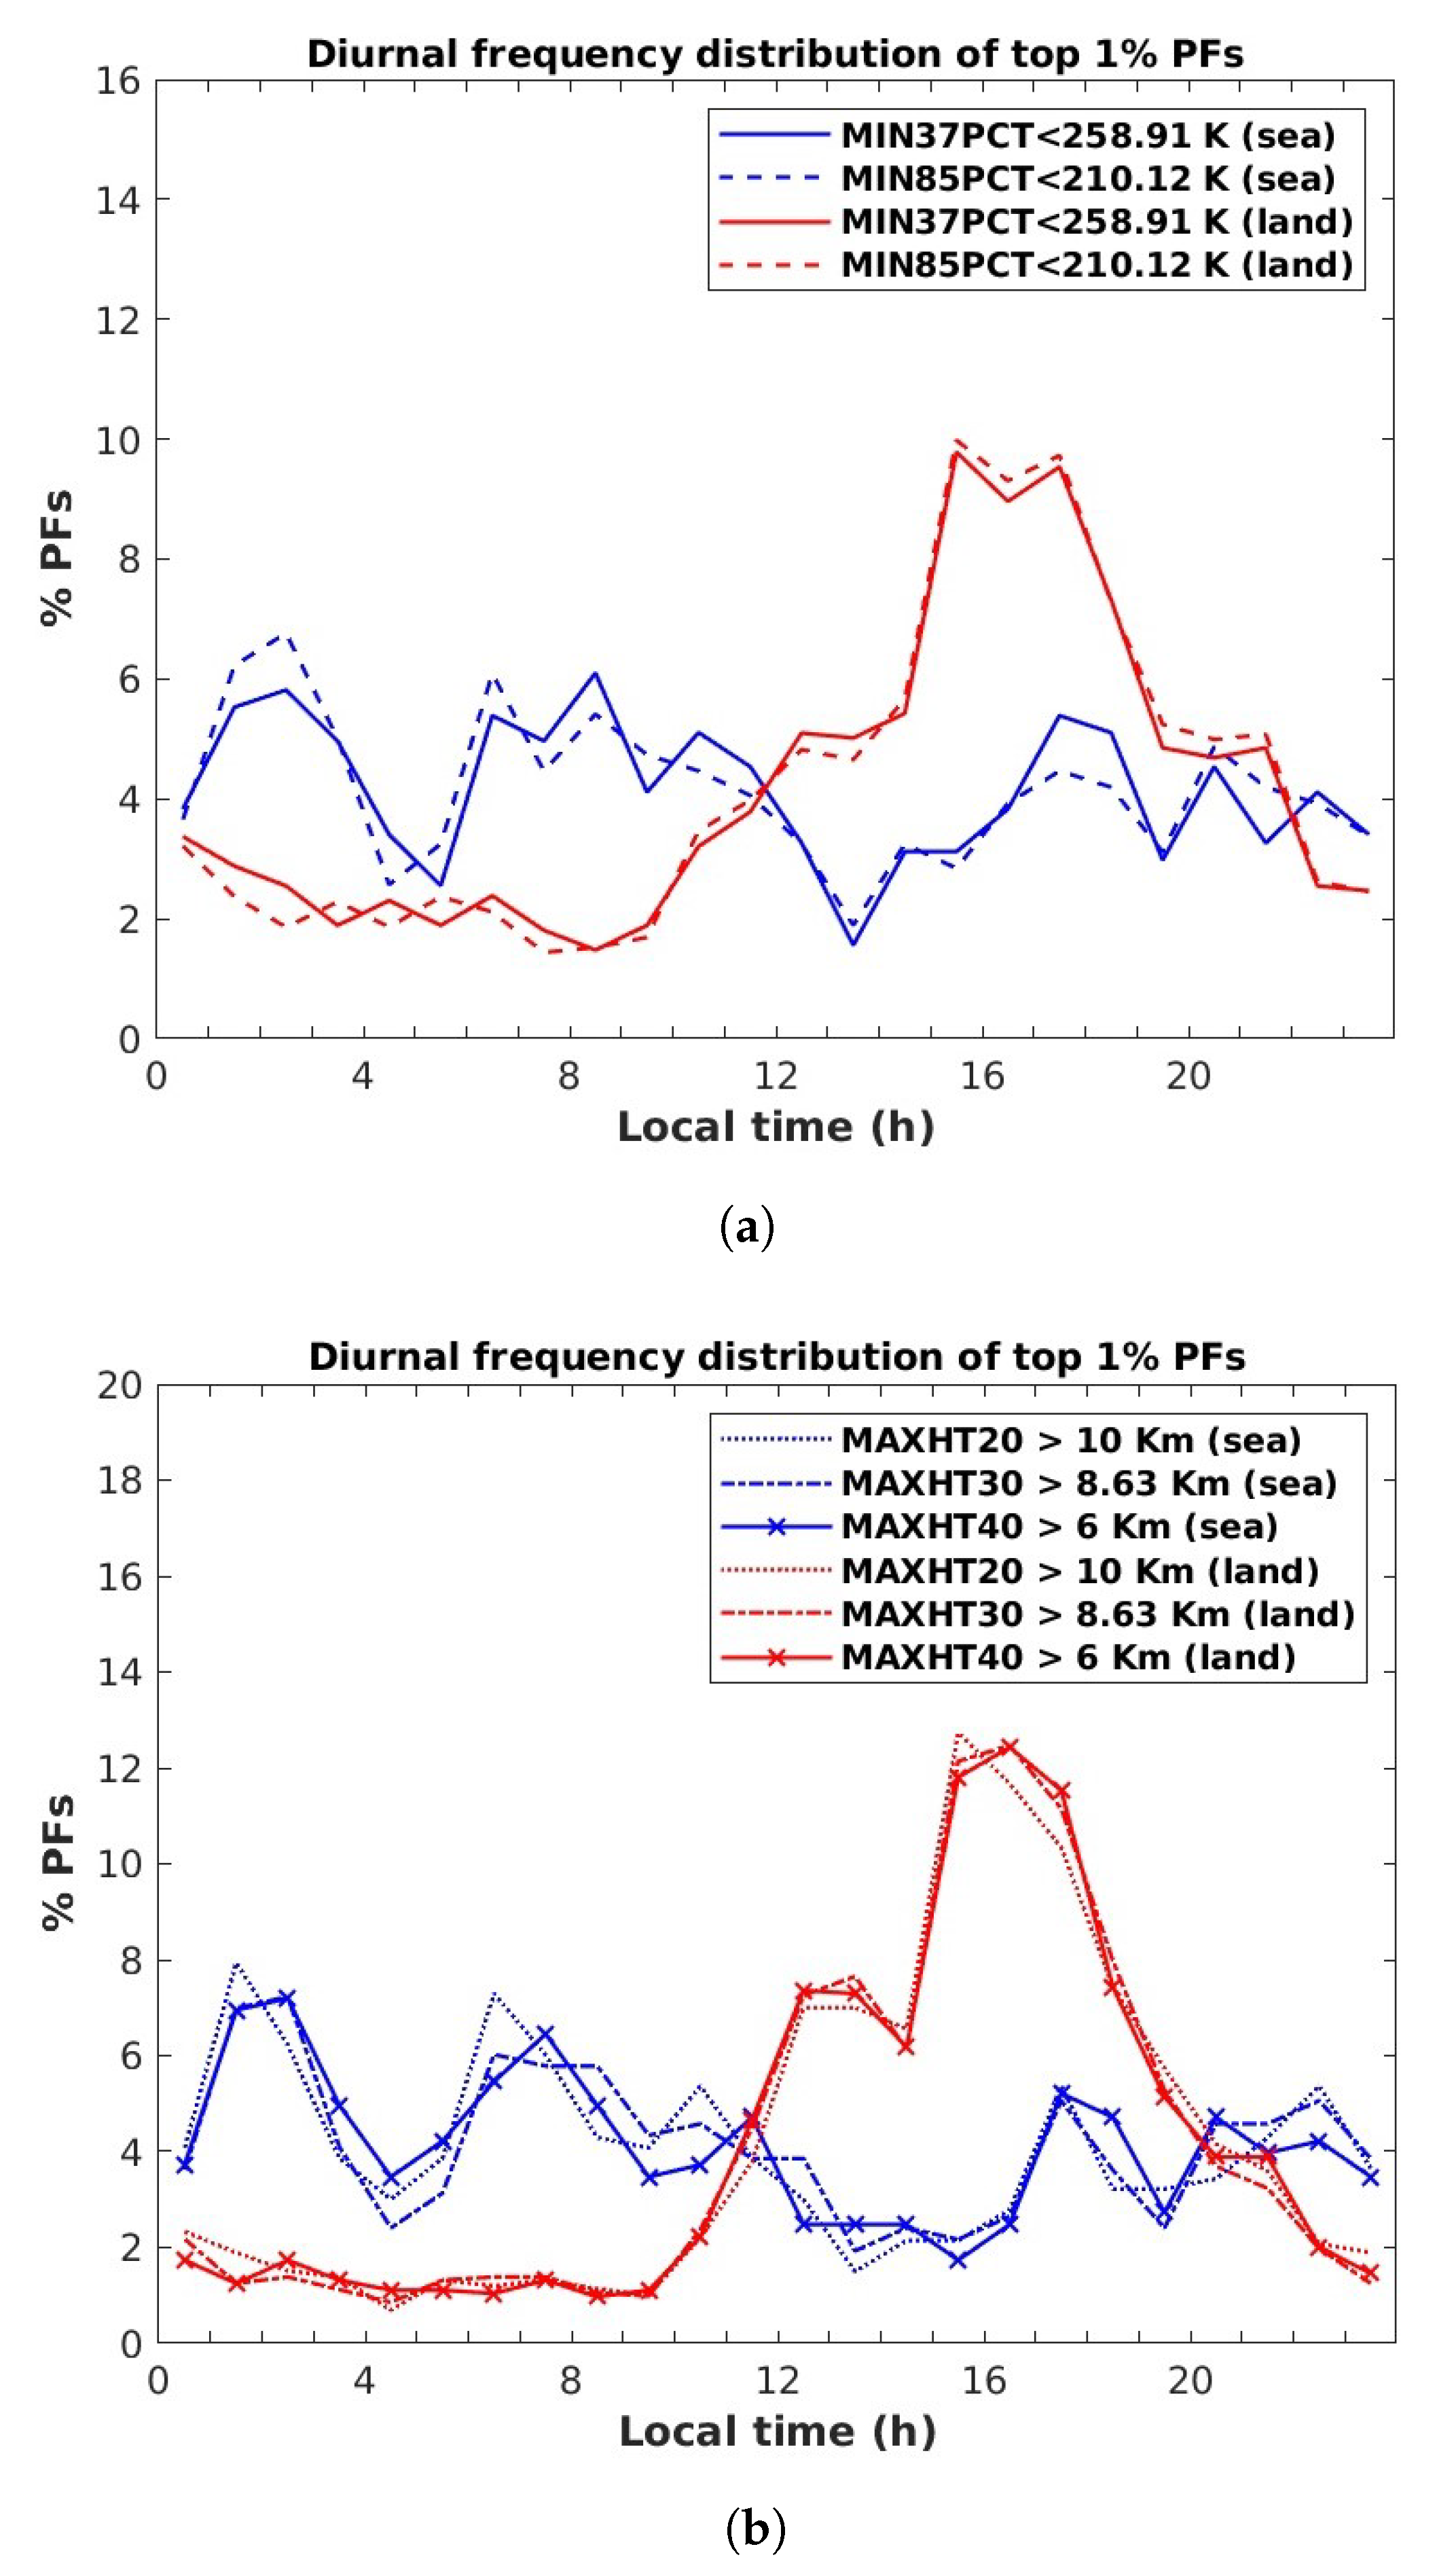
The diurnal variability shows a strong afternoon maximum of PF occurrence over land, where a 10–12% of the PFs belonging to the top intense 1% of each proxy distribution is found between noon and 7 p.m. local time. Weaker diurnal variability is observed over sea, with shallower peaks during the night. The maps of seasonal patterns show clear differences in the geographical distribution of deep convection PFs, pointing out the crucial role that the solar radiation has in affecting the daytime occurrence of intense PFs. Therefore, different origins of severe convection are expected in the cold and in the warm season. Namely, in the fall, severe convection is favored by strong instability induced by the cold air over warm water surface, while, in winter, we expect a direct relationship with the extra-tropical cyclones. The cold air above cool sea water does not lead to a strong instability till late spring when the sea surface temperature has a significant increase. In summer, the trends are a direct consequence of different heat fluxes between the land/sea surface and the atmosphere, due to the greater latent heat capacity of the sea compared to the land surface. The heat flux favors the convective diurnal activity exploiting the destabilization of the air column produced by the orography. It emerges that deep convection follows the general atmospheric circulation during the year, with a general southward shift, that begins in autumn and becomes more visible in winter. Particularly, in winter, the number of PFs found on the basis of different criteria generally decreases substantially for each parameter. It is clear how a key role in the periodic location of severe weather episodes is also played by synoptic conditions linked to the general atmospheric circulation, as well as by the seasonality of solar radiation.
The multiparameter approach allows evaluation of deep convection from different points of view, as well as to underline how, even in the Mediterranean area, extreme scattering signatures, typical of tropical storm structures and observed by TRMM measurements, are found also over the sea. The great variety of atmospheric conditions leads to several combinations of different parameter values that represent various microphysical and dynamical characteristics. Therefore, PFs belonging to a given class based on one proxy are not necessarily the same PFs belonging to same class based on a different proxy. There is also the chance that the number of PFs is not the same in each intensity category because of the specific characteristics associated with each parameter. Therefore, the consistency in the distributions of different proxies used for deep convection detection has been verified, showing that extreme radar echo heights have to necessarily coexist with remarkable low brightness temperature or PCT values. In this context, examples of precipitating systems with maximum 40 dBZ echo heights above 10 km or minimum value of PCT at 89 GHz below 100 K (down to 68 K) are all indicative of strong updraft sustaining high density and larger ice hydrometeors. On the other hand, the multiparameter approach serves as a sanity check to better control spurious effects in the large amount of data available. Cases with extreme maximum radar echo top heights and relatively warm BT values, likely related to mirror echoes (as in Marra et al. [7]), could be misinterpreted if radiometer- and radar-based proxies were not analyzed together.
The results obtained for the detection of overshooting top PFs (OPFs) and potential hailstorms are consistent with what is observed for the most extreme PFs identified with the multiparameter analysis, confirming the soundness of radar-based or radiometer-based criteria used for deep convection detection. The use of radar-based parameters [23,27] for OPFs proves it to be an extremely valid alternative to the more common methods based on infrared and visible measurements (e.g., References [3,42]). Although LEO satellites, such as the GPM-CO, have the disadvantage of not providing frequent repeated measurements for a given area, it has the advantage of providing more robust parameters that can describe many aspects associated with severe convection (e.g., OPFs). The DPR-based OPFs identification is subject to the selection of the reflectivity threshold for echo top height, and to the tropopause definition. In this study, the 20 dBZ threshold (MAXHT20) has been selected for OPFs’ identification, since it allows identification of more likely the maximum altitude of precipitating particles. Furthermore, the tropopause definition is not univocal because it should not be considered as an impenetrable and well-defined thin level of atmosphere, but rather as a transition layer between two different air masses, in which its definition could be associated with different physical parameters. A sensitivity analysis revealed that the WMO lapse rate tropopause definition seems to be the most appropriate for the Mediterranean area, as opposed to Liu and Zipser [23] and Liu and Liu [27], who found similar diurnal OPF behavior for different tropopause definitions, respectively for the tropics and for the entire globe. The analysis on the OPFs shows similarities with the more general deep convection PFs analysis, in terms of geographical distribution, diurnal, and seasonal variability, since these events are indicators of severe weather conditions and deep convection. Some results of this study, concerning the characterization of OPFs, are in agreement with previous studies [23,27,34]. A seasonal migration of occurrences from the land in the summer to the coastal areas and sea in the fall and in the winter is in agreement the analysis by Funatsu et al. [34] obtained by AMSU-B/MHS cross-track scanning radiometer observations for the period of 2005–2008.
The identification of potential hailstorms follows the radar-based and radiometer-based approach adopted by Ni et al. [28], and it has confirmed the value of using the GPM-CO for detecting strong updrafts associated with severe convection. Both methods provide results in agreement with what observed for the most intense PFs, despite the different number of potential hailstorms detected with the two methods: the number of potential hailstorms identified with the radar-based method is about twice the one found with the radiometer-based method. The radiometer-based approach seems to be more suitable to identify potential hailstorms. The low 89 GHz and 37 GHz PCTs, especially over land, respectively below 180 K and 230 K, corresponds to a hail probability that should exceed the 60–80% according to Cecil and Chronis [38]. It is interesting to note that the most extreme PFs associated with potential hail (as well as to OPFs), with a minimum 37 and 89 GHz PCTs below 120 K and 100 K, respectively, are observed over the sea. The analysis of OPFs and potential hailstorms has emphasized how in the selected domain, the fall is the season with most precipitation associated with these events, almost evenly distributed over land and sea, followed by the summer, for which a relevant contribution comes from the deep convection over land, favored by the solar heating. The occurrence of intense convective systems also over the sea is an important aspect that confirms the significance of the use of microwave instruments on board LEO satellites, especially for scientific and operational purposes, as in all those cases where ground-based instruments are not available for severe storm detection.
However, the analysis presented has some limitations that are worth mentioning. First of all, different thresholds and methods lead to a different number and typologies of detected events: further studies are needed to explain and understand which criteria are the most suitable for specific regions. Especially, the radiometer-based methods do not always allow inference of the effect of deep convection at the surface, since the passive microwave signal originates from column-integrated precipitation microphysics and from processes in the middle and upper levels of the deep convective cloud [21]. For example, hailstones can melt prior to reaching the surface (as a matter of fact, the term “potential hailstorm” is used throughout the study). Previous works, such as Cecil [20], Ni et al. [28], and Cecil and Chronis [38], push their analysis further to infer hail size at the surface in probabilistic terms. Indeed, although the main interest is to identify storms with hail at the surface, microwave measurements from space are important to identify consistent signatures of clouds characterized by the presence of hail and large graupel which can be potentially dangerous, as demonstrated by the very recent studies by Laviola et al. [32,33]. Although some severe events reported in the literature or in weather reports have been identified in the most extreme PF classes of the present study, a further step would be a more extensive use of ground-based measurements at weather stations, as done in Ni et al. [28] for the United States. It is also necessary to underline that criteria and empirical relationships derived for a particular region should not be applied a priori everywhere. Generally, for a finer analysis, the results should be scaled based on the regional environmental conditions and typical vertical radar profiles [21], through empirical relationships that would account for the local characteristics of a specific region.
Finally, it is worth reminding that the analysis carried out in this study is conditioned to the GPM-CO temporal and spatial sampling. The results shown are not representative of the actual occurrences during 4 years in the Mediterranean area, but only of the event captured by the GPM-CO radar and radiometer at the time of the overpass. The unique role of the GPM-CO satellite is to make, for the first time, spaceborne precipitation radar measurements available over the mid-latitudes, enabling us to have information related to the vertical structure of precipitating events, together with the precipitation intensity and microphysical structure inferred also by the radiometer measurements. A future goal of this research will be to exploit long data record of GPM-CO measurements and use the DPR as a reference for the GMI-based analysis to define an operational algorithm for deep convection (including OPFs and hailstorms) detection and characterization, optimized for the Mediterranean area. As a further step, the analysis will be extended to all conically scaning radiometers in the LEO satellite constellation to improve the spatial and temporal sampling, as well as to be able to extend the analysis to a longer period, before and beyond the GPM-CO satellite era.

Author Contributions

Conceptualization, D.H. and G.P.; Methodology, D.H.; Dataset creation, C.L.; Software, D.H., D.C., P.S. and L.P.D.; Formal analysis, D.H.; Investigation, D.H.; Discussion and analsyis of results, D.H., G.P., D.C., P.S., L.P.D. and C.L.; Resources, G.P.; writing—original draft preparation, D.H.; writing—review and editing, G.P., D.C., P.S., L.P.D. and C.L.; visualization, D.H. and L.P.D.; supervision, G.P.; project administration, G.P.; funding acquisition, G.P. All authors have read and agreed to the published version of the manuscript.

Funding

This research was partially funded by EUMETSAT Satellite Application Facility for Hydrology and Water Management (H SAF) Third Continuous Development and Operation Phase (CDOP-3), and by the project PON ARS01 00405 OT4CLIMA Sviluppo di tecnologie innovative di Osservazione della Terra per lo studio del Cambiamento Climatico e dei suoi impatti sull’ambiente (Development of Innovative Earth Observation Technologies for the Study of Climate Change and Its Impacts on the Environment), funded by the Italian Ministry of Education, University and Research (MIUR), in the framework of the National Operational Programme (PON), Research and Innovation 2014–2020, Specialization Area Aerospace.

Institutional Review Board Statement

Not applicable.

Informed Consent Statement

Not applicable.

Data Availability Statement

The GPM Precipitation Feature (PF) database was created and is updated by Prof. Chuntao Liu, and it is freely available at http://atmos.tamucc.edu/trmm/data/ (accessed on 26 April 2021).

Acknowledgments

The authors express their sincere gratitude to Anna Cinzia Marra (formerly at CNR-ISAC) for her valuable support and contribution during the study, and to Stefano Federico and Stefano Dietrich (CNR-ISAC) for their suggestions. The PMM Research Program and EUMETSAT are acknowledged for supporting H SAF and GPM collaboration through the approval of the no-cost H SAF-GPM proposal “H SAF and GPM: precipitation algorithm development and validation activity”. The five Reviewers are also acknowledged for their valuable comments and suggestions.

Conflicts of Interest

The authors declare no conflict of interest. The funders had no role in the design of the study; in the collection, analyses, or interpretation of data; in the writing of the manuscript, or in the decision to publish the results.

References

  1. Carrió, D.; Homar, V.; Jansa, A.; Romero, R.; Picornell, M. Tropicalization process of the 7 November 2014 Mediterranean cyclone: Numerical sensitivity study. Atmos. Res. 2017, 197, 300–312. [Google Scholar] [CrossRef] [Green Version]
  2. Giorgi, F. Climate change Hot-Spots. Geophys. Res. Let 2006. [Google Scholar] [CrossRef]
  3. Bedka, K.; Brunner, J.; Dworak, R.; Feltz, W.; Otkin, J.; Greenwald, T. Objective Satellite-Based Detection of Overshooting Tops Using Infrared Window Channel Brightness Temperature Gradients. J. Appl. Meteorol. Climatol. 2010, 49, 181–202. [Google Scholar] [CrossRef]
  4. Homeyer, C.R. Formation of the Enhanced-V Infrared Cloud-Top Feature from High-Resolution Three-Dimensional Radar Observations. J. Atmos. Sci. 2014, 71, 332–348. [Google Scholar] [CrossRef]
  5. Panegrossi, G.; Marra, A.; Sanò, P.; Baldini, L.; Casella, D.; Porcu, F. Heavy Precipitation Systems in the Mediterranean Area: The Role of GPM; Springer: Heidelberg/Berlin, Germany, 2020; pp. 819–841. [Google Scholar] [CrossRef]
  6. Manzato, A.; Davolio, S.; Miglietta, M.M.; Pucillo, A.; Setvák, M. 12 September 2012: A supercell outbreak in NE Italy? Atmos. Res. 2015, 153, 98–118. [Google Scholar] [CrossRef]
  7. Marra, A.; Porcù, F.; Baldini, L.; Petracca, M.; Casella, D.; Dietrich, S.; Mugnai, A.; Sanò, P.; Vulpiani, G.; Panegrossi, G. Observational analysis of an exceptionally intense hailstorm over the Mediterranean area: Role of the GPM Core Observatory. Atmos. Res. 2017, 192, 72–90. [Google Scholar] [CrossRef]
  8. Miglietta, M.M.; Mazon, J.; Rotunno, R. Numerical Simulations of a Tornadic Supercell over the Mediterranean. Weather Forecast. 2017, 32, 1209–1226. [Google Scholar] [CrossRef]
  9. Miglietta, M.M.; Rotunno, R. An EF3 Multivortex Tornado over the Ionian Region: Is It Time for a Dedicated Warning System over Italy? Bull. Am. Meteorol. Soc. 2016, 97, 337–344. [Google Scholar] [CrossRef]
  10. Markowski, P.; Richardson, Y. Mesoscale Meteorology in Midlatitudes; John Wiley & Sons Ltd.: Chichester, UK, 2011; Volume 2. [Google Scholar]
  11. Formentini, G. Temporali e Tornado; Alpha Test: Milano, Italy, 2009. [Google Scholar]
  12. Mugnai, A.; Cooper, H.J.; Smith, E.A.; Tripoli, G.J. Simulation of Microwave Brightness Temperatures of an Evolving Hailstorm at SSM/I Frequencies. Bull. Am. Meteorol. Soc. 1990, 71, 2–13. [Google Scholar] [CrossRef] [Green Version]
  13. Panegrossi, G.; Dietrich, S.; Marzano, F.S.; Mugnai, A.; Smith, E.A.; Xiang, X.; Tripoli, G.J.; Wang, P.K.; Baptista, J.P.V.P. Use of Cloud Model Microphysics for Passive Microwave-Based Precipitation Retrieval: Significance of Consistency between Model and Measurement Manifolds. J. Atmos. Sci. 1998, 55, 1644–1673. [Google Scholar] [CrossRef]
  14. Smith, E.A.; Cooper, H.J.; Xiang, X.; Mugnai, A.; Tripoli, G.J. Foundations for Statistical-Physical Precipitation Retrieval from Passive Microwave Satellite Measurements. Part I: Brightness-Temperature Properties of a Time-dependent Cloud-Radiation Model. J. Appl. Meteorol. Climatol. 1992, 31, 506–531. [Google Scholar] [CrossRef] [Green Version]
  15. Cecil, D.J. Relating Passive 37-GHz Scattering to Radar Profiles in Strong Convection. J. Appl. Meteorol. Climatol. 2011, 50, 233–240. [Google Scholar] [CrossRef]
  16. Cecil, D.J.; Goodman, S.J.; Boccippio, D.J.; Zipser, E.J.; Nesbitt, S.W. Three Years of TRMM Precipitation Features. Part I: Radar, Radiometric, and Lightning Characteristics. Mon. Weather Rev. 2005, 133, 543–566. [Google Scholar] [CrossRef] [Green Version]
  17. Liu, C.; Cecil, D.; Zipser, E.; Kronfeld, K.; Robertson, R. Relation between lightning flash rate and radar reflectivity vertical structure in thunderstorms over the tropics and subtropics. J. Geophys. Res. Atmos. 2012, 117, 6212. [Google Scholar] [CrossRef] [Green Version]
  18. Nesbitt, S.W.; Zipser, E.J.; Cecil, D.J. A Census of Precipitation Features in the Tropics Using TRMM: Radar, Ice Scattering, and Lightning Observations. J. Clim. 2000, 13, 4087–4106. [Google Scholar] [CrossRef] [Green Version]
  19. Zipser, E.J.; Cecil, D.J.; Liu, C.; Nesbitt, S.W.; Yorty, D.P. Where are the most intense thunderstorms on Earth? Bull. Am. Meteorol. Soc. 2006, 87, 1057–1072. [Google Scholar] [CrossRef] [Green Version]
  20. Cecil, D.J. Passive Microwave Brightness Temperatures as Proxies for Hailstorms. J. Appl. Meteorol. Climatol. 2009, 48, 1281–1286. [Google Scholar] [CrossRef]
  21. Cecil, D.J.; Blankenship, C.B. Toward a Global Climatology of Severe Hailstorms as Estimated by Satellite Passive Microwave Imagers. J. Clim. 2012, 25, 687–703. [Google Scholar] [CrossRef]
  22. Ferraro, R.; Beauchamp, J.; Cecil, D.; Heymsfield, G. A prototype hail detection algorithm and hail climatology developed with the advanced microwave sounding unit (AMSU). Atmos. Res. 2014, 163. [Google Scholar] [CrossRef] [Green Version]
  23. Liu, C.; Zipser, E. Global distribution of convection penetrating the tropical tropopause. J. Geophys. Res. 2005, 110. [Google Scholar] [CrossRef] [Green Version]
  24. Mroz, K.; Battaglia, A.; Lang, T.J.; Cecil, D.J.; Tanelli, S.; Tridon, F. Hail-detection algorithm for the GPM Core Observatory satellite sensors. J. Appl. Meteorol. Climatol. 2017, 56, 1939–1957. [Google Scholar] [CrossRef] [Green Version]
  25. Bang, S.D.; Cecil, D.J. Testing Passive Microwave-Based Hail Retrievals Using GPM DPR Ku-Band Radar. J. Appl. Meteorol. Climatol. 2021, 60, 255–271. [Google Scholar] [CrossRef]
  26. Liu, C.; Zipser, E.J. The global distribution of largest, deepest, and most intense precipitation systems. Geophys. Res. Lett. 2015, 42, 3591–3595. [Google Scholar] [CrossRef] [Green Version]
  27. Liu, N.; Liu, C. Global distribution of deep convection reaching tropopause in 1 year GPM observations. J. Geophys. Res. Atmos. 2016, 121. [Google Scholar] [CrossRef] [Green Version]
  28. Ni, X.; Liu, C.; Cecil, D.J.; Zhang, Q. On the Detection of Hail Using Satellite Passive Microwave Radiometers and Precipitation Radar. J. Appl. Meteorol. Climatol. 2017, 56, 2693–2709. [Google Scholar] [CrossRef] [Green Version]
  29. Hou, A.Y.; Kakar, R.K.; Neeck, S.; Azarbarzin, A.A.; Kummerow, C.D.; Kojima, M.; Oki, R.; Nakamura, K.; Iguchi, T. The Global Precipitation Measurement Mission. Bull. Am. Meteorol. Soc. 2014, 95, 701–722. [Google Scholar] [CrossRef]
  30. Skofronick-Jackson, G.; Petersen, W.A.; Berg, W.; Kidd, C.; Stocker, E.F.; Kirschbaum, D.B.; Kakar, R.; Braun, S.A.; Huffman, G.J.; Iguchi, T.; et al. The Global Precipitation Measurement (GPM) Mission for Science and Society. Bull. Am. Meteorol. Soc. 2017, 98, 1679–1695. [Google Scholar] [CrossRef] [PubMed]
  31. Bang, S.D.; Cecil, D.J. Constructing a Multifrequency Passive Microwave Hail Retrieval and Climatology in the GPM Domain. J. Appl. Meteorol. Climatol. 2019, 58, 1889–1904. [Google Scholar] [CrossRef]
  32. Laviola, S.; Levizzani, V.; Ferraro, R.R.; Beauchamp, J. Hailstorm Detection by Satellite Microwave Radiometers. Remote Sens. 2020, 12, 621. [Google Scholar] [CrossRef] [Green Version]
  33. Laviola, S.; Monte, G.; Levizzani, V.; Ferraro, R.R.; Beauchamp, J. A New Method for Hail Detection from the GPM Constellation: A Prospect for a Global Hailstorm Climatology. Remote Sens. 2020, 12, 3553. [Google Scholar] [CrossRef]
  34. Funatsu, B.M.; Rysman, J.F.; Claud, C.; Chaboureau, J.P. Deep convective clouds distribution over the Mediterranean region from AMSU-B/MHS observations. Atmos. Res. 2018, 207, 122–135. [Google Scholar] [CrossRef]
  35. Marra, A.C.; Federico, S.; Montopoli, M.; Avolio, E.; Baldini, L.; Casella, D.; D’Adderio, L.P.; Dietrich, S.; Sanò, P.; Torcasio, R.C.; et al. The Precipitation Structure of the Mediterranean Tropical-Like Cyclone Numa: Analysis of GPM Observations and Numerical Weather Prediction Model Simulations. Remote Sens. 2019, 11, 1690. [Google Scholar] [CrossRef] [Green Version]
  36. Draper, D.W.; Newell, D.A.; Wentz, F.J.; Krimchansky, S.; Skofronick-Jackson, G.M. The global precipitation measurement (GPM) microwave imager (GMI): Instrument overview and early on-orbit performance. IEEE J. Sel. Top. Appl. Earth Obs. Remote Sens. 2015, 8, 3452–3462. [Google Scholar] [CrossRef]
  37. Liu, C. GPM Precipitation Feature Database. Technical Report. 2016, p. 15. Available online: http://atmos.tamucc.edu/trmm/data/document/ (accessed on 26 April 2021).
  38. Cecil, D.J.; Chronis, T. Polarization-Corrected Temperatures for 10-, 19-, 37-, and 89-GHz Passive Microwave Frequencies. J. Appl. Meteorol. Climatol. 2018, 57, 2249–2265. [Google Scholar] [CrossRef]
  39. Spencer, R.W.; Goodman, H.M.; Hood, R.E. Precipitation Retrieval over Land and Ocean with the SSM/I: Identification and Characteristics of the Scattering Signal. J. Atmos. Ocean. Technol. 1989, 6, 254–273. [Google Scholar] [CrossRef] [Green Version]
  40. Toracinta, E.R.; Cecil, D.J.; Zipser, E.J.; Nesbitt, S.W. Radar, Passive Microwave, and Lightning Characteristics of Precipitating Systems in the Tropics. Mon. Weather Rev. 2002, 130, 802–824. [Google Scholar] [CrossRef]
  41. Berrisford, P.; Dee, D.; Poli, P.; Brugge, R.; Fielding, M.; Fuentes, M.; Kållberg, P.; Kobayashi, S.; Uppala, S.; Simmons, A. The ERA-Interim Archive Version 2.0; ECMWF: Shinfield Park, UK, 2011; p. 23. [Google Scholar]
  42. Proud, S. Analysis of overshooting top detections by Meteosat Second Generation: A 5-year dataset: Overshooting Top Detection with SEVIRI. Q. J. R. Meteorol. Soc. 2014, 141. [Google Scholar] [CrossRef]
Figure 1. Maps (in N Latitude and E Longitude coordinates) of Polarization Corrected Temperature (PCT) at 37 GHz (a) and 89 GHz (b), and Brightness Temperature (BT) at 166 GHz (V polarization) (c) for the MCS of 20 September 2014 over the Adriatic Sea. The black line indicates the position of the vertical cross-section shown in Figure 2. The colorbar refers to the PCT and BT values.
Remotesensing 13 01685 g001
Figure 2. Vertical section (position is indicated in Figure 1a–c) of DPR cross-track Ku-band measured reflectivity and GMI brightness temperatures along the section (colored solid and dashed curves) for the MCS of 20 September 2014 over the Adriatic Sea. The colorbar refers to the measured reflectivity values (in dBZ), while the right-hand side y-axis reports the brightness temperature values (in K). The legend refers to the GMI channels shown in the figure.
Remotesensing 13 01685 g002
Figure 3. Location and intensity categories of deep convection PFs identified according to the minimum PCT at 37 GHz (MINPCT37) (a) and to the 40 dBZ echo maximum height (MAXHT40) (b). For each category, the range of MINPCT37 and MAXHT40 values and the corresponding top percentages are reported in the colorbars.
Remotesensing 13 01685 g003
Figure 4. Maps on a 2 × 2 grid of the distribution of deep convection PFs belonging to the three most intense categories based on the minimum PCT at 37 GHz (MIN37PCT) (a,c) and on the 40 dBZ echo top height (MAXHT40) (b,d) for summer (top panels) and winter (bottom panels) (4-year analysis). The colorbar refers to number of PFs in each grid box.
Remotesensing 13 01685 g004
Figure 5. Diurnal distribution for the top 1% PFs for radiometer-based criteria MIN37PCT and MIN85PCT parameters in (a), and for radar-based criteria MAXHT20, MAXHT30, and MAXHT40 parameters in (b). For each criterion, the percentage frequencies reported on the y-axis is computed as the ratio between the number of PFs identified in each 1-h bin (over land or over sea) and the total number of PFs for each surface type.
Remotesensing 13 01685 g005
Figure 6. Distribution of the minimum BT at 183.31 ± 7 GHz (MIN1838) intensity classes as a function of the minimum PCT at 37 GHz and at 89 GHz (MIN37PCT and MIN85PCT).
Remotesensing 13 01685 g006
Figure 7. Distribution of 40 dBZ echo top height (MAXHT40) intensity classes as a function of the minimum PCT at 37 GHz (MIN37PCT) and the maximum near-surface reflectivity (MAXNSZ).
Remotesensing 13 01685 g007
Figure 8. Distribution of volumetric precipitation (VOLRAIN_KU) intensity classes as a function of the minimum PCT at 89 GHz (MIN85PCT) and the PF precipitation area.
Remotesensing 13 01685 g008
Figure 9. Diurnal variability of OPFs based on the maximum radar echo top height at 20 dBZ (MAXHT20) and Z L R T tropopause definition (a) and of potential hailstorms based on radiometer-based criterion (b) over land and over sea. The percentage is computed as the ratio between the number of OPFs or hailstorms detected in each 1-h bin (over land or over sea) and the total number of OPFs or hailstorms for each surface type.
Remotesensing 13 01685 g009
Figure 10. Monthly distribution of hailstorm events identified with the radar-based and radiometer-based criteria over land and sea. For each criterion, the percentage is computed as the ratio between the number of hailstorms detected in each month (over land or over sea) and the total number of hailstorms detected for each surface type.
Remotesensing 13 01685 g010
Figure 11. Seasonal distribution of OPFs obtained with the DPR-based method ( Z L R T tropopause definition) (a) and potential hailstorms obtained with the GMI-based method (based on MIN37PCT) (b), over the study area
Remotesensing 13 01685 g011
Figure 12. Four-year analysis of the seasonal percentage of volumetric precipitation associated with observed OPFs (a) and hailstorms (b) normalized to the total volumetric precipitation of all PFs in each season. The percentages are indicated above each histogram column.
Remotesensing 13 01685 g012
Table 1. Parameters associated with each PF in the V05 dataset. The first column reports the name of the parameter as it appears in the dataset, and the second column gives the description of each parameter referred to GMI and DPR Ku-band radar. In bold are the GMI-based parameters, and in italic are the DPR-based parameters used in the study.
NameParameter Description
ORBITOrbit number
YEARYear
MONTHMonth
DAYDay
HOURHour (UTC)
LATGeographical center latitude (degree)
LONGeographical center longitude (degree)
NPIXELSNumber of radar pixels with precipitation
LANDOCEAN0: over ocean, 1: over land
MIN85PCTMinimum 89 GHz polarization corrected temperature (K)
MIN37PCTMinimum 37 GHz polarization corrected temperature (K)
MIN1833Minimum 183.31 ± 3 GHz BT (K)
MIN1838Minimum 183.31 ± 7 GHz BT (K)
MIN165HMinimum 166 GHz H polarization BT (K)
MIN165VMinimum 166 GHz V polarization BT (K)
VOLRAIN_KUVolumetric precipitation from Ku (Km 2 mm/hr)
MAXNSZMaximum near surface reflectivity (dBZ)
MAXDBZProfile of maximum reflectivity (dBZ)
MAXNSPRECIPMaximum near surface precipitation rate (mm/hr)
MAXHTMaximum height of detectable radar echo (Km)
MAXHT15Maximum height with 15 dBZ echo (Km)
MAXHT20Maximum height with 20 dBZ echo (Km)
MAXHT30Maximum height with 30 dBZ echo (Km)
MAXHT40Maximum height with 40 dBZ echo (Km)
Table 2. Intensity classes defined for each parameter distribution. The colors used to identify each class in Figure 3a,b are also listed.
ClassInterval of ValuesColor
1top intense 0.01% valuesblack
2top intense 0.1% values not belonging to the top intense 0.01%red
3top intense 1% values not belonging to the top intense 0.1%blue
4top intense 10% values not belonging to the top intense 1%green
5values not belonging to the top intense 10%grey
Table 3. Population of overshooting top events detected using the 3 cloud top height definitions and the Z L R T tropopause level.
MAXHTMAXHT15MAXHT20
948649621
Table 4. Total number of potential hailstorms (over land and over sea) detected with the radar-based thresholds. The 50th and 10th percentiles of MIN37PCT and MIN85PCT distributions for each class are also reported.
Over SeaOver LandAll Events
N of events with
T_MAXHT44 22 °C224547771
50th percentile of
MIN37PCT/MIN85PCT (K)234.23/158.66240.39/178.40238.69/173.56
10th percentile of
MIN37PCT/MIN85PCT (K)180.67/103.22196.91/122.39193.22/116.02
Table 5. Same as in Table 4, but for the radiometer-based criterion.
Over SeaOver LandAll Events
N of events with
T_MAXHT44 22 °C118219337
50th percentile of
MIN37PCT/MIN85PCT (K)205.69/124.05213.51/137.52212.20/134.39
10th percentile of
MIN37PCT/MIN85PCT (K)167.74/91.27178.29/104.23172.84/97.04
Table 6. Four-year analysis of the seasonal percentage of volumetric precipitation associated with observed OPFs and potential hailstorms detected over land or over sea, normalized to the total volumetric precipitation of all PFs in each season detected over land or over sea.
OPFsSpringSummerAutumnWinter
Land7.6%21.4%12.1%1.7%
Sea3.6%4.0%11.4%5.6%
HailstormsSpringSummerAutumnWinter
Land4.5%18.6%12.0%1.1%
Sea2.6%3.9%12.0%4.1%
Publisher’s Note: MDPI stays neutral with regard to jurisdictional claims in published maps and institutional affiliations.

