
The Road to Operationalization of Effective Tropical Forest Monitoring Systems
by
 ,
,
Carlos Portillo-Quintero
1,*, 
Jose L. Hernández-Stefanoni
2,
Gabriela Reyes-Palomeque
2 and
Mukti R. Subedi
1 1
Department of Natural Resources Management, College of Agricultural Sciences and Natural Resources Management, Texas Tech University, Lubbock, TX 79401, USA
2
Centro de Investigación Científica de Yucatán A.C., Unidad de Recursos Naturales, Calle 43 # 130, x 32 y 34 Colonia Chuburná de Hidalgo, CP 97205 Mérida, Yucatán, Mexico
*
Author to whom correspondence should be addressed.
Remote Sens. 2021, 13(7), 1370; https://doi.org/10.3390/rs13071370
Submission received: 5 March 2021
/
Revised: 29 March 2021
/
Accepted: 31 March 2021
/
Published: 2 April 2021
(This article belongs to the Special Issue Novel Approaches in Tropical Forests Mapping and Monitoring – Time for Operationalization)
Abstract
:The urgency to preserve tropical forest remnants has encouraged the development of remote sensing tools and techniques to monitor diverse forest attributes for management and conservation. State-of-the-art methodologies for mapping and tracking these attributes usually achieve accuracies greater than 0.8 for forest cover monitoring; r-square values of ~0.5–0.7 for plant diversity, vegetation structure, and plant functional trait mapping, and overall accuracies of ~0.8 for categorical maps of forest attributes. Nonetheless, existing operational tropical forest monitoring systems only track single attributes at national to global scales. For the design and implementation of effective and integrated tropical forest monitoring systems, we recommend the integration of multiple data sources and techniques for monitoring structural, functional, and compositional attributes. We also recommend its decentralized implementation for adjusting methods to local climatic and ecological characteristics and for proper end-user engagement. The operationalization of the system should be based on all open-source computing platforms, leveraging international support in research and development and ensuring direct and constant user engagement. We recommend continuing the efforts to address these multiple challenges for effective monitoring.
1. Introduction
In the past decades, voices from the scientific community, international organizations, and conservation practitioners have called the attention of the remote sensing scientific community to help advance the capabilities to map and monitor tropical forests from space in an effort to aid in their conservation and/or management [1,2,3,4,5]. From traditional decadal wall-to-wall approaches to continuous near-real-time applications, the rapid progress of this discipline has been impressive. In general, remote sensing-based tropical forest monitoring systems can be defined as the protocols, methodologies, and activities designed to quantify and track changes in forest attributes at any spatial and temporal scale. Traceable tropical forest attributes can range from vegetation structure (i.e., canopy cover extent and distribution, tree density, tree height, vertical structure, basal area, carbon storage, or biomass) to composition (i.e., plant diversity, species richness) and plant functional traits (i.e., leaf area index, wood density, abundance of nitrogen fixing trees, among others) [6,7,8,9,10].
Since the launch of the first Earth observation satellites, the main interest has been focused on monitoring tropical forest extent and distribution. More recently, international agencies have encouraged the establishment of national monitoring systems for understanding the spatial and temporal patterns of biomass and carbon sequestration potential in the context of climate change mitigation [11,12,13,14]. In the meantime, remote sensing scientists have introduced and matured several techniques to measure and monitor essential tropical forest traits and properties, although these are rarely considered in monitoring systems and mostly implemented as case studies [15,16,17,18,19]. There is, however, an increasing need for integrating many structural, functional, and taxonomic traits into monitoring systems given the urgent need for strategic planning to halt tropical biodiversity loss. Tracking all these variables at once is, of course, a difficult undertaking that entails considerations of scale; the integration of data sources; the selection of efficient spatial, spectral, and temporal resolutions; and the design of field data collection campaigns for training and validation. Operationalizing such integrated monitoring platforms requires establishing protocols and pipelines for data ingestion, processing, and dissemination that are computationally efficient and, preferably, low-cost. In addition, the geographic scale of these platforms needs to match forest governance scales for true effectiveness. In this paper, we comment on the past progress in the design and launch of tropical forest monitoring systems and discuss further considerations regarding effectiveness and integration.
2. What Is the State of the Art?
2.1. Forest Cover Change
Tracking changes in forest cover extent and distribution has been a major application of remote sensing data. The majority of case studies and national assessments apply wall-to-wall comparisons at low temporal resolutions (every 5–10 years) to fill the information gap on forest cover dynamics and establish a baseline for current national forest monitoring systems. Frequent tracking, however, has gained a new meaning in the past two decades as satellite data has become readily and widely available right after collection from space.
In 2001, the National Institute for Space Research in Brazil (INPE) created a unique national monitoring system that uses frequent satellite imagery to detect and map forest cover gain and loss over time. This program has combined publicly available imagery from different sources including China–Brazil Earth Resources Satellite (CBERS), Indian Remote Sensing (IRS), Moderate Resolution Imaging Spectrometer (MODIS), and Landsat imagery. The INPE created two systems: Projeto de Monitoramento do Desmatamento na Amazônia Legal por Satélite (PRODES) which provides annual forest cover maps for the Brazilian Amazon, and Sistema de Detecção do Desmatamento em Tempo Real na Amazônia (DETER), which uses MODIS monthly composites to detect and map deforestation events.
In PRODES, annual forest cover datasets are created for Landsat scenes that cover the Brazilian Amazon. Their approach uses image transformation techniques to determine the components of vegetation, soil, and shadow fraction before image classification using the open-source TerraAmazon platform. Similarly, DETER tracks monthly changes in the vegetation fraction component using MODIS 250-m imagery within the PRODES annual forest cover mask. DETER is designed as an early warning system to support surveillance and control of deforestation, mapping the occurrence of clear-cutting and forest degradation areas greater than 25 ha and guiding law enforcement efforts on the ground [20]. INPE created the TerraBrasilis web portal as a platform to provide access, query, analysis, and dissemination of spatial data generated by PRODES and DETER.
The Global Forest Watch (GFW) and the University of Maryland followed a similar approach to PRODES/DETER for a global forest monitoring system [21]. Forests are monitored by tracking Landsat pixel-level tree cover (%) estimates from the year 2000. Imagery and products are hosted and generated through Google Earth Engine, while visualization and analytics are run by third-party applications (MapBox and Carto). The platform was published in 2014 and provides forest cover maps annually for the whole planet. It also provides an alert system based on monthly updates through MODIS-based Terra-I and Landsat-based Global Land Analysis and Discovery (GLAD) products [22]. The system represents a state-of-the-art workflow and visualization scheme meant to be adopted as a forest data source by national institutions and park managers. However, given that the tree cover concept includes secondary vegetation, tree plantations, and some crops as forests, further adaptation through refinement and processing is needed for its local use [23,24,25]. Vargas et al. [26] reported that Terra-I and GLAD alerts underestimate the number and extent of deforestation events occurring on the ground due to persistent cloud cover and a mismatch between MODIS spatial resolution and the small size of forest clearings (for Terra-I). In general, the PRODES, DETER, and GFW systems provide forest cover change information with ~80% accuracy when compared to ground data.
In order to eliminate the impact of cloud cover, radar-only deforestation monitoring systems have also been developed. The JiCA-JAXA Forest Early Warning System in the Tropics (JJ-FAST), for example, employs long-wavelength Advanced Land Observing Satellite Phased Array L-band Synthetic Aperture Radar (ALOS-2 PALSAR-2) L-band radar data with a spatial scale of 50 m, and provides event-based forest disturbance detection for the pan-tropics updated every 1.5–3 months [27]. However, the spatial accuracy of this system is still low, with user’s accuracy ranging from 59.9% to 66.7% [28]. The Radar for Detecting Deforestation (RADD) alerts are also operational for 25 African countries and six Asia–Pacific countries. RADD alerts are provided for primary humid tropical forest at 10-m spatial scale and in near-real-time using Sentinel-1 data [29]. The system delivers gap-free observations for the tropics consistently every 6 to 12 days.
Over the past several years, there have been significant advances in the design of alternative, open-source automated continuous land cover change (CLCC) mapping algorithms that take advantage of the complete Landsat data archive that became freely available in 2008 [30]. The availability of terrain and atmospherically-corrected data in near-real-time through the Earth Resources Observation and Science Center (EROS) (USGS/NASA) data distribution platforms has greatly benefited the development of CLCC algorithms using diverse programming languages (R, Matlab, IDL) in local computing platforms. CLCC algorithms can generate maps showing the location and extent of deforestation at a continuous rate (daily, monthly) using diverse time-series analysis frameworks [30]. CLCC-derived annual deforestation maps have been tested in various ecosystems, including tropical forests, achieving spatial accuracies of >80% when compared to reference ground data [26,30,31,32,33,34,35,36,37,38]. Temporal accuracies, however, can be much lower due to cloud cover persistence, especially in tropical areas, with differences of up to 18 months between the estimated time of occurrence of the deforestation event and the moment it happened [39]. Increasing the density of the time series by integrating Landsat data, Sentinel-2, and radar data have resulted in better temporal and spatial accuracies [40]. The development of Landsat Analysis Ready Data (ARD) as well as harmonized Landsat/Sentinel-1 time series also aims to improve accuracy of CLCC outputs [41]. More recently, algorithms such as LandTrendr and BFASTMonitor have been adapted to the Google Earth Engine (GEE) platform, allowing their implementation without the need for local data storage and harnessing the computing power of GEE for large area analysis. The GEE searchable data catalog includes the entire EROS (USGS/NASA) Landsat catalog, numerous MODIS datasets, and Sentinel-1 data.
2.2. Forest structure, Species Composition, and Functional Vegetation Attributes
Several techniques for modeling and mapping the spatial distribution and temporal patterns of structural vegetation attributes such as forest cover, height, and biomass, as well as taxonomic and functional diversity gradients, have been developed. NASA’s Earth Science Data Systems Program (ESDS), for example, have promoted the generation of long-term, global, consistent products that quantify ecosystem properties such as monthly and annual primary productivity, phenology, respiration, biomass and carbon storage, and carbon dynamics from diverse sensors at different spatial resolutions. Most of these products are based on tested biophysical relationships between surface reflectance data and ecosystem properties (i.e., surrogates) using parametric and nonparametric statistical models and applied to atmospherically- and terrain-corrected imagery. Products are not necessarily developed for any particular monitoring platform, but are offered as downloadable products that would feed science applications and monitoring platforms. These global-scale remote sensing products are dependent on quality ground data [42,43] and are primarily used for regional to global analysis of ecosystem processes.
Comprehensive reviews of past and emerging remote-sensing technologies in case-study applications that look into taxonomic and functional diversity can be found in the scientific literature [15,16,43,44,45,46,47,48,49,50,51], as well as biomass or carbon storage [16,18,19]. Numerous applications have used the power of multispectral and hyperspectral optical, radar, and LiDAR sensors for mapping ecosystem age, biomass and carbon stocks, alpha and beta diversity, biochemical heterogeneity, tree height, vertical structure, and complexity, among others. The accuracy of these products varies with the type of forest attribute mapped, the type of ecosystem, functional types, successional stages, and spatial (pixel size) and temporal scale [52]. Several authors have also addressed the influence of ground-data collection sampling size and GPS location errors on model accuracy [53,54,55]. Most of these studies report regression coefficients as indicators of precision without assessing accuracy through independent and randomized ground-validation efforts. In tropical forests, state-of-the-art methodologies using multispectral, hyperspectral imagery and/or LiDAR usually achieve R2 values of ~0.5–0.7 for canopy functional trait mapping [56,57,58,59,60,61], while categorical maps of plant functional types can achieve overall accuracies of ~0.8 [62,63,64]. The difficulties and costs associated with field data collection campaigns for implementing these methods in tropical regions might explain the scarcity of attempts to implement frequent tracking systems for taxonomic or functional forest traits.
2.3. New Data Sources
Unmanned aerial systems (UAS) and nano-satellites represent a new and exciting source of imagery. Indeed, the advent of UAS was once seen as a solution for cloud-free and high temporal resolution imagery acquisition. However, the need to perform image co-registration, resampling, and sun-angle/sensor viewing geometry corrections for time-series of UAS-derived orthomosaics results is unpractical. Instead, UAS along with wireless sensor networks and super-sites can provide efficient field data collection for algorithm training and product validation [42,43]. On the other hand, the recent announcement of public availability of monthly high spatial resolution RGB imagery (<5 m) for the entire tropics by Planet Labs’s constellation of nano-satellites with the support of the Norwegian government [65], brings the possibility of implementing object-oriented and deep learning approaches to the estimation and monitoring of important forest attributes and the detection of change for larger areas at higher accuracies and temporal rates.
3. The Road to Effectiveness: Local Accuracy and System Engagement
Today, we can see operational monitoring systems for tracking patterns of biomass and forest cover change deployed at national and global scales. In the future, we hope to see monitoring systems that integrate different tropical forest attributes and alert managers about emerging ecological changes and processes happening. These alerts could drive strategic interventions to reverse negative trends. However, we believe there should be a few additional considerations for achieving such systems.
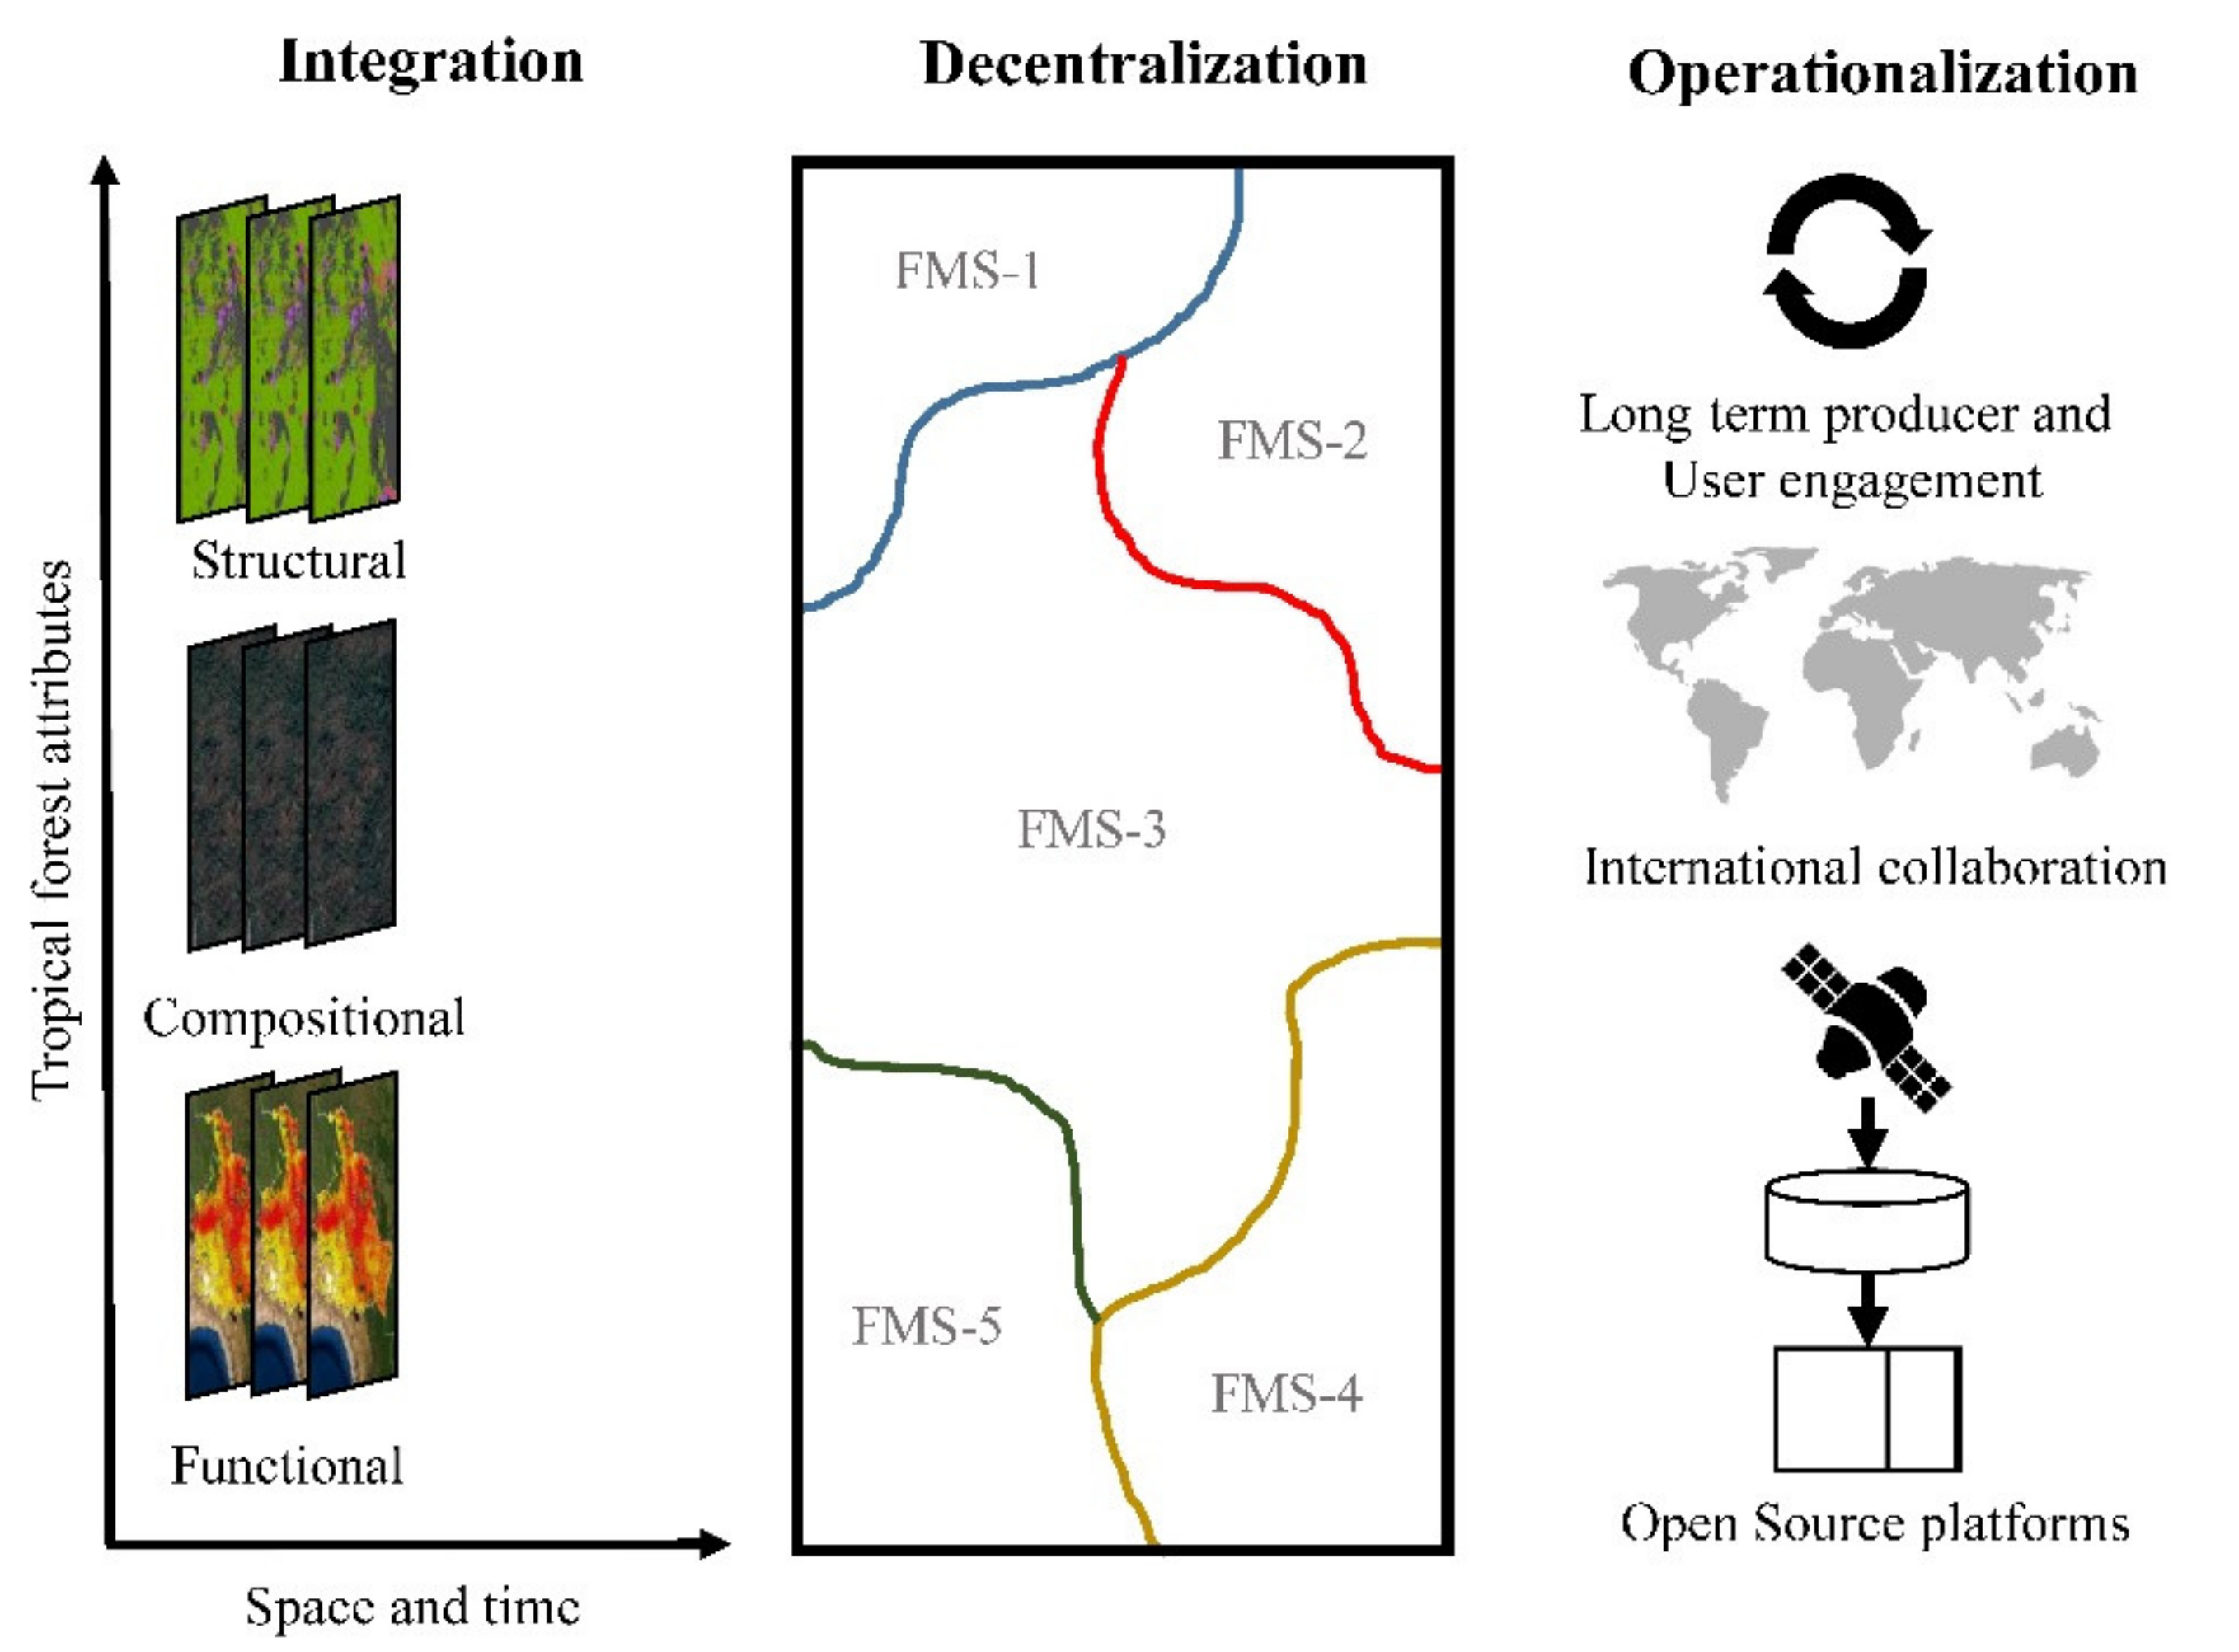
In Figure 1, we present a schematic representation of elements that could help building an effective and integrated tropical forest monitoring system. We define an “effective” monitoring system as a system that is used by managers and the public, it is trusted among all stakeholders, and drives decision-making on the ground. Such a system should affect land use decisions and, in general, effectively help in the maintenance of carbon storage and diversity of tropical forests. Therefore, an effective tropical forest monitoring system should be a tool and an integral component of communication in the socioecological land system management. This involves adapting to forest governance spatial and temporal scales and defining what a forest is and what a traceable structural, functional, or taxonomic trait constitutes. All these scales and concepts can be as diverse as the number of nations (including indigenous communities or nations) in the tropics. An effective system also involves optimized imagery ingestion and processing capabilities, high predictive power and accuracy, and product dissemination tools that are comprehensive and intuitive, capable of providing not just data, but clear information and knowledge on forest dynamics at a glimpse.
A model in this direction is promoted by the Food and Agriculture Organization (FAO) and exemplified by the REDDCopernicus framework for forest monitoring as part of the United Nations Programme on Reducing Emissions from Deforestation and Forest Degradation (UN-REDD) activities [66]; [https://www.reddcopernicus.info/, accessed on 21 January 2021]. National forest measurement, reporting, and verification (MRV) systems are meant to be “domestic tools” that will provide annual, national estimates of changes in forest carbon stocks and emissions. Methodologies and forest classification schemes are tailored to each country’s specific needs and context. However, for large area countries, national scale monitoring might not be fit for effectiveness. In order to create and maintain the end-user trust in a forest monitoring system, remote sensing scientists need to provide products with the highest possible accuracies, and for this, local-scale monitoring might prove to be more feasible. Local-scale monitoring also allows remote sensing scientists to have a better knowledge of the local sources of spectral variation leading to modeling errors. This would allow designing better field validation schemes and increase product accuracies. An example of this approach can be drawn from the “Mapbiomas” project in Brazil (https://mapbiomas.org/en, accessed on 21 January 2021) which, for producing a national land cover/land use map, organizes programmers, remote sensing specialists, and ecologists into teams for mapping each biome independently through ecosystem-adapted standardized methodologies.
Similarly, for tropical forests worldwide, rather than global and national systems (such as the Global Forest Watch or the UN-REDD+ models), the operationalization of monitoring systems might be more effective as a network of smaller subnational monitoring systems, each tailored to their own forest governance units (e.g., tropical forest reserves, provinces, ecoregions, etc.). Decentralized approaches are important for understanding forest dynamics at local and regional scales and identifying effective solutions [67]. Coupling forest monitoring scales with forest governance scales will require the direct engagement of remote sensing scientists with local forest management or conservation agencies in its design and implementation from data ingestion to product dissemination. The feedback could greatly improve the way remote sensing scientists design their monitoring systems, approach accuracy measure reporting, and communicate their results. Ultimately, this type of engagement will allow forest monitoring systems to be actors and not marginal tools in the decision-making process. Local-scale remote sensing monitoring frameworks will inevitably differ in remotely-sensed data sources, target forest attributes, and temporal and spatial scale, but technologies for data ingestion, processing, and dissemination could converge and lessons could be learned between each system.
Continuous local monitoring efforts with standardized field data and hyperspectral remote sensing collection methods, such as those established by the National Ecological Observatory Network (NEON-AOP) for its network of sites in the USA, can serve as an example for local tropical forest monitoring systems elsewhere. NEON-AOP activities embrace free and open-access data distribution, image processing algorithms, education, and training. As another example, the Global Airborne Observatory (GAO) at Arizona State University carries an integrated effort for frequent tracking of Ōhiʻa tree (Metrosideros polymorphadue) die-off due to fungus infestations using hyperspectral and LiDAR in Hawaii and publishes annual maps that feed into local conservation efforts led by the University of Hawaii (https://cms.ctahr.hawaii.edu/rod/, accessed on 21 January 2021).
The propagation of similar initiatives is possible given the wide range of sensors available at no cost and the possibility of connecting custom-made run-time applications to open data hubs. The progress made by NASA’s ESDS program on the development of data distribution pipelines and their integration to cloud-based analysis platforms has facilitated data acquisition, processing, and visualization of remotely-sensed data. Users are now able to either extract and graph pixel values over long-term time series and observe patterns in an online graphical user interface (e.g., AppEEARS); insert queries or request for bulk download using their own scripts in different programming languages, or use cloud-based applications such as Google Earth Engine. This should allow remote sensing scientists to focus on understanding the impact of scale on model accuracies and designing novel field validation schemes. Remote sensing scientists and technicians can also devote more time to working on alternative simplified mapping workflows and generating novel ways for communicating patterns and trends in the data to the public. In terms of product dissemination, the development of intuitive graphical user interfaces, such as INPE’s Terrabrasilis (http://terrabrasilis.dpi.inpe.br/en/home-page/, accessed on 21 January 2021), adapted to the local language, culture, and capacities could be an interesting endeavor for interdisciplinary teams of social scientists, graphic designers, and programmers.
Finally, considerations in the matter of technological independence and autonomy are necessary. Remote sensing protocols for a particular Landsat-based monitoring system in a developing country might consider what would happen if the free and open access policy by USGS EROS Data Center or the ESA ScienceHub data portals are dramatically changed by political decisions [68,69]. At the country or provincial scale, dependency on state resources could limit the independence and policy impact of their own scientific results. In addition, the ability to migrate to all open-source image processing workflows using local computing or open cloud-based services should be considered in the case that proprietary platforms such as Google Earth Engine are terminated. In this context, a positive trend has been the increase in international capacity building on the use of open-source software that has arisen from interactions between programmers, remote sensing scientists, and the rest of the scientific community in the past years; a trend that has been promoted through open data policies and online community code sharing and collaborations.
4. Conclusions
The development of an integrated tropical forest monitoring system for structural, taxonomic, and functional attributes of vegetation will require the implementation of novel data ingestion, preprocessing, modeling, field validation, and data communication techniques that fit the needs of conservation practitioners working on the ground. Today, these efforts are scattered, and we recommend continuing the efforts to implement decentralized, local-scale monitoring systems that address these multiple challenges for effective practical monitoring.
Author Contributions
Conceptualization and writing—original draft preparation: C.P.-Q.; writing—review and editing: J.L.H.-S., G.R.-P. and M.R.S. All authors have read and agreed to the published version of the manuscript.
Funding
This research received no external funding.
Institutional Review Board Statement
Not applicable.
Informed Consent Statement
Not applicable.
Acknowledgments
We would like to thank two anonymous reviewers for their comments and suggestions which greatly improved the quality of this article.
Conflicts of Interest
The authors declare no conflict of interest.
References
- O’Connor, B.; Secades, C.; Penner, J.; Sonnenschein, R.; Skidmore, A.; Burgess, N.D.; Hutton, J.M. Earth observation as a tool for tracking progress towards the Aichi Biodiversity Targets. Remote Sens. Ecol. Conserv. 2015, 1, 19–28. [Google Scholar] [CrossRef]
- Balmford, A.; Bennun, L.; ten Brink, B.; Cooper, D.; Côte, I.M.; Crane, P.; Dobson, A.; Dudley, N.; Dutton, I.; Green, R.E.; et al. The convention on biological diversity’s 2010 target. Science 2005, 307, 212. [Google Scholar] [CrossRef]
- Petrou, Z.I.; Manakos, I.; Stathaki, T. Remote sensing for biodiversity monitoring: A review of methods for biodiversity indicator extraction and assessment of progress towards international targets. Biodivers. Conserv. 2015, 24, 2333–2363. [Google Scholar] [CrossRef]
- Estoque, R.C. A review of the sustainability concept and the state of sdg monitoring using remote sensing. Remote Sens. 2020, 12, 1770. [Google Scholar] [CrossRef]
- Nagendra, H.; Lucas, R.; Honrado, J.P.; Jongman, R.H.G.; Tarantino, C.; Adamo, M.; Mairota, P. Remote sensing for conservation monitoring: Assessing protected areas, habitat extent, habitat condition, species diversity, and threats. Ecol. Indic. 2013, 33, 45–59. [Google Scholar] [CrossRef]
- Jetz, W.; Cavender-Bares, J.; Pavlick, R.; Schimel, D.; Davis, F.W.; Asner, G.P.; Guralnick, R.; Kattge, J.; Latimer, A.M.; Moorcroft, P.; et al. Monitoring plant functional diversity from space. Nat. Plants 2016, 2, 16024. [Google Scholar] [CrossRef] [PubMed] [Green Version]
- Asner, G.; Martin, R. Spectranomics: Emerging science and conservation opportunities at the interface of biodiversity and remote sensing. Glob. Ecol. Conserv. 2016, 8, 212–219. [Google Scholar] [CrossRef] [Green Version]
- Ustin, S.L.; Gamon, J.A. Remote sensing of plant functional types. New Phytol. 2010, 186, 795–816. [Google Scholar] [CrossRef] [PubMed]
- Abelleira Martínez, O.J.; Fremier, A.K.; Günter, S.; Ramos Bendaña, Z.; Vierling, L.; Galbraith, S.M.; Bosque-Pérez, N.A.; Ordoñez, J.C. Scaling up functional traits for ecosystem services with remote sensing: Concepts and methods. Ecol. Evol. 2016, 6, 4359–4371. [Google Scholar] [CrossRef]
- Gillespie, T.W.; Brock, J.; Wright, C. Prospects for quantifying structure, floristic composition and species richness of tropical forests. Int. J. Remote Sens. 2004, 25, 707–715. [Google Scholar] [CrossRef]
- Santilli, M.; Moutinho, P.; Schwartzman, S.; Nepstad, D.; Curran, L.; Nobre, C. Tropical deforestation and the Kyoto protocol. Clim. Chang. 2005, 71, 267–276. [Google Scholar] [CrossRef]
- FAO. Strengthening National Forest Monitoring Systems for REDD +; Food and Agriculture Organization of the United Nations: Rome, Italy, 2018; Available online: http://www.fao.org/3/ca0525en/CA0525EN.pdf. (accessed on 15 January 2021).
- Holmgren, L.; Marklund, G. National forest monitoring systems—Purposes, options and status. In Forestry & Climate Change; Freer-Smith, P.H., Broadmeadow, M.S.J., Lynch, J.M., Eds.; CAB International: Wallingford, UK, 2007; pp. 163–173. [Google Scholar]
- Neeff, T.; Piazza, M. Developing forest monitoring capacity–Progress achieved and gaps remaining after ten years. For. Policy Econ. 2019, 101, 88–95. [Google Scholar] [CrossRef]
- Gould, W. Remote sensing of vegetation, plant species richness, and regional biodiversity hotspots. Ecol. Appl. 2000, 10, 1861–1870. [Google Scholar] [CrossRef]
- Saatchi, S.; Harris, N.; Brown, S.; Lefsky, M.; Mitchard, E.; Salas, W.; Zutta, B.; Buermann, W.; Lewis, S.; Hagen, S.; et al. Benchmark map of forest carbon stocks in tropical regions across three continents. Proc. Natl. Acad. Sci. USA 2011, 108, 9899–9904. [Google Scholar] [CrossRef] [PubMed] [Green Version]
- Rocchini, D.; Balkenhol, N.; Carter, G.A.; Foody, G.M.; Gillespie, T.W.; He, K.S.; Kark, S.; Levin, N.; Lucas, K.; Luoto, M.; et al. Remotely sensed spectral heterogeneity as a proxy of species diversity: Recent advances and open challenges. Ecol. Inform. 2010, 5, 318–329. [Google Scholar] [CrossRef]
- Baccini, A.; Goetz, S.; Walker, W.S.; Laporte, N.T.; Sun, M.; Sulla-Menashe, D.; Hackler, J.; Beck, P.S.A.; Dubayah, R.; Friedl, M.A.; et al. Estimated carbon dioxide emissions from tropical deforestation improved by carbon-density maps. Nat. Clim. Chang. 2012, 2, 182–185. [Google Scholar] [CrossRef]
- Avitabile, V.; Herold, M.; Heuvelink, G.B.; Lewis, S.L.; Phillips, O.L.; Asner, G.P.; Berry, N.J. An integrated pan-tropical biomass map using multiple reference datasets. Glob. Chang. Biol. 2016, 22, 1406–1420. [Google Scholar] [CrossRef] [Green Version]
- Diniz, C.; De Almeida Souza, A.; Santos, D.; Correa Dias, M.; Cavalcante da Luz, N.; Vidal de Moraes, D.; Ana Maia, J.; Gomes, A.R.; Narvaes, I.S.; Valeriano, D.; et al. DETER-B: The new amazon near real-time deforestation detection system. IEEE J. Sel. Top. Appl. Earth Obs. Remote Sens. 2015, 8, 3619–3628. [Google Scholar] [CrossRef]
- Hansen, M.C.; Potapov, P.V.; Moore, R.; Hancher, M.; Turubanova, S.; Tyukavina, A.; Thau, D.; Stehman, S.; Goetz, S.; Loveland, T. High-resolution global maps of 21st-century forest cover change. Science 2013, 342, 850–853. [Google Scholar] [CrossRef] [Green Version]
- Hansen, M.C.; Krylov, A.; Tyukavina, A.; Potapov, P.V.; Turubanova, S.; Zutta, B.; Ifo, S.; Margono, B.; Stolle, F.; Moore, R. Humid tropical forest disturbance alerts using Landsat data. Environ. Res. Lett. 2016, 11, 034008. [Google Scholar] [CrossRef]
- Tropek, R.; Sedláček, O.; Beck, J.; Keil, P.; Musilová, Z.; Šímová, I.; Storch, D. Comment on “High-resolution global maps of 21st-century forest cover change”. Science 2014, 344, 981. [Google Scholar] [CrossRef] [PubMed] [Green Version]
- Portillo-Quintero, C.; Smith, V. Emerging trends of tropical dry forests loss in North & Central America during 2001–2013: The role of contextual and underlying drivers. Appl. Geogr. 2018, 94, 58–70. [Google Scholar]
- Cunningham, D.; Cunningham, P.; Fagan, M. Evaluating forest cover and fragmentation in Costa Rica with a corrected global tree cover map. Remote Sens. 2020, 12, 3226. [Google Scholar] [CrossRef]
- Vargas, C.; Montalban, J.; Leon, A. Early warning tropical forest loss alerts in Peru using Landsat. Environ. Res. Commun. 2019, 1, 121002. [Google Scholar] [CrossRef]
- Watanabe, M.; Koyama, C.N.; Hayashi, M.; Nagatani, I.; Shimada, M. Early-stage deforestation detection in the tropics with L-band SAR. IEEE J. Sel. Top. Appl. Earth Obs. Remote Sens. 2018, 11, 2127–2133. [Google Scholar] [CrossRef]
- Watanabe, M.; Koyama, C.; Hayashi, M.; Nagatani, I.; Tadono, T.; Shimada, M. Improvement of deforestation detection algorithms used in JJ-FAST. In Proceedings of the IGARSS 2019—2019 IEEE International Geoscience and Remote Sensing Symposium, Yokohama, Japan, 28 July–2 August 2019; pp. 5328–5331. [Google Scholar]
- Reiche, J.; Mullissa, A.; Slagter, B.; Gou, Y.; Tsendbazar, N.-E.; Odongo-Braun, C.; Vollrath, A.; Weisse, M.J.; Stolle, F.; Pickens, A.; et al. Forest disturbance alerts for the Congo Basin using Sentinel-1. Environ. Res. Lett. 2021. [Google Scholar] [CrossRef]
- Zhu, Z. Change detection using landsat time series: A review of frequencies, preprocessing, algorithms, and applications. ISPRS J. Photogramm. Remote Sens. 2017, 130, 370–384. [Google Scholar] [CrossRef]
- Zhu, Z.; Woodcock, C.E. Continuous change detection and classification of land cover using all available Landsat data. Remote Sens. Environ. 2014, 144, 152–171. [Google Scholar] [CrossRef] [Green Version]
- Murillo-Sandoval, P.J.; Van Den Hoek, J.; Hilker, T. Leveraging multisensor time series datasets to map short- and long-term tropical forest disturbances in the Colombian Andes. Remote Sens. 2017, 9, 179. [Google Scholar] [CrossRef] [Green Version]
- DeVries, B.; Decuyper, M.; Verbesselt, J.; Zeileis, A.; Herold, M.; Joseph, S. Tracking disturbance-regrowth dynamics in tropical forests using structural change detection and Landsat time series. Remote Sens. Environ. 2015, 169, 320–334. [Google Scholar] [CrossRef]
- DeVries, B.; Verbesselt, J.; Kooistra, L.; Herold, M. Robust monitoring of small-scale forest disturbances in a tropical montane forest using Landsat time series. Remote Sens. Environ. 2015, 161, 107–121. [Google Scholar] [CrossRef]
- DeVries, B.; Pratihast, A.K.; Verbesselt, J.; Kooistra, L.; Herold, M. Characterizing forest change using community-based monitoring data and landsat time series. PLoS ONE 2016, 11, 1–25. [Google Scholar] [CrossRef] [PubMed]
- Verbesselt, J.; Zeileis, A.; Herold, M. Near real-time disturbance detection using satellite image time series. Remote Sens. Environ. 2012, 123, 98–108. [Google Scholar] [CrossRef]
- Dutrieux, L.P.; Verbesselt, J.; Kooistra, L.; Herold, M. Monitoring forest cover loss using multiple data streams, a case study of a tropical dry forest in Bolivia. ISPRS J. Photogramm. Remote Sens. 2015, 107, 112–125. [Google Scholar] [CrossRef]
- Kennedy, E.R.; Yang, Z.; Cohen, W.B. Detecting trends in forest disturbance and recovery using yearly Landsat time series: 1. LandTrendr—Temporal segmentation algorithms. Remote Sens. Environ. 2010, 114, 2897–2910. [Google Scholar] [CrossRef]
- Smith, V.; Portillo-Quintero, C.; Sanchez-Azofeifa, A.; Hernandez-Stefanoni, J.L. Assessing the accuracy of detected breaks in Landsat time series as predictors of small scale deforestation in tropical dry forests of Mexico and Costa Rica. Remote Sens. Environ. 2019, 221, 707–721. [Google Scholar] [CrossRef]
- Reiche, J.; Hamunyela, E.; Verbesselt, J.; Hoekman, D.; Herold, M. Improving near-real time deforestation monitoring in tropical dry forests by combining dense Sentinel-1 time series with Landsat and ALOS-2 PALSAR-2. Remote Sens. Environ. 2018, 204, 147–161. [Google Scholar] [CrossRef]
- Zhu, Z. Science of Landsat analysis ready data. Remote Sens. 2019, 11, 2166. [Google Scholar] [CrossRef] [Green Version]
- Chave, J.; Davies, S.J.; Phillips, O.L.; Lewis, S.L.; Sist, P.; Schepaschenko, D.; Armston, J.; Baker, T.R.; Coomes, D.; Disney, M.; et al. Ground data are essential for biomass remote sensing missions. Surv. Geophys. 2019, 40, 863–880. [Google Scholar] [CrossRef]
- Sanchez-Azofeifa, A.; Antonio Guzmán, J.; Campos, C.A.; Castro, S.; Garcia-Millan, V.; Nightingale, J.; Rankine, C. Twenty-first century remote sensing technologies are revolutionizing the study of tropical forests. Biotropica 2017, 49, 604–619. [Google Scholar] [CrossRef]
- Ustin, S.L.; Roberts, D.A.; Gamon, J.A.; Asner, G.P.; Green, R.O. Using imaging spectroscopy to study ecosystem processes and properties. BioScience 2004, 54, 523–534. [Google Scholar] [CrossRef]
- Turner, W.; Spector, S.; Gardiner, N.; Fladeland, M.; Sterling, E.; Steininger, M. Remote sensing for biodiversity science and conservation. Trends Ecol. Evol. 2003, 18, 306–314. [Google Scholar] [CrossRef]
- Wang, K.; Franklin, S.E.; Guo, X.; Cattet, M. Remote sensing of ecology, biodiversity and conservation: A review from the perspective of remote sensing specialists. Sensors 2010, 10, 9647–9667. [Google Scholar] [CrossRef]
- Skidmore, A.K.; Pettorelli, N.; Coops, N.C.; Geller, G.N.; Hansen, M.; Lucas, R.; Mücher, S.; O’Connor, B.; Paganini, M.; Pereira, H.M.; et al. Environmental science: Agree on biodiversity metrics to track from space. Nature 2015, 523, 403–405. [Google Scholar] [CrossRef] [PubMed] [Green Version]
- Pettorelli, N.; to Buhne, H.S.; Tulloch, A.; Dubois, G.; Macinnis-Ng, C.; Queiros, A.M.; Keith, D.A.; Wegmann, M.; Schrodt, F.; Stellmes, M.; et al. Satellite remote sensing of ecosystem functions: Opportunities, challenges and way forward. Remote Sens. Ecol. Conserv. 2017, 4, 71–93. [Google Scholar] [CrossRef]
- Wang, R.; Gamon, J.A. Remote sensing of terrestrial plant biodiversity. Remote Sens. Environ. 2019, 231, 111218. [Google Scholar] [CrossRef]
- Seeley, M.; Asner, G.P. Imaging spectroscopy for conservation applications. Remote Sens. 2021, 13, 292. [Google Scholar] [CrossRef]
- Saatchi, S.S.; Houghton, R.A.; Dos Santos Alvala, R.C.; Soares, J.V.; Yu, Y. Distribution of aboveground live biomass in the Amazon basin. Glob. Chang. Biol. 2007, 13, 816–837. [Google Scholar] [CrossRef]
- Gamon, J.A.; Wang, R.; Gholizadeh, H.; Zutta, B.; Townsend, P.A.; Cavender-Bares, J. Consideration of scale in remote sensing of biodiversity. In Remote Sensing of Plant Biodiversity; Cavender-Bares, J.A., Gamon, J., Townsend, P., Eds.; Springer: New York, NY, USA, 2019. [Google Scholar]
- Hernández-Stefanoni, J.L.; Reyes-Palomeque, G.; Castillo-Santiago, M.A.; George-Chacón, S.P.; Huechacona-Ruiz, A.H.; Tun-Dzul, F.; Rondon-Rivera, D.; Dupuy, J.M. Effects of sample plot size and GPS location errors on aboveground biomass estimates from LiDAR in tropical dry forests. Remote Sens. 2018, 10, 1586. [Google Scholar] [CrossRef] [Green Version]
- Frazer, G.W.; Magnussen, S.; Wulder, M.A.; Niemann, K.O. Simulated impact of sample plot size and co-registration error on the accuracy and uncertainty of LiDAR-derived estimates of forest stand biomass. Remote Sens. Environ. 2011, 115, 636–649. [Google Scholar] [CrossRef]
- Gobakken, T.; Næsset, E. Assessing effects of positioning errors and sample plot size on biophysical stand properties derived from airborne laser scanner data. Can. J. For. Res. 2009, 39, 1036–1052. [Google Scholar] [CrossRef]
- Kalacska, M.; Sánchez-Azofeifa, G.A.; Calvo-Alvarado, J.C.; Rivard, B.; Quesada, M. Effects of season and successional stage on leaf area index and spectral vegetation indices in three mesoamerican tropical dry forests. Biotropica 2005, 37, 486–496. [Google Scholar] [CrossRef]
- Carlson, K.C.; Asner, G.P.; Hughes, R.F.; Ostertag, R.; Martin, R.E. Hyperspectral remote sensing of canopy biodiversity in Hawaiian lowland rainforests. Ecosystems 2007, 10, 536–549. [Google Scholar] [CrossRef]
- Chadwick, K.D.; Asner, G.P. Organismic-scale remote sensing of canopy foliar traits in lowland tropical forests. Remote Sens. 2016, 8, 87. [Google Scholar] [CrossRef] [Green Version]
- Sothe, C.; Dalponte, M.; Almeida, C.M.; Schimalski, M.B.; Lima, C.L.; Liesenberg, V.; Miyoshi, G.T.; Tommaselli, A.M.G. Tree species classification in a highly diverse subtropical forest integrating UAV-based photogrammetric point cloud and hyperspectral data. Remote Sens. 2019, 11, 1338. [Google Scholar] [CrossRef] [Green Version]
- Ordway, E.M.; Asner, G.P. Carbon declines along tropical forest edges correspond to heterogeneous effects on canopy structure and function. Proc. Natl. Acad. Sci. USA 2020, 117, 7863–7870. [Google Scholar] [CrossRef]
- Aguirre-Gutiérrez, J. Pantropical modelling of canopy functional traits using Sentinel-2 remote sensing data. Remote Sens. Environ. 2021, 252, 112122. [Google Scholar] [CrossRef]
- Fagan, M.E.; DeFries, R.S.; Sesnie, S.E.; Arroyo-Mora, J.P.; Soto, C.; Singh, A.; Townsend, P.A.; Chazdon, R.L. Mapping species composition of forests and tree plantations in Northeastern Costa Rica with an integration of hyperspectral and multitemporal Landsat imagery. Remote Sens. 2015, 7, 5660–5696. [Google Scholar] [CrossRef] [Green Version]
- Vaglio Laurin, G.; Puletti, N.; Hawthorne, W.; Liesenberg, V.; Corona, P.; Papale, D.; Chen, Q.; Valentini, R. Discrimination of tropical forest types, dominant species, and mapping of functional guilds by hyperspectral and simulated multispectral sentinel-2 data. Remote Sens. Environ. 2016, 176, 163–176. [Google Scholar] [CrossRef] [Green Version]
- Reyes-Palomeque, G.; Dupuy, J.M.; Portillo-Quintero, C.; Andrade, J.L.; Tun-Dzul, F.; Hernandez-Stefanoni, J.L. Mapping forest age as an indicator of vegetation structure and species composition in tropical dry forests. Ecol. Indic. 2021, 120. [Google Scholar] [CrossRef]
- Planet. Planet, KSAT and Airbus Awarded First-Ever Global Contract to Combat Deforestation. Available online: https://www.planet.com/pulse/planet-ksat-and-airbus-awarded-first-ever-global-contract-to-combat-deforestation/ (accessed on 19 February 2021).
- UN-REDD. National Forest Monitoring Systems: Monitoring and Measurement, Reporting and Verification (M & MRV) in the Context of REDD+ Activities; Food & Agriculture Organization: Rome, Italy, 2014. [Google Scholar]
- Larson, A.; Pekova, E. An introduction to forest governance, people and REDD plus in Latin America: Obstacles and opportunities. Forests 2011, 2, 86–111. [Google Scholar] [CrossRef]
- Popkin. US government considers charging for popular Earth-observing data. Nature 2018, 556, 417–418. [Google Scholar] [CrossRef] [PubMed] [Green Version]
- Zhu, Z.; Wulder, M.A.; Roy, D.P.; Woodcock, C.E.; Hansen, M.C.; Radeloff, V.C.; Healey, S.P.; Schaaf, C.; Hostert, P.; Strobl, P.; et al. Benefits of the free and open Landsat data policy. Remote Sens. Environ. 2019, 224, 382–385. [Google Scholar] [CrossRef]
Figure 1.
Schematic representation of key aspects in the design and implementation of effective and integrated tropical forest remote sensing systems as conceptualized in this paper: the integration of multiple data sources and techniques for mapping structural, functional, and compositional attributes; its decentralized implementation for adapting methods to local climatic and ecological characteristics and forest governance scales (FMS = forest monitoring system); and the operationalization of the system using all open-source computing platforms, leveraging international support in research and development and ensuring direct and constant user engagement.
Publisher’s Note: MDPI stays neutral with regard to jurisdictional claims in published maps and institutional affiliations. |
© 2021 by the authors. Licensee MDPI, Basel, Switzerland. This article is an open access article distributed under the terms and conditions of the Creative Commons Attribution (CC BY) license (https://creativecommons.org/licenses/by/4.0/).
Share and Cite
MDPI and ACS Style
Portillo-Quintero, C.; Hernández-Stefanoni, J.L.; Reyes-Palomeque, G.; Subedi, M.R. The Road to Operationalization of Effective Tropical Forest Monitoring Systems. Remote Sens. 2021, 13, 1370. https://doi.org/10.3390/rs13071370
AMA Style
Portillo-Quintero C, Hernández-Stefanoni JL, Reyes-Palomeque G, Subedi MR. The Road to Operationalization of Effective Tropical Forest Monitoring Systems. Remote Sensing. 2021; 13(7):1370. https://doi.org/10.3390/rs13071370
Chicago/Turabian StylePortillo-Quintero, Carlos, Jose L. Hernández-Stefanoni, Gabriela Reyes-Palomeque, and Mukti R. Subedi. 2021. "The Road to Operationalization of Effective Tropical Forest Monitoring Systems" Remote Sensing 13, no. 7: 1370. https://doi.org/10.3390/rs13071370
Note that from the first issue of 2016, this journal uses article numbers instead of page numbers. See further details here.