Article

Land Subsidence Induced by Rapid Urbanization in Arid Environments: A Remote Sensing-Based Investigation

1
Department of Geological and Environmental Sciences, Western Michigan University, Kalamazoo, MI 49008, USA
2
Geology Department, National Authority for Remote Sensing and Space Sciences, Cairo 11884, Egypt
3
Geology Department, Faculty of Science, Al-Azhar University, Cairo 11884, Egypt
4
Geodynamics Department, National Research Institute of Astronomy and Geophysics (NRIAG), Helwan, Cairo 11421, Egypt
5
Department of Environmental Sciences, The University of Toledo, Toledo, OH 43606, USA
*
Author to whom correspondence should be addressed.
Remote Sens. 2021, 13(6), 1109; https://doi.org/10.3390/rs13061109
Submission received: 8 February 2021 / Revised: 8 March 2021 / Accepted: 10 March 2021 / Published: 15 March 2021

Abstract

:
The rapid increase in the population of many of the older major cities within the countries of the Saharan-Arabian Desert is steering vast and disorganized urban expansion and in many cases introducing adverse environmental impacts such as soil erosion, rise in groundwater levels, and contamination of shallow aquifers, as well as development of deformational features including land subsidence. Using the rapidly growing city of Riyadh (1992: 467 km2; 2018: 980 km2), the capital of the Kingdom of Saudi Arabia as a test site, we utilized Small Baseline Subset (SBAS) interferometric analyses of 2016 to 2018 Sentinel-1 images together with multi-temporal high-resolution images viewable on Google Earth, GPS, field, land use land cover (LULC), and geological data to assess the distribution and rates of land subsidence and their causal effects. Three main causes of subsidence were identified and assessed: (1) discharge of wastewater effluents from septic systems in newly urbanized areas that lead to an increase in soil moisture, rise in groundwater levels, waterlogging, and wetting and hydrocompaction of dry alluvium loose sediments causing land subsidence (up to −20 mm/y) in wadis and lowlands; (2) the subsurface dissolution of karst formation by wastewater effluents and the collapse of voids and cavities at depth under stresses introduced by heavy construction machinery, causing sagging and land subsidence (up to −5 mm/y); and (3) leveling, compaction, and degradation of municipal and building waste materials in organized landfills and disorganized dump sites that resulted in significant land subsidence (up to −21 mm/y) and differential settling that could jeopardize the stability of structures erected over these sites. Our findings highlight the potential use of the advocated integrated approach to assess the nature and extent of land deformation associated with rapid urban growth in arid lands, and to identify areas most impacted for the purpose of directing and prioritizing remediation efforts.

Graphical Abstract

1. Introduction

Only 2% of the World population lived in urban centers in 1800, but 200 years later, these urban centers hosted some 50% of the World population and it is projected that by year 2030, 61% of the world population will reside in these centers [1]. Much of urban population growth is driven by migration from rural areas to benefit from the advantages offered by urban centers including, but not limited to, enhanced job opportunities, education, and health services [1].
Rapid urban growth has serious environmental repercussions including deterioration of air quality, degraded visibility, creation of urban heat islands, and elevated day and night temperatures [2,3,4]. Additional environmental impacts include inadequate water supplies, lack of sanitary landfills, and industrial pollution.
Many of the rapidly growing urban centers are witnessing high rates of subsidence. Using GPS, leveling, and interferometric synthetic aperture radar (InSAR) results, subsidence rates of about 5–10 cm/y and up to about 20 cm/y were reported from the cities of Jakarta, Bandung, and Semarang in Indonesia and were attributed to groundwater extraction, natural consolidation of alluvium soil, load of constructions, and tectonic activities [5]. In Hanoi city, in Vietnam, a mean vertical subsidence rate of 6.8 cm/y was extracted over three new urban districts using a multi-temporal InSAR analysis of ALOS images and was attributed to excessive groundwater extraction [6]. Similar findings were reported from Houston, Mexico City, Osaka, San Jose, Shanghai, Tokyo, and Venice, where subsidence was caused largely by pumping of ground water from unconsolidated sediment [7].
Less attention has been paid to assess the nature and magnitude of land deformation associated with rapid growth of urban centers in arid desert settings. Over the past few decades, many of the major cities across Saharan Africa and Arabia witnessed rapid expansion that continues to be fueled by rising populations and by the economic and cultural opportunities provided by these mega urban centers. Riyadh (To avoid confusion in this paper between the province of Riyadh and the city of Riyadh, we will refer to the former as “Riyadh Province” and the latter simply as “Riyadh.”), the capital of the Kingdom of Saudi Arabia (KSA), is one of these cities. The population of Riyadh increased from 0.4 million in 1970 to 4.5 million in 2005, and its area increased as well (24 km2 in 1970 to 700 km2 in 2005) [8]. Similar observations could be made for many other megacities in Saharan Africa (e.g., Cairo, and Khartoum) and Arabia (e.g., Baghdad, and Damascus). For example, Cairo, the capital of Egypt, had a population of 13 million in 1999 and 18 million in 2015, and its area increased from 423 km2 in 1999 to 656 km2 in 2015 [9]. Baghdad, in Iraq, had a population of a 5.3 million in 2008 and approached 7 million in 2019, as its area increased from 622 km2 in 2008 to 727 km2 in 2019 [10].
The economic development of the KSA has led to rapid urban expansion, with about 83% of population living in urban areas in 2015 compared to only 21% in 1950 [11,12]. In particular, large provinces such as Riyadh and Makkah in central and western Arabia, respectively (Figure 1), have witnessed the most dramatic urban expansion—almost a threefold increase in urban land use between 1992 and 2013 (e.g., 2340 to 6097 km2 and 1616 to 3461 km2 in Riyadh and Makkah provinces, respectively [13]). Riyadh, the largest urban center within the Riyadh Province is the study area of this research.
The rapid urban expansion and the recent discovery of deformation features (e.g., large sinkholes) in Riyadh [17] have drawn more attention to understanding the spatial distribution and mechanism of formation of deformation features in the city and to examining the role of human activities in their origin. This rapid urbanization was, in many sections of Riyadh, apparently disorganized. The majority of households had individual septic tanks in which the effluents were released in the ground probably causing dissolution of carbonate bedrock, sink hole formation and land subsidence, groundwater contamination, rise in groundwater levels, and discharge in lowlands. The significant increase of urban areas at the expense of rural lands over a short time period in Riyadh, have led to the development of poorly managed and randomly distributed dump sites in some areas. Natural hazards associated with urban encroachment over abandoned dump sites have been reported from numerous locations worldwide, including groundwater contamination and leakage of leachate in the city of Patras, Greece [18], and in Delhi city [19], and fatal slope failure in Quezon City, Philippines [20], and in Koshe landfill, Ethiopia [21]. Additionally, settlements established over abandoned dump sites are expected to cause land subsidence due to urban loading and waste degradation [22]. This study will assess the extent to which practices associated with rapid urbanization (e.g., release of effluents, poorly managed dump sites) could have caused land deformation (subsidence) in Riyadh.
Land subsidence is a slow phenomenon that refers to the gradual lowering of the surface of the land due to a reduction of the volume of subsurface materials and an increase in subsurface voids by either natural or anthropogenic processes [23]. Land subsidence is often related to urban expansion [24,25], sediment compaction [26], landslides [27], large-scale construction [28], mining activities, and mechanical compression and biochemical processes in dump sites [29]. Traditionally, land subsidence and associated deformation features has been examined using ground-based geodetic measurements including differential leveling, GPS, and LIDAR surveys [30]. Satellite-based measurements using interferometric synthetic aperture radar (InSAR) techniques provide a cost-effective and accurate tool for investigating land subsidence over large-scale areas [31]. InSAR techniques have been used widely to study land subsidence related to groundwater abstraction in different regions worldwide, such as northern California and southern Nevada [32,33,34], central and northern KSA [35,36], and in Beijing, China [37]. The Small Baseline Subset (SBAS) technique has emerged as an advanced method of InSAR time series analysis with algorithms that rely on small-baseline differential SAR interferograms to increase the volume of data for analysis [38,39].
In this study, we integrate field, remote sensing (e.g., InSAR and satellite imagery), land use and landcover (LULC), and hydrogeological data to accomplish the following tasks: (1) estimate the temporal and spatial deformation rates across Riyadh using SBAS techniques on Sentinel-1 data over a two year period (2016 to 2018), and (2) examine natural and anthropogenic factors that possibly control the observed deformation through spatial and temporal correlation of the observed deformation with relevant datasets (distribution of buildings, roads, dump sites, lithological units, wadis, and lowlands) in a GIS environment.

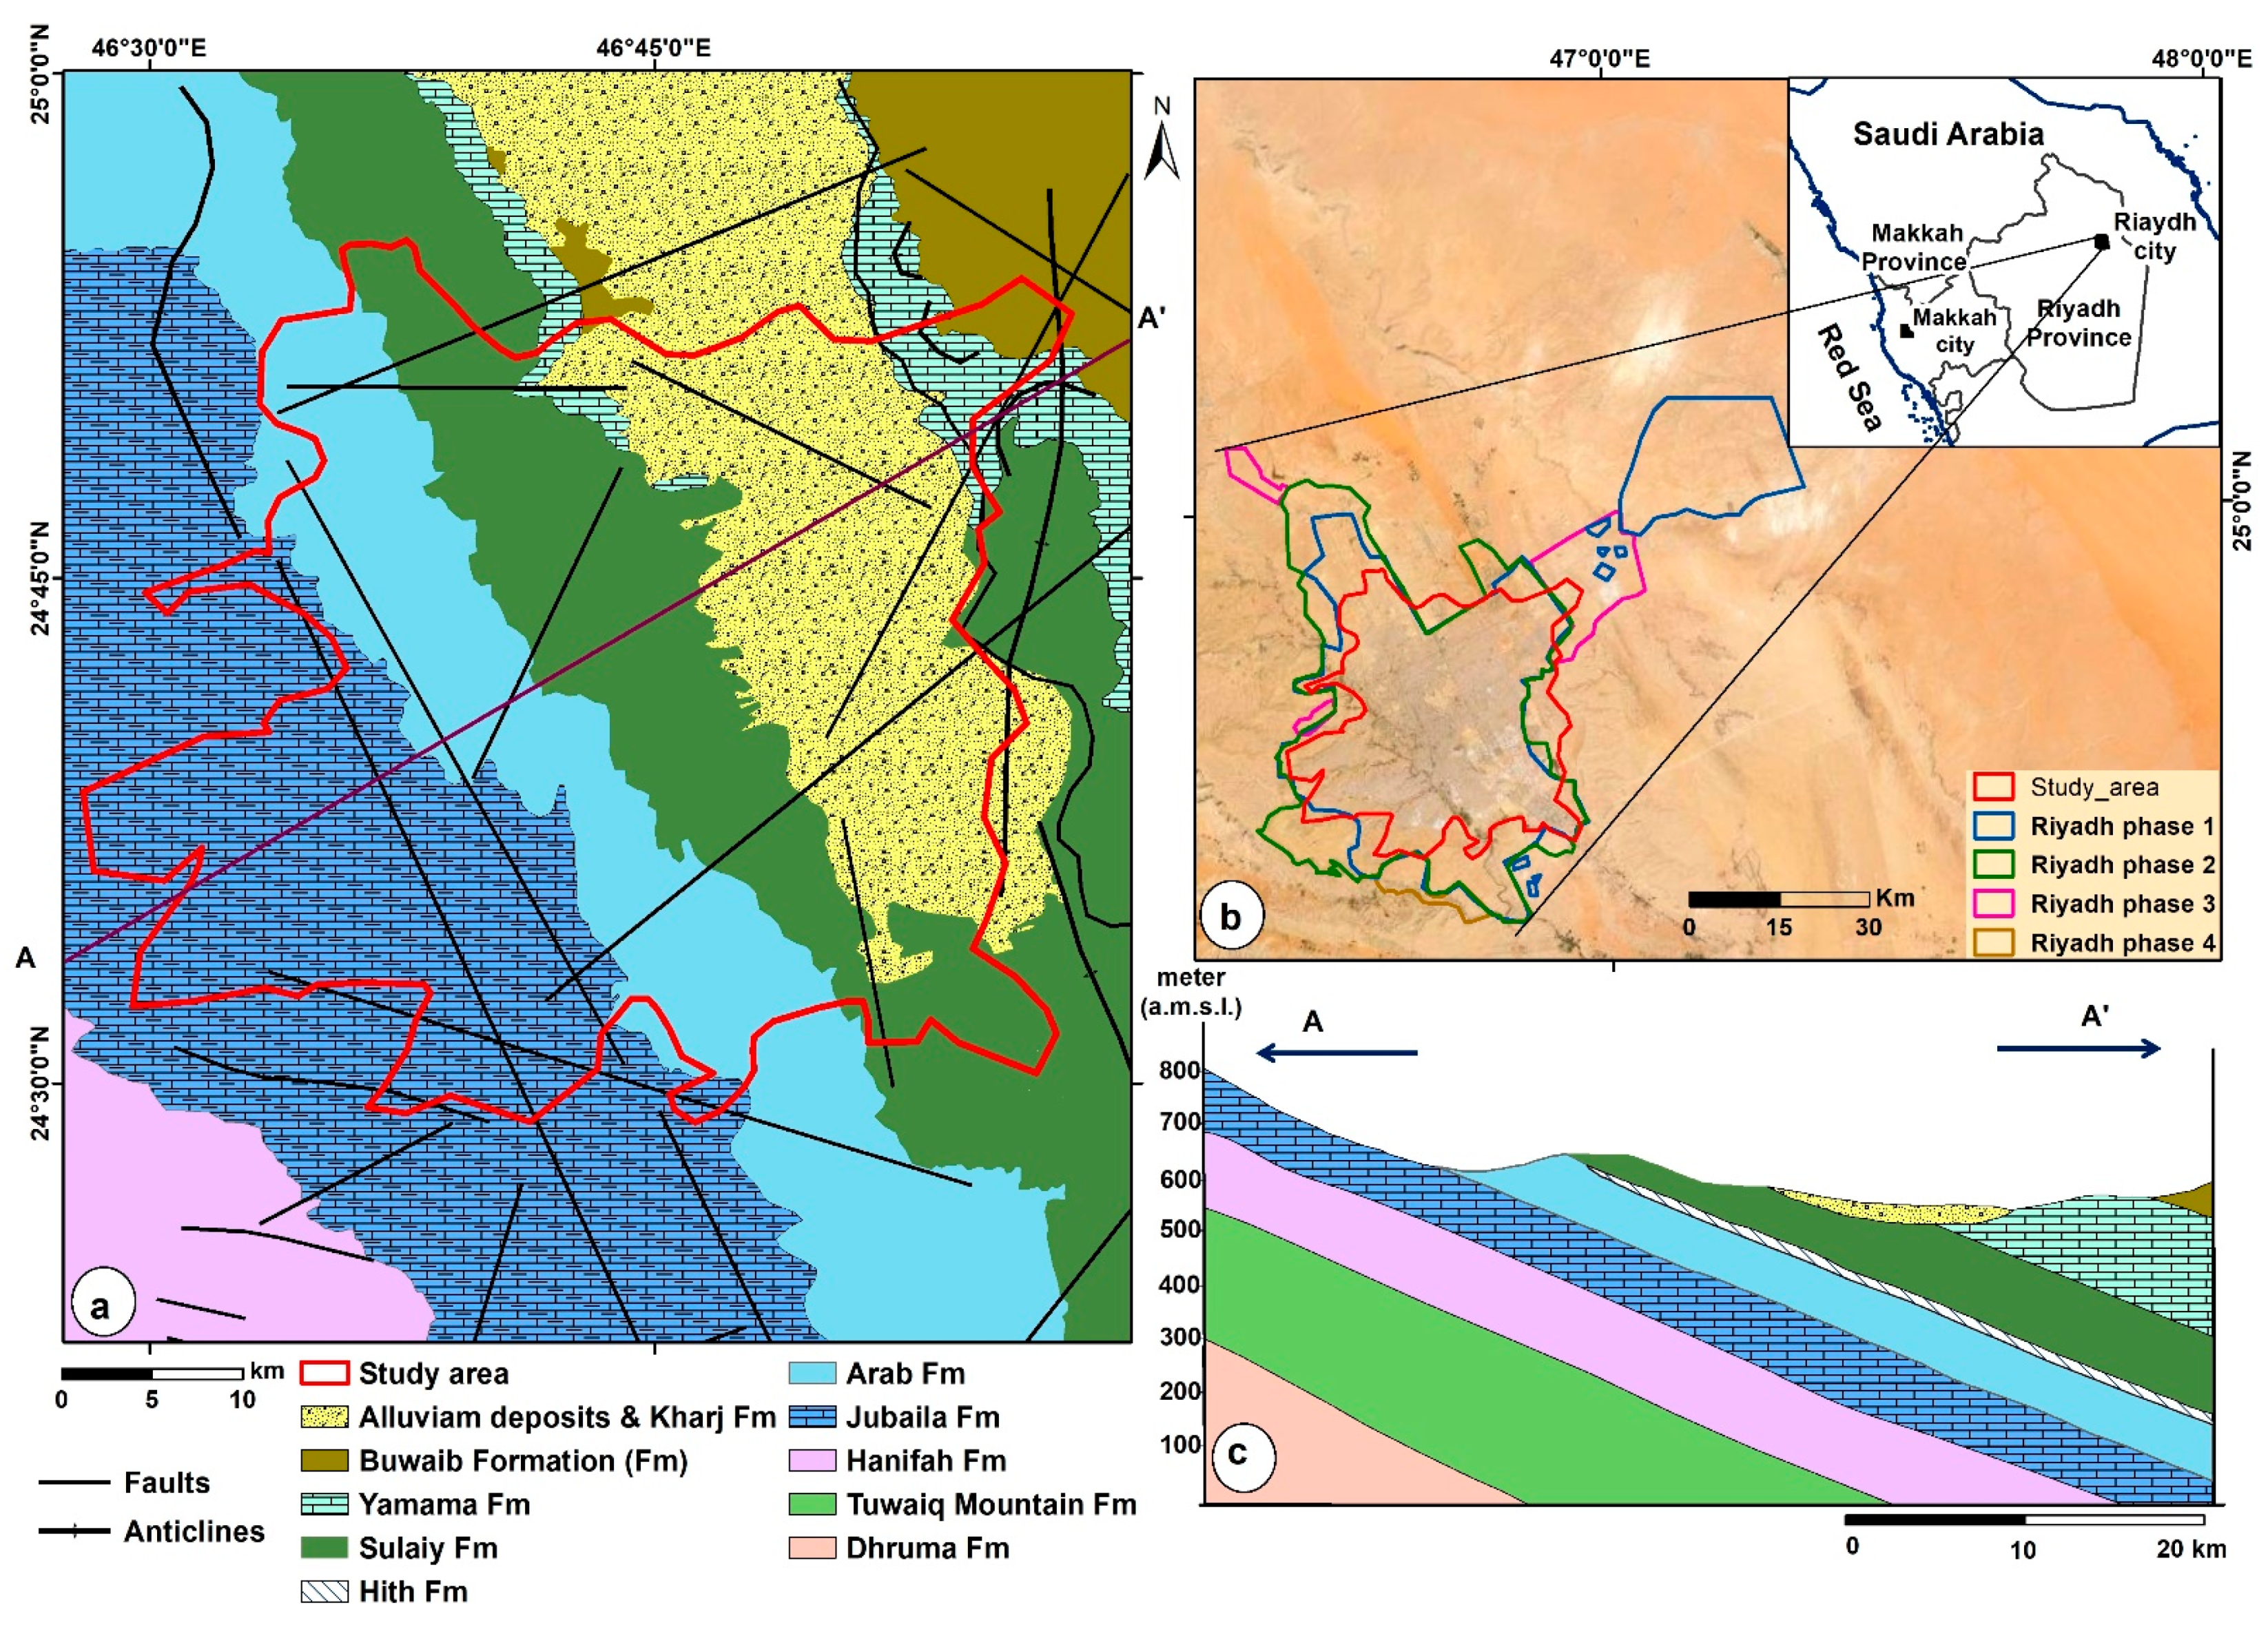
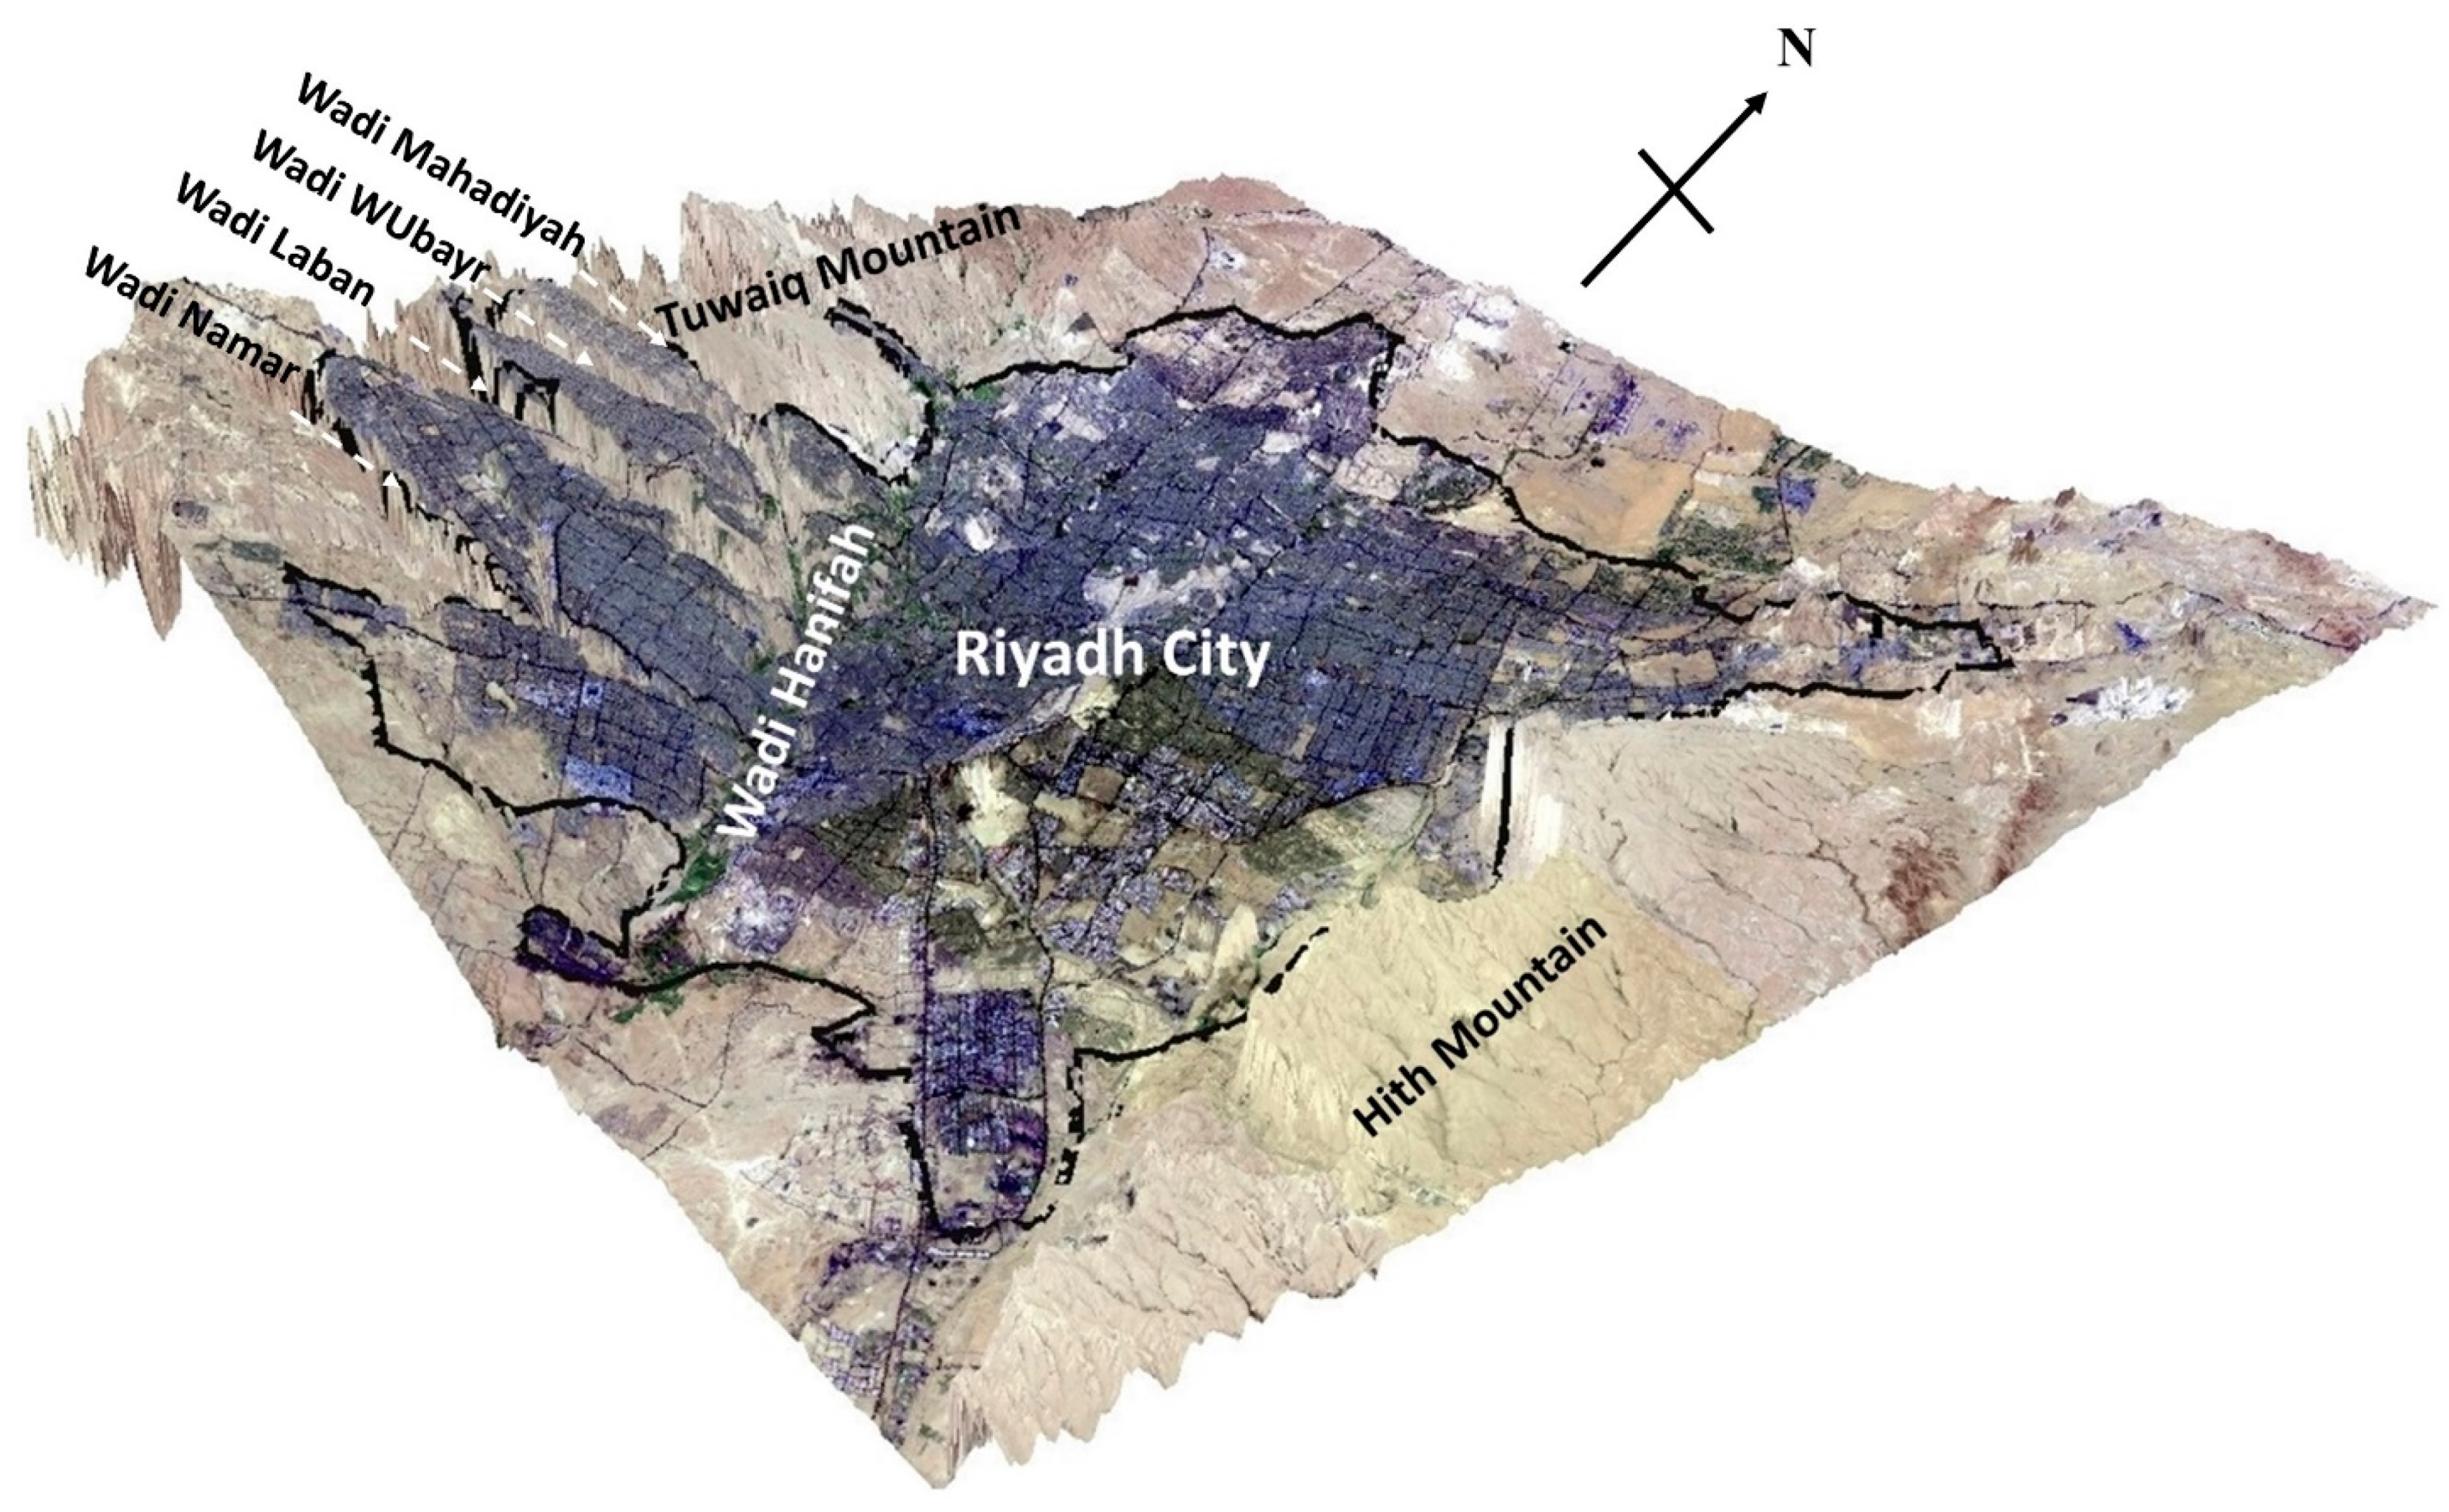
2. The Climatic, Geologic, Hydrogeologic, and Urban Settings of Riyadh

Riyadh extends in a more or less north–south direction and is largely built in the lowlands bordered on the west by the Tuwaiq Mountains and on the east by Hith Mountains (Figure 2). Figure 2 is a 3-D rendering of a Landsat 8 false color multispectral band image (spatial resolution: 30 m; acquisition date: 2020) draped over an ALOS World 3D digital elevation model (DEM; resolution 30 m). The Tuwaiq Mountains are bisected by southwest-northeast trending drainage networks (e.g., Wadi Mahadiyah, Wadi Wubay, Wadi Laban, and Wadi Namar; Figure 2) that drain into a main wadi (Wadi Hanifa). The latter (Wadi Hanifa) crosscuts the city in a northwest–southeast direction.
The Comprehensive Riyadh Strategic Plan (CRSP) was established to organize the expansion of the city with all its components (urban, environmental, economic, transportation, housing, and infrastructure). Four urban growth phases were set in the strategic plan between 2010 and 2030, with a start date and a defined extension for each of the four phases. Phase 1, 2, 3, and 4 start in 2010, 2015, 2020, and 2025, respectively, bringing the total area of Riyadh in these four phases to 2398 km2, 2763 km2, 3055 km2, and 3131 km2, respectively (Figure 1b; [16]). In the selection of the study area (Figure 1a,b; area outlined by red polygon), we visually identified (from Landsat 8 multispectral band image acquired in 2020) contiguous urban areas occupied by buildings and infrastructure.
The KSA in general including the city and province of Riyadh is characterized by desert climate with significant variations between day and night temperatures [40]. The annual average temperature is around 28 °C, while the maximum temperature in the summer can reach 50 °C and the mean precipitation in the Riyadh region is 87 mm/y [41].
The uplift associated with the Red Sea opening led to the exposure of the basement complex and the overlying Paleozoic sedimentary sequences on either side of the rift [14,42]. In central KSA, the outcrops of these formations, which range in age from Triassic to Miocene, are exposed near the Arabian-Nubian shield and dip steeply eastward towards the Arabian Gulf (Figure 1c; [14,43]). These formations include, from older to younger: (1) the shale, limestone, and sandstone of the Dhruma Formation; (2) the limestone and lime mudstone of the Tuwaiq Mountain Formation; (3) the muddy and lagoonal carbonates of the Hanifa Formation; (4) the lime mudstones, dolomite and sandstone of the Jubaila Formation; (5) the limestone, dolomite, and anhydrite of the Arab Formation; (6) the Hith anhydrite Formation; (7) the Sulaiy limestone Formation; (8) the Yamama limestone Formation; (9) the shale and dolomite of the Buwaib Formation; and (10) the Kharj Formation and alluvium deposits containing fragments of limestone, marl, shale, sandstone, chert, gravel, and gypsum. These stratigraphic units are covered locally by surficial deposits of gravels, sand, silt, and clays.
Karst-related phenomena have been observed and reported from large areas in the central and eastern parts of the KSA in carbonate and evaporite formations such as the Arab, Hith, Sulaiy, Umm ar Radhuma, Rus, Dammam, and Dam formations [44,45,46]. Most of the karstic features are controlled by joint systems [45] and were developed during previous wet climatic periods (Pliocene or Pleistocene; [44]). Riyadh is located within a dissolution-induced subsidence depression where thick Ca-sulfate rocks (up to 130 m) and carbonates dominate the subsurface [14]. The Riyadh urban area may have been the location of interstratal dissolution of karst units, leading to sagging and collapse of the overlying formations and the development of deformation features [47].
The faults and the folds reported in the area surrounding Riyadh indicate that they trend mostly in the northwest–southeast, northeast–southwest, west-northwest–east-northeast, and east–west directions (Figure 1). These faults and folds occur as deep-seated or shallow-to-surficial structures that have been initiated during the Late Cretaceous and experienced continued deformation until the Eocene [15,48].
Riyadh is underlain by the Mega Aquifer System (MAS), which is subdivided into two major aquifer systems, the Upper and Lower MAS. The significant aquifers for the Upper MAS are the Wasia-Biyadh and Umm er Radhuma; for the Lower MAS, the Minjur Aquifer is most significant. The Upper and Lower MAS are separated by the Upper Jurassic to Lower Cretaceous anhydrite aquitard of the Hith Formation [49,50]. These multiple aquifers within the MAS are partially hydraulically connected by subvertical fault systems which act as “hydraulic conduits” allowing cross-formation flow between the various aquifers [36,49,50].
The majority of households had individual septic tanks in which the effluents were released in the ground and concentrated sewage was collected from each household, treated in decentralized wastewater treatment plants, and used for landscaping, and agricultural irrigation, and industry. The release of effluents from septic tanks led to a general rise in groundwater levels in Riyadh, ponding in some locations, and discharge of groundwater into lowlands and wadis [51,52]. Moreover, encroachment of urbanization on major valleys (wadis) was a common practice. These wadis collect precipitation over extensive areas and channel it through the main valleys as runoff and groundwater flow in the underlying aquifers. Despite the paucity of precipitation, these main wadis (e.g., Hanifah and Laban) commonly become the site of flash floods [53].
In recent years, access to basic public services including electricity, drinking water, and sanitation has become a goal of the Ninth National Development Plan (NDP) and the country’s Vision 2030. Decentralized sewage systems are being replaced by centralized sewage systems and septic tanks are being decommissioned. In 2015, there was 55 wastewater treatment plants with a capacity of 1144 million cubic meters per year, and 42 more were under construction with an added capacity of 799 million cubic meters per year [54]. These sanitation projects will, with time, slow down the adverse impacts of the disorganized urbanization during the earlier periods, including land subsidence.
The significant increase of urban areas at the expense of rural lands over a short time period in Riyadh, has led to an annual addition of solid wastes of 2871 × 103 tons and the development of randomly distributed dump sites in some areas [55]. These solid wastes were dumped outside the Riyadh city limits, compressed by heavy machinery, and covered with thick soil [56]. With time, the city limits expanded and some of the urban settlements could have been established over areas once occupied by dump sites, exposing residents of these areas to various hazards associated with dump sites such as groundwater contamination, release of greenhouse gases, and slope stability and settlement problems. Throughout the text, we investigate the extent to which the geologic, tectonic, climatic, and hydrologic settings and the practices associated rapid urbanization have contributed to land deformation in Riyadh.

3. Data and Methods

Our approach involves addressing two main tasks: estimating the subsidence rates within and surrounding Riyadh and understanding the formation mechanism of these deformation features. The first task—estimating of the temporal and spatial deformation rates over Riyadh and its surroundings—was addressed by extracting the radar line-of-sight (LOS) velocities using SBAS techniques on Sentinel-1 data (acquisition period: 2016–2018) and comparing these velocities to GPS data. The second task—investigating the natural and anthropogenic factors that possibly control the observed deformation—was conducted through spatial correlation of the observed deformation with relevant spatial datasets in a GIS environment such as the distribution of lithological units, wadis, and features displayed in temporal Google Earth images and LULC maps (e.g., buildings, roads, dump sites, and water-logged areas). Findings were corroborated by observations collected (2016–2020) by our team during our field campaigns and by information provided by the locals residing in the investigated areas.

3.1. Processing of InSAR Data and Extraction of Displacement Rates (Task I)

The SBAS algorithm is based on creating a stack of interferograms with small temporal and orbital baselines to reduce the temporal and spatial decorrelation phenomena, and compensating topographic artifacts and atmospheric phase component by spatial and temporal filtering using the information available in the processed data [57]. The European Space Agency (ESA)’s Sentinel-1A data were utilized, with a revisit time of 12 days in central Arabia. A series of 39 ascending Sentinel-1 scenes (Table 1) were selected and the SBAS radar interferometric technique [57] was applied using Sarscape software to create 255 interferograms (Figure 3). A subset of these scenes and interferograms were subsequently eliminated because they yielded interferograms with heavy atmospheric contributions and/or low coherence (red points; Figure 3). The remaining scenes (30 scenes; 16 November 2016–15 June 2018) and interferograms (159) were included in the remaining processing steps. The ALOS World 3D digital elevation model was used to remove topographical phase contributions. A multi-looking ratio of 5:1 (range:azimuth) was applied leading to square pixel of approximately 15 m ground resolution. Phase unwrapping was performed on the interferograms using Delaunay triangulation [58] for the pixels having coherence value higher than 0.35. Then, over 100 evenly distributed ground control points (GCPs) were selected and used for orbital refinement by estimating and removing the residual phase ramps on the unwrapped interferograms. The GCPs were selected from locations with high coherence and where no deformation is observed or expected. In the first inversion, based on a linear velocity model, possible topographic phase residuals and mean velocity field were calculated using the unwrapped phases. Topographic phase residuals were subtracted from the wrapped interferograms. In the second inversion step, the time series of displacement was estimated by the singular value decomposition (SVD) inversion approach using refined unwrapped interferograms [57]. The GCPs used for orbital refinement were also used as reference points in phase to displacement conversion step assuming that the deformation at the reference points were zero. Atmospheric phase components were estimated and removed by low-pass spatial (1200 m) and high-pass temporal (365 days) filtering [59]. LOS deformation velocities (Figure 4a; Table 2) were retrieved and geocoded in geographic coordinates. In this step, pixels with the coherence value lower than 0.4 were masked. The deformation velocity (in mm/y) was contoured using a raster calculator in ArcMap for areas of subsidence and exported into the Google Earth domain to investigate the nature (urban, geologic, and hydrologic) of the setting undergoing subsidence and the factors causing the observed deformation through comparisons with temporal satellite imagery.

3.2. Processing of GPS Data to Validate InSAR-Derived Displacement Rates (Task I)

There are two GPS stations within the InSAR-based displacement mapping study. One of the stations is an IGS network station (SAS0; 46.639° E, 24.736° N). The daily solutions and vertical displacement velocity at this station is provided by Nevada geodetic laboratory [60] for the period between September 2019 and January 2021 (1.3 years). Vertical displacement velocity at this station is 2.28 ± 1.66 mm/y. Since the data acquisition period was not enough to acquire reliable long-term displacement velocity, this station was not included in the following discussion.
The second station (RY99, 46.694° E, 24.674° N; Figure 4) within the study area is part of Kingdom of Saudi Arabia Continuously Operating Reference Station (KSA-CORS) network operated by General Authority for Survey and Geospatial Information (CASGI). The time series of ~4.8 years covering the time-span 2015–2020 was processed using Bernese 5.2 [61] with the final IGS orbits, and satellite clocks and Earth orientation parameters. The processing included 18 permanent stations from different sources (International GNSS Services [IGS], EUREF Permanent GNSS Network [EPN], Scripps Orbit and Permanent Array Center [SOPAC], and University NAVSTAR Consortium [UNAVCO]; Table 3), 13 of which are included in the ITRF2014 and were used as fiducial stations to attain a comprehensive configuration around the GPS station and for datum definition purposes. We applied the processing strategy described by [62,63]. The GPS data processing was carried out on a daily basis which resulted in a set of 1726 daily solutions in ITRF2014 reference frame [64]. The built-in combination tool (ADDNEQ2) in Bernese software was used for the estimation of station position and velocity for all the processed stations. An outlier detection/rejection process was applied followed by a second round of estimations for station position and velocity based on the clean solution. To estimate a realistic margin of standard deviations, we scaled the standard deviations by the ratio of the formal error and repeatability estimated by the combination step [63,65,66,67].
The LOS SBAS velocity over the GPS station was obtained over the pixel centered on the RY99 GPS station. The extracted GPS velocity in the vertical direction was projected to satellite geometry by multiplying by the cosine of the incidence angle at the GPS station assuming no, or negligible, lateral displacement and was compared to the LOS velocity extracted from the InSAR time series analysis.

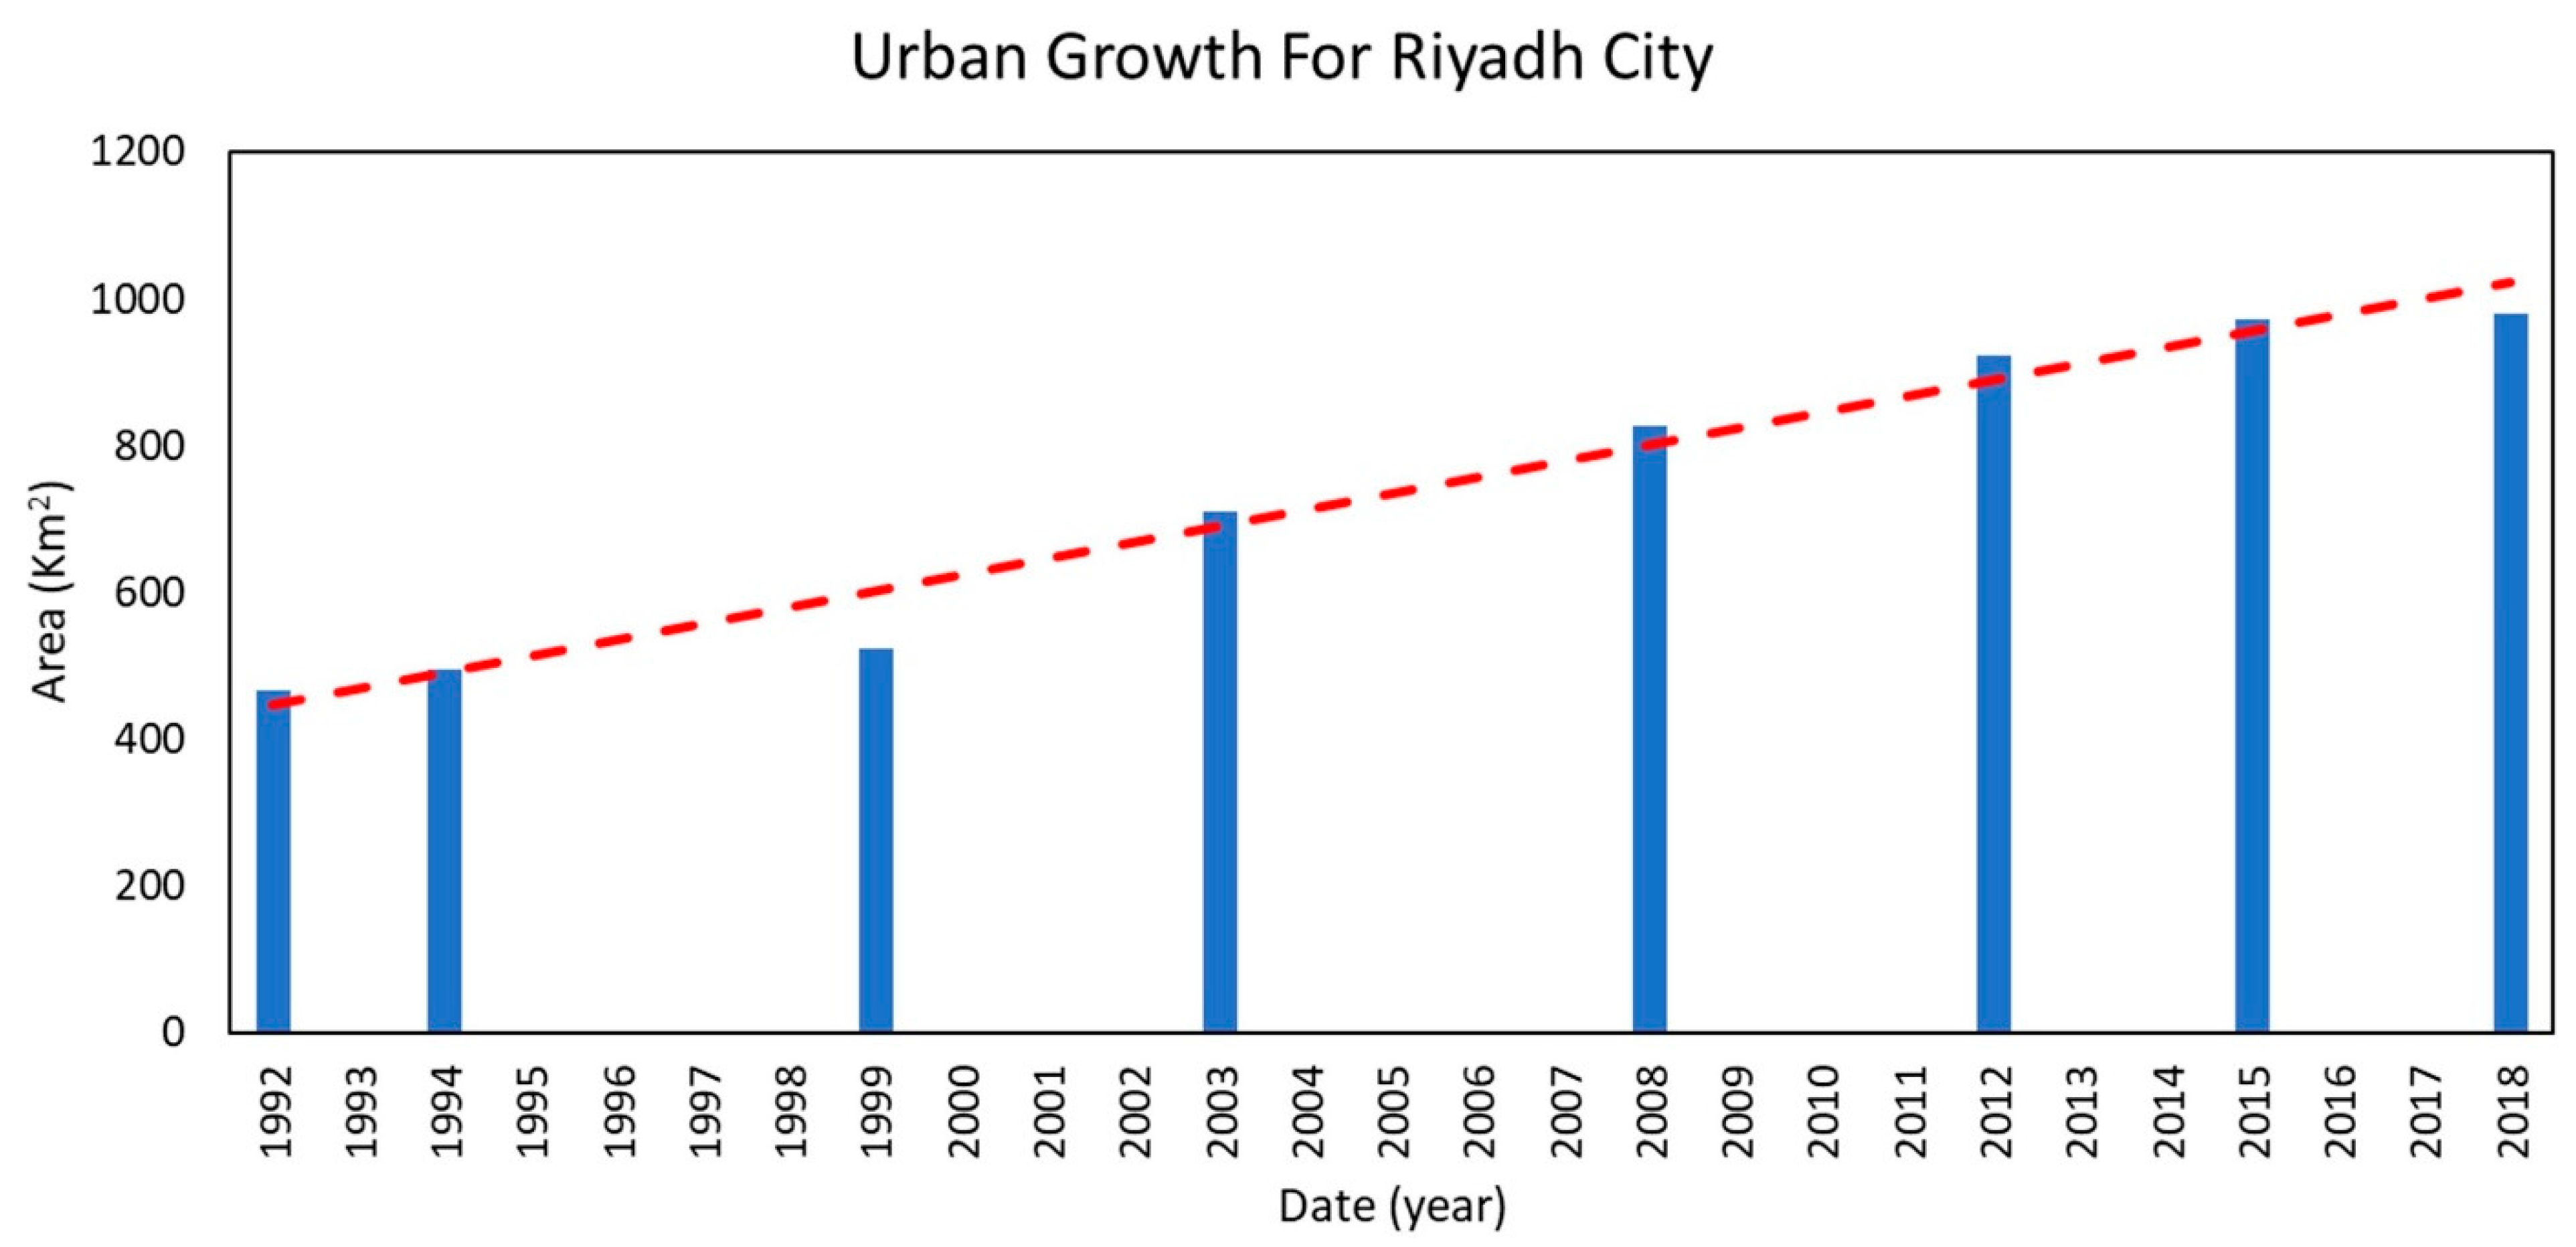
3.3. Urban Land Use Changes between 1992 and 2018 (Task II)

Eight LULC maps for the years 1992, 1994, 1999, 2003, 2008, 2012, 2015, and 2018 extracted from European Space Agency Climate Change Initiative (ESA-CCI) land cover viewer datasets (http://maps.elie.ucl.ac.be/CCI/viewer/ accessed on 2 September 2020) were compared to estimate the rates of urban encroachment in Riyadh. These are multi-sensor datasets (i.e., ENVISAT MERIS, SPOT-VEGETATION, PROBA-V, and AVHRR images) that provide a 37 classes-unified global LULC coverage with 300 m spatial resolution [68]. These maps were validated by comparison to the GlobCover 2009 dataset [69]. Urban areas, with a class number of 190, was extracted as a separate thematic map for each of the investigated years. Results are plotted in Figure 5.

3.4. Spatial Analysis of Relevant Datasets (Task II)

All collected and processed data were co-registered to a unified geographic projection (datum: WGS-84; UTM Zone: N38) in a GIS environment. Geological, topographic, and land use and land cover maps together with high-resolution images viewable on Google Earth were used to monitor the environmental impacts associated with urban expansion. These include the rise in groundwater level and the increase in soil moisture, waterlogging, and vegetation cover. The integrated datasets were also used to identify areas most susceptible to these adverse impacts. The integration of observations from various products provided valuable clues pertaining to the formation mechanisms of observed land deformation in Riyadh.

4. Results

Inspection of Figure 5 reveals that the area occupied by urban development within our study area doubled between years 1992 (467 km2) and 2018 (980 km2). Temporal Google images show that this urban encroachment was largely on Riyadh’s western and northwestern sections over the foothills of Tuwaiq Mountains and the interleaving valleys and lowlands (Figure 2) and less so on the eastern and southern sections. A similar pattern is observed on the LOS land deformation SBAS map (Figure 4a); areas experiencing subsidence exceeding 4 mm are largely concentrated on the western and northwestern sides, of the city where 32 of the 38 identified subsidence sites are located. These observations suggest that the observed LOS SBAS land deformation is largely caused by anthropogenic activities related to urban expansion. We first compare the LOS SBAS velocities to GPS data to validate or calibrate the SBAS measurement then conduct spatial correlation of the observed LOS SBAS deformation with relevant temporal and spatial datasets in a GIS environment to assess the observed deformation and to identify factors controlling it.

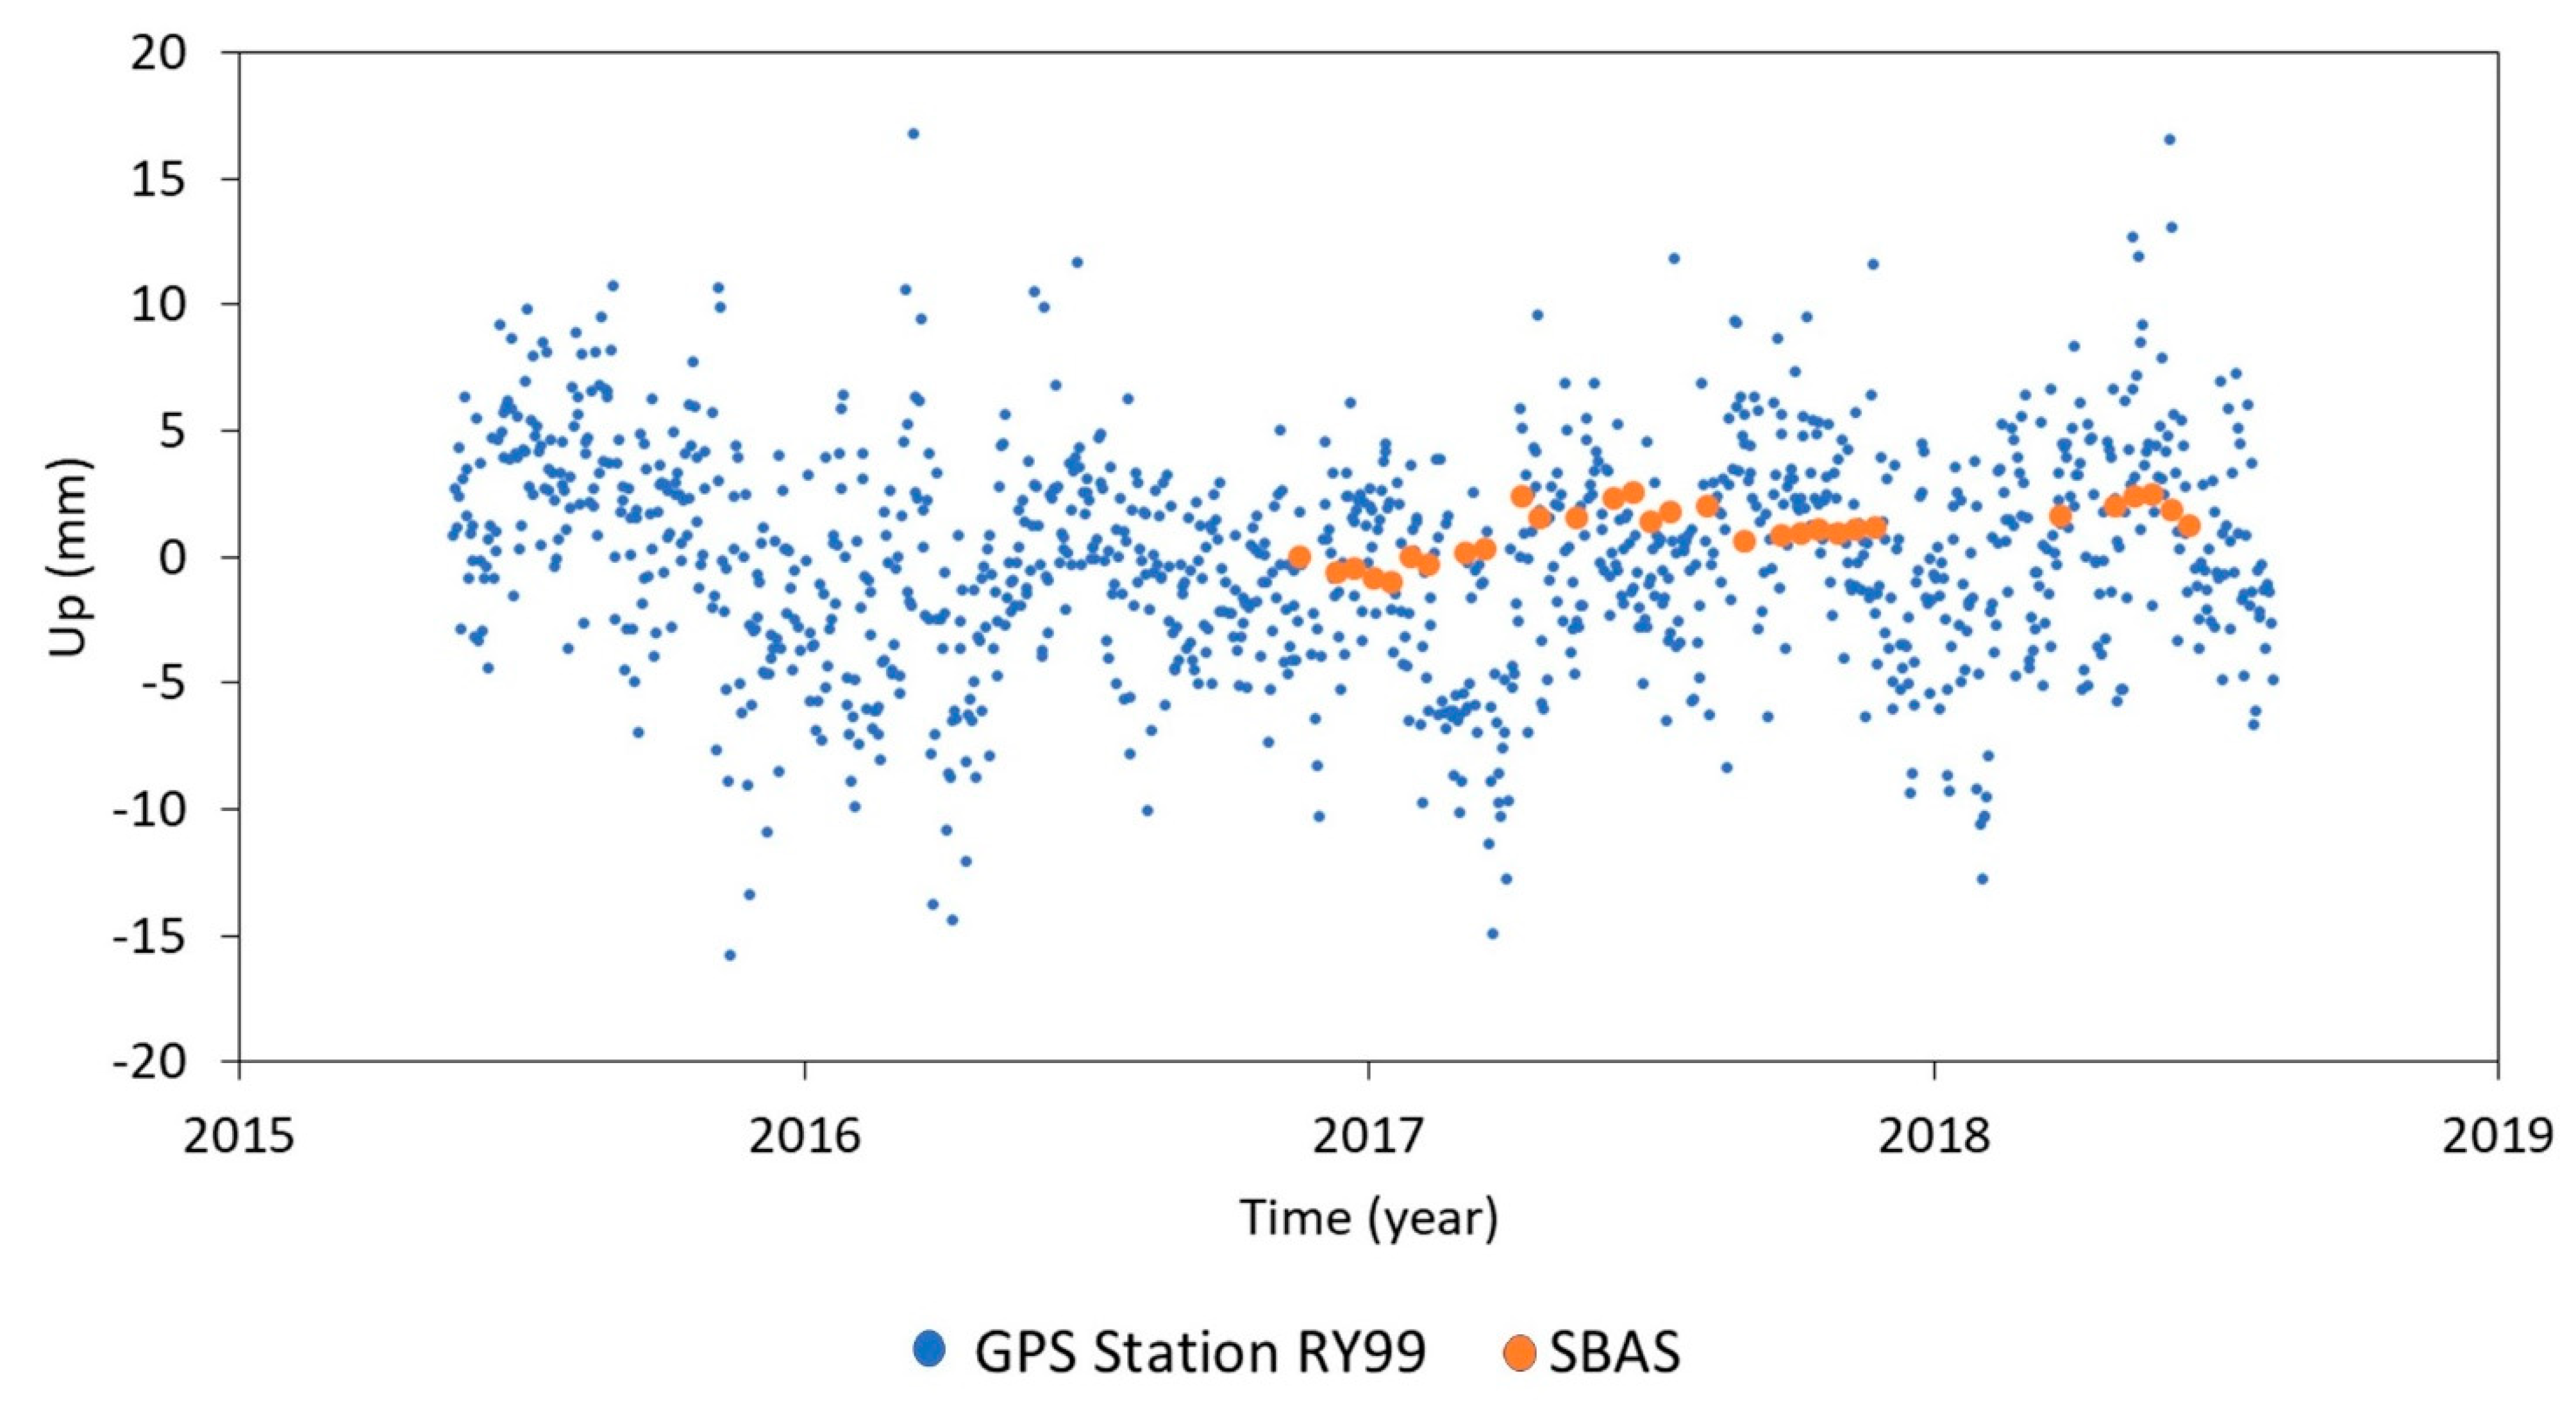
4.1. Comparison of SBAS and GPS Velocities

The east and north velocity components of the GPS measurement at the RY99 GPS station reported in Table 3 represent the northeast movement of the Arabian Plate towards Zagros Mountains in Iran [70,71]. It is safe to assume that this lateral plate motion movement is constant within the study area given that the area is located in the center of the Arabian Plate. These constant displacements (lateral or vertical) affecting the entire extent of the processed SAR data with the same magnitude (rate) will not be detected by the InSAR method. Instead, the LOS InSAR velocities describe the observed relative deformation within the extent of the processed SAR data. Hence, the observed SBAS deformation accounts only for the relative deformation within the processed area.
We compared the LOS velocities from the SBAS analysis (1.29 ± 0.2 mm/y) during the investigated period to those vertical GPS velocities (−0.12 ± 0.27 mm/y) projected to satellite LOS direction derived from the Riyadh RY99 GPS station (Figure 6). The reported error for the LOS SBAS velocity over the GPS station was estimated using a statistical approach that accounts for trend errors in the time series [72,73]; specifically, Monte Carlo simulations were adopted by fitting trends and other terms for many (n = 10,000) synthetic datasets and the standard deviation of the extracted synthetic trends was interpreted as the trend error. The estimated statistical error is an underestimate of the overall uncertainties in LOS SBAS velocities because it does not fully account for the additional uncertainties related to SBAS processing (e.g., atmospheric artifacts, unwrapping errors, and residual topography). Those uncertainties could exceed 2 mm/y for the number of utilized Sentinel-1 scenes [74]. Thus, the radar-based velocities are not statistically different from GPS velocities within 2 sigma error and no calibration for the radar-based velocities was conducted.

4.2. Subsidence Over Wadis and Lowlands

Inspection of the deformational velocities displayed in Figure 4a reveals moderate to high subsidence rates (up to −21 mm/y) over highly localized areas in the western sections of the city. Inspection of digital elevation maps over these areas reveals that many of these areas are concentrated within wadis and lowlands in the western sections of the city, but much less so on the eastern side (Figure 4a,b). Examples of subsiding areas within wadis include sites W2, W5, W6, W7, and W11 in wadi Hanifah or in wadis draining in, and proximal to it (wadi Hanifa), sites W1, W3, and W4 in wadi Wubay, site W8, W9, and W13 in wadi Laban, sites W10 and W12 in wadi Namar on the western side, and site W14 (Al Janadriyah area) on the eastern side (Figure 4). Examples of subsiding areas within lowlands include sites L2, L3, L5, L6, L7, L8, L9 in An Narjis District, L4 in Al Yasmin District, and L10 in An Nakhil District on the northern side, site L1 in Khashm Al An District on the eastern side, and sites L11, L12, and L13 in Tuwaiq District on the western side of Riyadh (Figure 4).
Inspection of temporal (2001–2018) Google Earth images over the above-mentioned subsiding areas indicates that the majority of these areas show evidence for increasing urbanization and associated increase in the soil moisture with time (e.g., sites from L1 to L13 and W5, W6, and W7; Figure 4). The increase of soil moisture can be inferred from the increased vegetation and waterlogging along these valleys and lowlands with time. As soil moisture increases, the soil darkens in tone, and approaches low reflectance values (dark grey to black tones) in waterlogged areas. The observed tonal variations in the wadis are local in nature and should not be confused with the evenly distributed spectral effects caused by seasonal variations in scene illumination or by precipitation-related variations in soil moisture. Both of these seasonal effects will affect the overall brightness of the individual wadis throughout their length and the brightness of the wadi network across the entire scene. In a number of these wadis and lowlands where waterlogging has been problematic there have been attempts to fill the waterlogged areas with loose sediments (e.g., sites W2, W5, W6, W7, W8, W10, W11, and W12; Figure 4).
Figure 7 shows LOS deformation rates (2016–2018) over subsiding areas within Wadi Hanifah (site W5) and displays temporal Google Earth images (March 2001–October 2016) and ArcGIS online base maps that show landscape evolution and progressive urbanization over time (2001: Figure 7a; 2005: 7b; 2014: 7c; 2016: 7d; 2019: 7e). Inspection of Figure 7 shows that in 2001, the site was barren and was dissected by an east–west trending wadi network (Figure 7a). The area witnessed the onset of urbanization by 2005 (Figure 7b), and the appearance of vegetation and burial of sections of the main wadi by 2014 (Figure 7c). Comparison between Figure 7c,d reveals that the progressive urbanization between 2014 and 2016 was associated with waterlogging and increased vegetation. Deformation rates of up to −9 mm/y were observed over the levelled and buried sections on the main wadi in Figure 7e. The LOS deformation rates were plotted over the 2019 ArcGIS online base map. Although not shown, this scenario is typical of sites W1, W3, W4, W9, W13, and W14 (Figure 4).
Similar high LOS subsidence rates and landscape evolution were observed over lower elevation areas, hereafter referred to as lowlands, that witnessed progressive urbanization through time. Figure 8 shows LOS deformation rates over subsiding areas within a lowland in An Narjis District (site L7) and displays temporal Google Earth images (April 2008–November 2018) and ArcGIS online base maps that show evolution of the landscape and progressive urbanization through time. Site L7, a barren area, was divided into parcels by 2008 (Figure 8a) and witnessed progressive urbanization starting in 2012 (Figure 8b). The progressive urbanization caused increased soil wetness and waterlogging, which was observed in the 2016 image (Figure 8c) and apparently required covering by loose soils observed in the 2018 image (Figure 8d). Deformation rates of up to −6 mm/y were observed over the central sections in Figure 8e, where the LOS deformation rates were plotted over the 2019 ArcGIS online base map. Although not shown, this scenario is typical of site L10. In the preceding examples (sites W5 and L7), and in other subsiding lowlands and wadi sections, the urbanization extended over these areas (e.g., sites W1 to W4; W6 to W14; L1 to L6; and L8 to L13; Figure 4). Not all of the subsidence within wadis and lowlands was associated with progressive urbanization. Exceptions include W14, a wadi that is distant from, and upstream of, urban areas.
We attribute the above-mentioned subsidence in lowlands and wadis to release of effluents from septic systems into both alluvial and karstic aquifers. Until recently the overwhelming majority of urban developments had decentralized sewage systems that utilize septic tanks, where the effluents were released in the underlying alluvial or karstic aquifers. It was reported that sewerage system in Riyadh serve only 50% of urban area population, while the remaining 50% uses lined and unlined septic tanks and shallow wells for wastewater disposal [54,75]. As described earlier, these practices led to increase in soil moisture and rise in groundwater levels in Riyadh, discharge of perched groundwater or groundwater in the lowlands and wadis, waterlogging in these areas, and their burial by loose sediments. An average rate of rise in water level of about 0.55 m/y was reported from eastern Riyadh [51]. The wetting of dry, unconsolidated, porous deposits flooring the wadis can cause hydrocompaction [76], a phenomenon that causes subsidence in such areas [76].
Hydrocompaction associated with wetting of loose sediments in the dry wadis or those used to bury the waterlogged areas is here interpreted to be causing the observed high rates of subsidence described above. The wetting of dry and loose sediments could be accomplished by flash floods (e.g., W14) in wadis and by sewage effluents in waterlogged areas (e.g., W5, W6, W7, W9, and W13; Figure 4) and the filling of waterlogged areas within wadis and lowlands with loose sediments will have the effect of broadening the areas affected by the advocated hydrocompaction-related subsidence.

4.3. Subsidence Over Karstic Topography

Figure 4a reveals additional locations that display moderate subsidence rates of up to −9 mm/y (e.g., K1, K2, K3, K4, K5, D1, and D2: Figure 4) to high subsidence rates of up to −21 mm/y (e.g., LF1 to LF4; Figure 4). Inspection of temporal Google Earth images together with our field observations over all these areas reveals that unlike the previously described locations (W1 to W4 and W6 to W14; L1 to L6 and L8 to L13: Figure 4) these sites do not display many of the features typical of a hydrocompaction-related origin. These sites are not found in lowlands or wadis, do not show evidence of progressive increase in urbanization, vegetation, or waterlogging, and do not show an increase in soil moisture with time. A number of these locations (K1, K2, K3, K4, and K5; Figure 4) are found in the Al Qirawan District and lie over and/or are underlain at depth by formations characterized by karstic topography (limestone, dolomite, and anhydrite), namely, the outcrops of the Upper Jurassic Jubalia Formation, the highly fractured limestone and evaporite of the Jurassic Arab Formation, and the dolomite limestone of the Cretaceous Sulaiy Formation. Solution features (voids, open fractures, side wall cavities, caves, scattered collapsed and buried sinkholes, and solution caverns) resulting from chemical leaching of carbonate and evaporite rich formations were reported from these formations using a wide range of techniques and disciplines. These include field, geophysical (electrical resistivity, seismic refraction, and ground penetrating radar) investigations, core drilling, in situ permeability tests (i.e., loss of drilling water and backfill grout), mechanical probes (rate of drilling in relation to depth), geotechnical studies [17,77,78,79], and InSAR analyses [36].
Inspection of temporal Google Earth images (January 2014–December 2018) over one of these areas (site K1) shows that until 2014, this site was a barren land formed largely of low-lying carbonate hills (height: 3 to 5 m above surroundings) that are dissected by wadis (Figure 9a). The removal of the hills, levelling, and subdivision of the area into parcels apparently began around 2016 (Figure 9b), proceeded in 2017 (Figure 9c) and 2018 (Figure 9d), and was completed in 2019 (Figure 9e). By then all the hills were removed and the terrain was levelled and subdivided into parcels in preparation for development of large urban projects. These constructional activities involved the operation of heavy machinery, the addition (and later wetting) of a layer of sediment (thickness: from 1 m up to 15 m), and compaction of the surface and substrate material by heavy machinery [80]. One plausible explanation for the observed deformation is that the compaction and wetting of sediments and/or the collapse of the voids and cavities at depth through the use of heavy machinery [80,81] could have produced collapse of paleo-sinkholes and voids, sagging in the overlying layers (e.g., [82,83,84]), and the LOS subsidence (up to −5 mm/y) observed in Figure 9e. However, we cannot ensure that the observed subsidence is characteristic of the (undisturbed) surface because the period during which the above-mentioned surface-shaping activities occurred coincided with the period of SBAS study (2016–2018).

4.4. Subsidence Over Dumpsites and Landfills

Unlike all of the previously described sites that are located over limestone formations, D1 (Ar Rimayah District) and D2 (Qurtubah District) lie over the Quaternary alluvial gravel, sand, and silt deposits of Wadi AlKharj (Figure 4b,c). Our field observations and inspection of temporal Google Earth images (May 2009–November 2014; Figure 10) reveal that these two sites have been used as unorganized dump sites. Up to 2009, site D1 was barren land formed largely of low-lying alluvium sediments (Figure 10a). By 2011, the area was already being used as a dumping site for building and municipal solid waste materials (Figure 10b) and continued as such into 2013, where a significant increase in the spatial extent of the dump site was observed (Figure 10c). By 2014 the use of the area as a dump site ceased. Instead, the southern sections of the dumpsite were levelled, and a submeter-thick soil layer was added and compacted by heavy machinery; construction proceeded of urban settlements atop the buried sections of the dump site (Figure 10d). The process of erecting structures atop the buried dumpsite continued up to 2019, as shown in Figure 10e, which also shows LOS subsidence of up to −6 mm/y over the buried sections of the dumpsite. The figure also shows varying subsidence rates (−1 mm/y to −6 mm/y) over the buried areas within the dump site (Figure 10e), an observation that suggests that the compacted materials could be subsiding at different rates over relatively small distances. If true, this differential settling could jeopardize the integrity of the overlying constructions.
Sites LF1 (area: 0.80 km2; Al Marwah District; Figure 4), LF2 (area: 0.38 km2; Al Marwah District; Figure 4), LF3 (area: 0.55 km2; As Sulay District; Figure 4), and LF4 (area 0.1 km2; Al Manakh District; Figure 4) were described as locations of organized landfills that were in place prior to year 2000 [56,85,86,87]. Landfills LF1, LF2, and LF3 received waste material from farms, houses, companies, streets, hospitals, workshops, factories, and construction sites, whereas landfill LF4 received industrial waste from a cement factory [56,85,86]. A common practice in these landfills is to spread (with heavy machinery) and compress the waste products to a thickness of 2.5 m, then cover the compressed waste by a submeter-thick layer of loose soil [85].
Figure 11 shows high LOS subsidence rates over sites LF1 (up to −21 mm/y) and LF2 (−11 mm/y). Although not shown, the subsidence rates over LF3 and LF4 are also as high (LF3: up to −21 mm/y; LF4: −9 mm/y, respectively). We attribute the observed high subsidence rates over L1, L2, L3, and L4 to mechanical compression and biochemical processes. Mechanical compression refers to compression of air-filled pores within the waste products, a continuous and long-term process that is caused by compression of low-density waste products. The biochemical processes refer to the continuous decomposition of organic matter [88,89,90]. Similar observations (subsidence over landfills) were reported over landfills (e.g., Noeul and Haneul parks in Seoul, Korea; [90]).

5. Discussion

The majority of the rapidly growing cities in arid lands were not intended to accommodate as many inhabitants as they do today, nor were they expected to expand as much in area. In this respect, the environmental problems associated with this widespread and rapid urban expansion described in this work were not expected, nor were their remedies adequately planned for ahead of time. For example, while the effluents discharged from septic systems in Riyadh did not pose significant environmental problems in the early 1990′s, they do now, as they were found to increase soil moisture and cause waterlogging and subsidence in wadis and lowlands. Similarly, the earlier unregulated dump sites outside the boundaries of the old city did not pose environmental problems at the time, but decades later, these dumpsites are located at the outskirts of, or incorporated within, the new borders of the expanded city, making them potential sites for future construction that could be subject to differential settling.
Integrated studies similar to the one carried out here can provide insights into the ongoing and earlier ground deformation in rapidly growing urban centers in arid lands, investigate the driving forces for the observed deformation, and identify areas most impacted for the purpose of directing and prioritizing remedial efforts. For example, the areas that should be among the first to be switched from septic to centralized sewage systems are those showing high subsidence rates, increase in soil moisture, and are subject to waterlogging. Furthermore, our approach could be used to identify buried dump sites and/or karst undergoing subsidence for the purpose of cautioning against, or adhering to appropriate building codes for, new construction over these sites.
Our approach has its limitations. The LULC observations cover a much longer time span (2001–2019) than that covered by the stack of Sentinel-1 scenes that were used in this study (2016–2018), and thus we could not assess the variations in deformation rates associated with LULC throughout the entire period covered by Google Earth images.

6. Conclusions

Rapid, and in many cases, disorganized urban expansion of the older major cities within the countries of the Saharan-Arabian Desert often causes adverse environmental impacts, one of which is land subsidence. Using Riyadh city, the capital of Saudi Arabia as a test site we assessed the magnitude and nature of land deformation associated with rapid urban growth over the study area and which could be applicable to many of the megacities within the Saharan-Arabian Desert. We adopted an integrated approach that relies on the extraction of deformation rates (period: 2016 to 2018) from Sentinel-1 images using SBAS interferometric analyses, verified the SBAS-deformation rates against GPS measurements, examined LULC variations over deformed areas using multi-temporal high-resolution images viewable on Google Earth in search of causal effects, and collected field observations to verify the inferred factors (anthropogenic versus natural forcings) causing subsidence.
Thirty-eight sites experienced subsidence rates exceeding −4 mm/y and were found over stretches of wadis and lowlands, areas characterized by karstic topography, and over dumpsites and landfills. Subsidence (up to −20 mm/y) over wadis and lowlands was here attributed to discharge of wastewater effluents from septic systems in newly urbanized areas that lead to an increase in soil moisture, rise in groundwater levels, waterlogging, and wetting and hydrocompaction of dry and loose alluvium sediments. Subsidence (up to −5 mm/y) over areas characterized by karstic topography was related to dissolution of karst-bearing formations by wastewater effluents and possibly the collapse of voids and cavities at depth under stresses introduced by heavy construction machinery. Finally, high subsidence rates (up to −21 mm/y) and differential settling were observed over landfills and dump sites due to leveling, compaction, and degradation of municipal and building waste materials. The latter (differential settling) could jeopardize the stability of structures, if erected over these sites.
Our findings illustrate a wide range of adverse environmental impacts due to rapid and widespread urbanization of urban centers in arid environments and highlight the potential applications of the advocated integrated methodology (SBAS interferometric analyses, GPS measurements, LULC variations from multi-temporal high-resolution images viewable on Google Earth, field observations) in addressing these environmental issues. These include assessing the distribution and magnitude of land subsidence associated with rapid urban growth in arid lands, investigating the cause of the observed subsidence, and identifying areas most impacted for the purpose of directing and prioritizing remedial efforts.

Author Contributions

A.A. played a significant role in processing of the remote sensing data, conducting field work, and preparation of the manuscript. M.S. (Mohamed Sultan) supervised the overall project and assisted in the analysis of the radar data and the development of the manuscript. M.S.E., A.Z.A., K.A. and M.S. (Mohamed Saleh) helped and supported the implementation of the project from beginning to end. M.I. and M.K.E. helped in the processing of the radar data. R.B. provided input and guidance throughout all stages of the project. All authors have read and agreed to the published version of the manuscript.

Funding

This research was funded by the Saudi Arabian Cultural Mission in the USA and the Earth Sciences Remote Sensing Facility (ESRS) at Western Michigan University.

Acknowledgments

The authors would like to thank the Saudi Geological Survey for their scientific and logistical support, the Ministry of Environment, Water, and Agriculture for providing data, and the Anonymous Reviewers of Remote Sensing for their thorough review, and their instructive comments and suggestions.

Conflicts of Interest

The authors declare that they have no conflict of interest.

References

  1. UN. World Economic and Social Survey 2004; UN: New York, NY, USA, 2004. [Google Scholar]
  2. Güneralp, B.; Seto, K.C. Environmental impacts of urban growth from an integrated dynamic perspective: A case study of Shenzhen, South China. Glob. Environ. Chang. 2008, 18, 720–735. [Google Scholar] [CrossRef]
  3. Yang, X.; Yue, W.; Xu, H.; Wu, J.; He, Y. Environmental consequences of rapid urbanization in Zhejiang Province, East China. Int. J. Environ. Res. Public Health 2014, 11, 7045–7059. [Google Scholar] [CrossRef] [PubMed]
  4. Elkadiri, R.; Manche, C.; Sultan, M.; Al-Dousari, A.; Uddin, S.; Chouinard, K.; Abotalib, A.Z. Development of a Coupled Spatiotemporal Algal Bloom Model for Coastal Areas: A Remote Sensing and Data Mining-Based Approach. IEEE J. Sel. Top. Appl. Earth Obs. Remote Sens. 2016, 9, 5159–5171. [Google Scholar] [CrossRef]
  5. Abidin, H.; Andreas, H.; Gumilar, I.; Sidiq, T.P.; Gamal, M. Environmental impacts of land subsidence in urban areas of Indonesia. In Proceedings of the FIG Working Week, Sofia, Bulgari, 17–21 May 2015; Paper no. 7568. pp. 17–21. [Google Scholar]
  6. Dang, V.K.; Doubre, C.; Weber, C.; Gourmelen, N.; Masson, F. Recent land subsidence caused by the rapid urban development in the Hanoi region (Vietnam) using ALOS InSAR data. Nat. Hazards Earth Syst. Sci. 2014, 14, 657–674. [Google Scholar] [CrossRef] [Green Version]
  7. Holzer, T.L.; Johnson, A.I. Land subsidence caused by ground water withdrawal in urban areas. GeoJournal 1985, 11, 245–255. [Google Scholar] [CrossRef]
  8. Aina, Y.A.; Merwe, J.H.V.; Alshuwaikhat, H.M. Urban Spatial Growth and Land Use Change in Riyadh: Comparing Spectral Angle Mapping and Band Ratioing Techniques. In Proceedings of the Academic Track of the 2008 Free and Open Source Software for Geospatial (FOSS4G) Conference, Incorporating the GISSA 2008 Conference, Cape Town, South Africa, 29 September–3 October 2008; pp. 51–57. [Google Scholar] [CrossRef]
  9. Hou, H.; Estoque, R.C.; Murayama, Y. Spatiotemporal analysis of urban growth in three African capital cities: A grid-cell-based analysis using remote sensing data. J. Afr. Earth Sci. 2016, 123, 381–391. [Google Scholar] [CrossRef]
  10. Tawfeek, Y.Q.; Jasim, F.H.; Al-Jiboori, M.H. A study of canopy urban heat Island of Baghdad, Iraq. Asian J. Atmos. Environ. 2020, 14, 280–288. [Google Scholar] [CrossRef]
  11. UNDESA. World Urbanization Prospects; UNDESA: New York, NY, USA, 2018; Volume 12, ISBN 9789211483192. [Google Scholar]
  12. Pankratz, H.G.; Sultan, M.; Abdelmohsen, K.; Sauck, W.A.; Alsefry, S.; Alharbi, H.; Emil, M.K.; Gebremichael, E.; Asaeidi, A.; Alshehri, F.; et al. Use of Geophysical and Radar Interferometric Techniques to Monitor Land Deformation Associated with the Jazan Salt Diapir, Jazan city, Saudi Arabia. Surv. Geophys. 2021, 42, 177–200. [Google Scholar] [CrossRef]
  13. Alahmadi, M.; Atkinson, P.M. Three-fold urban expansion in Saudi Arabia from 1992 to 2013 observed using calibrated DMSP-OLS night-time lights imagery. Remote Sens. 2019, 11, 2266. [Google Scholar] [CrossRef] [Green Version]
  14. Vaslet, D.; Al-Muallem, M.; Maddah, S.S.; Brosse, J.-M.; Fourniguet, J.; Breton, J.-P.; Le Nindre, Y.-M. Explanatory Notes to the Geologic Map of the Ar Riyad Quadrangle, Sheet 24 I, Kingdom of Saudi Arabia. PDF; Jeddah: Mecca, Saudi Arabia, 1991. [Google Scholar]
  15. ElKhedr Ibrahim Aeromagnetic data interpretation to locate buried faults in Riyadh region, Saudi Arabia. Sci. Res. Essays 2012, 7. [CrossRef]
  16. Alkhayyal, Z. Urban Growth Change Analysis of Riyadh, Saudi Arabia: 2005–2015. Saint Mary’s Univ. Minnesota Univ. Cent. Serv. Press 2017, 20, 10. [Google Scholar]
  17. Cueto, M.; Olona, J.; Fernández-Viejo, G.; Pando, L.; López-Fernández, C. Karst-induced sinkhole detection using an integrated geophysical survey: A case study along the Riyadh metro line 3 (Saudi Arabia). Near Surf. Geophys. 2018, 16, 270–281. [Google Scholar] [CrossRef]
  18. Papadopoulou, M.P.; Karatzas, G.P.; Bougioukou, G.G. Numerical modelling of the environmental impact of landfill leachate leakage on groundwater quality—A field application. Environ. Model. Assess. 2007, 12, 43–54. [Google Scholar] [CrossRef]
  19. Jhamnani, B.; Singh, S. Groundwater contamination due to Bhalaswa landfill site in New Delhi. Int. J. Enviorn. Sci. Eng. 2009, 3, 121–125. [Google Scholar]
  20. Jafari, N.H.; Stark, T.D.; Merry, S. The July 10 2000 Payatas landfill slope failure. Int. J. Geoengin. Case Hist. 2013, 2, 208–228. [Google Scholar] [CrossRef]
  21. Raviteja, K.V.N.S.; Basha, B.M. Probabilistic back analysis of Koshe landfill slope failure. In Proceedings of the Indian Geotechnical Conference, Guwahati, India, 14–16 December 2017; pp. 1–5. [Google Scholar]
  22. Yadav, H.; Kumar, P.; Singh, V.P. Hazards from the municipal solid waste dumpsites: A review. In Proceedings of the Lecture Notes in Civil Engineering; Springer: Berlin/Heidelberg, Germany, 2019; Volume 21, pp. 336–342. [Google Scholar]
  23. Ren, G.; Whittaker, B.N.; Reddish, D.J. Mining subsidence and displacement prediction using influence function methods for steep seams. Min. Sci. Technol. 1989, 8, 235–251. [Google Scholar] [CrossRef]
  24. Hu, B.; Wang, H.-S.; Sun, Y.-L.; Hou, J.-G.; Liang, J. Long-term land subsidence monitoring of Beijing (China) using the small baseline subset (SBAS) technique. Remote Sens. 2014, 6, 3648–3661. [Google Scholar] [CrossRef] [Green Version]
  25. Rateb, A.; Abotalib, A.Z. Inferencing the land subsidence in the Nile Delta using Sentinel-1 satellites and GPS between 2015 and 2019. Sci. Total Environ. 2020, 729, 138868. [Google Scholar] [CrossRef]
  26. Becker, R.H.; Sultan, M. Land subsidence in the Nile Delta: Inferences from radar interferometry. Holocene 2009, 19, 949–954. [Google Scholar] [CrossRef]
  27. Bhattacharya, A.; Mukherjee, K. Review on InSAR based displacement monitoring of Indian Himalayas: Issues, challenges and possible advanced alternatives. Geocarto Int. 2017, 32, 298–321. [Google Scholar] [CrossRef]
  28. Zhao, C.; Zhang, Q.; Yang, C.; Zou, W. Integration of MODIS data and short baseline subset (SBAS) technique for land subsidence monitoring in Datong, China. J. Geodyn. 2011, 52, 16–23. [Google Scholar] [CrossRef]
  29. Wei, L.; Zhang, Y.; Zhao, Z.; Zhong, X.; Liu, S.; Mao, Y.; Li, J. Analysis of mining waste dump site stability based on multiple remote sensing technologies. Remote Sens. 2018, 10, 2025. [Google Scholar] [CrossRef] [Green Version]
  30. Galloway, D.L.; Burbey, T.J. Review: Regional land subsidence accompanying groundwater extraction. Hydrogeol. J. 2011, 19, 1459–1486. [Google Scholar] [CrossRef]
  31. Gabriel, A.K.; Goldstein, R.M.; Zebker, H.A. Mapping small elevation changes over large areas: Differential radar interferometry. J. Geophys. Res. 1989, 94, 9183–9191. [Google Scholar] [CrossRef]
  32. Galloway, D.L.; Hoffmann, J. The application of satellite differential SAR interferometry-derived ground displacements in hydrogeology. Hydrogeol. J. 2007, 15, 133–154. [Google Scholar] [CrossRef] [Green Version]
  33. Galloway, D.L.; Hudnut, K.W.; Ingebritsen, S.E.; Phillips, S.P.; Peltzer, G.; Rogez, F.; Rosen, P.A. Detection of aquifer system compaction and land subsidence using interferometric synthetic aperture radar, Antelope Valley, Mojave Desert, California. Water Resour. Res. 1998, 34, 2573–2585. [Google Scholar] [CrossRef]
  34. Fielding, E.J.; Blom, R.G.; Goldstein, R.M. Rapid subsidence over oil fields measured by SAR interferometry. Geophys. Res. Lett. 1998, 25, 3215–3218. [Google Scholar] [CrossRef]
  35. Othman, A.; Sultan, M.; Becker, R.; Alsefry, S.; Alharbi, T.; Gebremichael, E.; Alharbi, H.; Abdelmohsen, K. Use of geophysical and remote sensing data for assessment of aquifer depletion and related land deformation. Surv. Geophys. 2018, 39, 543–566. [Google Scholar] [CrossRef] [PubMed] [Green Version]
  36. Othman, A.; Abotalib, A.Z. Land subsidence triggered by groundwater withdrawal under hyper-arid conditions: Case study from Central Saudi Arabia. Environ. Earth Sci. 2019, 78, 243. [Google Scholar] [CrossRef]
  37. Chen, M.; Tomás, R.; Li, Z.; Motagh, M.; Li, T.; Hu, L.; Gong, H.; Li, X.; Yu, J.; Gong, X. Imaging land subsidence induced by groundwater extraction in Beijing (China) using satellite radar interferometry. Remote Sens. 2016, 8, 468. [Google Scholar] [CrossRef] [Green Version]
  38. Berardino, P.; Casu, F.; Fornaro, G.; Lanari, R.; Manunta, M.; Manzo, M.; Pepe, A.; Sansosti, E. Small baseline DIFSAR techniques for earth surface deformation analysis. In Proceedings of the FRINGE 2003 Workshop (ESA SP-550), Frascati, Italy, 1–5 December 2003; Volume 550, pp. 7–12. [Google Scholar]
  39. Lanari, R.; Mora, O.; Manunta, M.; Mallorquí, J.J.; Berardino, P.; Sansosti, E. A small-baseline approach for investigating deformations on full-resolution differential SAR interferograms. IEEE Trans. Geosci. Remote Sens. 2004, 42, 1377–1386. [Google Scholar] [CrossRef]
  40. Almazroui, M.; Islam, M.N.; Jones, P.D.; Athar, H.; Rahman, M.A. Recent climate change in the Arabian Peninsula: Seasonal rainfall and temperature climatology of Saudi Arabia for 1979–2009. Atmos. Res. 2012, 111, 29–45. [Google Scholar] [CrossRef]
  41. GTZ/DCO. Detailed Water Resources Studies of Wajid and Overlying Aquifers; Ministry of Water and Electricity: Riyadh, Saudi Arabia, 2009.
  42. Abotalib, A.Z.; Mohamed, R.S.A. Surface evidences supporting a probable new concept for the river systems evolution in Egypt: A remote sensing overview. Environ. Earth Sci. 2013, 69, 1621–1635. [Google Scholar] [CrossRef]
  43. Bamousa, A.O. Tectonic and Eustatic Sea-Level Fluctuations during the Early Cretaceous: A Case Study from the Berriasian–Valanginian Sequences in Saudi Arabia; Springer: Cham, Switzerland, 2019; pp. 315–317. [Google Scholar]
  44. Jado, A.; Johnson, D. Solution caverns in the Dammam Dome, Dhahran, Saudi-Arabia. Arab. J. Sci. Eng. 1983, 8, 69–73. [Google Scholar]
  45. Grosch, J.J.; Touma, F.T.; Richards, D.P. Solution cavities in the limestone of eastern Saudi Arabia. In Multidisciplinary Conference on Sinkholes and the Environmental Impacts of Karst. 2; A. A. Balkema: Rotterdam, The Netherlands, 1987; pp. 73–78. [Google Scholar]
  46. Shehata, W.; Bader, T.; Hariri, Z. Principal geological hazards along the Arabian Gulf coast. J. King Abdulaziz Univ. Sci. 1990, 3, 289–302. [Google Scholar] [CrossRef]
  47. Memesh, A.; Dini, S.M.; Gutiérrez, F.; Wallace, C.A. Evidence of large-scale subsidence caused by interstratal karstification of evaporites in the interior homocline of Central Saudi Arabia. Geophys. Res. Abstr. 2008, 10, A-02276. [Google Scholar]
  48. Powers, R.W.; Ramirez, L.F.; Redmond, C.D.; Elberg, E.L.J. Geology of the Arabian Peninsula. U.S. Geol. Surv. Prof. Pap. 1966, 560-D, 154. [Google Scholar]
  49. Kalbus, E.; Oswald, S.; Wang, W.; Kolditz, O.; Engelhardt, I.; Al-saud, M.I.; Rausch, R. Large-scale modeling of the groundwater resources on the Arabian Platform. Int. J. Water Resour. Arid Environ. 2011, 1, 38–47. [Google Scholar]
  50. Sultan, M.; Sturchio, N.C.; Alsefry, S.; Emil, M.K.; Ahmed, M.; Abdelmohsen, K.; AbuAbdullah, M.M.; Yan, E.; Save, H.; Alharbi, T.; et al. Assessment of age, origin, and sustainability of fossil aquifers: A geochemical and remote sensing-based approach. J. Hydrol. 2019, 576, 325–341. [Google Scholar] [CrossRef]
  51. Al-Othman, A.A.; Ahmed, I. Hydrogeological framework and its implication on water level rise in Eastern ArRiyadh, Saudi Arabia. Environ. Earth Sci. 2012, 67, 1493–1502. [Google Scholar] [CrossRef]
  52. Fnais, M.S. Geophysical characteristics of wadi hanifah water system, Riyadh, Saudi Arabia. Arab. J. Geosci. 2011, 4, 1051–1066. [Google Scholar] [CrossRef]
  53. Al-Harthi, A.A.; Bankher, K.A. Collapsing loess-like soil in western Saudi Arabia. J. Arid Environ. 1999, 41, 383–399. [Google Scholar] [CrossRef] [Green Version]
  54. Ouda, O.K.M. Treated wastewater use in Saudi Arabia: Challenges and initiatives. Int. J. Water Resour. Dev. 2016, 32, 799–809. [Google Scholar] [CrossRef]
  55. Ouda, O.K.M.; Cekirge, H.M. Roadmap for development of waste-to energy facility in Saudi Arabia. Am. J. Environ. Eng. 2013, 3, 267–272. [Google Scholar] [CrossRef]
  56. Ali, A.E.; Abdou Ibrahim, E.E.; Massad, E.M. Mapping waste-disposal sites in Riyadh using radarsat imagery. J. King Saud Univ. Eng. Sci. 2009, 21, 7–13. [Google Scholar] [CrossRef]
  57. Berardino, P.; Fornaro, G.; Lanari, R.; Sansosti, E. A new algorithm for surface deformation monitoring based on small baseline differential SAR interferograms. IEEE Trans. Geosci. Remote Sens. 2002, 40, 2375–2383. [Google Scholar] [CrossRef] [Green Version]
  58. Costantini, M.; Rosen, P.A. Generalized phase unwrapping approach for sparse data. In Proceedings of the International Geoscience and Remote Sensing Symposium (IGARSS), Hamburg, Germany, 28 June–2 July 1999; Volume 1, pp. 267–269. [Google Scholar]
  59. Ferretti, A.; Prati, C.; Rocca, F. Nonlinear subsidence rate estimation using permanent scatterers in differential SAR interferometry. IEEE Trans. Geosci. Remote Sens. 2000, 38, 2202–2212. [Google Scholar] [CrossRef] [Green Version]
  60. Blewitt, G.; Kreemer, C.; Hammond, W.C.; Gazeaux, J. MIDAS robust trend estimator for accurate GPS station velocities without step detection. J. Geophys. Res. Solid Earth 2016, 121, 2054–2068. [Google Scholar] [CrossRef]
  61. Dach, R.; Walser, P. Bernese GNSS Software Version 5.2 Tutorial Processing Example Introductory Course Terminal Session; University of Bern: Bern, Switzerland, 2015. [Google Scholar]
  62. Saleh, M.; Becker, M. A new velocity field from the analysis of the Egyptian Permanent GPS Network (EPGN). Arab. J. Geosci. 2014, 7, 4665–4682. [Google Scholar] [CrossRef]
  63. Saleh, M.; Becker, M. New constraints on the Nubia-Sinai-Dead Sea fault crustal motion. Tectonophysics 2015, 651, 79–98. [Google Scholar] [CrossRef]
  64. Altamimi, Z.; Rebischung, P.; Métivier, L.; Collilieux, X. ITRF2014: A new release of the International Terrestrial Reference Frame modeling nonlinear station motions. J. Geophys. Res. Solid Earth 2016, 121, 6109–6131. [Google Scholar] [CrossRef] [Green Version]
  65. Hollenstein, C.; Kahle, H.-G.; Geiger, A.; Jenny, S.; Goes, S.; Giardini, D. New GPS constraints on the Africa-Eurasia plate boundary zone in southern Italy. Geophys. Res. Lett. 2003, 30. [Google Scholar] [CrossRef]
  66. Bahrouni, N.; Masson, F.; Meghraoui, M.; Saleh, M.; Maamri, R.; Dhaha, F.; Arfaoui, M. Active tectonics and GPS data analysis of the Maghrebian thrust belt and Africa-Eurasia plate convergence in Tunisia. Tectonophysics 2020, 785, 228440. [Google Scholar] [CrossRef]
  67. Alothman, A.O.; Fernandes, R.M.; Bos, M.S.; Schillak, S.; Elsaka, B. Angular velocity of Arabian plate from multi-year analysis of GNSS data. Arab. J. Geosci. 2016, 9, 1–10. [Google Scholar] [CrossRef]
  68. Hegazy, D.; Abotalib, A.Z.; El-Bastaweesy, M.; El-Said, M.A.; Melegy, A.; Garamoon, H. Geo-environmental impacts of hydrogeological setting and anthropogenic activities on water quality in the Quaternary aquifer southeast of the Nile Delta, Egypt. J. Afr. Earth Sci. 2020, 172, 103947. [Google Scholar] [CrossRef]
  69. Radwan, T.M.; Blackburn, G.A.; Whyatt, J.D.; Atkinson, P.M. Dramatic loss of agricultural land due to urban expansion threatens food security in the Nile Delta, Egypt. Remote Sens. 2019, 11, 332. [Google Scholar] [CrossRef] [Green Version]
  70. Reilinger, R.; McClusky, S.; Vernant, P.; Lawrence, S.; Ergintav, S.; Cakmak, R.; Ozener, H.; Kadirov, F.; Guliev, I.; Stepanyan, R.; et al. GPS constraints on continental deformation in the Africa-Arabia-Eurasia continental collision zone and implications for the dynamics of plate interactions. J. Geophys. Res. Solid Earth 2006, 111, 1–26. [Google Scholar] [CrossRef]
  71. ArRajehi, A.; McClusky, S.; Reilinger, R.; Daoud, M.; Alchalbi, A.; Ergintav, S.; Gomez, F.; Sholan, J.; Bou-Rabee, F.; Ogubazghi, G.; et al. Geodetic constraints on present-day motion of the Arabian Plate: Implications for Red Sea and Gulf of Aden rifting. Tectonics 2010, 29, 1–10. [Google Scholar] [CrossRef] [Green Version]
  72. Scanlon, B.R.; Zhang, Z.; Save, H.; Wiese, D.N.; Landerer, F.W.; Long, D.; Longuevergne, L.; Chen, J. Global evaluation of new GRACE mascon products for hydrologic applications. Water Resour. Res. 2016, 52, 9412–9429. [Google Scholar] [CrossRef]
  73. Abdelmohsen, K.; Sultan, M.; Ahmed, M.; Save, H.; Elkaliouby, B.; Emil, M.; Yan, E.; Abotalib, A.Z.; Krishnamurthy, R.V.; Abdelmalik, K. Response of deep aquifers to climate variability. Sci. Total Environ. 2019, 677, 530–544. [Google Scholar] [CrossRef] [PubMed]
  74. Havazli, E.; Wdowinski, S. Detection threshold estimates for insar time series: A simulation of tropospheric delay approach. Sensors (Switzerland) 2021, 21, 1124. [Google Scholar] [CrossRef]
  75. Ouda, O.K.M. Water demand versus supply in Saudi Arabia: Current and future challenges. Int. J. Water Resour. Dev. 2014, 30, 335–344. [Google Scholar] [CrossRef]
  76. Saxena, N.C. Subsidence Management Handbook; Scientific Publishers: Rajasthan, India, 2018; ISBN 9789387869462/9387869466. [Google Scholar]
  77. Abdeltawab, S. Karst limestone geohazards in Egypt and Saudi Arabia. Int. J. Geoengin. Case Hist. 2013, 2, 258–269. [Google Scholar] [CrossRef]
  78. Abd El Aal, A. Identification and characterization of near surface cavities in Tuwaiq mountain limestone, Riyadh, KSA, “detection and treatment. ” Egypt. J. Pet. 2017, 26, 215–223. [Google Scholar] [CrossRef] [Green Version]
  79. Abd El-Aal, A.K.; Masoud, A.A. Impacts of karst phenomena on engineering properties of limestone foundation bed, Ar Riyadh, Saudi Arabia. Arab. J. Geosci. 2017, 10, 1–17. [Google Scholar] [CrossRef]
  80. Tatiya, R.R. Surface and Underground Excavations; CRC Press: Boca Raton, FL, USA, 2005. [Google Scholar]
  81. Zhou, W.; Beck, B.F. Engineering issues on karst. In Karst Management; Springer: Cham, The Netherlands, 2011; pp. 9–45. [Google Scholar]
  82. Newton, J.G. Development of sinkholes resulting from man’s activities in the Eastern United States. US Geol. Surv. Circ. 1987, 968. [Google Scholar]
  83. Parise, M.; Closson, D.; Gutiérrez, F.; Stevanović, Z. Anticipating and managing engineering problems in the complex karst environment. Environ. Earth Sci. 2015, 74, 7823–7835. [Google Scholar] [CrossRef]
  84. Waltham, T.; Waltham, A.C.; Bell, F.G.; Culshaw, M.G. Sinkholes and Subsidence: Karst and Cavernous Rocks in Engineering and Construction; Springer: Cham, The Netherlands, 2005. [Google Scholar]
  85. Algarni, D.A.; Ali, A.E. Mapping waste-disposal sites using SPOT remote sensor data: Riyadh case. J. King Saud Univ. Eng. Sci. 1998, 10, 15–29. [Google Scholar] [CrossRef]
  86. Bian, Q.; Alharbi, B.; Shareef, M.M.; Husain, T.; Pasha, M.J.; Atwood, S.A.; Kreidenweis, S.M. Sources of PM2.5 carbonaceous aerosol in Riyadh, Saudi Arabia. Atmos. Chem. Phys. 2018, 18, 3969–3985. [Google Scholar] [CrossRef] [Green Version]
  87. Loni, O.A.; Hussein, M.T.; Alrehaili, A.M. Geo-environmental effect of landfill site, southeast of Riyadh, Saudi Arabia. Arab. J. Geosci. 2013, 6, 2021–2033. [Google Scholar] [CrossRef]
  88. Shin, B.W.; Lee, B.J.; Bae, W.S.; Lee, J.K.; Ahn, B.-C. The settlement characteristics of waste landfill site by consolidation test. J. Korean GEO Environ. Soc. 2000, 1, 35–42. [Google Scholar]
  89. Cho, Y.-K.; Chae, Y.S. Analysis of long-term settlement parameter correlation and bearing capacity reinforcement effect for closed waste landfill. J. Korean Geosynth. Soc. 2013, 12, 1–10. [Google Scholar] [CrossRef] [Green Version]
  90. Baek, W.-K.; Jung, H.-S.; Jo, M.-J.; Lee, W.-J.; Zhang, L. Ground subsidence observation of solid waste landfill park using multi-temporal radar interferometry. Int. J. Urban Sci. 2019, 23, 406–421. [Google Scholar] [CrossRef]
Figure 1. (a) Simplified geologic map for Riyadh and its surroundings (modified after [14,15]). (b) Location map showing the distribution of the Riyadh Province, the current extension of the city of Riyadh (this work), and the planned extensions (phases 1 through 4) of the city in accordance with the Comprehensive Riyadh Strategic Plan [16]. (c) Cross section along line A–A’ in Figure 1a showing the variations in elevations of formations in units of meters above mean sea level (m.a.m.s.l).
Remotesensing 13 01109 g001
Figure 2. A 3-D rendering of a Landsat 8 false color image (spatial resolution: 30 m) over the study area draped over a DEM (vertical exaggeration: 30) showing the city of Riyadh largely occupying the lowlands in between the Tuwaiq mountains in the west and the Hith Mountains in the east.
Remotesensing 13 01109 g002
Figure 3. Spatial baseline-time plots for 39 ascending Sentinel-1 (Path 72; Frame: 73 and 77) scenes (Table 1) that were used for Small Baseline Subset (SBAS) analysis. Further shown is the distribution of the main primary scene, included and eliminated scenes, and the interferometric pairs. Scenes yielding interferograms with heavy atmospheric contributions and/or low coherence were omitted; the remaining scenes (30 scenes; acquisition period: 16 November 2016 to 15 June 2018; Table 1) were included in the SBAS analysis and were subjected to additional processing.
Remotesensing 13 01109 g003
Figure 4. (a) Line of sight (LOS) land deformation (in mm/y) for the study area and surroundings extracted from the selected 30 Sentinel-1 ascending scenes (Table 1) that were acquired (2016–2018) over the study area and processed using synthetic aperture radar (SAR)scape. Negative velocities (orange to red) represent downward ground motion (subsidence), whereas positive (green) velocities represent stable or upward ground motion (uplift). (b) Distribution of wadis extracted from digital elevation map using an ALOS World 3D digital elevation model (DEM; resolution 30 m). (c) The distribution of districts within Riyadh. Further shown is the distribution of the 39 sites that show subsidence rates exceeding 4 mm/y, the location of the RY99 GPS station, and outline of the study area. Site locations preceded by the letter “L”, “W”, “K”, “LF”, and “D” indicate their occurrence over lowlands, wadis, karstic formations, landfills, and dumpsites, respectively.
Remotesensing 13 01109 g004
Figure 5. Urban growth (1992–2018) over study area extracted from the European Space Agency Climate Change Initiative (ESA-CCI) land cover viewer (http://maps.elie.ucl.ac.be/CCI/viewer/ accessed on 2 September 2020).
Remotesensing 13 01109 g005
Figure 6. Comparison of vertical GPS velocities from the permanent Riyadh GPS station (projected to satellite LOS direction) to the LOS SBAS velocities over the station.
Remotesensing 13 01109 g006
Figure 7. Temporal Google Earth images (2001 to 2016), ArcGIS online base map (2019), and LOS velocities over a wadi (site W5 in Wadi Hanifah). (a) Google Earth image acquired in March 2001. (b) Google Earth image acquired in February 2005. (c) Google Earth image acquired in November 2014. (d) Google Earth image acquired in October 2016. (e) LOS deformation rates plotted over the 2019 ArcGIS online base map.
Remotesensing 13 01109 g007
Figure 8. Temporal Google Earth images (2008 to 2018), ArcGIS online base map (2019), and LOS velocities over a lowland in An Narjis District (site L7). (a) Google Earth image acquired in April 2008. (b) Google Earth image acquired in December 2012. (c) Google Earth image acquired in October 2016. (d) Google Earth image acquired in November 2018. (e) LOS deformation rates plotted over the 2019 ArcGIS online base map.
Remotesensing 13 01109 g008
Figure 9. Temporal Google Earth images (2014 to 2018), ArcGIS online base map (2019), and LOS velocities over karstic limestone (site K1) in Al Qirawan District. (a) Google Earth image acquired in January 2014. (b) Google Earth image acquired in March 2016. (c) Google Earth image acquired in December 2017. (d) Google Earth image acquired in December 2018. (e) LOS deformation rates plotted over the 2019 ArcGIS online base map.
Remotesensing 13 01109 g009
Figure 10. Temporal Google Earth images (2009 to 2014), ArcGIS online base map (2019), and LOS velocities over a sandstone and alluvium dumpsite (site D1) in Ar Rimayah District. (a) Google Earth image acquired in May 2009. (b) Google Earth image acquired in December 2011. (c) Google Earth image acquired in February 2013. (d) Google Earth image acquired in November 2014. (e) LOS deformation rates plotted over the 2019 ArcGIS online base map.
Remotesensing 13 01109 g010
Figure 11. ArcGIS online base map (2019) and LOS velocities over landfill sites (LF1 and LF2) in the Al Marwah District. (a) ArcGIS online base map (2019) over site LF1. (b) LOS deformation rates plotted over Figure 11a. (c) ArcGIS online base map (2019) over site LF2. (d) LOS deformation rates plotted over Figure 11c.
Remotesensing 13 01109 g011
Table 1. Sentinel 1A SAR Acquisitions (ascending mode; Orbits: Path 72, Frame 73 and 77).
SR#MissionOrbitDayMonth YearComment
1Sentinel (1A)01396916112016Scenes used
3Sentinel (1A)01431910122016
4Sentinel (1A)01449422122016
5Sentinel (1A)01466903012017
6Sentinel (1A)01484415012017
7Sentinel (1A)01501927012017
8Sentinel (1A)01519408022017
10Sentinel (1A)01554404032017
11Sentinel (1A)01571916032017
13Sentinel (1A)01606909042017
14Sentinel (1A)01624421042017
15Sentinel (1A)01659415052017
17Sentinel (1A)01694408062017
18Sentinel (1A)01711920062017
19Sentinel (1A)01729402072017
20Sentinel (1A)01746914072017
21Sentinel (1A)01781907082017
23Sentinel (1A)01816931082017
25Sentinel (1A)01851924092017
26Sentinel (1A)01869406102017
27Sentinel (1A)01886918102017
28Sentinel (1A)01904430102017
29Sentinel (1A)01921911112017
30Sentinel (1A)01939423112017
31Sentinel (1A)02114423032018
34Sentinel (1A)02166928042018
35Sentinel (1A)02184410052018
36Sentinel (1A)02201922052018
37Sentinel (1A)02219403062018
38Sentinel (1A)02236915062018
0Sentinel (1A)00994414022016Scenes eliminated
2Sentinel (1A)01414428112016
9Sentinel (1A)01536920022017
12Sentinel (1A)01589428032017
16Sentinel (1A)01676927052017
22Sentinel (1A)01799419082017
24Sentinel (1A)01834412092017
32Sentinel (1A)02131904042018
33Sentinel (1A)02149404162018
Table 2. The distribution and rates of deformation of sites showing LOS subsidence exceeding 4 mm/y over Riyadh.
#SiteLatitudeLongitudeAreaSubsidence * (mm/y)
1W124°38′38.709″ N46°31′51.384″ EWadi Wubay −4 to −9
2W224°41′44.044″ N46°36′22.379″ EWadi Hanifah−1 to −4
3W324°39′32.734″ N46°33′24.014″ EWadi Wubay −2 to −8
4W424°39′55.499″ N46°34′18.458″ EWadi Wubay−1 to −7
5W524°39′5.564″ N46°35′12.577″ EWadi Hanifah−1 to −9
6W624°38′27.016″ N46°34′52.182″ EWadi Hanifah−1 to −18
7W724°38′41.857″ N46°35′51.722″ EWadi Hanifah−2 to −9
8W824°36′21.642″ N46°36′39.024″ EWadi Laban−2 to −6
9W924°35′55.154″ N46°31′55.488″ EWadi Laban−1 to −4
10W1024°34′15.424″ N46°36′11.816″ EWadi Namar−1 to −13
11W1124°35′20.698″ N46°39′3.233″ EWadi Hanifah−1 to −6
12W1224°33′40.369″ N46°37′38.978″ EWadi Namar−1 to −6
13W1324°35′44.25″ N46°31′18.543″ EWadi Laban−1 to −6
14W1424°50′58.932″ N46°54′44.591″ EAl Janadriyah−3 to −5
15L124°41′4.59″ N46°53′8.083″ EKhashm Al An−1 to −7
16L224°51′3.42″ N46°37′52.625″ EAn Narjis−2 to −4
17L324°51′36.777″ N46°37′49.09″ EAn Narjis−1 to −4
18L424°49′33.448″ N46°39′44.518″ EAl Yasmin−1 to −7
19L524°52′57.178″ N46°38′13.64″ EAn Narjis−3 to −5
20L624°52′41.952″ N46°37′22.343″ EAn Narjis−3 to −5
21L724°52′9.118″ N46°38′11.129″ EAn Narjis−3 to −6
22L824°51′22.118″ N46°36′46.65″ EAn Narjis−1 to −7
23L924°51′58.132″ N46°37′30.828″ EAn Narjis−3 to −5
24L1024°45′16.158″ N46°37′56.401″ EAn Nakhil−1 to −5
25L1124°33′44.12″ N46°32′12.723″ ETuwaiq−2 to −4
26L1224°33′43.813″ N46°31′28.054″ ETuwaiq−3 to −4
27L1324°32′53.479″ N46°31′13.872″ ETuwaiq−2 to −5
28K124°51′41.453″ N46°34′33.728″ EAl Qirawan−3 to −5
29K224°51′46.361″ N46°33′51.911″ EAl Qirawan−2 to −5
30K324°51′8.338″ N46°33′46.788″ EAl Qirawan−3 to −10
31K424°50′23.807″ N46°34′9.237″ EAl Qirawan−1 to −8
32K524°49′50.841″ N46°35′45.102″ EAl Qirawan−2 to −5
33D124°46′0.131″ N46°54′3.156″ EAr Rimayah−1 to −6
34D224°49′48.788″ N46°43′1.198″ EQurtubah−1 to − 4
35LF124°31′24.093″ N46°40′29.554″ EAl Marwah−1 to −21
36LF224°29′44.341″ N46°41′9.629″ EAl Marwah−1 to −11
37LF324°37′32.879″ N46°53′56.093″ EAs Sulay−1 to −21
38LF424°36′47.926″ N46°47′8.627″ EAl Manakh−1 to −9
* Range of LOS velocities (mm/y) over each of the investigated sites.
Table 3. GPS station position and velocities in east, north, and up components with uncertainties in mm/y relative to ITRF2014.
#StationsLatitudeLongitudeGPS Velocity mm/yStandard Deviation mm/y
VeVnVu σ e σ n σ u
1ADIS09°02′06.00″ N38°45′57.59″ E24.6418.83−3.200.270.170.48
2ANKR39°53′13.20″ N32°45′28.80″ E3.0011.57−4.430.590.220.79
3BHR326°12′32.39″ N50°36′28.79″ E31.1130.32−0.180.100.080.31
4BHR426°12′32.39″ N50°36′28.79″ E31.0330.32−0.100.090.060.57
5BSHM32°46′44.40″ N35°01′22.80″ E22.6519.870.250.090.100.46
6GRAZ47°04′01.20″ N15°29′34.80″ E22.5115.181.810.120.090.38
7IISC13°01′15.60″ N77°34′11.99″ E42.3235.71−1.190.160.110.52
8ISBA33°20′27.60″ N44°26′16.80″ E24.8428.39−0.360.150.190.57
9MAL202°59′45.59″ S40°11′38.40″ E26.1316.15−0.420.120.150.62
10MARS43°16′44.40″ N05°21′14.40″ E20.0815.85−0.350.120.080.39
11MAS127°45′50.39″ N15°37′58.79″ W17.1316.92−0.390.190.080.41
12MBAR00°36′03.60″ S30°44′16.79″ E25.5817.910.620.110.170.49
13RAMO30°35′52.79″ N34°45′46.79″ E23.8619.231.350.130.150.38
14RY9924°40′26.39″ N46°41′38.40″ E31.4829.71−0.150.080.190.34
15SOFI42°33′21.59″ N23°23′41.99″ E24.0211.430.560.240.110.37
16TEHN35°41′49.20″ N51°20′02.40″ E26.8219.14−2.430.360.270.65
17YEBE40°31′29.99″ N03°05′20.39″ W19.2715.960.750.160.060.28
Publisher’s Note: MDPI stays neutral with regard to jurisdictional claims in published maps and institutional affiliations.

