
Next Generation Agricultural Stress Index System (ASIS) for Agricultural Drought Monitoring

Natural Resource Officer, Food and Agriculture Organization of United Nations (FAO), 00153 Rome, Italy
Remote Sens. 2021, 13(5), 959; https://doi.org/10.3390/rs13050959
Submission received: 23 December 2020
/
Revised: 12 February 2021
/
Accepted: 25 February 2021
/
Published: 4 March 2021
(This article belongs to the Special Issue Earth Observation for Index Insurance)
Abstract
:Over the past 40 years, drought has affected more people in the world than any other natural hazard, affecting large segments of the population and destroying the natural resource base, livestock and livelihoods. Recent projections show that drought events are expected to increase in frequency and intensity due to climate change. According to studies conducted by the Food and Agriculture Organization of the United Nations (FAO), 83% of all damages and losses caused globally by drought between 2006 and 2016 have been absorbed by agriculture, putting a large part of the world’s population at risk of food insecurity. This study shows the advantage of scaling-up FAO’s agricultural drought monitoring and early warning system (ASIS) and building the bridge with the anticipatory action, drought financial mechanisms, social protection and other initiatives for preventing the deterioration of food security and strengthening resilience. The results of the methodology that is based on and supported by the digital innovation, machine learning, matured knowledge and experiences accumulated over the past 10 years are illustrated with practical examples from different countries, ecological environments and crops. A fused time series of Advanced Very-High-Resolution Radiometer (AVHRR) data from Meteorological Operational satellite (METOP) and National Oceanic and Atmospheric Administration (NOAA) was used to produce a consistent time series of a vegetation health index (VHI) at 1 km spatial resolution from 1984 to present. VHI is multiplied by the crop coefficient (kc) to provide more responsiveness to the VHI anomaly that occurs during sensitive phenological phases to water stress such as a flowering and grain filling. The weighted VHI (wVHI) is integrated from the start of the season (SOS) up to the end of season (EOS). Once the temporal analysis of wVHI is completed, the spatial average is calculated using the values of pixels within a specific crop mask and administrative unit. The system proposed different vegetation indices to assess the impact of drought in agriculture; including an agricultural drought forecast that provide more time to the decision makers for implementing anticipatory actions to mitigate the drought in agriculture. Next generation agricultural stress index system (ASIS) offers full capabilities to support: parametric crop insurance, social protection schemes, early action, national drought management plans and to guide public investments.
1. Introduction
The main objective of the agricultural drought monitoring and early warning system (ASIS) is to provide decision-makers with near real-time (NRT) information in order to improve preparedness and reduce the impact of drought on food security and crop production. Agriculture is the most affected sector by natural hazards and disasters [1]. Agricultural losses as a result of drought in developing countries account to about 60–80% of national crop production [2]. Drought remains a phenomenon that is difficult to quantify, assess and manage. It is a slowly developing hazard without clear onset or end, affecting ecosystems, hydrological cycles and society [3]. Adopting a reactive approach to drought management, acting only when the phenomenon has fully developed, limits the possibility to mitigate its impacts and can be costly in terms of losses of lives and assets [4]. By contrast, if adopting a proactive approach, drought risk and vulnerability will be reduced and mitigation action supported by comprehensive monitoring and early warning systems, underpinned by enhanced weather forecasting capabilities and linking the early warning system with the national mitigation plans [5].
The majority of available drought-related indices focus on the assessment of meteorological drought, for example: standard precipitation index (SPI), Palmer index (PI), simple precipitation intensity index (SPII), etc. However, these indices have limitations for the assessment of the impact of drought in agriculture [6]. Indices for meteorological drought do not consider the distribution of rainfall during the crop cycle and soil water retention; the minimum unit time of analysis is a month while the flowering phenological phase could be seriously affected with only 10–20 days of water stress, compromising the final crop production [7,8].
In the 90s, FAO developed a methodology to evaluate the water availability to satisfy crop requirements based on the information provided by meteorological stations [9,10]. The crop specific water balance model (CSWB) assisted countries to detect drought in agriculture. In 2014, FAO began to employ satellite information due to the often limited geographical coverage of meteorological network and limitations of agriculture representability of ground stations. FAO proposes an innovative approach to assess agricultural drought every 10-days at 1 km spatial resolution [11,12]. The new approach takes into consideration the crop specific requirements of water during each phenological phase. Flowering and grain filling crop phases are recognized to be the most sensitive phases to water stress on cereals crops. Taking advantage of the recent improvement in computer capacity, machine-learning approach and the development of expert systems, FAO has developed a global system to analyze satellite information that simultaneously considers temporal and spatial dimensions of drought conditions in major cropping areas.
In addition to the global system, a standalone “country-level” version of ASIS was developed in 2017, to be deployed at the country or regional level in order to strengthen the local national early warning system (NEWS) for food security [13,14]. The standalone tool allows countries to fine-tune parameters of the system based on detailed land-use maps and national crop statistics, thereby generating results that are more accurate than those achieved by the global version. Country-level ASIS has already been tested in several Central American countries with highly positive results http://asis.marn.gob.sv/. During this learning process, FAO implemented in 2020 the next generation ASIS including a complete toolbox with applications for preventing the deterioration of food security and strengthening resilience at local level. Some of the characteristics of the different phases of development are presented in Table 1.
The objective of this paper is to present the developments of the next generation ASIS for agricultural drought monitoring and early warning system to guide the early action, financial mechanisms such as crop insurance and/or social protection schemes.
2. Materials and Methods
2.1. Data
2.1.1. Global Earth Observation Data Sets
The NRT ASIS inputs are provided by the 10-daily (“dekadal" or “S10”) composites, derived by the Flemish Institute for Technological Research (VITO) from the Earth Observation (EO) system METOP-AVHRR (1 km spatial resolution, since March 2007) and freely available via the portal https://www.vito-eodata.be/PDF/portal/Application.html#Home. A description of the preprocessing methodology can be found in Eerens et al. [15,16]. In order to extend the time series retrospectively, similar AVHRR composites, derived from subsequent NOAA platforms, were acquired for the years from 1984 to 2012 from the portal of NOAA-STAR (Center for Satellite Applications and Research, ftp://ftp.star.nesdis.noaa.gov/). In contrast to METOP, these NOAA-composites have a weekly frequency and a coarser resolution of 16 km. In both cases (METOP and NOAA) only the composite layers of NDVI and BT4 (brightness temperature in AVHRR band 4, 10.3–11.3 μm) were downloaded, because these are needed for computation of the later anomaly indicators. The normalized difference vegetation index (NDVI) denotes the amount of green vegetation, while BT4 is a good indicator of land surface temperature (LST). Country level ASIS uses the vegetation condition index (VCI) and temperature condition index (TCI) images derivate from global ASIS data sets for each specific country. The images are automatic distributed on FAO-FTP (file transfer protocol) every 10 days.
2.1.2. Ancillary Data
The final spatial unit of ASIS is not the pixel (in this case, 1 km2) but rather the administrative region. For the latter, global ASIS, uses the three GIS layers provided by the GAUL (global administrative unit layers) initiative. While, country level ASIS uses the GIS layers of administrative boundaries provided by countries (country, department or province and district, county or municipality). The vector files were converted to 1 km-spatial resolution rasters congruent with the global METOP imagery. Global ASIS focuses on cropland and pastures. The information on the global distribution of both land use types was extracted from the Global Land Cover-SHARE (GLC-SHARE). GLC-SHARE is a global land cover database with spatial resolution of 30 arc-seconds (1 km2) http://www.fao.org/land-water/land/land-governance/land-resources-planning-toolbox/category/details/en/c/1036355/. While country level ASIS, focus on recently land use studies conducted by national institutions in charge to manage the system in the country. From the land use studies, a specific crop masks are produced to monitor each crop independently (maize, sorghum, rice, wheat, etc.). The officers of the Ministry of Agriculture provide phenology (planting dates and crop cycle duration) of each crop and district.
2.1.3. Study Cases
To illustrate the calibration, use and potential applications of the next generation ASIS, some countries were selected as examples around the globe. FAO already supported some countries with the country-level ASIS including Philippines, Vietnam, Pakistan, Timor Leste, Mexico, Peru, Guatemala, Honduras, El Salvador and Nicaragua. At the regional level, ASIS has been established in Central America to closely monitor drought in agriculture areas of the dry corridor. Next generation ASIS will be applied to the new projects in Ecuador, Iran, Panama and Ethiopia.
2.2. Methodology
Global ASIS’s methodology is described by Rojas et al. and Roel et al. [11,12]. This paper focuses on the improvements of methodology of global ASIS to fit it to the country level application. Modifications on the methodology have the purpose to match the crop water specific requirements when using remote sensing to assess the impact of drought in agriculture. Efforts were done on downscaling the methodology to satisfy NRT information required by decision makers at the government level to implement drought mitigation activities.
2.2.1. National Calibration of ASIS
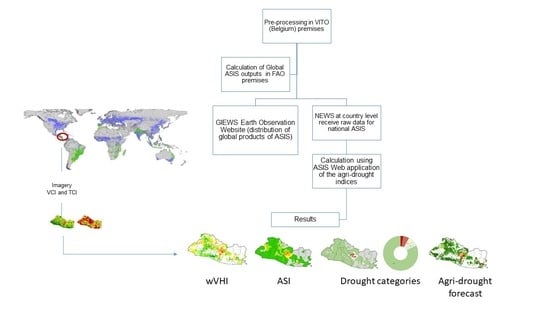
Figure 1 presents an overview of the major methodological steps applied in the next generation ASIS platform. To initiate the local calibration of ASIS, it is needed to collect agricultural data (phenology, crop statistics and land use studies) from the national institutions. The officers of the Ministry of Agriculture will provide phenological data by administrative unit (districts or municipalities). In some cases, national workshops are organized to gather this data from the grass roots level of the districts or municipalities. Planting date and the length of the crop cycle are essential parameters requested from local officers. The planting date corresponds to a period of 10 days (dekad) in which most of the farmers plant within a specific district. Normally, the planting takes place over a month and a half, but we request the dekad that represents the bulk of the planting. The SOS and EOS are tabulated in a comma-separated values (CSV) file by crop, administrative unit and crop season. The EOS in ASIS, coincide with physiological maturity of the crop. This information together with the crop coefficient (kc) [17] are rasterized using the ASIS platform for each crop that will be analyzed. Using the later version of land use studies available in the country, the areas with the specific crops to be monitored are extracted and rescaled to 1 km spatial resolution.
FAO provides the archive of remote sensing imagery (1984–2020) and the new images of VCI and TCI every 10 days to keep operational the system at the country level through FTP.
The NDVI [18] is a simple index to assess whether the target being observed contains live green vegetation or not. VCI compares the current NDVI to the range of values observed in the same period in previous years (from 1984 to 2020). The VCI is expressed as a percentage and gives an idea of where the observed value is situated between the extreme values (minimum and maximum) of NDVI (Equation (1)). Higher and lower values indicate better and poorer vegetation state conditions, respectively. The vegetation health index (VHI) is a composite index, joining the VCI and the TCI, an index analogous to the VCI but using surface temperature [19,20,21]. VHI can be expressed through Equation (2).
ASIS uses the VHI derived from NDVI as proposed by Kogan [22]:
- VCI = Vegetation Condition Index;
- TCI = Temperature Condition Index;
- a = weight, in some studies different weights are assigned to VCI and TCI [23].
The validity of the VHI as a drought detection tool relies on the assumption that NDVI and LST at a given pixel will vary inversely over time, with variation in VCI and TCI driven by local moisture conditions. However, positive relationships between LST and NDVI tend to develop in areas where vegetation growth is energy or temperature limited. In high latitudes, VHI should be used with caution [24]. On the other hand, VHI developed through VCI and TCI is found to be more effective compared to other indices in monitoring vegetative drought [25].
2.2.2. Weighted Vegetation Health Index (wVHI)
The water stress is measured by the weighted vegetation health index (wVHI), which is calculated using the anomaly of VHI of each dekad during the crop cycle multiplied by crop water requirement of each phenological phases (crop coefficient, kc). The temporal integration by pixel is expressed as:
- wVHI = Weighted vegetation health index cumulated from SOS up to EOS multiplied by crop coefficient;
- VHI = Anomaly of VHI by dekad;
- kc = Crop coefficient.
ASIS uses the Allen’s approach [26] to mimic the evolution of the crop coefficient during the crop cycle, using three reference points: start of season, maximum of season (that normally coincide with the flowering phenological phase) and end of season (SOS, MOS and EOS respectively). For instance, for maize it is introduced three kc values: 0.3, 1.2 and 0.4; for rice 0.95, 1.0 and 0.97; for fodder oats, 0.30, 1.15 and 0.25 and so on.
2.2.3. Agricultural Stress Index (ASI)
Once the temporal analysis of wVHI is completed, the spatial average is calculated using the values of pixels within the administrative unit. Figure 2 shows the flow of analysis, using a crop specific mask, the pixels inside are temporally weighting by the crop coefficient (kc) and spatially averaged, to obtain the ASI value at administrative level. ASI is expressed in percentage of agricultural area affected by drought. This index is proposed for triggering the pay-out of a parametric crop insurance or cash distribution as a part of the activities of a social protection scheme.
2.2.4. Agricultural Drought Categories
Categories of drought intensity are established based on the temporal and spatial average of the wVHI within the agricultural area inside of administrative unit. Figure 3 presents the threshold of the theoretical classification of each agricultural drought category. This paper proposes a slight modification of the thresholds to delimit drought categories proposed by Kogan [27,28]. The difference is mainly due that Kogan’s classification is based on VHI while this paper considers wVHI. The categories could be used to guide the early warning actions or trigger the mitigation activities included in a national drought plan.
2.2.5. Historical Drought Probabilities
Using the historical record of drought (1984–2020) for each crop and crop season, ASIS calculates the probability of having more than a specific percentage of area affected by drought. The user can establish the threshold of area affected by drought depending on their own research. PE (historical probability of droughts) indicates the historical frequency of droughts as defined by the ASI over the years included in the times series.
PE, RUM (regional unmixed mean) files are obtained by calculating the percentage of years surpassing a specified ASI threshold Te (e.g., ASI > 30%) per region. The resulting RUM file contains these percentages per region for all land uses and per land use class specified in the common parameters for a fixed set of thresholds (Te = 0, 10, 20... 90), plus the threshold explicitly specified by the user.
For this user specified threshold, PE raw disk image file (IMG extension file) and their corresponding Quicklooks (PNG files) can be generated, for all land uses, for each land use class specified in the common parameters, and for each land use class masked for this land use. In addition, line charts, for the specified regions, can be generated for all land uses and per land use class specified, showing PE over the Te threshold.
2.2.6. Agricultural Drought Forecast
ASIS will enable the user to estimate, midway through the crop cycle, the probability that a specific pixel will be classified as drought-affected at the end of the cycle. The tool will have this predictive application with statistical significance. The probability at the start of the cycle is based on the pixel’s historical probability of being drought-affected, obtained from the 30+ year historical records. As the agricultural season proceeds, new information on the evolution of the vegetation at the pixel level becomes available every 10 days, allowing for adjustment of the historical probability on the basis of recent data. After half the crop cycle has elapsed, the omission error is reduced and the probability of properly classifying the pixel as drought-affected increases [29]. This probability is calculated at the pixel level, making it possible to produce maps with information at 1 km spatial resolution. Statistics of identification, omission and commission along the growing season concerning the estimation of the probability are provided to validate it. Figure 4 presents a simplification of Meroni’s approach to estimate the probability of drought forecast. The Meroni’s approach [29] was adapted and implemented into the next generation ASIS toolbox.
2.2.7. ASIS Web and GIS Applications
The analysis of the historical and current data is automatically analyzed using the ASIS-Web application installed in a national institution. The application is programmed to collect the TCI and VCI images every 10 days from the FAO-FTP, running it to calculate the vegetation indices (VHI, wVHI, ASI, drought categories) and publish it on the national website for the food analyst and decision makers. The ASIS website is completely customizable and present an area of analysis to prepare early warning reports.
If the country has a national geo-portal, ASIS can be installed as a geographical information system (GIS) application to analyze the agricultural drought hot spots with socioeconomic data. The ASIS-GIS application has global indices such population, rural population, rural poverty, land use system and value of agricultural production. It is highly recommended that the countries introduce more accurate and higher resolution national information that can replace the global datasets. ASIS-GIS application enables the user to implement anticipatory action to mitigate drought in agriculture based on a methodology that combines seasonal forecast, El Niño forecast and the products of ASIS [30].
2.2.8. Derived Metrics from ASI
ASI also allows the user to build new metrics derived from the percentage of agricultural area affected by drought (ASI). The regression equations by administrative unit can be introduced in the platform through CSV files. Maps and graphs will be produced by the platform in an automated way to be accessible for the analysts and decision makers. The parameters of an equation can be introduced through CSV files. For instance, it is possible to generate a maize crop yield function (i.e., y = a + b ASI), the output expressed in tons by hectare will generate a map by an administrative unit with the respective statistics such as the determination coefficient (r2). The user can apply any statistical software outside the ASIS platform to perform a regression analysis. Once a regression model has been constructed, it may be important to confirm the quality of fit of the model and the statistical significance of the estimated parameters.
3. Results and Discussion
3.1. Rasterized Phenology and Crop Coefficients (kc)
Figure 5 shows phenological data collected in El Salvador from each of the administrative units that are rasterized by ASIS (bottom maps). The areas without crops are not included in the calculation and therefore shown in grey. This information gives precise indication on time and geographical space to ASIS of which pixels will start/end first in the analysis during the first crop season in the country. Figure 6A presents the rasterized maps for the crop coefficient of maize in Guatemala. The crop coefficients will provide a different weight of the potential impact of the water stress during the different phenological phases of maize (Figure 6B). The temporal variation of water stress would result in a different impact on the crop yield depending the phenological phase that it is affected. The integration of the phenology and crop coefficients by crop gives more potential for the use of Earth observation data to assess the impact on water stress in agriculture.
3.2. Weighted Vegetation Health Index (wVHI) and Drought Impact within the Administrative Unit
Rasterized crop coefficients (0.30, 1.15 and 0.25) for fodder-oats were used for weighting VHI temporally to obtain the weighted vegetation health index (wVHI). Figure 7 highlights the results for 2003 crop season in Puno province in Peru. The user can examine the different impacts of water-stress inside the districts of the Puno province. This index is recommended when the user needs to perform a granular analysis of drought impact in agriculture. The user would detect the intensity of the drought at 1 km spatial resolution. In the current example, it is noticed that the southern part of Puno was more affected by drought than central districts with fodder-oats. In the case of ASI, all pixel values of wVHI are spatially averaged, therefore it is not possible to observe the different impact of drought within the district. Figure 7 shows the sensibility of water stress of the phenological phases introduced by the kc in the temporal integration of VHI. The top right graph (Figure 7) shows from top to bottom, a pixel profile in green ranked it in 3rd place, when the weighting is applied it moves to the 6th position indicating that this pixel was affected by drought during a sensitive phenological phase such as flowering and grain filling.
3.3. Agricultural Stress Index (ASI), Crop Insurance and Social Protection Schemes
ASI represents the percentage of crop-specific area affected by drought within the administrative unit. The main advantage of the temporal and spatial integration of this index is the practical application at the central level relevant for decision-makers. ASI outputs are expressed at the same level as national agricultural statistics and socioeconomic data. The main purpose of ASI is to support the decision-making process providing an index that summarizes the drought impact in agriculture that could be overlapped with socioeconomic variables (rural population, production, poverty index, etc.). The index is expressed in two ways, the first using the crop mask as a boundary and the second assigning the same ranking to the entire administrative unit. For early warning bulletins, the second form is suggested to simplify the message to final users and decision makers. Figure 8 presents examples of the ASI outputs for rice agricultural areas of the three-crop seasons in the Philippines. Rice remains the top agricultural commodity in the Philippines accounting for 93% of household consumption in 2015/2016 [31]. The Philippines ranked fifth among the largest rice consumers worldwide with 13.7 million metric tons of milled rice in 2018/2019 [32]. Figure 8 shows the maps of ASI during El Niño 1997/98 and the historical statistics of drought impact for the three-crop seasons. The 1998 rice production was seriously affected by the reduction of rice output during the second and third crop seasons. The impact of El Niño 1991/92 also affected the three crop seasons in the Philippines. In the hypothetical case of implementation of parametric crop insurance in the Philippines, ASI could be a good index to trigger the pay-out of the insurance contract. Figure 8 shows the different risk of the three-crop seasons at the national level, however, for a real implementation the same analysis should be done at the municipality level. In the hypothetical case, more than 20 percent of the rice area affected by drought would trigger a pay-out of a crop insurance scheme. The prime pay by farmers during the first crop season should be less than the prime pay during the second and third crop seasons, because the high risk of drought during the last two seasons. It is also possible to introduce a deducible assigning and intermediate value of ASI. Figure 9 shows a theoretical case for rice plating during the second crop season. The advantage of introducing a deducible is that farmers will be fully covered during the rare extreme drought events but at the same time, they will receive some compensation during the moderate events. In this way, farmers will be more motived to purchase a crop insurance contract receiving payments that are more frequent and making the financial instrument more sustainable. At the municipality or district level, the same index could be used as a trigger for social protection schemes, such food or cash distribution will activate when a certain level of drought affectation is attained in the district.
3.4. Agricultural Drought Categories, Early Action and National Drought Plans
Next generation ASIS offers five drought categories that allow one to study the different intensity of drought in agriculture. Figure 10 shows the evolution of drought categories during the 1991 maize crop season in Guatemala. This country presents the particularity that farmers plant a variety of maize from 90 days crop cycle in the areas of the dry corridor up to 250 days in the highlands areas of Guatemala’s altiplano. Maize and beans are the foundation of the diet of the population. The 1991 crop season was influenced by the presence of the 1991/92 El Niño phenomenon that generally produces a reduction of rainfall in Central America with high impact in the dry corridor. The drought categories could be used as a trigger to activate the mitigation and prevention activities of a national drought management plan (Figure 11). The mitigation activities should be specified on the drought mitigation plan; establishing responsibilities of which institution has to do what and when. Each mitigation activity should be in agreement with the severity of agricultural drought detected by the system. It is highly recommended to use ASIS as a complement of other technical products to maximize the alert system such as seasonal climate perspective and El Niño forecast. A combined system with these technical products will provide a more robust and innovative guide to early action in the countries to mitigate drought in agriculture [30].
3.5. Historical Drought Probabilities
The ASIS database has historical information of the vegetation status at the global level since 1984. The long archive of vegetation monitoring allows the user to calculate the historical drought probability by crop; however, the user should take in consideration the “noise” produced by the land use change occurred during time series. In the traditional agricultural areas with a specific crop production, the bias should be lowest. In recent agricultural areas, the outputs should be taken with caution. In those new agricultural areas, natural vegetation could be a proxy of the past extreme droughts occurrence, however it is important to take in consideration the more adaptive skills of the natural vegetation to the local ecosystem. Figure 12 shows the probabilities of having more than 10, 20 and 30% of rice areas affected by drought in Ecuador. The districts that have 15–30% of probability of having more than 30% of rice areas affected by drought should be considered as a priority districts for public investment to mitigate drought such rain harvesting or irrigation systems.
3.6. Agricultural Drought Forecast and Early Action
ASIS, using a machine learning approach, can perform a probabilistic drought forecast at the pixel level. The drought forecast would provide more time for the decision makers for implementing early actions to mitigate the drought in agriculture. Different options provided by ASIS were tested to calculate the probabilistic forecast and the best result for Puno province was obtained using a minimum threshold on wVHI = 0.35 and a percentage of bad years = 15. Figure 13 shows the drought forecast in Puno, Peru for the agricultural areas of fodder-oats. Fodder-oats are planted mainly in November with some areas planted in December. Harvesting time is in April and for the late planting in May. We selected three examples of drought intensity, first an extreme drought occurred in 1990, a 2007′s moderate drought that affected the central and southern part of the province and, finally, the 2014 crop season that developed under very good conditions for fodder-oats. It is noticed that drought forecast application in ASIS performs well from the 3rd dekad of February; providing more than 2 months in advance for decision makers to implement early actions to mitigate the drought impacts in agriculture. In case that the district affected by drought has a high share production the decision makers would have time to examine the impact on the commercial balance; maybe giving enough time to negotiate import of the commodity. Decision makers will have appropriate information in the right moment to assess if the country has an internal food security problem well localized or if the country will have an externalized trading inconvenience. The EO system will provide the magnitude of the shock and the exact geographical localization of the drought impact and crops affected.
3.7. ASIS Web and GIS Applications
Based on the experience on supporting national early warning systems (NEWSs) during the last three decades, one lesson learned is the importance of national staff for executing monitoring and forecasting models and passing the alerts on time to mitigate drought impacts. Trained staff have high mobility in the national institutional context in most developing countries. The next generation ASIS takes advantage of the new capabilities and progress reached in computer science. Automated calculation of different vegetation indices is a large advantage for the sustainability of the methodology proposed. The effort of international institutions should be oriented to training the staff in the interpretation of the indices, advantages and limitation of the methodology. The national staff will have more time to dedicate to confirm the alert contacting the field and to communicate the confirmed alert to the decision makers. ASIS Web application provides in near real time all the indices introduced in the previous points. Figure 14 shows the flow chart of the automatic processing of the vegetation indices that are published on a national ASIS website.
The web application is completely customizable to facilitate ownership of the system by countries. On the other hand, ASIS GIS application is a complement of website. This second application introduces the possibility to do more in-depth analysis to the agricultural drought hot spots identified by the system. The user can easily overlay socioeconomic data with the areas affected by drought, such as a rural population. The application allows comparing different years affected by drought (Figure 15). The GIS application overlays information of socioeconomic data such as a population affected by drought, total rural population, farmer system and rural poverty index with the percentage of crop area affected by drought (ASI) (Figure 15).
3.8. Derived Metrics from ASI
The most recent application of next generation ASIS allows the user to correlate any variable such as crop yield (t ha–1), number of people in food insecurity, number of children underweight, etc., with the percentage of area affected by drought (ASI). The mentioned variables are correlated with the area affected by drought, the crop yield and production are influenced by extreme drought events, the number of food insecure people in rural areas (mainly farmers practicing subsistence farming) would increase during the dry years, and something similar will happen with the number of children underweight. The user can perform the regression analysis and confirm the quality of fit of the model and the statistical significance of the estimated parameters outside ASIS. The final estimated parameters could be introduced using CSV files for each administrative unit.
4. Conclusions
Next generation ASIS proved to be a very useful to support national drought monitoring and early warning systems. ASIS opens new avenues for state-of-the-art research and applied science that has the potential to transform policy-making processes, and help local governments and developmental and humanitarian agencies achieve their goals. Automatic calculation of the vegetation indices for agricultural drought detection guarantees the sustainability of the system at country level. The automation of ASIS avoids the issues of moral hazard and adverse selection in a parametric crop insurance context. The proposed methodology contributes to reduce the basis risk of a crop-indexed insurance.
Coarse-resolution remote-sensing sensors provide suitable data for such operational systems, since they retrieve consistent information at a high temporal frequency at regional to global scales. Furthermore, most of the decisions at the country level are taken at the local administrative unit such as the district or municipality; it is very difficult for a government during an extreme drought to take actions at a granular level such as a farm or commune. The potential use of high-resolution imagery still needs to be proven in a practical and operational way for monitoring drought in agriculture; this would depend on the capacity of government to provide mitigation actions at the granular level. Using AVHRR data (NOAA and METOP satellites), ASIS offers a long image record beginning in the early 1980s. The length of the time series is coupled to the normal rainfall cycle that approximately is completed every 30 years [33]. To assess drought, it is important to take into consideration the length of the time series because extreme drought is a rare event that occurs approximately once in every 10 years. Short time series would over or under estimate drought impacts in agriculture.
The temporal and spatial integration of the vegetation indices in ASIS offer the user a new opportunity for analysis and establishment of operational monitoring and early warning system. The system provides automatic generation of graphs, maps (jpg files) and raster (img files) for easy interpretation. By introducing the kc, the temporal integration of VHI permits a better measurement of the impact of water stress during the phenological phases. Most of the system for crop monitoring based on earth observation data lack a summary of the final impact on drought during the crop season by a specific crop. In ASIS it is possible to compare easily the impact of drought in different years of the time series due to the temporal and spatial integration.
Next generation ASIS offers full capabilities to support: parametric crop insurance, social protection schemes, early action and national drought management plans. The aim is for the sustainable use of the methodology in order to promote and add to the growing instruments and tools for risk management in agriculture, ultimately helping to reduce the impacts of drought and other hazards on agriculture-based livelihoods and food systems.
Funding
This research was funded by FAO and the European Commission.
Institutional Review Board Statement
Not applicable.
Informed Consent Statement
Not applicable.
Acknowledgments
Technical development of ASIS by the Office of Climate Change, Biodiversity and Environment (OCB) and the Global Information and Early Warning System (GIEWS) of the Trade and Markets Division of FAO. Software development of ASIS have been supported by the Flemish Institute for Technological Research (VITO). The author is very grateful of the reviewers for their comments and suggestions provided to improve the current paper.
Conflicts of Interest
The author declares no conflict of interest.
References
- FAO. The Impact of Natural Hazards and Disasters on Agriculture and Food Security and Nutrition. A Call for Action to Build Resilient Livelihoods; FAO: Rome, Italy, 2015; 16p, Available online: https://reliefweb.int/sites/reliefweb.int/files/resources/a-i4434e_0.pdf (accessed on 24 October 2020).
- FAO. 2017 The Impact of Disasters and Crises on Agriculture and Food Security; FAO: Rome, Italy, 2018; 143p. [Google Scholar]
- Sivakumar, M.; Stefanski, R.; Bazza, M.; Zelaya, S.; Wilhite, D.; Rocha, A. High Level Meeting on National Drought Policy: Summary and Major Outcomes. Weather Clim. Extremes 2014, 3, 126–132. [Google Scholar] [CrossRef] [Green Version]
- Wilhite, D.A.; Pulwarty, R.S. Drought and water crises: Lessons learned and the road ahead. In Drought and Water Crises: Science, Technology, and Management Issues; Wilhite, D.A., Ed.; CRC Press: Boca Raton, FL, USA, 2005; Chapter 15; pp. 389–398. [Google Scholar]
- Wilhite, D.A.; Sivakumar, M.; Pulwarty, R.S. Managing drought risk in a changing climate: The role of national drought policy. Weather Clim. Extremes 2014, 3, 4–13. [Google Scholar] [CrossRef] [Green Version]
- Balzter, H. Earth Observation for Land and Emergency Monitoring; National Centre for Earth Observation, University of Leicester, Centre for Landscape and Climate Research, Department of Geography: Leicester, UK; Wiley: Hoboken, NJ, USA, 2017; 336p. [Google Scholar]
- Ge, T.; Sui, F.; Bai, L.; Tong, C. Effects of water stress on growth, biomass partitioning, and water-use efficiency in summer maize (Zea mays L.) throughout the growth cycle. Acta Physiol. Plant 2012, 34, 1043–1053. [Google Scholar] [CrossRef]
- Song, L.; Jin, J.; He, J. Effects of Severe Water Stress on Maize Growth Processes in the Field. Sustainability 2019, 11, 5086. [Google Scholar] [CrossRef] [Green Version]
- Gommes, R. FAOINDEX, Version 2.1; Agrometeorology Group FAO: Rome, Italy, 1993. [Google Scholar]
- Rojas, O.; Rembold, F.; Royer, A.; Negre, T. Real-time agrometeorological crop yield monitoring in Eastern Africa. Agron. Sustain. Dev. 2005, 25, 63–77. [Google Scholar] [CrossRef]
- Rojas, O.; Vrieling, A.; Rembold, F. Assessing drought probability for agricultural areas in Africa with coarse resolution remote sensing imagery. Remote Sens. Environ. 2011, 115, 343–352. [Google Scholar] [CrossRef]
- Van Hoolst, R.; Eerens, H.; Haesen, D.; Royer, A.; Bydekerke, L.; Rojas, O.; Li, Y.; Racionzer, P. FAO’s AVHRR-based Agricultural Stress Index System (ASIS) for global drought monitoring. Int. J. Remote Sens. 2016, 37, 418–439. [Google Scholar] [CrossRef]
- Rojas, O. Protocol for Country-Level ASIS Calibration and National Adaptation; FAO: Rome, Italy, 2015; pp. 12p. Available online: http://www.fao.org/3/a-i5246e.pdf (accessed on 15 November 2020).
- FAO. Country Level ASIS: A Drought Monitoring System; FAO: Rome, Italy, 2018; 8p, Available online: http://www.fao.org/3/CA0986EN/ca0986en.pdf (accessed on 20 November 2020).
- Eerens, H.; Baruth, B.; Bydekerke, L.; Deronde, B.; Dries, J.; Goor, E.; Heyns, W.; Jacobs, T.; Ooms, B.; Piccard, I.; et al. Ten-Daily Global Composites of METOP-AVHRR. In Proceedings of the 6th International Symposium on Digital Earth, Beijing, China, 9–12 September 2009. International Society for Digital Earth (ISDE). [Google Scholar] [CrossRef]
- Eerens, H.; Haesen, D.; Rembold, F.; Urbano, F.; Tote, C.; Bydekerke, L. Image Time Series Processing for Agriculture Monitoring. Environ. Model. Softw. 2014, 53, 154–162. [Google Scholar] [CrossRef]
- Doorenbos, J.; Kassam, A. Yield Response to Water; FAO Irrigation and Drainage Paper No. 33; FAO: Rome, Italy, 1979. [Google Scholar]
- Rouse, J.W., Jr.; Haas, R.H.; Schell, J.A.; Deering, D.W. Monitoring vegetation systems in the Great Plains with ERTS. In Third ERTS-1 Symposium; NASA, SP-351, Paper A 20; NASA: Washington, DC, USA, 1974; Volume 1, pp. 309–317. [Google Scholar]
- Kogan, F.N. Application of vegetation index and brightness temperature for drought detection. Adv. Space Res. 1995, 15, 91–100. [Google Scholar] [CrossRef]
- Kogan, F.; Yang, B.; Wei, G.; Zhiyuan, P.; Xianfeng, J. Modelling corn production in China using AVHRR-based vegetation health indices. Int. J. Remote Sens. 2005, 26, 2325–2336. [Google Scholar] [CrossRef]
- Vrieling, A.; de Beurs, K.M.; Brown, M.E. Recent trends in agricultural production of Africa based on AVHRR NDVI time series. In Proceedings of the SPIE Remote Sensing, Cardiff, Wales, UK, 2 October 2008. [Google Scholar] [CrossRef]
- Kogan, F. Global Drought Watch from Space. Bull. Am. Meteorol. Soc. 1997, 78, 621–636. [Google Scholar] [CrossRef]
- Unganai, L.; Kogan, F. Drought monitoring and corn yield estimation in Southern Africa from AVHRR data. Remote Sens. Environ. 1998, 63, 219–232. [Google Scholar] [CrossRef]
- Karnieli, A.; Agam, N.; Pinker, R.; Anderson, M.; Imhoff, M.; Gutman, G.; Panov, N.; Goldberg, A. NDVI and Land Surface Temperature for Drought Assessment: Merits and Limitations. J. Clim. 2010, 23, 618–633. [Google Scholar] [CrossRef]
- Singh, R.P.; Roy, S.; Kogan, F.N. Vegetation and temperature condition indices from NOAA–AVHRR data for drought monitoring over India. Int. J. Remote Sens. 2003, 24, 4393–4402. [Google Scholar] [CrossRef]
- Allen, R. Crop coefficients. In Encyclopaedia of Water Sciences; Marcel Dekker: New York, NY, USA, 2003. [Google Scholar] [CrossRef]
- Kogan, F.N. World droughts in the new millennium from AVHRR-based Vegetation Health Indices. EOS Trans. Am. Geophy. Union 2002, 83, 562–563. [Google Scholar] [CrossRef]
- Bhuiyan, C.; Singh, R.P.; Kogan, F. Monitoring drought dynamics in the Aravalli region (India) using different indices based on ground and remote sensing data. Int. J. Appl. Earth Observ. Geoinform. 2006, 8, 289–302. [Google Scholar] [CrossRef]
- Meroni, M.; Fasbender, D.; Kayitakire, F.; Pini, G.; Rembold, F.; Urbano, F.; Verstraete, M. Early detection of production deficit hot-spots in semi-arid environment using FAPAR time series and a probabilistic approach. Remote Sens. Environ. 2014, 142, 57–68. [Google Scholar] [CrossRef]
- Fuganti, G.; Minelli, M.; Rojas, O. Practical Guidelines for Early Warning Early Action Plans on Agricultural Drought; FAO: Panama City, FL, USA, 2020; Available online: http://www.fao.org/3/cb0624es/cb0624es.pdf (accessed on 4 December 2020).
- Philippine Statistics Authority (PSA). Consumption of Agricultural Commodities in the Philippines; PSA: Quezon City, Philippines, 2017; Volume 1. Available online: https://psa.gov.ph/sites/default/files/2015-2016%20CSAC%20Vol1.pdf (accessed on 10 July 2019).
- Statista. 2019. Available online: https://www.statista.com/statistics/255971/top-countries-based-on-rice-consumption-2012-2013/ (accessed on 20 September 2020).
- Cocheme, J.; Franquin, P. Etude Agroclimatologique Dans une zone Semi-aride en Afrique au sud du Sahara Projet Conjoint; FAO; UNESCO; OMMFAO: Rome, Italy, 1967; Volume VIII, 326p. [Google Scholar]
Figure 1.
Schematic overview of the methodological approach.
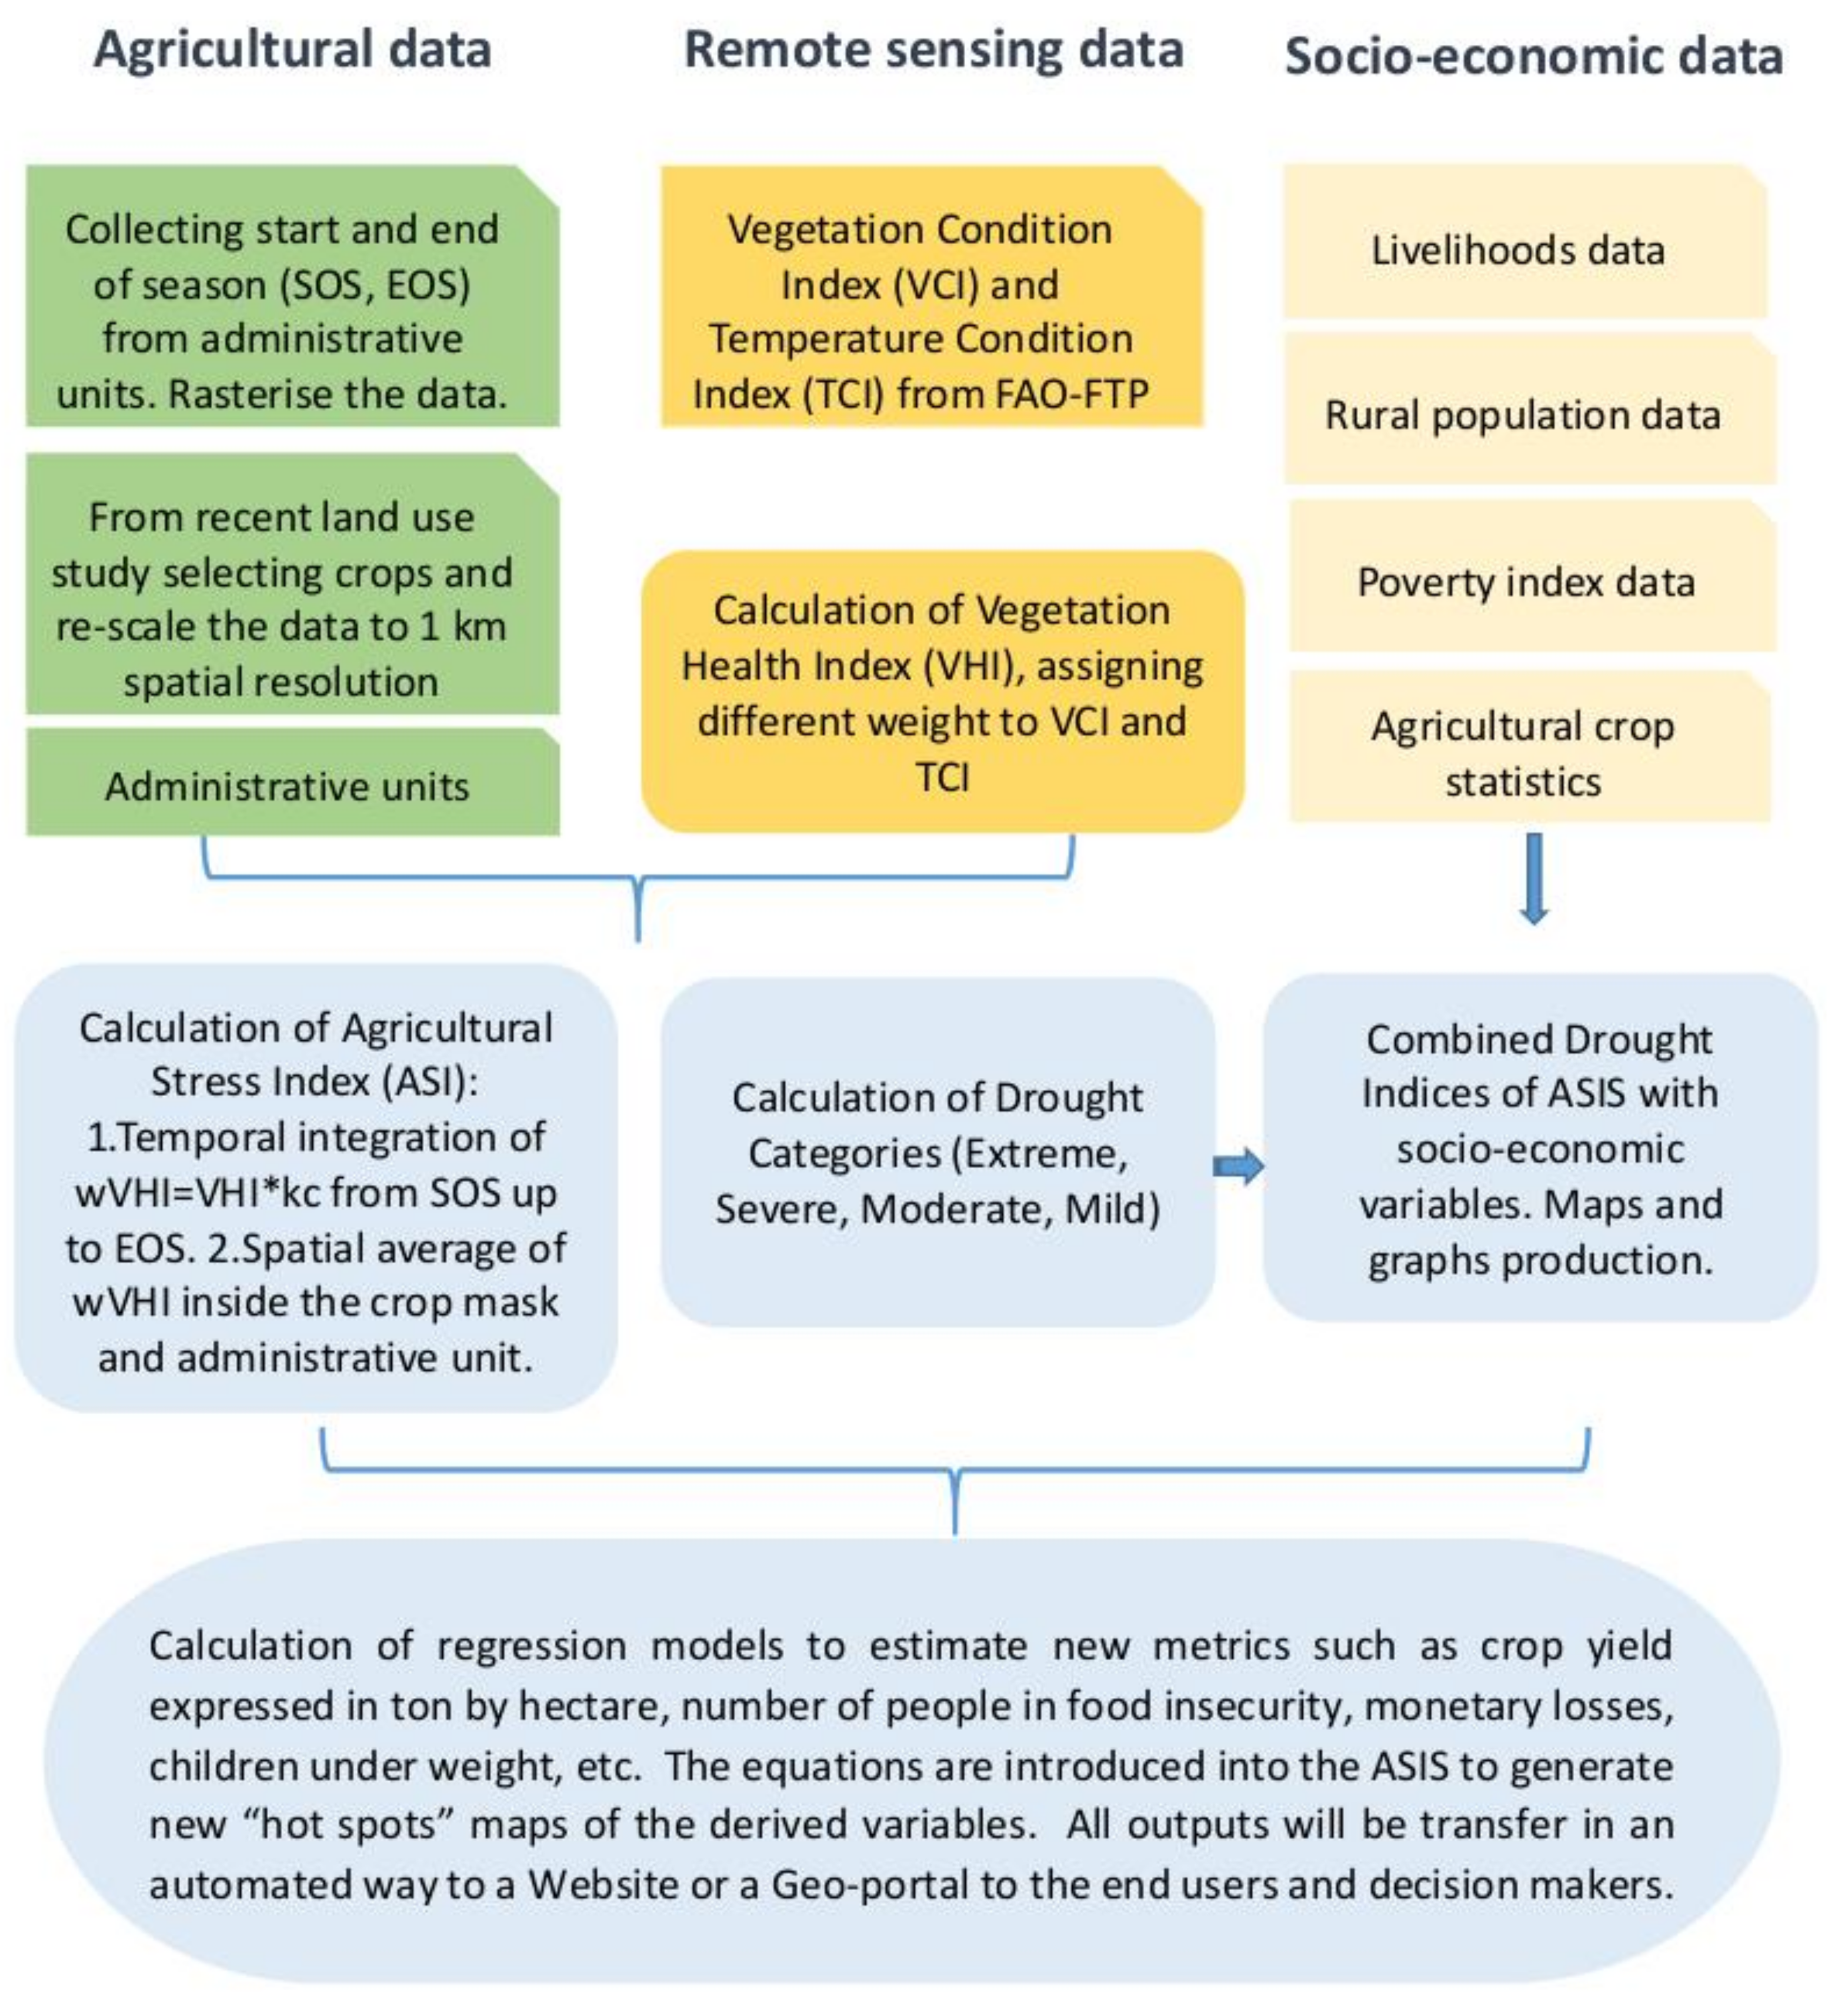
Figure 2.
Process used to calculate the percentage of crop affected by drought (ASI) at administrative unit level. The graph on the upper right-hand shows the temporal wVHI average values, while the graph on the lower right-hand displays their spatial wVHI average values. Source: FAO, 2018 [14].
Figure 2.
Process used to calculate the percentage of crop affected by drought (ASI) at administrative unit level. The graph on the upper right-hand shows the temporal wVHI average values, while the graph on the lower right-hand displays their spatial wVHI average values. Source: FAO, 2018 [14].
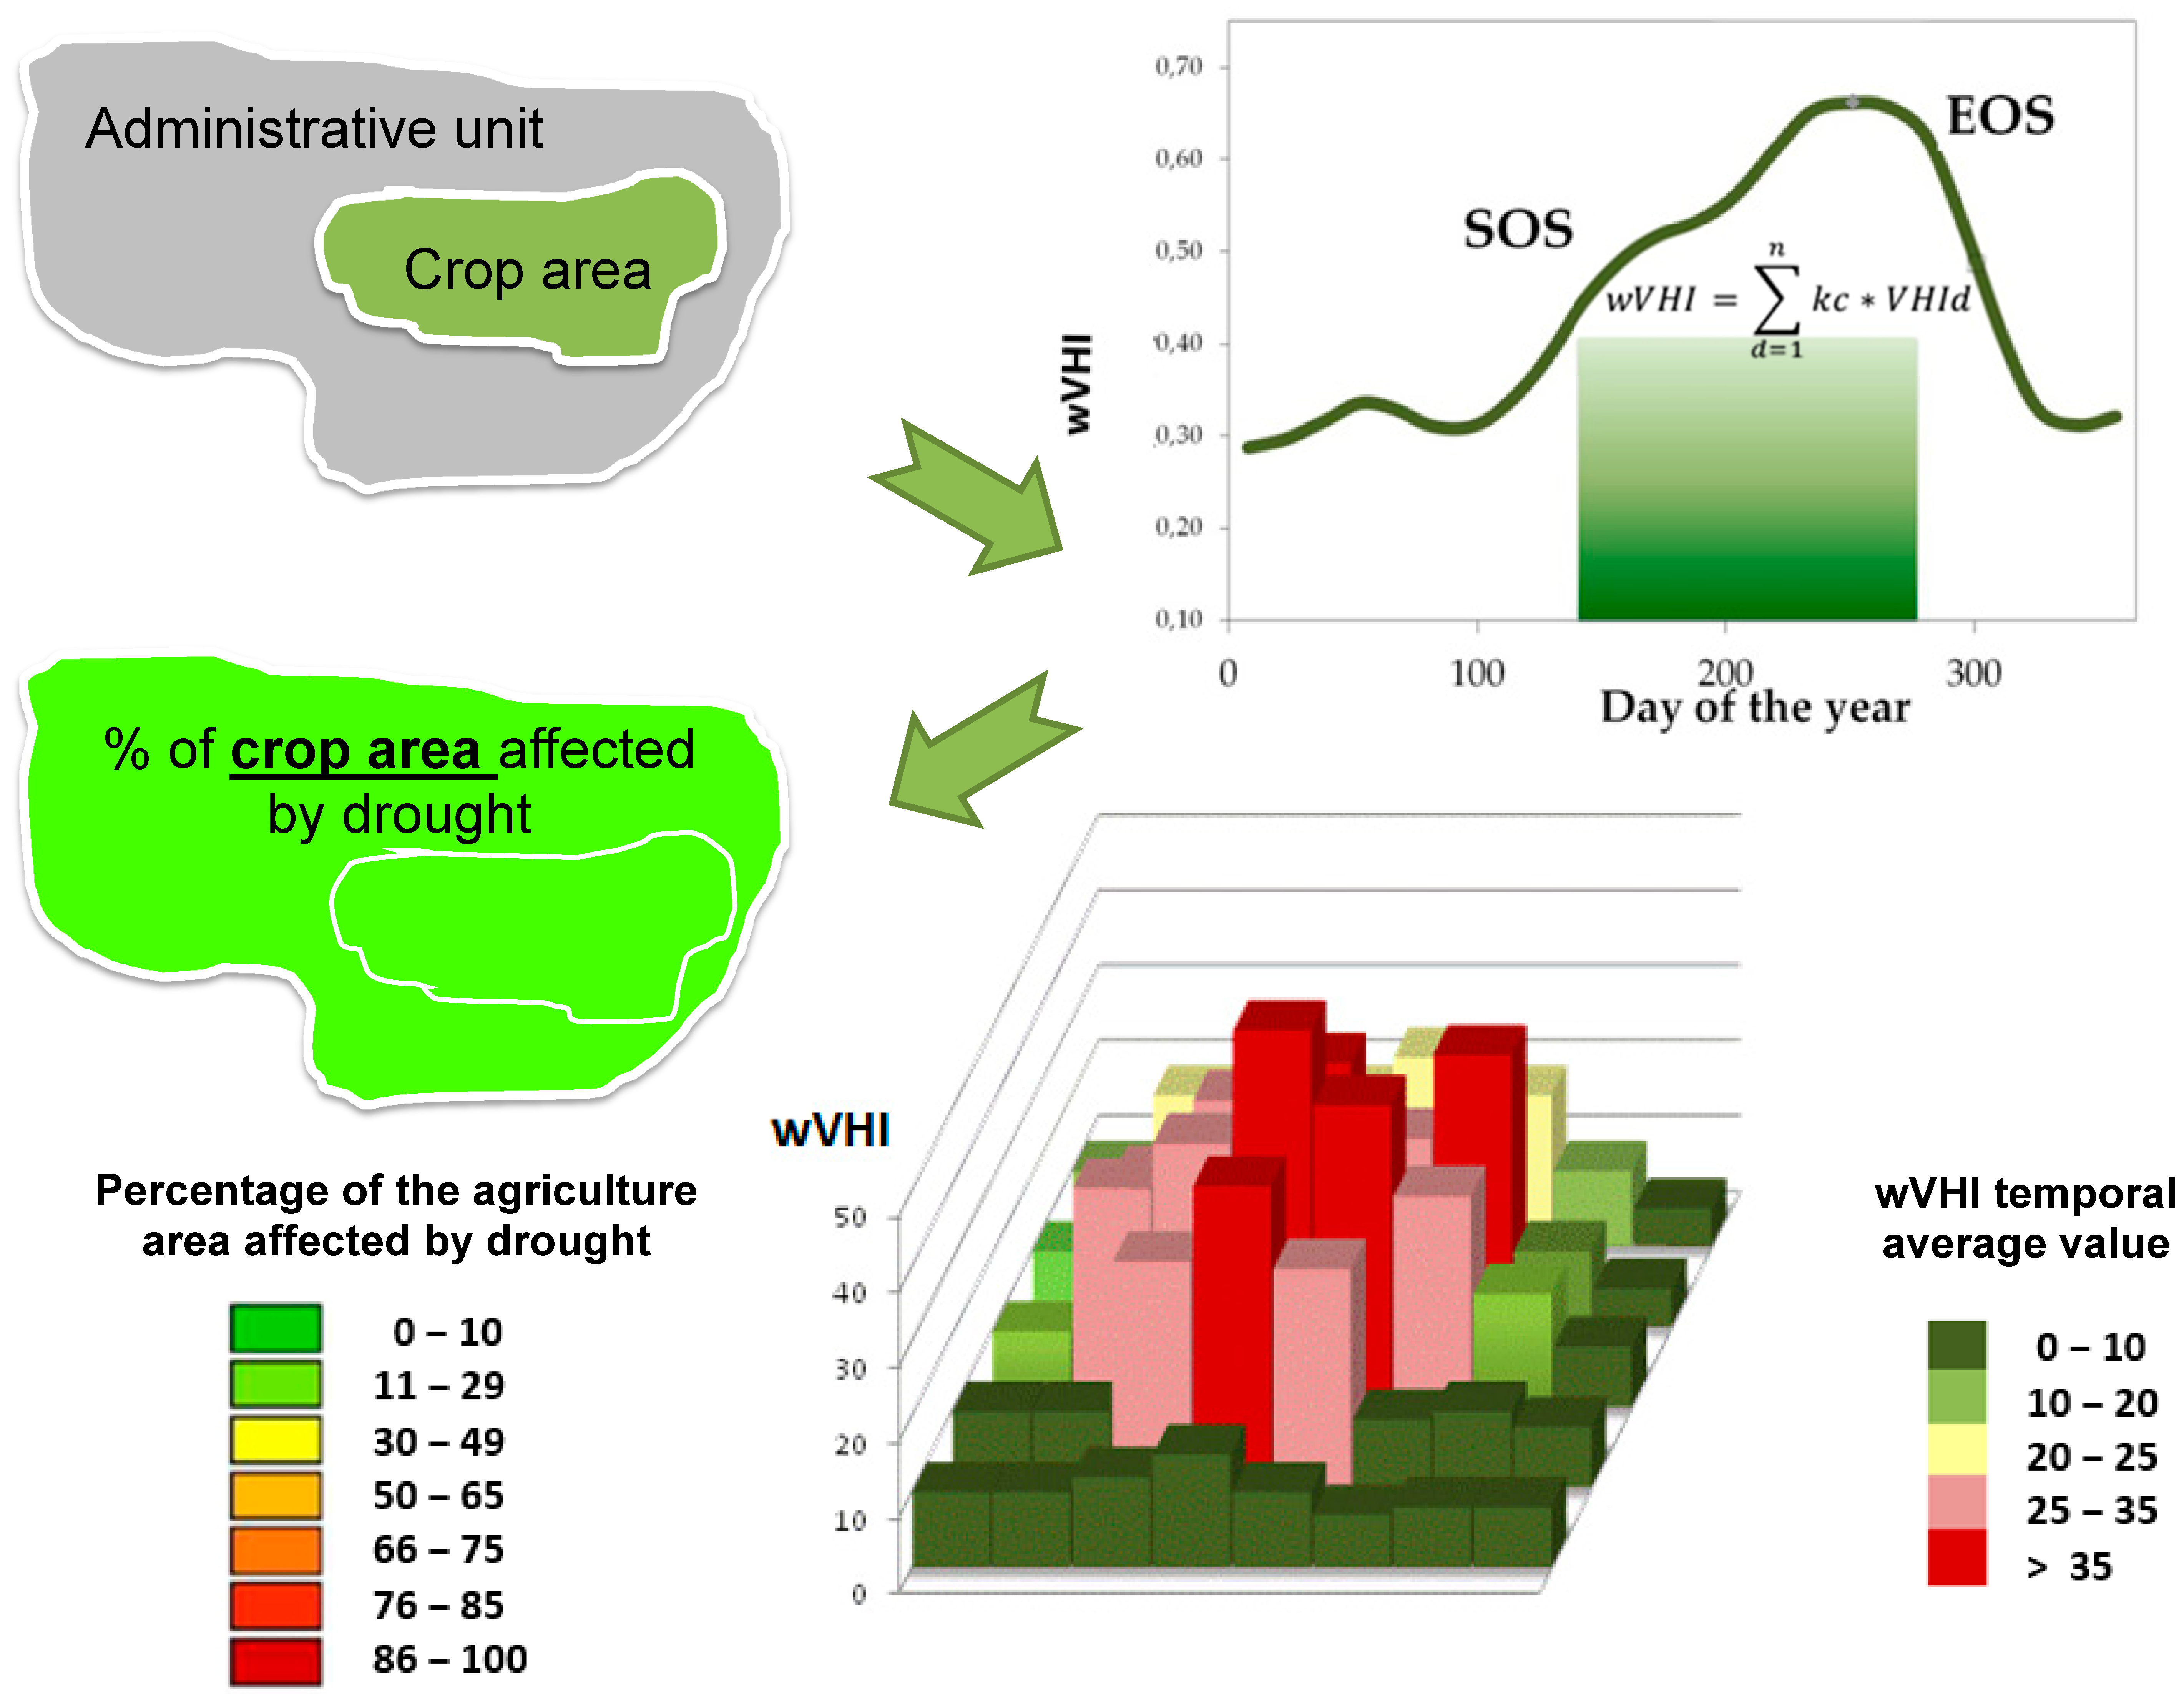
Figure 3.
Thresholds for defining each agricultural drought category.
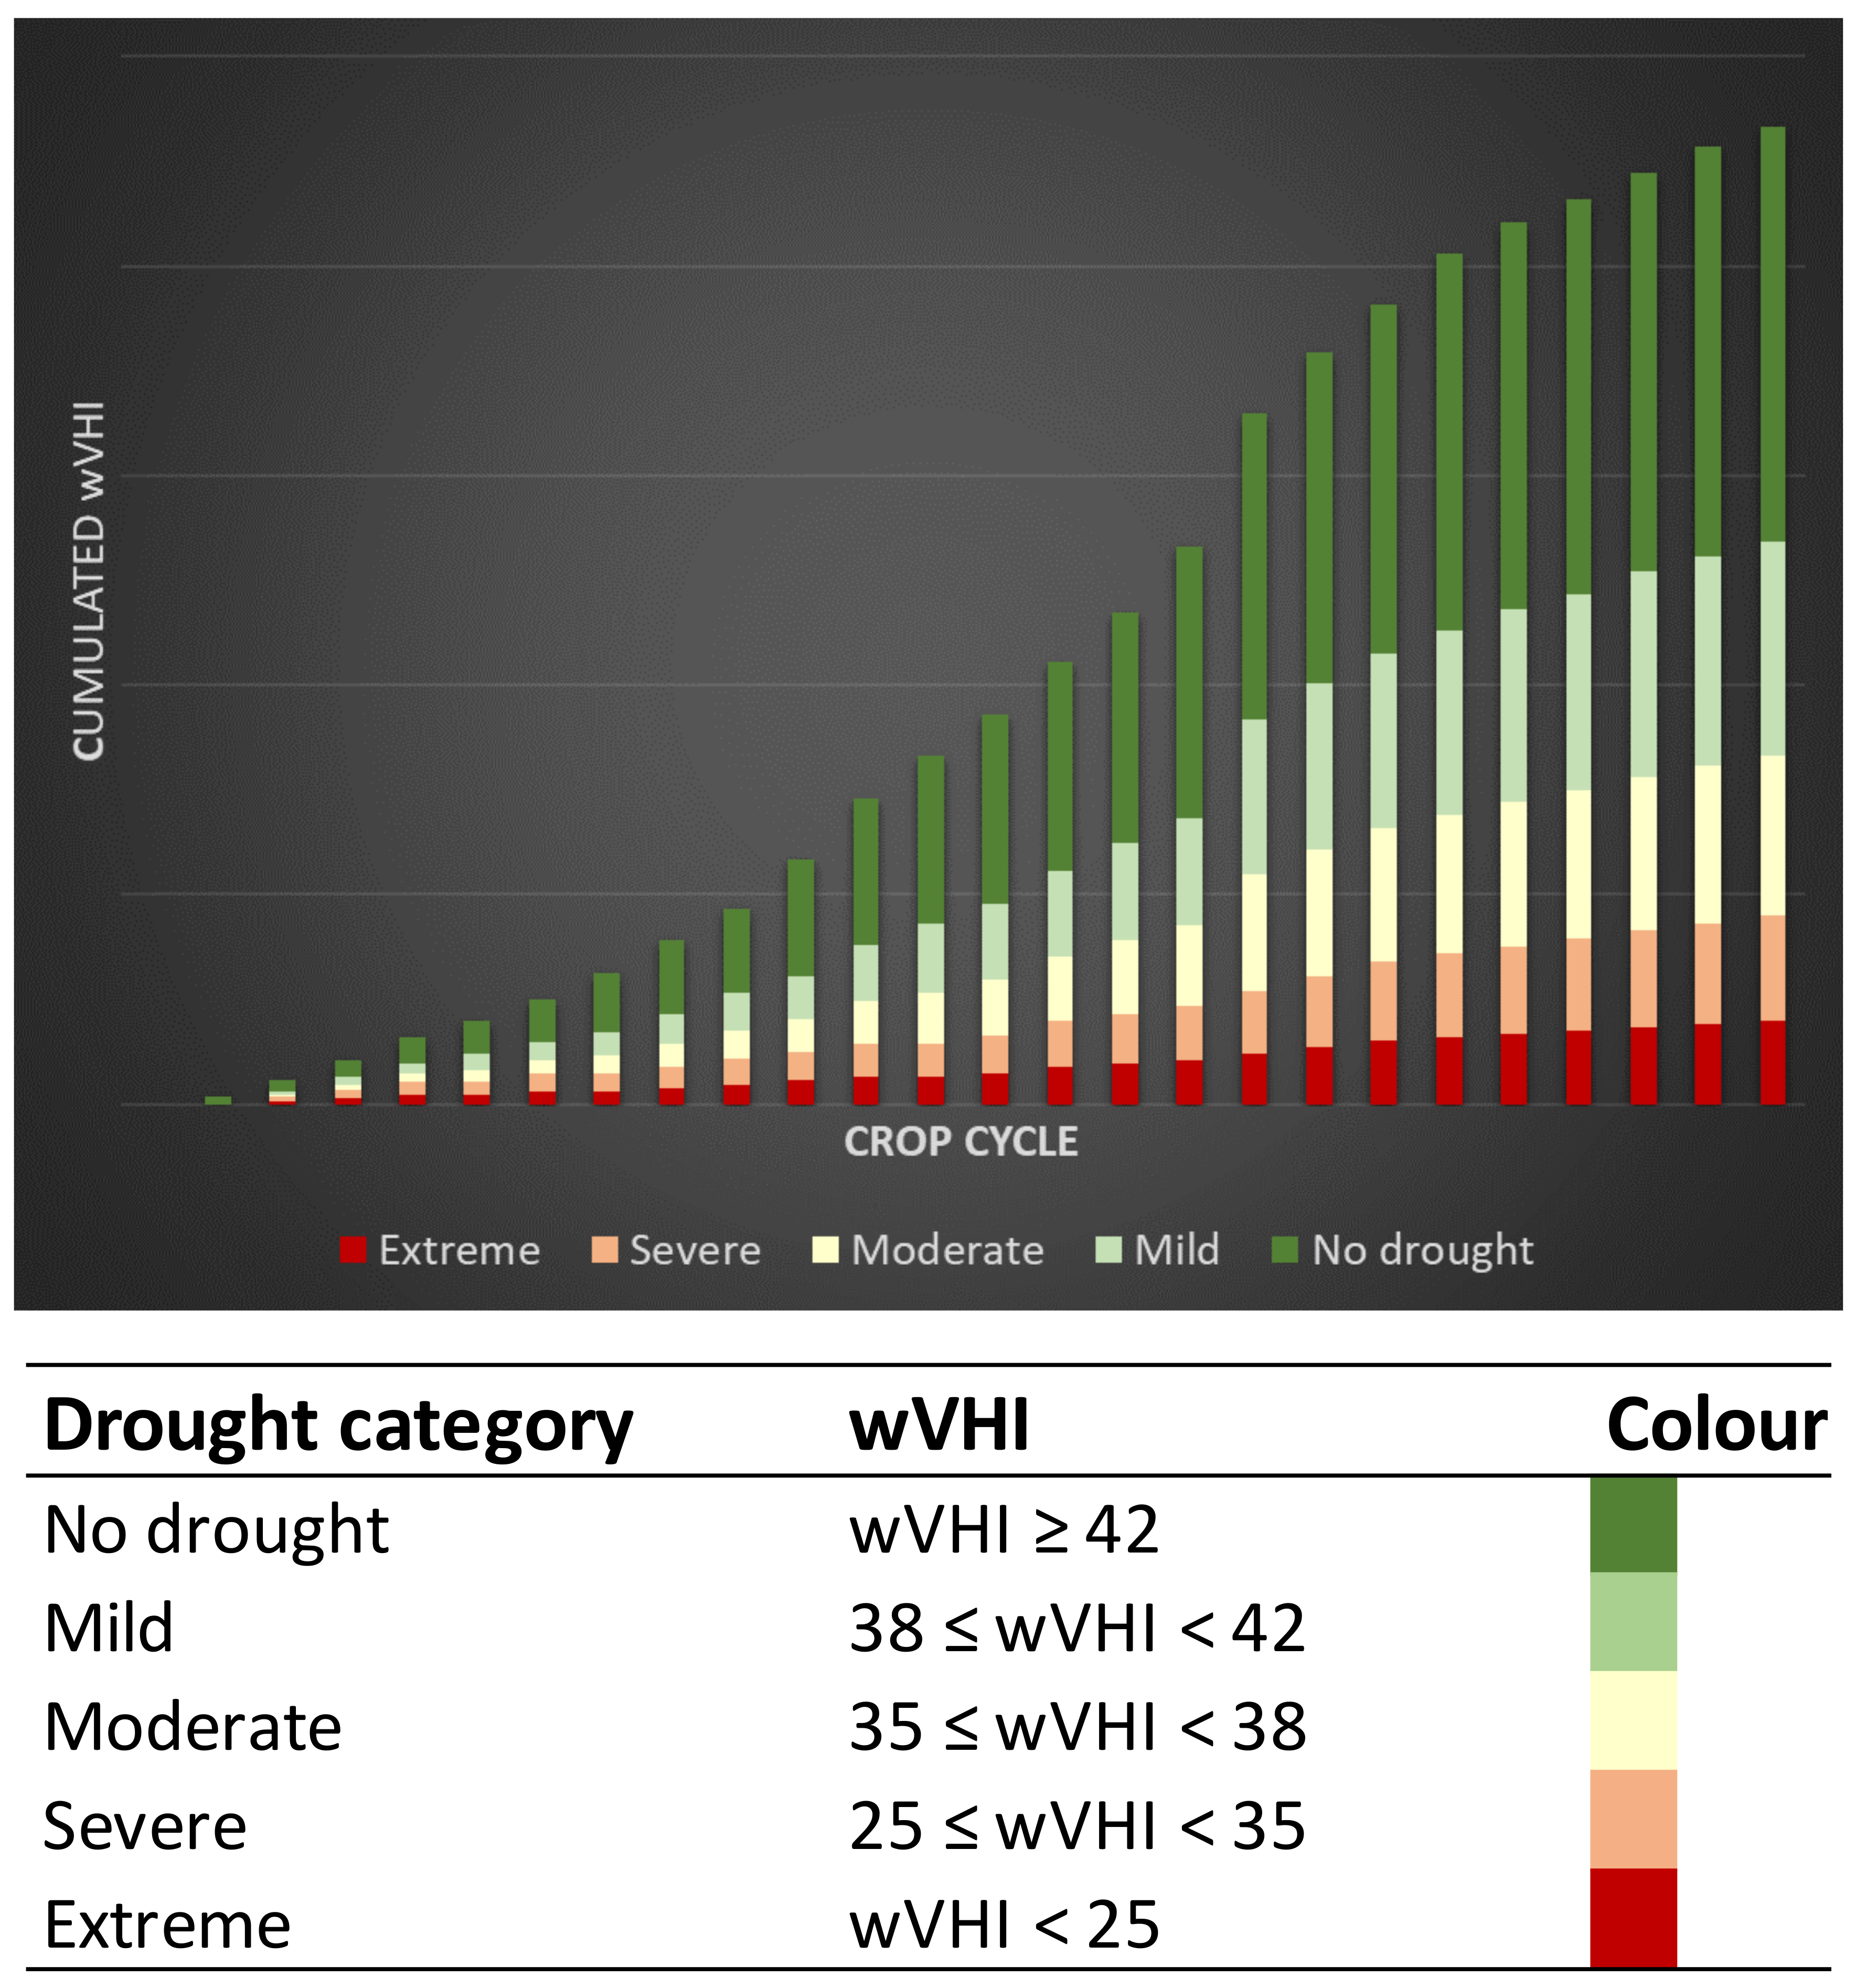
Figure 4.
Schematic overview of the methodology approach to estimate the probability of agricultural drought at pixel level. Source: Meroni, et al, 2014 [24].
Figure 4.
Schematic overview of the methodology approach to estimate the probability of agricultural drought at pixel level. Source: Meroni, et al, 2014 [24].

Figure 5.
The phenological data, start of season (SOS) and end of season (EOS) for the first crop season of rice, maize and beans in El Salvador. Top information from administrative unit. Bottom the same data rasterized.
Figure 5.
The phenological data, start of season (SOS) and end of season (EOS) for the first crop season of rice, maize and beans in El Salvador. Top information from administrative unit. Bottom the same data rasterized.
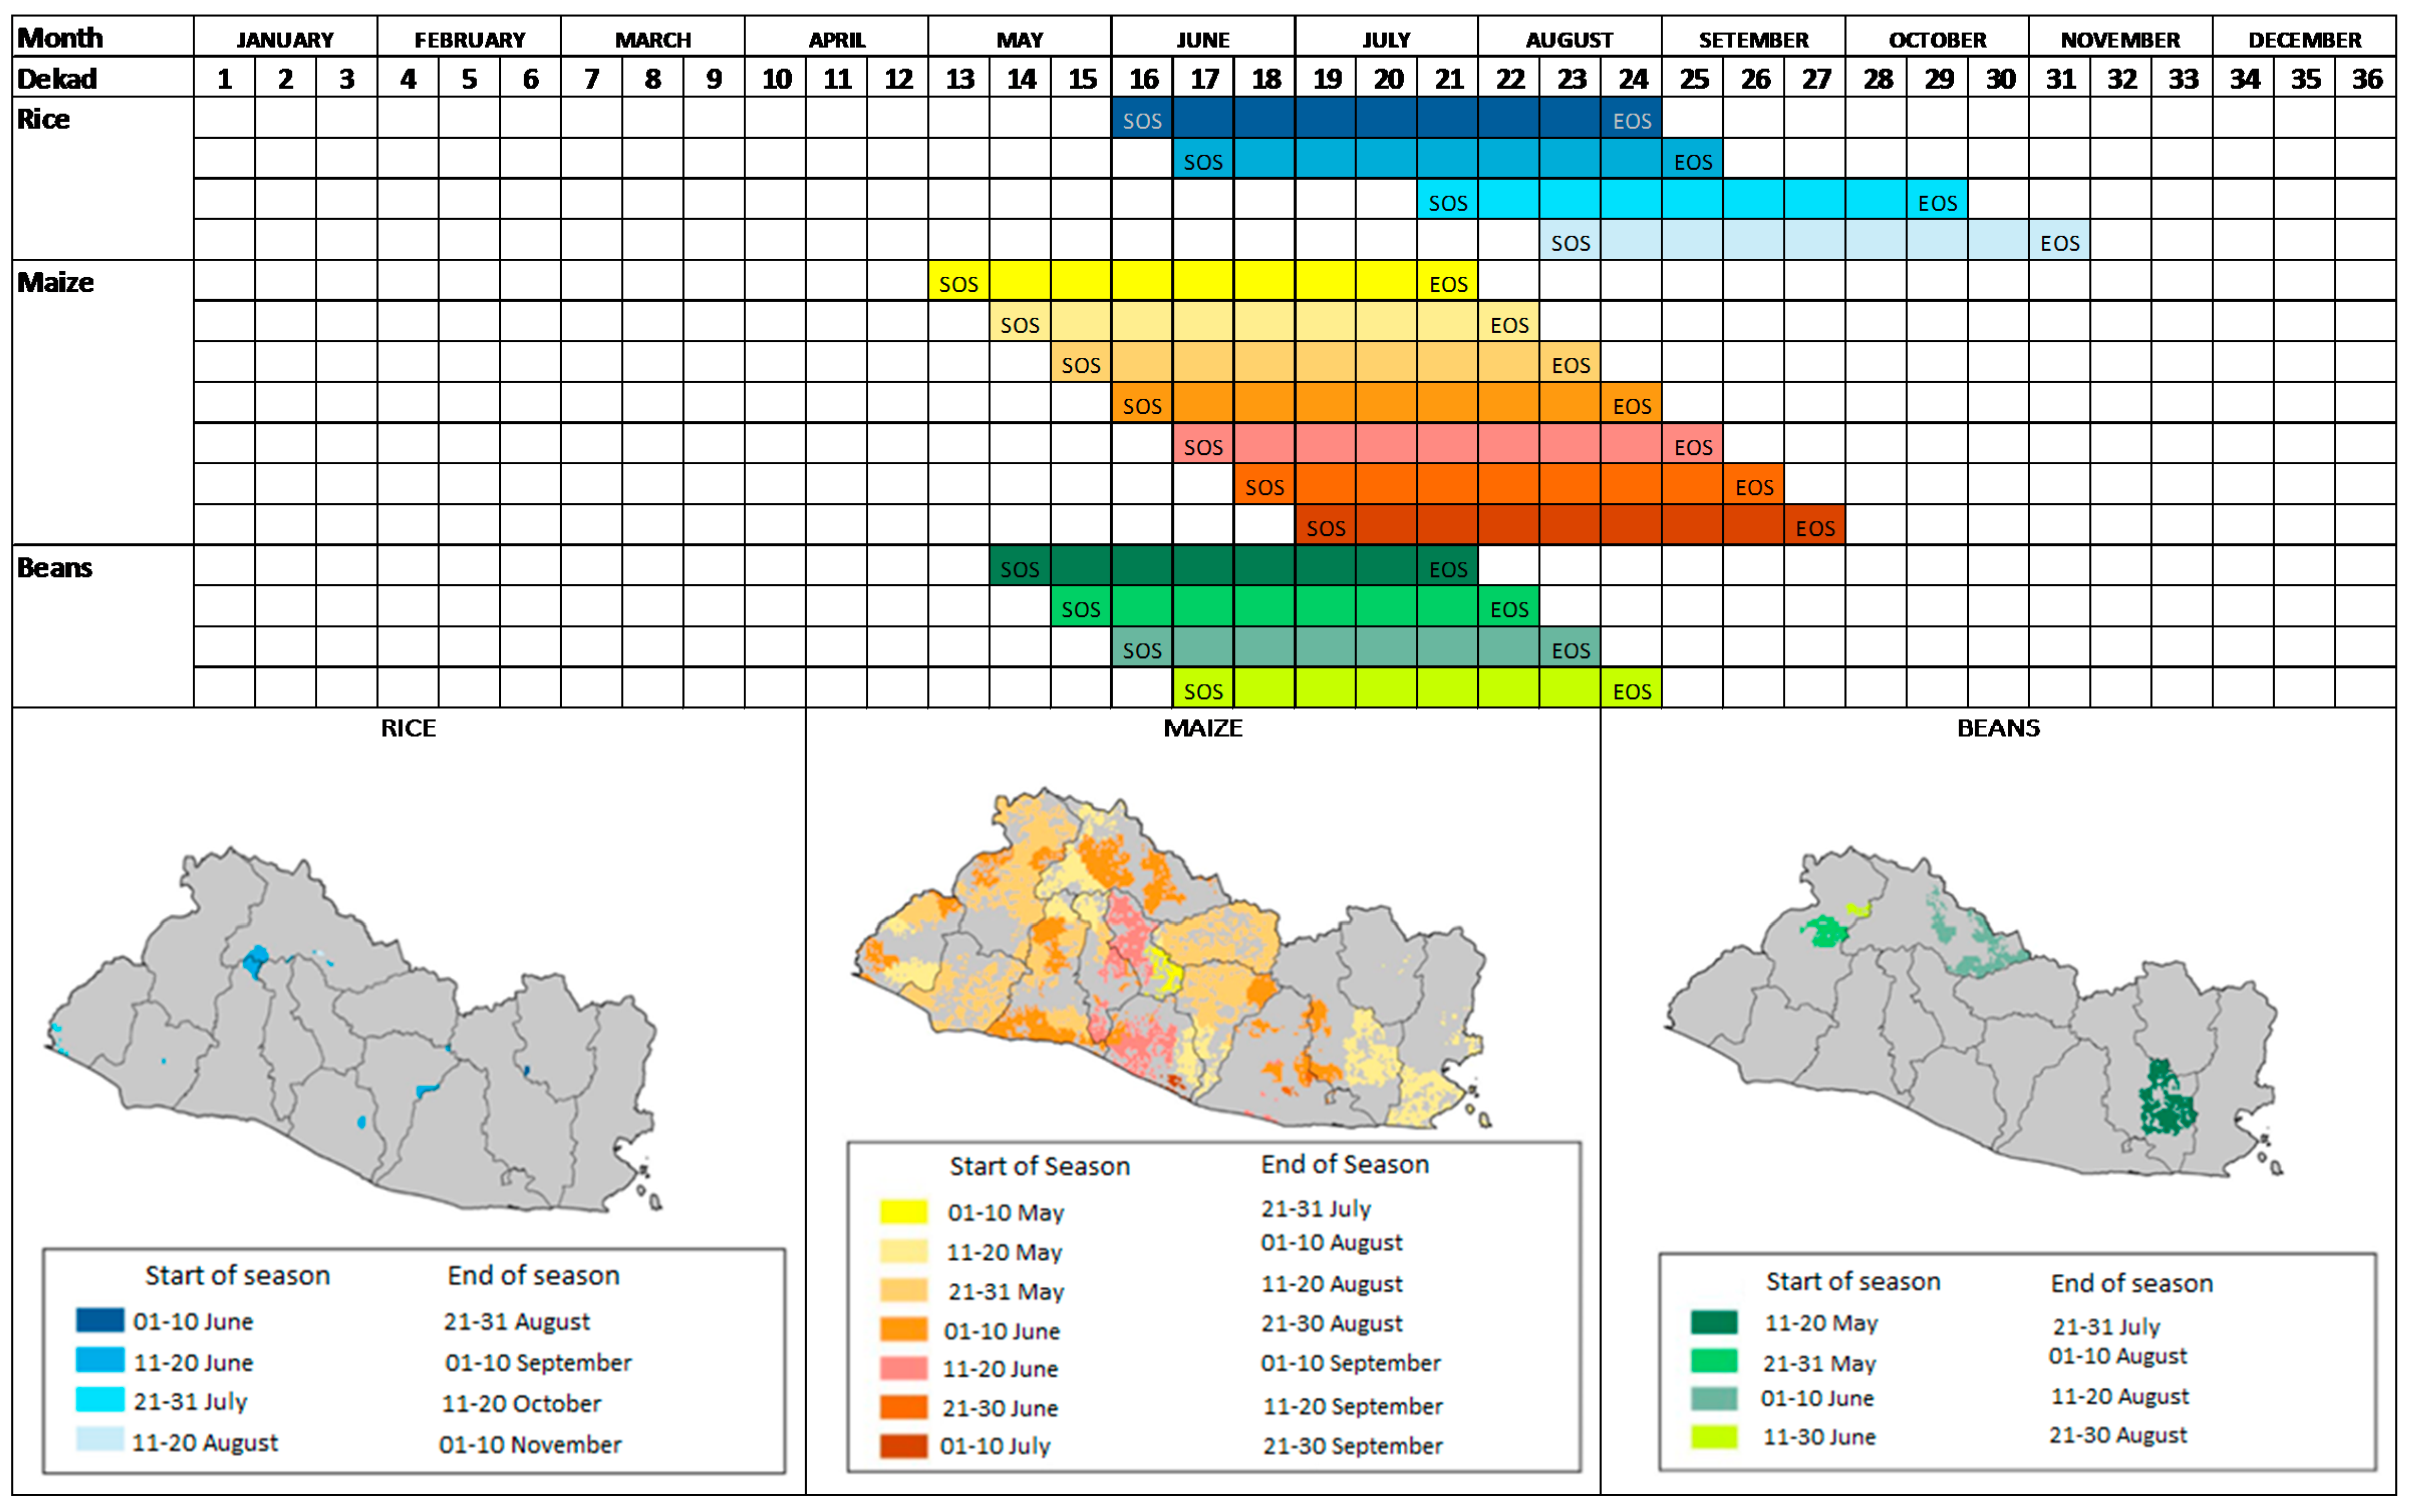
Figure 6.
Influence of the crop coefficient (kc) on the drought classification. (A) Map shows the crop coefficient rasterized in Guatemala. Areas without maize have been masked-out. Upper right graph shows the kc evolution during the phenological phases of maize. Dashed lines (red) represents the simplification of kc evolution proposed by Allen [26]. (B) Bottom left table shows the values of a 120 days maize crop cycle. Temporal average of VHI without weighting is 0.5 (No-drought). Temporal wVHI goes from mild to severe drought, depending of the dekad in which water stress occurred. In the example, it is used the same values of VHI but changing the temporal distribution. Pixel values of 0.20 (in red) represent the water stress. Bottom right graph shows the drought classification based on the pixel value of wVHI when three dekads have water stress during different moments of the crop cycle.
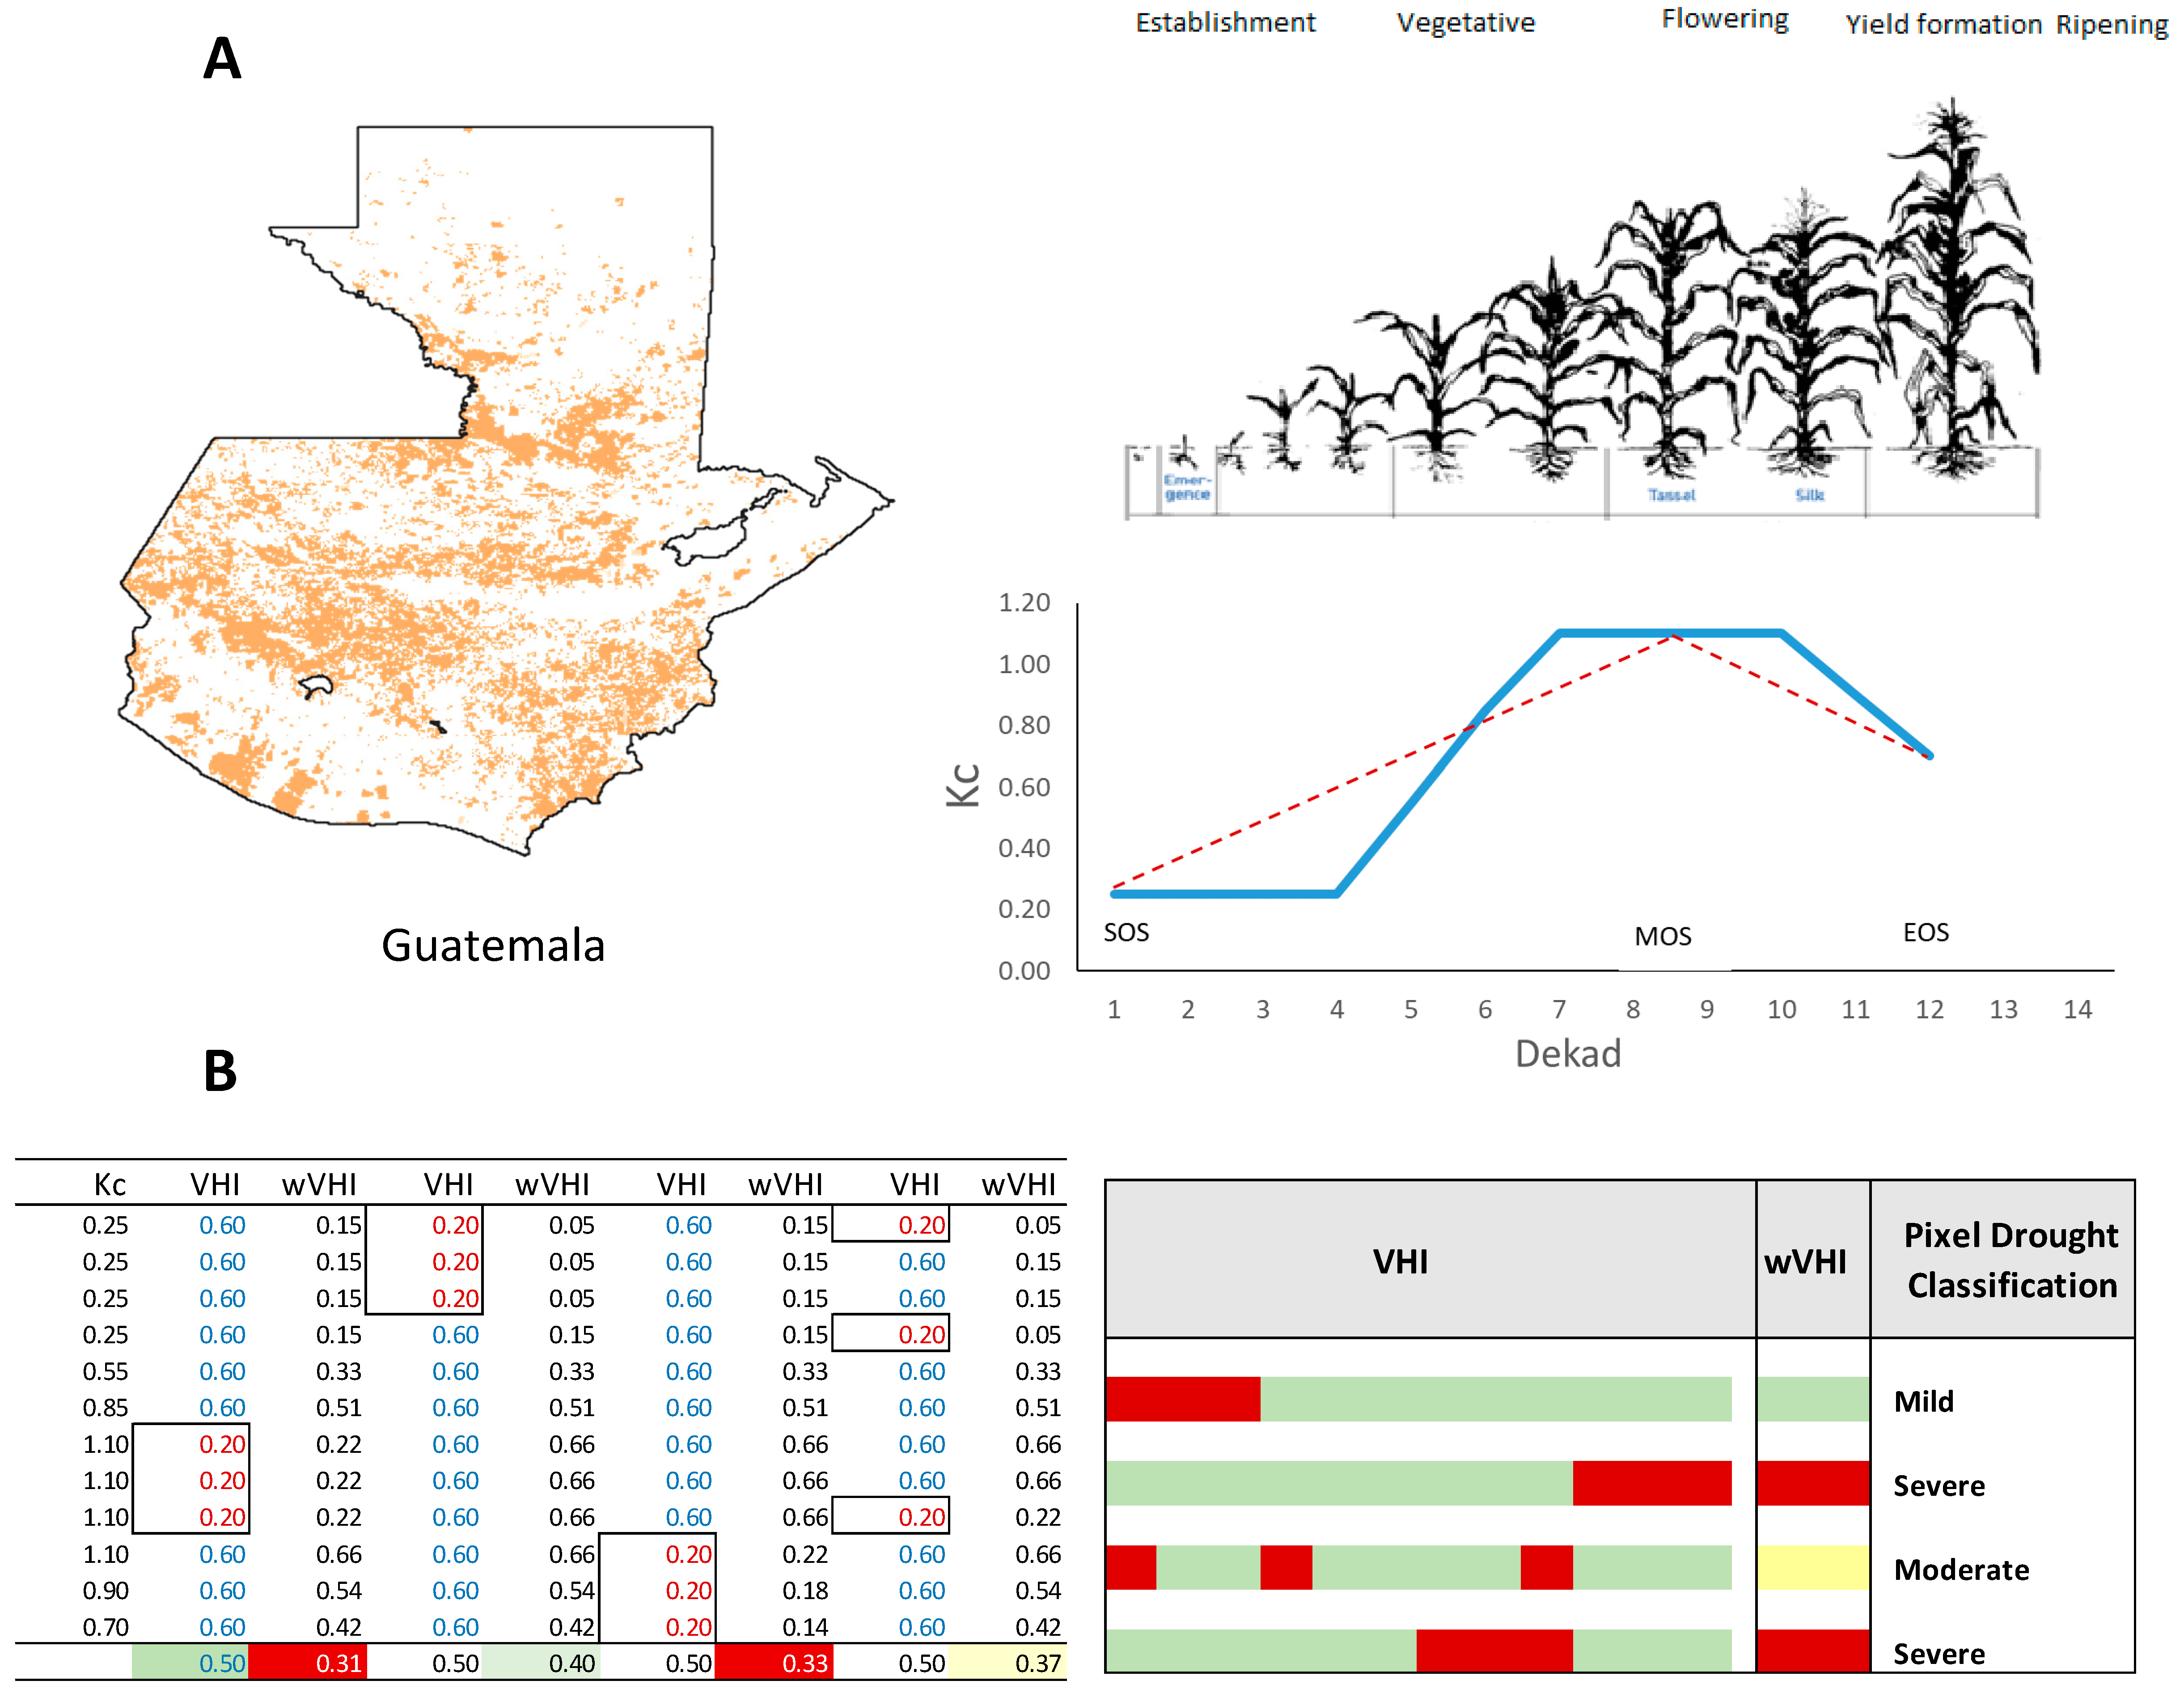
Figure 7.
Weighed Vegetation Health Index (wVHI) of fodder-oats for 2003 crop season in the province of Puno, Peru (map). Top graph on the right, cumulated VHI without weighting. Bottom graph on the right, cumulated weighted VHI (wVHI). The difference in the position of the profiles is due to the impact of a sensible phenological phase to water stress (i.e. third ranking position in the top graph from top to bottom moves a lower position (green line) because the introduction of the kc).
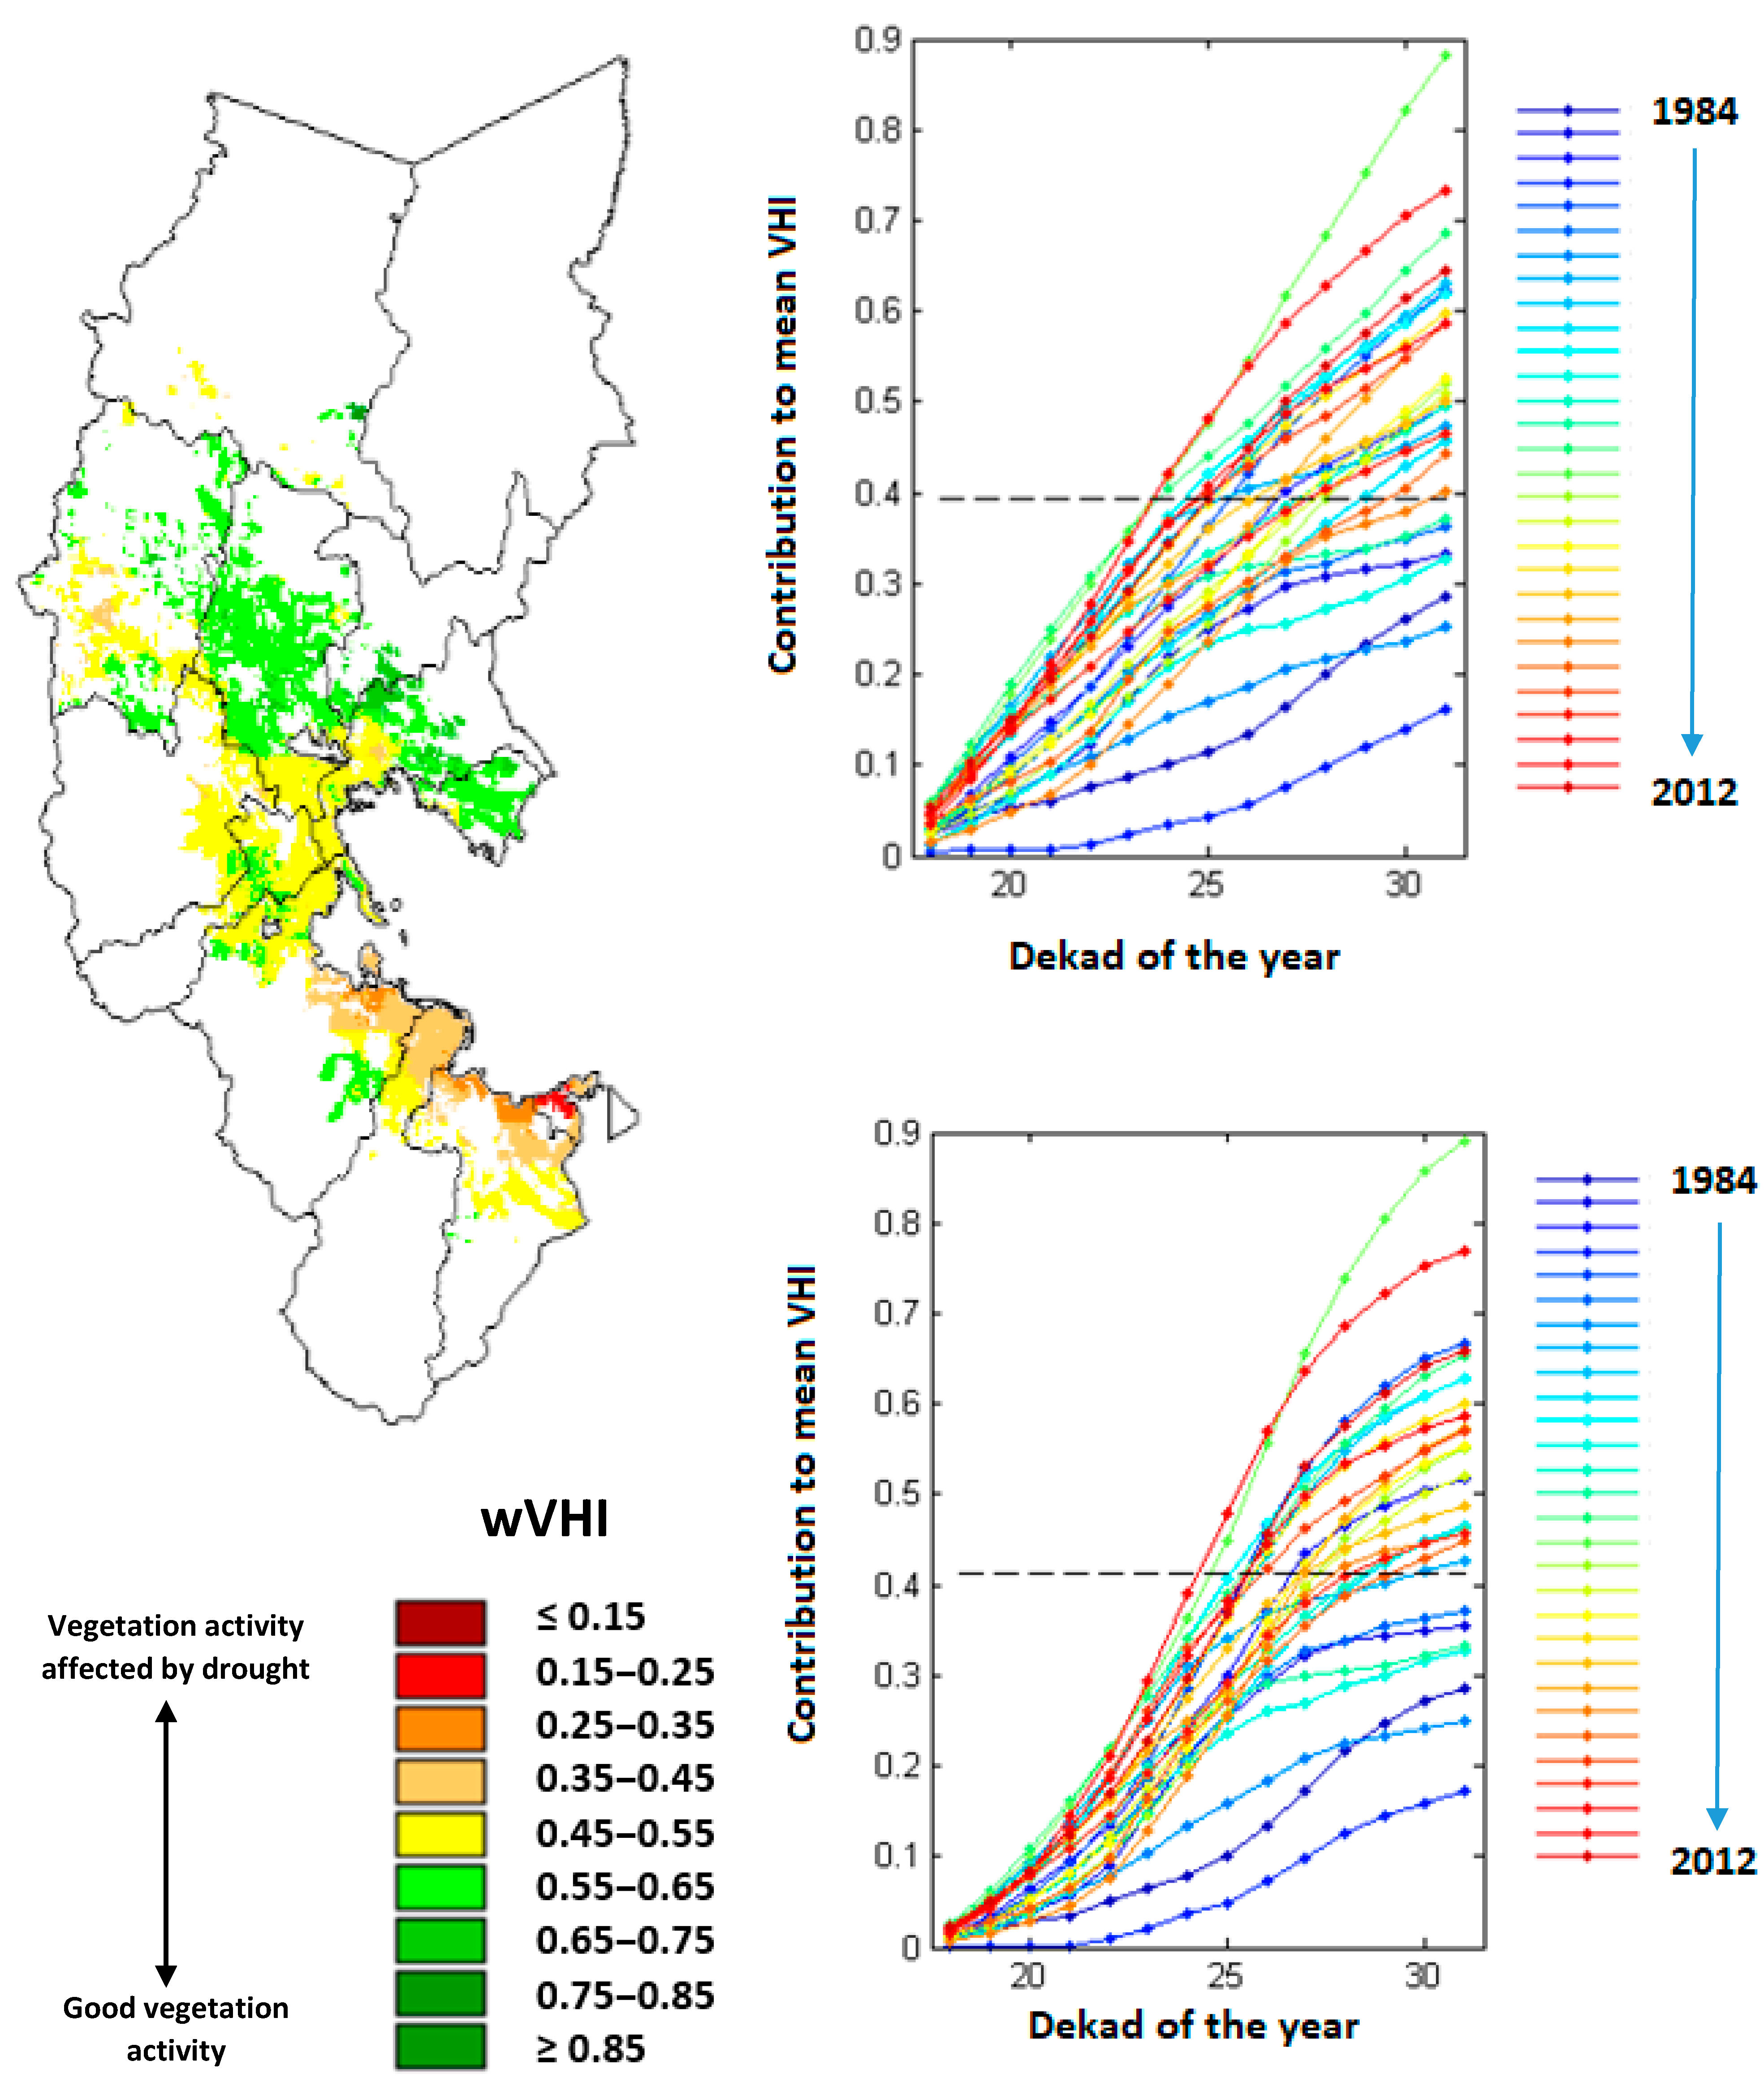
Figure 8.
On the left maps of percentage of rice area affected by drought (ASI) during 1998 El Niño that produced a serious reduction on the rice production. On the right, graphs with the historical area affected by drought and the country annual rice production de-trended (red line) from FAO-STAT http://www.fao.org/faostat/en/#home. ASI could be used to trigger a pay-out in case of a parametric crop insurance; for instance the value of 20 of ASI could be used with different prime based on drought risk. The first crop season shows less extreme drought events that second and third crop seasons. Source: FAO, 2018 [14].
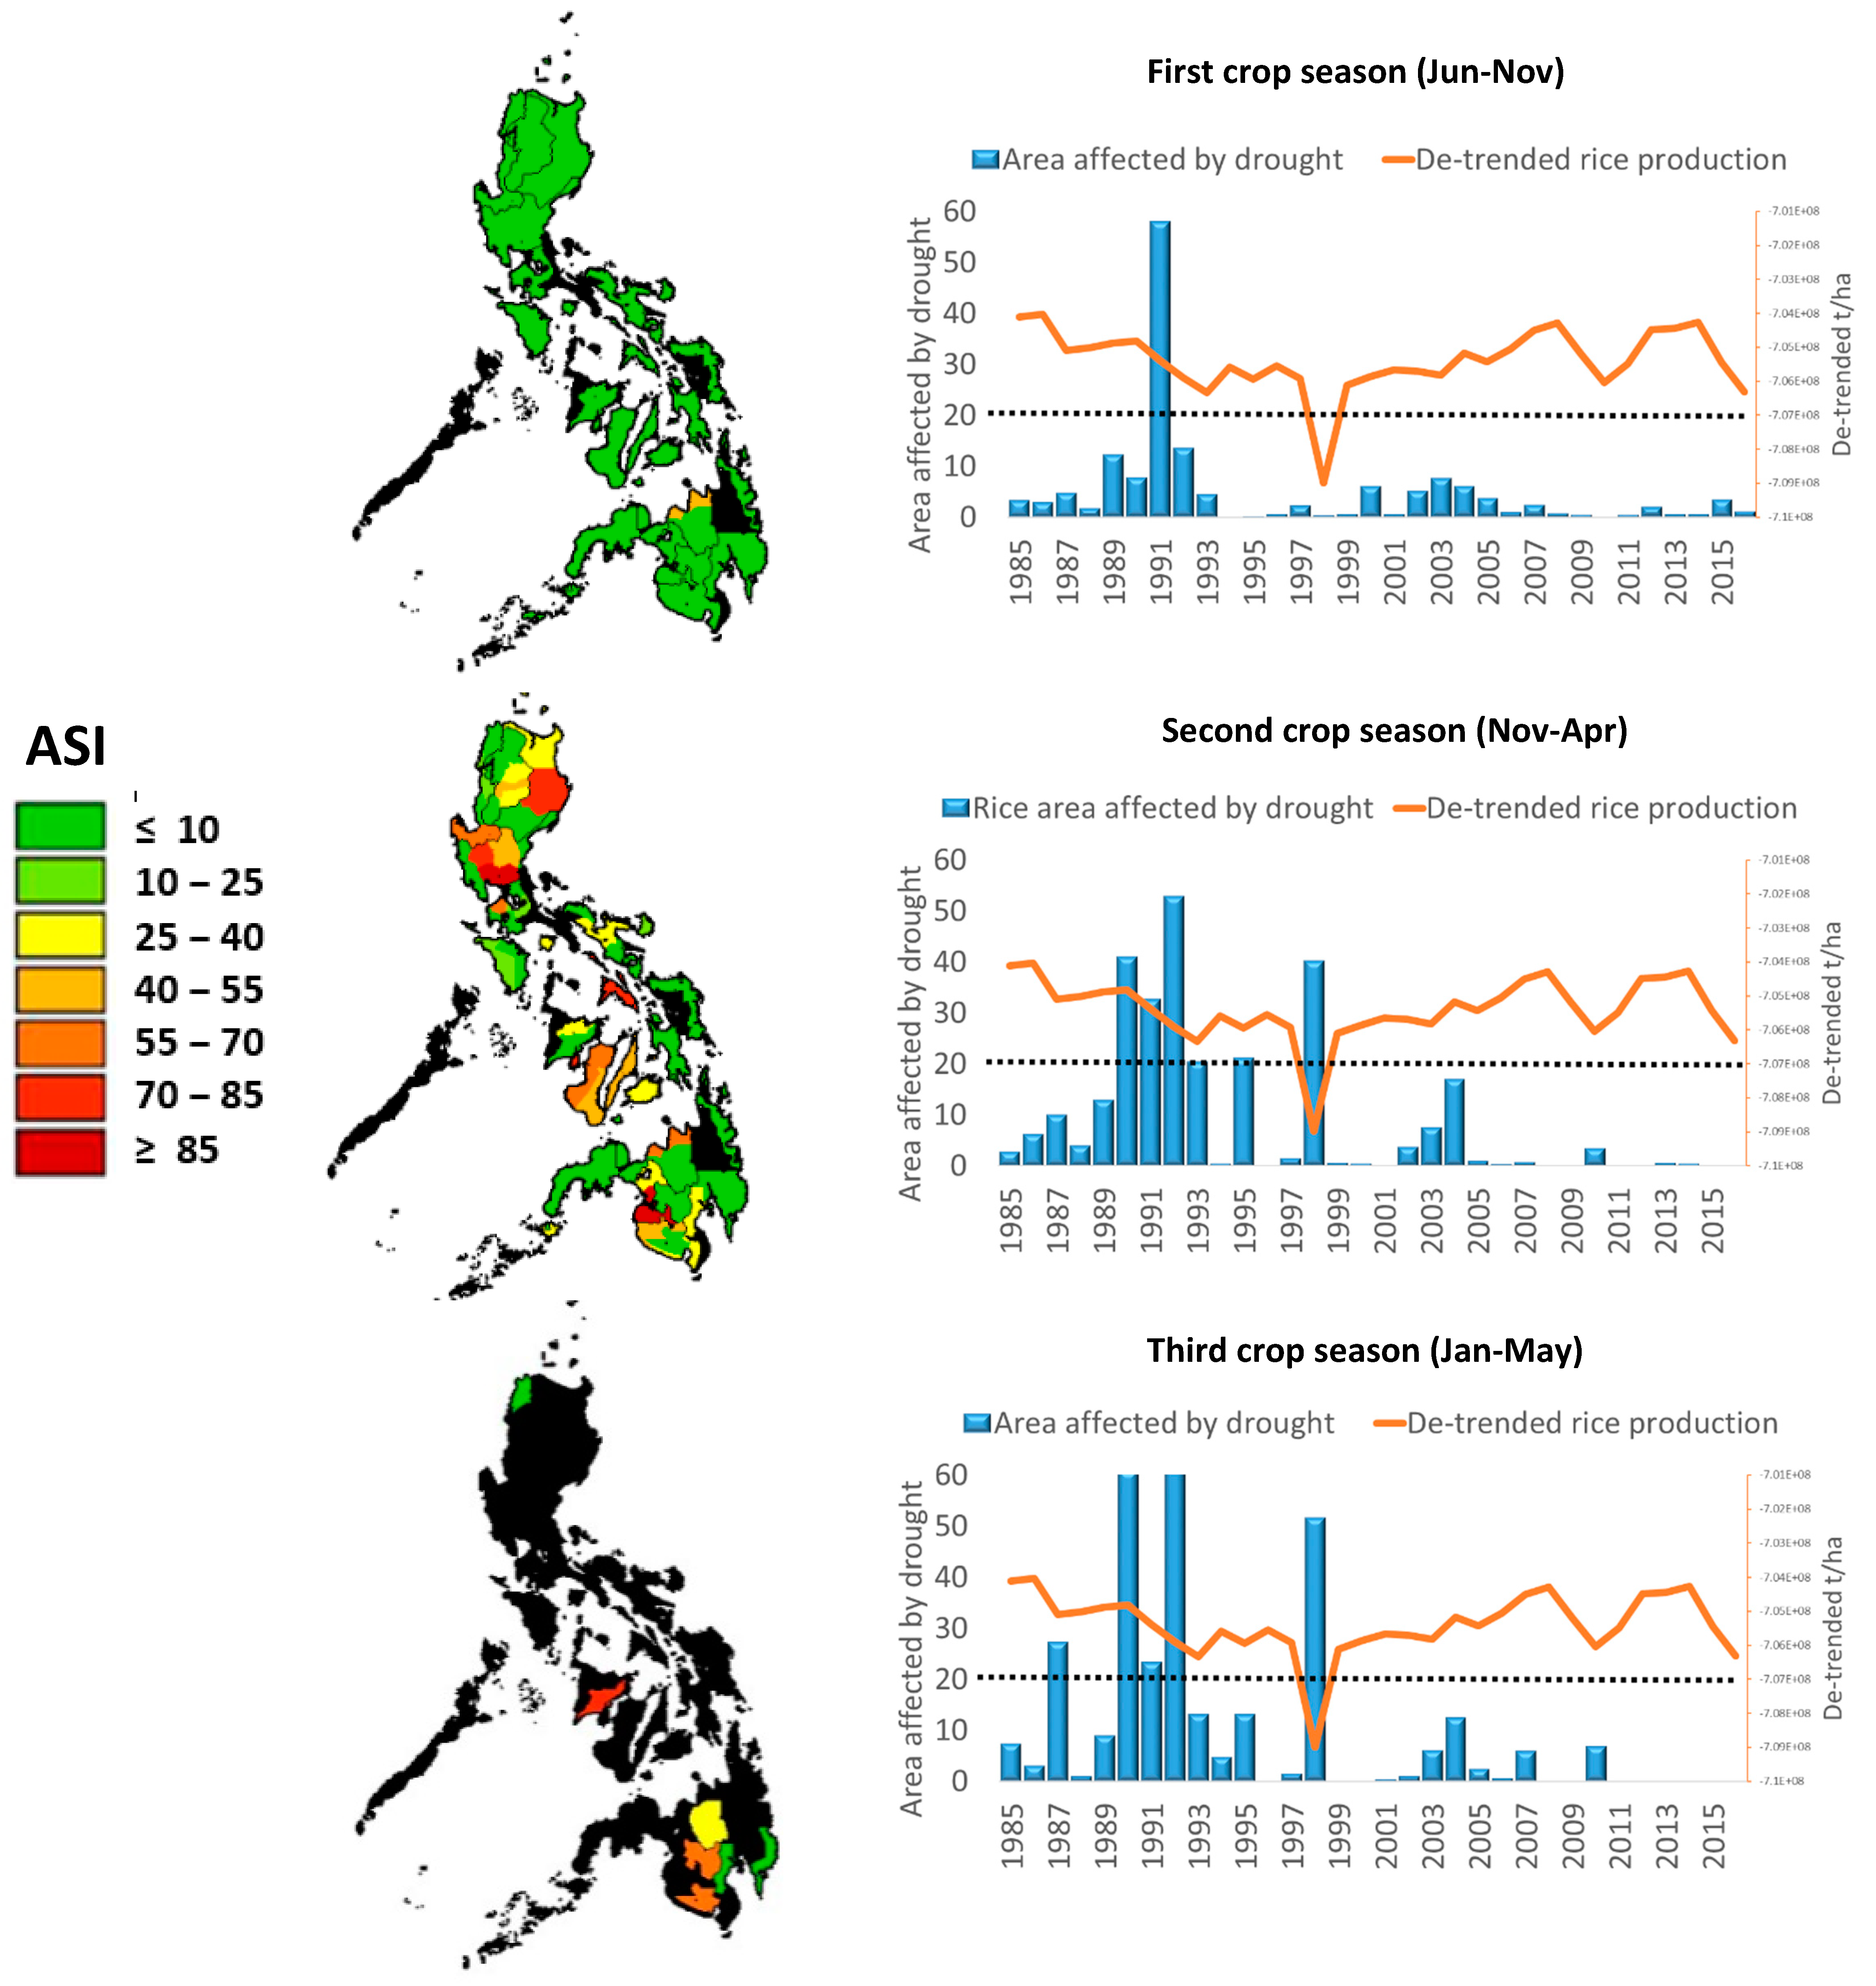
Figure 9.
Example of parametric crop insurance with deducible for rice during second crop season in the Philippines. The farmers will receive 100% of the indemnity when the percentage of area affected by drought (ASI) is equal or bigger than 30, the indemnity will reduce from 30 to 10 and the insurance company will not cover any loss occurred when the area affected is below 10%.

Figure 10.
Drought categories during 1991 first crop season of maize in Guatemala. Result of the completed crop season (central map) with monthly evolution from January to December 1991 surrounding it.
Figure 10.
Drought categories during 1991 first crop season of maize in Guatemala. Result of the completed crop season (central map) with monthly evolution from January to December 1991 surrounding it.
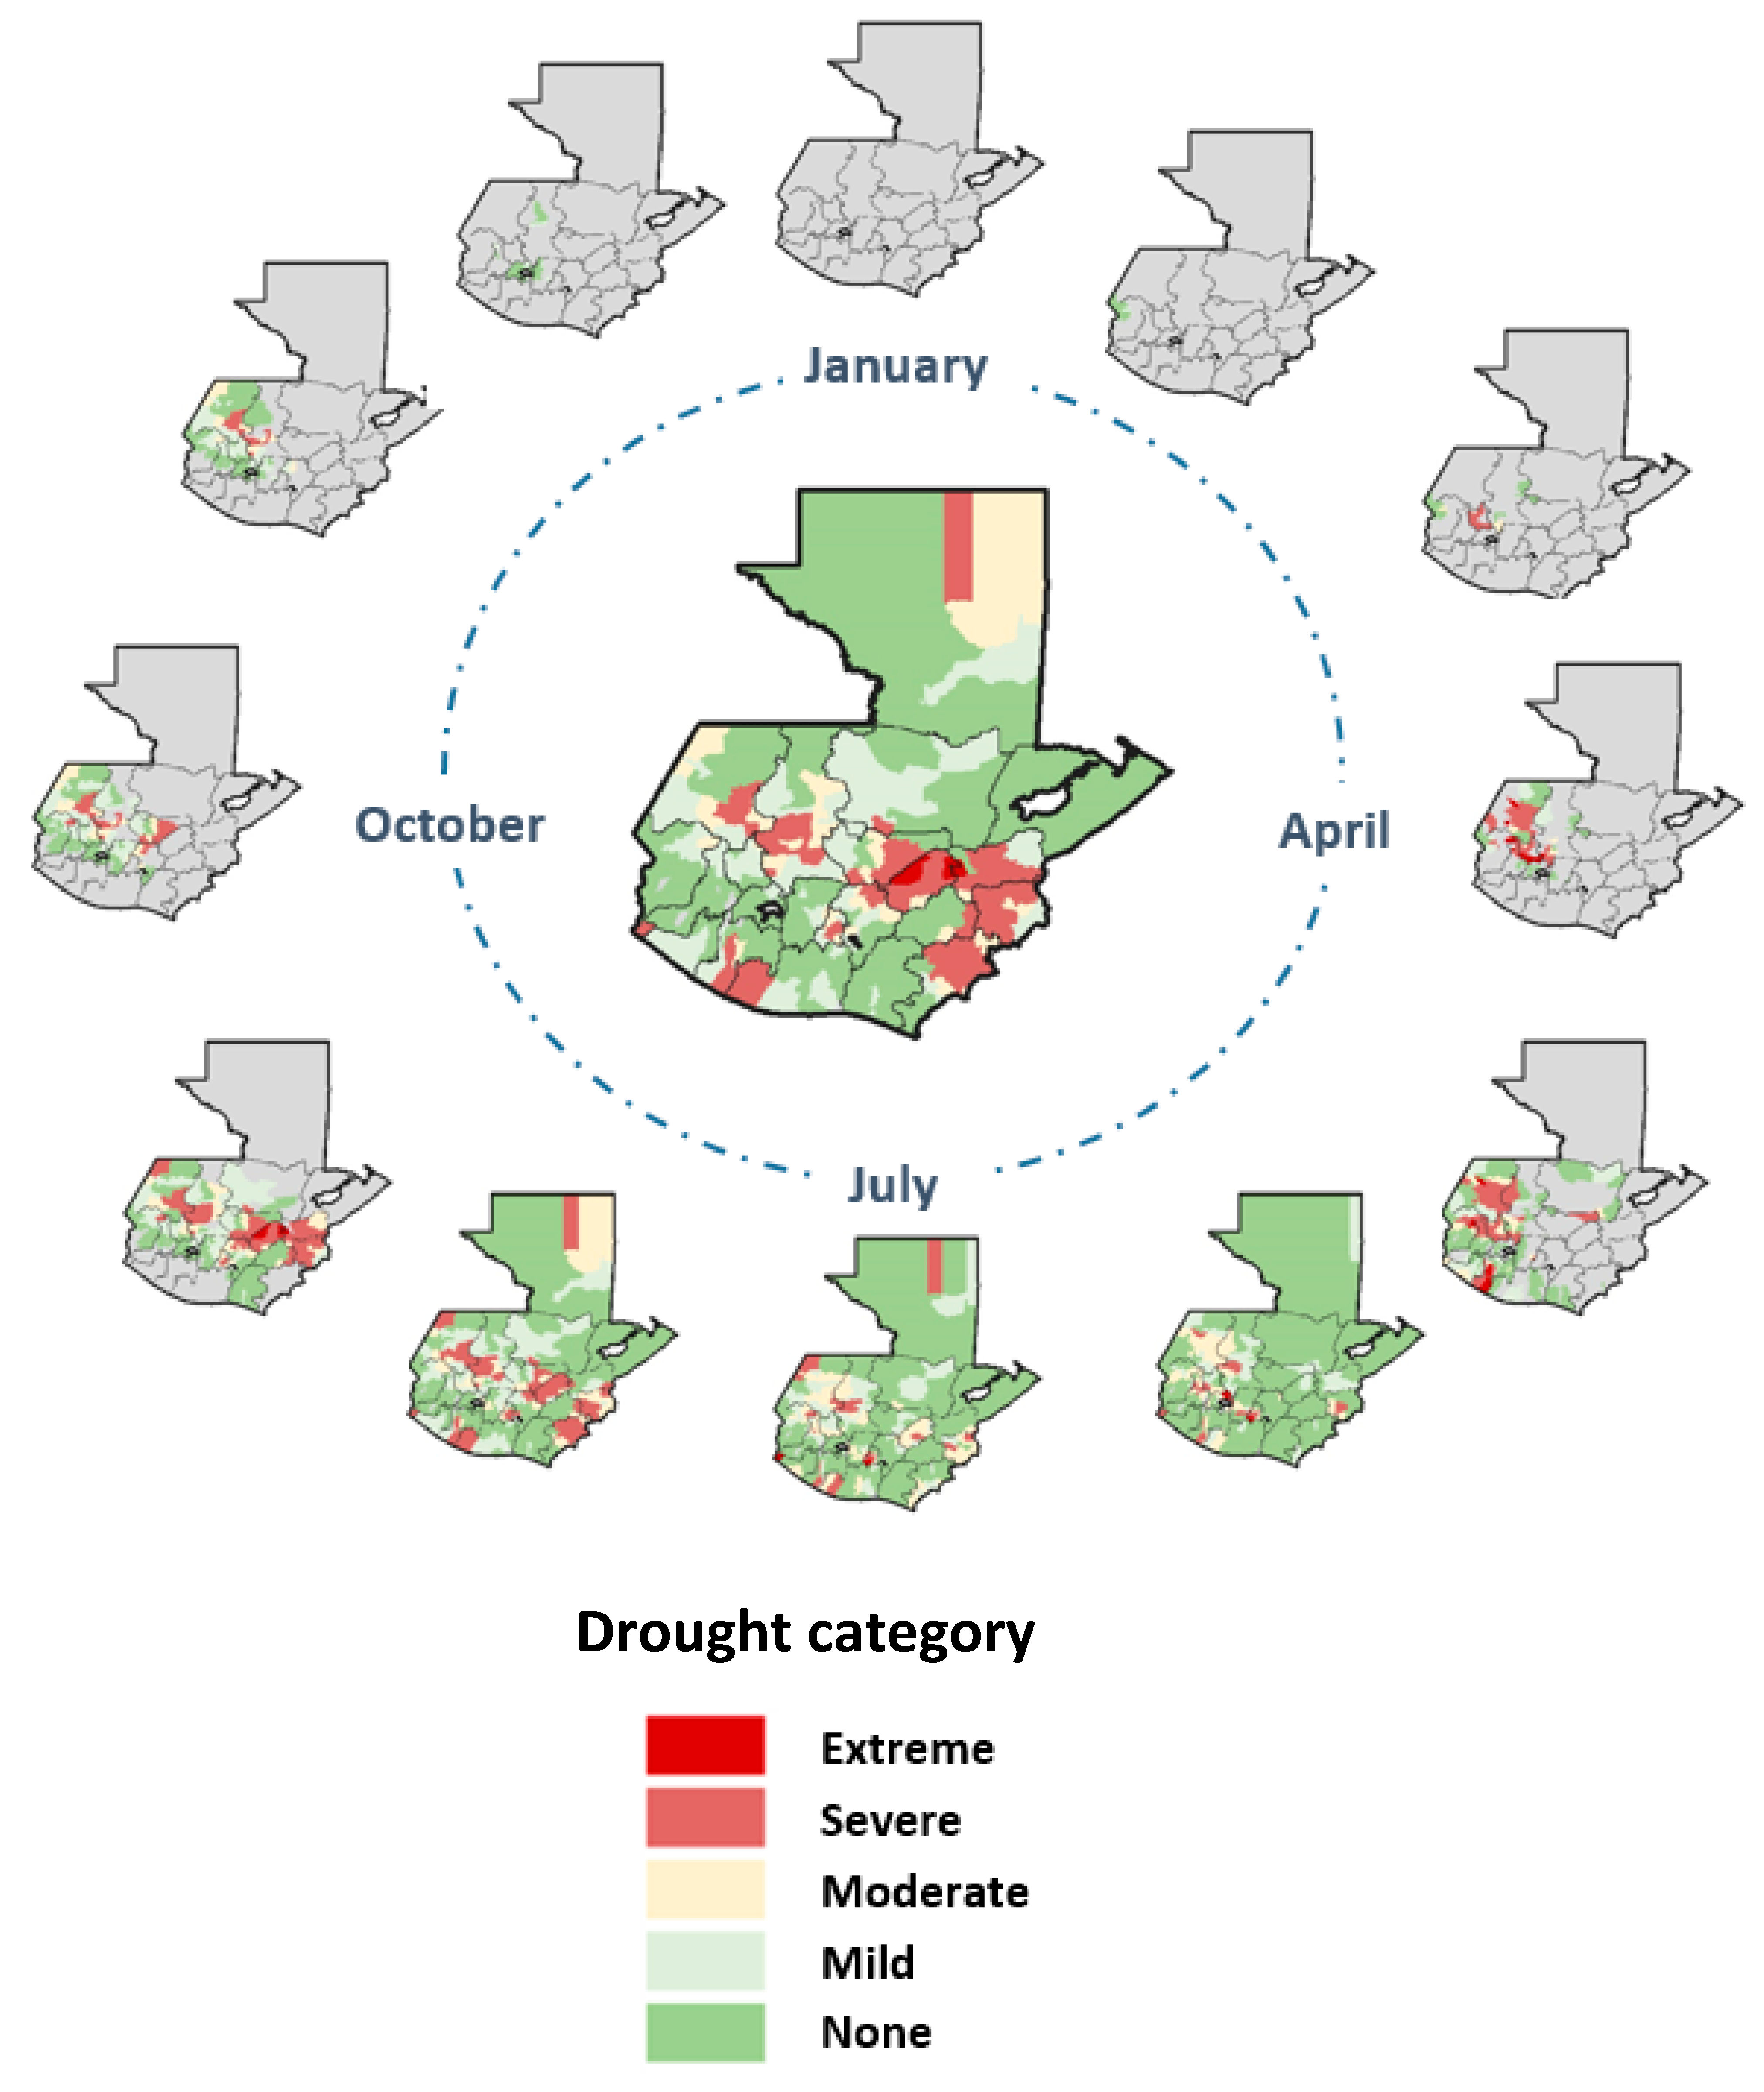
Figure 11.
The drought categories can be used as a trigger to activate mitigation and prevention activities of a national drought management plan.
Figure 11.
The drought categories can be used as a trigger to activate mitigation and prevention activities of a national drought management plan.

Figure 12.
Probability of having more than 10, 20 and 30% of rice area affected by drought in Ecuador.
Figure 12.
Probability of having more than 10, 20 and 30% of rice area affected by drought in Ecuador.
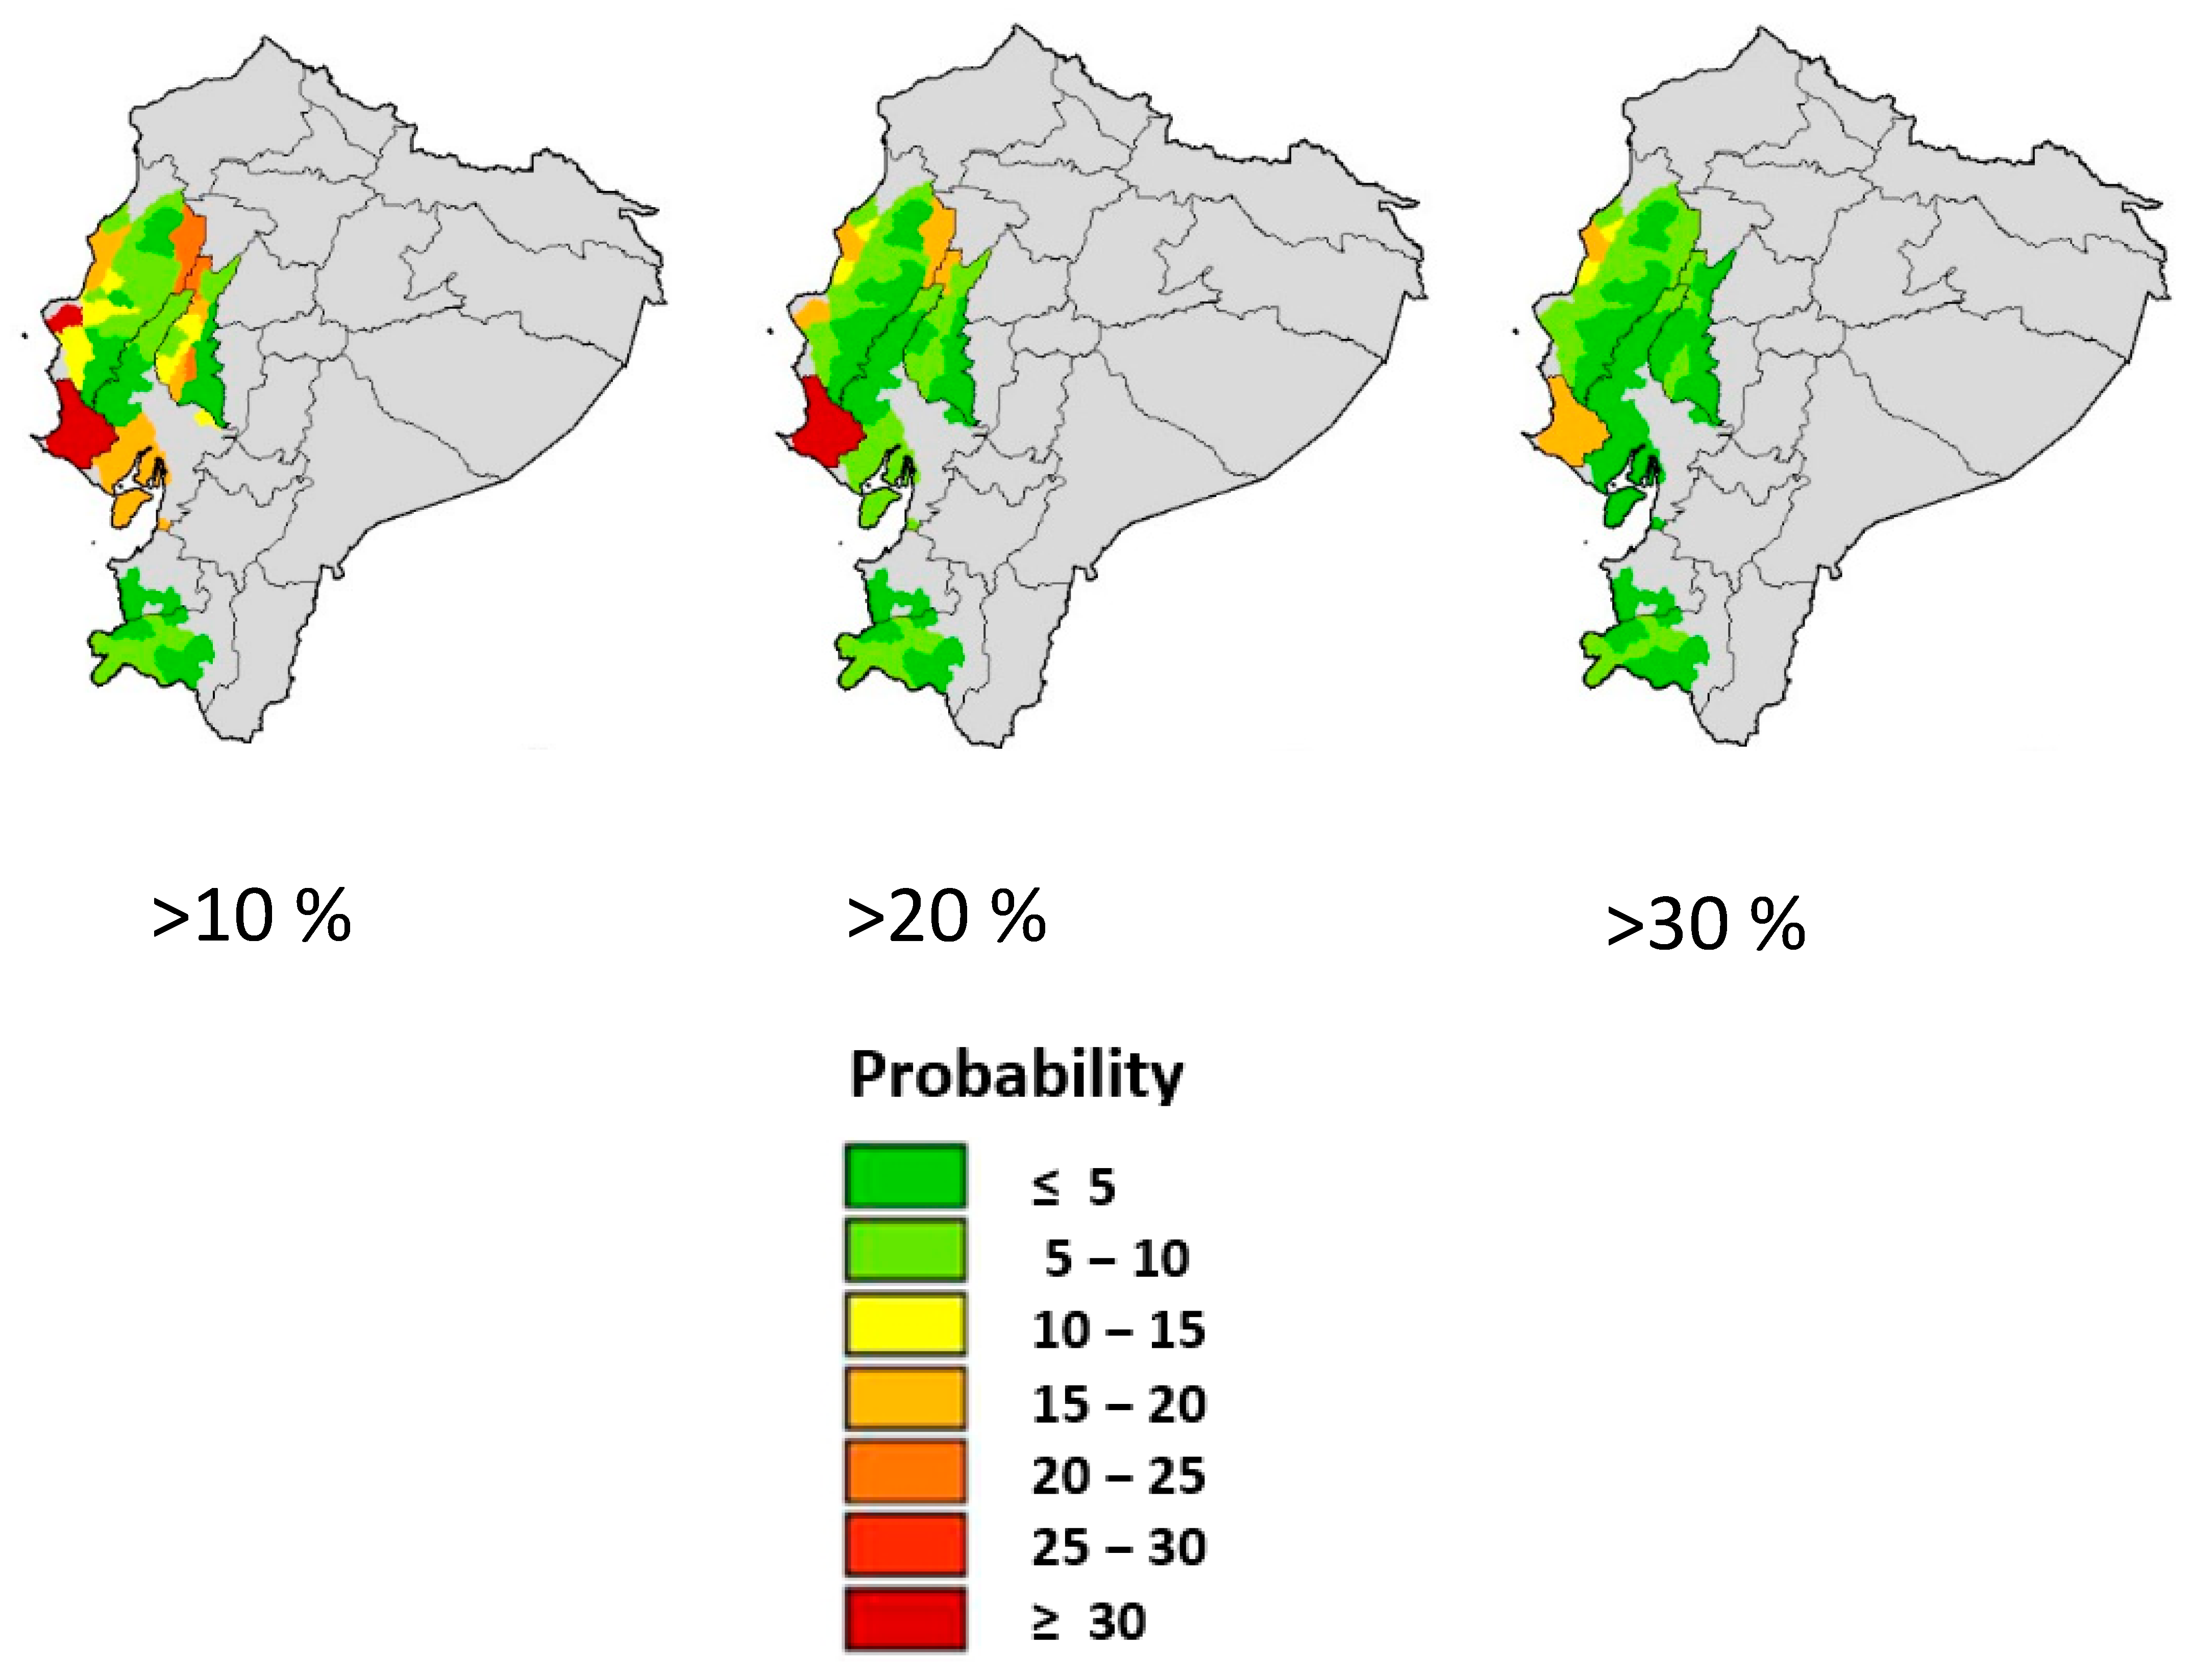
Figure 13.
Top: Progress of season of Fodder-oats, starting in November and fishing in May. Bottom: Extreme drought in 1989/90, moderate drought in 2006/07 and good crop season in 2013/14. The drought forecast has a good accuracy from 3rd dekad of February; providing two and half month in advance to implement drought mitigation activities.
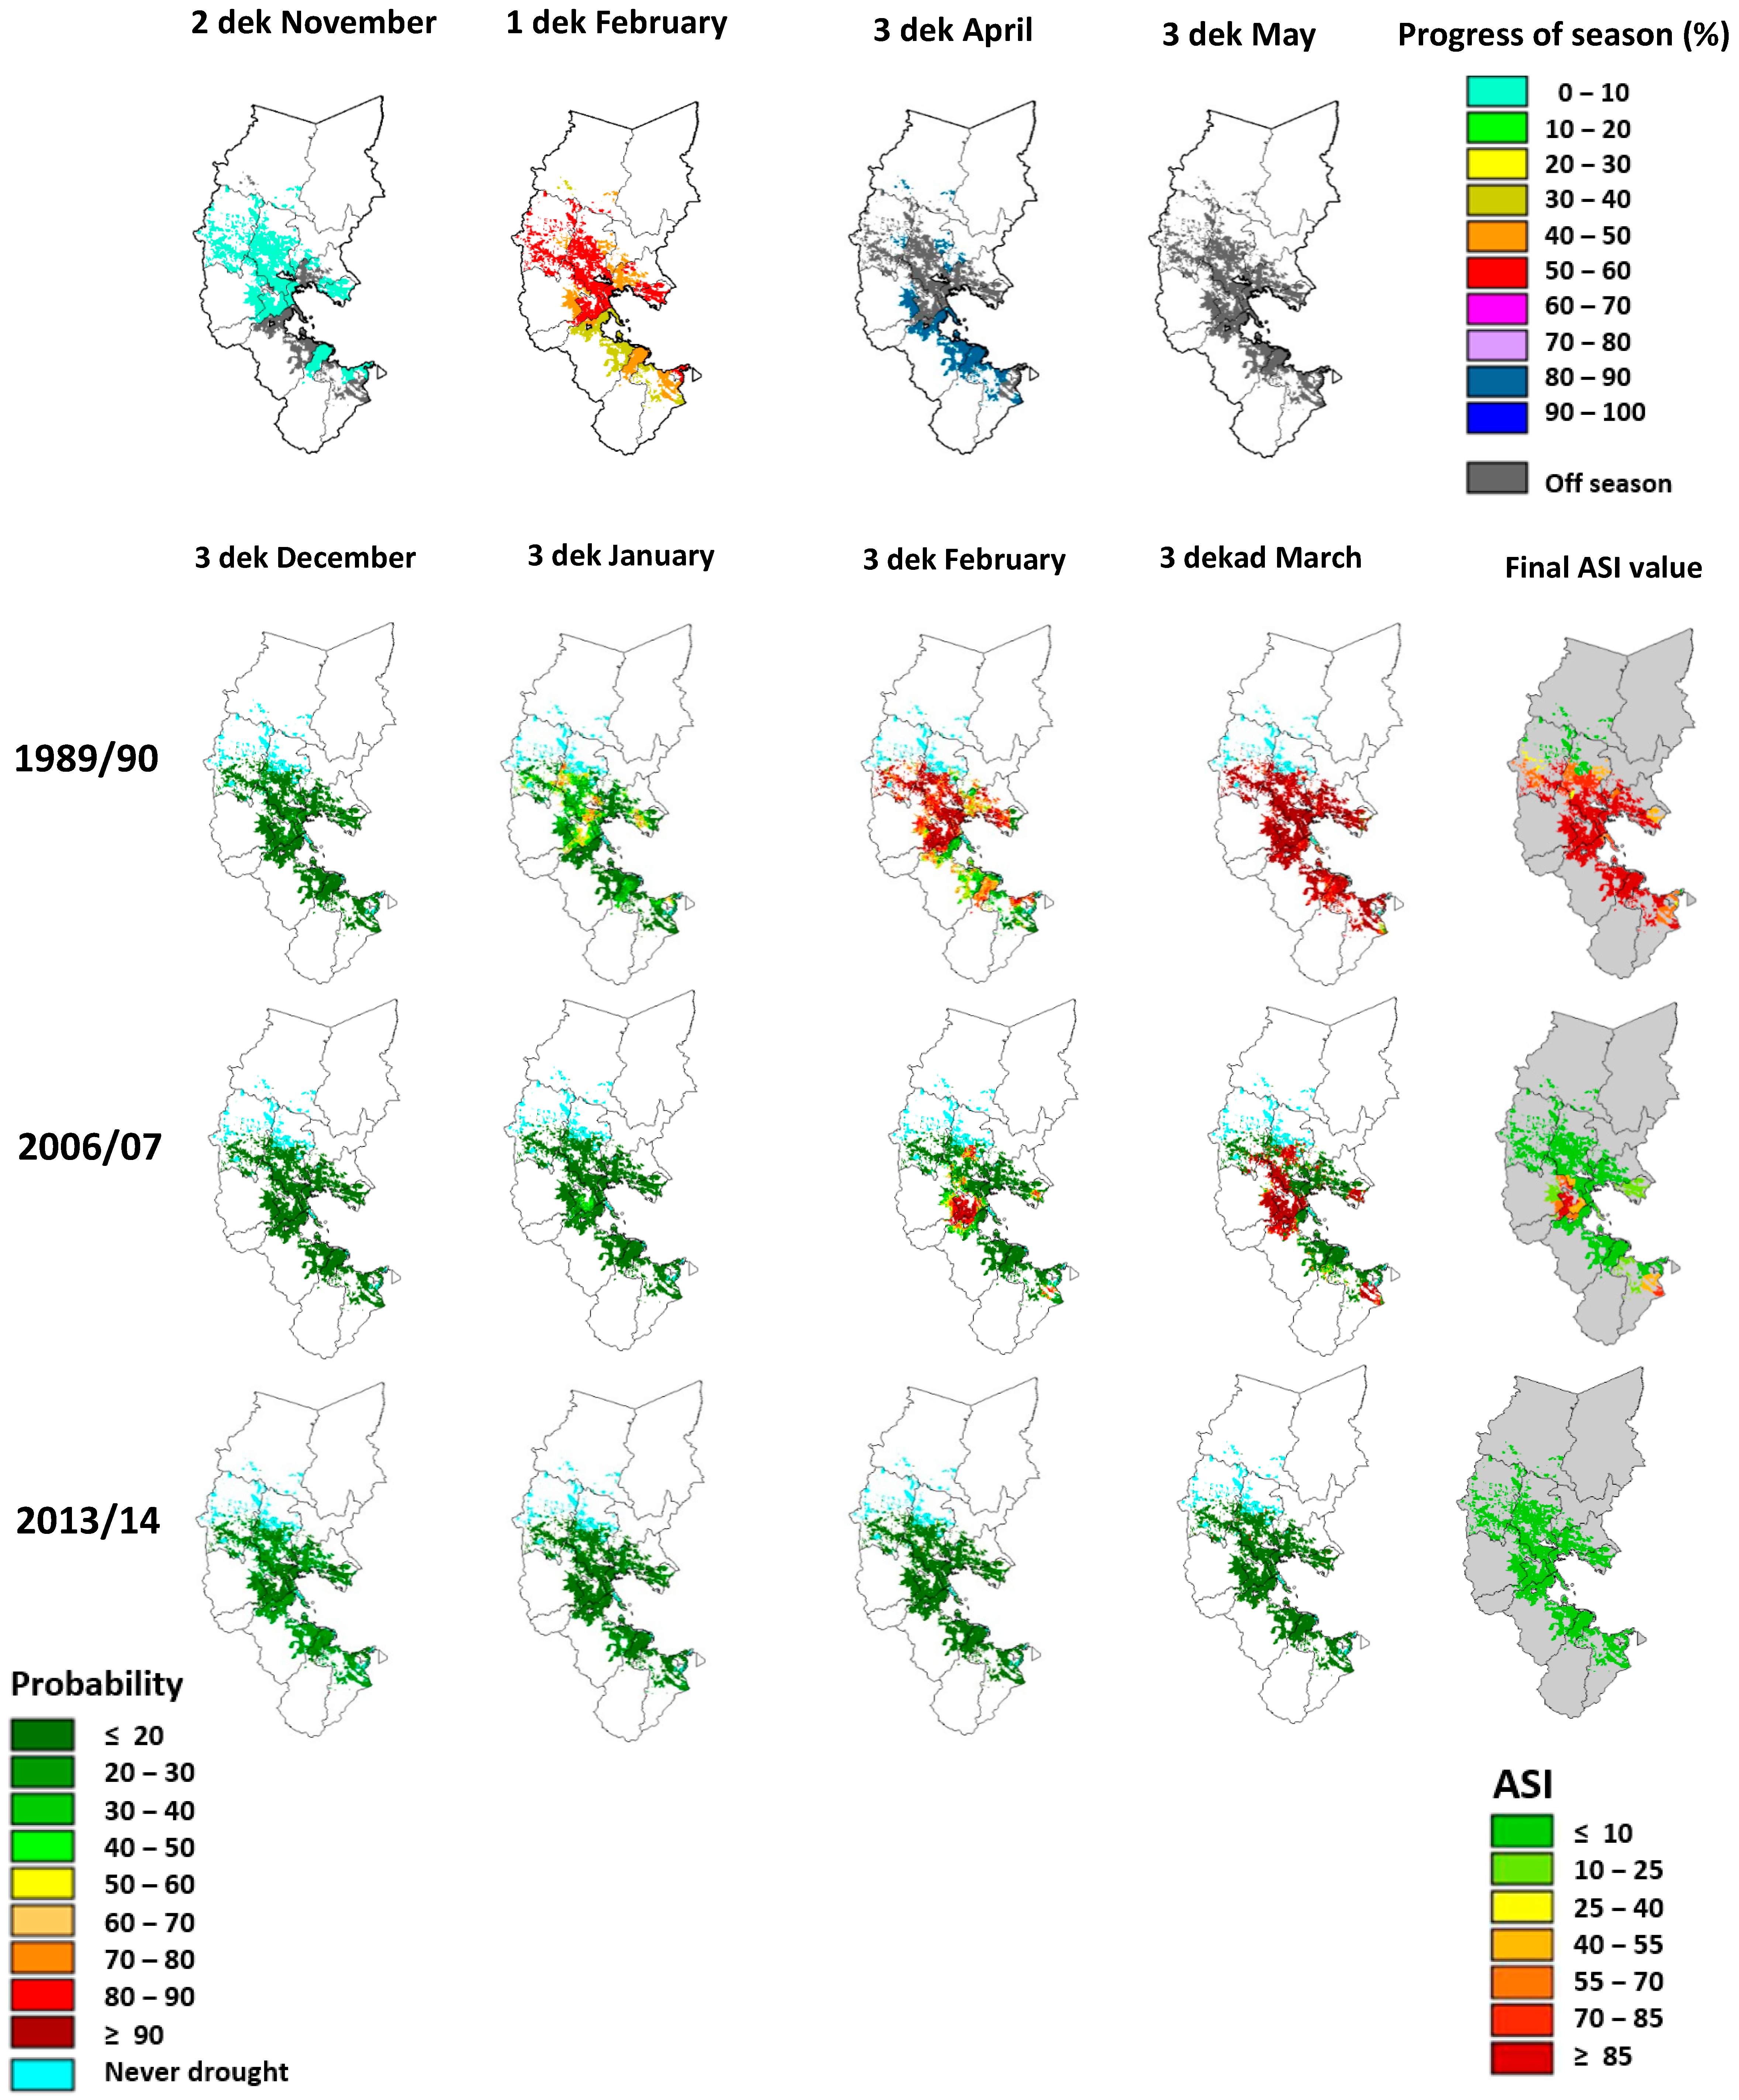
Figure 14.
Flow chart of the automatic processing of the vegetation indices that will be published on the national Website. Inputs data, intermediate non-crop specific outputs and final crop specific outputs.
Figure 14.
Flow chart of the automatic processing of the vegetation indices that will be published on the national Website. Inputs data, intermediate non-crop specific outputs and final crop specific outputs.
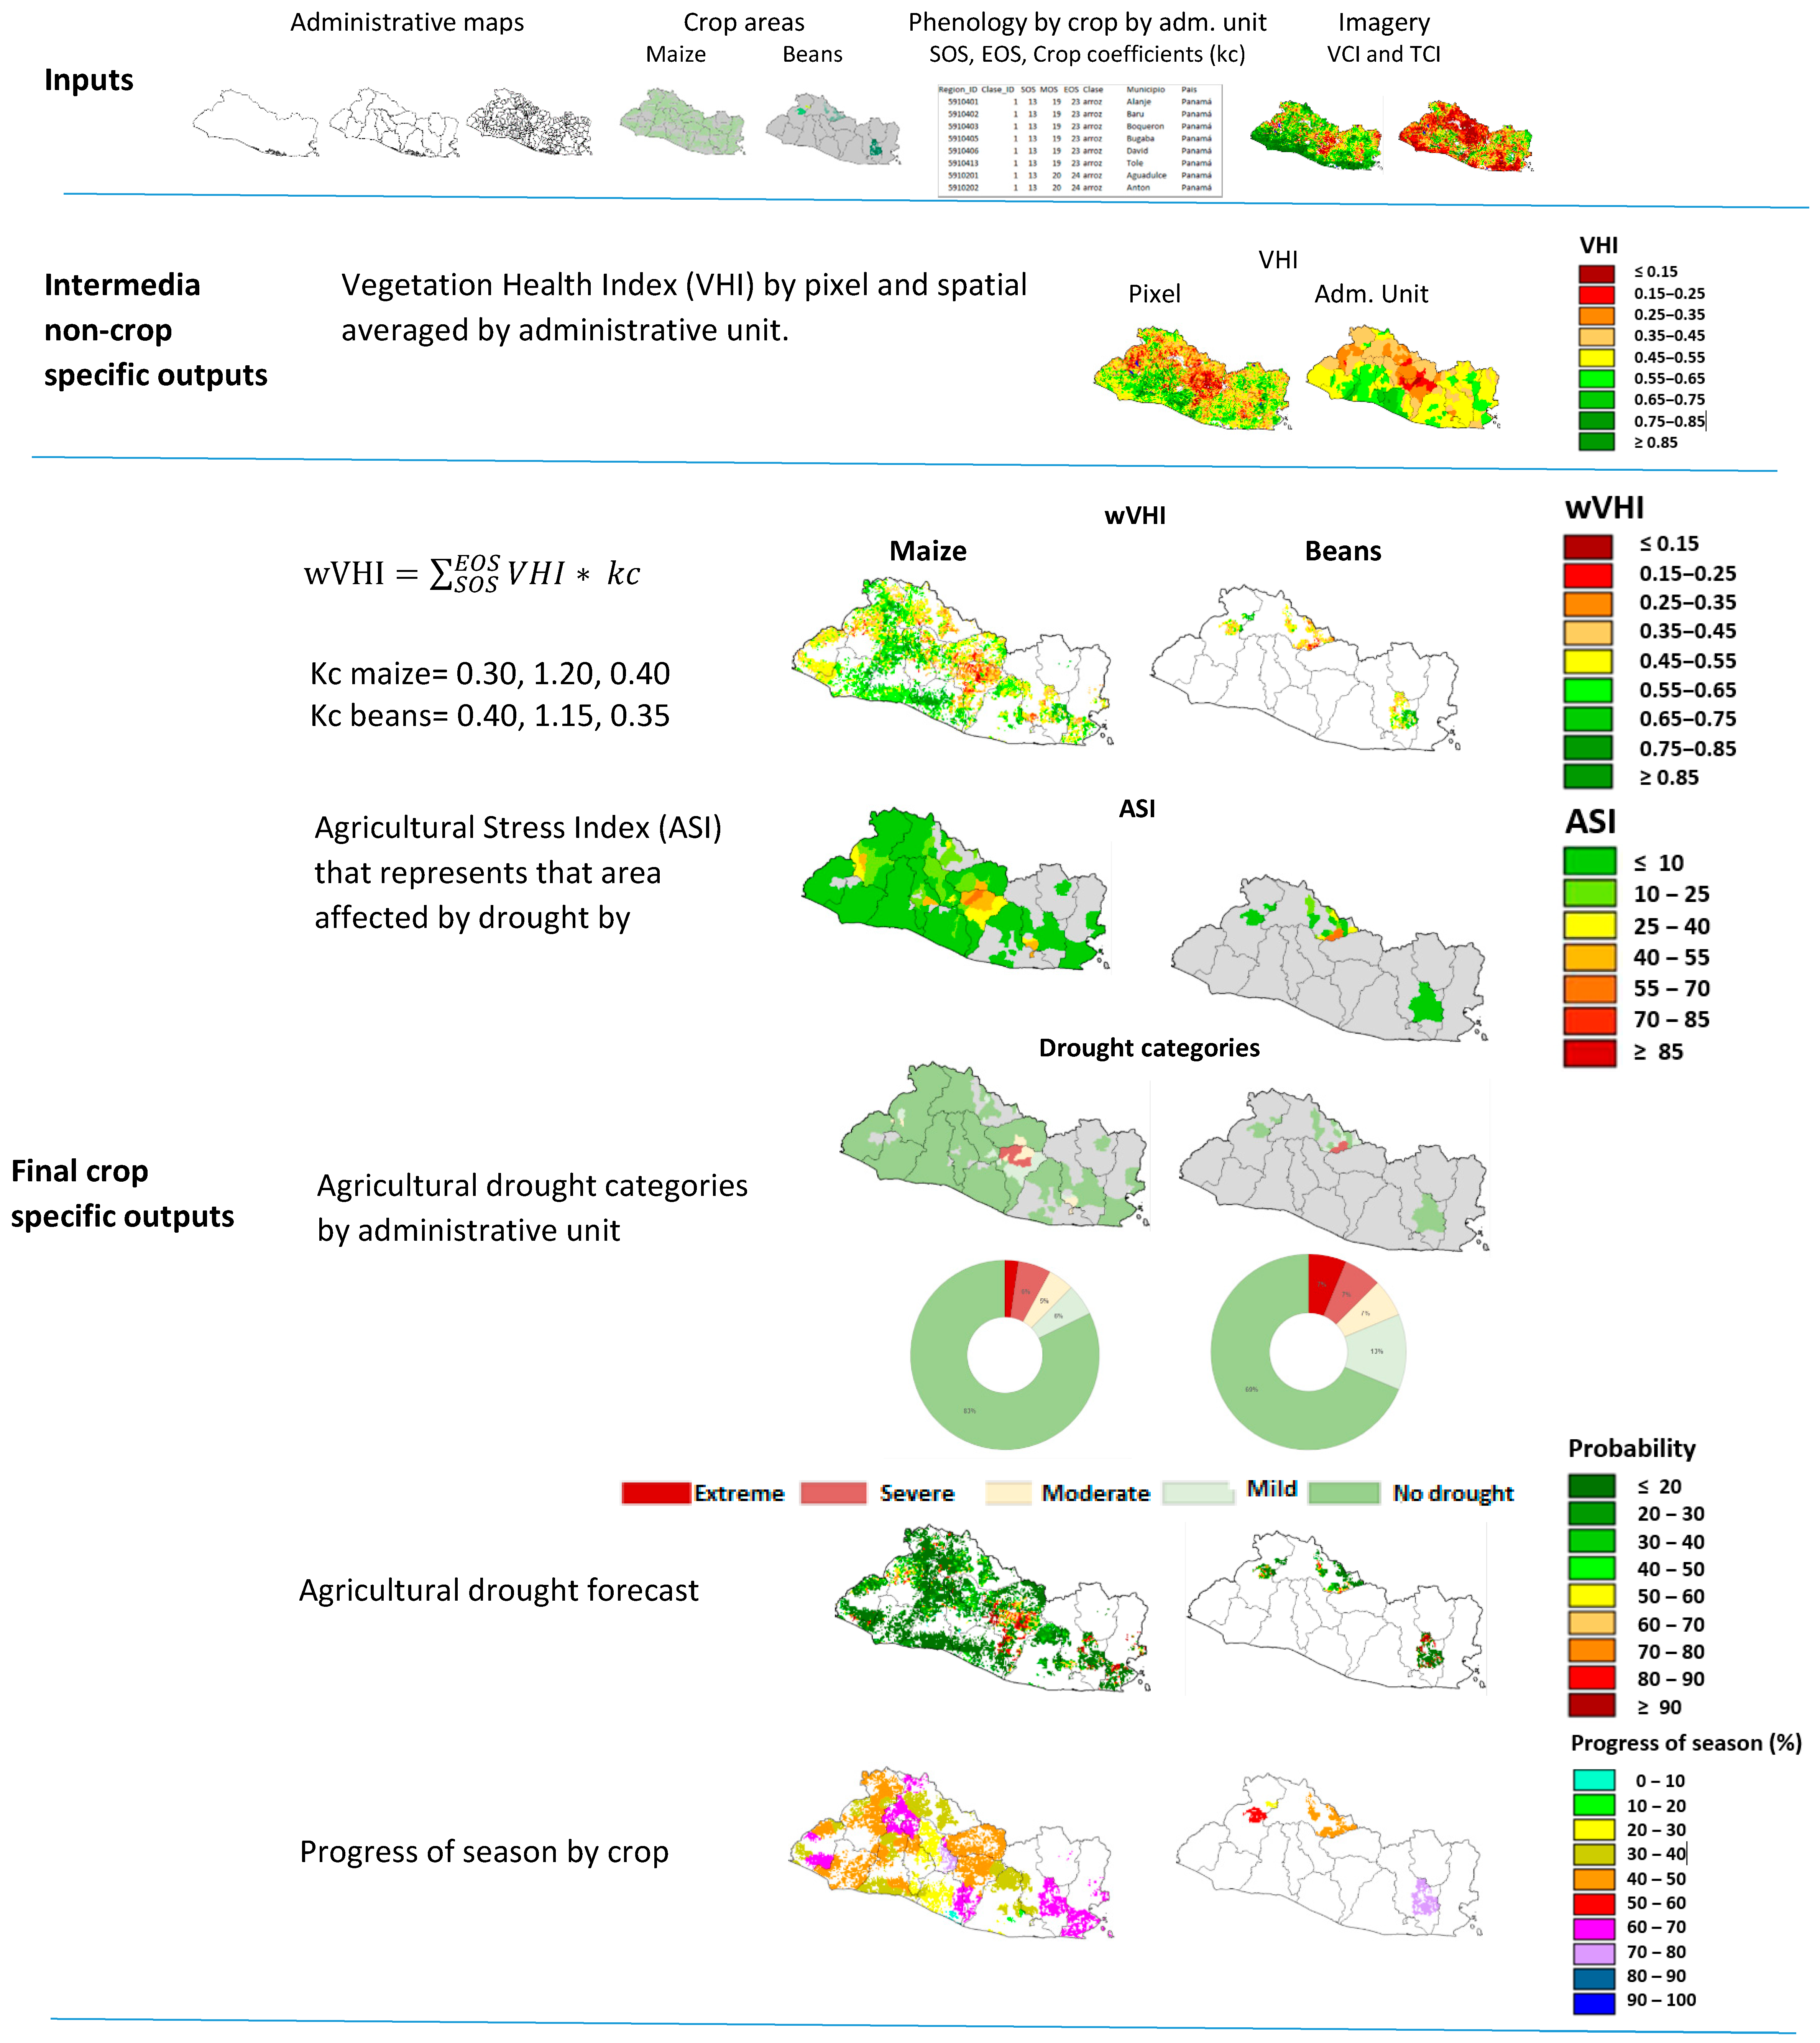
Figure 15.
ASIS GIS application shows the comparison between 2020 and 2019 crop seasons in the district of San Antonio La Paz in Guatemala. The district has 44% of maize area affected by drought with an estimated affected population of 7186 persons from a total population of 16,332. Rural population represents 94.5% of total population; most of them are smallholders with rural poverty index of 48.5%. The 2019 crop season was affected by drought however the 2020 crop season from June to July the area with water stress is larger than the previous year.


Table 1.
Characteristics of the different phases of development of next generation agricultural stress index system (ASIS).
Table 1.
Characteristics of the different phases of development of next generation agricultural stress index system (ASIS).
| Global ASIS | Country Level ASIS | Next Generation ASIS | |
|---|---|---|---|
| Purpose | Global ASIS was established in 2014 to support the Global Information and Early Warning System (GIEWS) to detect hot spots of agricultural drought around the world that could affect food security. It produces a collection of map dashboards both at global and country levels (196 countries). | Country level ASIS was launched in 2017 for strengthening the national drought monitoring systems in agriculture. | Next Generation ASIS launched in 2020 with the purpose of strengthening the national drought monitoring systems in agriculture and link the system to Early Action, Crop Insurance and Social Protection Schemes. |
| Crop mask | Global ASIS use a combined crop mask for cereals (maize, sorghum, rice, wheat, oat, millet, barley and teff) and grassland mask. Source: Global Land Cover-SHARE (GLC-SHARE) | Crop specific mask that allow to analyze independently maize from rice and so on. It is possible to introduce any crop including perennial crops such as sugar cane, coffee, grasslands, etc.). Source: most recent land use study available in the country. | Next Generation ASIS uses the most recent crop specific mask provided by the country. It is possible to introduce any crop including perennial crops such as sugar cane, coffee, grasslands, etc.). Source: most recent land use study available in the country. |
| Start of Season (SOS) and End of Season (EOS) | Global phenology maps comes from a model based on NDVI data, indicating the number of growing seasons and their start (SOS) and end dates (EOS), were derived from a multi-annual image set of SPOT-Vegetation (1999–2011). This approach allows the analysis of two crop seasons by year. | SOS and EOS come from the field by administrative unit. The dates are crop specific and refer to a common time that most of the famers use to plant and the length of the crop cycle used in each administrative unit. This approach allows the analysis of more than two crop seasons per year. | SOS and end EOS come from the field by an administrative unit. The dates are crop specific and refer to a common time that most of the famers use to plant and the length of the crop cycle used in each administrative unit. This approach allows the analysis of more than two crop seasons per year. |
| Vegetation Health Index (VHI) | The Vegetation Health Index (VHI) is calculated given equal weight to the Vegetation Condition Index (VCI) and Temperature Condition Index (TCI) (Kogan, 1997). | In the calculation of VHI the user can assign different weight to VCI and TCI. | In the calculation of VHI the user can assign different weight to VCI and TCI. |
| Weighted Vegetation Health Index (wVHI) | In the temporal integration of VHI from SOS and EOS, each VHI anomaly has equal weight. This approach did not discern between different crop demands of water consumption neither different sensitivity to water stress of the phenological phases during the crop cycle. | In the temporal integration of VHI, from SOS and EOS, each VHI anomaly is multiplied by a crop coefficient (kc). This approach introduces two important aspects to improve accuracy of the method. First, it would help to discern between different demands of water consumption by crop. Secondly, during the crop cycle, it provides more weight to VHI anomaly that occurs during sensitive phenological phases to water stress such as a flowering or grain filling, in the case of cereals. | In the temporal integration of VHI, from SOS and EOS, each VHI anomaly is multiplied by a crop coefficient (kc). This approach introduces two important aspects to improve accuracy of the method. First, it would help to discern between different demands of water consumption by crop. Secondly, during the crop cycle, it provides more weight to VHI anomaly that occurs during sensitive phenological phases to water stress such as a flowering or grain filling, in the case of cereals. |
| Agricultural drought forecast | Drought forecast is produced by Global ASIS for internal use. | Using the machine learning approach ASIS produces a drought forecast in the crop specific agricultural areas at the pixel level (Meroni, et al. 2014). The forecast is produced from the SOS up to EOS, every 10-day at 1 km spatial resolution. The accuracy of the forecast improves from 50% of the progress of crop cycle due to the reduction of uncertainties. The forecast express a theoretical probability of drought occurrence. | Using the machine learning approach ASIS produces a drought forecast in the crop specific agricultural areas at the pixel level (Meroni, et al. 2014). The forecast is produced from the SOS up to EOS every 10-day at 1 km spatial resolution. The accuracy of the forecast improves from 50% of the progress of crop cycle due to the reduction of the uncertainties. The forecast express the theoretical probability of drought occurrence. |
| Length of the imagery time series | ASIS uses a unique dataset of time series 30+, starting in 1984. As METOP became operational only in 2007, the series has been extended with similar AVHRR data from NOAA since 1984. In the current step, the 16 km resolution NOAA images were first resampled to the 1 km framing of METOP, using a simple inverse distance interpolation. However, as these upgraded 1 km NOAA scenes were somewhat blurry and lacking in spatial detail, their content was further enhanced using a data fusion method (Van Hoolst, R., 2016). The extension of 30+ years of remote sensing data is appropriate to study drought because the duration of natural cycle of rainfall is completed in approximately 30 years. Extreme drought is a rare climate event that occurrs once in 10 years. | Country level ASIS uses the full archive of VCI and TCI from global data for each specific area of interest (i.e., country). The user manually introduce in the toolbox to perform the analysis of remote sensing data every 10-day. | Next Generation ASIS used the full archive of VCI and TCI from global data for each specific area of interest (i.e., country). Using the ASIS Web application the calculation of the vegetation drought indices will be calculated and published on an automatic way. |
| Near real time (NRT) processing | From 2014 onwards, NRT processing was initiated at the premises of FAO and in a fully automated way. Besides providing the imagery archive (back to 1984) to Country ASIS users, every 10 days, Global ASIS processes the imagery used by Country ASIS and distribute them using the FAO-File Transfer Protocol (FTP). | At country level, ASIS is installed in a local computer including the images archive (1984–2020). Every 10-day the new images are receiving via FAO-FTP to keep operating the system in the countries. The local staff run the new information and produce the drought alerts. | Next Generation ASIS is installed on a Windows Server 2016 or superior (on the cloud or on premise). ASIS Web application will run on automatic way every time that new VCI and TCI images are available on the FAO-FTP. |
| Key outputs | Drought vegetation indices (VHI, VCI, TCI), ASI (% of agricultural area affected by drought) and Drought categories. Maps of drought vegetation indices are generated in automated way. Aggregated data at different administrative levels (Global Administrative Unit Layers (GAUL, levels 0, 1, 2) is also available. FAO using the new platform Hand in Hand distributing some global outputs of ASIS. | Drought vegetation indices (VHI, VCI, TCI), ASI (% of agricultural area affected by drought) and drought categories. ASIS produces simple graphs and maps of drought indices generated automatically to be used by the analyst. The maps and graphs are crop specific (maize, rice, sorghum, etc.) that have been calibrated using national land use maps and crop coefficients (kc). The user runs ASIS using a local computer and with the results they will prepare the alerts. | Drought vegetation indices (VHI, VCI, TCI), ASI (% of agricultural area affected by drought), Drought categories and other metrics derived from ASI such tonnes by hectare, number of people on food insecurity and monetary losses. Next Generation ASIS produces complex graphs that could combine ASI with socioeconomic variables that help the analyst to produce the alert. Maps and graphs are produced by the system in an automated way and outputs distributed through national website or geo-portals. The system allows to expand the information at subnational level. |
Publisher’s Note: MDPI stays neutral with regard to jurisdictional claims in published maps and institutional affiliations. |
© 2021 by the author. Licensee MDPI, Basel, Switzerland. This article is an open access article distributed under the terms and conditions of the Creative Commons Attribution (CC BY) license (http://creativecommons.org/licenses/by/4.0/).
Share and Cite
MDPI and ACS Style
Rojas, O. Next Generation Agricultural Stress Index System (ASIS) for Agricultural Drought Monitoring. Remote Sens. 2021, 13, 959. https://doi.org/10.3390/rs13050959
AMA Style
Rojas O. Next Generation Agricultural Stress Index System (ASIS) for Agricultural Drought Monitoring. Remote Sensing. 2021; 13(5):959. https://doi.org/10.3390/rs13050959
Chicago/Turabian StyleRojas, Oscar. 2021. "Next Generation Agricultural Stress Index System (ASIS) for Agricultural Drought Monitoring" Remote Sensing 13, no. 5: 959. https://doi.org/10.3390/rs13050959
Note that from the first issue of 2016, this journal uses article numbers instead of page numbers. See further details here.