
Research Gap Analysis of Remote Sensing Application in Fisheries: Prospects for Achieving the Sustainable Development Goals


1
Marine Fisheries Division, Fisheries Research Institute, Council of Agriculture, Keelung 202008, Taiwan
2
Planning and Information Division, Fisheries Research Institute, Council of Agriculture, Keelung 202008, Taiwan
*
Author to whom correspondence should be addressed.
Remote Sens. 2021, 13(5), 1013; https://doi.org/10.3390/rs13051013
Submission received: 3 February 2021
/
Revised: 2 March 2021
/
Accepted: 4 March 2021
/
Published: 8 March 2021
(This article belongs to the Special Issue Remote Sensing Measurements for Monitoring Achievement of the Sustainable Development Goals (SDGs))
Abstract
:Remote sensing (RS) technology, which can facilitate the sustainable management and development of fisheries, is easily accessible and exhibits high performance. It only requires the collection of sufficient information, establishment of databases and input of human and capital resources for analysis. However, many countries are unable to effectively ensure the sustainable development of marine fisheries due to technological limitations. The main challenge is the gap in the conditions for sustainable development between developed and developing countries. Therefore, this study applied the Web of Science database and geographic information systems to analyze the gaps in fisheries science in various countries over the past 10 years. Most studies have been conducted in the offshore marine areas of the northeastern United States of America. In addition, all research hotspots were located in the Northern Hemisphere, indicating a lack of relevant studies from the Southern Hemisphere. This study also found that research hotspots of satellite RS applications in fisheries were mainly conducted in (1) the northeastern sea area in the United States, (2) the high seas area of the North Atlantic Ocean, (3) the surrounding sea areas of France, Spain and Portugal, (4) the surrounding areas of the Indian Ocean and (5) the East China Sea, Yellow Sea and Bohai Bay sea areas to the north of Taiwan. A comparison of publications examining the three major oceans indicated that the Atlantic Ocean was the most extensively studied in terms of RS applications in fisheries, followed by the Indian Ocean, while the Pacific Ocean was less studied than the aforementioned two regions. In addition, all research hotspots were located in the Northern Hemisphere, indicating a lack of relevant studies from the Southern Hemisphere. The Atlantic Ocean and the Indian Ocean have been the subjects of many local in-depth studies; in the Pacific Ocean, the coastal areas have been abundantly investigated, while offshore local areas have only been sporadically addressed. Collaboration and partnership constitute an efficient approach for transferring skills and technology across countries. For the achievement of the sustainable development goals (SDGs) by 2030, research networks can be expanded to mitigate the research gaps and improve the sustainability of marine fisheries resources.
1. Introduction
Aquatic products are an important source of high-protein food for the global population and are also some of the most frequently traded foods worldwide. According to the Food and Agriculture Organization (FAO) report The State of World Fisheries and Aquaculture, the consumption of aquatic products has been increasing since 1961 at an average annual rate of 3.2%, which is twice as fast as the population growth (1.6%) [1] (p. 2). Globally, as the population increases, the demand for aquatic products is also constantly increasing. According to the United Nations’ simulation (2019), global population will reach 10.9 billion by 2100 [2]. Human society will face an insufficient supply of aquatic foods along with a variety of other environmental problems, such as overfishing, habitat changes, pollution, climate change, the serious impact of environmental degradation on global marine fishery resources and population growth [3,4,5,6].
Notably, 3.1 billion people from the developing countries depend on fish as a significant source of protein to which they have access; therefore, maintaining the sustainable development of marine fishery resources, which will ensure global food security, is the responsibility of all nations. Among the 17 sustainable development goals (SDGs) proposed in the United Nations’ “2030 Agenda for Sustainable Development”, many are directly related to fisheries and aquaculture, underscoring the important role played by the fishery sector in achieving the FAO’s goal of creating a world without hunger and malnutrition [1,7]. The United Nations (UN) has also expressed great concern about this issue and sent a specific message in 2014 to adopt the SDGs as a follow-up development agenda. The UN Conference on Sustainable Development also called on all countries to assume responsibility for national socioeconomic development and achieve the SDGs according to local conditions and necessary tasks by striving to obtain effective methods, models and tools. Countries all over the world should strengthen cooperation with each other and make good use of readily available and efficient technologies to achieve the SDGs [8]. The main challenge facing the implementation of the “2030 Agenda for Sustainable Development” is the gaps in sustainable development conditions between developed and developing countries; for example, some countries in Africa, Asia and South America, which are highly dependent on fisheries, are inadequate in coping with environmental changes due to the lack of social and economic capabilities [9,10,11]. The increasing economic interdependence of developed and developing countries, the weak management and governance capacity of developing countries and the differences among countries in economic scale and social development have formed tremendous gaps in sustainable fishery development between different countries [12,13,14].
The scope of fisheries science, oceanography, social and economic sciences come together in fisheries management [15] and the real-time (or near real-time) monitoring provided to fishermen, fleets and fishery companies, scientific research and commercial activities have different but important functions in the sustainability of fisheries [16,17]. Sustainable development requires effective monitoring and management of marine resources and, in this regard, remote sensing (RS) technology provides unique advantages, e.g., it can provide real-time, dynamic, accurate, long-term, broad-scale and sustainable marine environmental data. It has become an important application tool for monitoring global population trends and managing fishery resources [18,19]. Currently, many fishery-related issues (e.g., climate change, pollution, natural disasters and overfishing) can be addressed using RS information [20,21,22].
For example, as global environmental change dramatically continues, effective seawater temperature prediction models using RS data can help fisheries avoid suffering large economic losses not only by reducing the damage caused by high temperatures [23], but also through an analysis of the effects of rapidly decreasing sea surface temperatures on fisheries [24].
RS is the main method of obtaining data on the Earth’s surface and atmosphere and has been successfully used in the United States, France, Japan and other countries since 1975 to help scientists understand local fisheries resources and species movements and track hurricanes, earthquakes, coastal floods, coastal upwelling and downwelling and changes in ocean productivity [25,26,27,28,29,30].
RS data elucidate not only the effects of natural changes but also the impact of human activities on important fisheries [31] and further elucidate the feeding behavior and habitat of marine fishery resources [32,33]. Under sustainable development, groups of scientists have the task of caring for the marine ecosystem [34]. Quantifying the scientists’ effort is an important task to ensure that it is sufficient and to analyze gaps in global scientific knowledge.
RS Models of these habitats have also been constructed by importing data from emerging technologies [35,36]. An environmental monitoring platform has been established to apply RS detection data to the effective risk management of fisheries resources [37,38].
Effective partnerships between developed and developing countries must be established to enable access to RS technology for developing countries [39] and to increase the range of comprehensive monitoring of the surrounding maritime environment and of social changes in developing countries [40], especially in terms of policy coordination, funding, human resources development and the applications of RS technology in fisheries [1,41,42,43] to achieve the specific SDGs.
In summary, we postulate that under the premise of sustainability, (1) the current status of the academic network with regard to applications of RS in fisheries and (2) the research hotspots in this field and the distribution of research deficits must be clarified.
In this study, by focusing on the application of RS in fisheries, we examined research networks and hotspots over the past 10 years based on a bibliographic analysis of the literature in combination with visualization using geographic information systems and determined the research gaps in this field by analyzing the network and the hotspots to provide support for scientists in related fields to plan future studies. These studies are critical for both global and regional fisheries and provide information on the transmission of technology and the scope of research from lists of academically published authors and regions covered by this area of research.
2. Research Gaps in the Current Understanding of RS in Fisheries
The continued development and efficient utilization of marine resources urgently requires effective monitoring and management. Fisheries management planning is closely related to changes in marine spatial dynamics, and as a result, the application of RS detection in the marine environment is becoming increasingly important, particularly regarding sea surface temperature, chlorophyll a changes, wind speed and wind direction and sea level anomalies. These techniques help scientists understand local fisheries and species movements and track hurricanes, earthquakes, coastal floods, coastal upwelling and changes in ocean productivity [25,27,28,30,40].
Advanced technologies such as RS are vital to the social and economic growth of developing countries [41,42,43]. RS technology provides information about available natural resources (RS is a powerful resource in itself) and if developing countries are to sustain themselves, these resources must be properly understood and managed. RS has been implemented by many developing countries and has been influenced by different development strategies. Countries that emphasize economic growth (mainstream or traditional development) focus on specific applications that are usually related to energy.
As industrialized countries compete for the use of raw materials from the developing world, the awareness of technical assistance among technology suppliers on the use of RS and geophysical technologies changes due to the promised cooperation. Competition intensifies opportunities for scientific advancement and economic benefits related to the perception of natural resources, but developing countries may benefit because competition reduces the price of satellite products and eases the terms of access to RS technology [25,28,39]. Some countries are limited by research budgets and ocean RS technology is characterized by large-scale daily image collection systems, which limits the scope of comprehensive monitoring of local environmental and social changes [40].
In the past ten years, global capture fisheries and aquaculture production have played an important role in global food supplies, but they are also facing increasing challenges, threatening the progress of sustainability. In capture fisheries, the fundamental challenges are overfishing, bycatch, discards, the habitat of key species, land degradation, global fuel price instability and climate change. The aquaculture industry is facing increasing competition in terms of space, feed and labor, along with the potential impacts of disease outbreaks and climate change. Climate change may increase the occurrence of farmed species escaping into open-water habitats, threatening biodiversity and ecosystems [44]. The solution to some of these problems is the application of RS information [1,21].
The use of RS technology is an important application to realize the sustainable development of fisheries. The USA, Canada, France, Japan and other countries have actively invested in related applications [27,29,40], but for many developing countries, the global fisheries management system cannot be integrated due to budgets, manpower and technical limitations. Effective partnerships between developed and developing countries are needed, especially in policy coordination, funding, human resource financing and the application of advanced fisheries RS technologies, to achieve the specific goals of sustainable development [14].
3. Materials and Methods
In this study, using bibliometric and social network analysis methods, we collected and analyzed the literature published on the topics of “remote sensing” and “fishery”, which was further collated, classified and quantitatively evaluated to understand the research gaps in the field of RS application in global fisheries resource sustainability. We first analyzed the related literature using the bibliometric method and generated forms from the citation and geographic information systems based on the academic status of the network and the literature analysis and examined the research hotspots and networks that developed in the past 10 years using visualization tools to effectively present the distribution of the related studies in this field.
3.1. Research Materials
We searched the Web of Science (WOS) database using two keywords (“remote sensing” and “fishery”) and retrieved 236 articles (listed in the Supplementary File) related to the two subjects that were published in the ten-year period from 2009 to 2018, from which the author information and the country of the author’s institution were extracted. The two keywords reflect the publication activity and reveal the formal relationships in the study.
We examined the description of the research scope of each paper to understand the research scope of each publication. The spatial data of the scope were digitized and integrated in the geographic information system. Countries in the tropics are on the front line of climate change impacts and each country has different relevant research policies and international cooperative relations. From a marine geographic database (https://www.marineregions.org/, accessed date 13 January 2021) [45], we collected geographic data on the exclusive economic zones (EEZs) for each country as the basis for analyzing a country’s share of tropical waters and the research scope.
3.2. Cooperative Network Connections
We conducted a network analysis based on the country of origin of certain authors and that of their collaborators to represent the number of collaborations between countries and to understand the cooperative relations of the academic network in the research field. The network connections were then mapped on a world map to portray the geographical relations of the cooperation.
3.3. Comparison of the Cooperative Organizational Structures of The Main Research-Sponsoring Countries
We developed a new criterion based on the Herfindahl–Hirschman Index (HHI) [46], which is a concentration index commonly used in economics that reflects the degree of monopoly as the sum of the square of the market share of each company in a certain market, to measure the international cooperation of the partners of the primary research sponsors (if a single company has a market share of 100%, its HHI value is the square of 100%, which is still 1; if the market is shared by two companies, their HHI value is twice the square of 50%, which is 0.5, etc.; a greater number of companies and a more even the market share of individual companies will result in a lower HHI value). Accordingly, in this study, the credit was counted via the co-authorship from the same country on the same paper [47]. We substituted the company’s market share with the number of countries that individual countries have collaborated with to perform research and the calculated value was taken as the reciprocal to characterize the diversity and uniformity of the country’s collaboration with other countries, as shown in the following formula:
where ICR is the international collaboration ratio, which represents the level of diversity and uniformity of the individual country; N is the number of countries with which the main sponsor country has collaborated during the study period; and Vi is the ratio of country i participating in the international collaborations organized by the major country. The reason for using the reciprocal is that a higher value indicates a higher level of the diversity and uniformity and vice versa.
3.4. Distribution of Hotspots and Gaps in Academic Research
We extracted the geographic information from the studied areas over a 10-year period from the WOS database, which was then imported to QGIS GIS desktop (version 3.6.3, QGIS Geographic Information System, Open Source Geospatial Foundation Project. Available online: http://qgis.osgeo.org (accessed date 13 January 2021)) for data processing, application, analysis and visualization to generate a polygon for each studied area. Moreover, through the geographic information system, a grid (1 × 1 degree) was generated and overlaid on the aforementioned 1×1 grid to count the numbers on the polygon, which were then presented on the 1 × 1 grid.
Tropical marine habitats and fish populations are very susceptible to physical and biogeochemical changes in the ocean associated with the increase in greenhouse gases. These changes in fish stocks and their subsequent effects on fish production have a major impact on the United Nations Sustainable Development Goals [48]. We also conducted a subsequent analysis of tropical countries to truly understand the research process used in tropical countries in this field. Meanwhile, the polygon described above was overlaid on the polygon of the EEZ of each tropical country and the number of studies in each EEZ scope was determined through a statistical analysis of the geographic information. Ultimately, the lowest 20 EEZs with the lowest number of studies in the tropic area and the proportions of tropical and nontropical EEZs, as well as the proportion of these EEZs in the entire tropical seas, were calculated.
4. Results
4.1. Progress in the International Application of RS in Fisheries
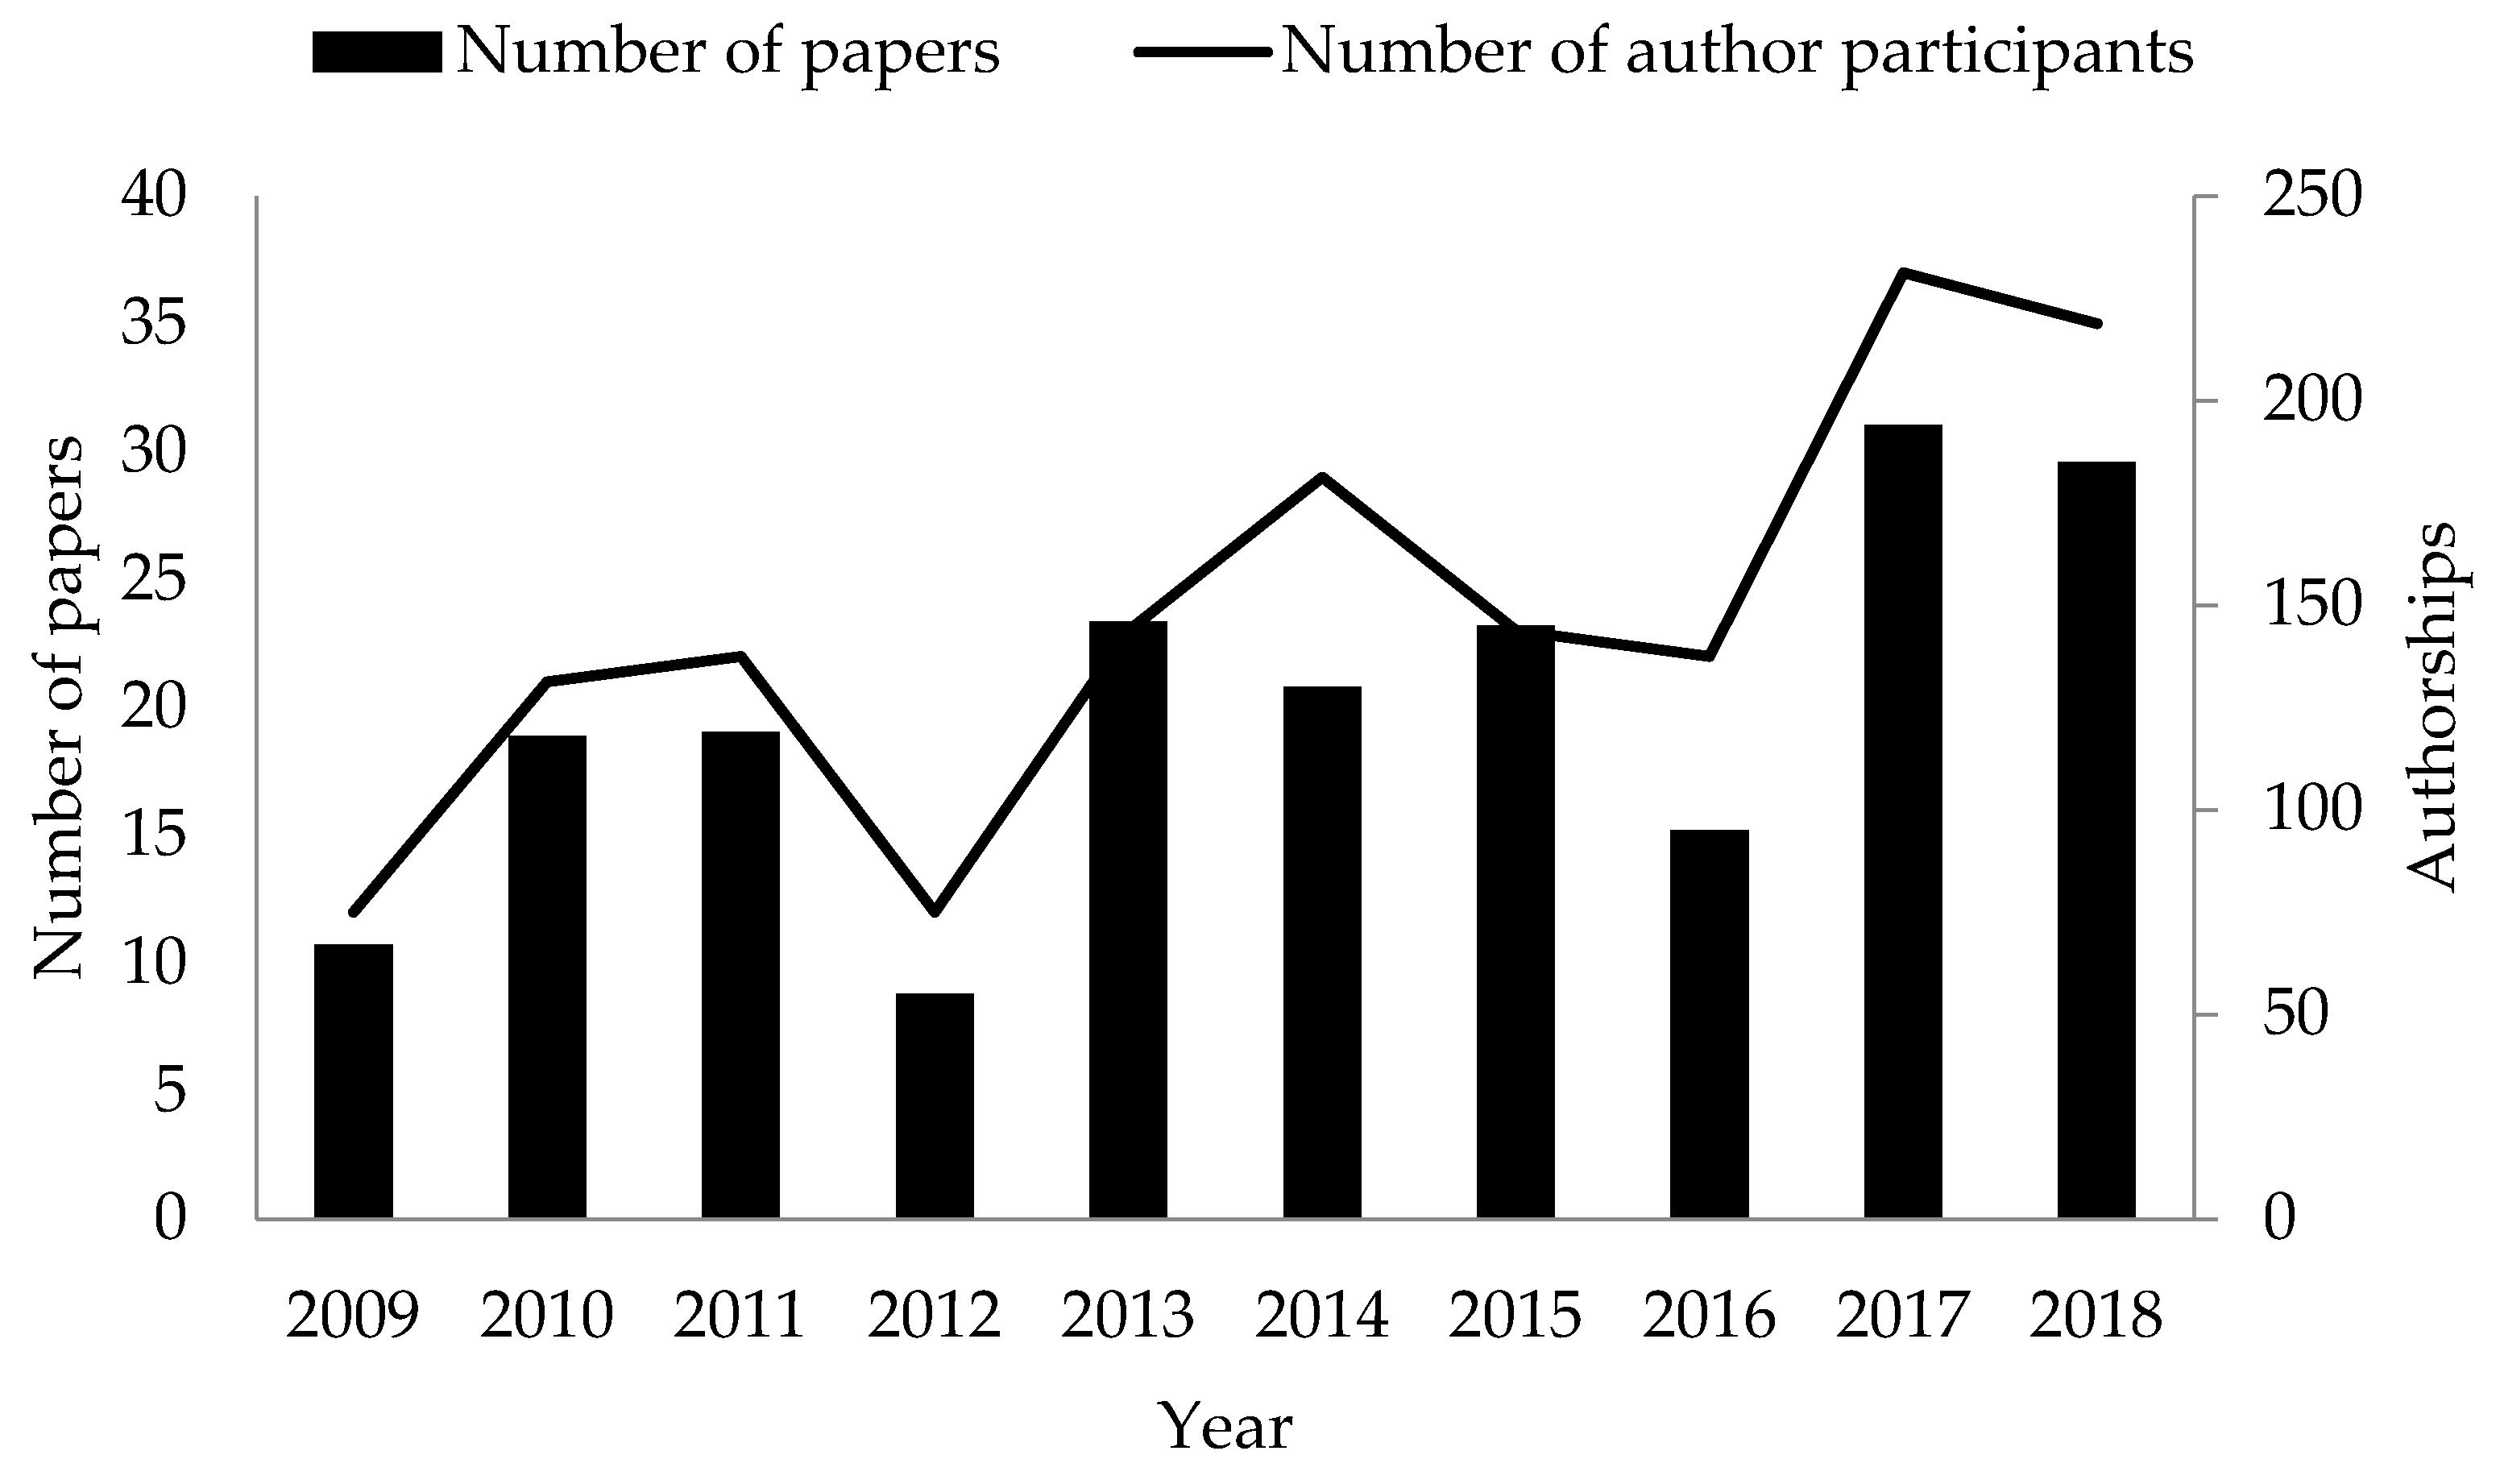
As shown in Figure 1, the number of articles published in 2009–2011 ranged from 12 to 21, but in 2012, the number decreased sharply to 12. In 2013, it displayed a significant rebound to 23, which surpassed the number of publications in 2009–2012. The number of publications increased to 29 in 2014, stabilized at 22–23 in 2015 and 2016 and increased successively in 2017 and 2018. Overall, the number of publications gradually increased from 12 in 2009 to 35 in 2018, assuming a sharp increase. The number of authorships indicates the effort of the involved scientists (Figure 1) and increased from 67 in 2009 to 185 in 2018. The changes over the years were consistent with the trend in the number of articles published, especially the drastic decrease in 2012. In 2016, the number of publications did not decrease significantly, but the number of authors decreased by 41%, from 145 in 2015 to 95.
Table 1 shows the number of researchers in the field from the top 20 countries, of which the United States (366 authors) had the most, sequentially followed by China (130), India (79), the UK (61), France (51), Italy (51), Japan (45), Australia (38), Taiwan (37) and Canada (35). The total number of researchers (in terms of person-time) from outside the top 20 countries was 115 and these researchers also accounted for a significant proportion of the total studies.
The comparison of the authorships of publications in the first five-year period (2009–2013) and the second five-year period (2014–2018) revealed that authors from the United States dominated in both periods. Meanwhile, China was the country with the greatest increase in the authorships of publications, from 30 authorships in the first five-year period to 100 in the second five-year period, i.e., a 233% increase in 70 authorships, followed by five countries, i.e., India (29), Australia (22), Spain (22), Indonesia (14) and Argentina (13), all of which displayed a substantial increase in authorships. Spain exhibited the greatest increase in both periods, from three to 25, i.e., 733%, sequentially followed by Malaysia (700%), Poland (400%), Mexico (367%), Argentina (325%), South Africa (300%), Portugal (300%), New Zealand (300%) and Russia (300%). The Philippines, Indonesia and Kenya did not have any entry in the WOS in the field in the first five-year period but had seven to eight entries in the second five-year period. Among the top 20 countries, a few decreased in terms of person–time; Belgium and the United Kingdom decreased by 78% and 55%, respectively, but 18 and 42 authorships, respectively, were still observed in the WOS database in the second five-year period, indicating that these countries still had a large research effort in this field. Meanwhile, countries outside the top 20 increased from 43 to 72 authorships, i.e., by 67%.
When ranking the authorships of publications in each country from 2009 to 2013 and those from 2014 to 2018, we found that, in addition to a dramatic change in the ranking structure, the increases in many countries approached the high values of the United States.
4.2. Network Pattern of the Application of RS in Fisheries
Table 2 shows the results of the analysis of the 236 publications by researchers from 64 countries collected in this study. The numbers of publications in each country from the studies that were independently conducted and with international cooperation are listed. The top ten countries in terms of publication number in the study time period are sequentially listed as follows:
- United States (84);
- China (33);
- India (22);
- Australia (20);
- Canada (19);
- France (19);
- UK (18);
- Japan (12);
- Taiwan (11);
- Germany (10);
- Brazil (9);
- Italy (9).
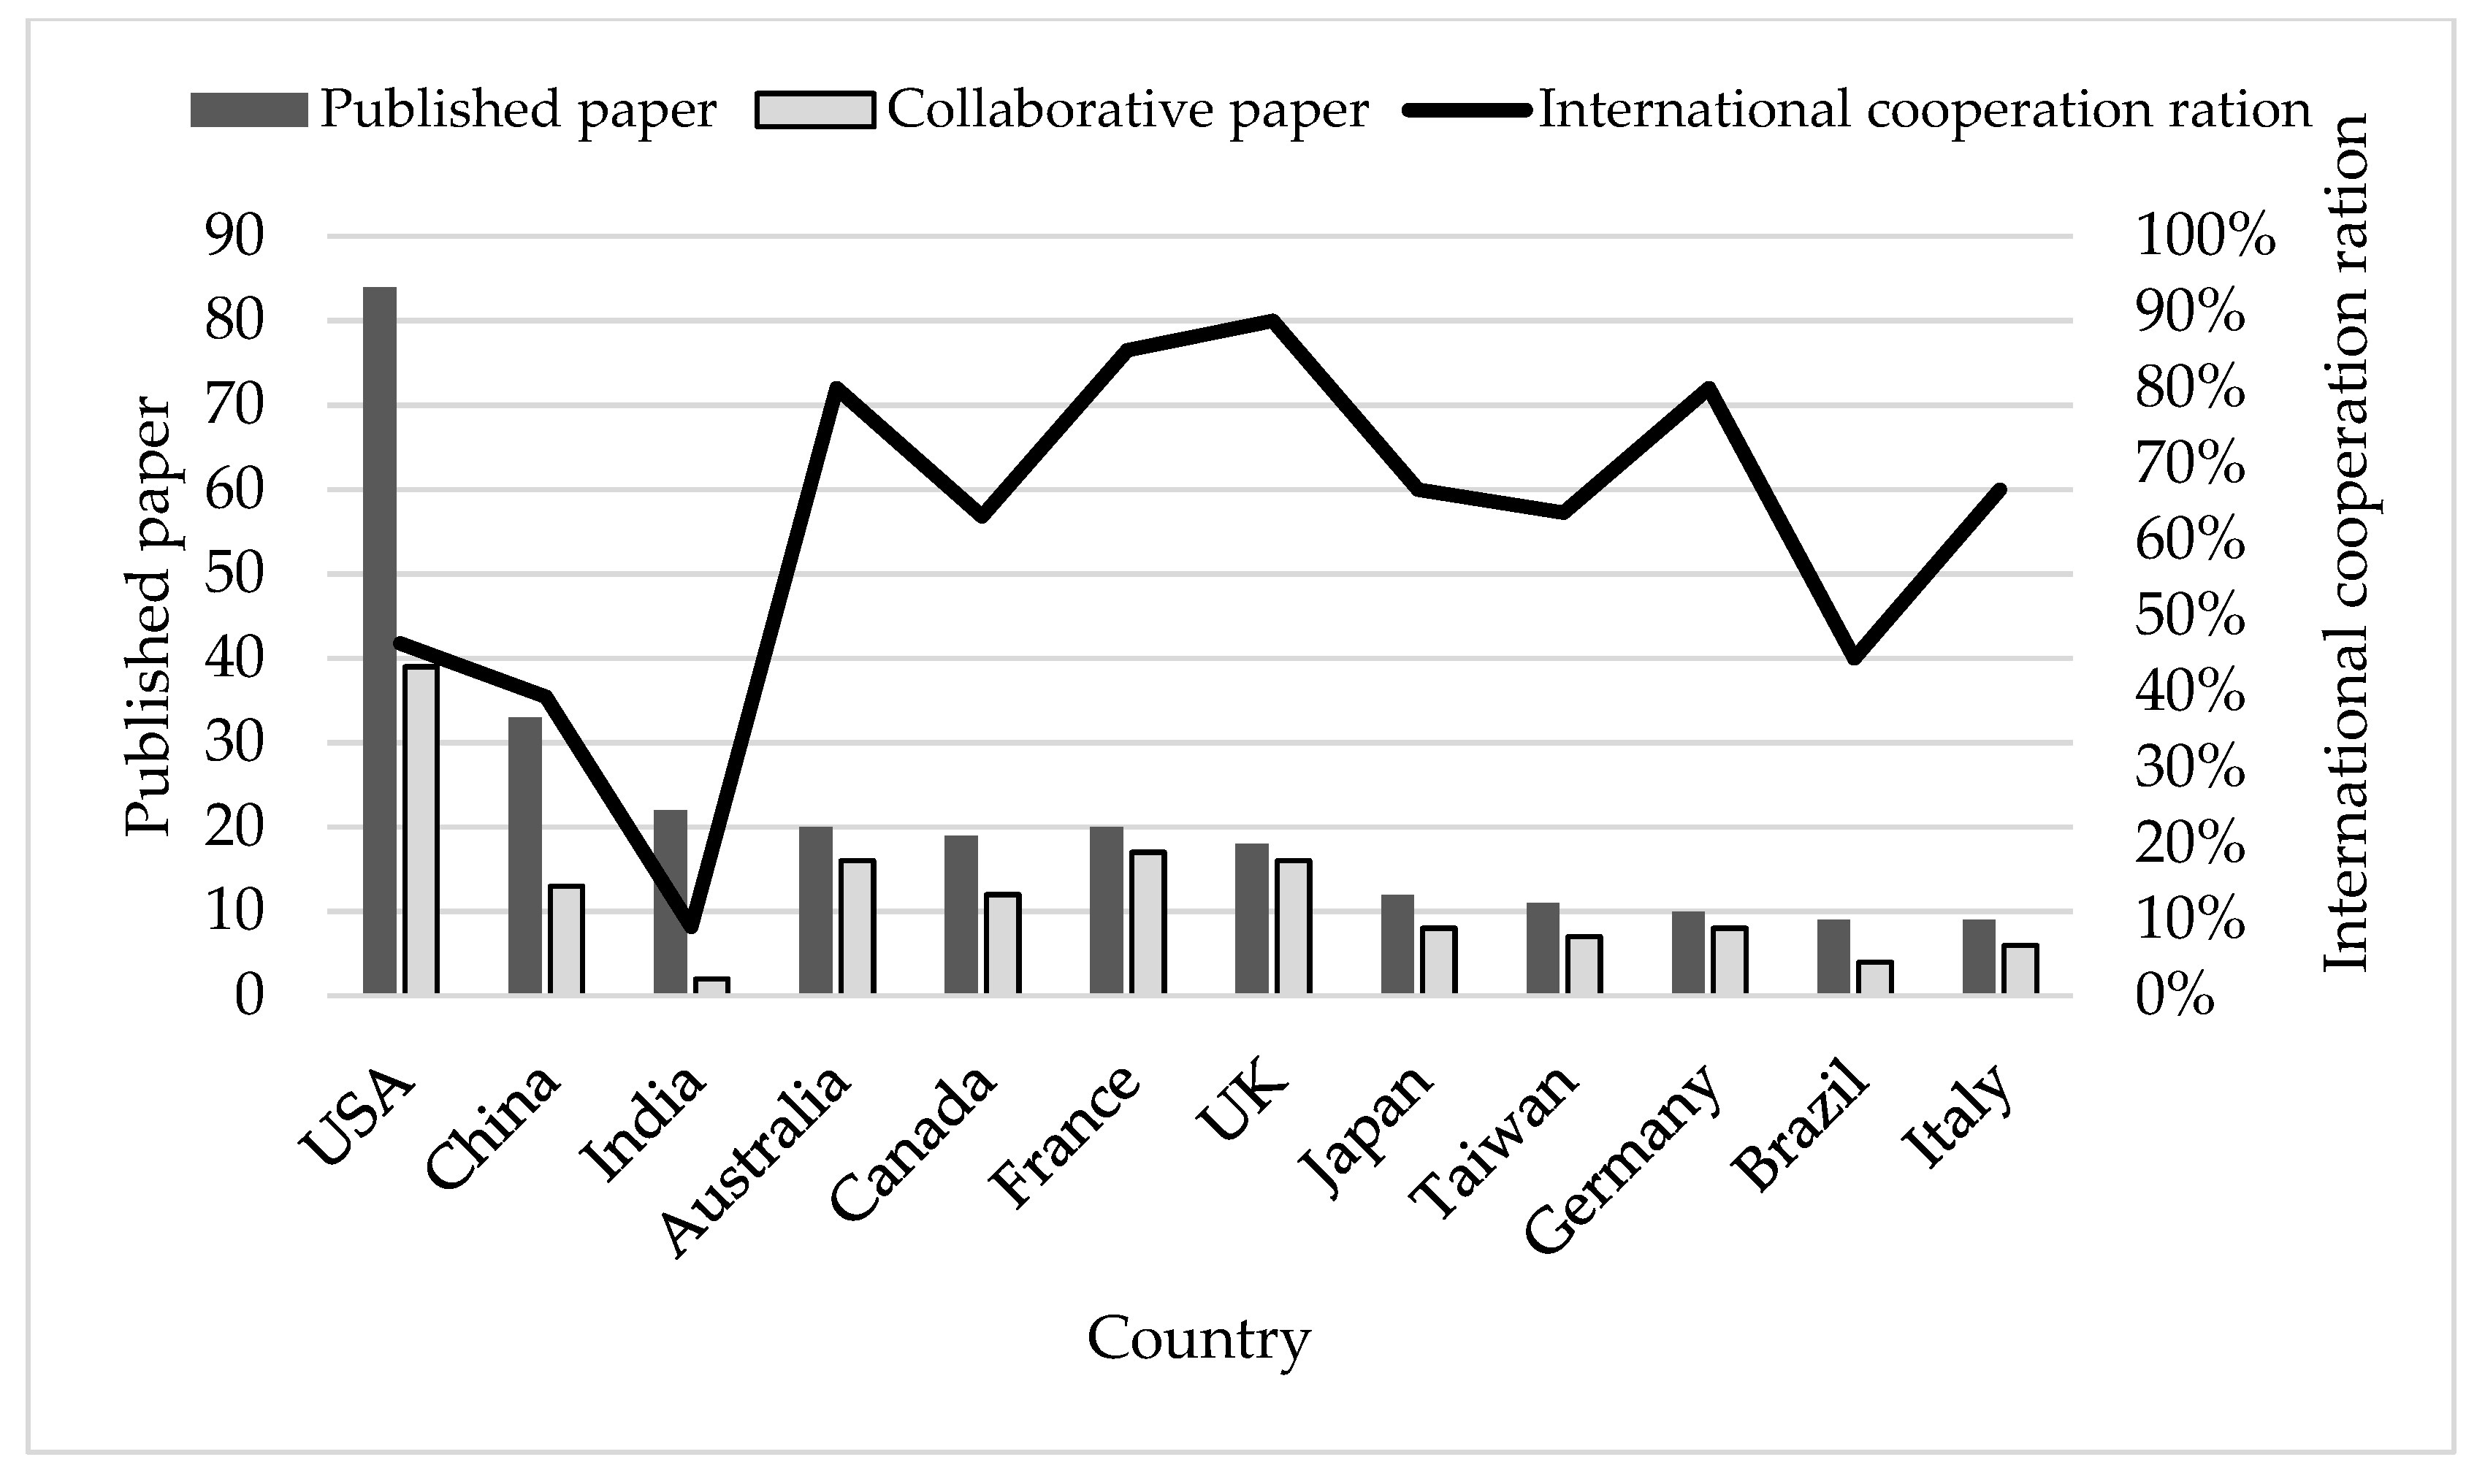
Figure 2 shows the number of publications, the number of international collaborations and the ICRs of the top ten countries. As shown in Figure 2, the number of publications and the ICR were not necessarily correlated. For example, the United States had the most international collaborations, but a lower ICR than those of eight other countries. India ranked number 3 in terms of publication number and was the lowest in terms of ICR; among its 22 publications, only two were from international collaborations. With the exception of Brazil, the countries ranked from 4 to 10 had a higher ICR, indicating that these countries have a high level of international cooperation in this field.
Figure 3 shows the cooperation network and geographic location of each country, which indicate the level of cooperation of the 64 countries in this study. Sixty-two of these countries (excluding Ecuador and Turkey, from which researchers have published as independent authors) all published studies with international collaborations. In fact, the cooperation network of the top five countries already included 46 countries (Figure 3). The United States had the most collaborations, with the densest cooperative connections that include over 30 countries worldwide.
Outside the cooperation network of the top five countries, 18 countries were independent of the cooperation network of the top five countries, i.e., six countries in Asia (Cambodia, Iran, Malaysia, Singapore, Thailand and Vietnam), five countries in Africa (Cameroon, Morocco, Namibia, Tanzania and Zambia), three countries in Europe (Austria, Malta and Turkey), two countries in Oceania (French Polynesia and Kiribati), one country in South America (Ecuador) and one country in Central America (Panama). Of these countries, Cambodia, Tanzania and Zambia have been on the UN’s list of the least developed countries in dire need of technical assistance [49], representing challenges in sustainable fishery development.
In terms of the number of publications per author, 15 authors had more than three publications, 86 had two publications and 953 had one publication. Regarding collaboration trends in the future, Table 3 shows the top 10 papers for citations, according to the level of collaboration, to characterize the level of collaboration and compare the citation impact of highly cited articles. The first paper is authored by a single researcher; the other nine papers are published in collaboration.
As shown in Figure 4, compared to the country-based network shown in Figure 3, the author-based network is more scattered. Except for a few networks that are interconnected, most of the networks are independent of each other, indicating that the researchers worked in diverse fields or regions and applied many techniques that were learned through academic journals, textbooks, manuals, teaching or the Internet. This phenomenon indicates that this research field will not be monopolized by a small set of scholars or academic institutions. Scholars generally can establish academic links through intangible communication channels (such as academic journals, textbooks, teaching, or the internet) to obtain technologies for research. These diffuse academic networks cover both developed and developing countries and the research output from developing countries has been active.
4.3. Hotspots and the Gaps in Applying RS to Fisheries
Twenty-eight publications reported studies at the global scale and 47 publications described studies conducted in the waters of the northeastern United States. The geographical fishery hotspots are shown in Figure 5. The region from the Washington, D.C. area to the Maine coastal area was the most extensively studied area, among which the high seas of the northern Atlantic Ocean have also been extensively studied. Many studies have been conducted on the waters surrounding France, Spain and Portugal. In the surrounding areas of the Indian Ocean, many research hotspots were also identified in the Arabian Sea, the area near the west side of India and the Bay of Bengal and the waters on the west side of Myanmar. In the waters of the East China Sea, Yellow Sea and Bohai Bay to the north of Taiwan, the neighboring countries, including Taiwan, China, Japan and South Korea, have also made many research efforts in these areas. Overall, the studies on the application of RS in fisheries were mostly distributed among the five hotspots described above.
A comparison of the studies in the three major oceans showed that studies in the Atlantic Ocean were more abundant, followed by those in the Indian Ocean, while the Pacific Ocean was less studied. In terms of the hemisphere, all research hotspots were located in the Northern Hemisphere, whereas the Southern Hemisphere was less extensively investigated. In-depth field studies were conducted in some local areas of the Atlantic and Indian Oceans. Areas near but not far from the coastal regions of the Pacific Ocean have been extensively studied. However, this phenomenon was not observed for the equatorial Pacific island countries. This phenomenon indicates that many countries are unable to invest in research due to a lack of resources, leading to a research gap in EEZs. This study also analyzed the EEZ research reports of tropical countries to determine the presence of research gaps on the coasts of these tropical countries.
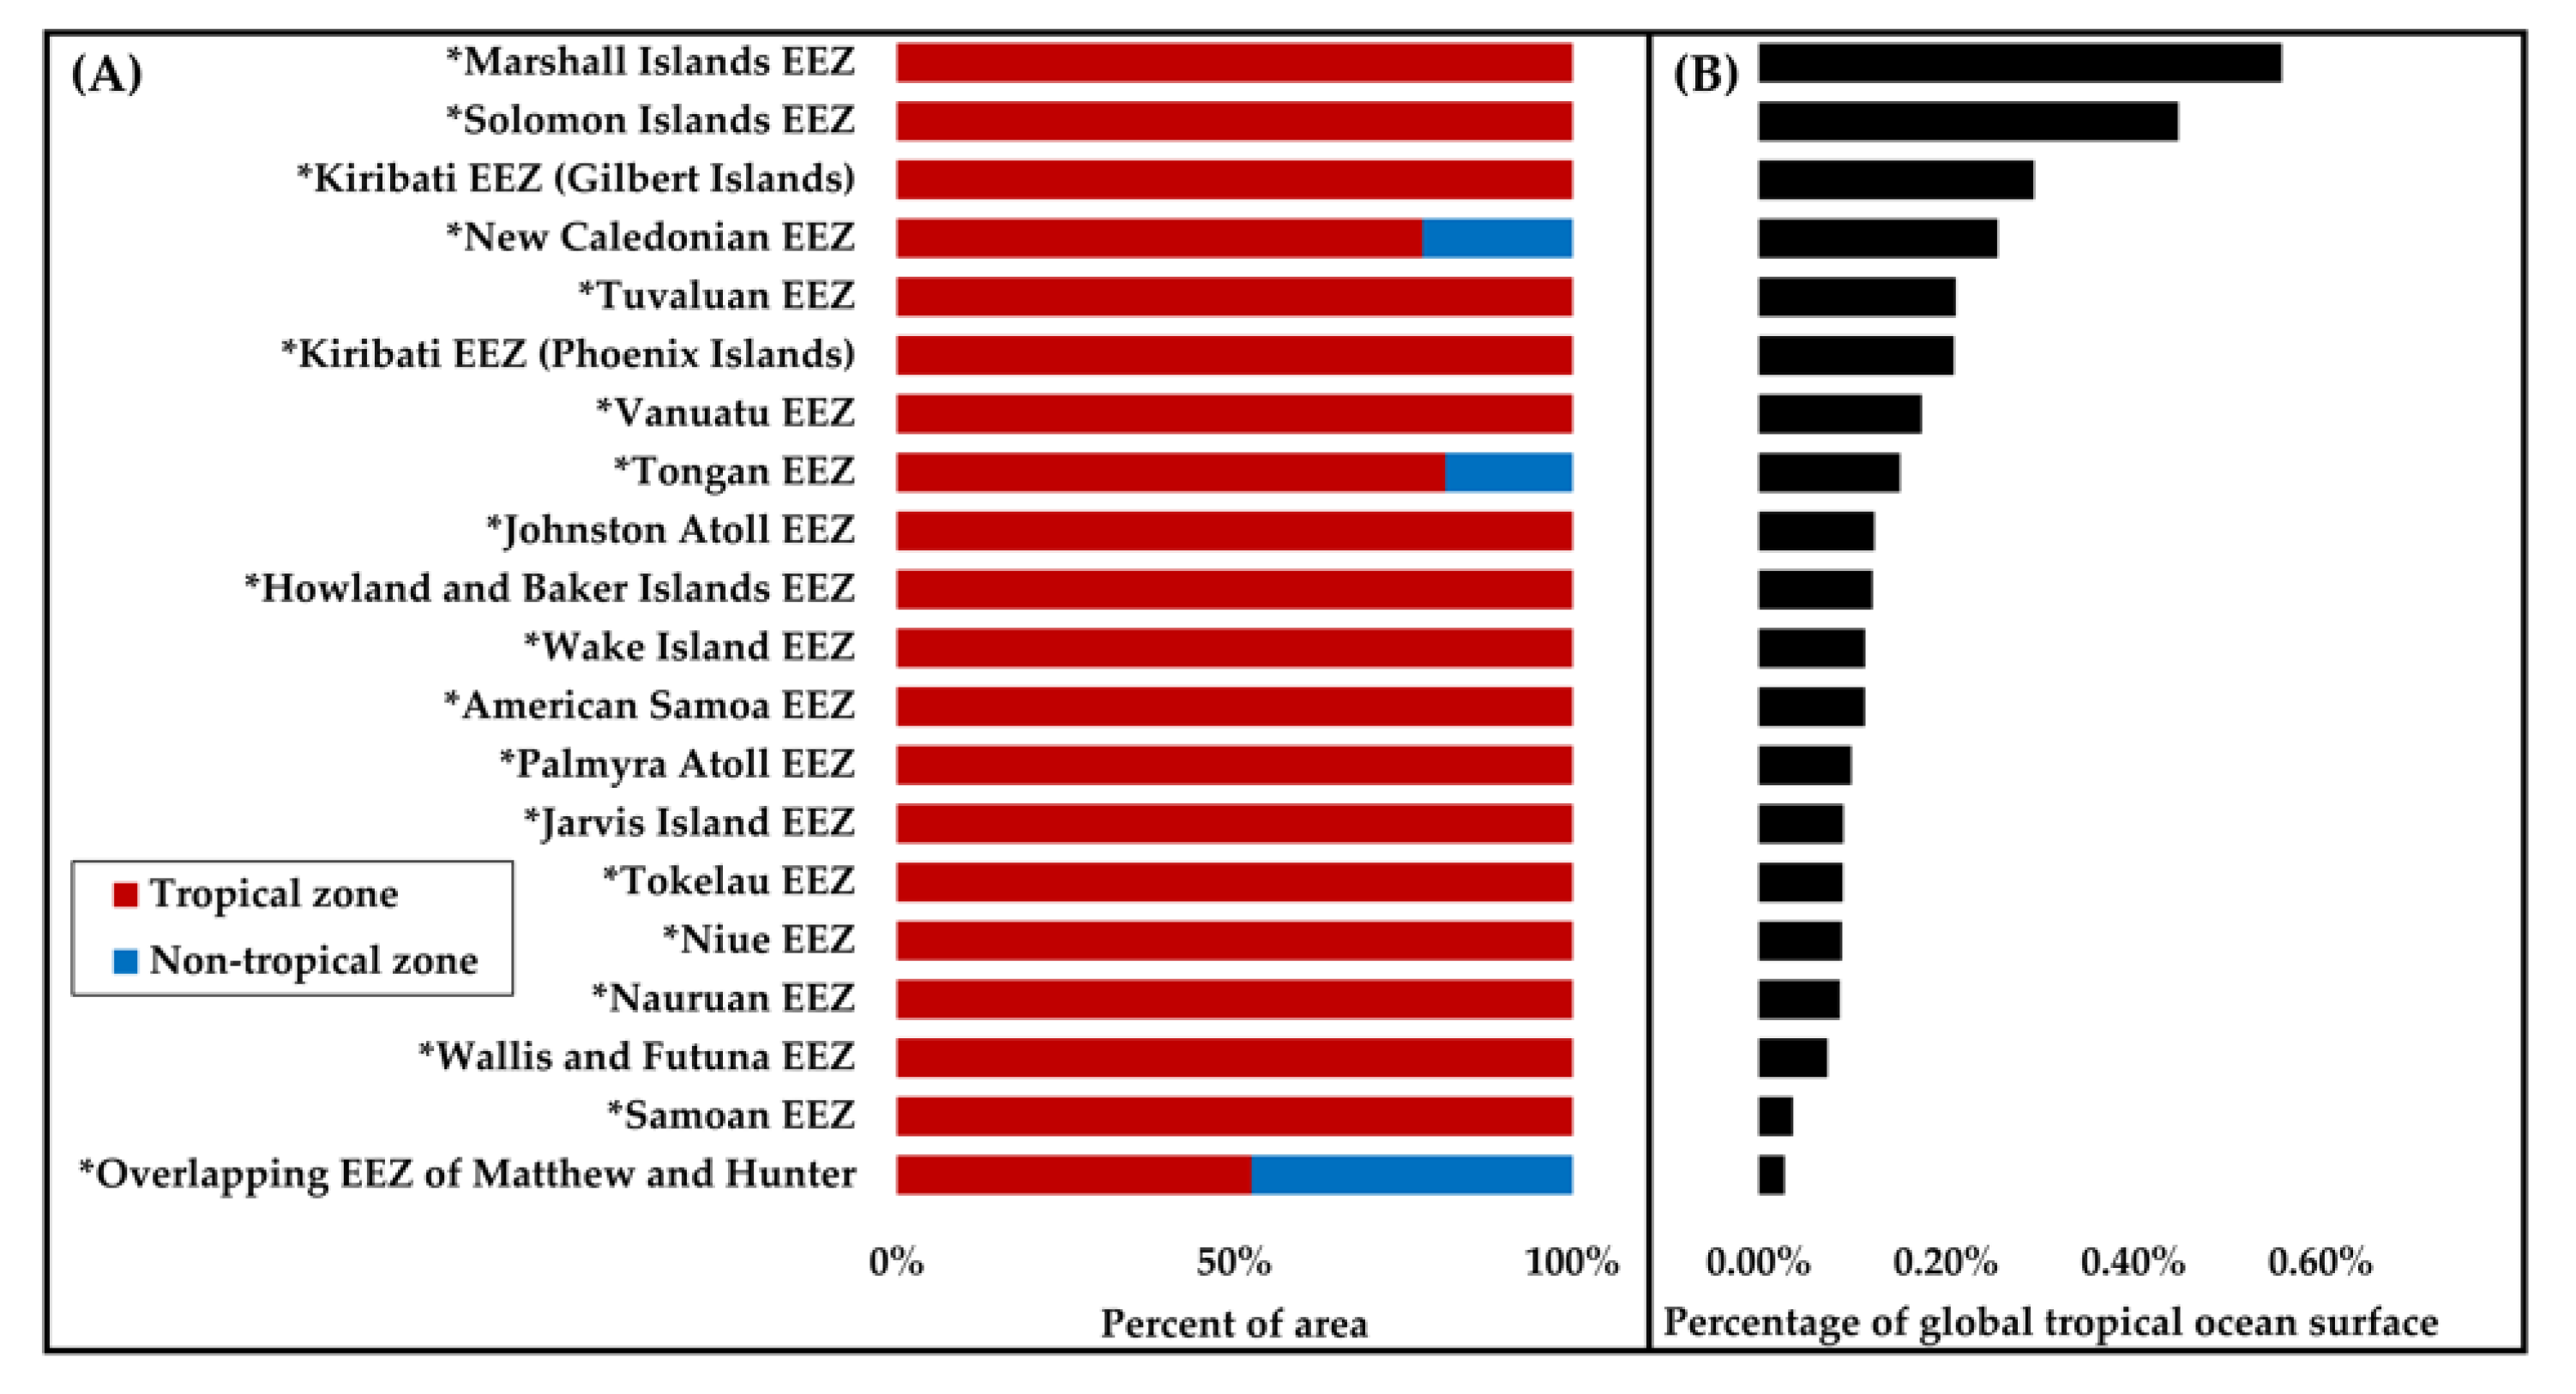
As shown in Figure 6, the EEZs with low coverage were mostly located in the Pacific Islands. Moreover, in these regions, the nontropical areas only composed a small proportion. In other words, if the first wave of the impact of climate change hits tropical regions and thus causes marine fishery resources to flee these areas, the source of aquatic products of the countries and the people in these areas will suffer the most serious blow.
5. Discussion
This study collects and analyzes the research reports using the two keywords “fisheries” and “remote sensing” in the WOS database. In addition, to exploring the academic network in the field and identifying research hotspots, this study compares different ocean areas of the Northern and Southern Hemispheres. This research further contributes to the discussion of research differences between coastal and offshore areas and between developing countries and developed countries and highlights research gaps in this field. The premise of the research method is to examine the peer-reviewed journals included in the WOS database to ensure that each paper is valid for this study and then to exclude articles in non-target areas by setting keywords. This method can be applied not only to the research on the sustainability of fisheries by satellite telemetry but also to other fields of sustainable research under the premise of mastering effective keywords.
This study used two keywords to search articles. Therefore, when narrowing the research field into research related to “fisheries” and “remote sensing”, some related documents will inevitably be excluded, which may lead to the analysis of disadvantages [50,51]. For example, the RS data of Advanced Very-High-Resolution Radiometer (AVHRR) are commonly used in fishery research. Thirty fishery research reports published from 2009 to 2018 used the RS data of AVHRR, but only 10 of them were identified in the database in the present study. According to the classification statistics of the WOS Categories, 66% of the articles whose categories are “remote sensing” are actually labeled RS (six of nine articles are labeled) and only 29% of the articles whose Categories are “fisheries” are labeled (only two of seven articles are labeled). This simple statistic suggests that when most scholars in the field of fishery use RS data, the customary practice is to refrain from mentioning RS in their titles, keywords and abstracts. Therefore, we are transparent about this limitation. As a result, even if the metadata of an article (title, abstract, author, journal name, keywords, etc.) are checked verbatim, the objective determination of whether an article belongs to the search scope is still difficult [52]. Therefore, although this method has research limitations, the bibliographic measurement results of this study are still representative.
Although RS data are not necessarily indispensable in fishery scientific research, they are an ideal tool to provide ecological indicator information [53,54]. In particular, fisheries management planning is closely related to dynamic changes in marine space, the policymakers’ and technicians’ concerns about the marine habitat situation and decreases in the spawning biomass of key species [55], and thus, the application of RS in the fishing ground environment has become increasingly important [19,28]. Many recent studies have analyzed the age growth of fishery resource species, reproductive organisms and catches [56,57,58,59] to achieve the effect of fishery sustainability and use on-site ship survey data to investigate the marine habitat situation and early life history of fish [60]. Although developed countries can certainly afford such high-cost research, developing countries may not. Currently, most of the RS marine environmental parameters are available online for free and can be processed using various open-source tools (e.g., R Project, Python and QGIS) developed by some research institutions or teams [61,62]. These resources will enable technicians of all countries to quickly and easily invest in sustainable fishery research. Policymakers can also effectively grasp the marine habitat situation and decrease in the spawning biomass of key species during climate change based on the research results.
On the other hand, this study also has the issue of difficulty in collecting grey literature. For example, Peru’s anchovy has an important correlation with climate change, and thus, The Instituto del Mar del Peru (IMARPE) has conducted many related studies using RS, but because these studies are mainly published in Spanish-based journals (e.g., Peruvian Journal of Biology) and therefore are not included in WOS. As another example, the journal “NIPPON SUISAN GAKKAISHI” of The Japanese Society of Fisheries Science in Japan also contains a large number of Japanese research reports. These reports are also not included in the WOS and could not be analyzed in this study. The effect of grey literature on the research conclusions has been discussed in other fields [63,64]. Even if the conclusions of this research are not significantly different, we still look forward to more improvements in the future. The database can eliminate language barriers and allow global grey literature to be included in the analysis, because a larger sample size will be closer to the original truth. The two journals listed above will provide basic English information when they are published. We propose that the inclusion of this information will have a positive effect on the future integration of relevant databases. On the other hand, The Japanese Society of Fisheries Science also issued another journal (Fisheries Science) published in English and it has been included in WOS.
Whether the official language of the country is English may also affect this analysis. However, many non-English speaking countries (China, Japan, Taiwan, etc.) included in this study still produced a relatively large number of publications. Some countries in the Pacific Islands use English as their official language (such as the Solomon Islands and Marshall Islands), but still encounter difficulty in publishing more academic results in the WOS. This difficulty is mainly due to the impact factor [65], audience accessibility [66] and other factors in the selection of academic research journals. Therefore, these publications should be considered as international cooperation. Research results are also easily considered for submission to highly cited journals (such as SCIE). On the other hand, through the process of peer review, academic achievements can be decontaminated and retained (academic communication citation) to ensure that most of the literature in this research field is positively helpful to the sustainability of fishery resources. Therefore, this research can not only help researchers effectively grasp the reports of world-class fishery sustainability research through the WOS pipeline, but also determine the geographical distribution of research gaps by collating these articles.
Some developed countries (e.g., the United States and Canada) have sufficient budgets to fully develop this technology [41], which will enable the territories on the waters surrounding these countries to continue receiving research investment and eventually form a research hotspot. As shown in Figure 5, for the Atlantic Ocean, our results indicated considerable research investment in the US Eastern Seaboard that extends to Europe and the entire Atlantic Ocean. Another example is the Pacific region shown in Figure 5, where the absence of sufficient research resources has posed various challenges to many developing countries in applying new technologies. In many developing countries (e.g., Pacific Island countries), the fishery products from the surrounding seas are used as a source of animal protein for locals. These resources can be converted into fishing quotas and sold to various ocean fishing countries to increase fiscal revenue while forging diplomatic relations. In addition, the offshore fishing areas of many developed countries (e.g., the European Union, the United States, China, Taiwan and Japan) not only develop EEZs and marine resources on the high seas, but also supplement the market gap by importing or reaching out to developing countries for fishery cooperation [12]. Sustainable fisheries around developing countries are a local issue, but will also affect many other countries. In addition, oceans are borderless and all regions near oceans are connected with one another; therefore, we urgently need to enable developing countries to rapidly develop sustainable fisheries research.
Increasing scientific knowledge, improving research capabilities and translating marine scientific and technological knowledge will help improve the health of the marine environment and the contribution of marine biodiversity to the development of developing countries. RS is a new and popular technology and countries are actively improving these studies [67]. Therefore, the rapid growth of this technology in individual countries (such as China and India) has been observed over 10 years (Table 1), as described in previous studies [68]. Increasing scientific knowledge, improving research capabilities and translating marine scientific and technological knowledge will help improve the health of the marine environment and the contribution of marine biodiversity to the development of developing countries. Studies of the reasons for the fast growth of these countries are also worthwhile for more in-depth discussion and as a reference to eliminate the research gap in this field. At the same time, we also hope that by implementing new technologies in countries and the established academic networks, we will effectively assist developing countries in meeting the expectations of SDGs for the balanced development of each country.
This study identified 18 countries that were not connected to the cooperative network involving the core countries, of which three were on the UN list of the least developed countries [49], which has inevitably affected the knowledge transfer from and the technology exchange with other countries. The regular review of information sources, such as data and statistics, is needed to effectively support the implementation and supervision of SDGs and sustainable development policies and measures. Developing and developed countries should establish research partnerships, especially in policy coordination, funding, human resource development and the application of advanced technologies in fisheries RS, to better gauge and manage global fisheries toward a prosperous future of resource recovery and to achieve the specific goals of sustainable development.
Consistent with the spirit of SDGs, any country should try to improve the sustainability of fisheries through scientific research and tool development. Climate change has been confirmed to cause changes in the marine environment, such as changes in water temperatures and hypoxia, which in turn affect fishery resources [69]. The absolute advantage of RS is to conduct fishery sustainability research based on the characteristics of RS, such as regularity, large area and convenience. Although on-site ship survey data can provide more accurate data, the analysis reported here indicates that regardless of the ocean area or the degree of economic development, the RS tool has been added to fishery research in all regions and excellent results have been obtained and published. Therefore, RS data can support sustainable fishery methods. In other words, this research method has considered the feasibility of investing in fisheries sustainability research by countries worldwide.
Each country bears the main responsibility for its own fishery economic development while strengthening research and planning in its fishery policies and development strategies. However, each country must not forget to help other countries. In the era of rapid climate change with broad-scale impacts, developing countries must continuously use RS technology in fisheries to achieve sustainable development. The countries with strong international collaborations can strengthen cooperation with research partners in developing countries in the future. Through increased technical exchange and dissemination, the 17th indicator of the SDGs (i.e., revitalize the global partnership for sustainable development) can be addressed. By assisting developing countries in fostering research and technological capabilities, developed countries can reduce research gaps to enhance the sustainability of marine fishery resources.
6. Conclusions
In this study, we examined the shortcomings of fisheries research from various countries and analyzed the research hotspots over the past 10 years, including countries with collaborative research networks, using the WOS database and geographic information systems. Most studies have been conducted in the northeastern marine areas of the United States, i.e., the coastal areas from Washington, D.C., to Maine.
We also found that research hotspots of satellite RS applications in fisheries mainly occurred in the following areas:
- the northeastern marine area of the United States;
- the high seas area of the North Atlantic Ocean;
- the surrounding sea areas of France, Spain and Portugal;
- the peripheral areas of the Indian Ocean;
- the East China Sea, Yellow Sea and Bohai Sea areas to the north of Taiwan.
A comparison of the publications involving fisheries RS applications in the three major oceans indicated that the Atlantic Ocean was the most extensively studied, followed by the Indian Ocean, while the Pacific Ocean was less studied than the other two regions.
In addition, all research hotspots were located in the Northern Hemisphere, indicating a lack of relevant studies from the Southern Hemisphere. The Atlantic Ocean and the Indian Ocean have been the subjects of many local in-depth studies; the coastal areas of the Pacific Ocean have been extensively investigated, while offshore local areas have only been sporadically addressed. For the achievement of SDGs by 2030, the research network can be expanded to mitigate the research gaps and improve the sustainability of marine fisheries resources.
Supplementary Materials
The following are available online at https://www.mdpi.com/2072-4292/13/5/1013/s1, Table S1: A list of 236 articles, including authors’ name, title, journal, publication year and citation, generated from a Boolean keyword search for “fisheries” and “remote sensing” in the WOS database between the years of 2009–2018.
Author Contributions
Conceptualization, K.-W.Y. and C.-H.C.; Methodology, K.-W.Y. C.-H.C.; Visualization, K.-W.Y. and C.-H.C.; Writing—original draft, K.-W.Y. and C.-H.C.; Writing—review and editing, K.-W.Y. and C.-H.C. All authors have read and agreed to the published version of the manuscript.
Funding
This research received no external funding.
Institutional Review Board Statement
Not applicable.
Informed Consent Statement
Not applicable.
Data Availability Statement
Data from this research will be available upon request to the authors.
Conflicts of Interest
The authors declare no conflict of interest.
References
- FAO. The State of World Fisheries and Aquaculture 2018-Meeting the Sustainable Development Goals. Available online: http://www.fao.org/documents/card/en/c/I9540EN/ (accessed on 13 January 2021).
- United Nations World Population Prospects. 2019. Available online: https://population.un.org/wpp/ (accessed on 13 January 2021).
- Guo, H. Earth Observations in China and the World: History and Development in 50 Years. Bull. Chin. Acad. Sci. 2013, 27, 96–98. [Google Scholar]
- Pew Research Center World’s Population Is Projected to Nearly Stop Growing by the End of the Century. Available online: https://www.pewresearch.org/fact-tank/2019/06/17/worlds-population-is-projected-to-nearly-stop-growing-by-the-end-of-the-century/ (accessed on 13 January 2021).
- Our World in Data. Seafood Production. 2020. Available online: https://ourworldindata.org/seafood-production (accessed on 13 January 2021).
- Seafood Source News. A Fish Populations Are Thriving in Areas with Intense Management, Global Study Finds. Available online: https://www.seafoodsource.com/news/environment-sustainability/fish-populations-are-thriving-in-areas-with-intense-management-global-study-finds (accessed on 13 January 2021).
- United Nations. Transforming Our World: The 2030 Agenda for Sustainable Development. Available online: https://sdgs.un.org/sites/default/files/publications/21252030%20Agenda%20for%20Sustainable%20Development%20web.pdf (accessed on 13 January 2021).
- Messerli, P.; Murniningtyas, E. Global Sustainable Development Report 2019: The Future Is Now–Science for Achieving Sustainable Development; United Nations: New York, NY, USA, 2019. [Google Scholar]
- Allison, E.; Perry, A.; Badjeck, M.-C.; Adger, W.; Brown, K.; Conway, D.; Halls, A.; Pilling, G.; Reynolds, J.; Andrew, N.; et al. Vulnerability of National Economies to the Impacts of Climate Change on Fisheries. Fish Fish. 2009, 10, 173–196. [Google Scholar] [CrossRef] [Green Version]
- Dulvy, N.; Reynolds, J.D.; Pilling, G.M.; Pinnegar, J.K.; Scutt Phillips, J.; Allison, E.H.; Badjeck, M.-C. Fisheries management and governance challenges in a climate change. In The Economics of Adapting Fisheries to Climate Change; OECD Publishing: Paris, France, 2011; pp. 31–88. [Google Scholar]
- OECD iLibrary. Available online: https://www.oecd-ilibrary.org/agriculture-and-food/the-economics-of-adapting-fisheries-to-climate-change_9789264090415-en (accessed on 13 January 2021).
- Liao, C.P.; Huang, H.W. The cooperation strategies of fisheries between Taiwanese purse seiners and Pacific Island Countries. Mar. Policy 2016, 66, 67–74. [Google Scholar] [CrossRef]
- Pauly, D.; Zeller, D. Catch reconstructions reveal that global marine fisheries catches are higher than reported and declining. Nat. Commun. 2016, 7, 10244. [Google Scholar] [CrossRef] [PubMed]
- Ye, Y.; Gutierrez, N. Ending fishery overexploitation by expanding from local successes to globalized solutions. Nat. Ecol. Evol. 2017, 1. [Google Scholar] [CrossRef]
- González, R.; Gaspar, C.; Curtolo, L.; Sangiuliano, I.; Osovnikar, P.; Borsetta, N. Fishery and oceanographic monitoring system (foms): A new technological tool based on remote sensing, with application in ecosystem management of coastal fisheries in patagonia. Gayana 2003, 68. [Google Scholar] [CrossRef]
- Adams, W.M. The Future of Sustainability: Re-Thinking Environment and Development in the Twenty-First Century [Online]. Report of the IUCN Renowned Thinkers Meeting, 29–31 January 2006. Available online: https://portals.iucn.org/library/sites/library/files/documents/Rep-2006-002.pdf (accessed on 21 February 2021).
- Hilborn, R.; Fulton, E.; Green, B.; Hartmann, K.; Tracey, S.; Watson, R. When is a fishery sustainable? Can. J. Fish. Aquat. Sci. 2015, 72, 1433–1441. [Google Scholar] [CrossRef]
- Bao, J.; Gao, S.; Ge, J. Dynamic land use and its policy in response to environmental and social-economic changes in China: A case study of the Jiangsu coast (1750–2015). Land Use Policy 2019, 82, 169–180. [Google Scholar] [CrossRef]
- Peng, B. Application of Marine Remote Sensing Technology in the Development of Fishery Economy. J. Coast. Res. 2019, 94, 783–787. [Google Scholar] [CrossRef]
- Bulter, M.J.A.; Mouchot, M.C.; Barale, V.; LeBlanc, C. The Application of Remote Sensing Technology to Marine Fisheries: An Introductory Manual; FAO Fisheries Technical Paper, 295; FAO: Rome, Italy, 1988; Available online: http://www.fao.org/3/t0355e/T0355E00.HTM#toc (accessed on 13 January 2021).
- Saitoh, S.-I.; Mugo, I.N.; Radiarta, S.; Asaga, F.; Takahashi, T.; Hirawake, Y.; Ishikawa, T.; Awaji, T.; In, T.; Shima, S. Some operational uses of satellite remote sensing and marine GIS for sustainable fisheries and aquaculture. ICES J. Mar. Sci. 2011, 68, 687–695. [Google Scholar] [CrossRef] [Green Version]
- Pricope, N.; Mapes, K.; Woodward, K. Remote Sensing of Human–Environment Interactions in Global Change Research: A Review of Advances, Challenges and Future Directions. Remote Sens. 2019, 11, 2783. [Google Scholar] [CrossRef] [Green Version]
- Kim, M.; Yang, Y.; Kim, J. Sea Surface Temperature and High Water Temperature Occurrence Prediction Using a Long Short-Term Memory Model. Remote Sens. 2020, 12, 3654. [Google Scholar] [CrossRef]
- Wu, Y.L.; Lee, M.A.; Chen, L.C.; Chan, J.W.; Lan, K.W. Evaluating a Suitable Aquaculture Site Selection Model for Cobia (Rachycentron canadum) during Extreme Events in the Inner Bay of the Penghu Islands, Taiwan. Remote Sens. 2020, 12, 2689. [Google Scholar] [CrossRef]
- Santos, A.; Miguel, P. Fisheries oceanography using satellite and airborne remote sensing methods: A review. Fish. Res. 2000, 49, 1–20. [Google Scholar] [CrossRef]
- A Brief History of Remote Sensing. Available online: http://www.sarracenia.com/astronomy/remotesensing/primer0120.html (accessed on 13 January 2021).
- Chassot, E.; Bonhommeau, S.; Reygondeau, G.; Nieto, K.; Polovina, J.J.; Huret, M.; Dulvy, N.K.; Demarcq, H. Satellite remote sensing for an ecosystem approach to fisheries management. ICES J. Mar. Sci. 2011, 68, 651–666. [Google Scholar] [CrossRef] [Green Version]
- Klemas, V.V. Fisheries Applications of Remote Sensing: An Overview. Fish. Res. 2013, 148, 124–136. [Google Scholar] [CrossRef]
- Zhu, L.J.; Suomalainen, J.; Liu, J.; Hyyppä, J.; Kaartinen, H.; Haggren, H. A review: Remote sensing sensors. In Multi-Purposeful Application of Geospatial Data; Rustamov, R.B., Hasanova, S., Zeynalova, M.H., Eds.; Intechopen: London, UK, 2018; pp. 19–42. [Google Scholar]
- Liang, S.; Wang, D.; He, T.; Yu, Y. Remote sensing of earth’s energy budget: Synthesis and review. Int. J. Digit. Earth 2019, 12, 737–780. [Google Scholar] [CrossRef] [Green Version]
- Sakti, A.D.; Fauzi, A.I.; Wilwatikta, F.N.; Rajagukguk, Y.S.; Sudhana, S.A.; Yayusman, L.F.; Syahid, L.N.; Sritarapipat, T.; Principe, J.A.; Trang, N.T.Q.; et al. Multi-Source Remote Sensing Data Product Analysis: Investigating Anthropogenic and Naturogenic Impacts on Mangroves in Southeast Asia. Remote Sens. 2020, 12, 2720. [Google Scholar] [CrossRef]
- Su, N.J.; Chang, C.H.; Hu, Y.T.; Chiang, W.C.; Tseng, C.T. Modeling the Spatial Distribution of Swordfish (Xiphias gladius) Using Fishery and Remote Sensing Data: Approach and Resolution. Remote Sens. 2020, 12, 947. [Google Scholar] [CrossRef] [Green Version]
- Vayghan, A.H.; Lee, M.A.; Weng, J.S.; Mondal, S.; Lin, C.T.; Wang, Y.C. Multisatellite-Based Feeding Habitat Suitability Modeling of Albacore Tuna in the Southern Atlantic Ocean. Remote Sens. 2020, 12, 2515. [Google Scholar] [CrossRef]
- Tang, D.L.; Levy, G. Introduction. In Remote Sensing of the Changing Oceans; Tang, D.L., Gower, J., Levy, G., Katsaros, K., Heron, M., Singh, R., Eds.; Springer: Berlin/Heidelberg, Germany, 2011; pp. 1–3. [Google Scholar]
- Dechesne, C.; Lefevre, S.; Vadaine, R.; Hajduch, G.; Fablet, R. Ship Identification and Characterization in Sentinel-1 SAR Images with Multi-Task Deep Learning. Remote Sens. 2019, 11, 2997. [Google Scholar] [CrossRef] [Green Version]
- Mugo, R.; Saitoh, S.I. Ensemble Modelling of Skipjack Tuna (Katsuwonus pelamis) Habitats in the Western North Pacific Using Satellite Remotely Sensed Data; a Comparative Analysis Using Machine-Learning Models. Remote Sens. 2020, 12, 2591. [Google Scholar] [CrossRef]
- Eugenio, F.; Marcello, J.; Martin, J. Multiplatform Earth Observation Systems for Monitoring Water Quality in Vulnerable Inland Ecosystems: Maspalomas Water Lagoon. Remote Sens. 2020, 12, 284. [Google Scholar] [CrossRef] [Green Version]
- Liu, Y.M.; Lu, C.; Yang, X.M.; Wang, Z.H.; Liu, B. Fine-Scale Coastal Storm Surge Disaster Vulnerability and Risk Assessment Model: A Case Study of Laizhou Bay, China. Remote Sens. 2020, 12, 1301. [Google Scholar] [CrossRef] [Green Version]
- Paul, C.K.; Mascarenhas, A.C. Remote sensing in development. Sci. New Ser. 1981, 214, 139–145. [Google Scholar] [CrossRef]
- Brewington, L.; Frizzelle, B.; Walsh, S.; Mena, C.; Sampedro, C. Remote Sensing of the Marine Environment: Challenges and Opportunities in the Galapagos Islands of Ecuador. In The Galapagos Marine Reserve: A Dynamic Social-Ecological System; Denkinger, J., Vinueza, L., Eds.; Springer: New York, NY, USA, 2014; Chapter 6; pp. 109–136. [Google Scholar]
- Nishida, T.; Itoh, K. GIS in Fisheries Resources Research: Current Situation and Prospects. In Proceedings of the 6th JIRCAS International Symposium: GIS Application for Agro-Environmental Issues in Developing Regions, Tsukuba, Japan, 7–8 September 1999; pp. 39–57. [Google Scholar]
- Boivin, T.; Coats, D.; Werle, D.; Baird, J. Remote Sensing Applications for Information Generation and Monitoring of Large River Fisheries. In Proceedings of the Second International Symposium on the Management of Large Rivers for Fisheries: Sustaining Livelihoods and Biodiversity in the New Millennium, Mekong River Commission Secretariat, Phnom Penh, Cambodia, 11–14 February 2003. [Google Scholar]
- De Graaf, G.; Marttin, F.; Aguilar-Manjarrez, J.; Jenness, J. Geographic Information Systems in Fisheries Management and Planning Technical manual; FAO Fisheries Technical Paper 449; FAO: Rome, Italy, 2003. [Google Scholar]
- De Silva, S.S.; Soto, D. Climate Change and Aquaculture: Potential Impacts, Adaptation and Mitigation. Climate Change Implications for Fisheries and Aquaculture: Overview of Current Scientific Knowledge; FAO Fisheries and Aquaculture Technical Paper; FAO: Rome, Italy, 2009; Volume 530, pp. 151–212. [Google Scholar]
- Marine Geographic Database. Available online: https://www.marineregions.org/ (accessed on 11 January 2021).
- Rhoades, S.A. The herfindahl-hirschman index. Fed. Res. Bull. 1993, 79, 188–189. [Google Scholar]
- Luukkonen, T.; Persson, O.; Sivertsen, G. Understanding Patterns of International Scientific Collaboration. Science. Technol. Hum. Values 1992, 17, 101–126. [Google Scholar] [CrossRef] [Green Version]
- Lam, V.W.Y.; Allison, E.H.; Bell, J.D.; Blythe, J.; Cheung, W.W.L.; Frölicher, T.L.; Gasalla, M.A.; Sumaila, U.R. Climate change, tropical fisheries and prospects for sustainable development. Nat. Rev. Earth Environ. 2020, 1, 440–454. [Google Scholar] [CrossRef]
- United Nations Least Developed Countries (LDCS). Available online: https://www.un.org/development/desa/dpad/least-developed-country-category/ldcs-at-a-glance.html (accessed on 13 January 2021).
- Mitra, M.; Chaudhuri, B.B. Information Retrieval from Documents: A Survey. Inf. Retr. J. 2000, 2, 141–163. [Google Scholar] [CrossRef]
- Grinäv, A. The Disadvantages of Using Scientometric Indicators in the Digital Age the Disadvantages of Using Scientometric Indicators in the Digital Age. IOP Conf. Ser. Mater. Sci. Eng. 2020, 970. [Google Scholar] [CrossRef]
- Gentles, S.J.; Charles, C.; Ploeg, J.; McKibbon, K.A. Sampling in qualitative research: Insights from an overview of the methods literature. Qual. Rep. 2015, 20, 1772–1789. [Google Scholar]
- Platt, T.; Sathyendranath, S. Ecological indicators for the pelagic zone of the ocean from remote sensing. Remote Sens Environ. 2008, 112, 3426–3436. [Google Scholar] [CrossRef]
- Stuart, V.; Platt, T.; Sathyendranath, S. The future of fisheries science in management: A remote-sensing perspective. ICES J. Mar. Sci. 2011, 68, 644–650. [Google Scholar] [CrossRef] [Green Version]
- Pierre, M.; Rouyer, T.; Bonhommeau, S.; Fromentin, J.M. Assessing causal links in fish stock-recruitment relationships. ICES J. Mar. Sci. 2018, 75, 903–911. [Google Scholar] [CrossRef]
- Forrest, R.E.; Walters, C.J. Estimating thresholds to optimal harvest rate for long-lived, low-fecundity sharks accounting for selectivity and density dependence in recruitment. Can. J. Fish. Aquat. Sci. 2009, 66, 2062–2080. [Google Scholar] [CrossRef]
- Juan-Jorda, M.J.; Mosqueira, I.; Freire, J.; Dulvy, N.K. Life in 3-D: Life history strategies in tunas, mackerels and bonitos. Rev. Fish. Biol. Fish. 2013, 23, 135–155. [Google Scholar] [CrossRef]
- Newman, S.J.; Williams, A.J.; Wakefield, C.B.; Nicol, S.J.; Taylor, B.M.; O’Malley, J.M. Review of the life history characteristics, ecology and fisheries for deep-water tropical demersal fish in the Indo-Pacific region. Rev. Fish. Biol. Fish. 2016, 26, 537–562. [Google Scholar] [CrossRef]
- Nikolic, N.; Morandeau, G.; Hoarau, L.; West, W.; Arrizabalaga, H.; Hoyle, S.; NICOL, S.; Bourjea, J.; Puech, A.; Farley, J.H.; et al. Review of albacore tuna, Thunnus alalunga, biology, fisheries and management. Rev. Fish Biol. Fish. 2017, 27, 775–810. [Google Scholar] [CrossRef]
- Lee, M.A.; Wang, Y.C.; Chen, Y.K.; Chen, W.Y.; Wu, L.J.; Liu, D.C.; Wu, J.L.; Teng, S.Y. Summer assemblages of ichthyoplankton in the waters of the East China Sea shelf and around Taiwan in 2007. J. Mar. Sci. Technol. Taiwan 2013, 21, 41–51. [Google Scholar] [CrossRef]
- Cresson, R. Deep Learning for Remote Sensing Images with Open Source Software; CRC Press: London, UK, 2020. [Google Scholar]
- Jacobs, Z.L.; Jebri, F.; Srokosz, M.; Raitsos, D.E.; Painter, S.C.; Nencioli, F.; Osuka, K.; Samoilys, M.; Sauer, W.; Roberts, M.; et al. A Major Ecosystem Shift in Coastal East African Waters during the 1997/98 Super El Nino as Detected Using Remote Sensing Data. Remote Sens. 2020, 12, 3127. [Google Scholar] [CrossRef]
- Osayande, O.; Ukpebor, C. Grey Literature Acquisition and Management: Challenges in Academic Libraries in Africa. Libr. Philos. Pract. 2012. Available online: https://digitalcommons.unl.edu/libphilprac/700 (accessed on 20 February 2021).
- Nussbaumer-Streit, B.; Klerings, I.; Dobrescu, A.I.; Persad, E.; Stevens, A.; Garritty, C.; Kamel, C.; Affengruber, L.; King, V.; Gartlehner, G. Excluding non-English publications from evidence-syntheses did not change conclusions: A meta-epidemiological study. J. Clin. Epidemiol. 2019, 118. [Google Scholar] [CrossRef]
- Schroter, S.; Tite, L.; Smith, R. Perceptions of open access publishing: Interviews with journal authors. BMJ 2005, 330, 756. [Google Scholar] [CrossRef] [Green Version]
- Warlick, S.E.; Vaughan, K. Factors influencing publication choice: Why faculty choose open access. Biomed. Digit. Libr. 2007, 4, 1–12. [Google Scholar] [CrossRef] [PubMed] [Green Version]
- Zhu, X.L.; Cai, F.Y.; Tian, J.Q.; Williams, T.K.A. Spatiotemporal Fusion of Multisource Remote Sensing Data: Literature Survey, Taxonomy, Principles, Applications, and Future Directions. Remote Sens. 2018, 10, 23. [Google Scholar] [CrossRef] [Green Version]
- Syed, S.; Aodha, L.; Scougal, C.; Spruit, M. Mapping the global network of fisheries science collaboration. Fish Fish. 2019, 20. [Google Scholar] [CrossRef] [Green Version]
- Portner, H.O.; Peck, M.A. Climate change effects on fishes and fisheries: Towards a cause-and-effect understanding. J. Fish. Biol. 2010, 77, 1745–1779. [Google Scholar] [CrossRef]
Figure 1.
Comparison of the number of articles published on fisheries RS and the numbers of authorships per study during the past ten years.
Figure 1.
Comparison of the number of articles published on fisheries RS and the numbers of authorships per study during the past ten years.

Figure 2.
The proportion of international collaborations in the top 10 most productive countries.

Figure 3.
Networks of international collaborations of various countries.
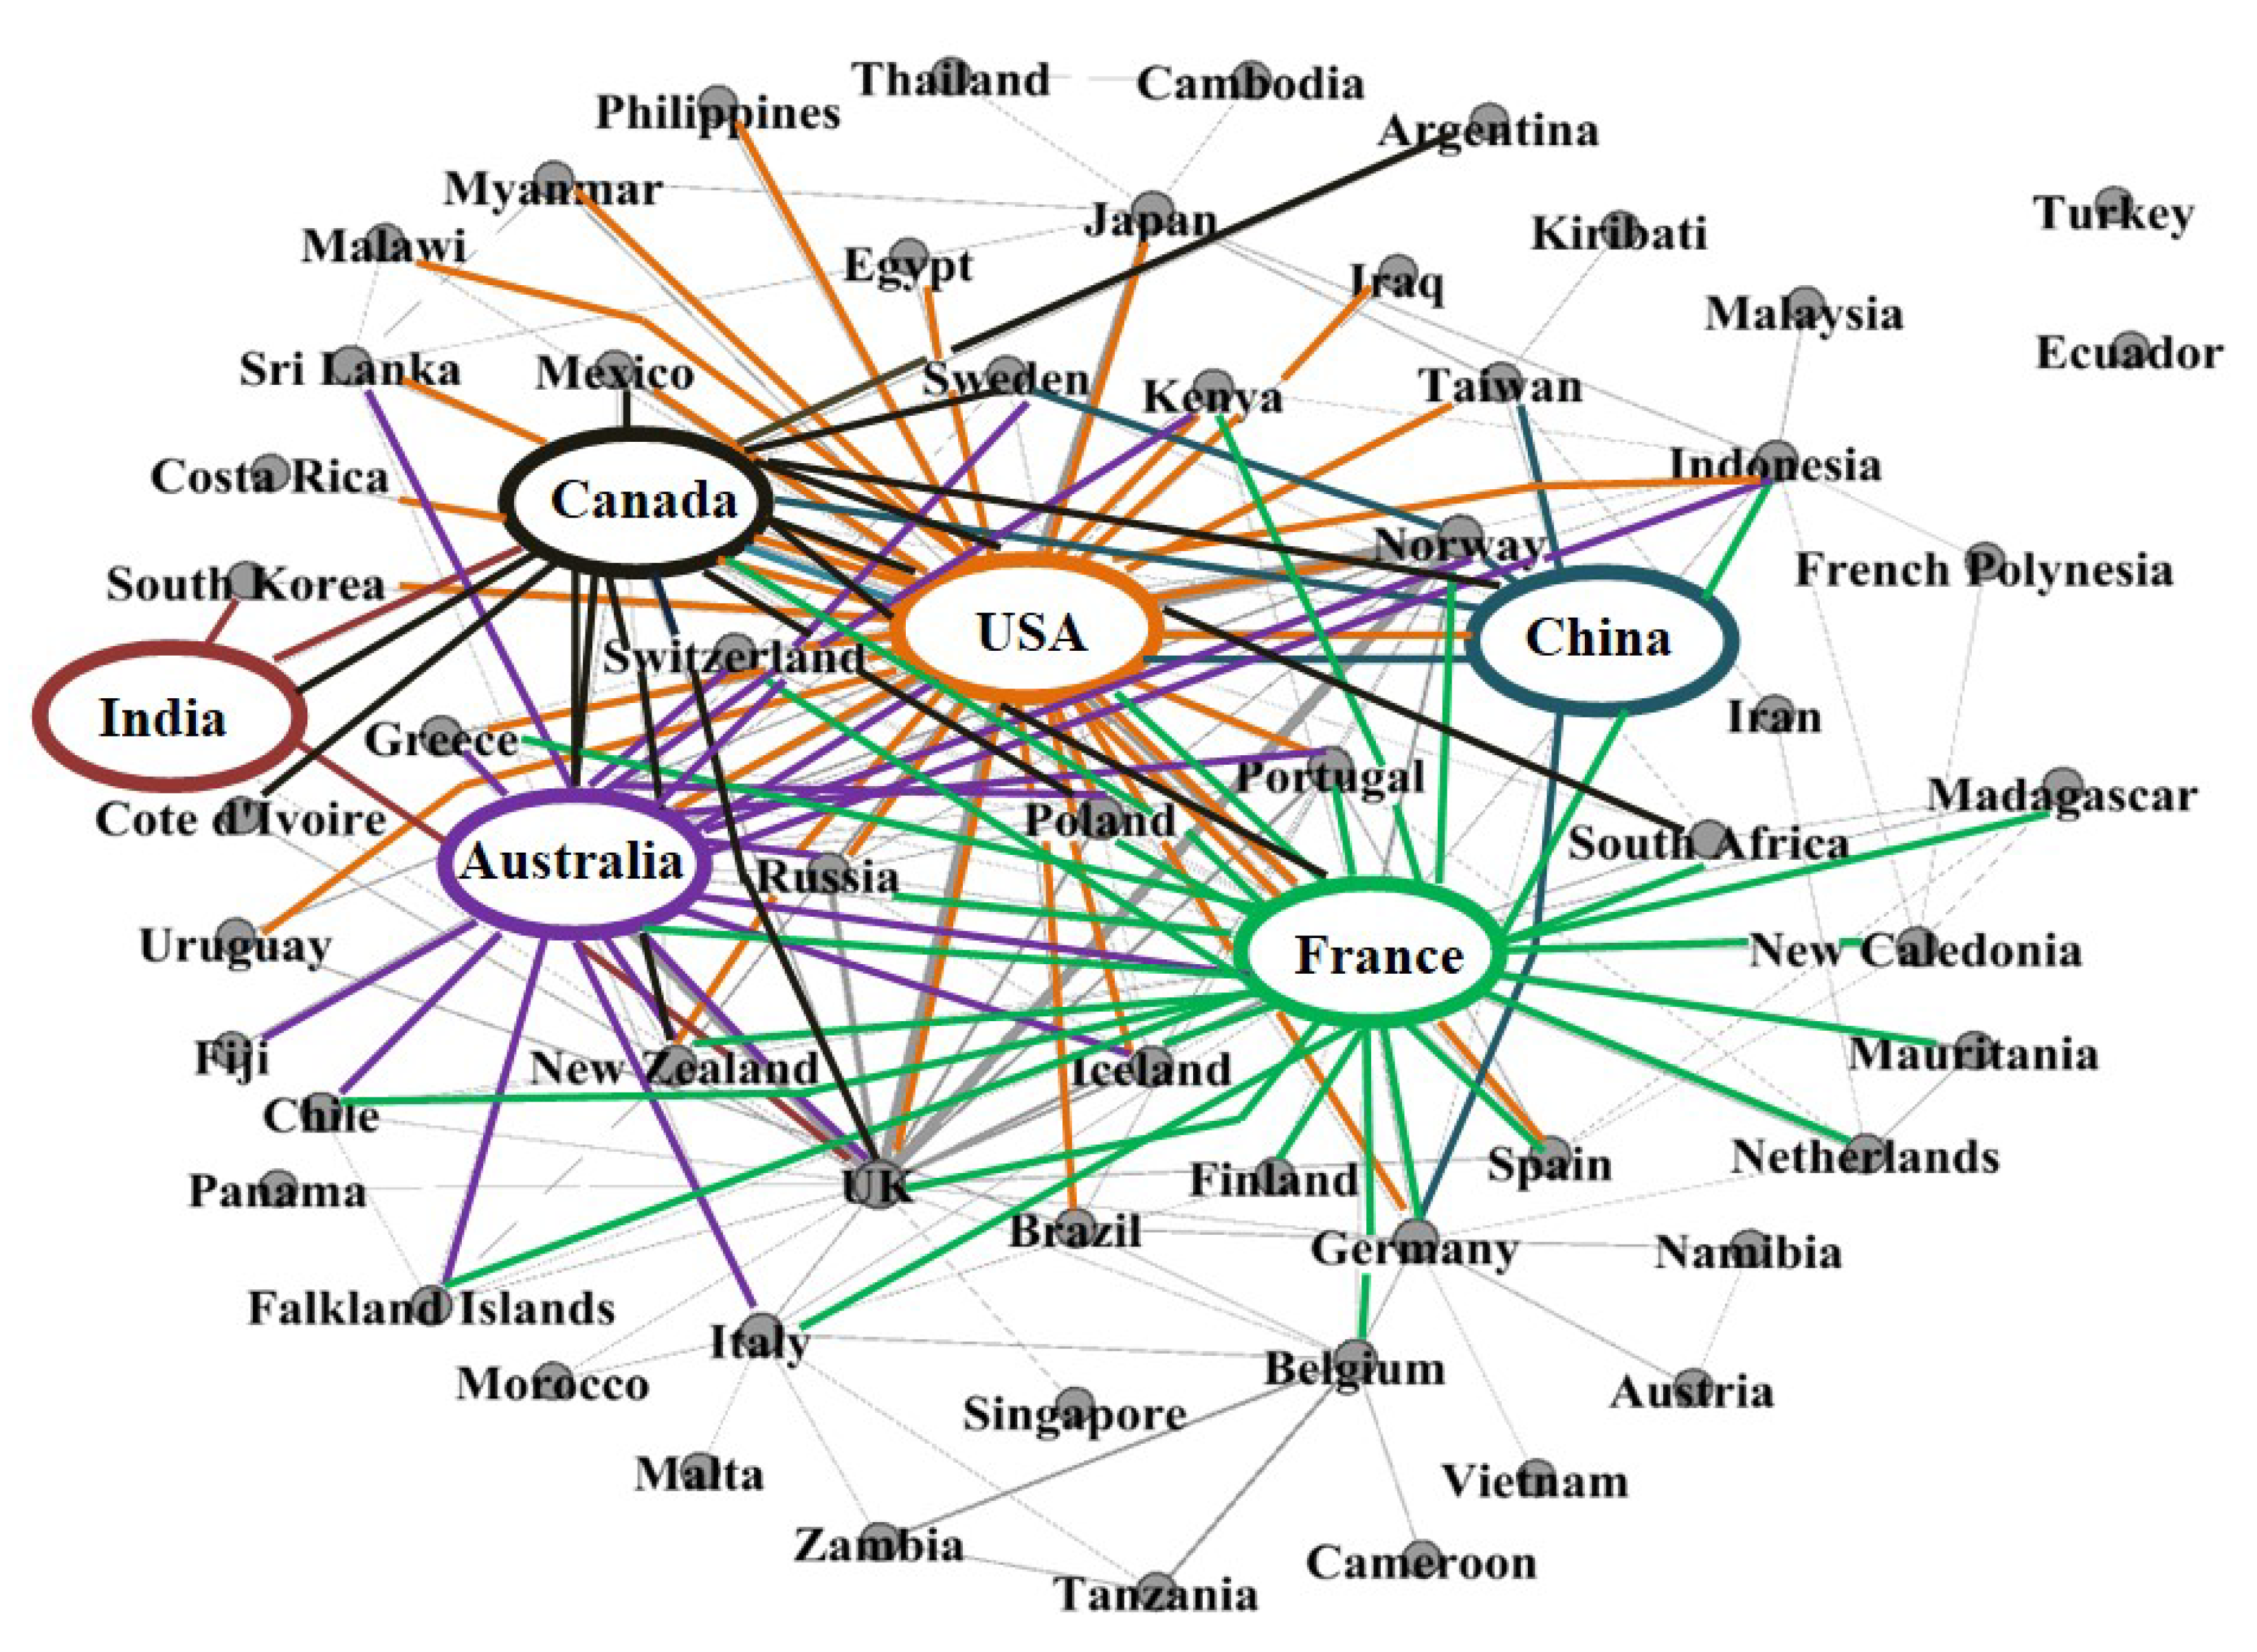
Figure 4.
Network of authors’ collaborations.
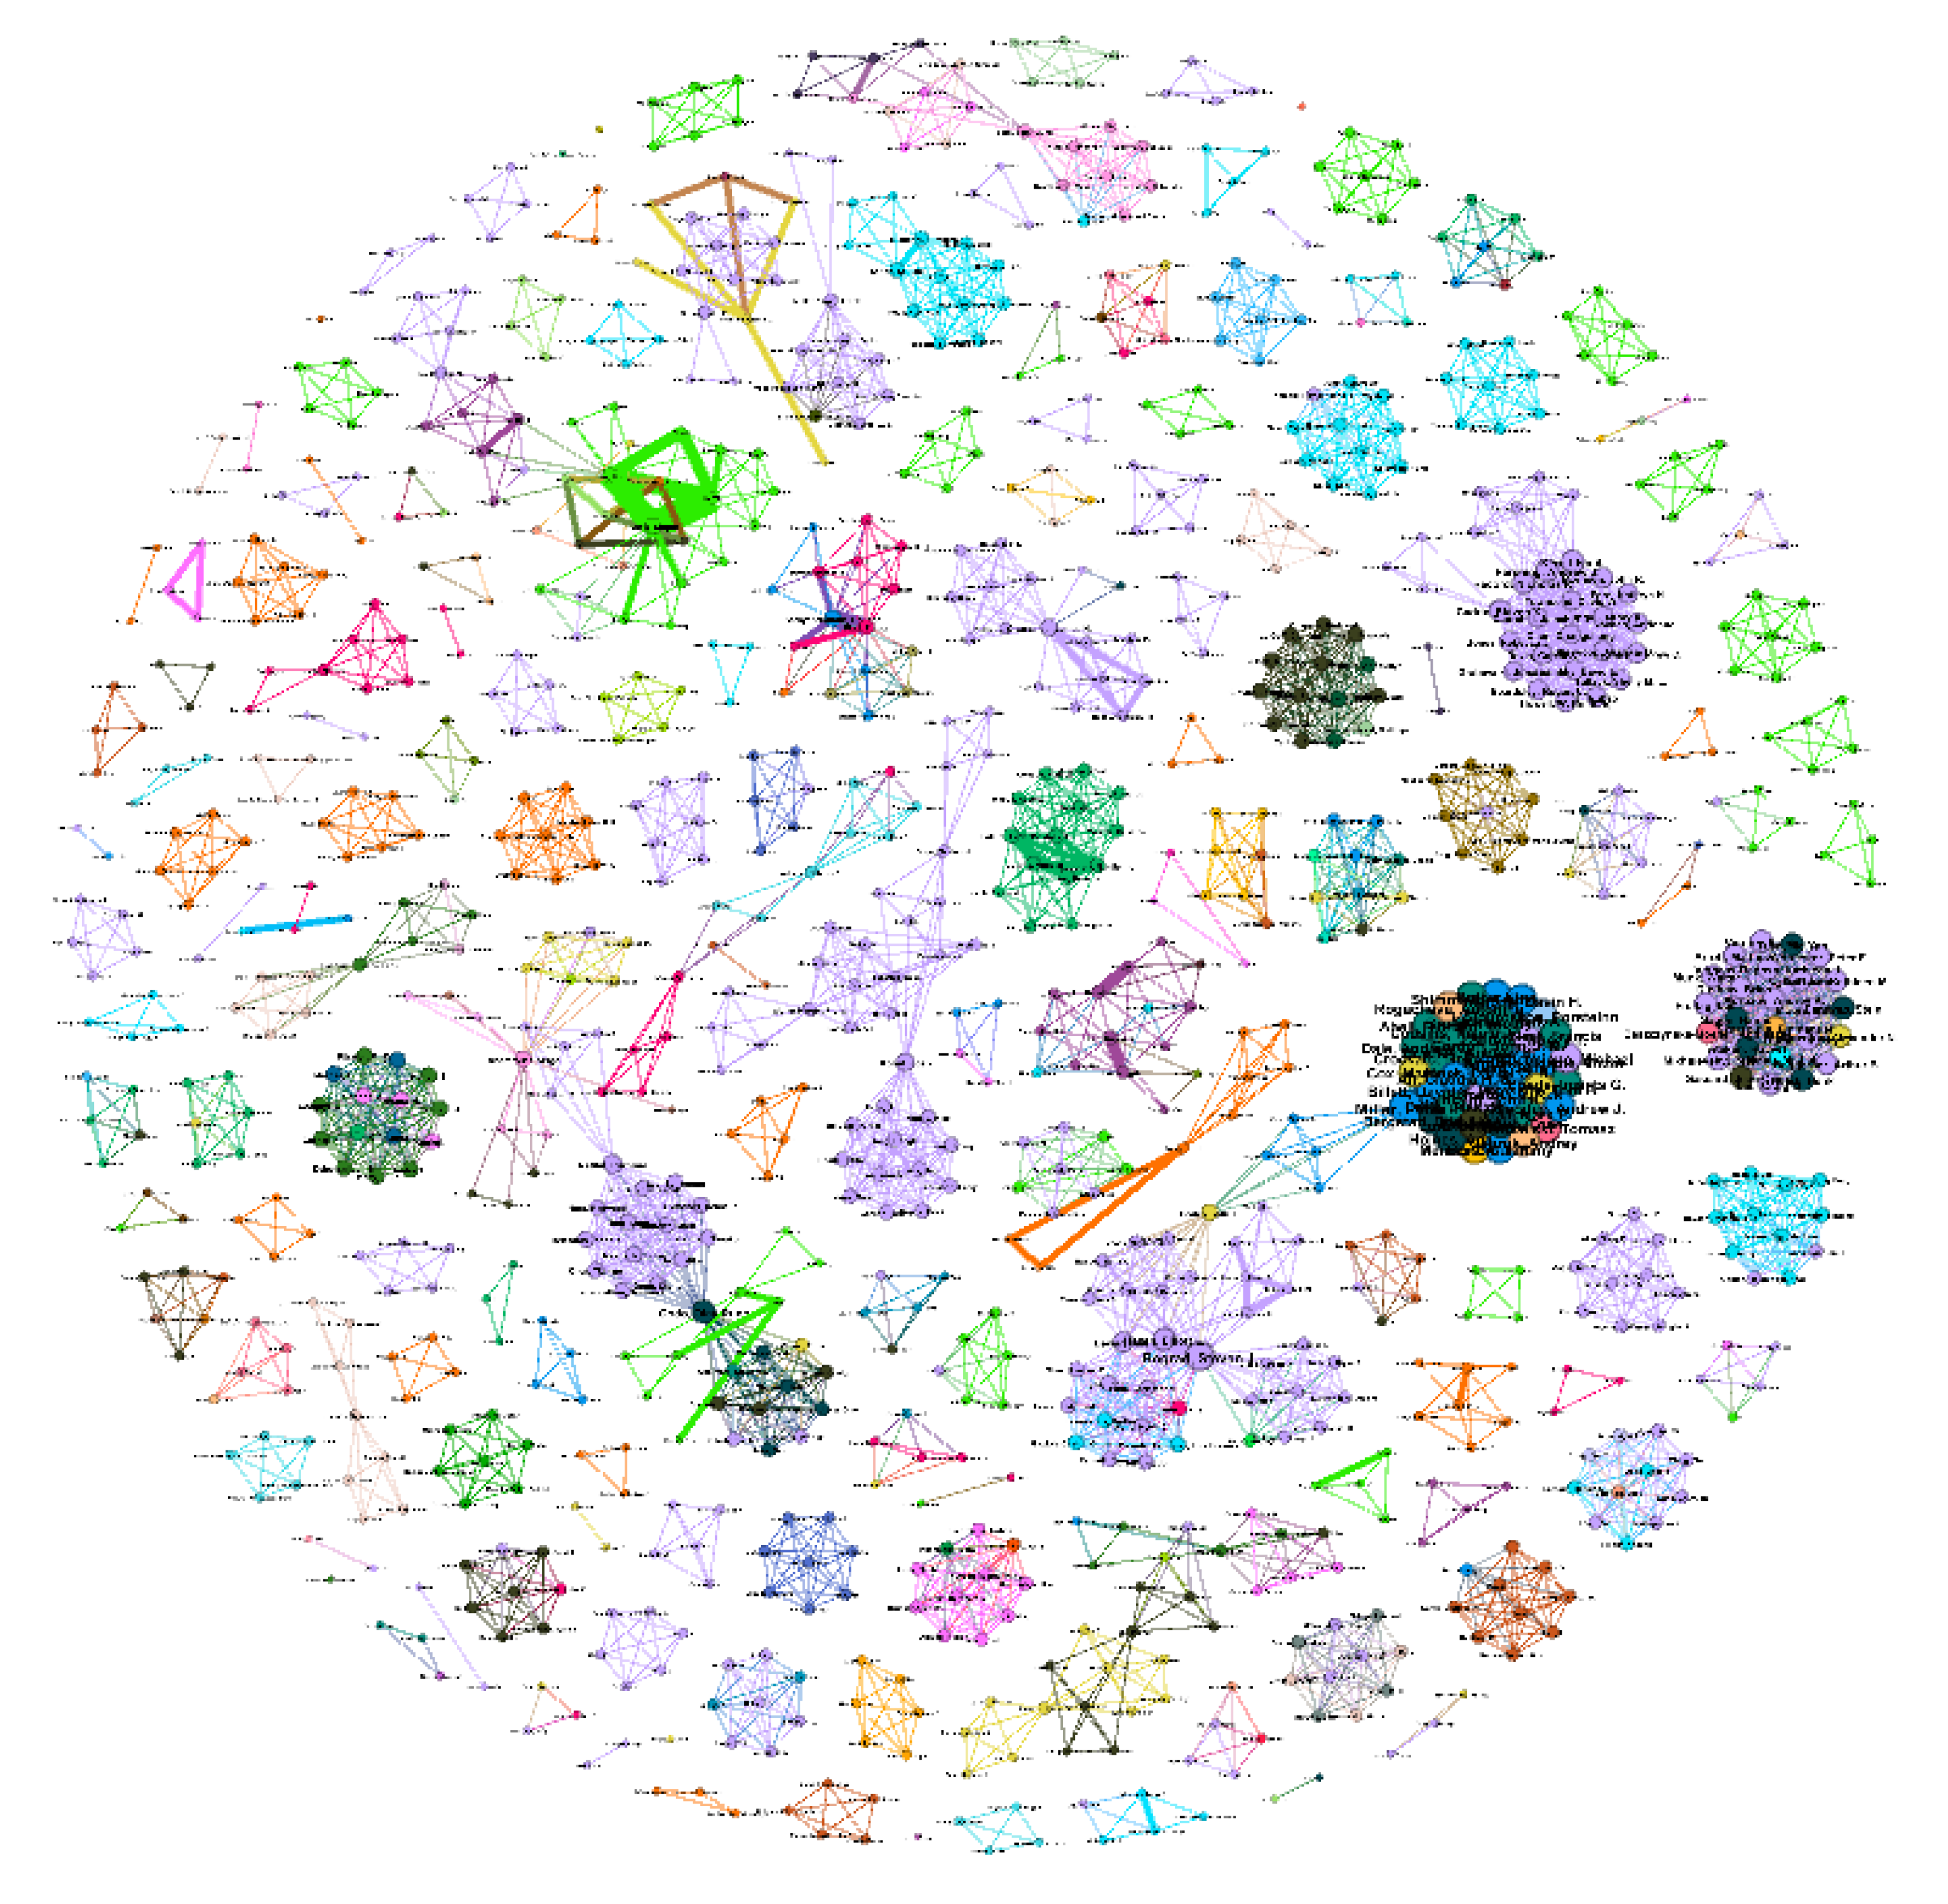
Figure 5.
Geographical hotspots of Remote sensing in fisheries research during 2009–2018.

Figure 6.
This study analyzed the bottom 20 exclusive economic zones in studies of tropical areas. (A) The percentages of exclusive economic zones in tropical and nontropical areas; (B) the percentages of global tropical ocean surface area represented by exclusive economic zones. (* denotes Pacific island countries.)

Table 1.
Comparison of the number of authorships invested in the study field by the top 20 countries and the growth in different time periods from 2009–2018.
Table 1.
Comparison of the number of authorships invested in the study field by the top 20 countries and the growth in different time periods from 2009–2018.
| Country | Total Number of Authorships during the Study Period (2009–2018) | 1st Five-Year Period (2009–2013) | 2nd Five-Year Period (2014–2018) | Growth Rate |
|---|---|---|---|---|
| USA | 366 | 172 | 194 | 13% |
| China | 130 | 30 | 100 | 233% |
| Others * | 115 | 43 | 72 | 67% |
| India | 79 | 25 | 54 | 116% |
| UK | 61 | 42 | 19 | −55% |
| France | 51 | 27 | 24 | −11% |
| Italy | 51 | 23 | 28 | 22% |
| Japan | 45 | 21 | 24 | 14% |
| Australia | 38 | 8 | 30 | 275% |
| Taiwan | 37 | 13 | 24 | 85% |
| Canada | 35 | 16 | 19 | 19% |
| Brazil | 32 | 15 | 17 | 13% |
| Germany | 31 | 12 | 19 | 58% |
| Spain | 28 | 3 | 25 | 733% |
| Belgium | 22 | 18 | 4 | −78% |
| Argentina | 21 | 4 | 17 | 325% |
| Mexico | 17 | 3 | 14 | 367% |
| Norway | 16 | 9 | 7 | −22% |
| South Africa | 15 | 3 | 12 | 300% |
| Philippines | 14 | 0 | 14 | - |
| South Korea | 14 | 9 | 5 | −44% |
| Indonesia | 13 | 0 | 13 | - |
| Turkey | 13 | 7 | 6 | −14% |
| Portugal | 10 | 2 | 8 | 300% |
* including Austria, Cambodia, Cameroon, Chile, Costa Rica, Côte d’Ivoire, Ecuador, Egypt, Falkland Islands, Fiji, Finland, French Polynesia, Greece, Iceland, Iran, Iraq, Kenya, Kiribati, Madagascar, Malawi, Malaysia, Malta, Mauritania, Morocco, Myanmar, Namibia, Netherlands, New Caledonia, New Zealand, Panama, Poland, Russia, Scotland, Singapore, Sri Lanka, Sweden, Switzerland, Tanzania, Thailand, Turkey, Uruguay, Vietnam and Zambia.
Table 2.
List of countries by number of journal articles (2009–2018).
| Rank | Country | International | Domestic | Total |
|---|---|---|---|---|
| 1 | USA | 39 | 45 | 84 |
| 2 | China | 13 | 20 | 33 |
| 3 | India | 2 | 20 | 22 |
| 4 | Australia | 16 | 4 | 20 |
| 4 | France | 17 | 3 | 20 |
| 5 | Canada | 12 | 7 | 19 |
| 6 | UK | 16 | 2 | 18 |
| 7 | Japan | 8 | 4 | 12 |
| 8 | Taiwan | 7 | 4 | 11 |
| 9 | Germany | 8 | 2 | 10 |
| 10 | Brazil | 4 | 5 | 9 |
| 10 | Italy | 6 | 3 | 9 |
| 11 | Spain | 5 | 3 | 8 |
| 12 | South Africa | 6 | 1 | 7 |
| 13 | Belgium and Norway | 6 | 0 | 6 |
| 14 | Argentina | 1 | 4 | 5 |
| 14 | Mexico | 2 | 3 | 5 |
| 15 | Indonesia | 4 | 0 | 4 |
| 15 | Kenya, Malaysia and the Netherlands | 3 | 1 | 4 |
| 1 5 | New Caledonia, New Zealand, Poland, Portugal and Russia | 4 | 0 | 4 |
| 16 | South Korea | 2 | 1 | 3 |
| 16 | Sri Lanka | 3 | 0 | 3 |
| 17 | Cambodia, Fiji, Iran, Madagascar and Sweden | 2 | 0 | 2 |
| 17 | Finland, Singapore and Thailand | 1 | 1 | 2 |
| 18 | Austria, Cameroon, Chile, Costa Rica, Cote d’Ivoire, Egypt, Falkland Islands, French Polynesia, Greece, Iceland, Iraq, Kiribati, Malawi, Malta, Mauritania, Morocco, Myanmar, Namibia, Panama, Philippines, Switzerland, Tanzania, Uruguay, Vietnam and Zambia | 1 | 0 | 1 |
| 18 | Turkey and Ecuador | 0 | 1 | 1 |
| Total | 250 | 139 | 389 |
Table 3.
Top 10 authors with the greatest number of citations or their research (2009–2018).
| Rank | Authors | Title | Total Citation | Publication Year | Level of Collaboration |
|---|---|---|---|---|---|
| 1 | Anderson, D. M. | Approaches to monitoring, control and management of harmful algal blooms (HABs) | 207 | 2009 | Single author |
| 2 | Lavik, G.; Stührmann, T.; Brüchert, V.; Van der Plas, A.; Mohrholz, V.; Lam, P.; Mussmann, M.; Fuchs, B. M.; Amann, R.; Lass, U.; and Kuypers, M. M. | Detoxification of sulphidic African shelf waters by blooming chemolithotrophs | 181 | 2009 | International |
| 3 | Richards, D. R.; and Friess, D. A. | Rates and drivers of mangrove deforestation in Southeast Asia, 2000–2012 | 171 | 2016 | Domestic |
| 4 | Zhu, C.; Zhou, H.; Wang, R.; and Guo, J. | A Novel Hierarchical Method of Ship Detection from Spaceborne Optical Image Based on Shape and Texture Features | 165 | 2010 | Domestic |
| 5 | Hamilton, S. E.; and Casey, D. | Creation of a high spatio-temporal resolution global database of continuous mangrove forest cover for the 21st century (CGMFC-21) | 140 | 2016 | Domestic |
| 6 | Heumann, B. W. | Satellite remote sensing of mangrove forests: Recent advances and future opportunities | 136 | 2011 | Domestic |
| 7 | Murphy, H. M.; and Jenkins, G. P. | Observational methods used in marine spatial monitoring of fishes and associated habitats: a review | 123 | 2010 | Domestic |
| 8 | Pittman, S. J.; and Brown, K. A. | Multi-Scale Approach for Predicting Fish Species Distributions across Coral Reef Seascapes | 117 | 2011 | International |
| 9 | Li, J.; Wang, X.; Wang, X.; Ma, W.; and Zhang, H. | Remote sensing evaluation of urban heat island and its spatial pattern of the Shanghai metropolitan area, China | 114 | 2009 | Domestic |
| 10 | Corbane, C.; Najman, L.; Pecoul, E.; Demagistri, L.; and Petit, M | A complete processing chain for ship detection using optical satellite imagery | 85 | 2010 | International |
Publisher’s Note: MDPI stays neutral with regard to jurisdictional claims in published maps and institutional affiliations. |
© 2021 by the authors. Licensee MDPI, Basel, Switzerland. This article is an open access article distributed under the terms and conditions of the Creative Commons Attribution (CC BY) license (http://creativecommons.org/licenses/by/4.0/).
Share and Cite
MDPI and ACS Style
Yen, K.-W.; Chen, C.-H. Research Gap Analysis of Remote Sensing Application in Fisheries: Prospects for Achieving the Sustainable Development Goals. Remote Sens. 2021, 13, 1013. https://doi.org/10.3390/rs13051013
AMA Style
Yen K-W, Chen C-H. Research Gap Analysis of Remote Sensing Application in Fisheries: Prospects for Achieving the Sustainable Development Goals. Remote Sensing. 2021; 13(5):1013. https://doi.org/10.3390/rs13051013
Chicago/Turabian StyleYen, Kuo-Wei, and Chia-Hsiang Chen. 2021. "Research Gap Analysis of Remote Sensing Application in Fisheries: Prospects for Achieving the Sustainable Development Goals" Remote Sensing 13, no. 5: 1013. https://doi.org/10.3390/rs13051013
Note that from the first issue of 2016, this journal uses article numbers instead of page numbers. See further details here.