Article

Influence of Soil Moisture vs. Climatic Factors in Pinus Halepensis Growth Variability in Spain: A Study with Remote Sensing and Modeled Data

by
Ángel González-Zamora
1,*,
Laura Almendra-Martín
1,
Martín de Luis
2 and
José Martínez-Fernández
1
1
Instituto Hispano Luso de Investigaciones Agrarias—CIALE, University of Salamanca, 37185 Villamayor, Spain
2
Department of Geography and Spatial Planning—IUCA, University of Zaragoza, 50009 Zaragoza, Spain
*
Author to whom correspondence should be addressed.
Remote Sens. 2021, 13(4), 757; https://doi.org/10.3390/rs13040757
Submission received: 23 December 2020 / Revised: 4 February 2021 / Accepted: 16 February 2021 / Published: 18 February 2021
(This article belongs to the Special Issue Feature Paper Special Issue on Ecological Remote Sensing)

Abstract

:
The influence of soil water content on Aleppo pine growth variability is analyzed against climatic variables, using satellite and modeled soil moisture databases. The study was made with a dendrochronological series of 22 forest sites in Spain with different environmental conditions. From the results of the correlation analysis, at both daily and monthly scales, it was observed that soil moisture was the variable that correlated the most with tree growth and the one that better identified the critical periods for this growth. The maximum correlation coefficients obtained with the rest of the variables were less than half of that obtained for soil moisture. Multiple linear regression analysis with all combinations of variables indicated that soil moisture was the most important variable, showing the lowest p-values in all cases. While identifying the role of soil moisture, it was noted that there was appreciable variability between the sites, and that this variability is mainly modulated by water availability, rather than thermal conditions. These results can contribute to new insights into the ecohydrological dynamics of Aleppo pine and a methodological approach to the study of many other species.

Graphical Abstract

1. Introduction

It is generally appreciated that forests, especially those located in water limited areas, are one of the environments most affected by climate change [1]. At the same time, it is well known that ecosystems play a crucial role in the interactions between natural systems that face climate change and the atmospheric system [2]. Forests are directly involved in critical issues for natural systems such as energy balance [3], carbon dioxide budget [4], or freshwater availability [5], and forest evolution is sharply conditioned by climate change.
A better understanding of how environmental factors shape plant function is crucial for predicting the consequences of environmental change for ecosystem functioning [6]. Precise knowledge of the factors controlling vegetation dynamics is also essential for improving ecosystem monitoring [7]. Climatic factors are identified as the main determinants in vegetation distribution, and climate dynamics are considered to drive vegetation shifts in many areas of the world [8,9]. Nevertheless, other factors, such as soil water content or topography and its derived variables, may be of great importance in the interaction of environmental factors affecting forest dynamics [10].
Global warming and the subsequent water scarcity may negatively impact forest productivity in extensive areas in many regions [11]. Forests of the Mediterranean region will be among the most affected because climate change exacerbates Mediterranean stresses [12]. A better understanding of tree growth responses to climate and to other related drawbacks could provide valuable insight into the vulnerability of those forests.
Aleppo pine is the most widespread pine species in the Mediterranean basin [13,14], and therefore is very representative of the bioclimatic conditions in this water-limited environment [15,16]. For these reasons, Aleppo pine has captured the interest of many researchers in recent decades from different points of view and all around the Mediterranean [17,18,19,20]. The study of the influence of environmental factors on the growth of this species has been approached from diverse perspectives, but in most cases has been focused on climatic and terrain variables [21].
For example, in one location in southern Italy, [22] studied Aleppo pine growth compared with weekly precipitation and the integrated temperature excess above 8°C. Ref. [23] analyzed radial growth and wood density profiles with precipitation and temperature variables in one location in southern France. Ref. [24] studied the Aleppo pine forest growth response to climate by analyzing radial growth series and their relationship to precipitation and temperature conditions at different spatial scales. Ref. [25] studied the wood formation process and the intra-annual density fluctuations in Aleppo pines correlated with monthly temperature and precipitation. Ref. [26] analyzed tree-ring widths and wood anatomical features in tree rings under contrasting environmental conditions in Spain and Slovenia. They applied principal component analysis to elucidate the relationship between those tree parameters and climate, based on the monthly mean temperature and the monthly sums of precipitation. Ref. [21] analyzed climatic variables and local site conditions, and concluded that the local water balance was the main factor driving Aleppo pine productivity in their study area in the South of France.
Usually, the few studies in which soil moisture has been used have been conducted using in situ measurements or estimations at the forest stand scale, and with very short-lived series, of a few growing seasons or years. Accordingly, very few studies have been conducted using soil water content as a variable to analyze tree growth dynamics and variability in large areas and with suitable long series. This fact is particularly relevant considering that this variable refers to the volume of water supplied to plants [27], and for that reason, it is generally considered a relevant factor. Annual growth of trees is governed by numerous biotic and abiotic factors, with available soil moisture being one of the most important [28], as has been known for a long time [29]. For example, [30] studied the relationships between climate, soil moisture, and phenology in two woody areas in West Africa using in situ soil moisture monitoring stations. Ref. [31] studied the role of soil moisture, estimated by an ecohydrological model, in Aleppo pine growth-climate relationships in four locations in Spain. Ref. [32] studied the relationship between soil moisture and forest productivity in a small forest catchment in USA using a forest growth model. The need to pay more attention to soil moisture is in line with the finding that climate change will intensify the soil water content deficit in the coming years in many regions of the world [33].
The lack of studies associating these topics with applied soil moisture is mainly due to the difficulty in obtaining soil moisture databases with long series and over large areas. Soil moisture monitoring requires costly sensors, is time consuming and, most of the time, requires direct surveying. In the past, it has been very difficult to obtain long-term observations because monitoring campaigns are usually linked to specific experiments for one or several years, at best. In many cases, only point measurements are available, and they are hardly applicable to areas of interest.
A suitable strategy to overcome these constraints could be the use of soil moisture databases generated by remote sensing, hydrological modeling, or reanalysis. Several satellites are now providing global soil moisture retrieval using both active [34] and passive [35,36] microwave technologies. These satellite missions provide soil moisture products for both the surface and root-zone layer, with suitable revisit times and at a variety of spatial resolutions. Many of these databases still have a limited timespan for use in long-term analysis. However, other satellite databases, such as the Climate Change Initiative (CCI) Soil Moisture [37] series ongoing since 1978, allow long-term analysis for multiple applications. Although it is known that the retrieval of soil moisture with microwave remote sensing is complicated in areas with dense vegetation [38], there are increasing numbers of examples where satisfactory results have been obtained [39,40]. Ref. [41] found that soil moisture estimates from microwave-based active and passive satellites outperform several model-based products over vegetated areas analyzed at global scale. Ref. [42] validated the CCI database under different environmental conditions in the Iberian Peninsula and obtained good results over forest areas (correlation coefficients around 0.9, and very low error and bias values).
Another way to apply soil moisture data in forest studies is to use databases obtained from hydrological modeling or reanalysis. There are many options and modeling approaches that generate soil moisture as a model output and provide databases at a variety of spatial resolutions, with long-term series and for many regions, or even globally [43,44,45,46]. In some cases, a hydrological model has been applied to a specific site [31] to generate soil moisture outputs at forest stand scale. The main limitation is that the required information at the desired scale and location is not always available. A suitable approach to overcome that constraint is the use of available soil moisture databases obtained through modeling [47], and previously validated in the area of interest.
Recently, [48] demonstrated that satellite soil moisture is sensitive enough to track the Aleppo pine growth pattern along the year. The satellite soil moisture was able to detect a bimodal pattern of tree growth with a maximum in May and a secondary peak in autumn. This temporal pattern was much clearer than that obtained using the modeled soil moisture or the precipitation. The study showed that, despite the limited spatial resolution of microwave satellite databases, the products that are available, such as CCI, can be useful for ecohydrological analysis and monitoring of this species. The opportunity to access global and daily root-zone soil moisture via satellite databases provides a huge advantage over other approaches that have been used so far.
The main goal of the present study was to investigate the role of soil moisture to explain the variability of the Aleppo pine growth in 22 locations in Spain, with different environmental conditions, from the north to the south of the country. With the aim of analyzing the influence of soil moisture on tree growth, several statistical approaches were applied, and two soil moisture databases, one from satellites and one from modeling, were used for the first time. Accordingly, another goal of the work was to study the influence of soil moisture compared with several climatic variables commonly used in this kind of studies. The climatic variables and indicators analyzed were minimum and maximum temperature, precipitation, standardized precipitation index (SPI), and potential evapotranspiration (PET). Finally, the role of soil moisture on tree growth was analyzed based on the climatic characteristics of each location, to study whether there is environmental modulation of the influence of the soil water content on Aleppo pine phenology.

2. Dataset and Study Area

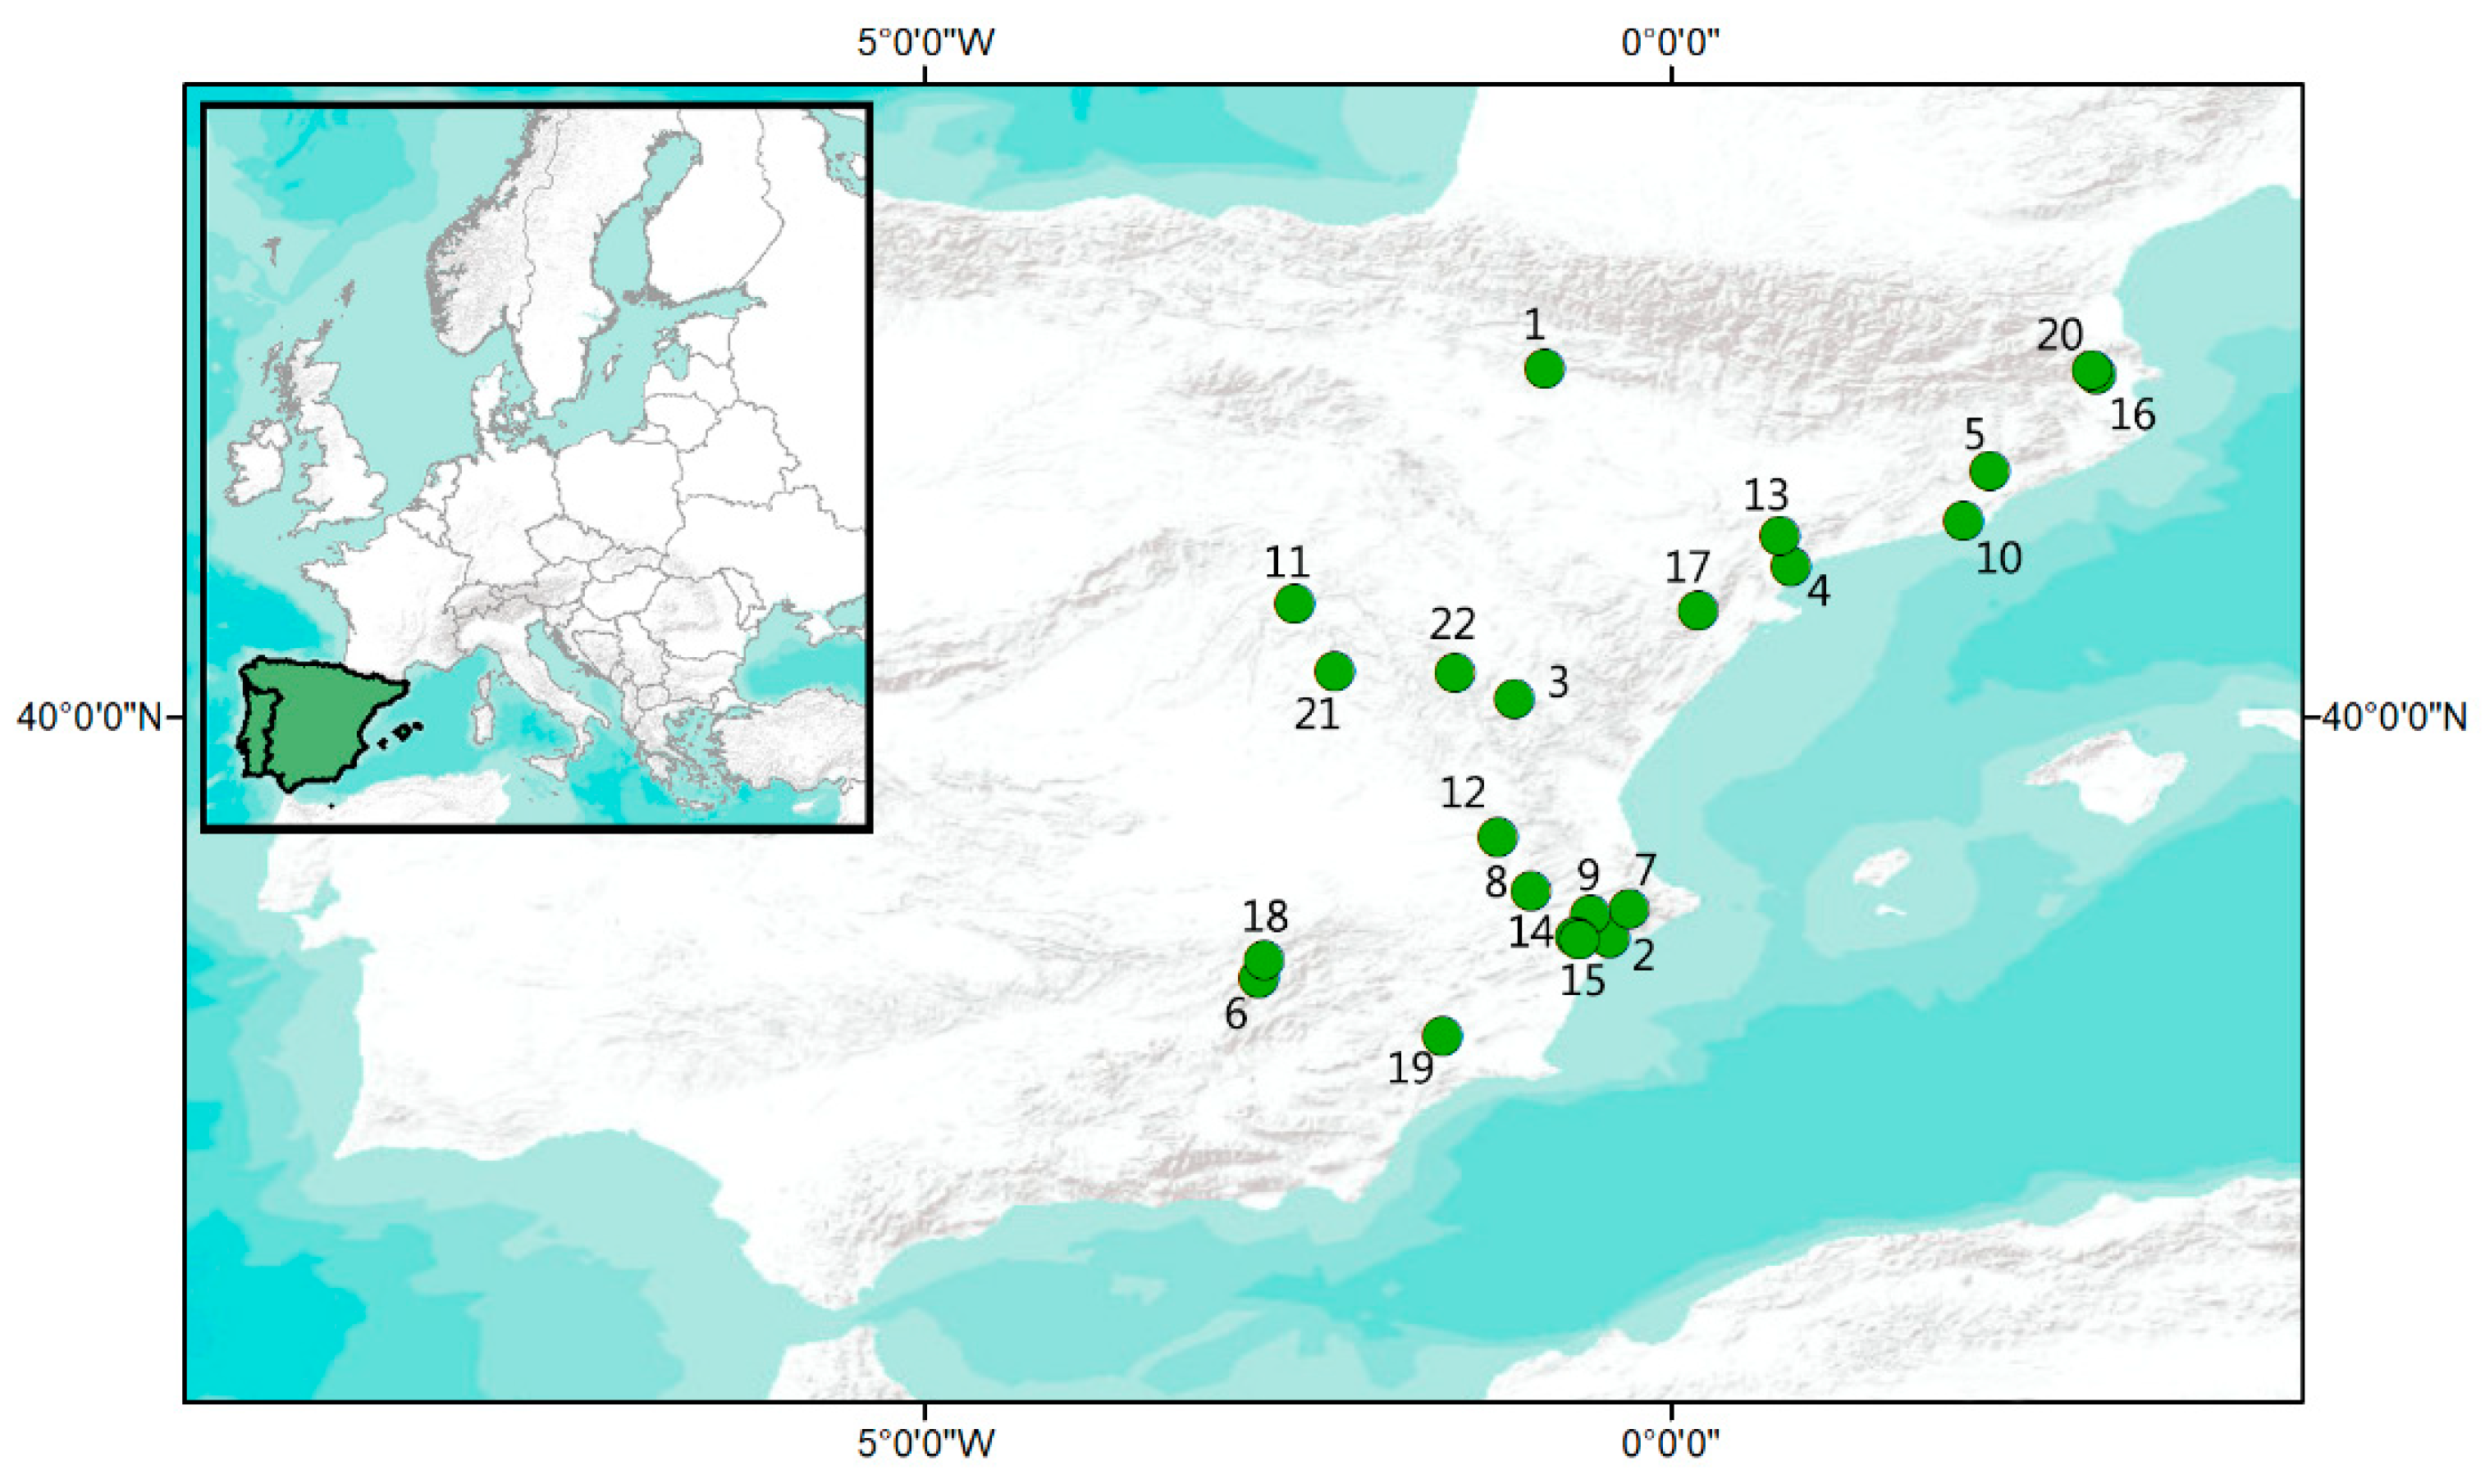
2.1. Tree Samples and Study Area

We used a previously developed dataset, selecting the annual tree-ring width series of 22 Aleppo pine forest stands covering a wide range of environmental conditions across the Iberian Peninsula (Figure 1 and Table 1). Site selection was based on the homogeneity of the forestland cover and soil conditions (marls and limestone) at the sampled sites [48]. In each forest site, a total number ranging from 15 to 40 dominant or co-dominant Aleppo pine trees, separated by at least 10 m, with no obvious signs of damage or disease, were sampled. Trees were cored at 1.3 m height, at two perpendicular directions, using Pressler increment borers.
Thus, using the annual tree-ring width series of 22 Aleppo pine forest stands, the dendrochronological database was derived using standard dendrochronological protocols [49]. Then, for each forest, a ring-width index (TRI) chronology was constructed by detrending tree-ring width measurements to eliminate the biological age trend in the radial growth. To preserve the inter-annual scale variability and eliminate the age-related trend in the radial growth, we standardized the individual tree-ring width series data were standardized using the ARSTAN program [49]. The long-term trends were removed using a negative exponential function followed by a cubic smoothing spline with a 50% cutoff frequency and a 30-year response period [15,49]. The autocorrelation filter was then applied to the detrended series to remove correlations between consecutive measurements and to obtain residual series containing only the high-frequency variations in year-to-year growth series. Finally, a bi-weight robust estimation of the mean was applied to construct each local residual chronology [50].

2.2. Soil Moisture

For this study, two soil moisture databases from satellites and modeling have been used. The first one corresponds to version 4.4 of the CCI Soil Moisture Combined product satellite database [51]. From the three different CCI soil moisture products available, the combined product was selected for this study because it is the longest satellite database, and it has given the best results in validations conducted worldwide, including the Iberian Peninsula [42,52]. This database provides daily surface soil moisture from seven passives and four actives satellites that have soil moisture measurements from November 1978 to June 2018 over a regular 25 km × 25 km grid. A detailed description of the algorithm used to obtain this product from the merge of the L2 products of these eleven satellites can be found in [37,53]. In this research, the pixels corresponding to the 22 tree samples were selected, and the surface soil moisture data was filtered applying the soil moisture flag (‘no data inconsistency’), in order to use the values with highest quality. Once the surface soil moisture time series from the CCI database were selected and filtered, the Soil Water Index (SWI) model [54] was used to obtain the soil moisture in the root zone. This model only uses as input the surface soil moisture and a parameter T related to the water time travel through the soil profile. To obtain this parameter, the SMAP L4 Surface and Root Zone product [55], which provides daily surface and root zone (0–100 cm depth) soil moisture over a regular grid of 9 km × 9 km from March 2015 to December 2019, was used. From this product, the surface and root zone soil moisture time series corresponding to the 22 tree samples were selected. Then, the surface soil moisture was used as input in the SWI model, and the T parameter was varied from 1 to 100 days to obtain 100 root zone soil moisture time series for each tree sample. These 100 root zone time series from the SWI model were compared with the root zone soil moisture from the SMAP L4 product to select the best T parameter for each tree sample based on the highest correlation, according to the study of [56]. Once the best value of T was selected for each tree sample, this parameter, together with the surface soil moisture time series from the CCI combined product, was used in the SWI model to obtain the CCI root zone soil moisture time series of the first 100 cm depth.
The second soil moisture database used in the present study is the set of soil moisture estimations from the Lisflood (LF) model [47]. LF is a spatially distributed hydrological rainfall-runoff model developed by the floods group of the Natural Hazards Project of the Joint Research Centre (JRC) of the European Commission [57]. LF was validated by [58] along Europe, with satisfactory results over the Iberian Peninsula. The soil moisture provided by this model is used by the European Drought Observatory (EDO) monitoring system. This hydrological model provides daily soil moisture data at three different layers with a spatial resolution of 5 km × 5 km and is available from January 1991 to December 2018. Only the time series of the first two layers, named the topsoil [59], were selected for the pixels corresponding to the 22 tree samples. The average of these two layers was considered the root zone soil moisture, assuming a soil volume similar to that of the CCI root zone, i.e., 0–100 cm depth, and in accordance with the root zone depth of the Aleppo pine [60].
These two databases were compared in a previous study [48], and have been widely used in studies with different soil moisture applications [61,62,63,64].

2.3. Precipitation and Temperature

Precipitation and temperature are the climatic variables most commonly used in studies of the impact of environmental factors on tree growth and phenology [65,66] in general and of Aleppo pine growth specifically [20,26,67]. The precipitation and temperature data used in the present study were obtained from the Spanish PREcipitation At Daily scale (SPREAD) and Spanish TEmperature At Daily scale (STEAD) databases, respectively [68,69]. Both databases are provided on a 5 km × 5 km resolution grid over the Iberian Peninsula, with daily data for precipitation, maximum temperature, and minimum temperature. Both databases were created with measurements from more than 12,000 meteorological stations with reference values through generalized linear models. These were based on the 10 closest measurement stations using latitude, longitude, and altitude as covariates. A detailed description of this computational process to reconstruct the original daily precipitation time series can be found in [68]. These two datasets have been widely validated and used in many works since they are the spatially distributed databases for these two variables with the greatest temporal coverage (1950–2012 for precipitation, 1901–2014 for temperature) over the Iberian Peninsula [69,70,71,72].
As for the soil moisture databases, only the time series of precipitation and maximum and minimum temperature pixels corresponding to the 22 locations of the tree samples were used in this research.

2.4. Standardized Precipitation Index (SPI)

The SPI is a meteorological drought index [73] and is calculated from the historical record of the precipitation collected at a location, where the accumulated precipitation during a specific study period is compared with the same period of time throughout the long-term record history in the same location. This index is considered by the World Meteorological Organization as the universal reference meteorological index [74].
The SPI generator application from the National Drought Mitigation Center (NDMC) (https://drought.unl.edu/droughtmonitoring/SPI/SPIProgram.aspx, accessed on 22 December 2020) of the University of Nebraska was used to calculate the SPI-1. The SPI obtained in this study is based on a representation of the historical record of precipitation with a gamma distribution, where the positive values of SPI correspond to wet conditions, while the negative values correspond to drought conditions. The long-term time series, from 1950 to 2012, of SPREAD precipitation data from the 22 locations of the tree samples were used as input to obtain the monthly value of SPI-1 in those locations. Only SPI-1 was analyzed, since only daily and monthly temporal scales were considered for the rest of the climatic variables used in this study. SPI was used even though precipitation itself was also included because SPI is a suitable indicator of precipitation anomalies.

2.5. Potential Evapotranspiration

Evapotranspiration is an essential variable in the water balance and clearly identifies the interaction of vegetation in the hydrological system. It is also well known that evapotranspiration is decisively involved in the growth of trees in different ecosystems [65]. In the present work, PET was correlated with Aleppo pine growth with the aim of studying whether a temporal pattern or a critical period exists.
The Climatic Research Unit gridded Time Series (CRU TS) v4.03 is a database that provides monthly data of a set of climatic variables over a regular 0.5° × 0.5° grid from 1901 to 2018 [75]. Due to this long-term time series, this dataset has been widely used in different climatic studies worldwide [76,77,78]. For this study, PET time series from the CRU TS were obtained from the pixels corresponding to each tree sample. This variable is calculated through the Penman-Monteith equation [79,80].
Prior to analysis, and to test the suitability of using PET with such a spatial resolution, CRU PET data were validated in all sampling sites. As sufficient climatic information was not available in these areas for using the Penman-Monteith method, PET was calculated with the STEAD database and the Thornthwaite method. The result of the comparison between CRU PET and PET-Thornthwaite was very satisfactory, with an average R2 of 0.93. Finally, in this study, CRU PET was used considering that the Penman-Monteith method has more physical basis.

3. Methods

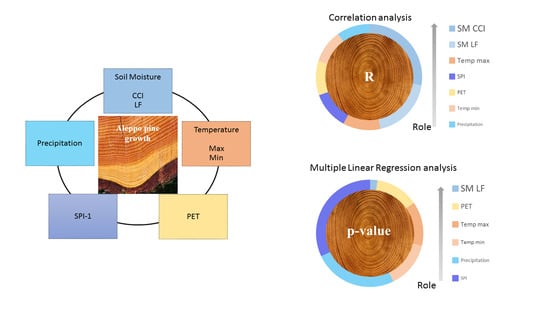
3.1. Correlation Analysis

In order to study the role of soil moisture and climatic factors in Aleppo pine growth and identify any temporal patterns, a correlation analysis was performed between the annual TRI series and the different variables considered in this study. For this, Pearson’s correlation coefficient (R) was calculated, and the statistical significance was settled for p-values < 0.05. This analysis was carried out at daily and monthly temporal resolutions and applied to a study period spanning from January 1979 (January 1991, in the case of LF) to December 2012.
For the analysis at daily resolution, the soil moisture from both LF and CCI, precipitation, and maximum and minimum temperature series were analyzed. The daily time series of these variables were obtained by averaging the original daily time series with a 30-day moving window. These values were only computed for those days when at least half of the data in the window were available. By doing so, the variability of the original series was smoothed, and the time patterns could be identified more clearly. Then, the annual TRI series were correlated with the series of each day from the beginning of the hydrological year, i.e., from 1st October of the previous year, to 31st December of the corresponding year, as in [48]. Thus, 457 R values were obtained for each tree-ring chronology. In this way, it is possible to identify any temporary pattern for each of the variables. Finally, the monthly median of the 22 R values and the percentage of significant results for each day were also calculated with the aim of simplifying and improving the representation of the results.
The same analysis was carried out for the monthly series. For the variables with daily resolution series, monthly values were obtained by calculating the average in those months where at least half of the daily data were available. The variables used for this case were soil moisture from both LF and CCI, precipitation, maximum and minimum temperature, SPI-1 and PET. The annual TRI series were correlated with the series of each month from October of the previous year to December of the corresponding year. Thus, 15 R values were obtained for each study site. In the same way, the median of the 22 resulting R data sets and the percentage of significant results for each month were also calculated, similar to the approach for the daily scale. In addition, for this analysis, the standard deviation between samples for each month was calculated.
With the aim of investigating whether the relationship between soil moisture and Aleppo pine growth dynamics is modulated by environmental conditions or whether that relationship follows a geographical pattern, the R (LF vs. TRI) data obtained were correlated with the mean annual temperature, maximum temperature, minimum temperature, precipitation (P), potential evapotranspiration (PET), P/PET ratio (aridity index), and altitude, latitude, and longitude of every forest site.

3.2. Multiple Linear Regression Analysis

With the aim of analyzing the influence of soil moisture on tree growth compared with climatic variables, a multiple linear regression (MLR) analysis was performed. Monthly series were used; the independent variables that were incorporated into the MLR model were the soil moisture, precipitation, SPI, PET, and maximum and minimum temperature; and the dependent variable was the TRI. Due to the data gaps in the CCI database during the first half of the series, and therefore the difficulty of obtaining a sufficiently long monthly series, this analysis was only performed with the LF database. Multicollinearity between independent variables is identified as a problem when trying to study influences on a dependent variable [81]. The variance influence factor (VIF) can detect the presence of multicollinearity. Therefore, in order to avoid this issue, different MLR analyses combining the independent variables were performed with the most correlated variables omitted and ensuring a VIF < 5 for the remaining variables [82]. This resulted in six different MLR analyses in which the soil moisture was maintained with the precipitation or SPI and the PET, maximum temperature or minimum temperature. For each analysis, the p-value was calculated for each independent variable, thus obtaining its importance in the MLR model. Therefore, a monthly p-value was obtained for each variable and each sample from October of the previous year to December of the corresponding year. Finally, the median of the 22 resulting p-values and the percentage of p-values < 0.05 for each variable for each month were also calculated.

4. Results

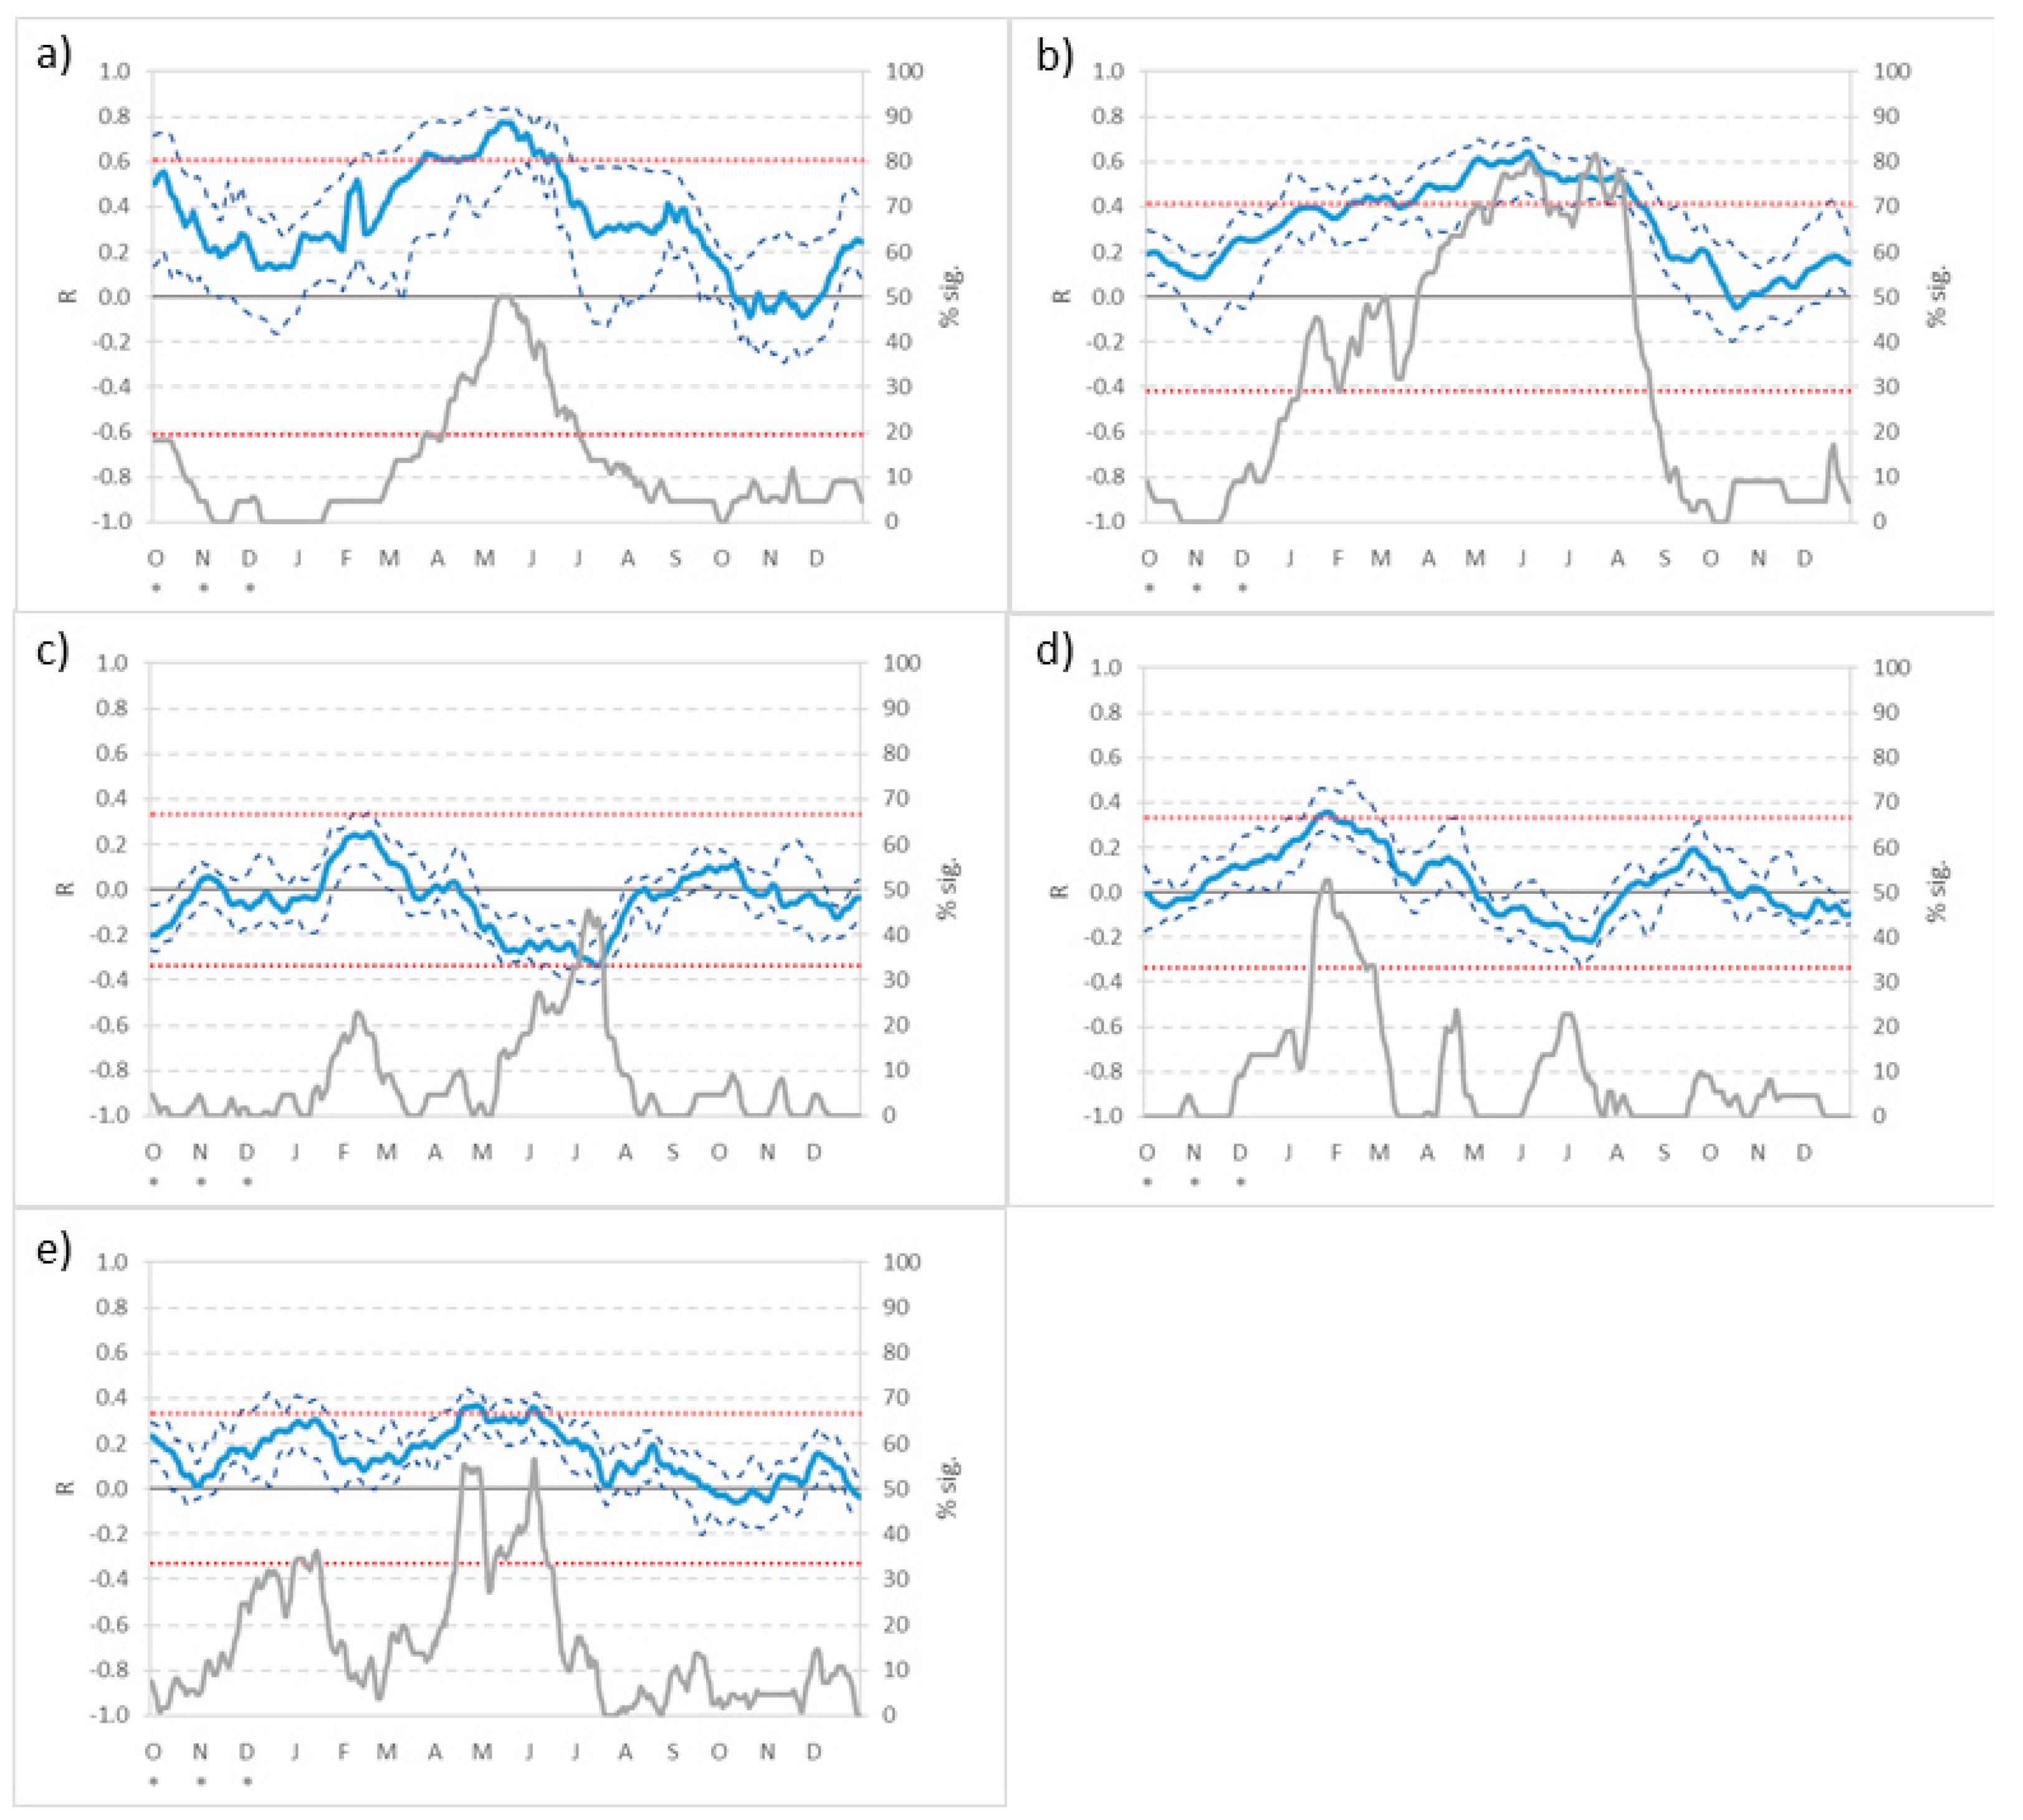
4.1. Analysis of the Influence of Soil Moisture and Climatic Factors

Figure 2 shows the temporal pattern of the relationship of each of the climatic variables studied with Aleppo pine growth, with soil moisture, from both CCI and LF, being most highly correlated along the seasonal cycle.
For the satellite soil moisture database, the maximum correlation was obtained during spring, i.e., from April to June, along with the increment in significant cases. The maximum of both median R value (0.78) and number of significant cases (50%) was reached in mid-May. In addition, all correlation coefficients exceed the significance level during these months. Ref. [31] obtained similar R values for Aleppo pine samples located in semiarid areas of the southeast Iberian Peninsula. A secondary peak was also observed in October of the previous year, with R values at approximately 0.5; although it does not reach the level of significance, it coincides with an increase in the number of significant samples, as seen in [48]. These results detecting this secondary peak are in agreement with those obtained in the study carried out by [83]. These authors found two growth phases in Aleppo pine, coinciding with the critical soil moisture periods detected in this study. The first one was observed in spring, the period of maximum correlation of soil moisture. The second one was observed in autumn, coinciding with the time when the soil water recharge occurs under this kind of climate condition.
For the LF database, the period with highest correlation spans from April to August, with correlations ranging from 0.4 to 0.6, reaching 80% of significant cases. This period, identified as critical for the Aleppo pine growth, starts in spring, as shown for the CCI database, but lasts until mid-summer. However, the secondary peak was not detected by LF. This might be because the LF model was not able to adequately reproduce the soil water recharge that takes place after the summer under Mediterranean conditions. In fact, ref. [31], which also used modeled soil moisture, found both the main spring period extending to mid-summer and the secondary autumn peak seen with the CCI database. Regarding the number of significant samples, the difference obtained between the two soil moisture databases might be due to the smaller number of data points available in the CCI database along the first half of the series. Another difference observed between the two sets of soil moisture database results is the variability between samples. The 25th and 75th percentiles of the correlation coefficient with the LF database differ from the median by between 0.2 and 0.3 for the whole period, while with the CCI database, this difference reached 0.7 in mid-July days. This might be related to the different spatial resolutions of the two products used.
When the climatic variables were considered in the daily temporal scale analysis, the R values obtained did not exceed 0.4 in either case (Figure 2c,d,e). Some temporal patterns can be observed in the relationship of these factors with the growth of Aleppo pine when an increase in the correlation coefficients coincides with an increase in the number of significant samples. Nevertheless, these correlations are weaker than those obtained for soil moisture, and the variability found between the different samples was also smaller than that obtained for this variable. The precipitation showed a peak of correlation between May and June (R = 0.37), exceeding the significance threshold on a few days, but was much lower than that obtained during the critical period identified with soil moisture. This correlation vanishes in summer, coinciding with the period when the cambial activity of the pine ceases due to dry conditions [25,83]. In the study carried out by [31], it was observed that the precipitation also showed a high correlation with tree growth in spring months. Ref. [84] determined that this variable was the main factor influencing the Aleppo pine growth with correlation values of approximately 0.4 in spring. In addition, [85,86] obtained similar results in the south of the Iberian Peninsula, as did [87] in the northeast. A similar temporal pattern was obtained by [88] for Aleppo pine trees located in Greece. This period, when precipitation seems to have more influence on tree growth, coincides with the period observed to coincide with soil moisture in those months when it seems to be more determinant. However, all the R values obtained for precipitation in the previously cited works, and in this study, are lower than those obtained for the soil moisture, both with CCI and LF.
In the case of temperature, a temporal pattern of correlation can be seen, with two peaks of relative importance, but moderate R values (Figure 2c,d). The first one, with positive R values (0.36), is observed with the minimum temperature in February, and the second peak, with negative R values (−0.34), is observed with the maximum temperature in July. Similar results were obtained in other works [31,86,89,90,91,92]. This implies that high temperatures have a negative influence on the growth of Aleppo pine in summer, while warm minimum temperatures have a positive influence in winter [87,93]. This could be in agreement with the well-described plasticity in the annual rhythms of cambial activity of the Aleppo pine in response to seasonal climatic variations [83,94,95]. Thus, the growth of the species during the growing season is usually subject to ‘‘double stress’’, characterized by two stops or slowdowns in cambial activity, one during winter, caused by low temperatures, and one during the summer, triggered by high temperatures and a lack of precipitation [96,97].
Temperature has been an environmental factor commonly used to explain the variability of Aleppo pine growth. Correlation values similar to those obtained in the present study were obtained in other works [89,90,92]. However, the results obtained both in this study and in those cited above, indicated less correlation than that obtained with the soil moisture.
The results obtained at monthly temporal resolution (Figure 3) showed similar temporal patterns to those obtained with the daily analysis. Once again, soil moisture was the variable that was the most highly correlated with Aleppo pine growth, and this was seen with both CCI and LF. The maximum correlation period in this analysis was identified from April to June with the CCI database, while with LF, it extended to August. Moreover, the R median values were greater for the CCI database during the period when soil moisture seems to be critical for Aleppo pine growth. However, the secondary peak observed in autumn with the satellite database in the previous analysis was not clearly observed here. For LF soil moisture results, both correlation coefficients and significant cases lightly decreased for the entire period at this time resolution. This would indicate that daily scale would be preferable as the temporal scale for this kind of analysis, as critical periods could be shorter than one month. Ref. [31], using the same time scale for their analysis and modeled soil moisture, obtained stronger correlation results than the LF results and similar results to those of the CCI, but using different soil depths (from 30 to 50 cm). When the variability of the results between samples was studied, for CCI, the standard deviation ranged between 0.4 to 0.2, while in LF, these values ranged between 0.3 and 0.2 throughout the period, similar to that obtained in the daily scale analysis. In addition, when the CCI soil moisture reached its maximum correlation values, a decrease in the standard deviation was observed, indicating that soil moisture has a more homogeneous influence on Aleppo pine growth between samples during this period.
As in the analysis carried out at the daily scale, this analysis also showed a lower relationship between climatic variables and TRI series than those obtained with the soil moisture (Figure 3). The R values obtained were always lower than 0.3, and barely 40% of significant samples were found in those months where R reaches its maximum value. Regarding the variability, an almost constant standard deviation ranging between 0.1 and 0.2 was observed for the climatic variables, exceeding in several months the mean R value, similar to the variability results obtained in the study by [24]. Precipitation and maximum and minimum temperature reached the maximum correlation coefficients in the same months as in the daily analysis, although with lower values: 0.25, -0.29, and 0.26, respectively. PET reached its maximum correlation in February (R = 0.23) and July (R = −0.26), coinciding with the periods of maximum correlation for both maximum and minimum temperatures. The correlation values obtained were similar to those obtained with precipitation and temperatures; however, these maximum correlations were not even half of that obtained for soil moisture. In the case of SPI, the variable reaches its maximum correlation values in January and May (R = 0.28 in both cases). Recently, several drought indices have been used to study the impact of extreme climatic situations on tree growth, and in some cases, a temporal pattern was detected [92,98,99,100,101]. In the present study, no temporal pattern was clearly identified with this variable, but the results obtained were consistent with those obtained by [102]. The Aleppo pine has been shown to be more resistant to more extreme drought conditions than other pine species [92]. However, it is interesting to highlight that an increase in this variable indicates better conditions in terms of water availability and positively affects tree growth [100]. The results obtained in the present study show a slight influence of this precipitation anomaly in winter and spring periods, although its relevance is much lower than that observed for soil moisture itself.
Therefore, the critical period for soil moisture coincided with the period when the maximum correlation values of precipitation and SPI were reached. However, the correlation of the climatic variables at any temporal scale was even less than a half of that obtained with both soil moisture databases. The results of the correlation analysis seem to indicate that the fundamental variable for Aleppo pine growth is water availability, and the key variable seems to be the soil water content [100]. This becomes more evident for the spring and mid-summer, coinciding with the growth phases [83].

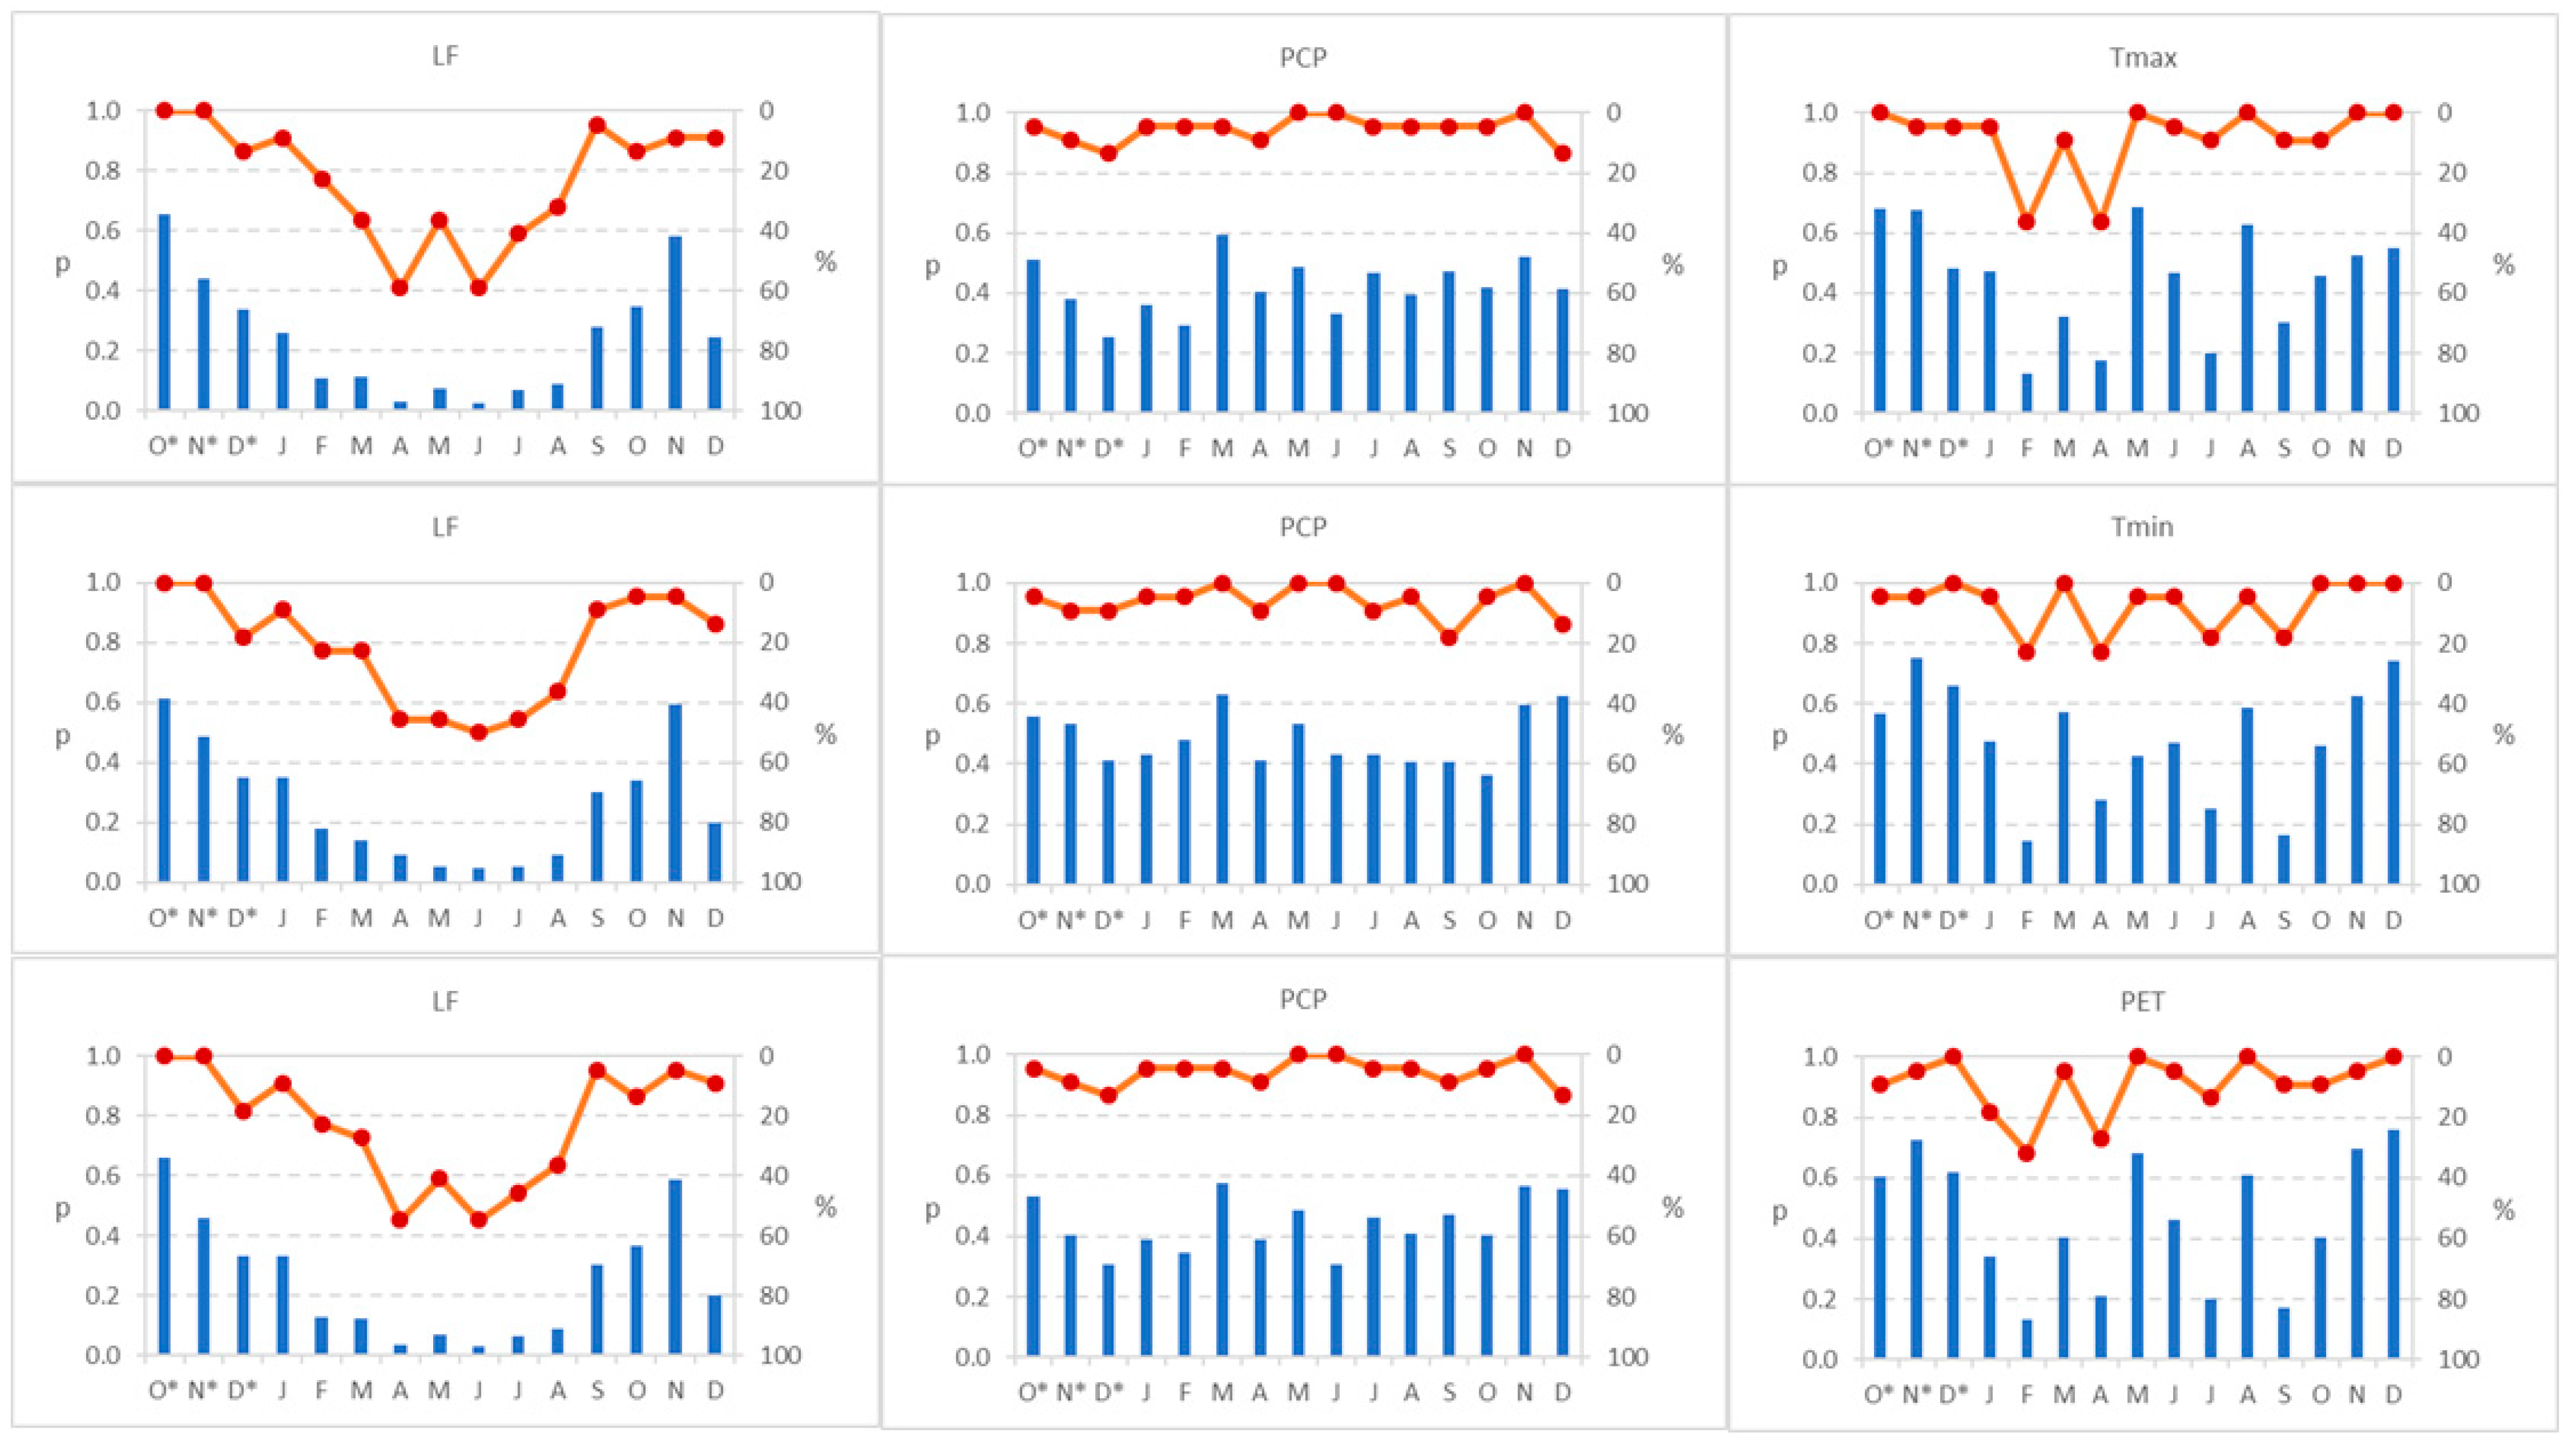
4.2. Combined Influence of Soil Moisture Together with Climatic Factors

From the results obtained with the different combinations of variables in the MLR analysis (Figure 4 and Figure 5), it was observed that soil moisture was the most important variable, showing the lowest p-values in all cases. In the spring and summer months, median p-values are lower than the significance threshold, and the percentage of significant samples exceeds 50%. In all cases, the minimum p-value was reached in June, ranging from 0.02 to 0.04. These results are in agreement with that obtained in the correlation analysis, and the period when the amount of water available in the soil reaches the most critical relevance for the growth of trees was again identified.
Conversely, the climatic variables used did not show a clear influence on Aleppo pine growth in this analysis (Figure 4 and Figure 5). The percentage of significant samples never exceeded 40%, and the median p-values were always higher than the significance threshold. This reveals a strong influence of soil moisture on Aleppo pine growth with respect to the climatic variables, which becomes clearer in spring and summer months. In addition, the p-values obtained with the climatic variables with different combinations in the MLR analyses were very similar. This could be due to the high correlation between precipitation and SPI, on the one hand, and between maximum temperature, minimum temperature, and PET on the other. Although climatic variables exert influence on the growth of Aleppo pine when they are analyzed individually [26,89], when all factors analyzed are considered together, the effect of the climatic variables was masked because of the higher weight of soil moisture in the MLR models. The results obtained from the correlation analysis showed that soil moisture plays a fundamental role in tree growth, and this stood out when considering all environmental factors studied together. These results confirmed the hypothesis raised by [100], that soil water availability better estimates Aleppo pine growth than other variables such as precipitation.
Other studies have incorporated different climatic variables into models, commonly precipitation and temperature, in order to simulate tree growth [65,103]. However, soil moisture has not been used for this purpose. It would be a good option to use soil moisture as an adequate variable to investigate tree growth, as it has been shown from the results obtained with the MLR.

4.3. Environmental Modulation of the Role of Soil Moisture in Aleppo Pine Growth

It has been seen so far that soil moisture plays a predominant role in relation to the other environmental variables studied in the present work and those that are commonly used in studies investigating the effects of climate factors on Aleppo pine growth [66]. It is also of interest to investigate whether this relationship follows a spatial or environmental pattern. From the results analyzed, it has been seen that there is variability between samples and that not all places show the same degree of relationship. It is therefore interesting to know whether this relationship between soil moisture and Aleppo pine growth is modulated by the environmental or geographical conditions of the places where it has been analyzed. It is also important to determine whether there is a predominant factor that accentuates or attenuates the role of soil moisture. To investigate this issue, the R (LF vs. TRI) data obtained were correlated with the annual mean temperature, maximum temperature, minimum temperature, precipitation, potential evapotranspiration, P/PET ratio, and altitude, latitude, and longitude, of every location. P/PET is a common aridity index, usually used to characterize the degree of water limitation of an ecosystem or region [104].
The results of this analysis show that almost no relationship exists with the thermal conditions of the areas (Figure 6a–c). Only mean and minimum temperature show a significant and direct relationship with the R values of October of the previous year. This could be related to the secondary peak of TRI in autumn [48], indicating that such a pattern in the relationship between soil moisture and tree growth is more evident where the conditions are warmer in that season. However, the R values between LF and TRI are clearly correlated with environmental factors that express the water availability of the sampling sites. Precipitation and P/PET show an inverse relationship, whereas in the case of the PET ratio, the relationship is direct (Figure 6d–f). This is consistent, as it indicates that the relationship between soil water content and tree growth is closer as water availability is lower at a given location. The relationship is very clearly expressed, as it is statistically significant (p < 0.01) in the spring and summer months, the time of maximum biological activity and aridity under Mediterranean conditions. A similar pattern was observed by [31], who found that the relationship between soil moisture and Aleppo pine growth was stronger in more arid sites.
It is noticeable that no relationship was found with altitude (Figure 6h,i), considering that the variability of cases is high (Table 1), ranging between 170 and 1676 m.a.s.l. It is well known that altitude has great importance in plant phenology [105], especially because it controls and modulates thermal conditions. It is also known that altitude interferes with tree growth, but usually this is because this terrain factor conditions aspects such as competition for light or nutrients [106]. In the present study, the results show that altitude has no relevance in relation with the influence of soil water content on Aleppo pine growth.
However, geographical location seems to be clearly related. Both the latitude and longitude of the sampled sites show a clear, inverse relationship with R (Figure 6). As the latitude decreases, the value of R is higher, and the link between soil moisture and tree growth is stronger. This is clearer in the months of April to June, where the correlation is statistically significant, and it is precisely in the months when the correlation between soil moisture and growth is higher (Figure 2 and Figure 3). The longitude results are similar, since in this case, both latitude and longitude are related. Owing the configuration of the eastern part of the Iberian Peninsula (Figure 1), as the latitude decreases (to the south), the longitude does as well (to the west). Therefore, the geographical location of the samples becomes a modulating factor for the role of soil moisture. This is in relation to the fact that, in this region, aridity increases to the south and, especially, to the southeast [107]. This result is clearly consistent with what we observed in relation to indicators such as precipitation or P/PET ratio (aridity index). Therefore, again, it is observed that the role of soil moisture in the growth of Aleppo pine is modulated by the aridity or water availability conditions.

5. Conclusions

From the two approaches applied in this study, univariate and multiple linear regression analysis, it was seen that soil moisture is the most important variable in Aleppo pine growth, compared with the climatic factors analyzed. This work found that the influence of those variables, commonly used for this kind of study, is lower than that observed for soil moisture itself. It was also seen how the variables related to water dynamics (precipitation or SPI) showed a clearer relationship than other climate factors with the growth of the trees. Previous studies showed that factors such as temperature conditions had a considerable influence, while this study showed a much less clear relationship than that obtained for soil water content.
When soil moisture was taken into account together with the different climatic variables through multiple linear regression analysis, the results pointed in the same direction. It was clearly observed how soil moisture is the variable that plays the most important role in the growth of Aleppo pine. In fact, soil moisture outperforms the other factors considered, and no significant influence was observed when they were used in the analysis.
From the analysis of the relationship between soil moisture and tree growth, remarkable variability was observed between the studied sites. For that reason, it was determined whether the link between both variables was modulated by the environmental conditions. From the correlation of that relationship with the climatic characteristics and the geographical location of the forests where the samples were obtained, it was determined that thermal conditions have no influence. However, the relationship with the variables that define the availability of water, mainly the amount of precipitation and the aridity index, is very clear, especially at the time of year when, according to the characteristics of the Mediterranean climate, water scarcity is greater. Therefore, the soil water content is decisive for the growth of Aleppo pine, and this variable is much more determinant as the environmental conditions are more arid. This result is very relevant considering that most climate change projections show an increase in water deficits in regions such as the Mediterranean, where water-limited ecosystems are predominant.
The results obtained in this study have shown that the role of soil moisture is decisive for this tree species, which is characteristic of the vegetation in water-limited environments, and that it is possible to undertake its study using approaches and methodologies, such as satellite or modeled soil moisture, that are fully available for almost any territory and at appropriate temporal and spatial scales. The use of these new approaches allows knowledge of the inherent environmental conditions of forest areas to be advanced. These tools can also be very useful to better understand the functioning of ecosystems as sensitive as forests and to face the challenges of climate change. In addition, recent studies highlighted the potential of Aleppo pine as a suitable climate proxy able to reconstruct past precipitation conditions on semiarid areas of its distribution area [16]. Despite its importance, information on past soil moisture conditions is extremely scarce, and our study demonstrates the high potential of dendroclimatological studies to be used to improve our knowledge of soil moisture evolution over the last few centuries in highly sensitive areas.

Author Contributions

The initial idea for this research was conceived by J.M.-F. The different datasets were prepared by Á.G.-Z., M.d.L., and L.A.-M., who also collected all the results. The four authors have equally contributed to the analysis and the interpretation of the results. The first manuscript was prepared by Á.G.-Z., in collaboration with the other authors. All authors have read and agreed to the published version of the manuscript.

Funding

This study was supported by the Spanish Ministry of Science, Innovation and Universities (Project ESP2017-89463-C3-3-R), the European Regional Development Fund (ERDF) and the project Unidad de Excelencia CLU-2018-04 co-funded by ERDF and Castilla y León Government.

Institutional Review Board Statement

Not applicable.

Informed Consent Statement

Not applicable.

Acknowledgments

The authors acknowledge the European Space Agency, the University of East Anglia, and the European Flood Awareness System.

Conflicts of Interest

The authors declare no conflict of interest.

References

  1. Lindner, M.; Maroschek, M.; Netherer, S.; Kremer, A.; Barbati, A.; García-Gonzalo, J.; Seidl, R.; Delzon, S.; Corona, P.; Kolström, M.; et al. Climate change impacts, adaptive capacity, and vulnerability of European forest ecosystems. For. Ecol. Manag. 2010, 259, 698–709. [Google Scholar] [CrossRef]
  2. Bonan, G.B. Forests and Climate Change: Forcings, Feedbacks, and the Climate Benefits of Forests. Science 2008, 320, 1444–1449. [Google Scholar] [CrossRef] [Green Version]
  3. He, T.; Shao, Q.; Cao, W.; Huang, L.; Liu, L. Satellite-Observed Energy Budget Change of Deforestation in Northeastern China and its Climate Implications. Remote Sens. 2015, 7, 11586–11601. [Google Scholar] [CrossRef] [Green Version]
  4. van der Werf, G.R.; Morton, D.C.; DeFries, R.S.; Olivier, J.G.J.; Kasibhatla, P.S.; Jackson, R.B.; Collatz, G.J.; Randerson, J.T. CO2 emissions from forest loss. Nat. Geosci. 2009, 2, 737–738. [Google Scholar] [CrossRef]
  5. Mankin, J.S.; Seager, R.; Smerdon, J.E.; Cook, B.I.; Williams, A.P. Mid-latitude freshwater availability reduced by projected vegetation responses to climate change. Nat. Geosci. 2019, 12, 983–988. [Google Scholar] [CrossRef]
  6. Bjorkman, A.D.; Myers-Smith, I.H.; Elmendorf, S.C.; Normand, S.; Rüger, N.; Beck, P.S.A.; Blach-Overgaard, A.; Blok, D.; Cornelisses, J.H.C.; Forbes, B.C.; et al. Plant functional trait change across a warming tundra biome. Nature 2018, 562, 57–62. [Google Scholar] [CrossRef]
  7. Vidal-Macua, J.J.; Ninyerola, M.; Zabala, A.; Domingo-Marimón, C.; Pons, X. Factors affecting forest dynamics in the Iberian Pen-insula from 1987 to 2012. The role of topography and drought. For. Ecol. Manag. 2017, 406, 290–306. [Google Scholar] [CrossRef]
  8. Kellomäki, S.; Väisänen, H. Modelling the dynamics of the forest ecosystem for climate change studies in the boreal conditions. Ecol. Modell. 1997, 97, 121–140. [Google Scholar] [CrossRef]
  9. Walther, G.R.; Post, E.; Convey, P.; Menzel, A.; Parmesan, C.; Beebee, T.J.; Fromentin, J.M.; Hoegh-Guldberg, O.; Bairlein, F. Eco-logical responses to recent climate change. Nature 2002, 416, 389–395. [Google Scholar] [CrossRef]
  10. Frey, S.J.K.; Hadley, A.S.; Johnson, S.L.; Schulze, M.; Jones, J.A.; Betts, M.G. Spatial models reveal the microclimatic buffering ca-pacity of old-growth forests. Sci. Adv. 2016, 2, e1501392. [Google Scholar] [CrossRef] [Green Version]
  11. Caminero, L.; Génova, M.; Camarero, J.J.; Sánchez-Salguero, R. Growth responses to climate and drought at the southernmost European limit of Mediterranean Pinus pinaster forests. Dendrochronologia 2018, 48, 20–29. [Google Scholar] [CrossRef]
  12. Valladares, F.; Benavides, R.; Rabasa, S.G.; Díaz, M.; Pausas, J.G.; Paula, S.; Simonson, W.D. Global change and Mediterranean forests: Current impacts and potential responses. In Forests and Global Change; Coomes, D.A., Burslem, D.F.R.P., Simonson, W.D., Eds.; Cambridge University Press: Cambridge, UK, 2014; pp. 47–75. [Google Scholar]
  13. Barbéro, M.; Loisel, R.; Quezel, P.; Richardson, D.M.; Romane, F. Pines of the mediterranean basin. In Ecology and Biogeography of Pinus; Richardson, D.M., Ed.; Cambridge University Press: Cambridge, UK, 1998; pp. 153–170. [Google Scholar]
  14. Quézel, P. Taxonomy and biogeography of Mediterranean pines (Pinus halepensis and P. brutia). In Ecology, Biogeography and Management of Pinus halepensis and P. brutia Forest Ecosystems in the Mediterranean Basin; Neeman, G., Trabaud, L., Eds.; Backhuys Publishers: Leiden, The Netherlands, 2000; pp. 1–12. [Google Scholar] [CrossRef]
  15. de Luis, M.; Čufar, K.; di Filippo, A.; Novak, K.; Papadopoulos, A.; Piovesan, G.; Rathgeber, C.B.K.; Raventós, J.; Saz, M.A.; Smith, K.T. Plasticity in dendroclimatic response across the distribution range of Aleppo pine (Pinus halepensis). PLoS ONE 2013, 8, e83550. [Google Scholar] [CrossRef] [Green Version]
  16. Tejedor, E.; Serrano-Notivoli, R.; Saz, M.A.; Longares, L.A.; Novak, K.; Cuadrat, J.M.; de Luis, M. Rain in the desert; A precipitation reconstruction of the last 156 years inferred from Aleppo Pine in the Bardenas Natural Park, Spain. Dendrochronologia 2020, 62, 125759. [Google Scholar] [CrossRef]
  17. Gazol, A.; Ribas, M.; Gutiérrez, E.; Camarero, J.J. Aleppo pine forests from across Spain show drought-induced growth decline and partial recovery. Agric. For. Meteorol. 2017, 232, 186–194. [Google Scholar] [CrossRef]
  18. Mauri, A.; Di Leo, M.; de Rigo, D.; Caudullo, G. Pinus halepensis and Pinus brutia in Europe: Distribution, habitat, usage and threats. In European Atlas of Forest Tree Species; San-Miguel-Ayanz, J., de Rigo, D., Caudullo, G., Houston Durrant, T., Mauri, A., Eds.; Publications Office of the European Union: Luxembourg, 2016; p. e0166b8+. [Google Scholar]
  19. Nicault, A. Analyse de l’influence du Climat sur les Variations Inter et Intraannuelles de la Croissance Radiale du pin d’Alep (Pinus halepensis Mill.) en Provence Calcaire. Ph.D. Thesis, Sci. Univ. Aix-Marseille III, Marseille, France, 1999; p. 254. [Google Scholar]
  20. Novak, K.; de Luis, M.; Saz, M.A.; Longares, L.A.; Serrano-Notivoli, R.; Raventós, J.; Čufar, K.; Gričar, J.; Di Filippo, A.; Piovesan, G.; et al. Missing rings in Pinus halepensis—The missing link to relate the tree-ring record to extreme climatic events. Front. Plant Sci. 2016, 7, 727. [Google Scholar] [CrossRef]
  21. Vennetier, M.; Ripert, C.; Rathgeber, C. Autecology and growth of Aleppo pine (Pinus halepensis Mill.): A comprehensive study in France. For. Ecol. Manag. 2018, 413, 32–47. [Google Scholar] [CrossRef]
  22. Attolini, M.R.; Calvani, F.; Galli, M.; Nanni, T.; Ruggiero, L.; Schaer, E.; Zuanni, F. The relationship between climatic variables and wood structure in Pinus halepensis Mill. Theor. Appl. Climatol. 1990, 41, 121–127. [Google Scholar] [CrossRef]
  23. Nicault, A.; Rathgeber, C.; Tessier, L.; Thomas, A. Observations sur la mise en place du cerne chez le pin d’Alep (Pinus halepensis Mill.): Confrontation entre les mesures de croissance radiale, de densité et les facteurs climatiques. Ann. For. Sci. 2001, 58, 769–784. [Google Scholar] [CrossRef] [Green Version]
  24. Matamoros, M.R.; Merino, E.G.; Ibáñez, N.I.; Bernal, E.M. Sensibilidad y grado de adaptación de Pinus halepensis Mill. a la varia-bilidad climática en la provincia de Zaragoza. Cuadernos de la Sociedad Española de Ciencias Forestales 2008, 26, 137–142. [Google Scholar]
  25. de Luis, M.; Novak, K.; Raventós, J.; Gričar, J.; Prislan, P.; Čufar, K. Climate factors promoting intra-annual density fluctuations in Aleppo pine (Pinus halepensis) from semiarid sites. Dendrochronologia 2011, 29, 163–169. [Google Scholar] [CrossRef]
  26. Novak, K.; de Luis, M.; Raventós, J.; Čufar, K. Climatic signals in tree-ring widths and wood structure of Pinus halepensis in con-trasted environmental conditions. Trees 2013, 27, 927–936. [Google Scholar] [CrossRef]
  27. Hillel, D. Environmental Soil Physics: Fundamentals, Applications, and Environmental Considerations; Academic Press: London, UK, 1998. [Google Scholar]
  28. Oberhuber, W.; Kofler, W. Topographic influences on radial growth of Scots pine (Pinus sylvestris L.) at small spatial scales. Plant Ecol. 2000, 46, 231–240. [Google Scholar]
  29. Kramer, P. Soil Moisture in Relation to Plant Growth. Bot. Rev. 1944, 10, 525–559. [Google Scholar] [CrossRef]
  30. Seghieri, J.; Vescovo, A.; Padel, K.; Soubie, R.; Arjounin, M.; Boulain, N.; de Rosnay, P.; Galle, S.; Gosset, M.; Mouctar, A.H.; et al. Relationships between climate, soil moisture and phenology of the woody cover in two sites located along the West African latitudinal gradient. J. Hydrol. 2009, 375, 78–89. [Google Scholar] [CrossRef]
  31. Manrique-Alba, A.; Ruiz-Yanetti, S.; Moutahir, H.; Novak, K.; de Luis, M.; Bellot, J. Soil moisture and its role in growth-climate relationships across an aridity gradient in semiarid Pinus halepensis forests. Sci. Total Environ. 2017, 574, 982–990. [Google Scholar] [CrossRef]
  32. Wei, L.; Zhou, H.; Link, T.E.; Kavanag, K.L.; Hubbart, J.A.; Du, E.; Hudak, A.T.; Marshall, J.D. Forest productivity varies with soil moisture more than temperature in a small montane watershed. Agric. For. Meteorol. 2018, 259, 211–221. [Google Scholar] [CrossRef]
  33. Samaniego, L.; Thober, S.; Kumar, R.; Wanders, N.; Rakovec, O.; Pan, M.; Zink, M.; Sheffield, J.; Wood, E.F.; Marx, A. Anthropogenic warming exacerbates European soil moisture droughts. Nat. Clim. Chang. 2018, 8, 421–426. [Google Scholar] [CrossRef]
  34. Bartalis, Z.; Wagner, W.; Naeimi, V.; Hasenauer, S.; Scipal, K.; Bonekamp, H.; Figa, J.; Anderson, C. Initial soil moisture retrievals from the METOP-A Advanced Scatterometer (ASCAT). Geophys. Res. Lett. 2007, 34, L20401. [Google Scholar] [CrossRef] [Green Version]
  35. Kerr, Y.; Waldteufel, P.; Wigneron, J.-P.; Delwart, S.; Cabot, F.; Boutin, J.; Escorihuela, M.J.; Font, J.; Reul, N.; Gruhier, C.; et al. The SMOS mission: New tool for monitoring key elements of the global water cycle. Proc. IEEE 2010, 98, 666–687. [Google Scholar] [CrossRef] [Green Version]
  36. Chan, S.; Bindlish, R.; O’Neill, P.; Njoku, E.; Jackson, T.; Colliander, A.; Chen, F.; Burgin, M.; Dunbar, S.; Piepmeier, J.; et al. Assessment of the SMAP Passive Soil Moisture Product. IEEE Trans. Geosci. Remote Sens. 2016, 54, 4994–5007. [Google Scholar] [CrossRef]
  37. Dorigo, W.; Wagner, W.; Albergel, C.; Albrecht, F.; Balsamo, G.; Brocca, L.; Chung, D.; Ertl, M.; Forkel, M.; Gruber, A.; et al. ESA CCI Soil Moisture for improved Earth system understanding: State-of-the art and future directions. Remote Sens. Environ. 2017, 203, 185–215. [Google Scholar] [CrossRef]
  38. Kerr, Y.; Wigneron, J.-P.; Al Bitar, A.; Mialon, A.; Srivastava, P.K. Soil Moisture from Space: Techniques and Limitations. In Satellite Soil Moisture Retrieval: Techniques and Applications; Srivastava, P.K., Petropoulos, G., Kerr, Y., Eds.; Elsevier: Amsterdam, The Netherlands, 2016; pp. 3–27. [Google Scholar]
  39. Vittucci, C.; Ferrazzoli, P.; Kerr, Y.; Richaume, P.; Guerriero, L.; Rahmoune, R.; Vaglio Laurin, G. SMOS retrieval over forests: Ex-ploitation of optical depth and tests of soil moisture estimates. Remote Sens. Environ. 2016, 180, 115–127. [Google Scholar] [CrossRef] [Green Version]
  40. Colliander, A.; Cosh, M.H.; Kelly, V.R.; Kraatz, S.; Bourgeau-Chavez, L.; Siqueira, P.; Roy, A.; Konings, A.G.; Holtzman, N.; Misra, S.; et al. SMAP detects soil moisture under temperate forest canopies. Geophys. Res. Lett. 2020, 47. [Google Scholar] [CrossRef]
  41. Kim, H.; Wigneron, J.-P.; Kumar, S.; Dong, J.; Wagner, W.; Cosh, M.H.; Bosch, D.D.; Holifield Collins, C.; Starks, P.J.; Seyfried, M.; et al. Global scale error assessments of soil moisture estimates from microwave based active and passive satellites and land surface models over forest and mixed irrigated/dryland agriculture regions. Remote Sens. Environ. 2020, 251, 112052. [Google Scholar] [CrossRef]
  42. González-Zamora, A.; Sánchez, N.; Pablos, M.; Martínez-Fernández, J. CCI soil moisture assessment with SMOS soil moisture and in situ data under different environmental conditions and spatial scales in Spain. Remote Sens. Environ. 2019, 225, 469–482. [Google Scholar] [CrossRef]
  43. Kong, X.; Dorling, S.; Smith, R. Soil moisture modelling and validation at an agricultural site in Norfolk using the Met Office surface exchange scheme (MOSES). Meteorol. Appl. 2011, 18, 18–27. [Google Scholar] [CrossRef]
  44. Hagan, D.F.T.; Parinussa, R.M.; Wang, G.; Draper, C.S. An Evaluation of Soil Moisture Anomalies from Global Model-Based Datasets over the People’s Republic of China. Water 2020, 12, 117. [Google Scholar] [CrossRef] [Green Version]
  45. Martens, B.; Miralles, D.G.; Lievens, H.; van der Schalie, R.; de Jeu, R.A.M.; Fernández-Prieto, D.; Beck, H.E.; Dorigo, W.A.; Verhoest, N.E.C. GLEAM v3: Satellite-based land evaporation and root-zone soil moisture. Geosci. Model Dev. 2017, 10, 1903–1925. [Google Scholar] [CrossRef] [Green Version]
  46. Naz, B.S.; Kollet, S.; Franssen, H.J.H.; Montzka, C.; Kurtz, W. A 3 km spatially and temporally consistent European daily soil moisture reanalysis from 2000 to 2015. Sci. Data 2020, 7, 111. [Google Scholar] [CrossRef] [Green Version]
  47. Thielen, J.; Bartholmes, J.; Ramos, M.H.; de Roo, A. The European Flood Alert System-Part 1: Concept and development. Hydrol. Earth Syst. Sci. 2009, 13, 125–140. [Google Scholar] [CrossRef] [Green Version]
  48. Martínez-Fernández, J.; Almendra-Martín, L.; de Luis, M.; González-Zamora, A.; Herrero-Jiménez, C. Tracking tree growth through satellite soil moisture monitoring: A case study of Pinus halepensis in Spain. Remote Sens. Environ. 2019, 235, 111422. [Google Scholar] [CrossRef]
  49. Cook, E.; Holmes, R. Users manual for Arstan program. Adapted from users manual for program ARSTAN. In Tree-ring Chronologies of Western North America: California, Eastern Oregon and Northern Great Basin; Holmes, R., Adams, R.K., Fritts, H.C., Eds.; La-boratory of Tree-Ring Research, University of Arizona: Tucson, AZ, USA, 1986; pp. 50–65. [Google Scholar]
  50. Cook, E.; Peters, K. Calculating unbiased tree-ring indices for the study of climatic and environmental change. Holocene 1997, 7, 361–370. [Google Scholar] [CrossRef]
  51. Gruber, A.; Scanlon, T.; van der Schalie, R.; Wagner, W.; Dorigo, W. Evolution of the ESA CCI Soil Moisture climate data records and their underlying merging methodology. Earth Syst. Sci. Data 2019, 11, 717–739. [Google Scholar] [CrossRef] [Green Version]
  52. Dorigo, W.; Gruber, A.; de Jeu, R.A.M.; Wagner, W.; Stacke, T.; Loew, A.; Albergel, C.; Brocca, L.; Chung, D.; Parinussa, R.M.; et al. Evaluation of the ESA CCI soil moisture product using ground-based observations. Remote Sens. Environ. 2015, 162, 380–395. [Google Scholar] [CrossRef]
  53. Chung, D.; Dorigo, W.; de Jeu, R.A.M.; Kidd, R.; Wagner, W. Product Specification Document—ESA CCI Soil Moisture. Version 4.4. 2018. Available online: https://www.esa-soilmoisture-cci.org/sites/default/files/documents/public/CCI%20SM%20v04.7%20documentation/ESA_CCI_Soil_Moisture_Product_Specification_Document_(PSD)_v04.7.pdf (accessed on 22 December 2020).
  54. Albergel, C.; Rüdiger, C.; Carrer, D.; Calvet, J.C.; Fritz, N.; Naeimi, V.; Bartalis, Z.; Hasenauer, S. An evaluation of ASCAT surface soil moisture products with in-situ observations in Southwestern France. Hydrol. Earth Syst. Sci. 2009, 13, 115–124. [Google Scholar] [CrossRef] [Green Version]
  55. Reichle, R.H.; De Lannoy, G.J.; Liu, Q.; Ardizzone, J.V.; Colliander, A.; Conaty, A.; Crow, W.; Jackson, T.; Jones, L.A.; Kimball, J.S.; et al. Assessment of the SMAP level-4 surface and root-zone soil moisture product using in situ measurements. J. Hydrometeorol. 2017, 18, 2621–2645. [Google Scholar] [CrossRef]
  56. González-Zamora, A.; Sánchez, N.; Martínez-Fernández, J.; Wagner, W. Root-zone plant available water estimation using the SMOS-derived soil water index. Adv. Water Resour. 2016, 96, 339–353. [Google Scholar] [CrossRef]
  57. de Roo, A.P.J.; Wesseling, C.G.; van Deursen, W.P.A. Physically based river basin modelling within a GIS: The LISFLOOD model. Hydrol. Process 2000, 14, 1981–1992. [Google Scholar] [CrossRef]
  58. Laguardia, G.; Niemeyer, S. On the comparison between the LISFLOOD modelled and the ERS/SCAT derived soil moisture estimates. Hydrol. Earth Syst. Sci. 2008, 12, 1339–1351. [Google Scholar] [CrossRef] [Green Version]
  59. van der Knijff, J.M.; Younis, J.; de Roo, A.P.J. LISFLOOD: A GIS-based distributed model for river basin scale water balance and flood simulation. Int. J. Geogr. Inf. Sci. 2008, 24, 189–212. [Google Scholar] [CrossRef]
  60. Voltas, J.; Lucabaugh, D.; Chambel, M.R.; Ferrio, J.P. Intraspecific variation in the use of water sources by the circum-Mediterranean conifer Pinus halepensis. New Phytol. 2015, 208, 1031–1041. [Google Scholar] [CrossRef] [PubMed] [Green Version]
  61. Ciabatta, L.; Massari, C.; Brocca, L.; Gruber, A.; Reimer, C.; Hahn, S.; Paulik, C.; Dorigo, W.; Kidd, R.; Wagner, W. SM2RAIN-CCI: A new global long-term rainfall data set derived from ESA CCI soil moisture. Earth Syst. Sci. Data 2018, 10, 267. [Google Scholar] [CrossRef] [Green Version]
  62. Cuo, L.; Pagano, T.C.; Wang, Q.J. A review of quantitative precipitation forecasts and their use in short-to medium-range streamflow forecasting. J. Hydrometeorol. 2011, 12, 713–728. [Google Scholar] [CrossRef]
  63. Wanders, N.; Karssenberg, D.; de Roo, A.; de Jong, S.M.; Bierkens, M.F.P. The suitability of remotely sensed soil moisture for im-proving operational flood forecasting. Hydrol. Earth Syst. Sci. Dis. 2013, 10, 13783–13816. [Google Scholar]
  64. Zhang, L.; Liu, Y.; Ren, L.; Jiang, S.; Yang, X.; Yuan, F.; Wang, M.; Wei, L. Drought Monitoring and Evaluation by ESA CCI Soil Moisture Products Over the Yellow River Basin. IEEE J. Sel. Top. Appl. Earth Obs. Remote Sens. 2019, 12, 3376–3386. [Google Scholar] [CrossRef]
  65. Liu, Y.; El-Kassaby, Y.A. Evapotranspiration and favorable growing degree-days are key to tree height growth and ecosystem functioning: Meta-analyses of Pacific Northwest historical data. Sci. Rep. 2018, 8, 8228. [Google Scholar] [CrossRef] [Green Version]
  66. Zalloni, E.; de Luis, M.; Campelo, F.; Novak, K.; De Micco, V.; di Filippo, A.; Vieira, J.; Nabais, C.; Rozas, V.; Battipaglia, G. Climatic Signals from Intra-annual Density Fluctuation Frequency in Mediterranean Pines at a Regional Scale. Front. Plant Sci. 2016, 7, 579. [Google Scholar] [CrossRef] [PubMed] [Green Version]
  67. Novak, K.; Saz, M.A.; Čufar, K.; Raventós, J.; de Luis, M. Age, climate and intra-annual density fluctuations in Pinus halepensis in Spain. IAWA J. 2013, 34, 459–474. [Google Scholar] [CrossRef] [Green Version]
  68. Serrano-Notivoli, R.; Beguería, S.; Saz, M.Á.; Longares, L.A.; de Luis, M. SPREAD: A high-resolution daily gridded precipitation dataset for Spain–an extreme events frequency and intensity overview. Earth Syst. Sci. Data 2017, 9, 721–738. [Google Scholar] [CrossRef] [Green Version]
  69. Serrano-Notivoli, R.; Beguería, S.; de Luis, M. STEAD: A high-resolution daily gridded temperature dataset for Spain. Earth Syst. Sci. Data 2019, 11, 1171–1188. [Google Scholar] [CrossRef] [Green Version]
  70. Eekhout, J.P.; Hunink, J.E.; Terink, W.; de Vente, J. Why increased extreme precipitation under climate change negatively affects water security. Hydrol. Earth Syst. Sci. 2018, 22, 5935–5946. [Google Scholar] [CrossRef] [Green Version]
  71. Martínez del Castillo, E.; Tejedor, E.; Serrano-Notivoli, R.; Novak, K.; Saz, M.A.; Longares, L.A.; de Luis, M. Contrasting patterns of tree growth of mediterranean pine species in the Iberian Peninsula. Forests 2018, 9, 416. [Google Scholar] [CrossRef] [Green Version]
  72. Serrano-Notivoli, R.; Martín-Vide, J.; Saz, M.A.; Longares, L.A.; Beguería, S.; Sarricolea, P.; Meseguer-Ruiz, O.; de Luis, M. Spa-tio-temporal variability of daily precipitation concentration in Spain based on a high-resolution gridded data set. Int. J. Climatol. 2018, 38, e518–e530. [Google Scholar] [CrossRef] [Green Version]
  73. McKee, T.B.; Doesken, N.J.; Kleist, J. The relationship of drought frequency and duration to time scales. In Proceedings of the 8th Conference on Applied Climatology, Anaheim, CA, USA, 17–22 January 1993; Volume 17, pp. 179–183. [Google Scholar]
  74. Svoboda, M.; Hayes, M.; Wood, D. Standardized Precipitation Index User Guide; World Meteorological Organization (WMO): Geneva, Switzerland, 2012. [Google Scholar]
  75. Harris, I.; Osborn, T.J.; Jones, P.; Lister, D.H. Version 4 of the CRU TS monthly high-resolution gridded multivariate climate dataset. Sci. Data 2020, 7, 109. [Google Scholar] [CrossRef] [PubMed] [Green Version]
  76. Dikshit, A.; Pradhan, B.; Alamri, A.M. Short-Term Spatio-Temporal Drought Forecasting Using Random Forests Model at New South Wales, Australia. Appl. Sci. 2020, 10, 4254. [Google Scholar] [CrossRef]
  77. Haile, G.G.; Tang, Q.; Hosseini-Moghari, S.M.; Liu, X.; Gebremicael, T.G.; Leng, G.; Kebede, A.; Xu, X.; Yun, X. Projected impacts of climate change on drought patterns over East Africa. Earths Future 2020, 8, e1502. [Google Scholar] [CrossRef]
  78. Mubialiwo, A.; Onyutha, C.; Abebe, A. Historical Rainfall and Evapotranspiration Changes over Mpologoma Catchment in Uganda. Adv. Meteorol. 2020, 2020, 8870935. [Google Scholar] [CrossRef]
  79. Allen, R.G.; Pereira, L.S.; Raes, D.; Smith, M. Crop Evapotranspiration—Guidelines for Computing Crop Water Requirements; FAO Irrigation and Drainage Paper, 56; FAO: Rome, Italy, 1998. [Google Scholar]
  80. Harris, I.; Jones, P.D.; Osborn, T.J.; Lister, D.H. Updated high-resolution grids of monthly climatic observations-The CRU TS3.10 Dataset. Int. J. Climatol. 2014, 34, 623–642. [Google Scholar] [CrossRef] [Green Version]
  81. Paul, R.K. Multicollinearity: Causes, Effects and Remedies; IASRI: New Delhi, India, 2006; pp. 58–65.
  82. Montgomery, D.C.; Peckand, E.A.; Vining, G.G. Introduction to Linear Regression Analysis, 5th ed.; Wiley: New York, NY, USA, 2001. [Google Scholar]
  83. de Luis, M.; Gričar, J.; Čufar, K.; Raventós, J. Seasonal dynamics of wood formation in Pinus halepensis from dry and semi-arid ecosystems in Spain. IAWA J. 2007, 28, 389–404. [Google Scholar] [CrossRef] [Green Version]
  84. Olivar, J.; Bogino, S.; Spiecker, H.; Bravo, F. Climate impact on growth dynamic and intra-annual density fluctuations in Aleppo pine (Pinus halepensis) trees of different crown classes. Dendrochronologia 2012, 30, 35–47. [Google Scholar] [CrossRef]
  85. Olivar, J.; Bogino, S.; Spiecker, H. Changes in climate-growth relationships and IADF formation over time of pine species (Pinus halepensis, P. pinaster and P. sylvestris) in Mediterranean environments. For. Syst. 2015, 24, 10. [Google Scholar] [CrossRef] [Green Version]
  86. Campelo, F.; Nabais, C.; Freitas, H.; Gutiérrez, E. Climatic significance of tree-ring width and intra-annual density fluctuations in Pinus pinea from a dry Mediterranean area in Portugal. Ann. For. Sci. 2007, 64, 229–238. [Google Scholar] [CrossRef] [Green Version]
  87. Pasho, E.; Camarero, J.J.; Vicente-Serrano, S.M. Climatic impacts and drought control of radial growth and seasonal wood formation in Pinus halepensis. Trees 2012, 26, 1875–1886. [Google Scholar] [CrossRef]
  88. Papadopoulos, A.; Serre-Bachet, F.; Tessier, L. Tree ring to climate relationships of Aleppo pine (Pinus halepensis Mill.) in Greece. Ecol. Mediterr. 2001, 27, 89–98. [Google Scholar] [CrossRef]
  89. de Luis, M.; Novak, K.; Čufar, K.; Raventós, J. Size mediated climate–growth relationships in Pinus halepensis and Pinus pinea. Trees 2009, 23, 1065–1073. [Google Scholar] [CrossRef]
  90. Linares, J.C.; Delgado-Huertas, A.; Carreira, J.A. Climatic trends and different drought adaptive capacity and vulnerability in a mixed Abies pinsapo–Pinus halepensis forest. Clim. Chang. 2011, 105, 67–90. [Google Scholar] [CrossRef]
  91. Moreno-Gutiérrez, C.; Battipaglia, G.; Cherubini, P.; Saurer, M.; Nicolas, E.; Contreras, S.; Querejeta, J.I. Stand structure modulates the long-term vulnerability of Pinus halepensis to climatic drought in a semiarid Mediterranean ecosystem. Plant Cell Environ. 2012, 35, 1026–1039. [Google Scholar] [CrossRef]
  92. Sánchez-Salguero, R.; Navarro-Cerrillo, R.M.; Camarero, J.J.; Fernández-Cancio, Á. Selective drought-induced decline of pine spe-cies in southeastern Spain. Clim. Chang. 2012, 113, 767–785. [Google Scholar] [CrossRef]
  93. Sarris, D.; Christodoulakis, D.; Körner, C. Impact of recent climatic change on growth of low elevation eastern Mediterranean forest trees. Clim. Chang. 2011, 106, 203–223. [Google Scholar] [CrossRef]
  94. Camarero, J.J.; Olano, J.M.; Parras, A. Plastic bimodal xylogenesis in conifers from continental Mediterranean climates. New Phytol. 2010, 185, 471–480. [Google Scholar] [CrossRef] [PubMed]
  95. Lev-Yadun, S. Wood structure and the ecology of annual growth ring formation in Pinus halepensis and P. brutia. Ecology, bioge-ography and management of Pinus halepensis and P. brutia. In Forest Ecosystems in the Mediterranean Basin; Ne’eman, G.G., Trabaud, L., Eds.; Backhuys Publisher: Leiden, The Netherlands, 2000; pp. 67–78. [Google Scholar] [CrossRef]
  96. Cherubini, P.; Gartner, B.; Tognetti, R.; Bräker, O.U.; Schoch, W.; Innes, J. Identification, measurement and interpretation of tree rings in woody species from mediterranean climates. Biol. Rev. 2003, 78, 119–148. [Google Scholar] [CrossRef] [PubMed] [Green Version]
  97. de Luis, M.; Novak, K.; Raventós, J.; Gričar, J.; Prislan, P.; Čufar, K. Cambial activity, wood formation and sapling survival of Pinus halepensis exposed to different irrigation regimes. For. Ecol. Manag. 2011, 262, 1630–1638. [Google Scholar] [CrossRef]
  98. Camarero, J.J.; Manzanedo, R.D.; Sanchez-Salguero, R.; Navarro-Cerrillo, R.M. Growth response to climate and drought change along an aridity gradient in the southernmost Pinus nigra relict forests. Ann. For. Sci. 2013, 70, 769–780. [Google Scholar] [CrossRef]
  99. Casas-Gómez, P.; Sánchez-Salguero, R.; Ribera, P.; Linares, J.C. Contrasting Signals of the Westerly Index and North Atlantic Os-cillation over the Drought Sensitivity of Tree-Ring Chronologies from the Mediterranean Basin. Atmosphere 2020, 11, 644. [Google Scholar] [CrossRef]
  100. Helluy, M.; Prévosto, B.; Cailleret, M.; Fernandez, C.; Balandier, P. Competition and water stress indices as predictors of Pinus halepensis Mill. radial growth under drought. For. Ecol. Manag. 2020, 460, 117877. [Google Scholar] [CrossRef]
  101. Peña-Gallardo, M.; Vicente-Serrano, S.M.; Camarero, J.J.; Gazol, A.; Sánchez-Salguero, R.; Domínguez-Castro, F.; El Kenawy, A.; Beguería-Portugés, S.; Gutiérrez, E.; De Luis, M.; et al. Drought Sensitiveness on Forest Growth in Peninsular Spain and the Balearic Islands. Forests 2018, 9, 524. [Google Scholar] [CrossRef] [Green Version]
  102. Pasho, E.; Camarero, J.J.; de Luis, M.; Vicente-Serrano, S.M. Impacts of drought at different time scales on forest growth across a wide climatic gradient in north-eastern Spain. Agric. For. Meteorol. 2011, 151, 1800–1811. [Google Scholar] [CrossRef]
  103. Misson, L.; Rathgeber, C.; Guiot, J. Dendroecological analysis of climatic effects on Quercus petraea and Pinus halepensis radial growth using the process-based MAIDEN model. Can. J. For. Res. 2004, 34, 888–898. [Google Scholar] [CrossRef] [Green Version]
  104. Parsons, A.J.; Abrahams, A.D. Geomorphology of desert environments. In Geomorphology of Desert Environments; Abrahams, A.D., Parsons, A.J., Eds.; CRC Press: Boca Raton, FL, USA, 1994; pp. 3–12. [Google Scholar]
  105. Ziello, C.; Estrella, N.; Kostova, M.; Koch, E.; Menzel, A. Influence of altitude on phenology of selected plant species in the Alpine region (1971–2000). Clim. Res. 2009, 39, 227–234. [Google Scholar] [CrossRef] [Green Version]
  106. Coomes, D.A.; Allen, R.B. Effects of size, competition and altitude on tree growth. J. Ecol. 2007, 95, 1084–1097. [Google Scholar] [CrossRef]
  107. Paniagua, L.L.; García-Martín, A.; Moral, F.J.; Rebollo, F.J. Aridity in the Iberian Peninsula (1960–2017): Distribution, tendencies, and changes. Theor. Appl. Climatol. 2019, 138, 811–830. [Google Scholar] [CrossRef]
Figure 1. Locations of the Aleppo pine samples across the Iberian Peninsula.
Remotesensing 13 00757 g001
Figure 2. Temporal evolution of the R median (blue continuous line), its 25th and 75th percentiles (blue dashed lines) and the moving average of the percentage of significant (p-value < 0.05) cases (gray line) from the comparison between the daily moving window averages of 30 days for (a) Climate Change Initiative (CCI), (b) Lisflood (LF), (c) Tmax, (d) Tmin, and (e) precipitation, and TRI series. Asterisks correspond to data from the previous year, and the red lines correspond to the significance threshold (p-value < 0.05).
Remotesensing 13 00757 g002
Figure 3. Monthly median correlation coefficients between the monthly time series of (a) CCI, (b) LF, (c) Tmax, (d) Tmin, (e) precipitation, (f) PET, and (g) SPI-1, and TRI series (blue bars), percentage of significant (p-value < 0.05) cases (red dots), and standard deviation of the results from the 22 tree samples (orange line). Asterisks correspond to data from the previous year.
Remotesensing 13 00757 g003
Figure 4. Monthly results from the multiple linear regression analysis for LF, SPI, and Tmax (first row), LF, SPI, and Tmin (second row), and LF, SPI, and PET (third row), respectively. Blue bars correspond to the median p-values and red dots corresponds to the percentage of significant results (p-value < 0.05). Asterisks corresponds to data from the previous year.
Remotesensing 13 00757 g004
Figure 5. Monthly results from the multiple linear regression analysis for LF, precipitation, and Tmax (first row), LF, precipitation, and Tmin (second row), and LF, precipitation, and PET (third row). Blue bars correspond to the median p-values and red dots corresponds to percentage of significant results (p-value < 0.05). Asterisks corresponds to data from the previous year.
Remotesensing 13 00757 g005
Figure 6. Monthly mean correlation coefficient between R (LF vs. TRI) and (a) mean annual maximum temperature, (b) mean annual minimum temperature, (c) mean annual temperature, (d) precipitation, (e) potential evapotranspiration, (f) ratio P/PET, (g) altitude, (h) latitude, and (i) longitude of every sampled site. Significant (p < 0.01) cases (black dots). Asterisks: Data from the previous year.
Remotesensing 13 00757 g006
Table 1. Information on the locations of the Aleppo pine samples used in this study. MAP, MAT, and PET are the mean annual precipitation, temperature, and potential evapotranspiration, respectively.
NumberSampleSiteAlt.
(m)
MAP
(mm)
MAT
(°C)
PET
(mm)
Lat.Long.
1SPAIN_AYE_PIHA_MAyerbe92463012.2110242.32−0.84
2SPAIN_CAB_PIHA_MCabeco54528916.3116338.51−0.40
3SPAIN_CAM_PIHA_MEstación esquí Javalambre16766009.0113740.11−1.04
4SPAIN_CDG_PIHA_MSierra de Genessies52580814.8122041.000.81
5SPAIN_CDM_PIHA_MCaldes de Montbui34058815.3102341.642.15
6SPAIN_CNC_PIHA_MPN Cazorla—C. Nuevos96063613.6126538.24−2.76
7SPAIN_CON_PIHA_MConfrides109085313.4116338.70−0.28
8SPAIN_FHI_PIHA_MFont de la Figuera68035914.8118538.83−0.93
9SPAIN_FNT_PIHA_MAlcoy102240113.2118538.67−0.54
10SPAIN_GAV_PIHA_MGava17059915.8110841.311.97
11SPAIN_HUT_PIHA_MHuetos99552312.0112540.75−2.52
12SPAIN_JAL_PIHA_MJalance57138714.3119339.19−1.15
13SPAIN_LAF_PIHA_MLa Figuera54047314.9120641.210.73
14SPAIN_MAN_PIHA_MMaigmo norte84558013.7118538.52−0.64
15SPAIN_MAS_PIHA_MMaigmo sur76237115.7122338.50−0.60
16SPAIN_PDF_PIHA_MPuig de les Forques18574714.5102942.292.86
17SPAIN_PDP_PIHA_MPinar del Pla128058213.0119940.710.19
18SPAIN_PSC_PIHA_MPN Cazorla-P. de Segura103067915.0126538.36−2.72
19SPAIN_SES_PIHA_MSierra Espuña84638715.1122137.87−1.52
20SPAIN_SSJ_PIHA_MSierra de Sant Jordi23574714.5102942.322.83
21SPAIN_TOR_PIHA_MTorralba109552112.1116140.30−2.25
22SPAIN_VAC_PIHA_MValdecuenca14416019.7113740.29−1.45
Publisher’s Note: MDPI stays neutral with regard to jurisdictional claims in published maps and institutional affiliations.

