
Indian Ocean Crossing Swells: New Insights from “Fireworks” Perspective Using Envisat Advanced Synthetic Aperture Radar


1
National Ocean Technology Center, Ministry of Natural Resources, Tianjin 300112, China
2
Laboratoire d’Océanographie Physique Spatiale, Centre de Brest, Ifremer, 29280 Plouzané, France
3
Collecte Localisation Satellites, 29280 Plouzané, France
*
Author to whom correspondence should be addressed.
Remote Sens. 2021, 13(4), 670; https://doi.org/10.3390/rs13040670
Submission received: 9 January 2021
/
Revised: 10 February 2021
/
Accepted: 11 February 2021
/
Published: 12 February 2021
(This article belongs to the Special Issue Feature Paper Special Issue on Ocean Remote Sensing)
Abstract
:Synthetic Aperture Radar (SAR) in wave mode is a powerful sensor for monitoring the swells propagating across ocean basins. Here, we investigate crossing swells in the Indian Ocean using 10-years Envisat SAR wave mode archive spanning from December 2003 to April 2012. Taking the benefit of the unique “fireworks” analysis on SAR observations, we reconstruct the origins and propagating routes that are associated with crossing swell pools in the Indian Ocean. Besides, three different crossing swell mechanisms are discriminated from space by the comparative analysis between results from “fireworks” and original SAR data: (1) in the mid-ocean basin of the Indian Ocean, two remote southern swells form the crossing swell; (2) wave-current interaction; and, (3) co-existence of remote Southern swell and shamal swell contribute to the crossing swells in the Agulhas Current region and the Arabian Sea.
1. Introduction
It is estimated that more than 75% waves across the world seas are generated by remote storms that propagate as long-period ocean waves or swells [1]. In particular, crossing swells [2], defined as complex sea state of at least two swell systems with different directions, are of importance in navigation safety. Furthermore, an understanding of climatology of crossing swells would be helpful in interpreting the global wave climate change.
The strongly swell-dominated areas, termed “swell pools”, in the ocean basins have been identified by the means of altimeters decades ago [3]. To date, Synthetic Aperture Radar (SAR), particularly equipped with the specific Wave Mode (WM), is the only space-borne sensor that is able to provide the directional ocean wave spectra on a global scale in the long term [4,5]. In contrast to altimeters only providing wave height without directional information, wave spectra from SAR WM could readily distinguish swell from local wind sea and even separate different swell systems. Hence, based on 10-years Envisat Advanced Synthetic Aperture Radar (ASAR) WM observations, a global view on crossing swell pools has been revealed [6]. However, as reported by Jiang et al. [7], some limitations for crossing swell on SAR description still exist, mainly owing to the questionable ASAR retrievals (e.g., [8]). Besides, the in-depth understanding of the formation mechanism of crossing swell remains improved from the interpretation using SAR WM.
Taking advantage of space-time consistency of swells in open ocean discovered by [9], the so-called “fireworks” technique, in which the integral properties of swells are derived from SAR WM observations, and used to both monitor and predict their evolution across the globe, has been developed by Collard et al. [10]. Because the “fireworks” technique could be employed to enhance the capability of ocean swell monitoring [11,12,13], a question of interest becomes whether unique analysis might improve our knowledge on geophysical processes for crossing swells from space?
In this communication, taking the Indian Ocean as an example, we aim to identify the crossing swell regions and interpret their forming mechanism from space using the “fireworks” analysis on 10 years of Envisat ASAR WM data.
2. Data Sets and Methodology
2.1. ASAR Level-2 Swell Spectra
We use the full mission Envisat ASAR archive over 10 years (December 2003–April 2012). Operating in wave mode, the ASAR imagettes (Level-1) covering 10 × 7 km in the open ocean every 100 km, have been officially produced to Level-2 wave spectra by European Space Agency (ESA), employing the cross-spectra [14] and quasi-linear inversion procedure [15]. The SAR derived wave spectra are further decomposed into two components. The partitioning is implemented, as described in [16], using the classical image segmentation scheme, called “watershed”. Finally, parameters of significant swell height, peak wave period, and direction are estimated for each wave partitions.
Here, we only retain the SAR observed swell partitions of good quality. Following the procedure outlined in [10], we use mainly two criteria: (1) in order to exclude the retrievals that are affected by azimuth cut-off, only measurements under 3–9 m/s wind speed and with a wavelength >200 m are retained. (2) The spectra resulted from SAR imagette with normalized variance >1.5 are regarded as inhomogeneous and, thereby, rejected. In the Indian Ocean, our quality-control yields the Level-2 swell observations with a rejection rate of around 18%.
2.2. “Fireworks” Analysis: ASAR Level-3 Swell Spectra
Furthermore, the quality-controlled ASAR swells are processed into a higher level (Level-3) using the “fireworks” algorithm detailed in [10,17]. The main steps are briefly, as follows. The observed swells are firstly retro-propagated along great circles until land/island in step of 3 h, neglecting wave-current interactions. Secondly, the swell origins (usually storms) are identified by seeking the spatiotemporal convergence of the retro-propagated trajectories. As a result, the “fireworks” analysis separates ASAR Level-2 swells into:
- Refocused swell observations: the converging swell partitions. From validation [18], this sub-dataset of swells has proven to be of better qualify due to space-time consistency. In addition to SAR observed swell as snapshot, the whole swell evolutions (i.e., generation date/area and three-hourly propagation from origin towards coast) are also provided. The percentage is around 30% in the Indian Ocean.
- Non-refocused data: the inconsistent observed swell partitions, which failed to be converged in our “fireworks” analysis and, thus, irrelevant to any storm events.
It is worth noting that the relative low rate (30%) of retained in “fireworks” reported here is consistent with that (25%, globally) regarding Level-3 swell products of Sentinel-1A/B in the framework of Copernicus Marine Environment Monitoring Service (CMEMS) officially released by ESA [19]. The explanation is mainly that our “fireworks” quality-controls can filter most of the suspicious SAR retrievals (badly inversed swell partitions and 180° ambiguity, for instance, see [7,18]). Additionally, it is also reasonable to raise the hypothesis that the majority of data (~70%) that are considered as non-refocused are not all noise, and we might mine geophysical meanings.
2.3. Auxiliary Data
Blended winds from Institut français de recherche pour l’exploitation de la mer (Ifremer) [20], i.e., six-hourly ocean winds from different scatterometers via the kriging technique, are used here. Regarding ocean current, we rely on the daily geostrophic currents from the ESA GlobCurrent project (http://www.globcurrent.org accessed on 10 February 2021), which is an optimal analysis on multiple altimeters. They are both available on global 0.25° grid.
3. Core Crossing Swell Pool and Its Properties
In this study, the criterion of defining a crossing swell event include (1) the angle between the two swell systems is larger than 40°, (2) the wave height of the less energetic swell is larger than 1/2 of another swell, and both components >0.5 m. These thresholds are equivalent to [6,7].
In each location, we first calculated the probability of crossing swells using the number of crossing swell cases divided by the total number of records. Subsequently, we further normalized the probability through dividing by the peak value, making the comparative analysis between the results from “fireworks” and original SAR easier, as shown in Figure 1.
As a result, statistics on 10-years Envisat wave mode ASAR yields the normalized occurrence map of the Indian Ocean crossing swells. Generally, both of the maps (using all ASAR observed swells and only refocused) highlight the core of crossing swell pool in the mid-ocean basin (hereafter, Region A: 15°S–5°N, 75°–90°E).
Although consistent with previous studies [6,7] regarding geographical distribution, extra properties of the pool and its forming mechanism (e.g., origins and pathways) could be further investigated using “fireworks”. We first illustrate this by the representative crossing swell case that occurred in Region A (Figure 2). This event was captured by refocused ASAR “fireworks” data on 17 April 2008 at 12.36°S/83.03°E (black box in Figure 2c). The crossing swell, i.e., two systems propagating northwestward and northeastward, is clearly presented in the ASAR spectral retrieval, and js also visible from the imagette (blue and green lines indicating wave crests of two swells respectively overlaid on Figure 2a).
The generation and propagation of this event could be revealed from space, as depicted in Figure 2c. Based on “fireworks” analysis, the origins of the two swell systems were identified in the Southern Ocean, being represented as red disks. Accordingly, two extra-tropical storms (up to 35 knots) could be found from blended winds (Figure 2d) in Kerguelen Islands and west Australia, respectively, five days before the ASAR acquisition. Swells that were generated from these intense storms radiated and then crossed. Here, we predict the swell arrival dates and locations (colored lines) apart from storms, following linear wave propagation theory with the group velocity derived from ASAR swell periods (12 s and 14.5 s for two systems). As a result, the prediction lines from different swell generation area intersect close to ASAR acquisition in both space and time, indicating the agreement between the satellite observation and the analysis from “fireworks”. Therefore, in addition to the detection of crossing swell events, origins, and propagating routes that are associated with crossing swell pool could be reconstructed, providing a mechanism of these complex sea states from space, especially by our unique “fireworks” technique.
Here, we statically analyze the Region A using 10-years “fireworks” data. Ocean waves that are responsible for crossing swells mainly originate from storms in the Southern Ocean westerly around 40°S (black dots), as shown in Figure 3a. In addition, the normalized occurrences of swell traveling routes (i.e., dots backward and forward propagated from SAR observations in “fireworks” for every 3 h) are overlaid on the map. From the density, the propagation occurrences peak in the core crossing swell pool, decreasing towards the Southern Ocean (swell origins) and the north Indian Ocean coast (swell destinations). This characterizes the two propagating routes from the southwest (SW) and southeast (SE) Indian Ocean towards the Bay of Bengal and the Arabian Sea, respectively. From the time difference (“fireworks” three-hourly propagations minus the ASAR actual observations, see colored lines), we could further infer that swells from SW (SE) of the basin travel six to eight days before they cross each other in Region A, and then reach the coast in the Bay of Bengal (the Arabian Sea) two (4) days later.
Furthermore, the distribution of SAR observed swell wavelength and direction are investigated. Crossed swells in Region A generally propagate following swell incident regimes towards northeast (20–50°) and northwest (320–350°), coinciding with the two corridor-like pathways that are presented in colored map of Figure 3a, as shown by the spectral statistics presented in Figure 3b. Note that more swells are coming from southwest, and these swells have a longer wavelength (350 m approximately) than those from southeast (around 300 m) statistically. Both of these features indicate that Southern swells have more influence on the Bay of Bengal than the Arabian Sea, in line with previous finding from modeling [21,22].
4. Discussion
From Figure 1, the major discrepancy between the two maps is the missing of crossing swells detected from refocused data in Level-3 “fireworks”. This is because some ASAR observed swell partitions consisting the crossing sea that were non-refocused in “fireworks” processing. In this study, we focus on three noticeable regions:
- Region B: offshore South Africa (40°–35°S, 20°–30°E);
- Region C: South off Madagascar (38°–28°S, 35°–45°E); and,
- Region D: the Arabian Sea (10°S–20°N, 60°–70°E).
In Figure 4a–f, we statistically analyze the swell spectral distribution from refocused and non-refocused ASAR swell partitions for these regions. All of the distributions from refocused data (Figure 4a–c) are different from the distinct bi-directional incident swell signature that is presented in Figure 3b. Moreover, non-refocused data distributions (Figure 4d–f) show various patterns, indicating different reasons for filtering out through “fireworks” analysis.
In addition, average altimeter-derived current speeds (Figure 4g) illustrate that Region B is well located in the main stream of the Agulhas current, and Region C is in the north of Agulhas Return Current (ARC). It implies the possibility of relation to this strong current, different from Region D in Arabian Sea (Figure 4h). Hence, we discuss Region B, C, and D separately below.
4.1. Crossing Swells in Agulhas Current Regions
From the spectral statistics presented in Figure 4a,d, the ASAR observed crossing swells in Region B have two sorts: (1) refocused ASAR swells mainly originated from Southern Ocean and propagated towards northeastward and (2) non-refocused swell with a broad directional pattern scattering from north to east.
The fact that most of the observed crossing swells here did not converge in our “fireworks” procedure could be explained by the wave–current interaction. This effect includes wave spectrum modulation, wave energy enhancement, or attenuation by the co-existing surface current [23,24]. The equatorial currents could refract swells up to 10° according to buoy records, as documented by [25]. Here, Region B is characterized as the Agulhas Current main stream, the strongest western boundary in Southern Hemisphere [26]. The average current speeds are >1.2 m/s during the 10-years Envisat mission, as illustrated in the GlobCurrent current map shown in Figure 4g. Because of the reflection of the strong Agulhas, incoming swells from the Southern Ocean would deviate from their incident directions and, thus, severely interfere with the refocusing algorithm of retro-propagated great circle trajectories. Recall that ignoring ocean current is one of the assumptions for our “fireworks” technique.
The complex crossing sea states that were caused by wave-current interaction were also documented by other remotely sensed data. For instance, investigation using Sentinel-2 optical imagery has reported the spectra splitting of incident swell caused by Agulhas Current [27]. Here, this formation mechanism of crossing swell is highlighted through inter-comparison between the remaining and rejected data from the SAR “fireworks”.
This could also be demonstrated by the typical case presented in Figure 5. Inferred from “fireworks”, the extra-tropical storm (>50 knots wind speed from Ifremer blended winds) generated swells that were captured by 12 ASAR WM imagettes (numbered from 0 to 11) along descending satellite orbit on 18 April 2007 in the Agulhas region. Figure 6 presents the corresponding ocean spectra retrieved from ASAR WM imagettes. ASAR observations #3 and 6 are located in the stronger Agulhas current areas, when compared to the acquisitions of #1 and 4, as shown in GlobCurrent surface velocity colored in Figure 5 (right). Correspondingly, from Figure 6, in contrast to the unimodal swell spectra (#1 and #4) observed from ASAR in the absence of strong Agulhas current, the ocean swell spectra (#3 and #6) exhibit bimodality due to the spectra splitting by the wave–current interaction and, thus, present the crossing swell states. Although the surface current is not taken to consideration in our “fireworks” analysis in present version, the crossing swell mechanism of wave–current interaction could be highlighted by the careful examination of these rejected observations.
Here, we also discuss the possibility of including wave–current interactions in an improved “fireworks” algorithm. Even if great-circles back-tracing is most often in good agreement with the location of large storms, there are indeed some cases in which there are some inconsistencies (as mentioned by [25], and also highlighted here). These arise from wave refraction by surface currents. One feasible solution is based on the spherical ray tracing using reconstructed surface currents that are inferred from satellite altimetry, rather than the present simpler great-circle propagation. Such a technique has been tested for wave spectral observations from buoy, and it could also be implemented in an improved version of “fireworks” algorithm for SAR derived swells. However, this implementation requires a careful analysis, since, as it has experienced [25], directional fluctuations of the order of 10° can be observed at the buoy location, which result from the arrival of wave packets that have travelled along the different rays. This can bias the directional average at the buoy, not to mention the significant wave height.
With respect to Region C, statistical analysis on non-refocused swell observations (in Figure 4e) shows a very scattered pattern, and the cluster containing the highest density of points representing the swell propagating towards directions that range 30–70° (represented by black dashed lines). Examining the Globcurrent map shown in Figure 4g, one could see that the eastward flowing ARC (along 40°S approximately, ranging from 20° to 35°E) is just located in the regime of non-refocused swell propagating pathway that corresponds to the spectral statistical analysis in Figure 4e. Thus, the relatively strong ARC (though weaker than core Agulhas current) could interfere the current-ignored retro-propagation in firework, and lead to the non-refocused, and thereby discrepancy, of crossing swell in Figure 1.
4.2. Crossing Swells in the Arabian Sea
From statistics of ASAR WM spectra that are shown in Figure 4c, only swells originating from the Southern Ocean and northward propagating towards the Arabian Sea could be refocused in “fireworks” analysis. With respect to the non-refocused (Figure 4f), the pattern of directional statistics indicates two kinds of waves that contribute the crossing swells that were identified from Level-2 observations, but they were rejected during “fireworks”: (1) swells propagating from SE and (2) waves from northwest (NW). We examine these two cases of ASAR left-overs spectra and discuss, as follows.
The island blocking effect could explain the non-refocusing of ASAR observed swells from SE in the Arabian Sea. When the swells from directions of 140–160° (regime defined by dash lines in Figure 4f,h) propagate across the Maldives islands, although attenuation and diffraction will occur, some swell energy will continuously travel and arrive at the Arabian Sea, thus crossing with other swells. However, because of the island obstructions, ASAR observed swells from these directions could not be retro-propagated and then associated with their origins successfully and, therefore, be regarded as left-overs in the “fireworks”.
Regarding waves from NW, the reason of missing crossing swell may be attributed to shamal swell events. The northwest propagating shamal swells [28] in the Arabian Sea is in agreement with the ASAR derived spectra towards SE regarding the propagation direction (Figure 4h). In fact, because shamal swells are generated by the strong northwesterly winds in the Arabian Peninsula [29], it is difficult to associate these swells with storms (the retro-propagation was stopped near the coast in our “fireworks” analysis). Therefore, another crossing swell formation mechanism, i.e., a combination of Southern Ocean swells and shamal swells could be revealed.
Using the buoy data along the west coast of India, Aboobacker et al. [28] reported a representative shamal swell event in the Arabian Sea throughout 2–4 February 2008. Here, we revisit this event using SAR data from space. This shamal swell case was captured by wave mode ASAR (Figure 7a) on 3 February 2008 at 16.26°N/61.80°E, as shown in Figure 7 (red box in Figure 7b). The SW propagating swell system from ASAR derived spectrum that is shown in Figure 7a (2nd partition) could be associated with that shamal event. From three-days successive Ifremer blended wind maps in Figure 7c–e, the northwesterly shamal wind event began on 1 February in the Persian Gulf, blew offshore the Arabian Peninsula on 2 February, and then vanished over the Arabian Sea on 3 February at the time of SAR observation. Additionally, one could see the topography effect of the Arabic Peninsula on the wind flow, i.e., the winds coming from the Persian Gulf were obstructed at the Hormuz Strait and separated into two flows in the Arabian Sea and then created the two swell systems (one from N and one from NW) that are presented in Figure 7a.
Besides, we could further identify the 1st swell partition in Figure 7a as a long-distance traveling swell system (the pathway depicted as a dashed line in Figure 7b) originating from the extra-tropical storm on 25 January in the Southern Ocean (>50 knots from Ifremer blended winds in bottom of Figure 7b) using ASAR WM “fireworks” analysis. Hence, in this case, the complex crossing swell state resulted from the co-existence of Southern Ocean swell and shamal swell could be interpreted from the SAR observation using “fireworks” analysis, complementary to the in situ that only documented the shamal swell [28].
Another interesting pattern shown in Figure 4f is that some points (close to North) representing swells from the Southern Ocean are still retained in the non-refocused subset. This portion data failed to be refocused in “fireworks”, owing to the similar wave-current interaction mechanism that was mentioned in the last section. Not Agulhas, but equatorial currents and eddies, in the midway of propagating route, refract some of these long-distance traveling swells. Therefore, in the present “fireworks”, this wave–current interaction bends the back-propagated great-circle rays and leads to a focus on non-storm regions (over sea ice or even on Antarctica for instance). The examples of buoy measurements and related theory are detailed in [25].
5. Conclusions and Perspectives
In this communication we present the new insights into Indian Ocean crossing swells from 10 years Envisat ASAR data taking advantage of “fireworks” analysis. Our results present the three crossing-swell dominated areas, i.e., the mid-Indian Ocean basin, the Arabian Sea, and Agulhas region.
The “fireworks” analysis on SAR WM observations improves our understanding of crossing swells from space. On the one hand, knowledge on swell origins, propagating pathways for crossing swell pool (the mid-Indian Ocean basin), are revealed from the “fireworks” product. On the other hand, some of the rejected observations in the “fireworks analysis” indeed make geophysical sense, revealing the formation of crossing swell. Thus, the discrimination of crossing swell mechanisms could be revealed by comparative analysis taking opportunity of the SAR WM fireworks technique. In the Indian Ocean, the wave–current interaction and the combination of remote southern swell and local shamal swell are highlighted in the Agulhas current region and the Arabian Sea, respectively, as compared to the mechanism of two remote southern swells cross-over in the mid-Indian Ocean basin.
Based on this 10-year remotely sensed swell dataset processed by the unique “fireworks” technique, studies could be further performed regarding the spatio-temporal distributions of crossing swells that resulted from different mechanisms. This long-term analysis on a global scale could deepen our understanding of nature of ocean. Future work will also be dedicated to the improvement of our “fireworks” algorithm by considering wave–current interactions.
Although the Envisat mission ended in 2012, C-band SARs that are equipped with wave mode continue providing swell spectra nowadays, such as European Copernicus missions Sentinel-1A/B [19] and Chinese Gaofen-3 [30]. In addition, Chinese–French joint mission CFOSAT launched in 2018, which is also capable of providing 2D ocean wave spectra globally [31]. With the accumulation of more data in near future, it is encouraging to enlarge the temporal series of remotely sensed swell spectra archive and merging multi-sensor data, therefore improving the significance of our results.
Author Contributions
Conceptualization, H.W.; Investigation, H.W., A.M. and R.H.; Supervision, B.C.; Writing—original draft, H.W. All authors have read and agreed to the published version of the manuscript.
Funding
This work was supported by the ESA-MOST China Dragon-5 Project under grant 58290.
Institutional Review Board Statement
Not applicable.
Informed Consent Statement
Not applicable.
Data Availability Statement
Envisat ASAR data were provided by the ESA. Blended winds and ocean current data were obtained from Ifremer and ESA’s GlobCurrent project.
Acknowledgments
The authors thank the three anonymous referees for their helpful comments.
Conflicts of Interest
The authors declare no conflict of interest.
References
- Semedo, A.; Sušelj, K.; Rutgersson, A.; Sterl, A. A global view on the wind sea and swell climate and variability from ERA-40. J. Clim. 2011, 24, 1461–1479. [Google Scholar] [CrossRef]
- Vettor, R.; Soares, C.G. A global view on bimodal wave spectra and crossing seas from ERA-interim. Ocean Eng. 2020, 210, 107439. [Google Scholar] [CrossRef]
- Chen, G.; Chapron, B.; Ezraty, R.; Vandemark, D. A global view of swell and wind sea climate in the ocean by satellite altimeter and scatterometer. J. Atmos. Ocean. Technol. 2002, 19, 1849–1859. [Google Scholar] [CrossRef]
- Hasselmann, K.; Chapron, B.; Aouf, L.; Ardhuin, F.; Collard, F.; Engen, G.; Hasselmann, S.; Heimbach, P.; Janssen, P.; Johnsen, H.; et al. The ERS SAR wave mode: A breakthrough in global ocean wave observations. In ERS Missions: 20 Years of Observing Earth, 1st ed.; Fletcher, K., Ed.; European Space Agency: Noordwijk, The Netherlands, 2013; pp. 165–198. [Google Scholar]
- Wang, H.; Wang, J.; Yang, J.S.; Ren, L.; Zhu, J.H.; Yuan, X.Z.; Xie, C.H. Empirical algorithm for significant wave height retrieval from wave mode data provided by the Chinese satellite Gaofen-3. Remote Sens. 2018, 10, 363. [Google Scholar] [CrossRef]
- Li, X.-M. A new insight from space into swell propagation and crossing in the global oceans. Geophys. Res. Lett. 2016, 43, 5202–5209. [Google Scholar]
- Jiang, H.; Mouche, A.; Wang, H.; Babanin, A.; Chapron, B.; Chen, G. Limitation of SAR quasi-linear inversion data on swell climate: An example of global crossing swells. Remote Sens. 2017, 9, 107. [Google Scholar] [CrossRef]
- Portilla-Yandun, J.; Valladares, C.; Violante-Carvalho, N. A hybrid physical-statistical algorithm for SAR wave spectra quality assessment. IEEE J. Sel. Top. Appl. Earth Obs. Remote Sens. 2019, 12, 3943–3948. [Google Scholar] [CrossRef]
- Munk, W.H.; Miller, G.R.; Snodgrass, F.E.; Barber, N.F. Directional recording of swell from distant storms. Philos. Trans. R. Soc. A Math. Phys. Eng. Sci. 1963, 255, 505–584. [Google Scholar] [CrossRef]
- Collard, F.; Ardhuin, F.; Chapron, B. Monitoring and analysis of ocean swell fields from space: New methods for routine observations. J. Geophys. Res. 2009, 114, C07023. [Google Scholar] [CrossRef]
- Ardhuin, F.; Chapron, B.; Collard, F. Observation of swell dissipation across oceans. Geophys. Res. Lett. 2009, 36, L06607. [Google Scholar] [CrossRef]
- Husson, R.; Ardhuin, F.; Collard, F.; Chapron, B.; Balanche, A. Revealing forerunners on Envisat wave mode ASAR using the Global Seismic Network. Geophys. Res. Lett. 2012, 39, L15609. [Google Scholar] [CrossRef]
- Stopa, J.E.; Ardhuin, F.; Husson, R.; Jiang, H.; Chapron, B.; Collard, F. Swell dissipation from 10 years of Envisat advanced synthetic aperture radar in wave mode. Geophys. Res. Lett. 2016, 43, 3423–3430. [Google Scholar] [CrossRef]
- Engen, G.; Johnsen, H. SAR-ocean wave inversion using image cross spectra. IEEE Trans. Geosci. Remote Sens. 1995, 33, 1047–1056. [Google Scholar] [CrossRef]
- Chapron, B.; Johnsen, H.; Garello, R. Wave and wind retrieval from SAR images of the ocean. Ann. Telecommun. 2001, 56, 682–699. [Google Scholar]
- Portilla, J.; Ocampo-Torres, F.J.; Monbaliu, J. Spectral partitioning and identification of wind sea and swell. J. Atmos. Ocean. Technol. 2009, 26, 107–122. [Google Scholar] [CrossRef]
- Husson, R. Development and Validation of a Global Observation-Based Swell Model Using Wave Mode Operating Synthetic Aperture Radar. Ph.D. Thesis, Université de Bretagne Occidentale, Brest, France, 2012. [Google Scholar]
- Wang, H.; Mouche, A.; Husson, R.; Chapron, B. Dynamic validation of ocean swell derived from Sentinel-1 wave mode against buoys. In Proceedings of the 2018 IEEE International Geoscience and Remote Sensing Symposium, Valencia, Spain, 22–27 July 2018; pp. 3223–3226. [Google Scholar]
- Charles, E.; Husson, R.; Taburet, N.; Mouche, A.; Wang, H. Description and validation of the Marine Copernicus Near-Real-Time wave products: Derived from altimeter and SAR measurements. In Proceedings of the User Consultation Meeting—CCI SeaState, Brest, France, 8–9 October 2019; Available online: https://seastatecci-ucm.sciencesconf.org/data/pages/HUSSON_SEASTATECCI_UCM2019.pdf (accessed on 3 February 2021).
- Desbiolles, F.; Bentamy, A.; Blanke, B.; Roy, C.; Mestas-Nuñez, A.M.; Grodsky, S.A.; Herbette, S.; Cambon, G.; Maes, C. Two decades [1992–2012] of surface wind analyses based on satellite scatterometer observations. J. Mar. Syst. 2017, 168, 38–56. [Google Scholar]
- Remya, P.; Kumar, R.; Basu, S.; Sarkar, A. Wave hindcast experiments in the Indian Ocean using MIKE 21 SW model. J. Earth Syst. Sci. 2012, 121, 385–392. [Google Scholar]
- Zheng, C.W.; Li, C.Y.; Pan, J. Propagation route and speed of swell in the Indian Ocean. J. Geophys. Res 2018, 123, 8–21. [Google Scholar] [CrossRef]
- Romero, L.; Lenain, L.; Melville, W.K. Observations of surface wave–current Interaction. J. Phys. Oceanogr. 2017, 47, 615–632. [Google Scholar] [CrossRef]
- Quilfen, Y.; Chapron, B. Ocean surface wave-current signatures from satellite altimeter measurements. Geophys. Res. Lett. 2019, 46, 253–261. [Google Scholar] [CrossRef]
- Gallet, B.; Young, W.R. Refraction of swell by surface currents. J. Mar. Res. 2014, 72, 105–126. [Google Scholar] [CrossRef]
- Bryden, H.L.; Beal, L.M.; Duncan, L.M. Structure and transport of the Agulhas Current and its temporal variability. J. Oceanogr. 2005, 61, 479–492. [Google Scholar] [CrossRef]
- Kudryavtsev, V.; Yurovskaya, M.; Chapron, B.; Collard, F.; Donlon, C. Sun glitter imagery of surface waves. Part 2: Waves transformation on ocean currents. J. Geophys. Res. 2017, 122, 1384–1399. [Google Scholar] [CrossRef]
- Aboobacker, V.M.; Vethamony, P.; Rashmi, R. “Shamal” swells in the Arabian Sea and their influence along the west coast of India. Geophys. Res. Lett. 2011, 38, L03608. [Google Scholar] [CrossRef]
- Aboobacker, V.M.; Shanas, P.R. The climatology of shamals in the Arabian Sea-Part 2: Surface waves. Int. J. Clim. 2018, 38, 4417–4430. [Google Scholar] [CrossRef]
- Wang, H.; Wang, J.; Zhang, B.; Zhu, J. Evaluating ocean wave spectra derived from quad-polarized GF-3 wave mode SAR images against buoys. In Proceedings of the SPIE Remote Sensing, Strasbourg, France, 9–12 September 2019. [Google Scholar] [CrossRef]
- Hauser, D.; Tourain, C.; Hermozo, L.; Alraddawi, D.; Aouf, L.; Chapron, B.; Dalphinet, A.; Delaye, L.; Dalila, M.; Dormy, E.; et al. New observations from the SWIM radar on-board CFOSAT: Instrument validation and ocean wave measurement assessment. IEEE Trans. Geosci. Remote Sens. 2021, 59, 5–26. [Google Scholar] [CrossRef]
Figure 1.
Distribution of Indian Ocean crossing swells from (a) all Level-2 swell observations and (b) only refocused in Level-3 “fireworks”, respectively, for 10-years Envisat wave mode Advanced Synthetic Aperture Radar (ASAR).
Figure 1.
Distribution of Indian Ocean crossing swells from (a) all Level-2 swell observations and (b) only refocused in Level-3 “fireworks”, respectively, for 10-years Envisat wave mode Advanced Synthetic Aperture Radar (ASAR).
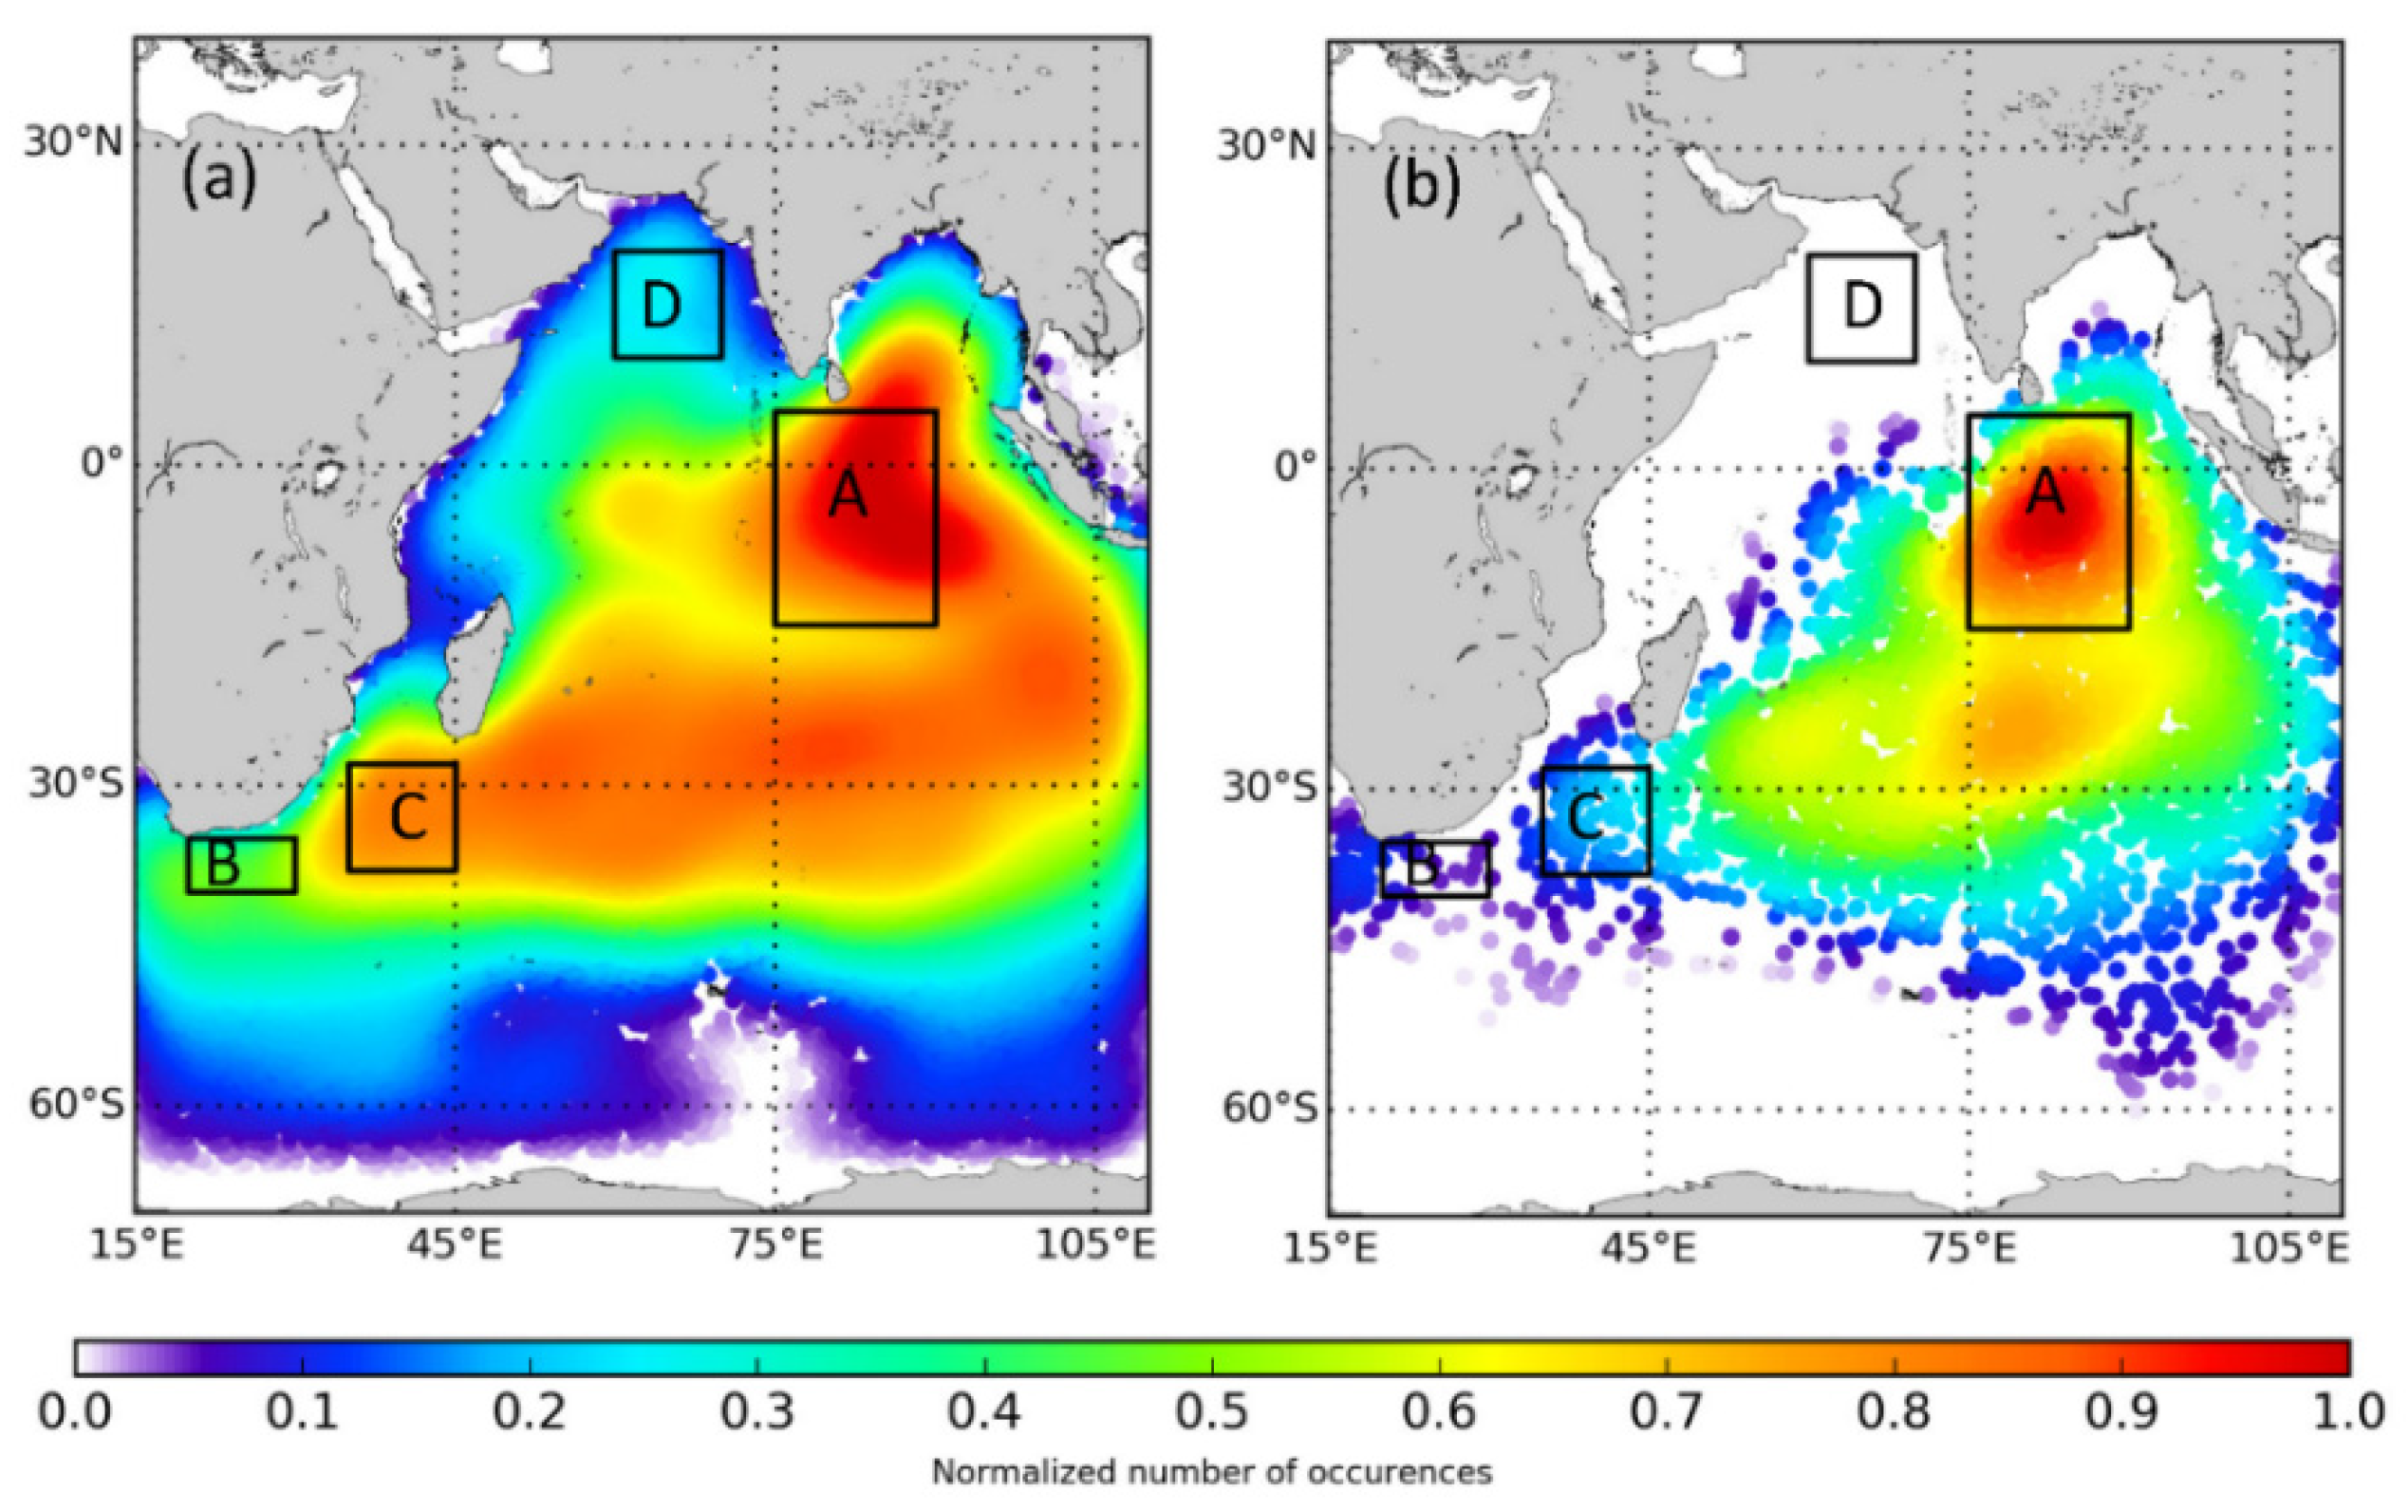
Figure 2.
Example of crossing swell in Region A from refocused ASAR observation. (a) Roughness of ASAR imagette and (b) its corresponding Level-2 swell spectrum (17 April 2008). (c) Map illustrating the generation and propagation of this event, with dashed and colored lines indicating swell propagating routes, and the predicted arrival times from the swell origins, respectively. (d) Ifremer blended winds (12 April 2008 12:00). Red disks and white crosses indicate origins of crossing swell systems inferred from “fireworks” analysis in (c,d).

Figure 3.
(a) Map illustrating the swell propagation routes (colored shade), propagation days (colored lines) and origins (dots); and (b) swell spectral statistics (normalized occurrence probability) for the swells contributing the crossing swells pool in the mid-Indian Ocean basin (Region A) from the refocused ASAR WM data in the “fireworks” analysis. The dash lines indicate the swell propagating regimes coming from SW and SE regions of the basin.

Figure 4.
Spectral statistics of swell partitions from (a–c) refocused and (d–f) non-refocused ASAR WM spectra in “fireworks” for the Regions of B, C, and D. Maps for (g) Region B and C, with colors representing GlobalCurrent currents (2003–2012 average), and (h) Region D.
Figure 4.
Spectral statistics of swell partitions from (a–c) refocused and (d–f) non-refocused ASAR WM spectra in “fireworks” for the Regions of B, C, and D. Maps for (g) Region B and C, with colors representing GlobalCurrent currents (2003–2012 average), and (h) Region D.

Figure 5.
Typical Example of crossing swells in Region B. Right of map illustrates ASAR observed swells (numbered from 0 to 11) in the Agulhas Current (color-coded GlobCurrent current speed) on 18 April 2007. These swells were originated from the extra-tropical cyclone on 17 April (on the left, with color representing Ifremer blended winds, and white cross indicating “fireworks” determined swell origin).

Figure 6.
(a–d) Swell spectra from Envisat ASAR imagettes #1,3,4,6 in Figure 5.
Figure 6.
(a–d) Swell spectra from Envisat ASAR imagettes #1,3,4,6 in Figure 5.

Figure 7.
Example of crossing swell in the Arabian Sea. (a) ASAR observed two-dimensional (2-D) swell spectrum on 3 February 2008. Maps of Ifremer blended winds generating (b) Southern swell and (c–e) shamal swell on 25 January and 1–3 February, respectively.
Figure 7.
Example of crossing swell in the Arabian Sea. (a) ASAR observed two-dimensional (2-D) swell spectrum on 3 February 2008. Maps of Ifremer blended winds generating (b) Southern swell and (c–e) shamal swell on 25 January and 1–3 February, respectively.

Publisher’s Note: MDPI stays neutral with regard to jurisdictional claims in published maps and institutional affiliations. |
© 2021 by the authors. Licensee MDPI, Basel, Switzerland. This article is an open access article distributed under the terms and conditions of the Creative Commons Attribution (CC BY) license (http://creativecommons.org/licenses/by/4.0/).
Share and Cite
MDPI and ACS Style
Wang, H.; Mouche, A.; Husson, R.; Chapron, B. Indian Ocean Crossing Swells: New Insights from “Fireworks” Perspective Using Envisat Advanced Synthetic Aperture Radar. Remote Sens. 2021, 13, 670. https://doi.org/10.3390/rs13040670
AMA Style
Wang H, Mouche A, Husson R, Chapron B. Indian Ocean Crossing Swells: New Insights from “Fireworks” Perspective Using Envisat Advanced Synthetic Aperture Radar. Remote Sensing. 2021; 13(4):670. https://doi.org/10.3390/rs13040670
Chicago/Turabian StyleWang, He, Alexis Mouche, Romain Husson, and Bertrand Chapron. 2021. "Indian Ocean Crossing Swells: New Insights from “Fireworks” Perspective Using Envisat Advanced Synthetic Aperture Radar" Remote Sensing 13, no. 4: 670. https://doi.org/10.3390/rs13040670
Note that from the first issue of 2016, this journal uses article numbers instead of page numbers. See further details here.