
On the Spatial Patterns of Urban Thermal Conditions Using Indoor and Outdoor Temperatures
by
 , and
, and
Sadroddin Alavipanah
1, 
Dagmar Haase
1,
Mohsen Makki
1,*,
Mir Muhammad Nizamani
2 and
Salman Qureshi
1 1
Institute of Geography, Humboldt University of Berlin, Rudower Chaussee 16, 12489 Berlin, Germany
2
Hainan Key Laboratory for Sustainable Utilization of Tropical Bioresources, School of Life and Pharmaceutical Sciences, Hainan University, Haikou 570228, China
*
Author to whom correspondence should be addressed.
Remote Sens. 2021, 13(4), 640; https://doi.org/10.3390/rs13040640
Submission received: 10 November 2020
/
Revised: 19 January 2021
/
Accepted: 6 February 2021
/
Published: 10 February 2021
(This article belongs to the Special Issue Urban Landscapes and Global Environmental Challenges: Monitoring and Modelling Using Remote Sensing)
Abstract
:The changing climate has introduced new and unique challenges and threats to humans and their environment. Urban dwellers in particular have suffered from increased levels of heat stress, and the situation is predicted to continue to worsen in the future. Attention toward urban climate change adaptation has increased more than ever before, but previous studies have focused on indoor and outdoor temperature patterns separately. The objective of this research is to assess the indoor and outdoor temperature patterns of different urban settlements. Remote sensing data, together with air temperature data collected with temperature data loggers, were used to analyze land surface temperature (outdoor temperature) and air temperature (indoor temperature). A hot and cold spot analysis was performed to identify the statistically significant clusters of high and low temperature data. The results showed a distinct temperature pattern across different residential units. Districts with dense urban settlements show a warmer outdoor temperature than do more sparsely developed districts. Dense urban settlements show cooler indoor temperatures during the day and night, while newly built districts show cooler outdoor temperatures during the warm season. Understanding indoor and outdoor temperature patterns simultaneously could help to better identify districts that are vulnerable to heat stress in each city. Recognizing vulnerable districts could minimize the impact of heat stress on inhabitants.
1. Introduction
Human beings have long recognized that cities designed with nature in mind are beneficial, practical and aesthetically pleasing [1]. Therefore, the harmonious integration of settlements into the natural environment is highly desired. The tradition of considering environmental climatic conditions in the urban design process dates back approximately 2000 years [2]. The population of urban inhabitants is expected to reach 6.4 billion out of a total population of 9.7 billion (66 percent) by 2050 [3]. This brings urban areas and cities to the center of attention more than ever before. In addition, climate change has emerged as one of the most urgent and complicated issues of the early 21st century. Increases in surface temperature (known as global warming) and more frequent and intensive heatwaves in urban areas, coupled with the urban heat island (UHI) effect, can dramatically increase the risk of heat stress for inhabitants in cities [4,5,6,7,8,9,10,11,12,13]. Heat stress caused by the UHI effect has been shown to have a dramatic impact on human health [14], and urban citizens in particular are likely to suffer more in the future [15,16,17]. It is also expected that an increase in heat stress could result in the average global income being reduced by 23% by 2100 [18] due to loss of labor capacity during the warmer months [19]. Therefore, better understanding the indoor and outdoor temperature patterns in each city is crucial to reducing the impact of heat stress.
To reduce the impact of heat stress in the context of urban climate change strategies, indoor and outdoor temperature variations in different urban settlements are of special interest, not only during extreme situations but also during average days and nights. Thus, information about temperature variations during the day and night is valuable for urban planners to help them better understand the factors influencing temperature fluctuations. Land surface temperature [20,21], the UHI effect [22,23] and indoor temperature measurements [24,25] have been frequently studied. However, outdoor and indoor temperature pattern data on a city scale where remote sensing data and instrumental measurements have been used are still lacking. This study could be important because of its strong implications for urban planners and risk managers.
This study focuses on the spatial patterns of temperature in an urban context, particularly the indoor and outdoor temperature patterns of urban settlements. The overarching aim of this research is to assess the variation of indoor and outdoor urban temperature patterns. This study examines the city of Yazd due to the presence of very different urban geometries, materials and structures in the city.
2. Materials and Methods
2.1. Study Area
The study area is situated in central Iran (31.8974° N, 54.3569° E) adjacent to the Siah-koeh Kavir, Abarkouh Kavir and Bafgh Kavir deserts, as well as the Kuh-e Kharanaq and Shir-Kuh mountains (Figure 1). Yazd is located 1200 m above sea level on relatively flat terrain. The topography within a two-mile radius of Yazd shows modest variations in elevation, with a maximum elevation change of approximately 50 m. The city of Yazd is approximately 240 km2 in size and was home to approximately half a million people in 2015. The climate in Yazd is categorized as a hot desert climate (BWh) by the Köppen–Geiger climate classification scheme. Summers in Yazd are hot and dry, and winters are cold and dry. The warm season lasts from mid-April to mid-October (May–October are hot months). Over the course of the year, temperatures typically vary from 0.5 °C (in winter) to 42 °C (in hot months). The average annual rainfall in Yazd is only 60 mm.
Since July 2017, the city of Yazd has been added to the list of UNESCO world heritage sites [26]. Characteristics of the inner city are strongly influenced by historical legacies and consist of two main types of housing estates: The historical district (built in approximately 2500 BC) (Carter and Mathew, 1984), and newly built districts (developed in the second half of the 19th century). Containing 7.5% of the infrastructure, the historical district stretches to almost 10% of Yazd’s surface area. The historical district is believed to have been established in the Elamit period (2500 BC). The physical morphology of the buildings in the historical district is adapted to the hot and dry climatic conditions of the region: Buildings are made of adobe bricks (also known as mudbricks) and are separated by narrow alleys (Figure 2, pictures 1 to 3). The newly built residential areas, known as the new district, and cover over 90% of the study area. Multi-storey blocks (mainly limited to two or three storeys) in the new district are finished with “modern materials” such as cement and concrete, and wide streets separate the buildings (Figure 2, pictures 4 to 6).
2.2. Indoor Measurements of Air Temperature Data
Temperature data were collected every hour during a 6-month period from 25 March to 20 September 2017 using the temperature data logger RC-5 at 70 locations chosen in the city of Yazd (Figure 3). In the historical district, 10 temperature data loggers were installed and, in the newly built district, 60 temperature data loggers were installed; thus, each square kilometer in the historical district and every two square kilom in the newly built district contained one temperature data logger. The RC-5 temperature data loggers from Elitech (approximate dimensions 80 (L) × 34 (W) × 14 (H) mm) measure a temperature range of −30 °C to +70 °C at a resolution of +0.1 °C. The accuracy of the RC-5 is +0.5 °C, and the measurements range from −20 °C to +40 °C. Each temperature data logger was regulated to record the temperature in a 60-min interval. All temperature data loggers recorded temperature values from 25 March to 20 September 2017. The exact locations of the loggers were identified using a GPS device.
The temperature data loggers were calibrated by direct comparison to a reference digital thermometer at a level of 0 °C. For the installation of the temperature loggers, two major criteria were strictly observed: first, they were installed indoors in a non-closed room with sufficient air convection and at a height of 2 m on a wall, and second, the devices were kept out of direct sun exposure and were positioned where the indoor temperature was not directly affected by artificial air conditioning.
On 21 September, all temperature data loggers were collected. Using the USB port included in each temperature logger, the temperature data from the 25 March to 20 September were transferred to a single Excel spreadsheet. Temperature loggers were installed and collected at different times (early in the morning until late in the evening) on 25 March and 20 September. To ensure that the data loggers started recording temperature at the same time, only the time from the last installation of temperature data loggers to the time of the first collection of temperature data loggers was considered in the statistical analysis. For instance, if all temperature loggers were installed between 8.00 and 16.00 on the same day, we only considered the temperature records after 16.00 in the statistical analysis. Additionally, if the collection of the temperature loggers occurred between 8.00 and 16.00 on the same day, we did not consider temperature records after 8.00 in the statistical analysis. To cross-check whether the devices functioned properly during data collection and storage, the temperature data were compared with the daily temperature data recorded by the weather station in Yazd.
2.3. Outdoor Measurements of Surface Temperature Data
Measuring the land surface temperature using satellite data is one of the key steps in evaluating the physical process of surface energy exchange at local and global scales. Surface temperature characterizes the average temperature of the surface in a given areal unit, for instance, 30 × 30 m, at a certain time during the local day or night. For this study, data were collected during the day (local time 10:30 a.m.) using a thermal infrared sensor (TIRS) on a Landsat-8 satellite. A cloud-free satellite image (less than 5%) was freely available from the United States Geological Survey (USGS) website (www.earthexplorer.usgs.gov) for 9 August 2016. The spatial resolution of TIRS bands is 100 m. A detailed description proposed by the USGS Landsat 8 Handbook was used to create land surface temperature maps. Sunrise and sunset data from Yazd were included for each month (from March to September) to calculate day length hours and night length hours, respectively. Table 1 shows the average sunrise and sunset times and the average day and night length hours for the months of the temperature records (from 25 March to 20 September 2017) in Yazd. The average day and nighttime temperatures were then calculated considering the day and night length hours.
2.4. Statistical Analysis
A statistical analysis, termed the hot and cold spot analysis, a spatial statistics measure, was performed using temperature data from the 70 aforementioned temperature data loggers. The statistical analysis tests the null hypothesis and determines whether there is any spatial pattern among the detected features or among values associated with those features. To analyze the spatial temperature pattern, daytime temperature data were separated from nighttime temperature data [27,28].
The variance is calculated as follows:
The test statistic of the chi-square test for variance is calculated as follows:
whereby
- n = the sample size
- s2 = the sample variance
- σ2 = the population variance
The hot and cold spot analysis identifies statistically significant spatial clusters of high values (hot spots) and low values (cold spots) using Getis-Ord (Gi-star) statistics. In the standard normal distribution of temperature data, the z-score is a test of statistical significance that shows whether one can reject the null hypothesis. The p-value is the probability of a falsely rejected null hypothesis. When the absolute value of the z-score falls in one of the two tails (larger than 1.65 and smaller than −1.65) of the normal distribution and the probability is lower than 0.05, the confidence level is greater than 90% (Table 2). In this case, the null hypothesis can be rejected, and it is very unlikely that the observed spatial pattern is the result of random processes.
Higher z-scores (>+1.65) of some features not only indicate a significant hot spot but also intensive clustering within the data. Lower z-scores (<−1.65), on the other hand, indicate the statistical significance of a feature as well as a more dispersed pattern. Values close to zero are randomly distributed.
3. Results
3.1. Air Temperature
The hourly daytime and nighttime temperatures were separated for every temperature data logger. Then, the average daytime temperature and the average nighttime temperature of each temperature data logger were calculated for every day between 25 March and 20 September 2017. Thus, for every temperature data logger, there is an average daytime and nighttime temperature for every single day in the recording period. The statistical analysis used for this study was done separately for the historical and new districts in order to present the temperature patterns of both districts individually.
Figure 4 (upper figure) depicts the average daytime and nighttime temperatures during the recording period. The result shows lower nighttime temperatures than the daytime temperatures in both districts. Interestingly, both the daytime and nighttime inner-building temperatures of the historical district are lower than those of the new district. The results from the analysis of variance test, performed on the variation in indoor temperature between the historical and the new districts during the study, are shown in Figure 4 (lower figure). The variance is larger for the new district than for the historical district. This indicates that over the course of the day, the indoor temperature variation in the historical district is lower than that of the newly built housing stock. The temperature variance for the historical district is 7.3 °C during the day and 5.9 °C during the night, compared to 20 °C during the day and 17.40 °C during the night for the newly built district. Thus, the temperature is more constant and stable in the historical district than the newly built one.
Subsequently, to determine whether the temperature data are associated with the spatial patterns of building structures, the hot spot and cold spot statistical analysis was performed using temperature data from the temperature data loggers. The upper graph in Figure 5 illustrates the hot spots and cold spots during the daytime, and the lower graph in Figure 5 illustrates the hot and cold spots during the nighttime for both historical and newly built districts for the period of the recorded temperature.
Figure 5 shows the hot spots and cold spots over the course of the indoor temperature recording period. Thus, the probability that the indoor temperature in the historical district creates a cluster and is spatially related seems higher than the same probability for the newly built districts, which, even when the analysis is statistically significant, acts as a dispersed distribution.
3.2. Surface Temperature
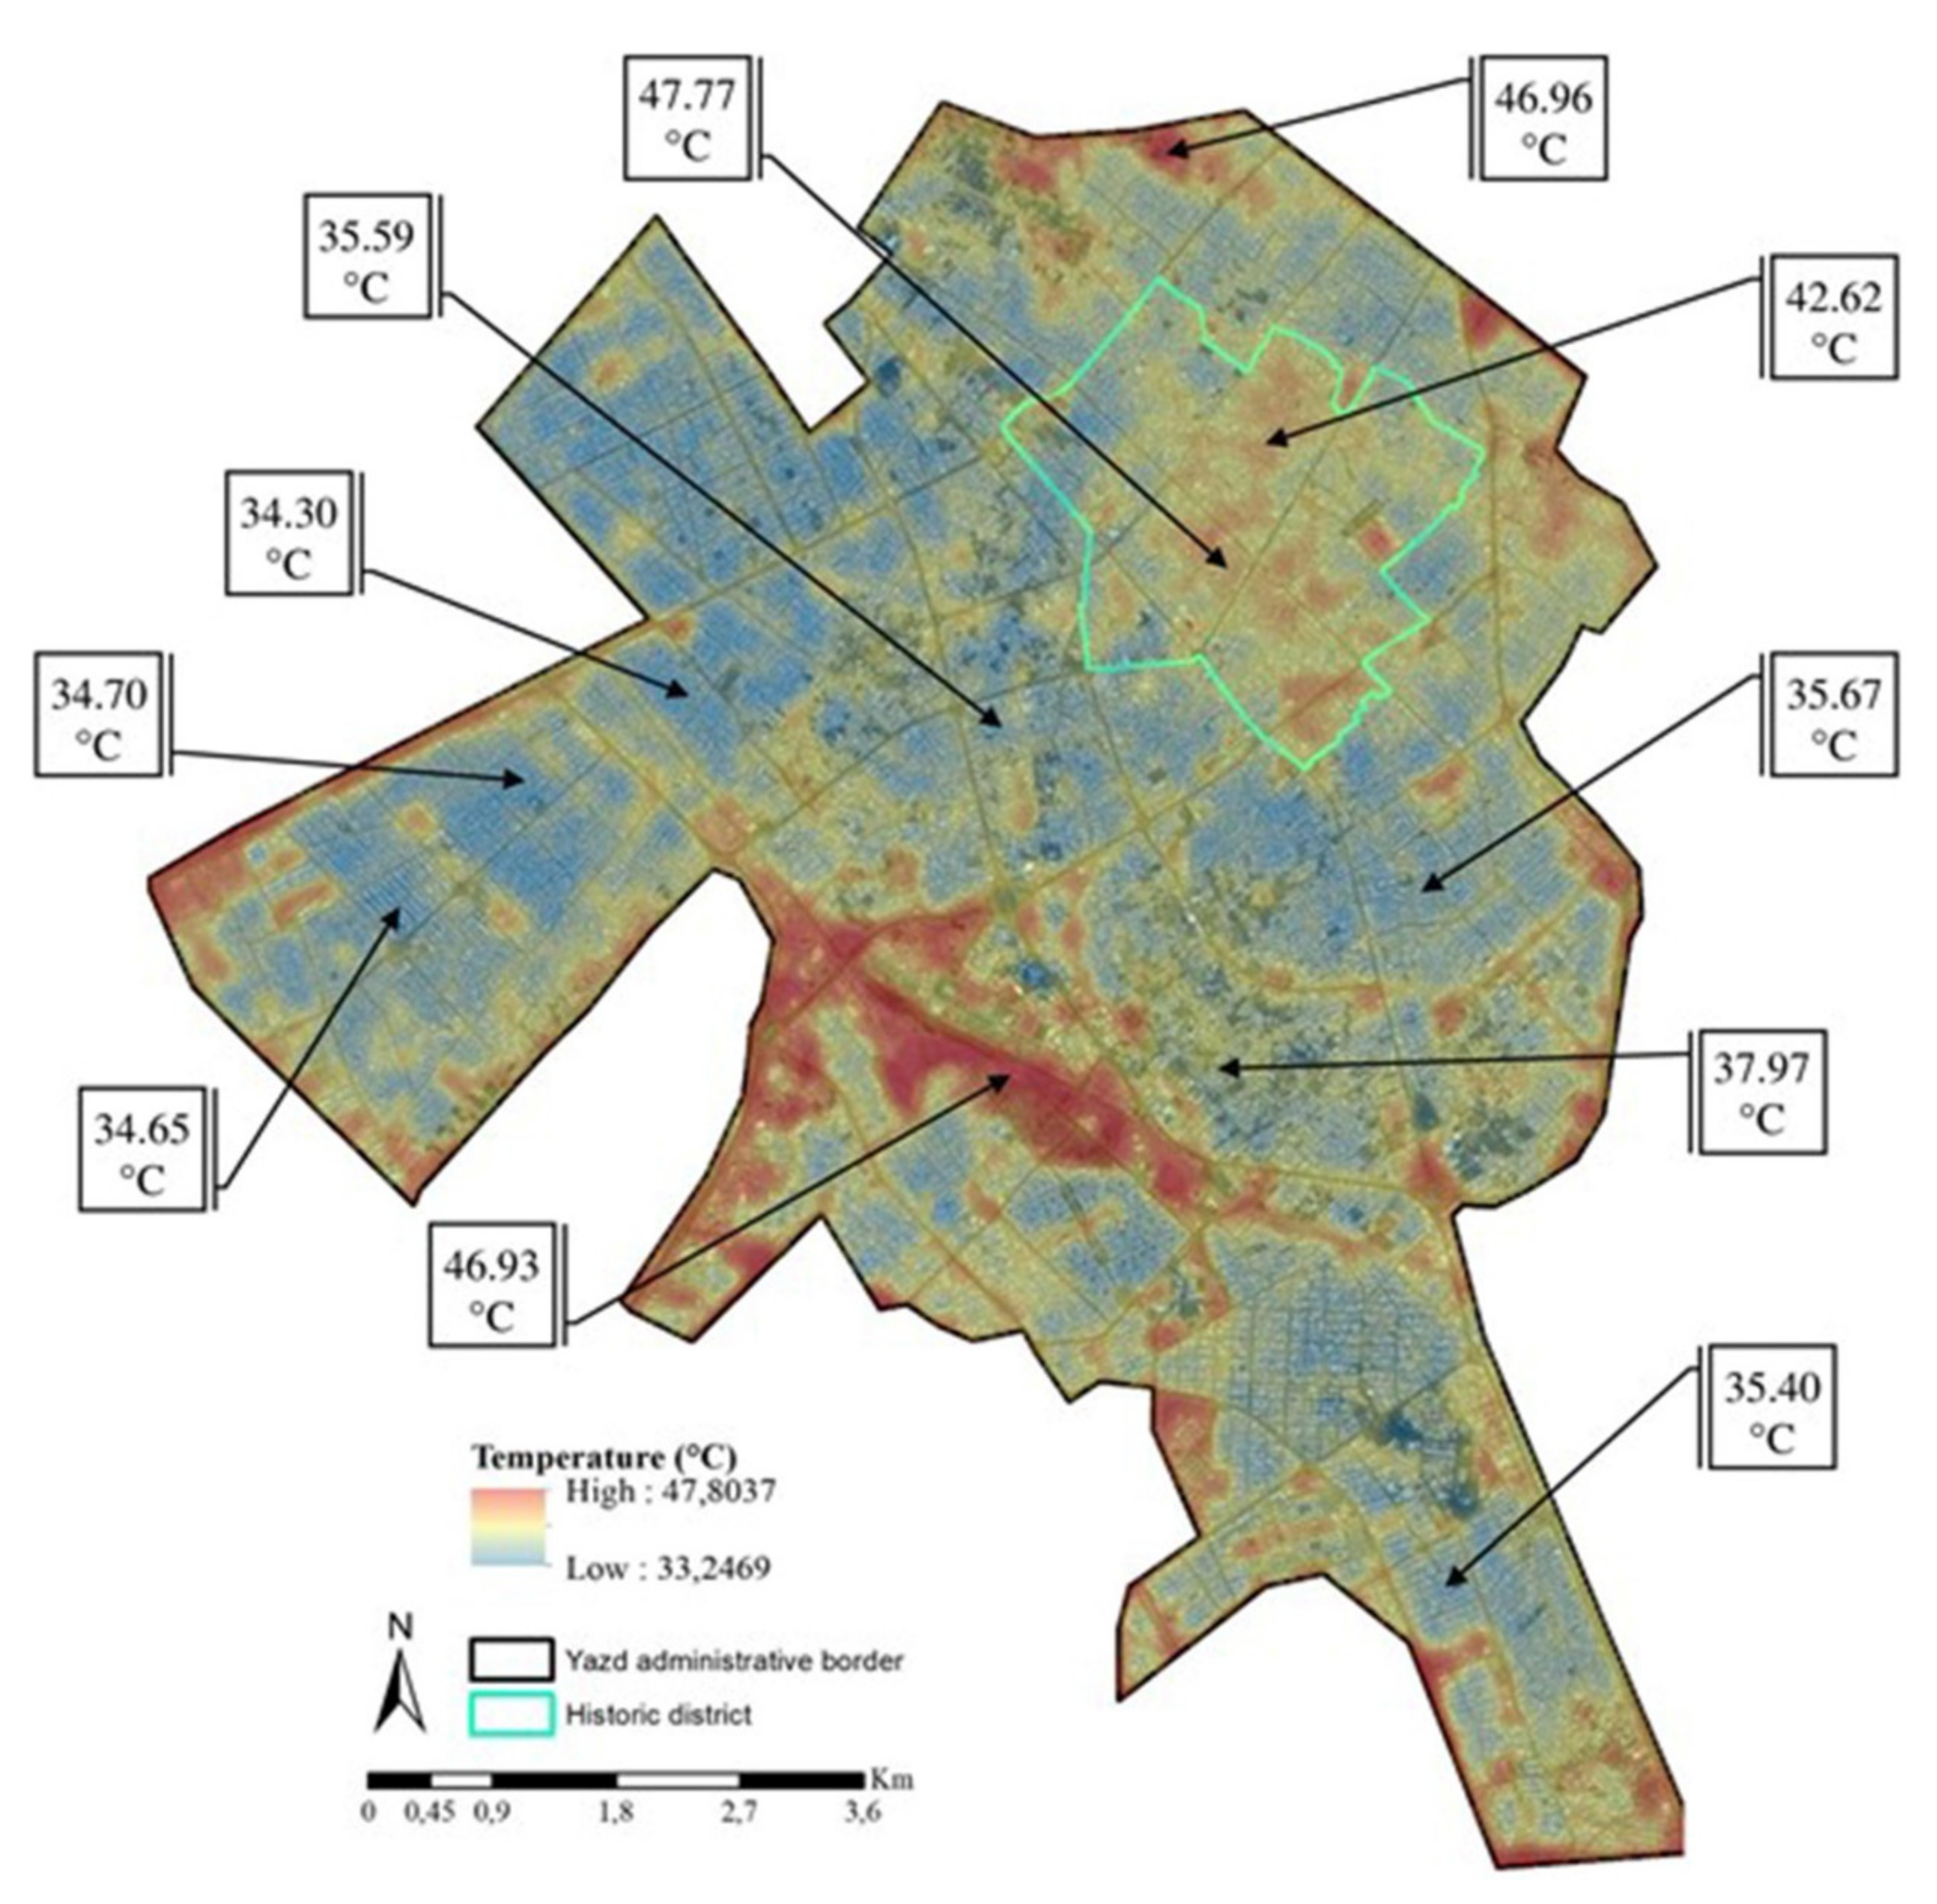
Figure 6 shows the structure and the surface temperature of the city of Yazd at 10:30 a.m. local time on 9 August 2016. The surface temperature shows various behaviors in different districts as well as different land covers. Table 3 shows the temperature variations for different districts and land covers. The results show a lower maximum, minimum and average temperature for the new district compared to the historical district. Among the different land covers, the surface temperatures of bare soil represent the highest minimum, maximum and average temperatures.
4. Discussion
Previous UHI studies either used remote sensing thermal data to report land surface temperatures [29,30,31,32] or analyzed the heat flux using in situ instrumental measurements to represent air temperatures independently [33,34,35]. In recent years, thermal remote sensing data have received renewed attention due to their ability to retrieve surface temperatures [36]. Retrieving land surface temperature is still a challenging task, but it provides very useful knowledge of temporal, as well as spatial, variations in the surface equilibrium state.
Surface temperatures in cities are associated with outdoor weather and human health [37]. In Yazd, due to desert-like conditions and higher temperatures during the daytime, people spend most of their time indoors [38]. The overarching aim of this research was therefore to test the potential of combining satellite data for temperature monitoring assisted by on-ground in situ measurements to provide a better understanding of indoor and outdoor temperature patterns during the day and night. Both the indoor and outdoor measurements were conducted in the old and newly built areas of the study area.
In the context of UHI, thermal remote sensing information was used to retrieve surface and outdoor temperatures. The findings of this study indicate that two areas are exposed to higher surface temperatures than the others: the historical district located in the center of the study area and bare soil, which is spread across the newly built district of the city. Figure 4 represents the extent of surface temperature for both mentioned areas within the study area. In addition, the average surface temperature reflected in Table 3 confirms that bare soil shows the highest average outdoor surface temperature, followed by the historical district of the study area.
The surrounding soil of Yazd (mainly sandy) is very dry, with almost no vegetation cover due to the dry climatic conditions of that geographical location. This is why the dry soil heats up so rapidly in the direct sunlight, producing high surface temperatures, as demonstrated by Larson and Carnahan [39]. In addition, several factors play a key role in shaping the high surface temperatures of the historical district. The building material in the historical district (adobe brick) is made from the surrounding soil, which is currently being replaced with new district building materials. The dense urban structure with houses built close together and with narrow alleys may be another reason for the high rooftop temperatures of the historical district. However, the historical district has a lower average surface temperature compared with the bare soil. The shadow effect produced by buildings and the small tree stock in the courtyards, the so-called “Sahn”, is presumed to be the main reason for the lower surface temperatures.
The air temperature recorded by the mobile temperature loggers tells a different story in terms of the indoor room temperatures of the study area, with a focus on the two different districts. The results indicate that indoor temperature data (air temperature) show different temperature behavior than outdoor temperature data (surface temperature). In addition, it is surprising that the indoor temperatures of the historical area show cooler temperatures than those of the new district. This is in direct contrast with the outdoor temperature data. Wael et al. [25] and Adewale Oluseyi Adunola [40] also reported similar contrasts in temperature results for their study areas. This contrast, in a straightforward way, shows that the average indoor temperature of all 10 temperature loggers installed in the historical district is cooler than the average indoor temperature of all 60 temperature loggers installed in the new district. The indoor temperature of the historical district is cooler during the day and the night for the entire warm period.
Several factors play a role in shaping the difference between the indoor and outdoor temperatures. The outdoor spaces are exposed to a high intensity of solar radiation. The dense and often continuous developments of man-made infrastructure, such as buildings, roads and railways, and minimal vegetation cover, characterize the contemporary urban environment. Moreover, the use of dark-colored materials with high thermal storage properties leads to the high thermal accumulation of impervious surfaces. The vegetation cover of the Yazd urban environment is sparse. The dry climate and the high maintenance costs of irrigating trees due to water scarcity are the main reasons for this. Both facts are among other reasons for the weak evapotranspiration and the fragile cooling effect of urban vegetation. However, the vegetation cover in Yazd plays a different role in terms of cooling its surroundings in different physical morphological urban structures (new and historical districts). The findings of the statistical analysis presented in Figure 5 confirm the differences in the spatial patterns for the indoor temperatures of both districts. The Getis-Ord (Gi-star) statistical analysis identified the indoor temperatures of the historical district as constituting a statistically significant spatial cluster of hot spots. These findings are valid both for daytime and nighttime indoor temperatures. Over the course of the temperature recording period during the days and nights of the warm months, the indoor temperature of the historical district frequently has a confidence level greater than 90 percent. Thus, it is very likely that the indoor temperature spatial pattern is statistically significant for the historical district. On the other hand, the observed spatial patterns of the new district are the result of random processes.
A previous study on human activity patterns published by Wael et al. [25] indicated that humans spend, on average, 87% of their time in enclosed buildings, such as at home, in school, at work or during leisure time, and approximately 6% of their time in enclosed vehicles. This pattern may vary by country, culture, climatic conditions, geographical conditions, urban infrastructure, accessibility, etc. However, there is no doubt that both indoor and outdoor temperatures are essential factors determining human thermal comfort. Comparing the outdoor and the indoor temperatures of different urban geometries (the new and the historical district) indicates that urban physical morphologies and impervious surfaces are principal factors determining temperature in urban areas. Previous studies published by Wang et al. [41] and Palme et al. [42] also confirm this. In addition, a study published by Pasanen et al. [43] shows that outdoor temperature and exposure to urban greening are connected to improved general and mental health. Therefore, combining and monitoring outdoor and indoor temperatures could aid our understanding of human thermal comfort.
The results of this study indicate a cooler outdoor temperature for the new urban district compared to the historical district. The planned structure of the new district with wide streets, plenty of space between buildings and open fields allows the wind to flow unhindered to cool down the surfaces during the day and night. The geometry of the streets, especially the length-to-width ratio, could directly influence the airflow and solar access, which leads to less of a canyon effect as reported by Shishegar [44]. The vegetation cover in the new district is also more abundant compared to the historical district. More planted vegetation along the streets, in the middle of boulevards and in the backyards of houses in the new district aids the cooling effect. The cooling effect is shaped by the evapotranspiration of trees, and the resulting shadowing effect significantly decreases heat stress during the warm season. While the temperature is lower in the new district, the outdoor temperature of the historical district is higher. The dense architecture of the buildings and narrow alleys not only make wind flow more difficult, especially in the core of the district, but also increases the trapping of thermal energy and intensifies the overall canyon effect. Due to the dense urban structures and narrow alleys, the vegetation cover became restricted to courtyards; therefore, the cooling and shading effects are limited for the inhabitants of each house. However, one should bear in mind that the historical principle of building dense urban structures was to avoid the penetration of sunlight into buildings. Similar dense urban structures that avoid exposure to direct sunlight can also be seen in Morocco, Italy, Portugal, Iraq, India and Spain. To increase the albedo and keep the surface cool, methods using light, bright colors such as by mixing straw with mud when molding bricks were historically used.
In contrast with the outdoor temperature results, indoor temperatures in the historical district are on average cooler than those in the new district. The findings of the spatial hot and cold spot analysis of the indoor air temperature records show this pattern, as presented in Figure 4. The indoor temperature of the historical district frequently crosses the z-factor of +1.65 (and a p-value of less than 0.05), indicating that the confidence level is larger than 90 percent and that the indoor temperature records show a clustered spatial pattern. In contrast, the indoor measurements for the new district frequently cross the z-factor of −1.65. This indicates that it is highly probable (>90%) that the spatial pattern of the indoor temperature of the new district results from random processes.
The findings of this study, along with previous findings, suggest that urban configuration plays a critical role in determining outdoor temperatures as well as defining the inner temperatures of buildings. Unlike the warmer outdoor temperature of the historical district, its indoor temperature shows a cooler temperature trend than other districts. Although dense historical urban structures may trap heat, leading to warmer outdoor temperatures, they also limit the penetration of sunlight into buildings. The 3D study of Yazd, published by Alavipanah et al. [45], shows that the new district shares more wall surface with its surroundings than the historical district, where the walls are shared among buildings. Objects with smaller areas exposed to sunlight are exposed to less heat. Therefore, although the closely constructed buildings may trap and store the heat, they are also less exposed to solar radiation than buildings in the new district. This could be one of the main reasons for the cooler historical indoor temperature levels. Moreover, the different building materials and the 3D spatial orientations of the buildings in both districts also play a role in shaping the indoor and outdoor temperatures. The thermal conductivity values of concrete vary according to the density of the material but, for structural uses, they are on average greater than 1.0 W/mK, especially for reinforced concrete. Unreinforced concrete can have lower values, and even more so if the aggregates are light (for example, expanded clay). For the purposes of heat storage, however, the performance parameter to be taken into consideration is the heat capacity, which is actually greater for adobe (about 1200 J/kgK) than for concrete (about 1000 J/kgK). This suggests that the thick adobe walls have greater ability to store heat, rather than transmit it. Therefore, smaller wall areas being exposed to sunlight, thicker walls, the lower thermal conductivity of adobe, higher ceilings and the cool micro-climates created by the planted central courtyards are the main reasons explaining the cooler temperatures in the historical district.
The findings of this research call into question whether the role of indoor temperature on human health has been considered on a city scale. Combining remote sensing and instrumental measurements could help to fill this gap and open new venues for future research. Analyzing and understanding outdoor and indoor temperature patterns and behaviors provides valuable information to districts vulnerable to indoor and outdoor heat stress. Measuring the indoor and outdoor heat stress can also be tested for different cities; however, there are several limitations to this study. First, it is not possible to include all the factors that are known to influence indoor and outdoor temperatures. Second, we were not able to measure the indoor temperature of all the districts of the city due to several restrictions. Third, due to time restrains, we could not record the air temperature for the entire year and observe seasonal temperature variations; therefore, the results of this study are applicable only to cities comparable to Yazd during its warm period.
5. Conclusions
Most previous studies have investigated indoor and/or outdoor temperatures independently of one another. This study combined the results of indoor and outdoor temperature patterns into a single analysis. The results of this study suggest that in addition to outdoor temperature, indoor temperature can also strongly impact the health of city inhabitants, especially because humans spend most of their time indoors. City dwellers are mobile and dynamic, and spend much of their time either indoors (at home or work) or outdoors (commuting). City inhabitants are always exposed to heat regardless of how much time they spend indoors or outdoors; therefore, if the temperature is higher than the human thermal comfort level, it could result in heat stress. Thus, measuring outdoor and indoor temperatures could reveal those districts that are vulnerable to heat stress. In addition, the results show that building characteristics, such as orientation, density, material and shape, each play different roles in shaping the indoor and outdoor temperature levels. The building material, regardless of the extent of each urban district, could characterize the indoor temperature, while the density of urban districts could characterize the outdoor temperature.
This investigation recommends that urban planners consider the thermal conductivity of mud bricks when developing new materials used in constructing buildings. In addition, historical building architecture with its high ceilings and central yards could help reduce the penetration of direct sunlight into houses, and therefore help to reduce heat stress in cities. Future studies are needed to investigate the electricity consumption of air conditioners for both districts. This will improve our understanding of the differences between these two districts, taking into consideration how different building materials, 3D building shapes, densities, etc. affect the resulting Co2 emissions.
Author Contributions
Conceptualization, S.A., S.Q. and D.H.; methodology, S.A., S.Q. and D.H.; software, S.A.; validation, S.A. and M.M.N.; formal analysis, S.A.; investigation, S.A.; resources, S.A., S.Q., M.M. and D.H.; data curation, S.A.; writing—original draft preparation, S.A.; writing—review and editing, S.A., S.Q., M.M., M.M.N. and D.H.; visualization, S.A.; supervision, S.A., S.Q. and D.H.; project administration, S.A., S.Q., M.M. and D.H.; funding acquisition, S.A., S.Q. and D.H. All authors have read and agreed to the published version of the manuscript.
Funding
We acknowledge support by the German Research Foundation (DFG) and the Open Access Publication Fund of Humboldt-Universität zu Berlin
Acknowledgments
The authors wish to express appreciation to the Yazd municipality and Hoseiny at the University of Yazd for helping us with the distribution of temperature data loggers in the study area. The authors would also to thank Thomas Blaschke for supporting the methodology at the University of Salzburg, Austria. The authors acknowledge the USGS for providing the Landsat-8 satellite data used in this study.
Conflicts of Interest
The authors declare no conflict of interest.
References
- Pressman, N. Introduction to climatic factors in urban design. Arch. Comport Arch. Behav. 1994, 10, 5–7. [Google Scholar]
- Morgan, M.H. Vitruvius, The Ten Books on Architecture; Dover Publications: New York, NY, USA, 1960. [Google Scholar]
- Department of economic and Social Affairs, Population Division. World Urbanization Prospects. In United Nations Report; The 2014 Revision, Highlights, ST/ESA/SER.A/352; United Nations: New York, NY, USA, 2014. [Google Scholar]
- Howard, L. The Climate of London; London Harvey and Dorton: London, UK, 1833; Volume 2, pp. 1818–1820. [Google Scholar]
- Detwiller, J. Deep soil temperature trends and urban effects at Paris. J. Appl. Meteorol. 1970, 9, 178–180. [Google Scholar] [CrossRef] [Green Version]
- Fukui, E. The recent rise of temperature in Japan. In Japanese Progress in Climatology; Tokyo University of Education: Tokyo, Japan, 1970; pp. 46–65. [Google Scholar]
- Katsoulis, B.D.; Theoharatos, G.A. Indications of the urban heat island in Athens, Greece. J. Clim. Appl. Meteorol. 1985, 24, 1296–1302. [Google Scholar] [CrossRef] [Green Version]
- Wang, W.; Zheng, Z.; Karl, T.R. Urban Heat Islands in China. Geophys. Res. Lett. 1990, 17, 2377–2380. [Google Scholar] [CrossRef]
- Kim, H.H. Urban Heat Island. Int. J. Remote Sens. 1990, 13, 2319–2336. [Google Scholar] [CrossRef]
- Lee, H. An application of NOAA AVHRR thermal data to the study of urban heat Islands. Atmos. Environ. 1993, 27, 1–13. [Google Scholar] [CrossRef]
- Johnson, G.L.; Davis, J.M.; Karl, T.R.; McNab, A.L.; Gallo, K.P.; Tarpley, J.D.; Bloomfield, P. Estimating urban temperature bias using polar-orbiting satellite data. J. Appl. Meteorol. 1994, 33, 358–369. [Google Scholar] [CrossRef] [Green Version]
- Tso, C.P. A survey of urban heat island studies in two tropical cities. Atmos. Environ. 1996, 30, 507–519. [Google Scholar] [CrossRef]
- Camilloni, I.; Barros, V. On the urban heat island effect dependence on temperature trends. Clim. Chang. 1997, 37, 665–681. [Google Scholar] [CrossRef]
- Revich, B.A.; Shaposhnikov, D.A. Climate change, heat waves, and cold spells as risk factors for increased mortality in some regions of Russia. Stud. Russ. Econ. Dev. 2012, 23, 195–207. [Google Scholar] [CrossRef]
- Beniston, M.; Stephenson, D.B.; Christensen, O.B.; Ferro, C.A.; Frei, C.; Goyette, S.; Halsnaes, K.; Holt, T.; Jylhä, K.; Koffi, B.; et al. Future extreme events in European climate: An exploration of regional climate model projections. Clim. Chang. 2007, 81, 71–95. [Google Scholar] [CrossRef] [Green Version]
- Oke, T.R. City size and the urban heat island. Atmos. Environ. 1973, 7, 769–779. [Google Scholar] [CrossRef]
- Revi, A.; Satterthwaite, D.E.; Aragón-Durand, F.; Corfee-Morlot, J.; Kiunsi, R.B.R.; Pelling, M.; Roberts, D.C.; Solecki, W. “Urban Areas”. In Climate Change 2014: Impacts, Adaptation, and Vulnerability. Part A: Global and Sectoral Aspects. Contribution of Working Group II to the Fifth Assessment Report of the Intergovernmental Panel on Climate Change; Field, C.B., Barros, V.R., Dokken, D.J., Mach, K.J., Mastrandrea, M.D., Bilir, T.E., Chatterjee, M., Eds.; Cambridge University Press: Cambridge, MA, USA, 2014; pp. 535–612. [Google Scholar]
- Burke, M.; Hsiang, S.M.; Miguel, E. Global Non-Linear Effect of Temperature on Economic Production. Nature 2015, 527, 235–239. [Google Scholar] [CrossRef]
- Dunne, J.P.; Stouffer, R.J.; John, J.G. Reductions in labour capacity from heat stress under climate warming. Nat. Clim. Chang. 2013, 3, 563–566. [Google Scholar] [CrossRef]
- Rosenfeld, A.H.; Akbari, H.; Bretz, S.; Sailor, D.; Taha, H. Mitigation of urban heat islands: Materials, utility programs: Updateat. Energy Effic. 1993, 1, 1–20. [Google Scholar] [CrossRef]
- Stathopoulou, M.; Cartalis, C. Downscaling AVHRR land surface temperatures for improved surface urban heat island intensity estimation. Remote Sens. Environ. 2009, 113, 2592–2605. [Google Scholar] [CrossRef]
- Gago, E.J.; Roldan, J.; Pacheco-Torres, R.; Ordóñez, J. The city and urban heat islands: A review of strategies to mitigate adverse effects. Renew. Sustain. Energy Rev. 2013, 25, 749–758. [Google Scholar] [CrossRef]
- Dos Santos, A.R.; de Oliveira, F.S.; da Silva, A.G.; Gleriani, J.M.; Gonçalves, W.; Moreira, G.L.; Silva, F.G.; Branco, E.R.F.; Moura, M.M.; da Silva, R.G.; et al. Spatial and temporal distribution of urban heat islands. Sci. Total Environ. 2017, 605, 946–956. [Google Scholar] [CrossRef] [PubMed]
- Yoshino, H.; Guan, S.; Lun, Y.F.; Mochida, A.; Shigeno, T.; Yoshino, Y. Indoor thermal environment of urban residential buildings in China: Winter investigation in five major cities. J. Build. Eng. 2004, 36, 1227–1233. [Google Scholar] [CrossRef]
- Mousa, W.A.Y.; Werner, L.; Waleed, A.Y. Simulations and quantitative data analytic interpretations of indoor-outdoor temperatures in a high thermal mass structure. J. Build. Eng. 2017, 12, 68–76. [Google Scholar] [CrossRef]
- UNESCO. Eight New Sites Inscribed on UNESCO’s World Heritage List. Recuperado 15 December 2017. Available online: http://whc.unesco.org/en/news/1689/ (accessed on 15 December 2017).
- Ruiz, A.; Belén Sosa, M.; Correa, E.N.; Cantón, M.A. Design tool to improve daytime thermal comfort and nighttime cooling of urban canyons. Landsc. Urban Plan. 2017, 167, 249–256. [Google Scholar] [CrossRef]
- Zhang, Y.; Murray, A.T.; Turner, B.L. Optimizing green space locations to reduce daytime and nighttime urban heat island effects in Phoenix, Arizona. Landsc. Urban Plan. 2017, 165, 162–171. [Google Scholar] [CrossRef]
- De Faria, L.; José de Lucena, P.; Rotunno Filho, A.; Ricardo de Almeida França, O.C. The urban heat island in Rio de Janeiro, Brazil, in the last 30 years using remote sensing data. Int. J. Appl. Earth Obs. 2018, 64, 104–116. [Google Scholar] [CrossRef]
- Mathew, A.; Khandelwal, S.; Kaul, N. Analysis of diurnal surface temperature variations for the assessment of surface urban heat island effect over Indian cities. Energy Build. 2018, 159, 271–295. [Google Scholar] [CrossRef]
- Bonafoni, S.; Baldinelli, G.; Verducci, P. Sustainable strategies for smart cities: Analysis of the town development effect on surface urban heat island through remote sensing methodologies. Sustain. Cities Soc. 2017, 29, 211–218. [Google Scholar] [CrossRef]
- Chen, W.; Zhang, Y.; Gao, W.; Zhou, D. The Investigation of Urbanization and Urban Heat Island in Beijing Based on Remote Sensing. Procedia Soc. Behav. Sci. 2016, 216, 141–150. [Google Scholar] [CrossRef] [Green Version]
- Shiflett, S.A.; Liang, L.L.; Crum, S.M.; Feyisa, G.L.; Wang, J.; Jenerette, G.D. Variation in the urban vegetation, surface temperature, air temperature nexus. Sci. Total Environ. 2017, 579, 495–505. [Google Scholar] [CrossRef]
- Jamei, E.; Ossen, D.R.; Rajagopalan, P. Investigating the effect of urban configurations on the variation of air temperature. Int. J. Sustain. Built Environ. 2017. [Google Scholar] [CrossRef]
- Shojaei, P.; Gheysari, M.; Myers, B.; Eslamian, S.; Shafieiyoun, E.; Esmaeili, H. Effect of different land cover/use types on canopy layer air temperature in an urban area with a dry climate. Build Environ. 2017, 125, 451–463. [Google Scholar] [CrossRef]
- Patz, J.A.; Campbell-Lendrum, D.; Holloway, T.; Foley, J.A. Impact of regional climate change on human health. Nature 2005, 438, 310–317. [Google Scholar] [CrossRef]
- Weber, N.; Haase, D.; Franck, U. Zooming into the urban heat island: How do urban built and green structures influence earth surface temperatures in the city? Sci. Total Environ. 2014, 496, 289–298. [Google Scholar] [CrossRef]
- Statistical Center of Report. Iran Activities for Time and Time Use of Different Cities in Iran; The 2015 revision; Statistical Center of Report: Tehran, Iran, 2015. [Google Scholar]
- Larson, R.C.; Carnahan, W.H. The influence of surface characteristics on urban radiant temperatures. Geocarto Int. 1997, 12, 5–16. [Google Scholar] [CrossRef]
- Adewale, O.A. Evaluation of urban residential thermal comfort in relation to indoor and outdoor air temperatures in Ibadan, Nigeria. Build. Environ. 2014, 75, 190–205. [Google Scholar] [CrossRef]
- Wang, J.; Zhan, Q.; Guo, H. The Morphology, Dynamics and Potential Hotspots of Land Surface Temperature at a Local Scale in Urban Areas. Remote Sens. 2016, 8, 18. [Google Scholar] [CrossRef] [Green Version]
- Palme, M.; Lobato, A.; Carrasco, C. Quantitative Analysis of Factors Contributing to Urban Heat Island Effect in Cities of Latin-American Pacific Coast. Procedia Eng. 2016, 169, 199–206. [Google Scholar] [CrossRef]
- Pasanen, T.P.; Tyrväinen, L.; Korpela, K.M. The Relationship between Perceived Health and Physical Activity Indoors, Outdoors in Built Environments, and Outdoors in Nature. Appl. Psychol. Health Well Being 2014, 6, 324–346. [Google Scholar] [CrossRef] [Green Version]
- Shishegar, N. Street Design and Urban Microclimate: Analyzing the Effects of Street Geometry and Orientation on Airflow and Solar Access in Urban Canyons. Clean Energy Technol. 2013, 1, 1. [Google Scholar] [CrossRef]
- Alavipanah, S.; Schreyer, J.; Haase, D.; Lakes, T.; Qureshi, S. The association of multi-dimensional indicators on urban thermal conditions. J. Clean. Prod. 2017, 115–123. [Google Scholar] [CrossRef]
Figure 1.
The main picture in the center shows the location of the study area in central Iran, adjacent to the Kuhe-Karanaq mountain in the northeast and Shir-Kuh mountain in the southwest of the city. The dark lines illustrate the road network of the city with its surrounding environment.
Figure 1.
The main picture in the center shows the location of the study area in central Iran, adjacent to the Kuhe-Karanaq mountain in the northeast and Shir-Kuh mountain in the southwest of the city. The dark lines illustrate the road network of the city with its surrounding environment.
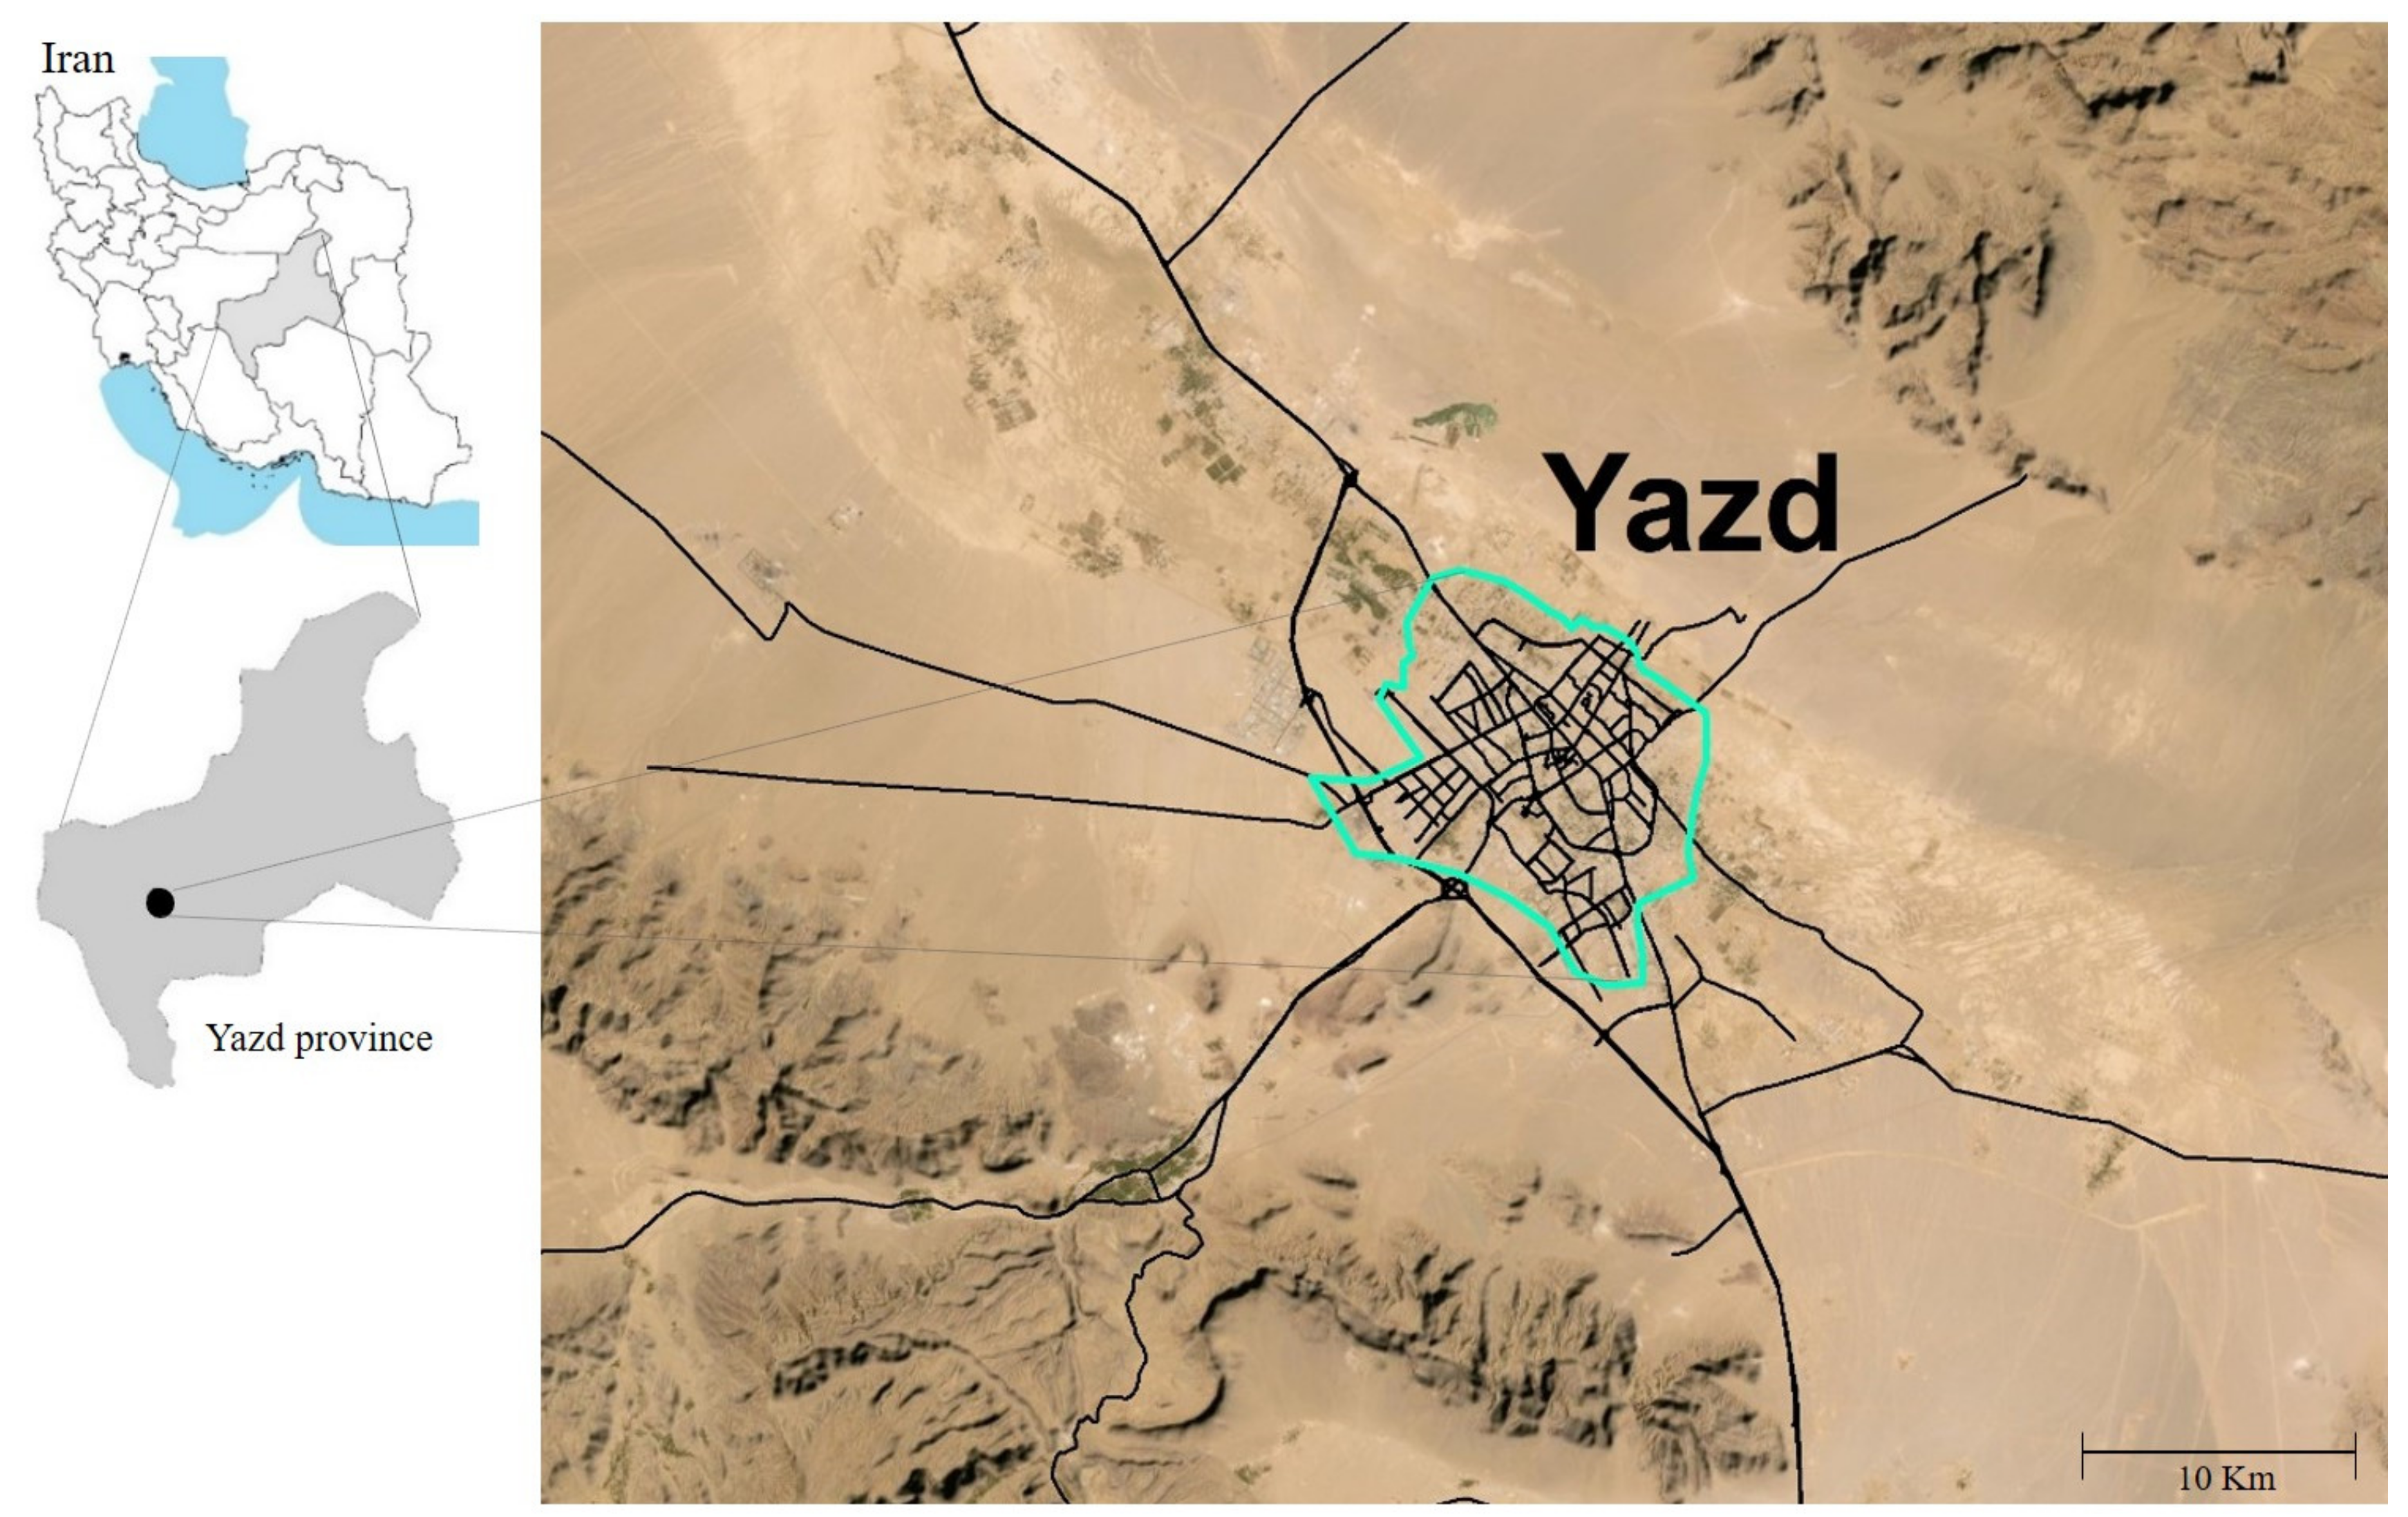
Figure 2.
The physical morphology of the buildings in the historical district and the new district. Pictures 1–3 show the historical district, and pictures 4–6 show the new district of the city of Yazd. Picture 1 was taken by Mohsen Maki, pictures 2 and 3 were taken by Alavi Panah and pictures 4–6 were taken by Amirmasoud Zarrabi.
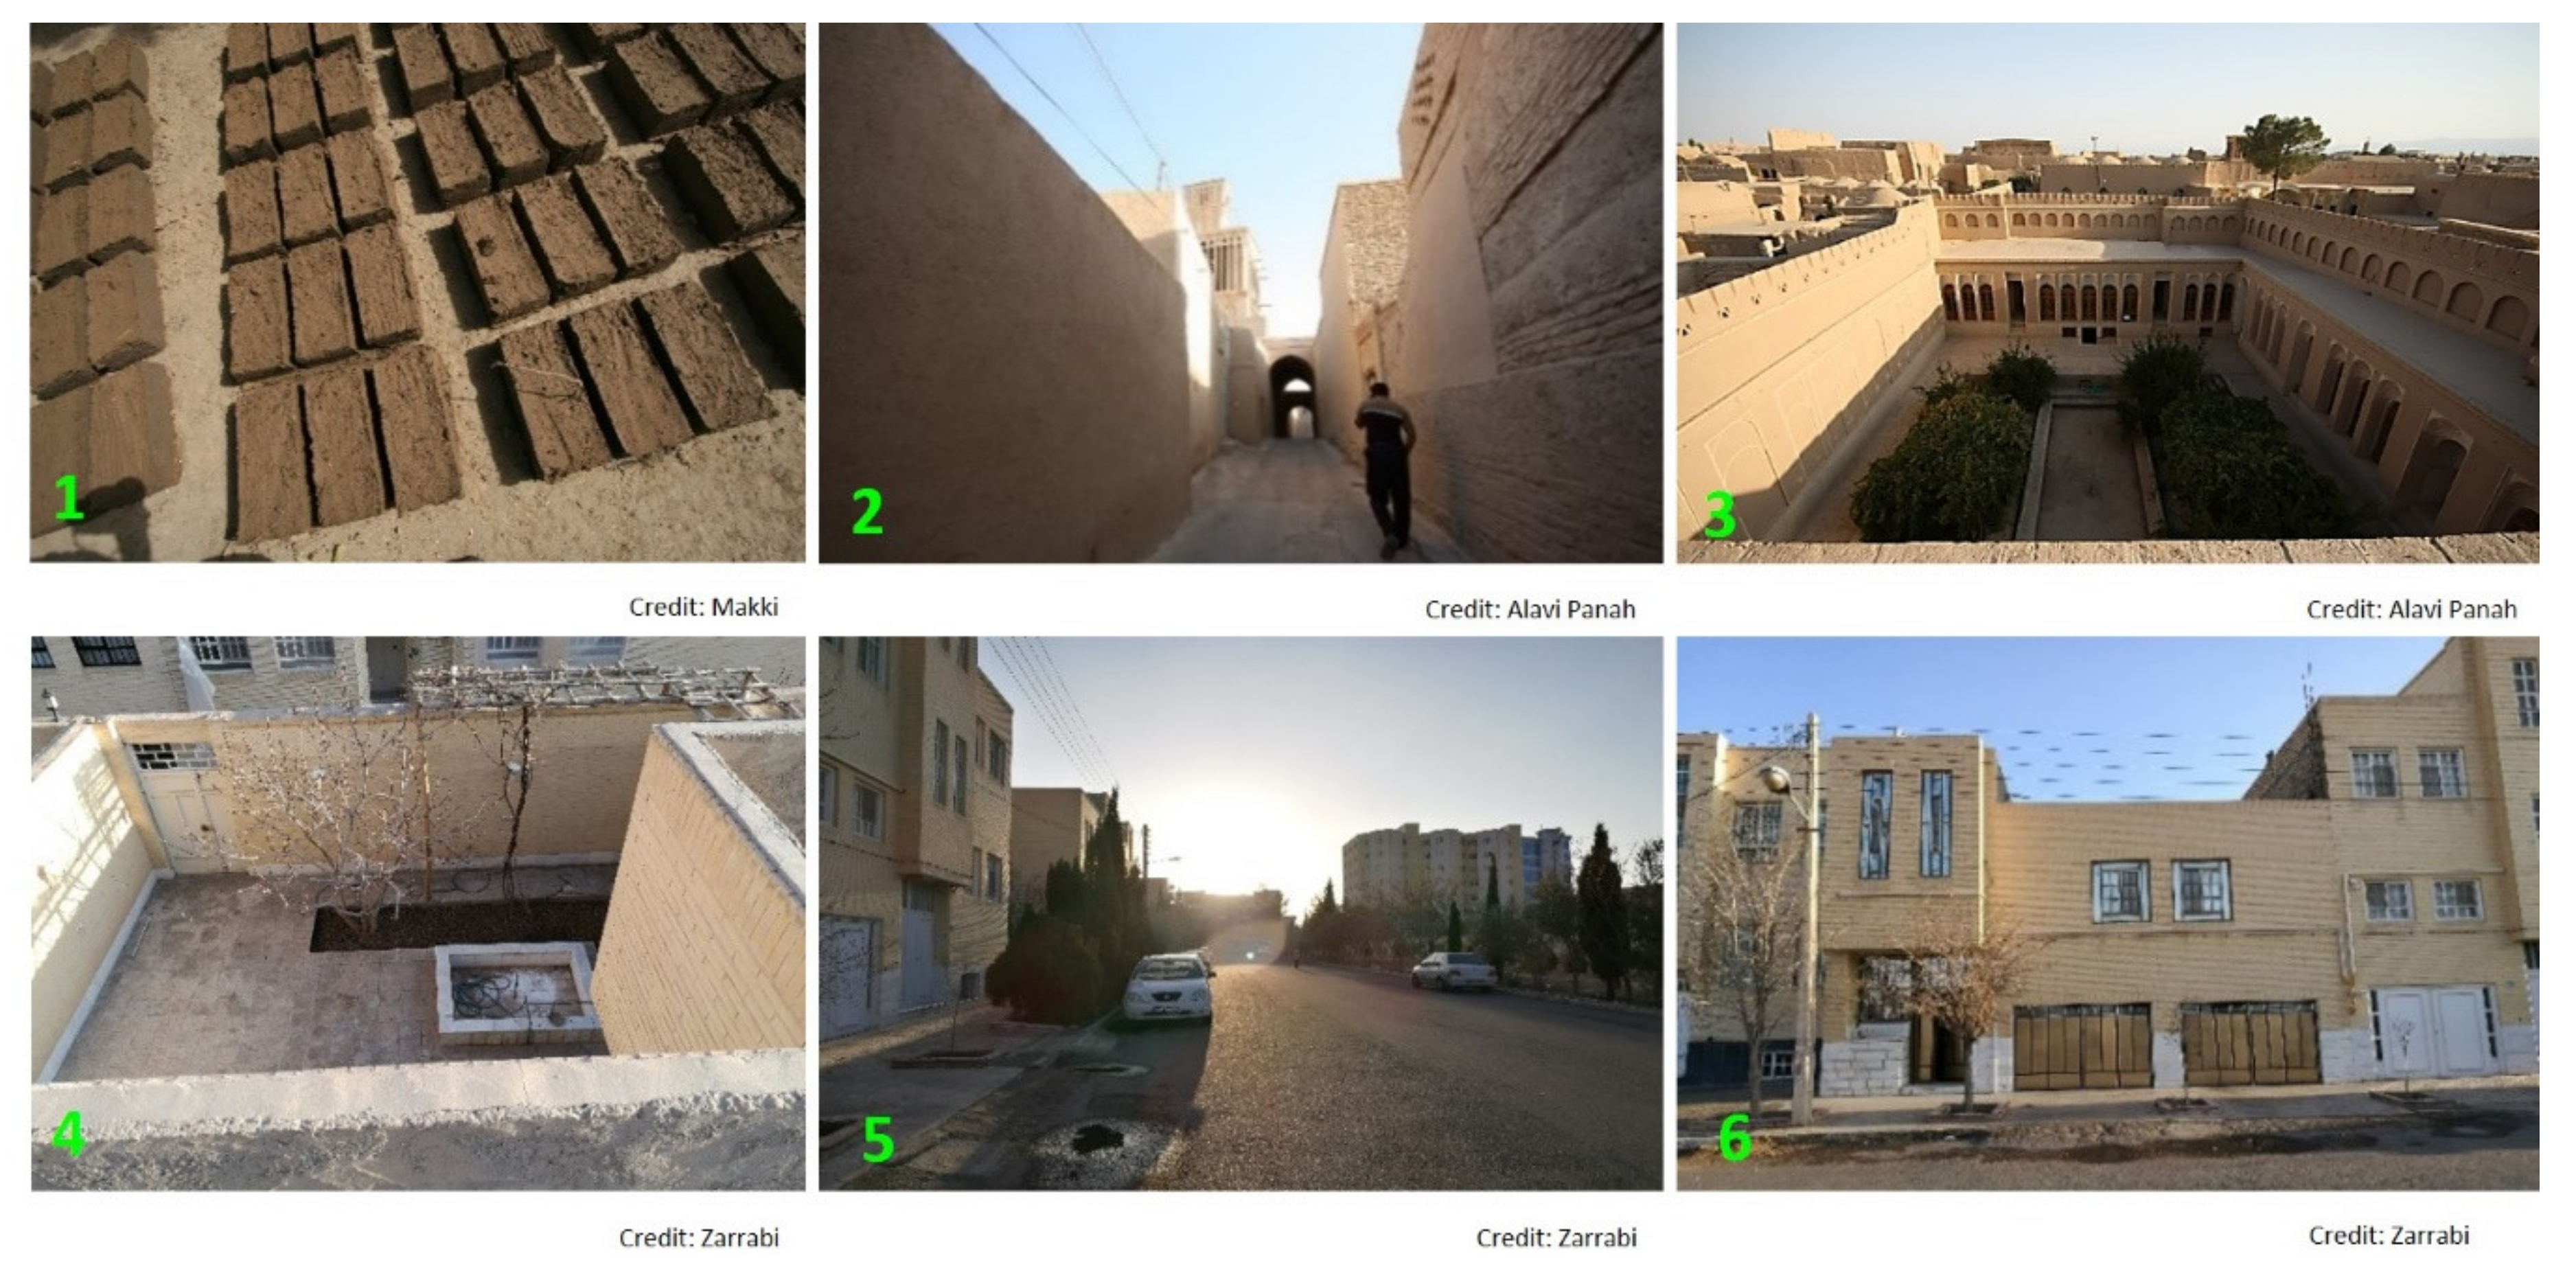
Figure 3.
The left-hand panel (A) shows the temperature data logger. The right-hand panel (B) shows the distribution of the temperature data loggers for the entire city of Yazd (10 devices in the historical district and 60 devices in the newly built district).
Figure 3.
The left-hand panel (A) shows the temperature data logger. The right-hand panel (B) shows the distribution of the temperature data loggers for the entire city of Yazd (10 devices in the historical district and 60 devices in the newly built district).
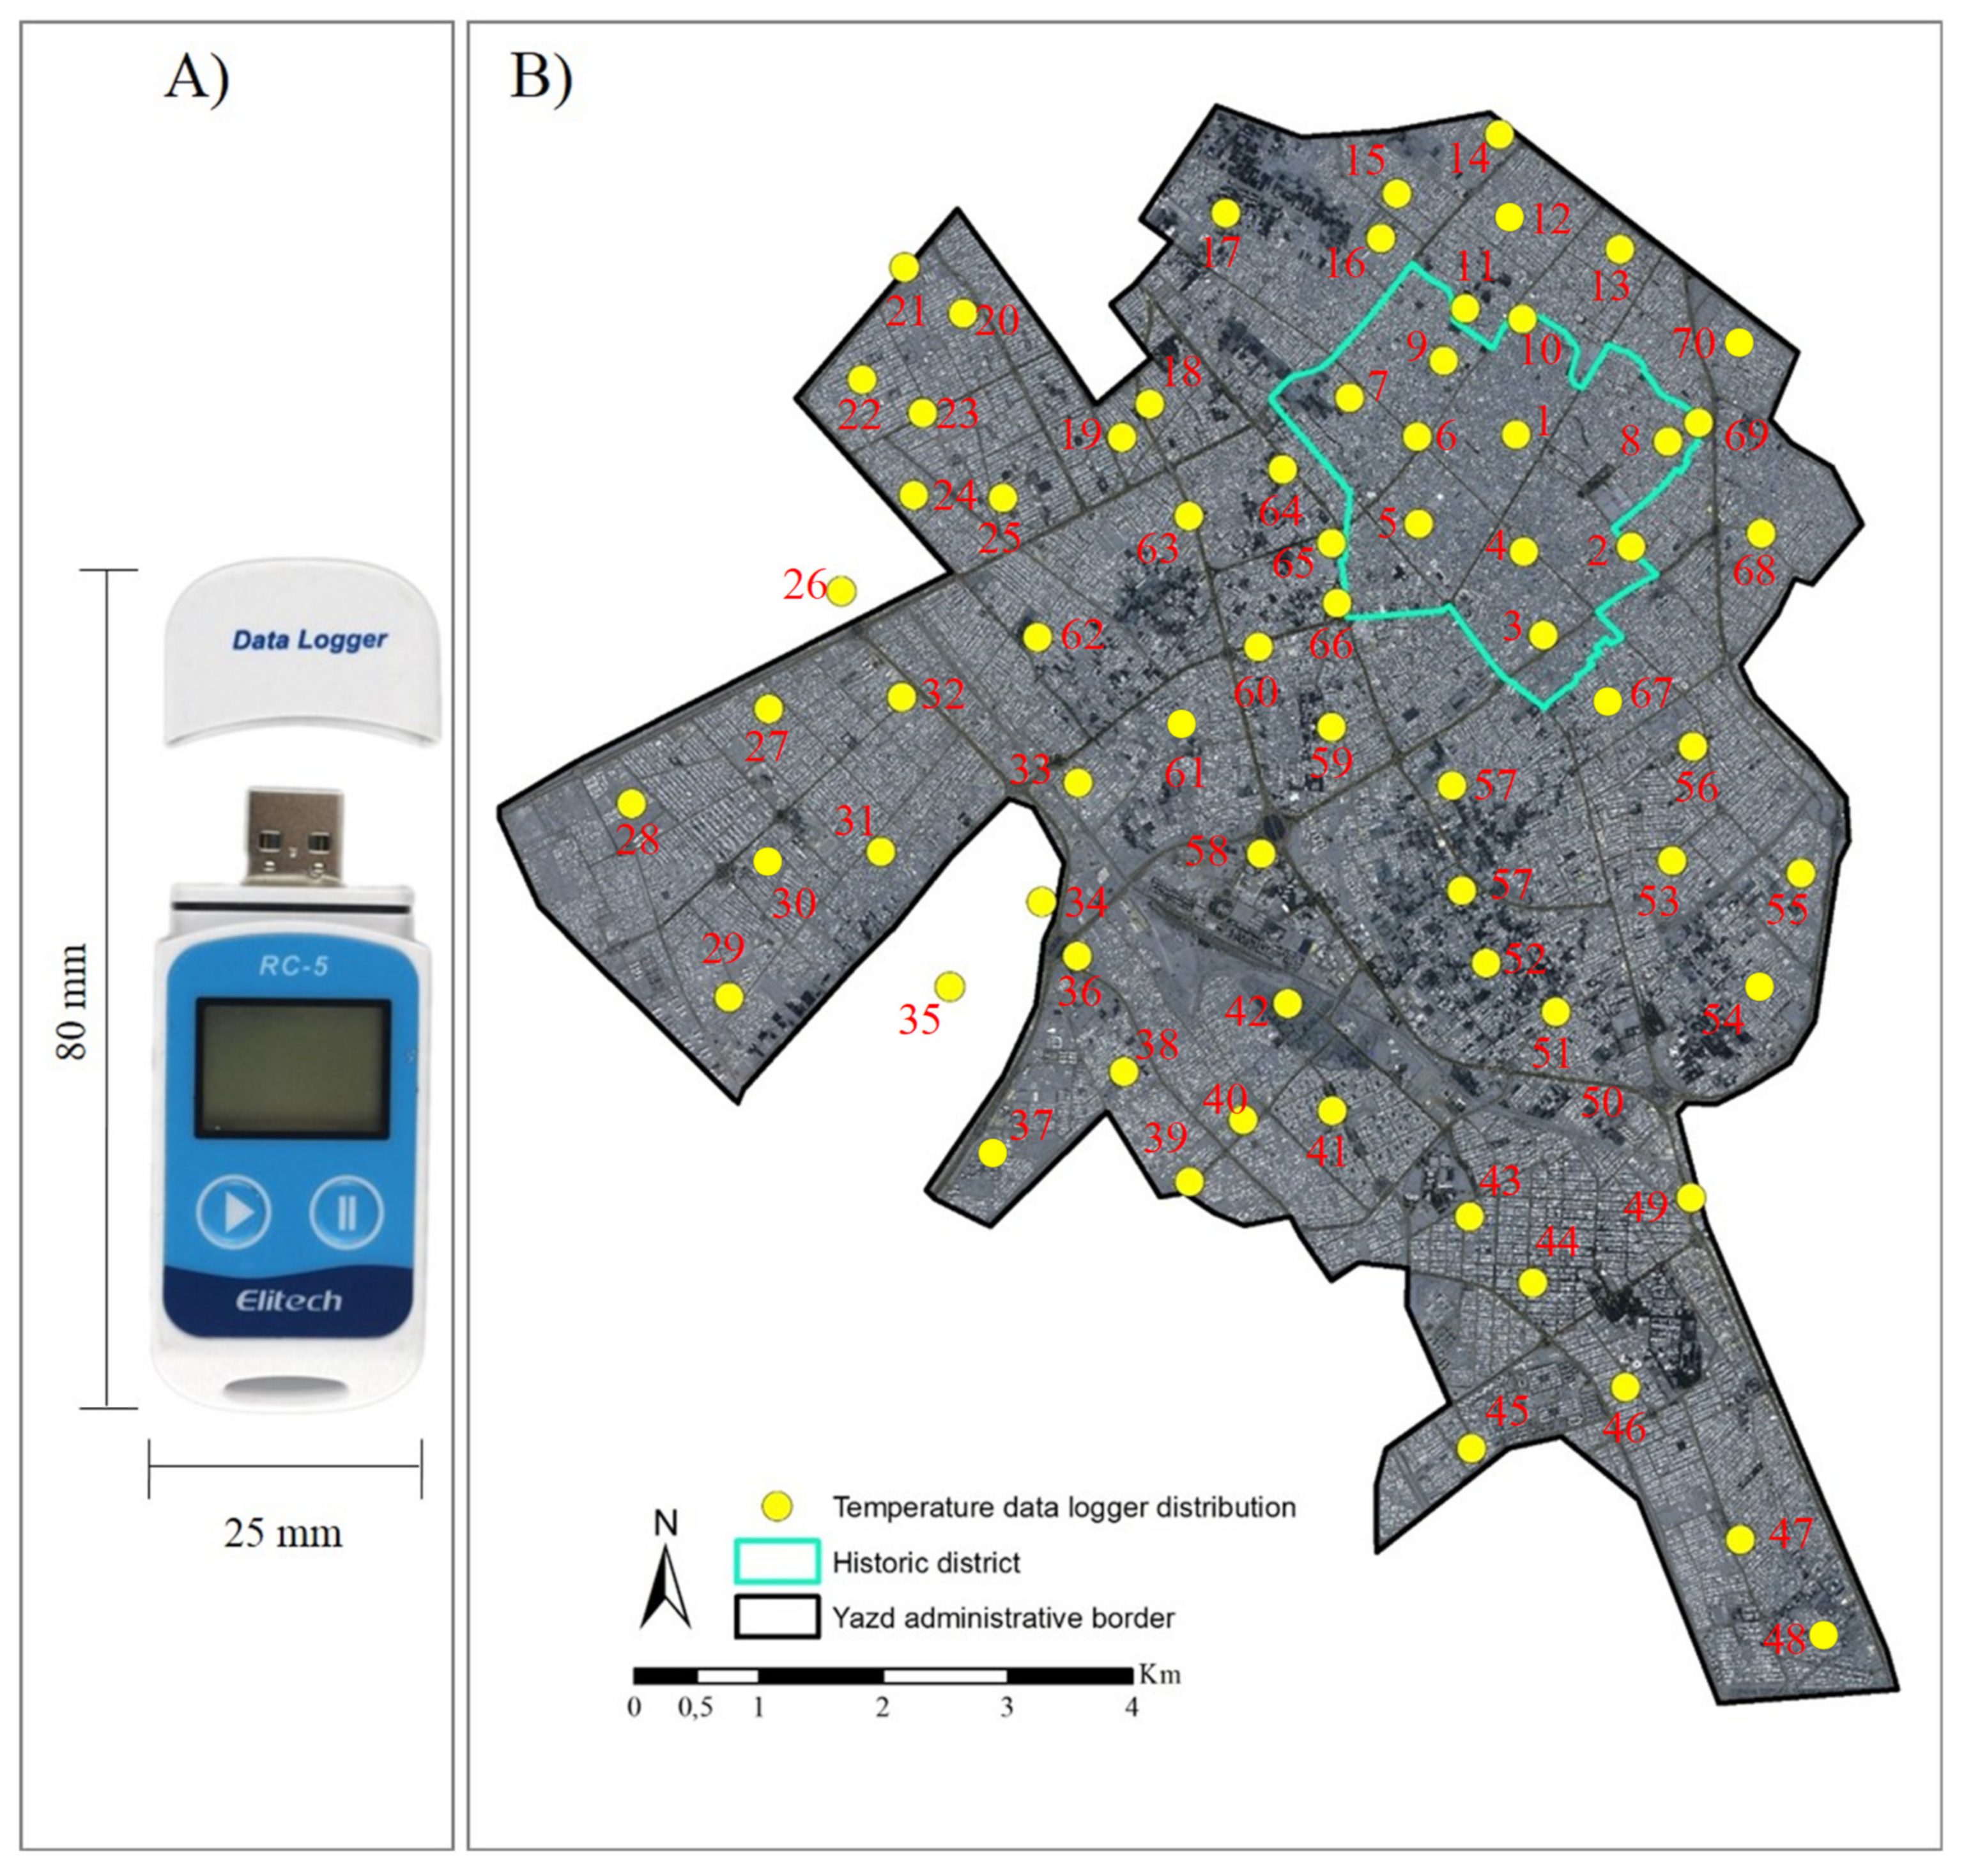
Figure 4.
(Upper figure) Average daytime and night-time temperatures of historical and new districts of the city of Yazd based on 10 temperature loggers in the historical district and 60 temperatures in the newly built district. (Lower figure) Variance of indoor temperature during the recording period in both historical and newly built districts.
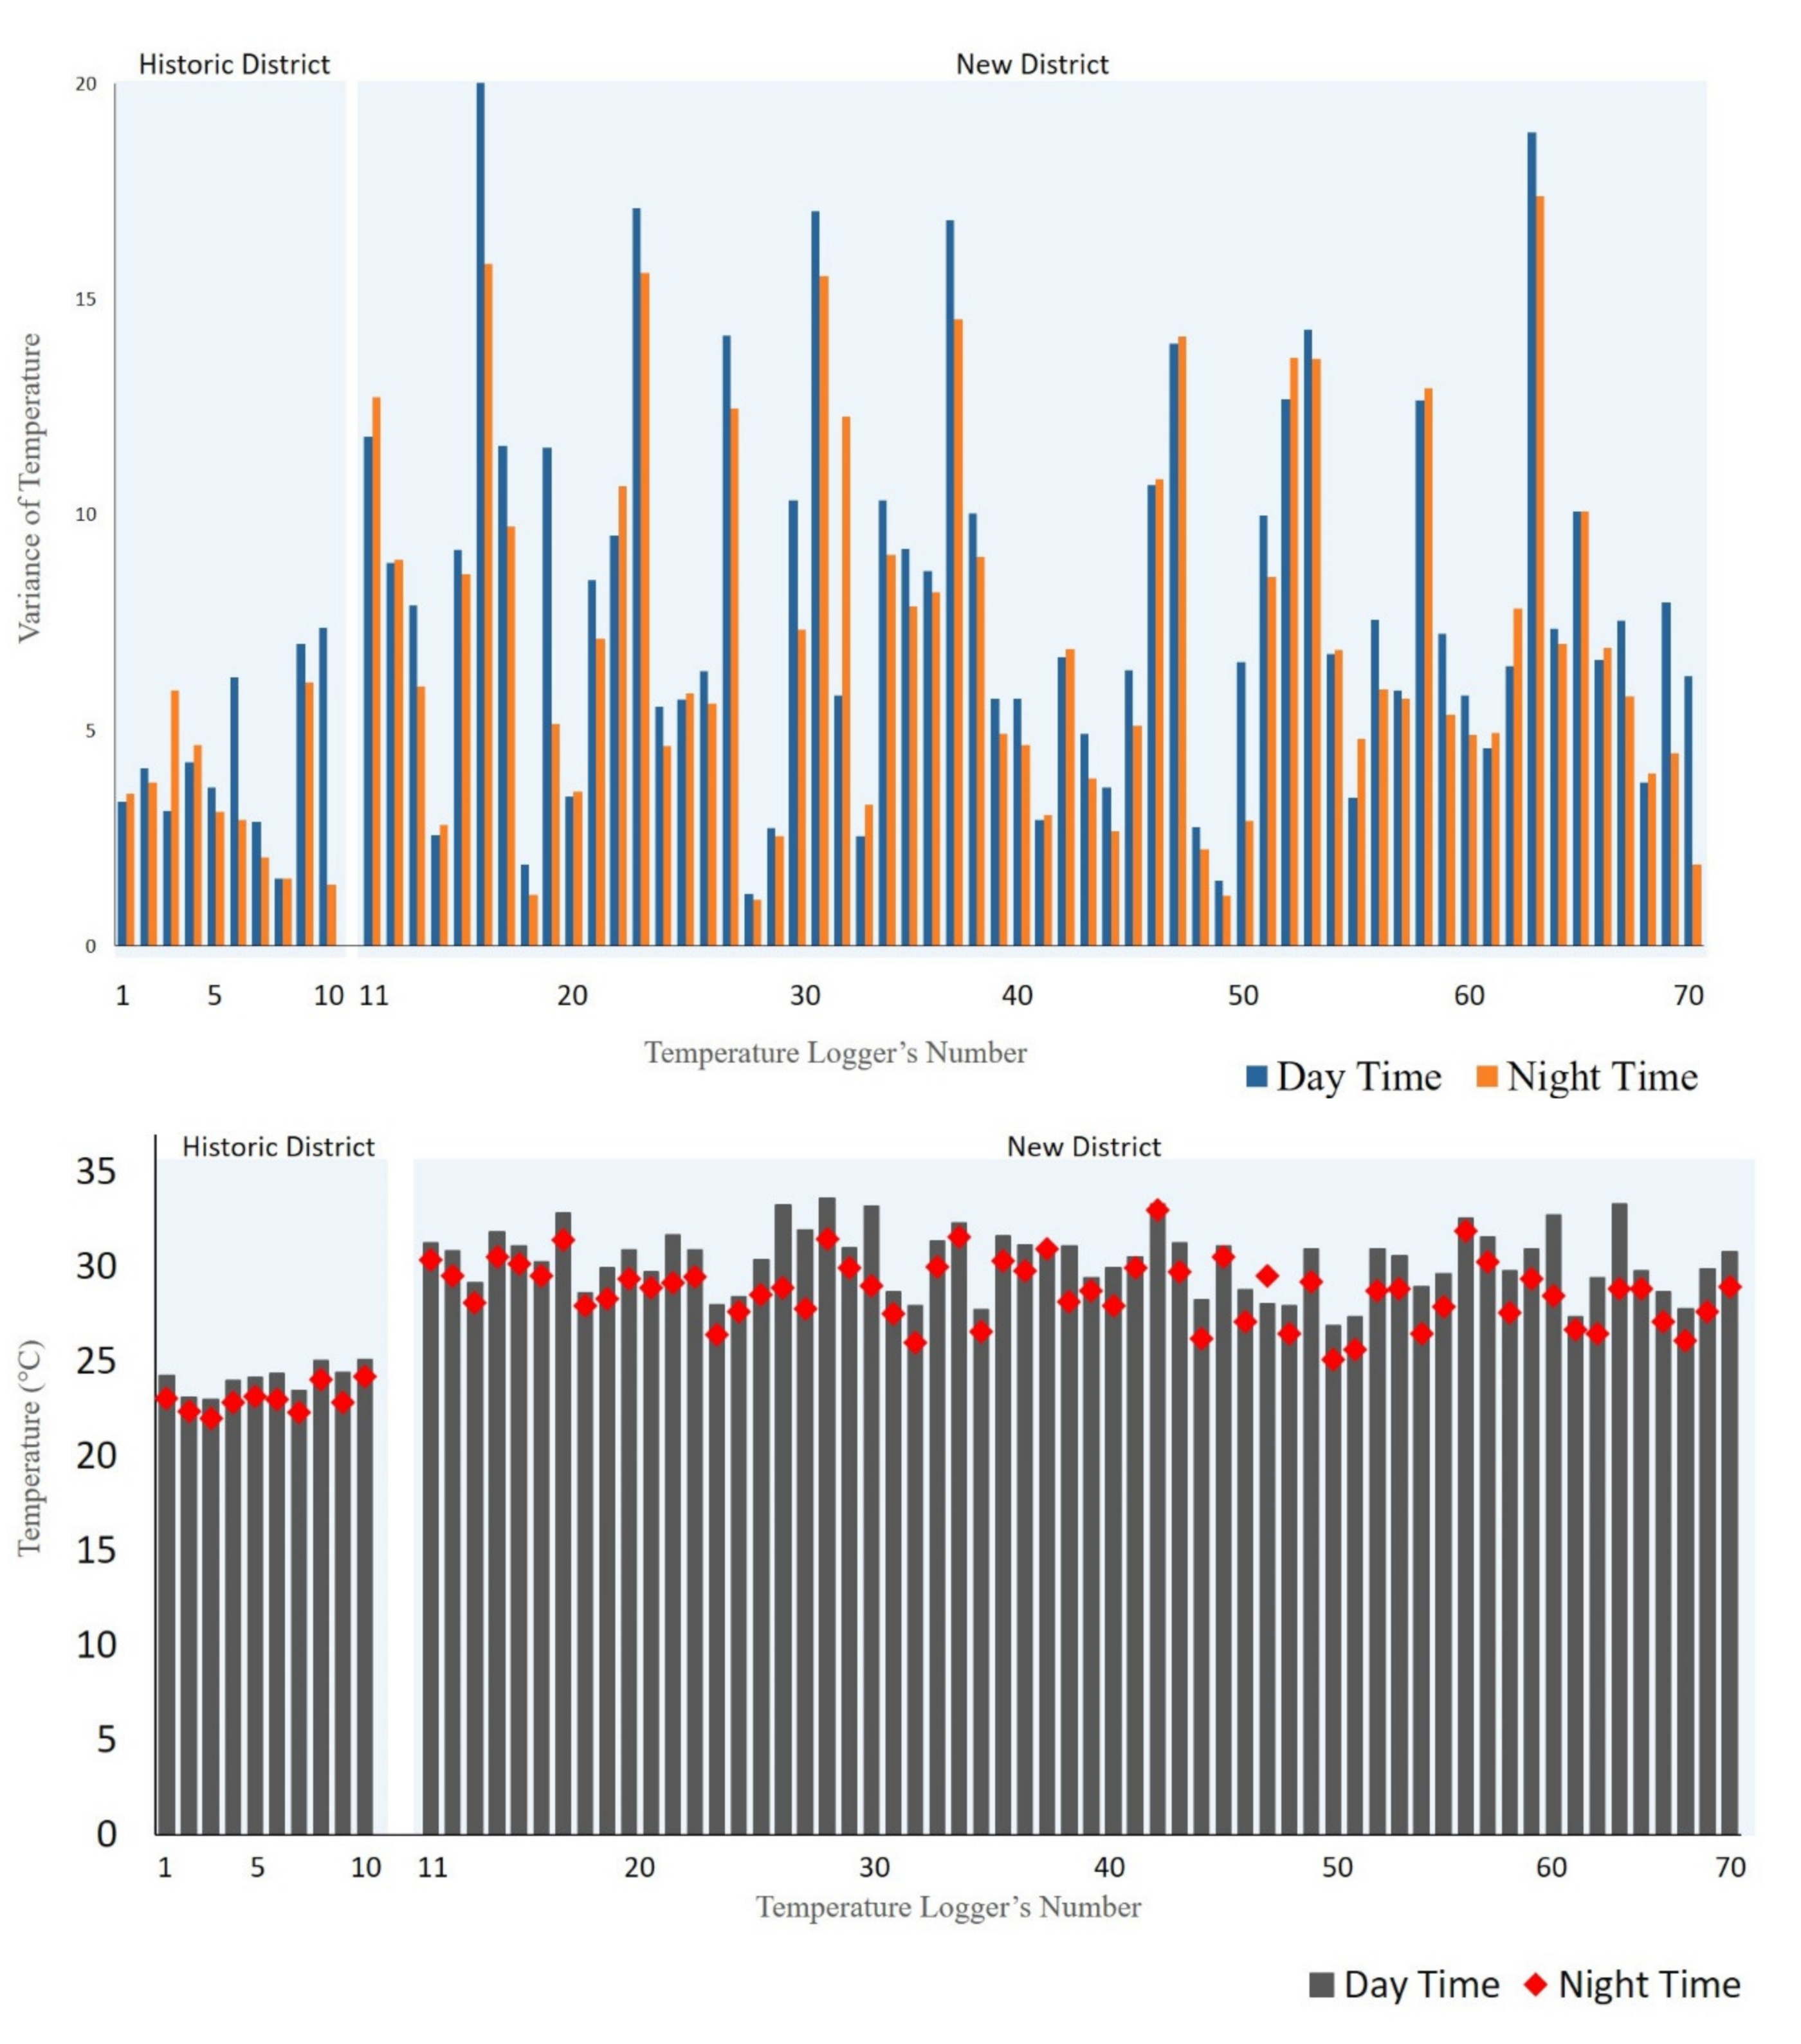
Figure 5.
The hot spots and cold spots of both historical and newly built districts of Yazd during daytime and nighttime (from 25 March to 20 September 2017).
Figure 5.
The hot spots and cold spots of both historical and newly built districts of Yazd during daytime and nighttime (from 25 March to 20 September 2017).

Figure 6.
Surface temperature for the city of Yazd, including both the historical and the new districts.
Figure 6.
Surface temperature for the city of Yazd, including both the historical and the new districts.

Table 1.
Average day length hours during the months of temperature logger records in the city of Yazd.
Table 1.
Average day length hours during the months of temperature logger records in the city of Yazd.
| Months of Temperature Record | Average Sunrise | Average Sunset | Day Length Hours |
|---|---|---|---|
| March | 06:47:30 | 19:08:00 | 11:55:00 |
| April | 06:24:00 | 19:22:00 | 12:55:00 |
| May | 05:56:30 | 19:42:00 | 13:46:00 |
| June | 05:48:30 | 19:57:30 | 14:11:00 |
| July | 05:58:30 | 19:56:00 | 14:00:00 |
| August | 06:17:00 | 19:32:00 | 13:17:00 |
| September | 06:35:00 | 19:33:00 | 12:19:00 |
Table 2.
Critical p-value and z-scores for different confidence levels.
| Critical Value (z-Score) | Significance Level (p-Value) | Confidence Level |
|---|---|---|
| < −1.65 or > +1.65 | <0.10 | 90% |
| < −1.96 or > +1.96 | <0.05 | 95% |
| < −2.58 or > +2.58 | <0.01 | 99% |
Table 3.
Distribution of surface temperatures in different districts and land cover types of Yazd.
| Surface Temperature | Minimum Record (°C) | Maximum Record (°C) | Average (°C) | Standard Deviation |
|---|---|---|---|---|
| Entire study area | 33.2 | 47.8 | 39.2 | 2.6 |
| Built-up area in new district | 32.2 | 45.2 | 38.2 | 1.9 |
| Built-up area in historical district | 34.4 | 46.9 | 39.2 | 1.7 |
| Bare soil | 37.0 | 47.8 | 42.8 | 1.9 |
Publisher’s Note: MDPI stays neutral with regard to jurisdictional claims in published maps and institutional affiliations. |
© 2021 by the authors. Licensee MDPI, Basel, Switzerland. This article is an open access article distributed under the terms and conditions of the Creative Commons Attribution (CC BY) license (http://creativecommons.org/licenses/by/4.0/).
Share and Cite
MDPI and ACS Style
Alavipanah, S.; Haase, D.; Makki, M.; Nizamani, M.M.; Qureshi, S. On the Spatial Patterns of Urban Thermal Conditions Using Indoor and Outdoor Temperatures. Remote Sens. 2021, 13, 640. https://doi.org/10.3390/rs13040640
AMA Style
Alavipanah S, Haase D, Makki M, Nizamani MM, Qureshi S. On the Spatial Patterns of Urban Thermal Conditions Using Indoor and Outdoor Temperatures. Remote Sensing. 2021; 13(4):640. https://doi.org/10.3390/rs13040640
Chicago/Turabian StyleAlavipanah, Sadroddin, Dagmar Haase, Mohsen Makki, Mir Muhammad Nizamani, and Salman Qureshi. 2021. "On the Spatial Patterns of Urban Thermal Conditions Using Indoor and Outdoor Temperatures" Remote Sensing 13, no. 4: 640. https://doi.org/10.3390/rs13040640
Note that from the first issue of 2016, this journal uses article numbers instead of page numbers. See further details here.