Article

Complex Principal Component Analysis of Antarctic Ice Sheet Mass Balance

1
State Key Laboratory of Geodesy and Earth’s Dynamics, Innovation Academy for Precision Measurement Science and Technology, CAS, Wuhan 430077, China
2
National Satellite Meteorological Center, Beijing 100081, China
*
Author to whom correspondence should be addressed.
Remote Sens. 2021, 13(3), 480; https://doi.org/10.3390/rs13030480
Submission received: 22 December 2020 / Revised: 24 January 2021 / Accepted: 27 January 2021 / Published: 29 January 2021

Abstract

:
Ice sheet changes of the Antarctic are the result of interactions among the ocean, atmosphere, and ice sheet. Studying the ice sheet mass variations helps us to understand the possible reasons for these changes. We used 164 months of Gravity Recovery and Climate Experiment (GRACE) satellite time-varying solutions to study the principal components (PCs) of the Antarctic ice sheet mass change and their time-frequency variation. This assessment was based on complex principal component analysis (CPCA) and the wavelet amplitude-period spectrum (WAPS) method to study the PCs and their time-frequency information. The CPCA results revealed the PCs that affect the ice sheet balance, and the wavelet analysis exposed the time-frequency variation of the quasi-periodic signal in each component. The results show that the first PC, which has a linear term and low-frequency signals with periods greater than five years, dominates the variation trend of ice sheet in the Antarctic. The ratio of its variance to the total variance shows that the first PC explains 83.73% of the mass change in the ice sheet. Similar low-frequency signals are also found in the meridional wind at 700 hPa in the South Pacific and the sea surface temperature anomaly (SSTA) in the equatorial Pacific, with the correlation between the low-frequency periodic signal of SSTA in the equatorial Pacific and the first PC of the ice sheet mass change in Antarctica found to be 0.73. The phase signals in the mass change of West Antarctica indicate the upstream propagation of mass loss information over time from the ocean–ice interface to the southward upslope, which mainly reflects ocean-driven factors such as enhanced ice–ocean interaction and the intrusion of warm saline water into the cavities under ice shelves associated with ice sheets which sit on retrograde slopes. Meanwhile, the phase signals in the mass change of East Antarctica indicate the downstream propagation of mass increase information from the South Pole toward Dronning Maud Land, which mainly reflects atmospheric factors such as precipitation accumulation.

Graphical Abstract

1. Introduction

Antarctica shows an important regulatory role in climate changes. The relationship between the ice sheet and climate change over Antarctica has been intensively studied. Studies [1,2,3,4,5,6] indicate there has been an increased warming of the atmosphere over Antarctica during the second half of the 20th century, especially in the western Antarctic Peninsula (WAP) with the rates of 0.4 °C/decade. Turner et al. (2016) [7] and Oliva et al. (2017) [8] analyzed stacked temperature records and noted that the atmospheric temperature has shifted from 0.32 °C/decade to −0.47 °C/decade between 1979–2014. This climate change contributed to the regional mass balance of glaciers. El Niño changes and atmospheric circulation changes in Antarctica have also affected the ice sheet balance [7,9,10].
Some studies suggest that the factors of iceberg calving, basal melt, intrusion of warm saline water on retrograde slopes, and ice discharge have played a dominant role in West Antarctica’s mass loss in recent years [11,12,13,14]. The mass change, caused by the disintegration of the ice shelf related to atmospheric and ocean-driven processes, and the enhanced basal melting linked to warmer sea water are mainly concentrated on the ice shelf sections that extend beyond the Antarctic land mass, and rarely involve inland ice sheet mass changes [15].
The impact of climate factors such as El Niño-Southern Oscillation (ENSO) on the mass changes in the Antarctic is also receiving increasing attention. For example, Turner (2004) [16] pointed out there is a correlation between ENSO signals and pressure anomalies over the Amundsen. Sasgen et al. (2010) [17] also found the signals of ENSO in the ice sheet variations on the West Antarctica. Mémin et al. (2015) [18] also found 4–6-year signals in the changes of the Antarctic ice sheet balance using empirical orthogonal functions and connected this signal to the Antarctic circumpolar wave (ACW).
Gravity Recovery and Climate Experiment (GRACE) data can monitor land water reserves, glaciers, and ice sheet balance in Antarctica [19,20,21,22,23]. The GRACE satellites can provide direct information on ice sheet mass balance changes in Antarctica. These data have unique advantages such as global coverage and observation continuity, and this provides abundant observations that can be used to study the ice sheet balance of the Antarctica and its response to climate change. In this paper, based on the grounded portions of the Antarctic drainage data definitions by Zwally [24], we present the principal components (PCs), their time-frequency information, and the phase distribution of mass change in Antarctica using complex principal component analysis (CPCA) and the wavelet method. The CPCA results revealed the PCs that affect the ice sheet balance, and the wavelet analysis exposed the time-frequency variation of the quasi-periodic signal in each component, which help to determine which factors are dominant in mass change, and provide references for future research.

2. Materials and Methods

2.1. GRACE Data

The variation of Earth’s gravity field reflects the redistribution of mass inside the Earth. Over a short time (compared with geologic time), the variation of the gravity field can be regarded as mass transfer of the Earth’s surface and shallow fluids. GRACE was jointly developed by NASA and The German Research Center for Geoscience (GFZ) and successfully operated for more than 15 years. Its monthly gravity solutions reflect changes of 1-mm geoid fluctuation at a 300-km spatial scale [25,26] and can be used to monitor gravity field variations caused by changes in hydrology and the cryosphere, earthquakes, and glacial isostatic adjustment [27,28,29,30,31].
We used GRACE data Release-06 (RL06) solutions provided by the Center for Space Research (CSR), University of Texas-Austin. The 164 approximately monthly GRACE gravity solutions cover the period from April 2002 to through June 2017 (~14 solutions are missing). Each monthly solution consists of normalized spherical harmonic (SH) coefficients, to degree and order 60. The main improvements in the RL06 products were as follows: (1) a reprocessed GPS constellation consistent with ITRF2014/IGS14; (2) re-processed RL03 Level-1B products for K-band and star camera instrument data; (3) updated models for ocean tides (FES2014) and Atmosphere and Ocean De-aliasing (AOD1B RL06); and (4) modified parameterization of orbit and instruments. The resulting RL06 time series of monthly GRACE Level-2 spherical harmonics with its underlying processing standards will then serve for the continuation with GRACE-follow-on (GRACE-FO) data with the idea of harmonizing the two time series. This will ensure the consistency between GRACE and GRACE-FO time series for all scientific studies and have improved precision. However, at high degrees and orders, GRACE spherical harmonics are contaminated by noise, including longitudinal stripes, and filtering is still needed. In our study, the smoothness priors method [32,33] was used to remove noise in the spatial domain. Compared with the Gaussian filter, correlated-error filter, and the combined filter (Gaussian with 300-km smoothing and correlated-error), the smoothness priors method has advantages of less reduction in signal amplitude at high latitude, preservation of greater detail for short-wavelength components in the result, and less signal distortion at low latitudes.

2.2. Glacial Isostatic Adjustment

To compute ice sheet mass trends from GRACE data and interpret them as changes in the water content of hydrologic basins, ocean bottom pressure, or ice sheet mass, it is necessary to remove the effect of the glacial isostatic adjustment (GIA) of the lithosphere and mantle. For the GIA effect in Antarctica, several models have been released since 2012 [34,35,36]. We choose the latest GIA model [37], which consists of normalized spherical harmonic coefficients to degree and order 89, to remove the effect of GIA. The new model used a Bayesian framework with many new GPS time series from 459 sites and 11451 RSL data. Related data are available from the link https://vesl.jpl.nasa.gov/solid-earth/gia/.

2.3. Data Processing and Equivalent Water Height

The monthly Release 06 GRACE fields were expressed in the form of spherical harmonic coefficients. We replaced the coefficients of C20 in the GRACE field with satellite laser ranging estimations. The influence of geocenter variations on gravity was also considered [38]. According to Wahr et al. (1998) [19], at an arbitrary point with colatitude θ and longitude λ, the ice mass change can be expressed as
Δ σ ( θ , λ ) = a ρ e 3 ρ w n = 0 2 n + 1 1 + k n m = 0 n { [ c ˜ n m cos ( m λ ) + s ˜ n m sin ( m λ ) ] P ˜ n m ( cos θ ) }
where ρ e is the density of the Earth and ρ w is water density. Parameters kn and a are the load Love number and the equatorial radius, respectively; P ˜ n m ( cos θ ) is the nth degree and mth order fully normalized Legendre function. The coefficients c ˜ n m and s ˜ n m are the normalized SH coefficients.
In order to reduce the leakage of signal originating from the ice sheet to the oceans, an exact averaging kernel φ ( θ , λ ) (1 inside and 0 outside the region) is used based on the grounded portions of the Antarctic drainage data definitions by Zwally [24].
Δ σ ¯ region = 1 Ω region Δ σ ( θ , λ )   φ ( θ , λ )   d Ω
The mass change in vertically integrated water storage averaged over Antarctic region can be re-expressed by a sum of Stokes coefficients as
Δ σ ¯ ( θ , λ ) = a ρ e 3 ρ w Ω region n = 0 2 n + 1 1 + k n m = 0 n ( φ n m c c ˜ n m + φ n m s s ˜ n m )
where φ n m c and φ n m s are the spherical harmonic coefficients of the averaging kernel described above.

2.4. Complex Principal Component Analysis

Similar to empirical orthogonal function analysis, principal component analysis (PCA) also decomposes a matrix H composed of n observations at m observation points into the product of the mutually orthogonal spatial function V and the mutually orthogonal time function T; that is, H m n = V m m T m n , where
V = [ v 11 v 12 v 1 m v 21 v 22 v 2 m v m 1 v m m ] ,   and   T = [ t 11 t 12 t 1 n t 21 t 22 t 2 n t m 1 t m n ] .
Here, V is a spatial function that does not change with time, and T is a time function that only depends on time changes. v j = ( v 1 j , v 2 j , L , v m j ) T is the jth spatial mode, and t j = ( t j 1 , t j 2 , L , t j n ) is the jth PC. The product of the jth spatial mode and the jth PC can be expressed as
H j = v j t j = [ v 1 j t j 1 v 1 j t j 2 v 1 j t j n v 2 j t j 1 v 2 j t j 2 v 2 j t j n v m j t j 1 v m j t j n ]
Thus, the product of each spatial mode and its corresponding main component reflects the main change in the observation field H captured by the PC under the maximum variance criterion. Since the components are decomposed according to the principle of maximizing variance, they can reflect the changing characteristics of the original observation field H to the greatest extent. The disadvantage of the PCA method is that it can only detect standing waves rather than advancing waves due to the absence of phase information. To overcome this, Horel (1984) [39] introduced phase information into PCA to identify traveling signals and named the method CPCA [33]. CPCA has been widely used in the fields of atmosphere, ocean, and earth science to identify information such as advancing waves of observation fields [40,41,42,43]. The CPCA method combines the observation data and its Hilbert transform into a complex series and then executes the PCA. The CPCA method still performs PCA analysis, which has the same theoretical basis as the PCA method, but the input data contain phase information, so these data can express the wave propagation direction information. This information helps researchers uncover additional information about the observation data field itself.
Before CPCA, a complex observation sequence should first be constructed using a real observation series. For a time varying observation vector u j ( t ) , its Fourier expansion is:
u j ( t ) = ω [ a j ( ω ) cos ( ω t ) + b j ( ω ) s i n ( ω t ) ]
here, j represents the location of the observation point, ω is the Fourier frequency, and t is the observation time. In order to describe the propagation characteristics of a time series, it is necessary to construct the imaginary part and convert it into a complex observation sequence. The complex observation sequence can be expressed as:
U j ( t ) = ω c j ( ω ) e i ω t
here, we define c j ( ω ) = a j ( ω ) + i b j ( ω ) , i = 1 . Then the Equation (5) can be expanded as:
U j ( t ) = ω [ a j ( ω ) cos ( ω t ) + b j ( ω ) sin ( ω t ) ] + i [ b j ( ω ) cos ( ω t ) a j ( ω ) sin ( ω t ) ] = u j ( t ) + i v j ( t )
The real part of Equation (6) is the original observation sequence and the imaginary part is the Hilbert transform of the real part, which does not change the amplitude of each component of u j ( t ) . However, the phase of each spectral component is advanced by π / 2 .
The traditional PCA is the principal component analysis of the real observation vector, whereas the CPCA analysis is the principal component analysis of the constructed complex vector. After the normalization of the complex observation vectors, the average value is subtracted from the complex observation vector of each observation point, and then divided by the standard deviation. The complex correlation matrix of the observation point can be expressed as:
[ r 11 r 12 r 1 n r 21 r 22 r 2 n r n 1 r n 2 r n n ]
here r j k represents the multiple correlation coefficients between the jth and kth observation points. CPCA compresses information using the least complex eigenvector e j n of the correlation matrix (Equation (7)) and the complex principal component p n ( t ) , because the correlation matrix (Equation (7)) is a Hermitian matrix including n real eigenvalues λ . λ j / i = 1 n λ i denotes the contribution percentage of the jth principal component.
Observation vector U j ( t ) can be expressed as the sum of N principal components,
U j ( t ) = n = 1 N e j n * p n ( t )
where * stands for the complex conjugate, and both complex principal components and complex eigenvectors are orthogonal. The nth complex eigenvector element e j n can be expressed as
e j n = [ U j ( t ) * p n ( t ) ] t = s j n e i θ j n
here, e j n indicates the multiple correlation relationship between the jth time sequence and nth principal component, s j n and θ j n are, respectively, correlative order of magnitude and phase, and [ ] t signifies the average of times. The time sequence elements of principal components can be expressed as the functional form of amplitude T n and phase Φ n .
P n ( t ) = T n ( t ) e i Φ n ( t )

2.5. WAPS

For a time series, we usually need to perform harmonic analysis to determine the trend of changes and the periodic signals contained and then analyze the possible factors affecting its changes. For periodic signals, the harmonic analysis method gives only the frequency information of the signal and not the details of how the signal changes over time. The wavelet amplitude spectral analysis method compensates for this shortcoming by providing frequency and amplitude information of the signal vary with time.
The variation of the ice sheet in Antarctica is the result of interactions of many factors such as the ice sheet, atmosphere, and ocean. Its changes reflect the temporal variations of specific factors represented by different frequency signals as well as long-term non-periodic changes such as enhanced ice–ocean interaction, ice discharge, and intrusion of warm saline water on retrograde slopes. The PCs can be derived after CPCA analysis and can be expressed by a linear term and many periodic signals. The linear and periodic terms can be easily obtained through harmonic analysis. The linear and periodic terms all contribute to the mass changes of the observation field captured by its PCs. In addition to the linear term, we also need to analyze the time-frequency information of the periodic signals and investigate its possible connections with different climate factors based on the periodic characteristics of the signals. Therefore, after obtaining the evolution information of PCs of mass change in Antarctica, the time-frequency information of quasi-periodic signals required analysis. The WAPS is a useful tool for analyzing the variation in time of periods and the amplitude (energy) of different signals [44]. The advantage of this method is that it is simple to use and we can easily obtain the time-varying amplitude and period, as well as phase information of each quasi-periodic signal. This method has been widely used in time-frequency analysis of sea level changes, glacier mass balance, and other geophysical signal changes. For a more detailed description, see [44,45,46,47].

3. Results

Each variation field of ice sheet was calculated over the Antarctic using each of the monthly gravity solutions following Equation (3), and then filtered with the smoothness priors method. In this way, we obtained the time sequence of mass changes from April 2002 to June 2017 at each grid point. However, some monthly GRACE gravity solutions were not available due to the data quality. Therefore, the time series of mass change at one point shows discontinuous and sudden transitions. Before applying the CPCA analysis, we need to interpolate the missing data to make the time sequence continuous. Here, we used a spline function to interpolate missing data in the time series. The rate of change of the ice sheet mass based on GRACE data was also estimated.
Figure 1 shows the time evolution and trend of the ice sheet mass change after eliminating the effect of GIA on the Antarctic from 2002–2017. It can be seen that the loss of ice in the Antarctica accelerated after 2007. The ice sheet change has the following spatial characteristics: There is a large mass loss area from the Antarctic Peninsula (AP) to Ellsworth (corresponding to the basins B19 to B27). The average annual ice sheet mass loss was 182.9 ± 13.4 Gt in this area, and this amplitude is consistent with estimates of 159 ± 26 Gt in West Antarctica, 33 ± 16 Gt on the Antarctic Peninsula [48], and 179 ± 17.2 Gt in West Antarctica [49]. There is a small mass drop centered in the Ross Land and Victoria area (corresponding to the basins B14 to B15), and Wilkes area (corresponding to the basin B13). The average ice sheet mass loss in these two areas was 12.4 ± 4.6 Gt and 13.4 ± 2.5 Gt per year. The area of mass increase is mainly located in Dronning Maud Land and Enderby Land (corresponding to the basins B4 to B8) areas corresponding to the East Antarctic West Indian Ocean sector. The average ice sheet mass increase in the area was 54.2 ± 5.0 Gt per year. The mass of ice sheets in other areas did not change significantly. The spatial characteristics of the mass change trend are similar to the result of ESA CCI AMB (https://data1.geo.tu-dresden.de/ais_gmb/).
We used the CPCA method to analyze the PCs of ice sheet mass change from 2002 to 2017. Table 1 shows the contributions to the mass change of the first three PCs of ice sheet change during the period of 2002–2017. The eigenvalues corresponding to the first three PCs are 9703.61, 297.32, and 216.33, respectively, and their contributions to the ice sheet balance in the region are 83.73%, 2.57%, and 1.87%, respectively. The results of the PCs analysis show that the main factors influencing the Antarctic ice sheet mass balance change mainly come from the behavior of the first PC. This behavior has absolute dominance over the ice sheet variation in the Antarctic region and explains 83.73% of its changes.
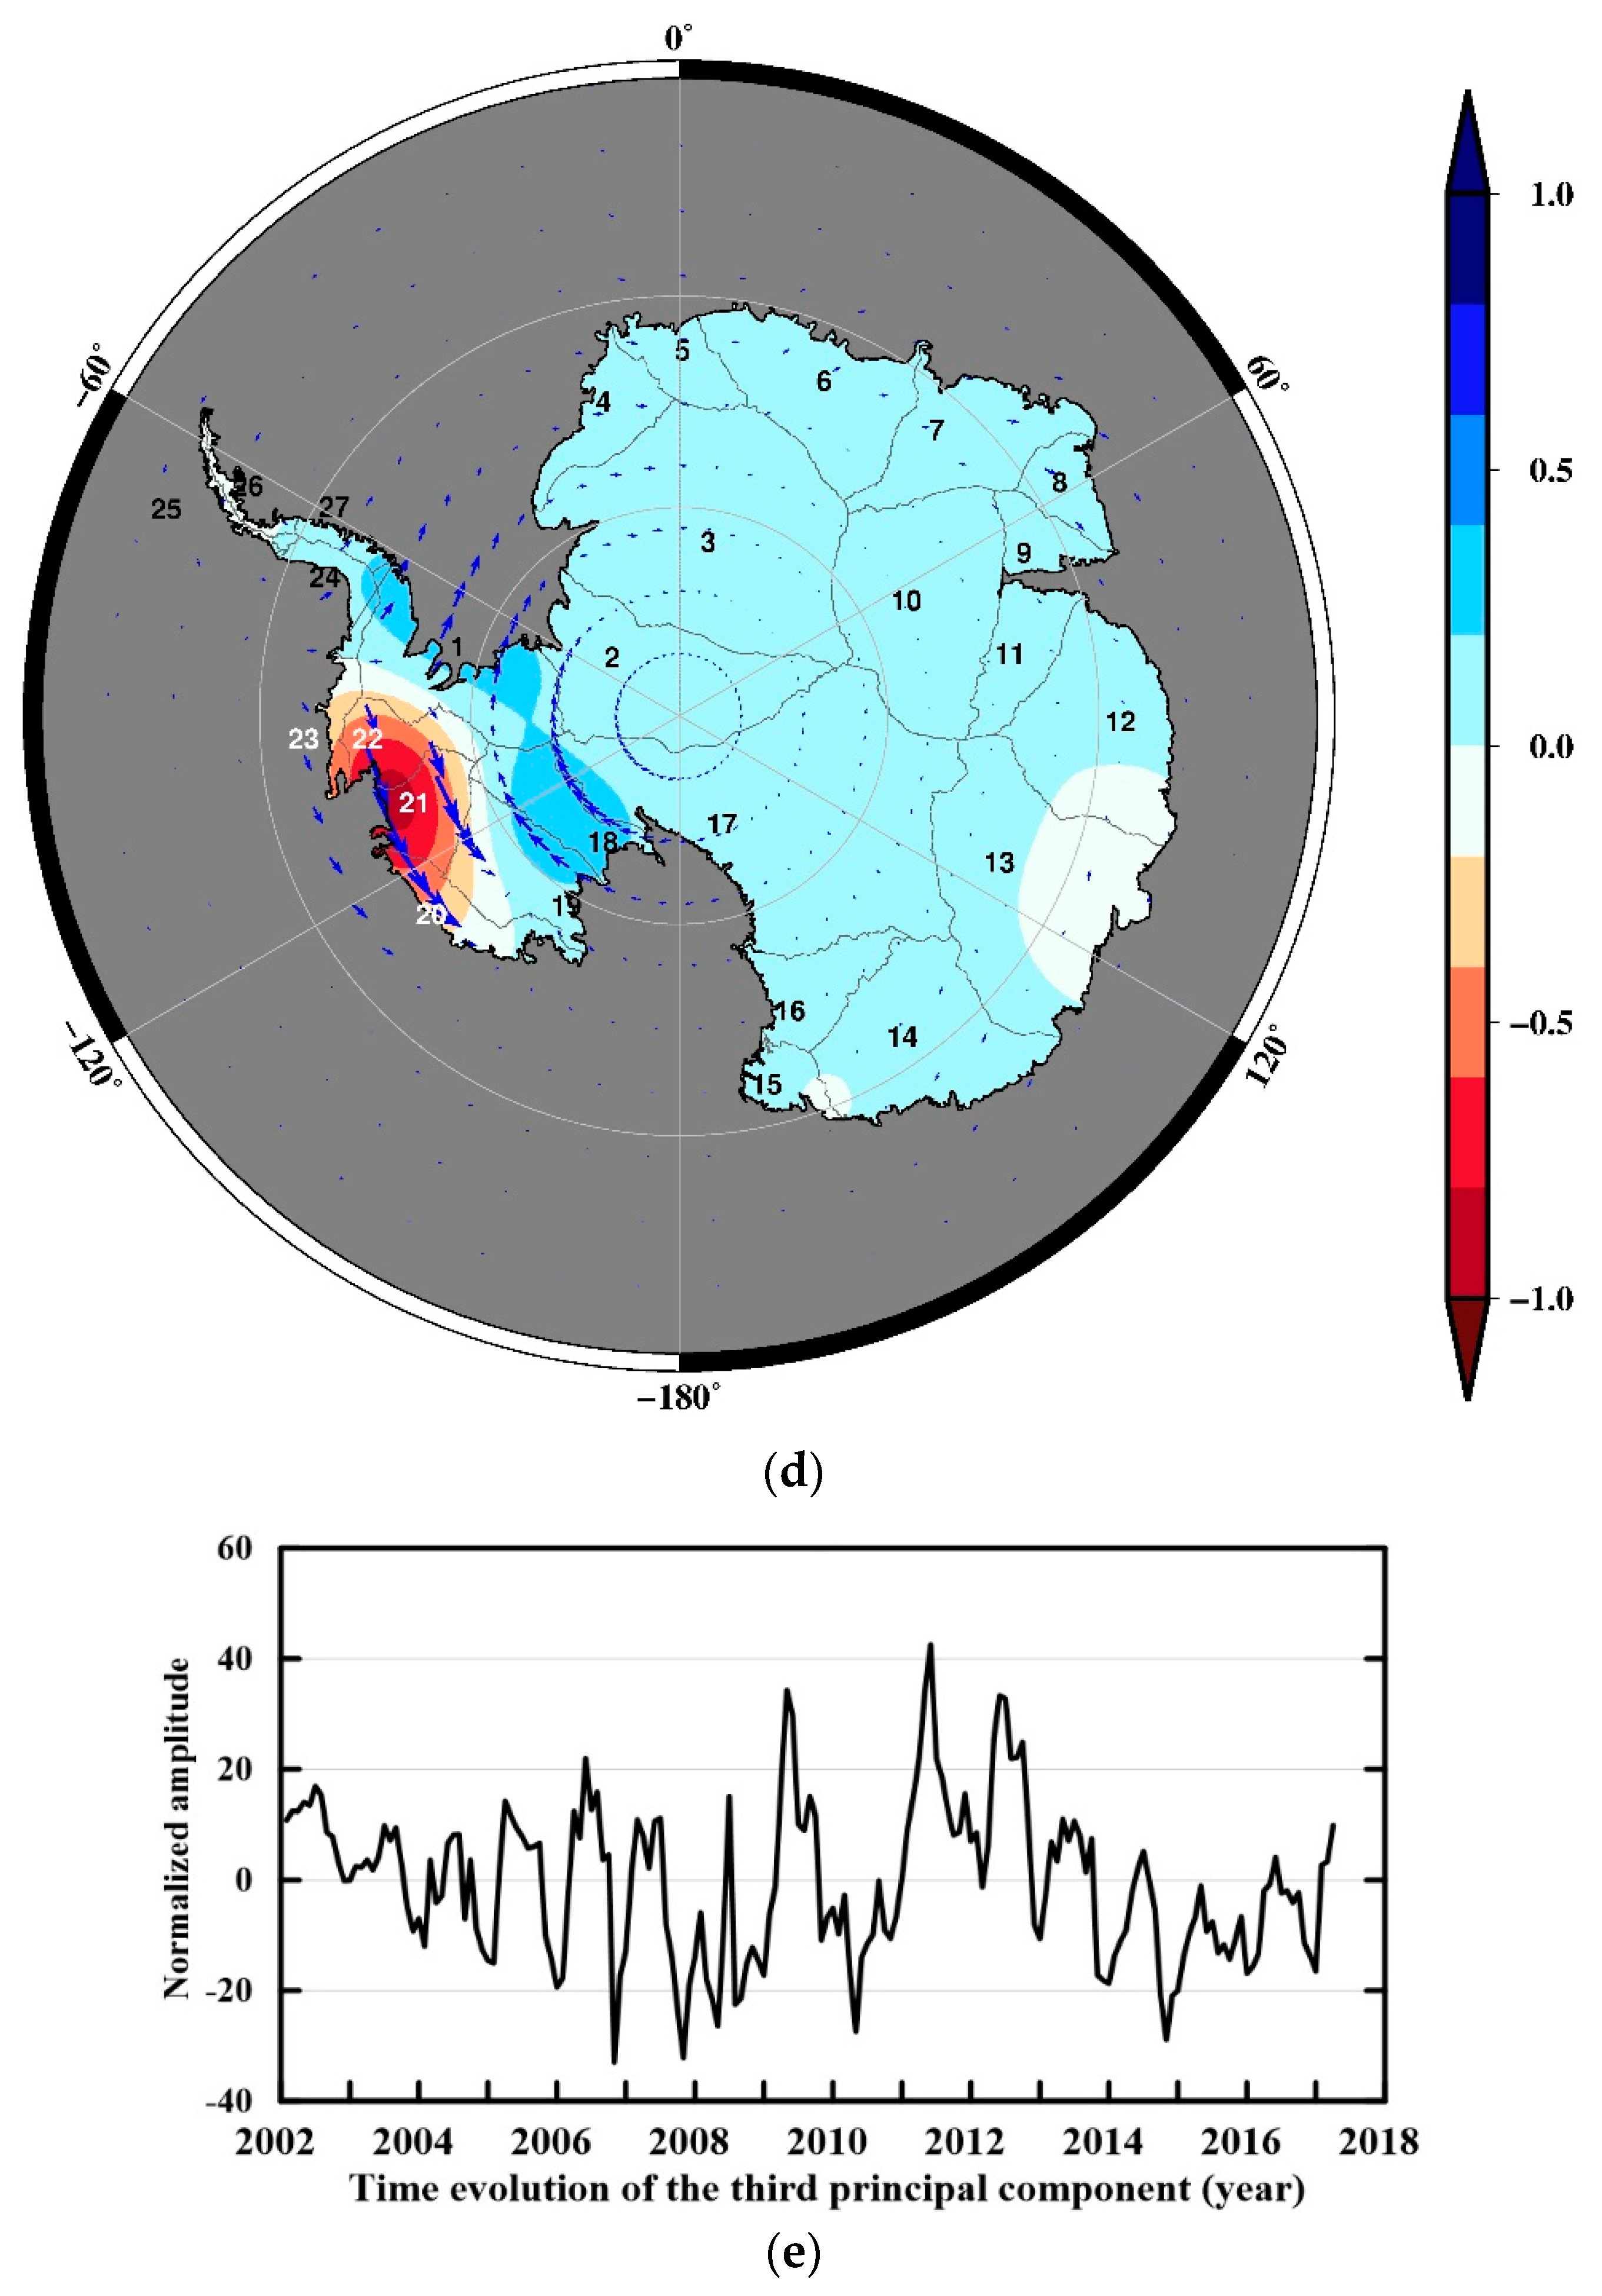
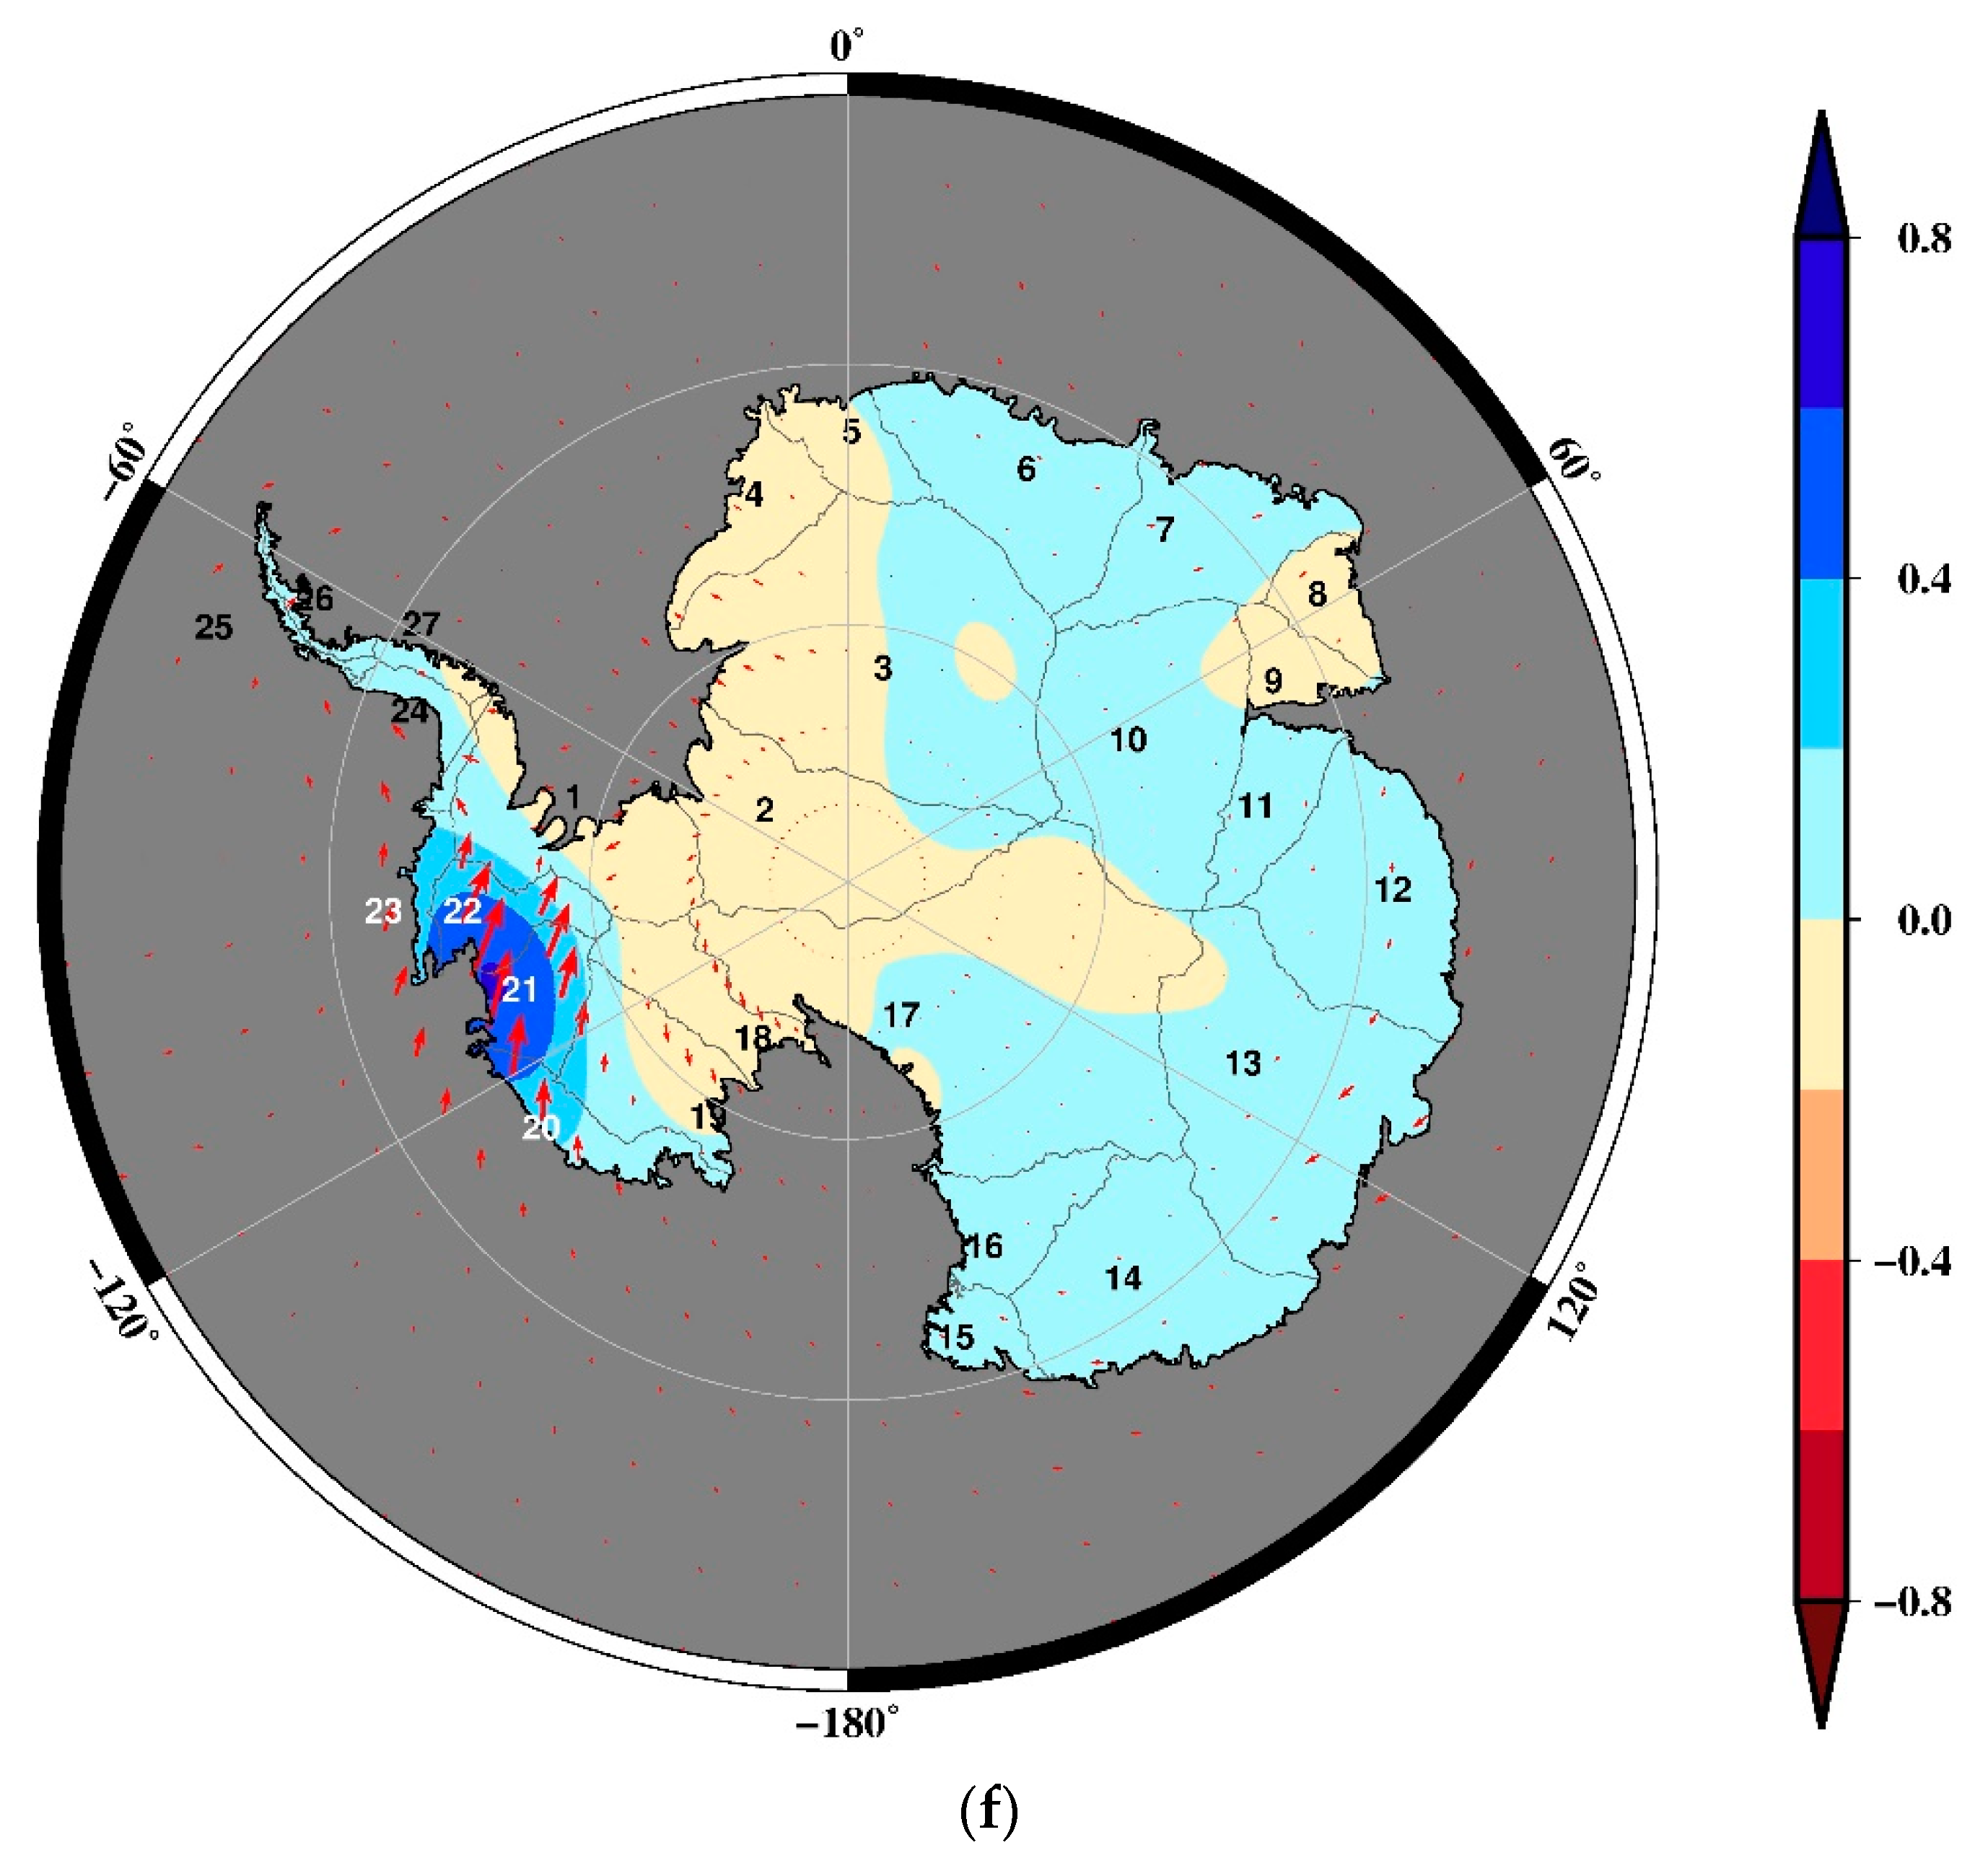
Figure 2 shows the evolution of the PCs, their corresponding spatial modes, and the phase distribution of the first three components derived by CPCA. Among them, the ice sheets in the AP and West Antarctica except for Basin 1 and Basin 18, Wilkes Land (B13), and Dronning Maud Land and Enderby Land (basins B4 to B8) (Figure 2b) areas are the most sensitive to the behavior corresponding to the first PC. The impact of the behavior corresponding to the second PC of the mass change in Antarctica rapidly drops to 2.57%. The ice sheet mass in the area of basin B21 (Figure 2d) is more sensitive to the behavior corresponding to the second PC. However, change corresponding to the third PC only accounts for 1.87% of the mass change. The ice sheet mass in the area of basins B21 to B23 (Figure 2f) is more sensitive to the behavior corresponding to the third PC. This result shows that the changes in the climatic factors that have recently affected the mass balance of the ice sheets in Antarctica are relatively simple.

4. Discussion

4.1. The First Three Principal Components

Similar to the PCA analysis method, CPCA also decomposes a matrix composed of n observations at p observation points into the product of the mutually orthogonal spatial function V and the mutually orthogonal time function T. The product of each spatial mode and its corresponding PC reflects the primary change of the observation field H captured by the PC under the maximum variance criterion. Since the components are decomposed according to the principle of maximizing variance, they can reflect the changing characteristics of the original observation field H to the greatest extent. Compared with PCA, the CPCA results not only show the time evolution of the PCs and their corresponding spatial mode characteristics, but also provide phase distribution information of the PCs, thereby enabling CPCA to identify traveling waves. This traveling wave information not only reflects the spatial correlation of mass change, but also indicates the direction from which the factor that affected the mass change originated.
As shown in Figure 2a, the first PC exhibits a rising trend and low-frequency signals, revealing that the main factors affecting the ice sheet changes are linear and low-frequency periodic terms. Figure 2b reflects the spatial characteristics of ice sheet mass changes in basins B20 to 23 of West Antarctica and basins B20 to 23 of East Antarctica. The result shows that the first PC displays a rising trend, and the mass change in basins B20 to 23 of the first spatial mode has a maximum negative value, while the mass variation in basins B5 to 8 has a maximum positive value. Therefore, the product between the first PC and its corresponding spatial mode reflects the mass loss trend characteristics in basins B20 to 23 and the mass increase in the B5 to 8 area. This result is consistent with the spatial characteristics of mass change in Antarctica, indicating that the first PC captured the spatial pattern of the dominant mass change trend of the ice sheet. In addition to the rising trend, the first PC also exhibits a significant low-frequency periodic signal. Since the amplitude of the quasi-periodic signal is not constant over time, the linear estimation of the ice sheet mass balance in Antarctica contains the contribution of the low-frequency signal to the trend. Compared with the second and third PC, the factor corresponding to the first PC has a larger scale because the area that affects the mass change of Antarctica has the larger scale.
Researchers have pointed out that on the southern Antarctic Peninsula, the ice sheet manifested a slight mass loss trend from 2003 to 2015, while the regional atmospheric climate model result showed that during this period the integral surface mass balance (iSMB, the cumulative sum of each monthly SMB) decreased slightly, suggesting there is no significant increase or decrease in mass in this region at that time [50,51].
In West Antarctica (especially in basins B21 to B23), the GRACE results of Gao et al. (2019) [50] show that the rate of mass loss was −126.2 ± 6.2 Gt/a from 2003 to 2007, −243.8 ± 7.5 Gt/a from 2007 to 2011, and −231.5 ± 7.1 Gt/a from 2011 to 2015. Meanwhile, the iSMB product indicates that during the periods of 2003–2007, 2007–2011, and 2011–2015, the mass loss rates of iSMB in West Antarctica were 435.1 ± 34.8 Gt/a, 368.6 ± 29.5 Gt/a, and 385.7 ± 30.9 Gt/a, respectively. This result indicates the further acceleration of mass loss after 2009 in this region. This conclusion is highly consistent with the results of Mouginot et al. (2014) [52] and Shepherd et al. (2018) [48]. Dutrieux et al. (2014) [53] discussed the causes of the slowdown on Pine Island from 2012 to2013, and the effect of seawater temperature on the melting rate of the ice shelf.
Different from West Antarctica, the rates of ice sheet increase in Dronning Maud Land determined from the GRACE observations were 23.0 ± 7.8 Gt/a from 2003 to 2007, 99.5 ± 8.0 Gt/a from 2007 to 2011, and 46.7 ± 7.8 Gt/a from 2011 to 2015. These mass fluctuations are consistent with the iSMB estimations, which were mainly related to the large-scale snowfall events in the region in 2009 and 2011 [50,54].
Compared with the traditional PCA analysis, the CPCA method introduces phase information, and therefore can provide traveling wave information such as wave propagation direction in the result. From the phase distribution of first PC (Figure 2b), we can see that the factors affecting the mass balance in West Antarctica mainly come from the western AP and the coastal areas of the Amundsen Sea, while the factors affecting the mass balance in East Antarctica mainly come from the inland direction. The arrow lengths in these areas are also the longest, suggesting that the mass changes in the corresponding areas are the most dramatic relative to other areas corresponding the first PC. The phase information direction displays the source of the driving force that affects the mass change, such as enhanced ice–ocean interaction, basal melt, and intrusion of warm saline water on retrograde slopes in West Antarctica, suggesting the propagation progress of ice sheet loss from the ocean–ice interface to the southward upslope in this area. Meanwhile, in East Antarctica, it may reflect the progress of precipitation accumulation from inland to coast.
Figure 2d illustrates the spatial mode and phase distribution of the second PC. The phase distribution of the second PC shows that the factors affecting the mass balance are mainly along the latitude line. The phase direction in basins B21–B23 is counterclockwise, while in basin B18 the phase is clockwise. It is somewhat similar to atmospheric circulation at height of 700hPa, which was affected by a disturbance in the Antarctic Peninsula and produced a counterclockwise atmospheric circulation in Basin 21 and Basin 23 region. This data suggests that the impact factors may come from the disturbance of small scale local atmospheric circulation. The phase distribution of the third PC (Figure 2f) shows that the factors affecting the mass balance mainly come from the direction of the Amundsen Sea.
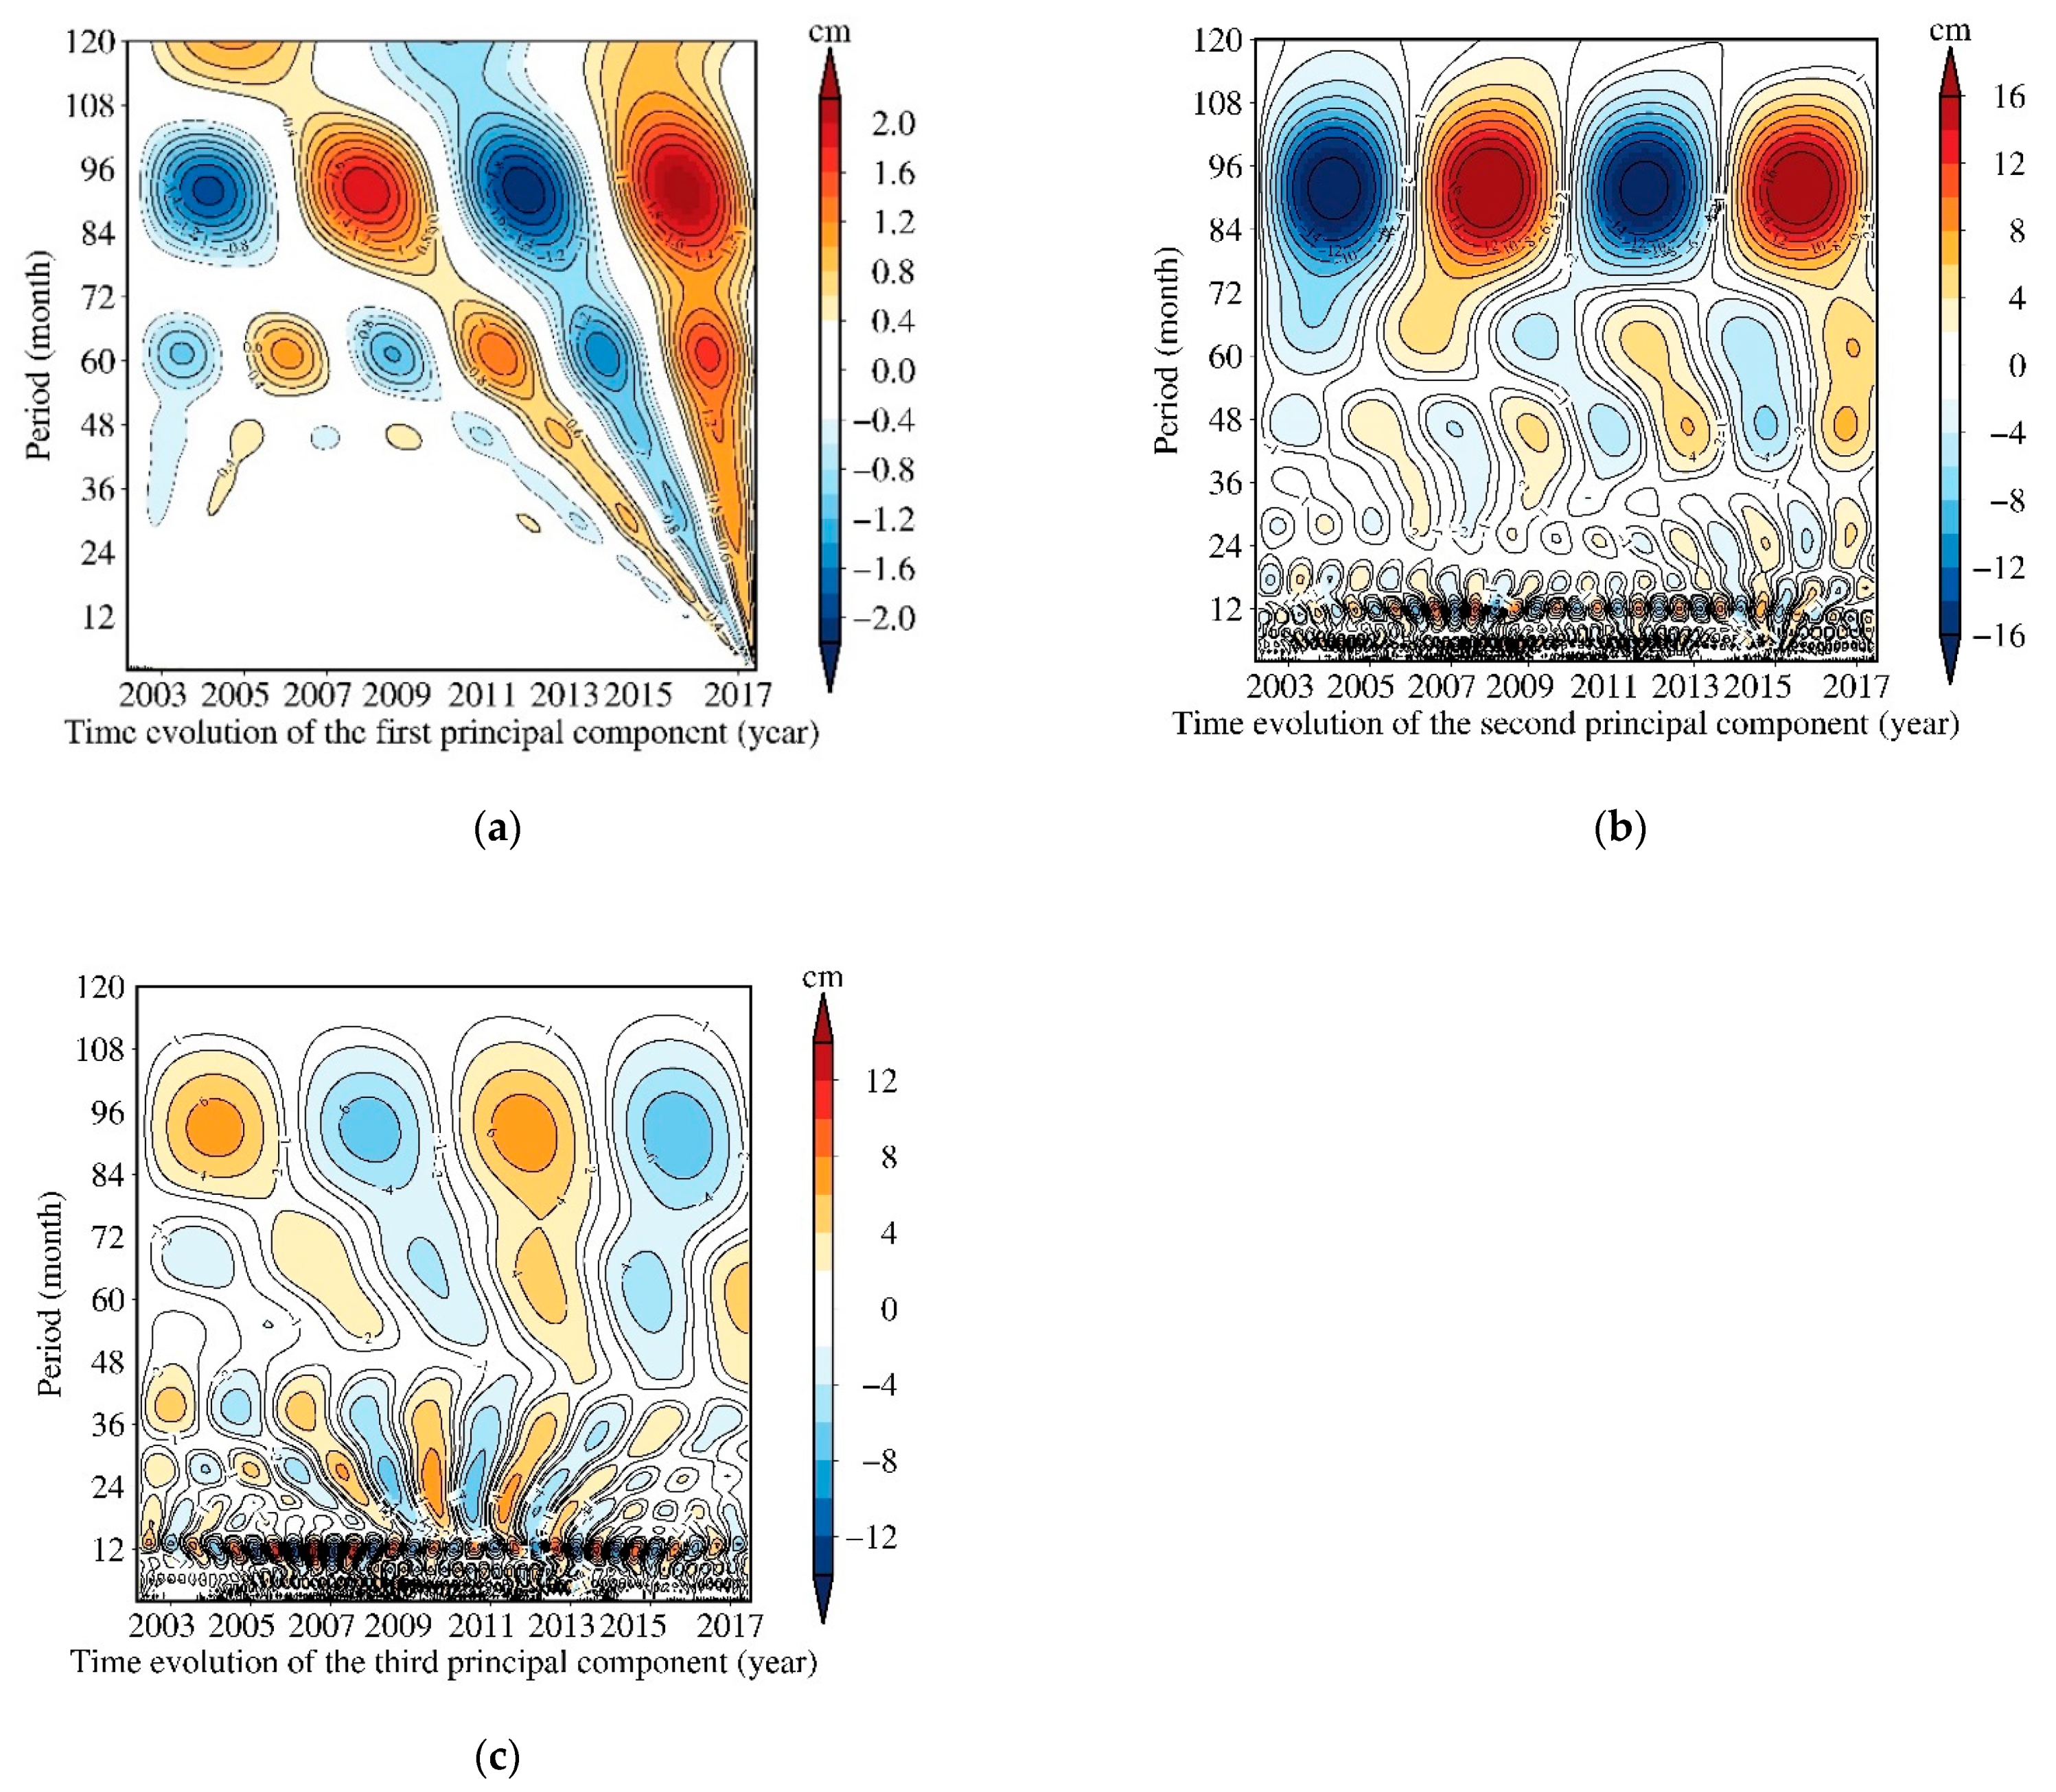
In addition to the 7.5-year periodic signal, the WAPS (Figure 3) shows that the second and third PC also contain the signals with periods < 4 years. The energy of the 7.5-year and 1-year periodic signals are the largest, followed by those of the other periodic signals. Compared with the first PC, the scale factors of the second and third PC are smaller because they affect a smaller area. These results suggest that the second and third PC are related to the anomalies of local small-scale atmospheric and oceanic circulations such the Southern Annular Mode index (Figure 4b,f) and the Amundsen Sea Low (ASL), which affect the ice–ocean interaction, basal melt, intrusion of warm saline water on retrograde slopes, and precipitation accumulation in basins B21 and B22. We also noticed that all of the first three PCs contain the 7.5-year periodic signal, since the CPCA method decomposes the observation matrix according to the maximum variance criterion rather than the period of the signal.
Raphael et al. (2016) [55] studied the ASL, and found that the Amundsen–Bellingshausen Sea (ABS) region exhibits large inter-annual atmospheric circulation variability. This is due, in part, to orographic forcing and in part to its location in the South Pacific, where atmospheric Rossby waves associated with ENSO variability have a year-round influence. The ENSO plays a significant role in determining the depth of the ASL. The most energetic Rossby waves associated with ENSO variability in the Southern Hemisphere occur in spring, and hence the strongest correlations between ENSO variability and the ASL generally occur in this season. In its La Niña phase, in spring, ENSO is associated with a deeper ASL and with warm air advection toward the Antarctic Peninsula and West Antarctica. The ASL is an important circulation feature that influences West Antarctic climate variability. Observations reveal that the ASL has deepened in recent decades with potential impacts on the regional climate through its influence on the meridional wind field. Some studies have suggested that tropical teleconnections have contributed to atmospheric warming in West Antarctica and across the peninsula [6,56], and to sea ice loss in the Bellingshausen Sea [57]. The ASL is probably related to the variability of the Southern Annular Mode (SAM) and ENSO [58,59].
Paolo et al. (2018) [10] noted that studies correlating ENSO tropical forcing with Pacific sector climate indicators, such as the strength of the Amundsen Sea Low, sea-ice extent, and AP temperature, found that correlations with ENSO are significant in some seasons but not in others, with reversals of the sign of the correlation from season to season in some cases. The dominant effect of El Niño on the Amundsen Sea ice shelf mass is the increased basal melting associated with the onshore flow of Circumpolar Deep Water and coastal upwelling as westerly wind stress intensifies.

4.2. The Low-Frequency Signals with 5-Year and Longer Periodicity in the First Principal Component

After obtaining the PCs, their time-frequency characteristics can be analyzed once the linear trend has been removed. Figure 3 shows the time-frequency characteristics of the first three PCs. The WAPS of the first PC evolution shows that the PC contains significant periodic signals of 7.5 years and 5 years (Figure 3a). The energy of the 7.5-year periodic signal is the largest, followed by that of the 5-year periodic signal, which occupies the dominant position in the Antarctica mass change of the periodic signals, i.e., apart from linear factors, the low-frequency signals with 5-year and longer periodicity also contribute to the linear estimation of the ice sheet mass balance. The disadvantage of CPCA and WAPS analysis is that they cannot quantitatively distinguish the contributions of linear factors and periodic factors to linear estimation.
To further determine whether this signal contributed to the linear estimation of mass change, we reanalyzed the mass change using the CPCA method after removing the linear trend from the GRACE data at each point. The low-frequency signals with 5-year and longer periodicity disappeared in the reanalysis results, which indicates that the low-frequency signals with 5-year and longer periodicity do not contribute to the observation field where the trend is zero. This verifies that the low-frequency signals are robust and contributed to the mass change trend in the Antarctic region.
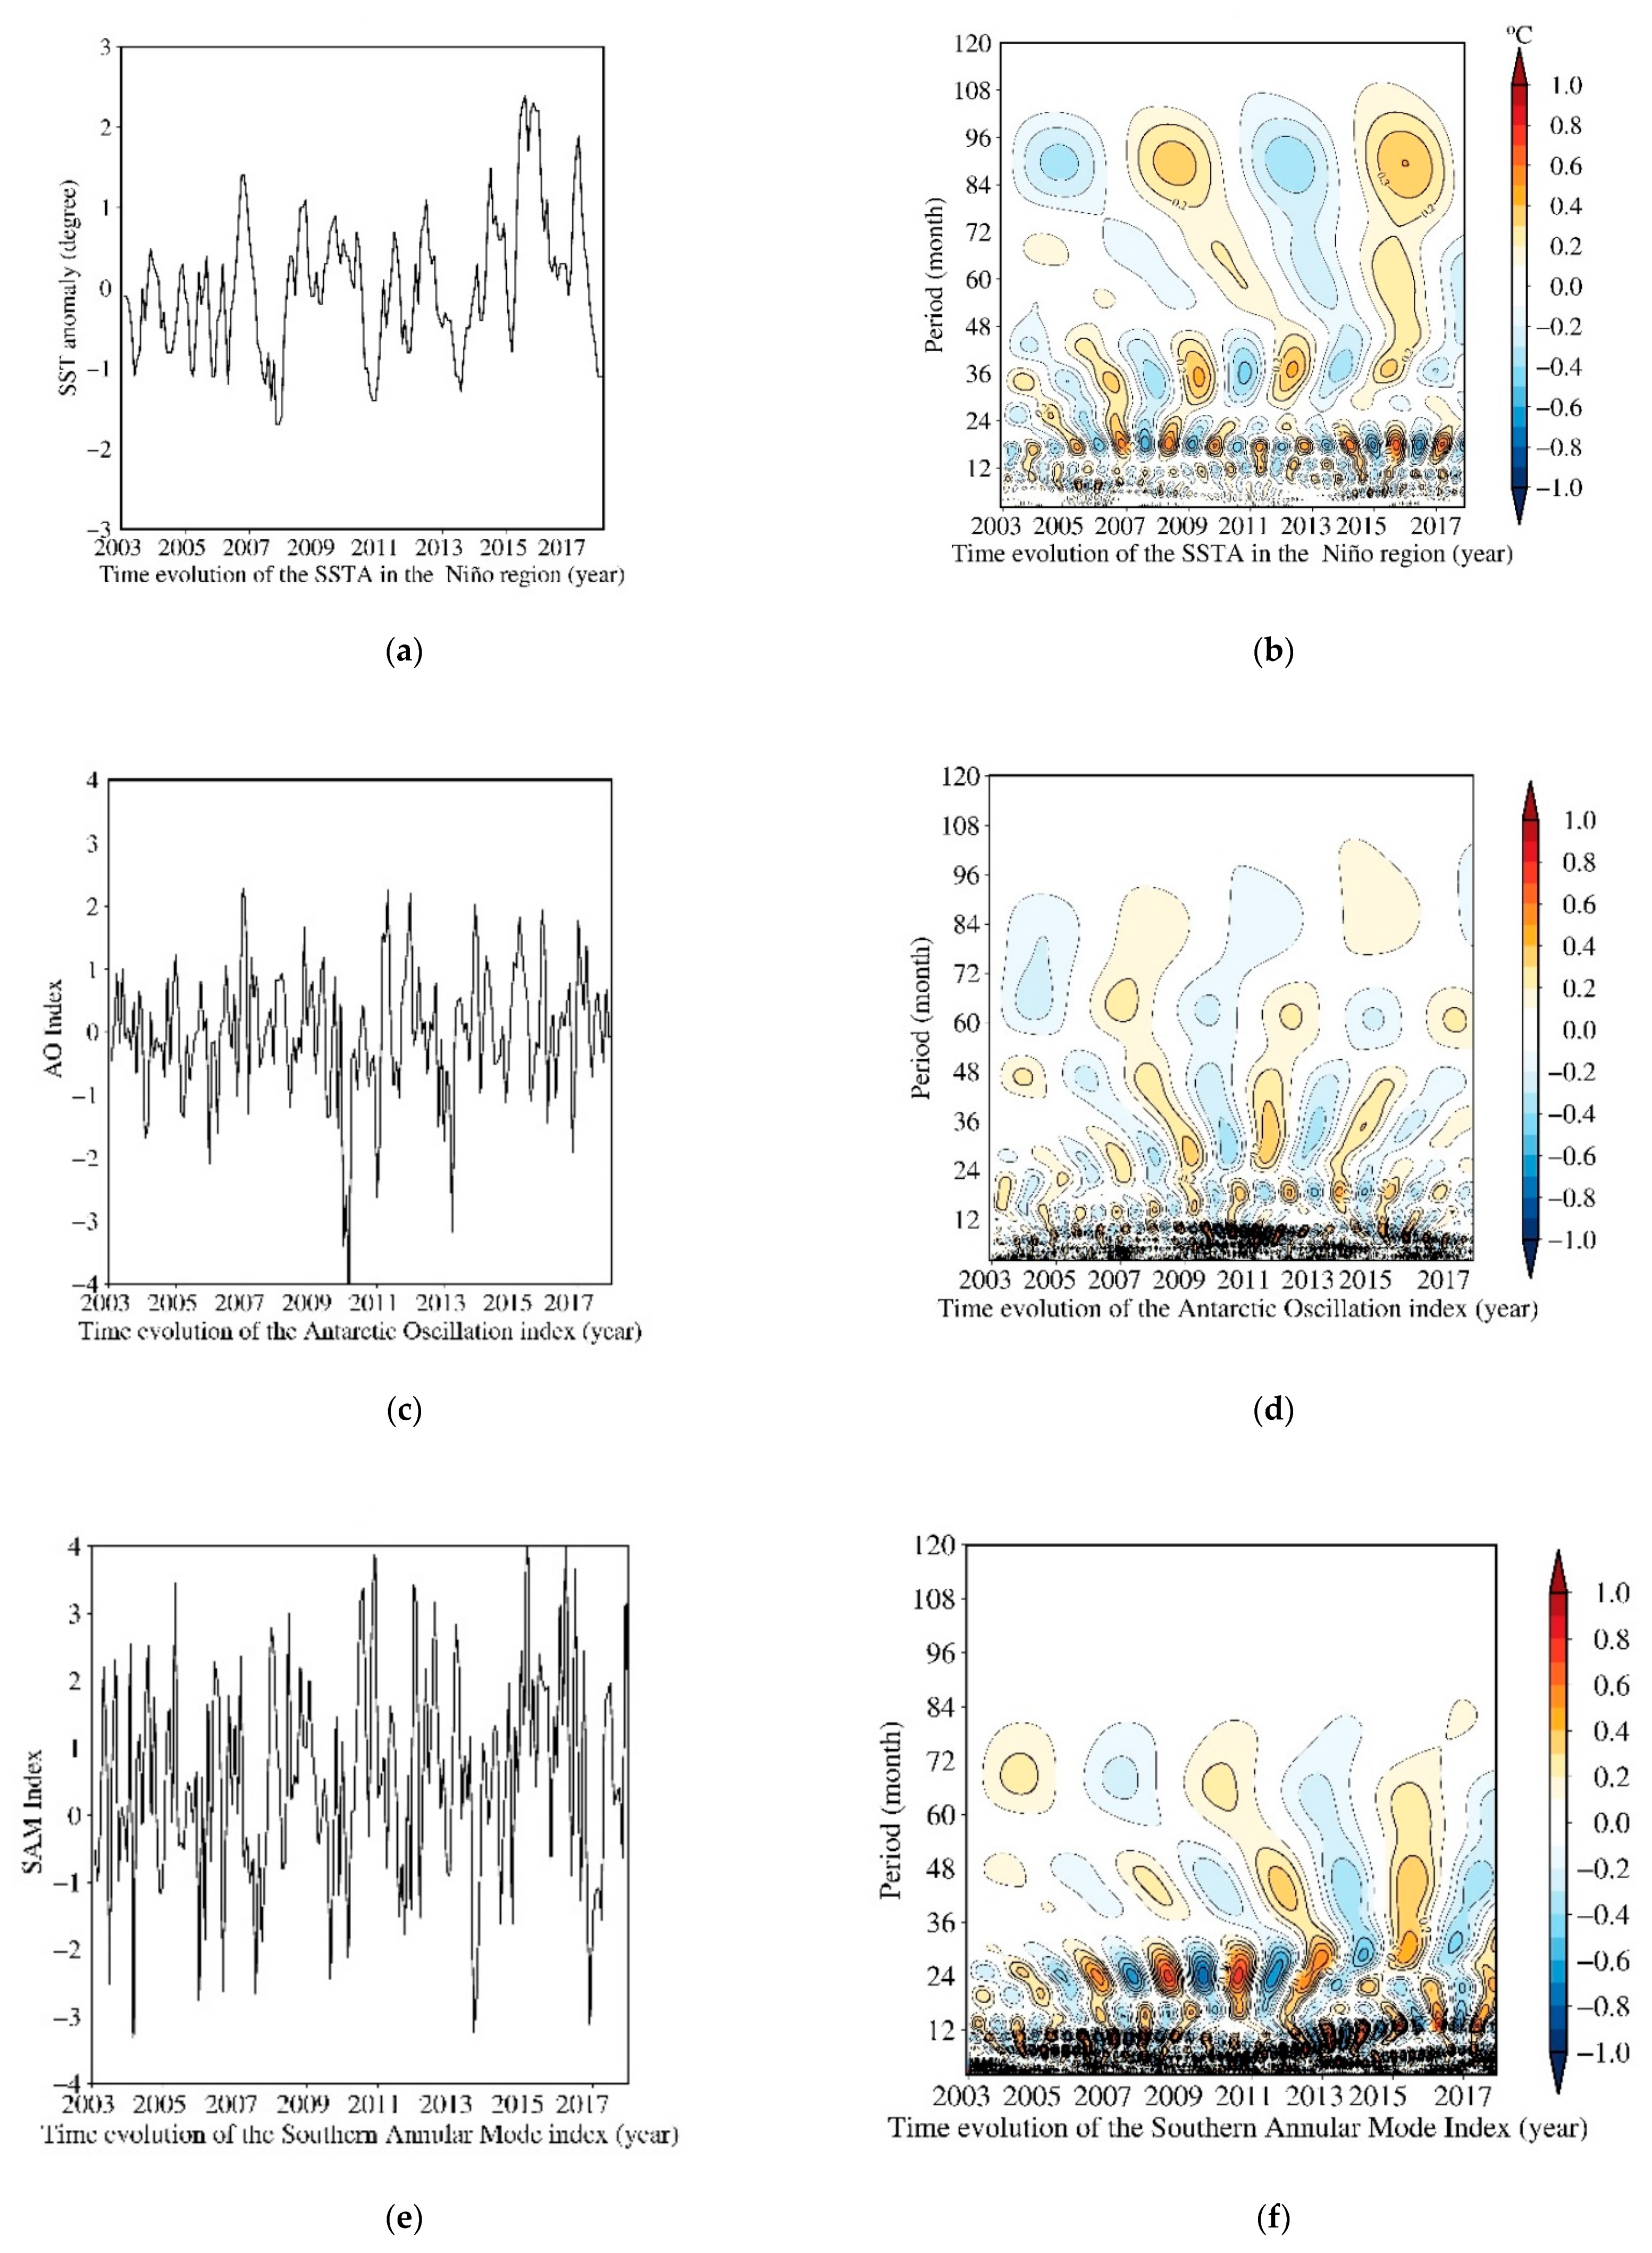
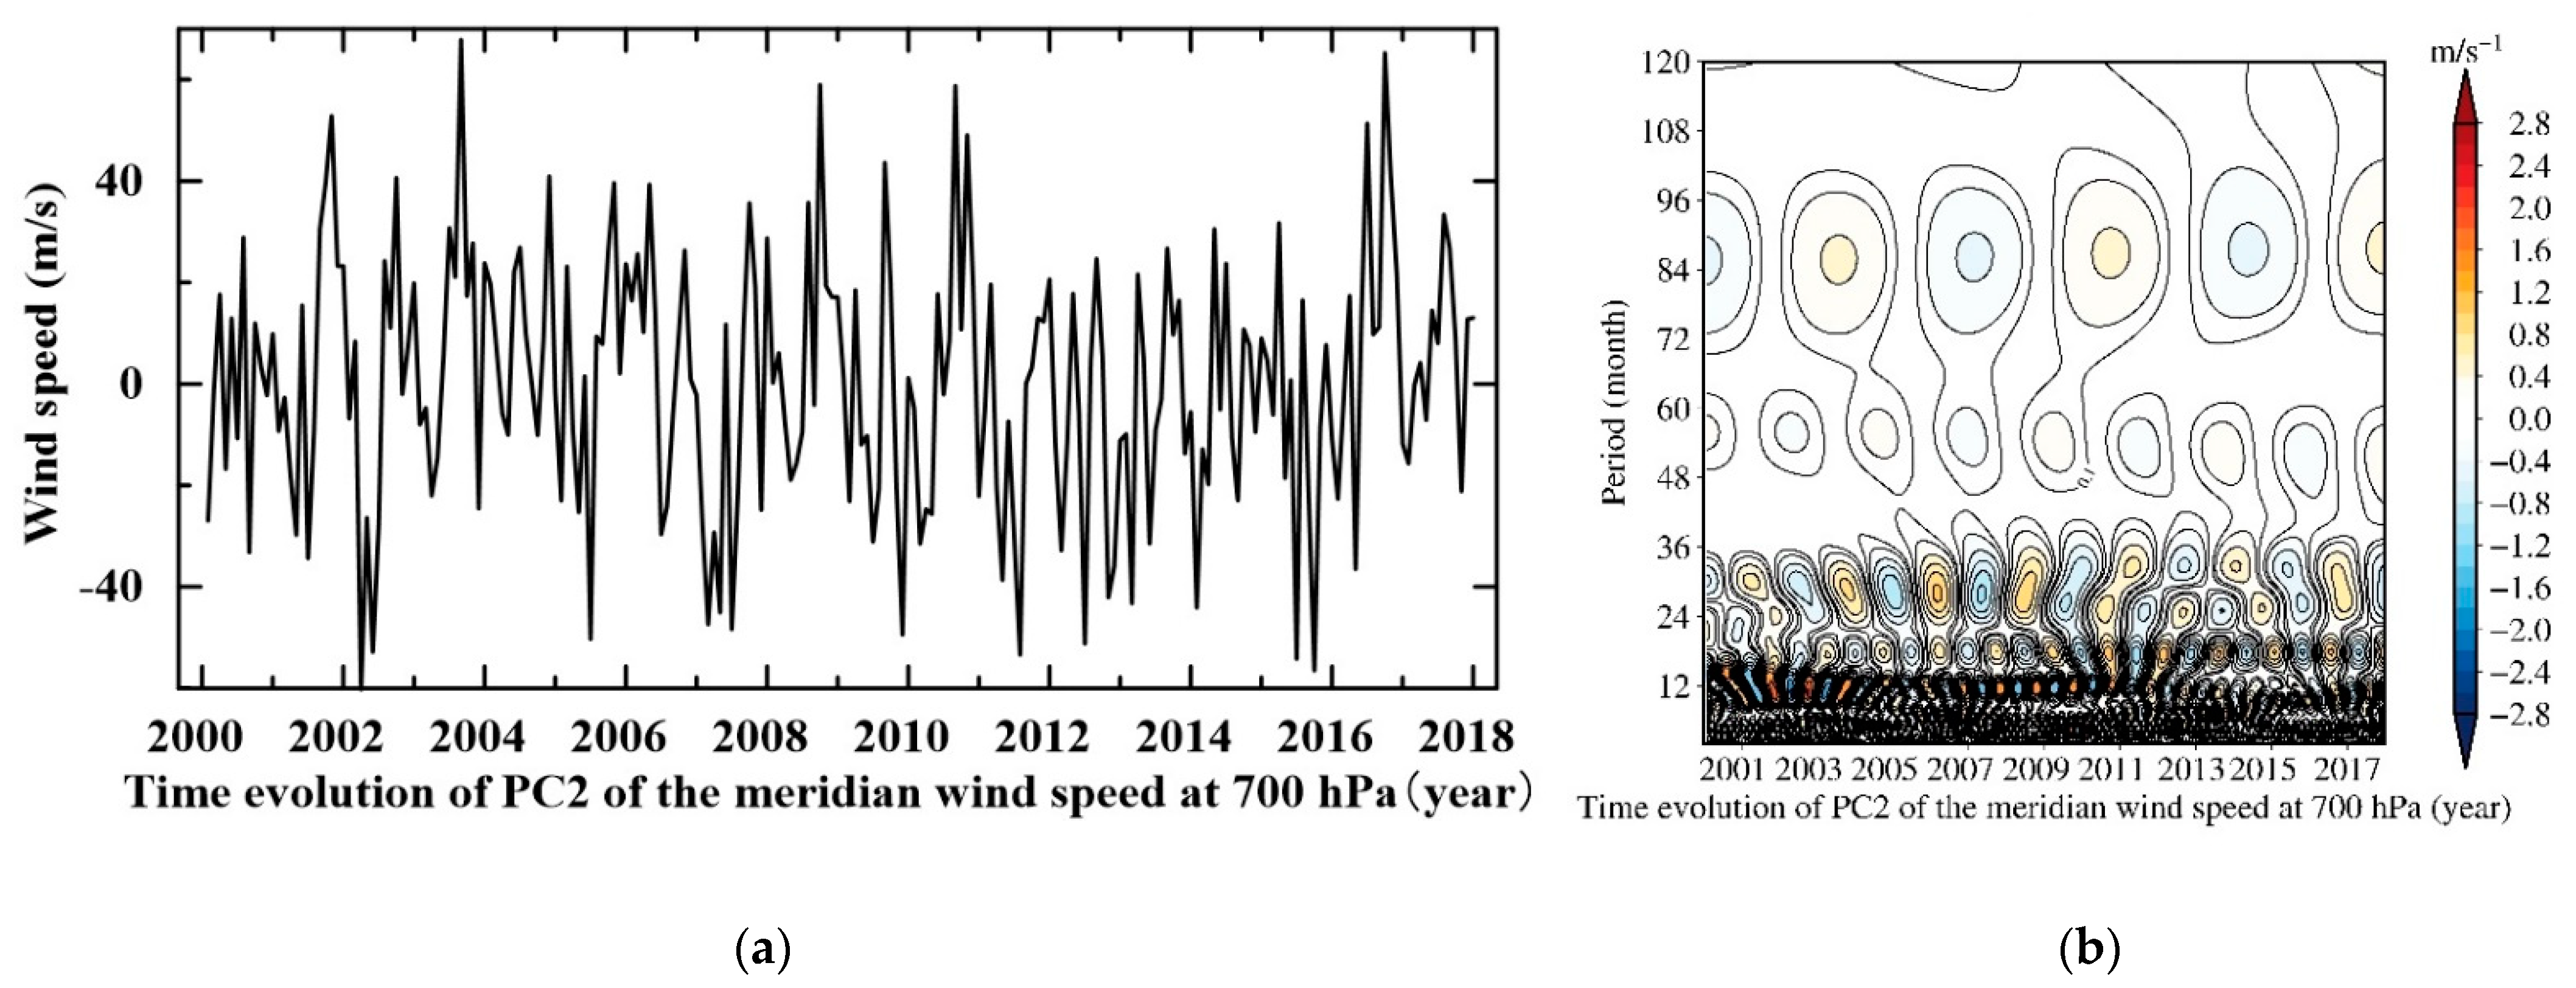
The sea surface temperature anomaly (SSTA) in the equatorial Pacific, the Antarctic Oscillation Index (AO), SAM, ASL Index [60], and the meridian wind speed in the South Pacific region (−80° S to −40° S) at a height of 700 hPa were also analyzed using the WAPS method to study the relationships of this low-frequency signal between different datasets. The results of their WAPS are presented in Figure 4 and Figure 5.
Figure 4b shows the WAPS of the SSTA time evolution in the Niño 1+2 region. It can be seen from the figure that the SSTA in the Niño 1+2 region has signals with periods of 2–3 years in addition to the 7.5-year periodic signals. The energy of the 7.5-year periodic signals is comparable to the energy of the 2–3-year periodic signals. The cross-correlation analysis results show that the coefficient between the first PC and the SSTA in the Niño 1+2 region is 0.24. The correlation between the first PC and the SSTA time series after a 48-month moving average is as high as 0.73, which is much larger than the 95% CI of 0.16 (see Table 2). The ice sheet mass changes lag the SSTA by ~9 months, a finding that is similar to the result of Sasgen et al. (2010) [17]. Local climate models such as the AO and SAM, however, do not include this periodic signal, suggesting that the local climate changes have a smaller correlation with the first component of the ice sheet. Meanwhile, the results of the second PC of meridian wind speed (Figure 5) show that the meridian wind in the South Pacific region has 7.5-year periodic signals. The correlation coefficient of the low-frequency signal between the meridional wind field and SSTA in the equatorial Pacific is 0.77. These results suggest that the changes of the SSTA in the Niño 1+2 region are correlated with the low-frequency signals of the first PC.
Turner (2004) [16] concluded that the El Niño–Southern Oscillation might be transmitting its effects from the tropical Pacific Ocean to the Antarctic for the ENSO signals which are found over the Amundsen–Bellingshausen Sea. Turner et al. (2016) [7] analyzed the air temperature changes across the AP and found that abnormal changes in the sea surface temperature (El Niño events) in the Eastern Pacific can cause changes in the strength of Rossby waves that propagate southwards, as well as strengthening of the polar front jets. These researchers showed that during the cooling period (1999–2014) of the AP, the subtropical front that spreads to the AP is reflected by the enhanced polar front jet (60° S) and cannot affect the interior of the Antarctic based on the 300-hPa zonal wind component.
Clem and Fogt (2013) [9] analyzed the relationship between the ENSO and the SAM Index over time, and found that these climate models have spatial dependence with respect to their influence on the AP. There is a clear correlation between ENSO and climate change in the WAP, and there is a clear correlation between SAM and climate change in the northeastern AP.
Paolo et al. (2018) [10] used satellite altimetry data to analyze the relationship between changes in the elevation of ice sheets in the West Antarctica and the local atmospheric circulation driven by El Niño/Southern Oscillation. During strong El Niño periods, the height of the ice sheet accumulation in the Antarctic Pacific sector exceeds the height of the base melting, although net mass loss occurred because the ice lost from the base has higher density than the fresh snow being gained at the surface. The results of this study reflect the impact of El Niño events on the mass loss of the Antarctic ice sheet. When studying changes in the mass balance of the AP, the above studies noted the effects of El Niño changes on atmospheric circulation and temperature changes in the AP and attempted to determine the effect on the mass changes of the ice sheet in the area. They pointed out that studies correlating ENSO tropical forcing with Pacific sector climate indicators, such as the Amundsen Sea Low strength, sea-ice extent, and AP temperature, found that correlations with ENSO are significant for some seasons but not for others, with reversals of the sign of the correlation from season to season in some cases. The dominant effect of El Niño on the Amundsen Sea ice shelf mass is the increased basal melting associated with the onshore flow of Circumpolar Deep Water and coastal upwelling as westerly wind stress intensifies. On interannual timescales, this basal mass loss anomaly, relative to the longer-term mass loss trend, is partially offset by increased snowfall. This precipitation increase is consistent with the northerly wind anomaly during El Niño events, possibly including increased local moisture uptake from the coastal ocean due to a reduction in regional sea-ice concentration.

5. Conclusions

During the period 2003–2017, the ice sheet in Antarctica exhibited a trend of large mass loss in West Antarctica and mass increase in East Antarctica. The first PC and its corresponding spatial mode from GRACE satellite data successfully captured the spatial pattern of the dominant trend in the mass change of the Antarctic ice sheet. The first PC contains a linear term and low-frequency signals with a period > 5 years, which all contribute to the mass change trends in Antarctica. We also found similar low-frequency signals in the SSTA in the equatorial Pacific Ocean and the second PC of the meridional wind field at 700 hPa over the South Pacific. The correlation results suggest that the low frequency signals with a period > 5 years in the SSTA in the Niño 1+2 region and the first PC of the Antarctic ice sheet mass change have a strong correlation, with the correlation coefficient reaching 0.73, even though the mass changes in Antarctica lag the SSTA in the Niño 1+2 region by ~9 months.
The first PC has large-scale factors in both time and space, because it contains the linear terms and low-frequency periodic signals which dominate the spatial pattern of mass change, and hence, its influence range is wide. In contrast, the scale factors of the second and third PC are smaller because they mainly affect the mass changes around the Pine Island and Thwaites regions, and hence, the second and third PC are related to small-scale local atmospheric circulation changes such as the SAM index, ASL, and westerly winds.
The mass change phase signals of West Antarctica indicate the upstream propagation of mass loss information from the ocean–ice interface to the southward upslope over time, which mainly reflects ocean-driven factors such as enhanced ice–ocean interaction and intrusion of warm saline water on retrograde slopes. Meanwhile, the mass change phase signals of East Antarctica reflect the downstream propagation of mass increase information from the South Pole toward Dronning Maud Land and Enderby Land, which mainly reflects atmospheric factors such as precipitation accumulation.

Author Contributions

Conceptualization, J.Z. and Y.W.; methodology, J.Z.; validation, H.S. and Y.Y.; writing—original draft preparation, J.Z.; writing—review and editing, J.Z.; All authors have read and agreed to the published version of the manuscript.

Funding

This research was funded by National Natural Science Foundation of China (grant 41874093, 41774022, 42074094, 41574073).

Acknowledgments

The authors are grateful to different agencies for providing the various data sets, including to the CSR for GRACE RL06 product.

Conflicts of Interest

The authors declare no conflict of interest.

References

  1. Chapman, W.L.; Walsh, J.E. Simulations of Arctic Temperature and Pressure by Global Coupled Models. J. Clim. 2007, 20, 609–632. [Google Scholar] [CrossRef]
  2. Vaughan, D.G.; Marshall, G.J.; Connolley, W.M.; Parkinson, C.; Mulvaney, R.; Hodgson, D.A.; King, J.C.; Pudsey, C.J.; Turner, J. Recent rapid regional climate warming on the Antarctic Peninsula. Clim. Chang. 2003, 60, 243–274. [Google Scholar] [CrossRef]
  3. Turner, J.; Colwell, S.R.; Marshall, G.J.; Lachlan-Cope, T.A.; Carleton, A.M.; Jones, P.D.; Lagun, V.; Reid, P.A.; Iagovkina, S. Antarctic climate change during the last 50 years. Int. J. Climatol. 2005, 25, 279–294. [Google Scholar] [CrossRef]
  4. Turner, J.; Bindschadler, R.; Convey, P.; Di Prisco, G.; Fahrbach, E.; Gutt, J.; Hodgson, D.; Mayewski, P.; Summerhayes, C. Antarctic Climate Change and the Environment; Scientific Commitee on Antarctic Research: Cambridge, UK, 2009. [Google Scholar]
  5. Steig, E.J.; Schneider, D.P.; Rutherford, S.D.; Mann, M.E.; Comiso, J.C.; Shindell, D.T. Warming of the Antarctic ice-sheet surface since the 1957 International Geophysical Year (vol 457, pg 459, 2009). Nature 2009, 460, 766. [Google Scholar] [CrossRef] [Green Version]
  6. Ding, Q.; Steig, E.J.; Battisti, D.S.; Küttel, M. Winter warming in West Antarctica caused by central tropical Pacific warming. Nat. Geosci. 2011, 4, 398–403. [Google Scholar] [CrossRef] [Green Version]
  7. Turner, J.; Lu, H.; White, I.; King, J.C.; Phillips, T.; Hosking, J.S.; Bracegirdle, T.J.; Marshall, G.J.; Mulvaney, R.; Deb, P. Absence of 21st century warming on Antarctic Peninsula consistent with natural variability. Nature 2016, 535, 411–415. [Google Scholar] [CrossRef] [Green Version]
  8. Oliva, M.; Navarro, F.; Hrbáek, F.; Hernández, A.; Nyvlt, D.; Pereira, P.; Ruiz-Fernández, J.; Trigo, R. Recent regional climate cooling on the Antarctic Peninsula and associated impacts on the cryosphere. Sci. Total Environ. 2017, 580, 210–223. [Google Scholar] [CrossRef]
  9. Clem, K.R.; Fogt, R.L. Varying roles of ENSO and SAM on the Antarctic Peninsula climate in austral spring. J. Geophys. Res. Atmos. 2013, 118, 11481–11492. [Google Scholar] [CrossRef]
  10. Paolo, F.S.; Padman, L.; Fricker, H.A.; Adusumilli, S.; Howard, S.; Siegfried, M.R. Response of Pacific-sector Antarctic ice shelves to the El Nio/Southern Oscillation. Nat. Geosci. 2018, 11, 121–126. [Google Scholar] [CrossRef]
  11. Scambos, T.A.; Bohlander, J.A.; Shuman, C.A.; Skvarca, P. Glacier acceleration and thinning after ice shelf collapse in the Larsen B embayment, Antarctica. Geophys. Res. Lett. 2004, 31, L18402. [Google Scholar] [CrossRef] [Green Version]
  12. Rignot, E.; Casassa, G.; Gogineni, S.; Kanagaratnam, P.; Krabill, W.; Pritchard, H.; Rivera, A.; Thomas, R.; Turner, J.; Vaughan, D. Recent ice loss from the Fleming and other glaciers, Wordie Bay, West Antarctic Peninsula. Geophys. Res. Lett. 2005, 32, 4. [Google Scholar] [CrossRef] [Green Version]
  13. Jacobs, S.S.; Jenkins, A.; Giulivi, C.F.; Dutrieux, P. Stronger ocean circulation and increased melting under Pine Island Glacier ice shelf. Nat. Geosci. 2011, 4, 519–523. [Google Scholar] [CrossRef]
  14. MacAyeal, D.; Scambos, T.; Hulbe, C.; Fahnestock, M. Catastrophic ice-shelf break-up by an ice-shelf-fragment-capsize mechanism. J. Glaciol. 2003, 49, 22–36. [Google Scholar] [CrossRef] [Green Version]
  15. Schmidtko, S.; Heywood, K.J.; Thompson, A.F.; Aoki, S. Multidecadal warming of Antarctic waters. Science 2014, 346, 1227–1231. [Google Scholar] [CrossRef] [Green Version]
  16. Turner, J. The El Niño–southern oscillation and Antarctica. Int. J. Climatol. 2004, 24, 1–31. [Google Scholar] [CrossRef] [Green Version]
  17. Sasgen, I.; Dobslaw, H.; Martinec, Z.; Thomas, M. Satellite gravimetry observation of Antarctic snow accumulation related to ENSO. Earth Planet. Sci. Lett. 2010, 299, 352–358. [Google Scholar] [CrossRef]
  18. Mémin, A.; Flament, T.; Alizier, B.; Watson, C.; Rémy, F. Interannual variation of the Antarctic Ice Sheet from a combined analysis of satellite gravimetry and altimetry data. Earth Planet. Sci. Lett. 2015, 422, 150–156. [Google Scholar] [CrossRef]
  19. Wahr, J.; Molenaar, M.; Bryan, F. Time variability of the Earth’s gravity field: Hydrological and oceanic effects and their possible detection using GRACE. J. Geophys. Res. Solid Earth 1998, 103, 30205–30229. [Google Scholar] [CrossRef]
  20. Xiang, L.W.; Wang, H.S.; Steffen, H.; Wu, P.; Jia, L.L.; Jiang, L.M.; Shen, Q. Groundwater storage changes in the Tibetan Plateau and adjacent areas revealed from GRACE satellite gravity data. Earth Planet. Sci. Lett. 2016, 449, 228–239. [Google Scholar] [CrossRef] [Green Version]
  21. Chen, J.L.; Wilson, C.R.; Blankenship, D.; Tapley, B.D. Accelerated Antarctic ice loss from satellite gravity measurements. Nat. Geosci. 2009, 2, 859–862. [Google Scholar] [CrossRef]
  22. Gardner, A.S.; Moholdt, G.; Cogley, J.G.; Wouters, B.; Arendt, A.A.; Wahr, J.; Berthier, E.; Hock, R.; Pfeffer, T.; Kaser, G.; et al. A Reconciled Estimate of Glacier Contributions to Sea Level Rise: 2003 to 2009. Science 2013, 340, 852–857. [Google Scholar] [CrossRef] [Green Version]
  23. Chen, J.L.; Wilson, C.R.; Tapley, B.D. Interannual variability of Greenland ice losses from satellite gravimetry. J. Geophys. Res. Solid Earth 2011, 116. [Google Scholar] [CrossRef] [Green Version]
  24. Zwally, H.J.; Mario, B.; Matthew, G.; Beckley, A.; Saba, J.L. Antarctic and Greenland Drainage Systems. Available online: http://icesat4.gsfc.nasa.gov/cryo_data/ant_grn_drainage_systems.php (accessed on 5 September 2020).
  25. Bettadpur, S.; Kang, Z.; Peter, N.; Rick, P.; Steve, P.; John, R.; Save, H. Status and Assessments of CSR GRACE Level-2 Data Products. In Proceedings of the EGU General Assembly Conference, Vienna, Austria, 12–17 April 2015; p. 4142. [Google Scholar]
  26. Save, H.; Bettadpur, S.; Tapley, B.D. High-resolution CSR GRACE RL05 mascons. J. Geophys. Res. Solid Earth 2016, 121, 22. [Google Scholar] [CrossRef]
  27. Velicogna, I. Increasing rates of ice mass loss from the Greenland and Antarctic ice sheets revealed by GRACE. Geophys. Res. Lett. 2009, 36, L19503. [Google Scholar] [CrossRef] [Green Version]
  28. Rignot, E.; Velicogna, I.; Broeke, M.R.V.D.; Monaghan, A.; Lenaerts, J.T.M. Acceleration of the contribution of the Greenland and Antarctic ice sheets to sea level rise. Geophys. Res. Lett. 2011, 38. [Google Scholar] [CrossRef] [Green Version]
  29. Chen, J.L.; Wilson, C.R.; Tapley, B.D.; Grand, S. GRACE detects coseismic and postseismic deformation from the Sumatra-Andaman earthquake. Geophys. Res. Lett. 2007, 34. [Google Scholar] [CrossRef] [Green Version]
  30. Chen, J.L.; Wilson, C.R.; Tapley, B.D.; Blankenship, D.; Young, D. Antarctic regional ice loss rates from GRACE. Earth Planet. Sci. Lett. 2008, 266, 140–148. [Google Scholar] [CrossRef]
  31. Tarvainen, M.P.; Ranta-aho, P.O.; Karjalainen, P.A. An advanced detrending method with application to HRV analysis. IEEE Trans. Biomed. Eng. 2002, 49, 172–175. [Google Scholar] [CrossRef] [PubMed]
  32. Ramillien, G.; Lombard, A.; Cazenave, A.; Ivins, E.R.; Llubes, M.; Remy, F.; Biancale, R. Interannual variations of the mass balance of the Antarctica and Greenland ice sheets from GRACE. Glob. Planet. Chang. 2006, 53, 198–208. [Google Scholar] [CrossRef]
  33. Zhan, J.G.; Wang, Y.; Shi, H.L.; Chai, H.; Zhu, C.D. Removing correlative errors in GRACE data by the smoothness priors method. Chin. J. Geophys. Chin. Ed. 2015, 58, 1135–1144. [Google Scholar] [CrossRef]
  34. Whitehouse, P.L.; Bentley, M.J.; Milne, G.A.; King, M.A.; Thomas, I.D. A new glacial isostatic adjustment model for Antarctica: Calibrated and tested using observations of relative sea-level change and present-day uplift rates. Geophys. J. Int. 2012, 190, 1464–1482. [Google Scholar] [CrossRef] [Green Version]
  35. Ivins, E.R.; James, T.S.; Wahr, J.; Schrama, E.J.O.; Landerer, F.W.; Simon, K.M. Antarctic contribution to sea level rise observed by GRACE with improved GIA correction. J. Geophys. Res. Solid Earth 2013, 118, 3126–3141. [Google Scholar] [CrossRef] [Green Version]
  36. Peltier, W.R.; Argus, D.F.; Drummond, R. Space geodesy constrains ice age terminal deglaciation: The global ICE-6G_C (VM5a) model. J. Geophys. Res. Solid Earth 2015, 120, 450–487. [Google Scholar] [CrossRef] [Green Version]
  37. Caron, L.; Ivins, E.R.; Larour, E.; Adhikari, S.; Nilsson, J.; Blewitt, G. GIA Model Statistics for GRACE Hydrology, Cryosphere, and Ocean Science. Geophys. Res. Lett. 2018, 45, 2203–2212. [Google Scholar] [CrossRef]
  38. Swenson, S.; Chambers, D.; Wahr, J. Estimating geocenter variations from a combination of GRACE and ocean model output. J. Geophys. Res. Solid Earth 2008, 113, 12. [Google Scholar] [CrossRef] [Green Version]
  39. Horel, J.D. Complex Principal Component Analysis: Theory and Examples. J. Appl. Meteorol. 1984, 23, 1660–1673. [Google Scholar] [CrossRef]
  40. Harlander, U.; Larcher, T.; Wright, G.B.; Hoff, M.; Alexandrov, K.; Egbers, C. Orthogonal Decomposition Methods to Analyze PIV, LDV, and Thermography Data of Thermally Driven Rotating Annulus Laboratory Experiments. In Modeling Atmospheric and Oceanic Flows; John Wiley & Sons, Inc.: Hoboken, NJ, USA, 2014; pp. 315–336. [Google Scholar] [CrossRef] [Green Version]
  41. Von Larcher, T.; Viazzo, S.; Harlander, U.; Vincze, M.; Randriamampianina, A. Instabilities and small-scale waves within the Stewartson layers of a thermally driven rotating annulus. J. Fluid Mech. 2018, 841, 380–407. [Google Scholar] [CrossRef] [Green Version]
  42. Walcker, R.; Anthony, E.J.; Cassou, C.; Aller, R.C.; Gardel, A.; Proisy, C.; Martinez, J.M.; Fromard, F. Fluctuations in the extent of mangroves driven by multi-decadal changes in North Atlantic waves. J. Biogeogr. 2015, 42, 2209–2219. [Google Scholar] [CrossRef]
  43. Hoff, M.; Harlander, U.; Egbers, C. Experimental survey of linear and nonlinear inertial waves and wave instabilities in a spherical shell. J. Fluid Mech. 2016, 789, 589–616. [Google Scholar] [CrossRef]
  44. Liu, L. Basic Wavelet Theory and Its Applications in Geosciences. Ph.D. Thesis, Institute of Geodesy and Geophysics, CAS, Wuhan, China, 1999. [Google Scholar]
  45. Zhan, J.G.; Wang, Y.; Liu, L.T. Time-frequency analysis of the inter-seasonal variations of China-neighboring seas level. Chin. J. Geophys. Chin. Ed. 2003, 46, 36–41. [Google Scholar] [CrossRef]
  46. Zhan, J.G.; Shi, H.L.; Wang, Y.; Yao, Y.X. Complex principal component analysis of mass balance changes on the Qinghai-Tibetan Plateau. Cryosphere 2017, 11, 1487–1499. [Google Scholar] [CrossRef] [Green Version]
  47. Liu, L.; Hsu, H. Inversion and normalization of time-frequency transform. In Proceedings of the 2011 International Conference on Multimedia Technology, Hangzhou, China, 26–28 July 2011; pp. 2164–2168. [Google Scholar]
  48. Shepherd, A.; Ivins, E.; Rignot, E.; Smith, B.; van den Broeke, M.; Velicogna, I.; Whitehouse, P.; Briggs, K.; Joughin, I.; Krinner, G.; et al. Mass balance of the Antarctic Ice Sheet from 1992 to 2017. Nature 2018, 558, 219–222. [Google Scholar] [CrossRef] [Green Version]
  49. Nagler, T.; Floricioiu, D.; Groh, A.; Horwath, M.; Kusk, A.; Muir, A.; Wuite, J. Algorithm Theoretical Basis Document (ATBD) for the Antarctic_Ice_Sheet_cci project of ESA’s Climate Change Initiative, Version 2.1. 2017. Available online: https://data1.geo.tu-dresden.de/ais_gmb/source/ST-UL-ESA-AISCCI-ATBD-Draft_GMB.pdf (accessed on 29 January 2021).
  50. Gao, C.; Lu, Y.; Shi, H.; Zhang, Z.; Xu, C.; Tan, B. Detection and analysis of ice sheet mass changes over 27 Antarctic drainage systems from GRACE RL06 data. Chin. J. Geophys. 2019, 62, 864–882. (In Chinese) [Google Scholar] [CrossRef]
  51. Wouters, B.; Martin-Espanol, A.; Helm, V.; Flament, T.; van Wessem, J.M.; Ligtenberg, S.R.M.; van den Broeke, M.R.; Bamber, J.L. Dynamic thinning of glaciers on the Southern Antarctic Peninsula. Science 2015, 348, 899–903. [Google Scholar] [CrossRef]
  52. Mouginot, J.; Rignot, E.; Scheuchl, B. Sustained increase in ice discharge from the Amundsen Sea Embayment, West Antarctica, from 1973 to 2013. Geophys. Res. Lett. 2014, 41, 1576–1584. [Google Scholar] [CrossRef] [Green Version]
  53. Dutrieux, P.; De Rydt, J.; Jenkins, A.; Holland, P.R.; Ha, H.K.; Lee, S.H.; Steig, E.J.; Ding, Q.; Abrahamsen, E.P.; Schröder, M. Strong Sensitivity of Pine Island Ice-Shelf Melting to Climatic Variability. Science 2014, 343, 174–178. [Google Scholar] [CrossRef] [Green Version]
  54. Boening, C.; Lebsock, M.; Landerer, F.; Stephens, G. Snowfall-driven mass change on the East Antarctic ice sheet. Geophys. Res. Lett. 2012, 39. [Google Scholar] [CrossRef]
  55. Raphael, M.N.; Marshall, G.J.; Turner, J.; Fogt, R.L.; Schneider, D.; Dixon, D.A.; Hosking, J.S.; Jones, J.M.; Hobbs, W.R. The Amundsen Sea Low: Variability, Change and Impact on Antarctic Climate. Bull. Am. Meteorol. Soc. 2016, 97, 197–210. [Google Scholar] [CrossRef]
  56. Schneider, D.P.; Deser, C.; Okumura, Y. An assessment and interpretation of the observed warming of West Antarctica in the austral spring. Clim. Dyn. 2012, 38, 323–347. [Google Scholar] [CrossRef]
  57. Li, X.; Holland, D.M.; Gerber, E.P.; Yoo, C. Impacts of the north and tropical Atlantic Ocean on the Antarctic Peninsula and sea ice. Nature 2014, 505, 538–542. [Google Scholar] [CrossRef]
  58. Fogt, R.L.; Bromwich, D.H.; Hines, K.M. Understanding the SAM influence on the South Pacific ENSO teleconnection. Clim. Dyn. 2011, 36, 1555–1576. [Google Scholar] [CrossRef] [Green Version]
  59. Lachlan-Cope, T.; Connolley, W. Teleconnections between the tropical Pacific and the Amundsen-Bellinghausens Sea: Role of the El Niño/Southern Oscillation. J. Geophys. Res. Atmos. 2006, 111. [Google Scholar] [CrossRef] [Green Version]
  60. Hosking, J.S.; Orr, A.; Bracegirdle, T.J.; Turner, J. Future circulation changes off West Antarctica: Sensitivity of the Amundsen Sea Low to projected anthropogenic forcing. Geophys. Res. Lett. 2016, 43, 367–376. [Google Scholar] [CrossRef] [Green Version]
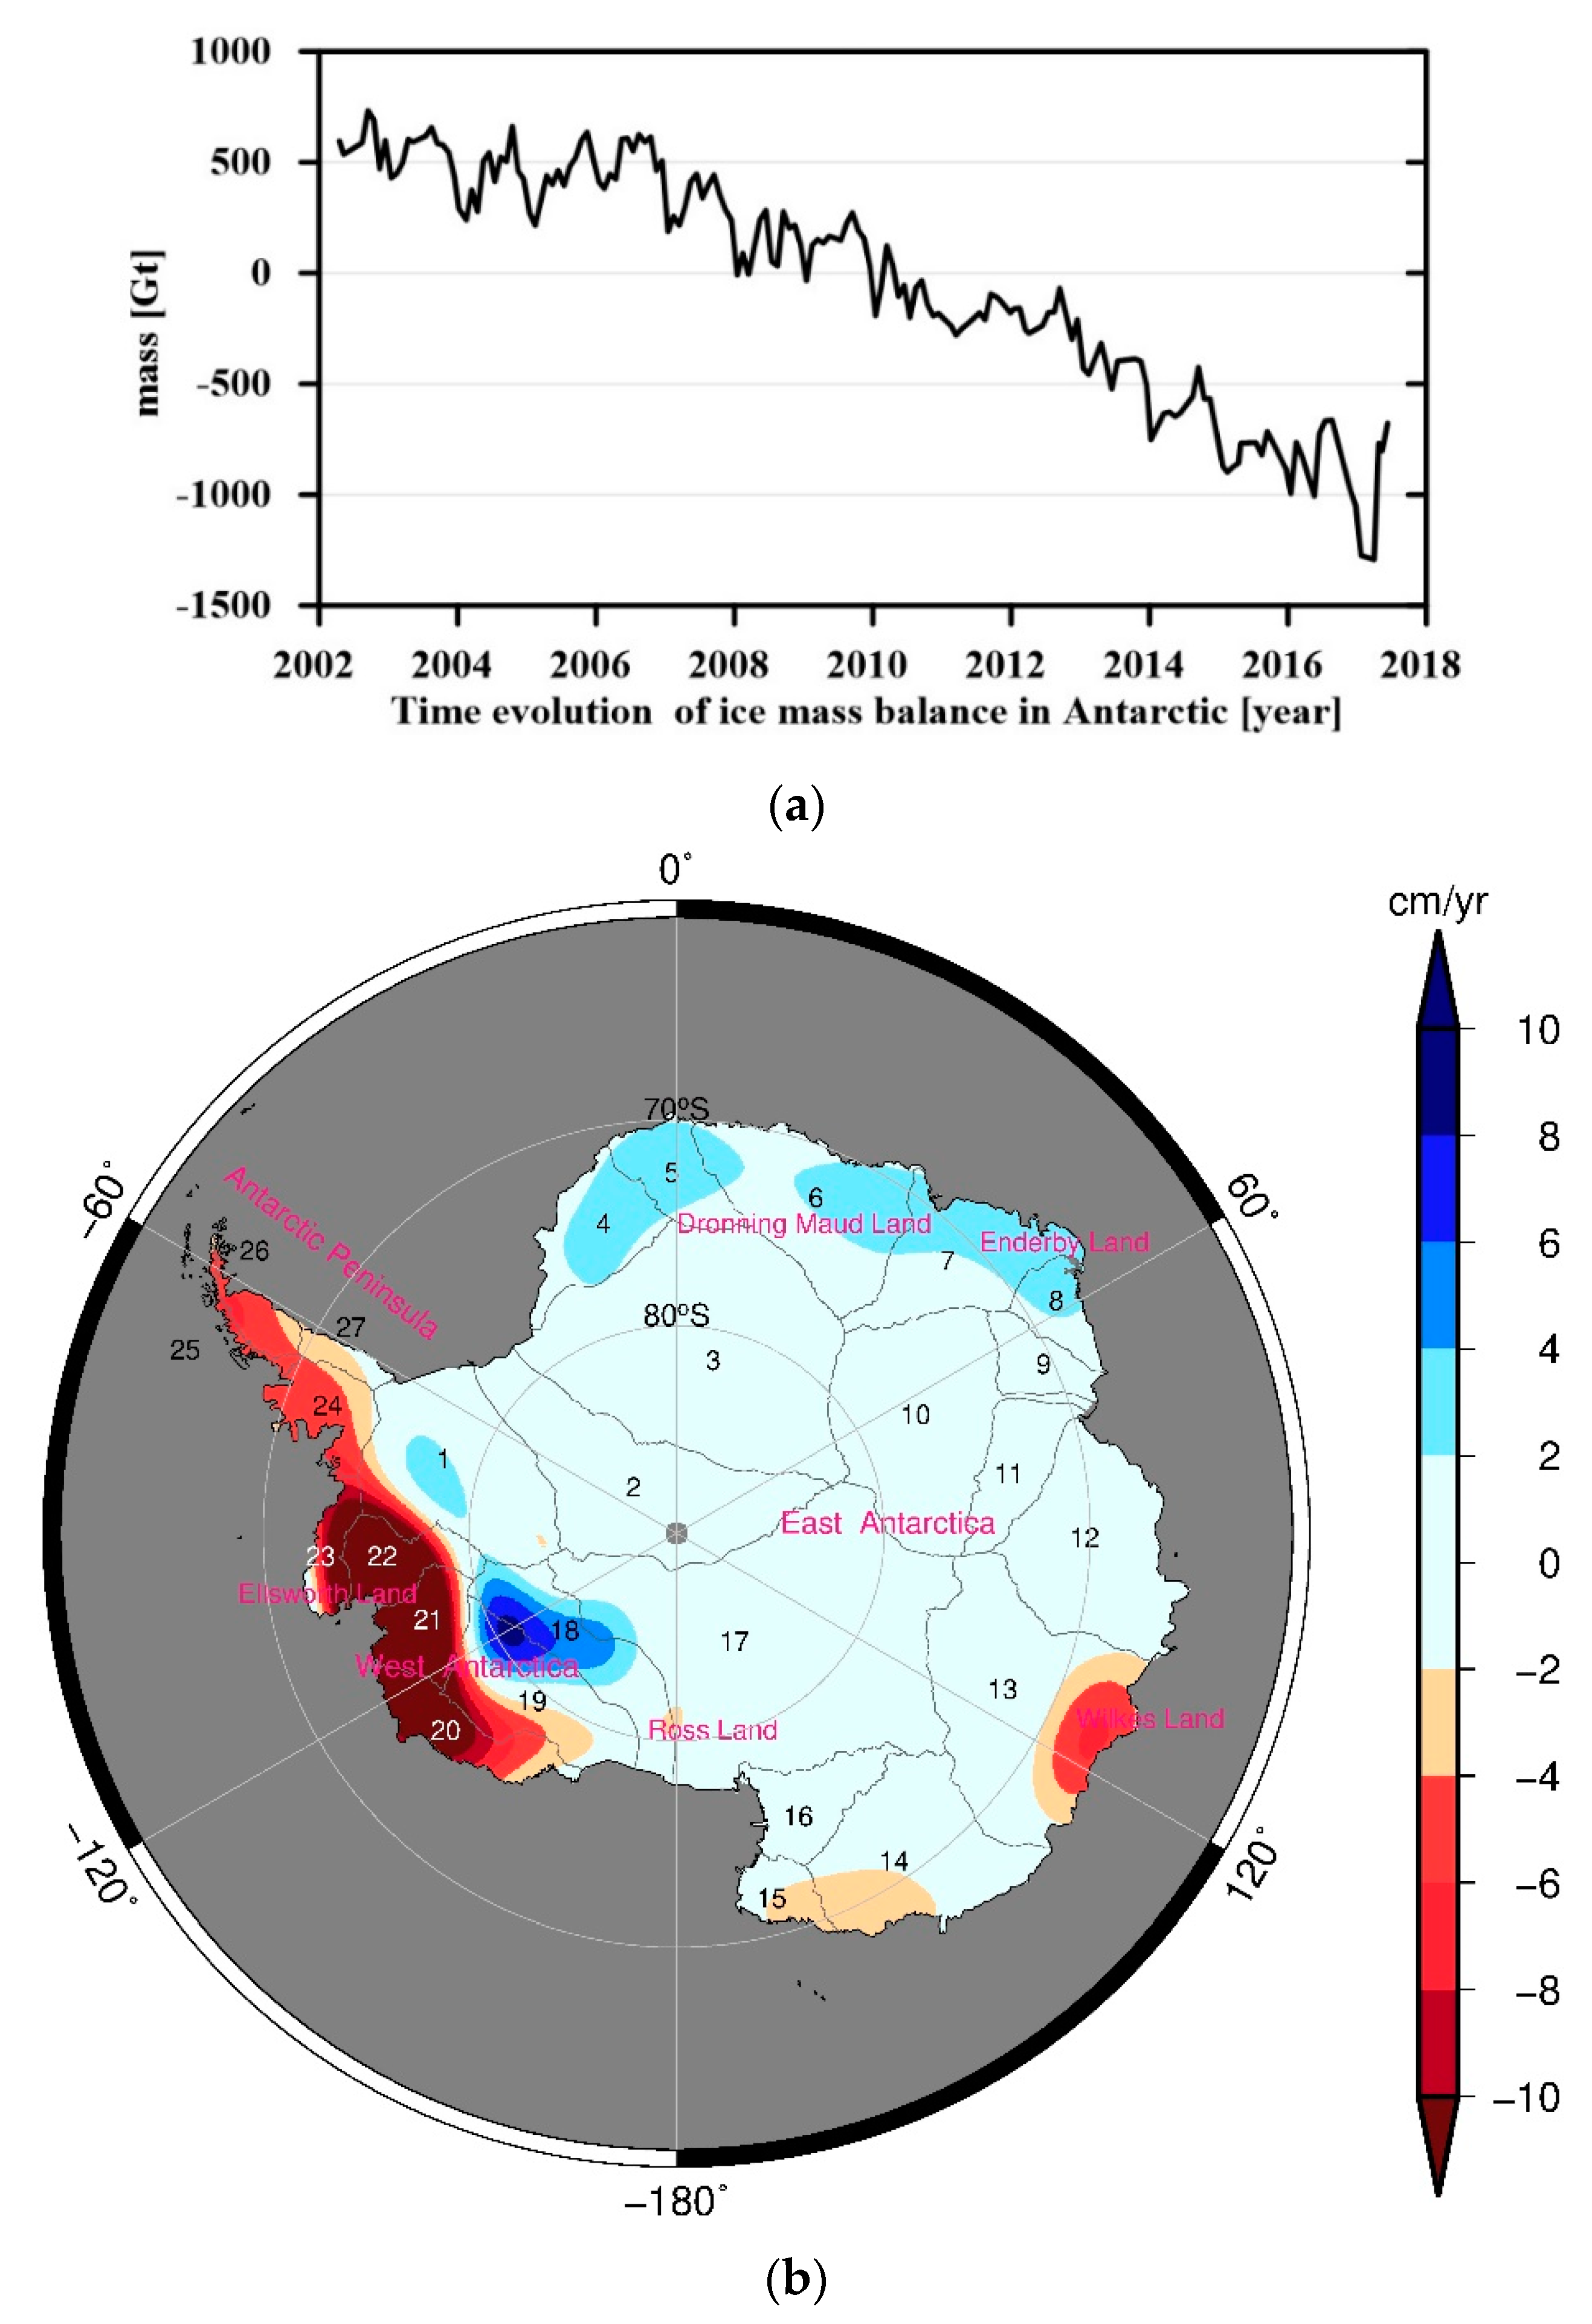
Figure 1. Time evolution (a) and trend (b) of ice sheet mass balance in Antarctica after eliminating the glacial isostatic adjustment (GIA) effect. Basins 1–27 are the Antarctic drainage divides defined by Zwally [24]. Basins 2, 17, and 18 are complimented with differences in 1997 and 2009 Synthetic Aperture Radar velocities poleward of 82.5° S. The definitions of the West Antarctic ice sheet (Basins 1 and 18–23), the East Antarctic ice sheet (Basins 2–17), and the Antarctic Peninsula (Basins 24–27) allocate the drainage systems according to ice provenance with separation of East and West Antarctica approximately along the Trans-Antarctic Mountains.
Remotesensing 13 00480 g001
Figure 2. CPCA results of ice sheet mass change in Antarctica. The first principal component (a) and its corresponding spatial mode and phase distribution (arrows) (b), the second principal component (c) and its corresponding spatial mode and phase distribution (arrows) (d), as well as the third principal component (e) and its corresponding spatial mode and phase distribution (arrows) (f).
Remotesensing 13 00480 g002aRemotesensing 13 00480 g002bRemotesensing 13 00480 g002cRemotesensing 13 00480 g002d
Figure 3. The wavelet amplitude-period spectrum of the first principal component (a), the second principal component (b), and the third principal component (c) during the period 2003–2016.
Remotesensing 13 00480 g003
Figure 4. Time evolution and its wavelet amplitude-period spectrum of the sea surface temperature anomaly in the Niño 1+2 region (a,b), Antarctic Oscillation index (c,d), Southern Annular Mode Index (e,f), and the air temperature changes over Antarctica (g,h) during the period 2003–2016.
Remotesensing 13 00480 g004aRemotesensing 13 00480 g004b
Figure 5. Time evolution of the second principal component of meridian wind speed at 700 hPa (a) and its wavelet amplitude-period spectrum (b).
Remotesensing 13 00480 g005
Table 1. Eigenvalues and contribution percentages to mass change in complex principal component analysis (CPCA) analysis of Antarctica.
NumberEigenvaluesAs PercentagesCumul. Percentages
19703.6183.7383.73
2297.322.5786.29
3216.331.8788.16
Table 2. Correlation analysis between different factors and principal components.
Time Lag (month)First Principal ComponentLow Frequency Signal of Meridional Wind95% Confidence Level
El Niño−90.24-0.17
Low Frequency Signal of El Niño10.730.770.16
Publisher’s Note: MDPI stays neutral with regard to jurisdictional claims in published maps and institutional affiliations.