
Identification and Portrait of Urban Functional Zones Based on Multisource Heterogeneous Data and Ensemble Learning


1
Aerospace Information Research Institute, Chinese Academy of Sciences, Beijing 100101, China
2
University of Chinese Academy of Sciences, Beijing 100049, China
3
School of Science, Chang’an University, Xi’an 710064, China
*
Author to whom correspondence should be addressed.
Remote Sens. 2021, 13(3), 373; https://doi.org/10.3390/rs13030373
Submission received: 13 December 2020
/
Revised: 14 January 2021
/
Accepted: 20 January 2021
/
Published: 21 January 2021
(This article belongs to the Special Issue Optical Remote Sensing Applications in Urban Areas)
Abstract
:Urban functional zones are important space carriers for urban economic and social function. The accurate and rapid identification of urban functional zones is of great significance to urban planning and resource allocation. However, the factors considered in the existing functional zone identification methods are not comprehensive enough, and the recognition of functional zones stops at their categories. This paper proposes a framework that combines multisource heterogeneous data to identify the categories of functional zones and draw the portraits of functional zones. The framework comprehensively describes the features of functional zones from four aspects: building-level metrics, landscape metrics, semantic metrics, and human activity metrics, and uses a combination of ensemble learning and active learning to balance the identification accuracy of functional zones and the labeling cost during large-scale generalization. Furthermore, sentiment analysis, word cloud analysis, and land cover proportion maps are added to the portraits of typical functional zones to make the image of functional zones vivid. The experiment carried out within the Fifth Ring Road, Haidian District, Beijing, shows that the overall accuracy of the method reached 82.37% and the portraits of the four typical functional zones are clear. The method in this paper has good repeatability and generalization, which is helpful to carry out quantitative and objective research on urban functional zones.
1. Introduction
According to people’s different social and economic activities, cities are divided into different functional zones, which are the basic units of urban planning, management, and resource allocation [1,2,3,4,5,6]. The accurate mapping of functional zones is of great significance for the quantitative analysis of urban traffic, the balance of workplaces and residences, and residents’ relocation [7], which are also helpful to economic and demographic research [8,9]. In traditional urban planning, urban functional zones are first planned and then constructed, and the distribution of functional zones must follow rules. However, it is difficult to replan and construct built-up areas in many large and medium-sized cities. At the same time, the division of urban functional zones formulated by the government usually takes administrative divisions as the unit, which only indicates the functional distribution on a macro level. In this case, the accurate division of fine-scale urban functional zones in existing built-up areas is of great significance to the understanding and management of cities.
In previous studies that have examined the research unit of fine-scale functional zones, the partitioning of functional zones involves the problem of modifiable area units [10], so it is necessary to determine the division scale of functional zones before describing their categories. In the literature [11], the methods for dividing functional zone units are summarized into three types: grid-based methods, block-based methods, and cadastral data-based methods. Grid-based methods usually create fishnets that cover the study area according to a certain space interval and then determine their functional attributes [12,13]. This segmentation method is simple and easy to operate, but the boundary obtained is not accurate. A grid may contain multiple functional zones, or a functional zone may be segmented by multiple grids. Block-based methods divide functional zones by road networks and then analyze the functional attributes of these traffic analysis zones (TAZs) [2,7,14,15,16]. Road networks usually come from the popular collaborative mapping project OpenStreetMap (OSM) or the navigation data of Internet maps. These TAZs are more in line with the urban planning units, but the simple qualitative analysis of functional categories in previous studies cannot help urban planners obtain a good understanding of functional zones. The cadastral data-based methods use the land parcel in cadastral surveys as the unit of functional zone identification [17]. Cadastral data are detailed and accurate, but they are slow to update and sometimes difficult to obtain [18]. In recent years, there have been studies on functional zones based on segmentation units. These studies usually use object-oriented segmentation methods to obtain functional objects and study functional zones on a more precise scale [11,19]. However, the concept of functional zones implies highly heterogeneous and complex scenes [1,20,21]. Functional zones are a combination of various land cover types with complex visual characteristics. Image segmentation produces objects with similar spectral and texture features rather than areas with homogeneous social functions, which is more meaningful in land cover and land use classification [14,22]. Functional zones should not correspond to a single land use type but should be a combination of land use and land cover types to provide functional services for people’s daily lives. Therefore, the research unit of this paper is based on TAZs, which are relatively fine and consistent with the planning unit of urban planning.
From the perspective of data and methods, image data and location-based social perception data are the main data sources suitable for urban functional area research. Very high-resolution (VHR) remote sensing images provide a wide and detailed view for the recognition of urban functional zones [1,23,24]. The buildings in the image are clearly visible, and the land cover is immediately apparent. By using high-resolution remote sensing data as a single data source, Zhou et al. proposed a super object convolutional neural network based on super objects from image segmentation. The functional attributes of super objects were determined by voting on the functional categories of random points in them [11]. However, most remote sensing images are focused on the natural characteristics of land cover, with abundant spectral and texture information and a lack of information on human and social activities [7]. Therefore, in functional zone studies, remote sensing images are usually combined with other types of data to conduct research. With the development of information technology and the construction of smart cities, new urban social perception big data and corresponding data mining methods are emerging. Point of interest (POI) data are one of the most common types of data in the study of functional zone identification. POI data are widely used because of their accessible and rich semantic and land use information [2,25]. Zhang et al. proposed using public bicycle rental records and POI data to identify urban functional zones. The topic model and the unsupervised classification method are used to cluster the functional zones [15]. Song et al. used VHR remote sensing images and POI data to calculate the function value of a TAZ by using building rooftop functional segments and the corresponding segmental weight coefficient [7]. Chao et al. used social media check-in records and street view imagery to identify functional zones. Verbs in the check-in records are used to represent human activities, and street view data are used to represent the natural environment. The categories of urban functional zones are predicted based on deep learning [26]. Mobile phone signaling data, a new type of human activity data, have also appeared in the study of urban functional zone recognition. Tu et al. studied the feasibility of hierarchical clustering by combining mobile phone positioning data and VHR remote sensing data to identify functional zones [12]. In addition, real-time population heat map data, floating car trajectory data, and bus smart card data appear as human activity data in the study of functional area recognition [13,16,27].
Generally, these studies on functional zones involve buildings, the natural environment, functional semantics, and human activities. Previous studies often establish the corresponding relationship between features and functional zones based on one point or parts of points but rarely comprehensively consider the characteristics of these four different aspects. In fact, all of these four aspects reflect the functions of zones. Functional zones are closely related to human activities. As the main space of human activities in the city, the shape of buildings must also conform to their functionality. In addition, landscape design is not only based on aesthetic or ecological considerations, but also closely related to its function. POIs are intuitive reflections of the functional zones. The above four metrics are directly related to the recognition of functional zones. The purpose of this paper is to comprehensively consider these four metrics of building, landscape, semantics, and human activities to complete the identification of urban functional zones. In addition, this paper also aims to optimize the other two aspects ignored in previous studies of functional zones: on the one hand, large-scale functional zone recognition application scenarios are different from small-scale experiments. One of the important differences is sample labeling. In small-scale experiments, all the training samples can be labeled in order to obtain better classification accuracy. However, large-scale application scenarios need to fully consider the cost of sample labeling. In the process of extending the method of small-scale experiments to large-scale application scenarios, how to balance the accuracy of identification and the cost of labeling is one of the problems that this paper attempts to solve. On the other hand, this paper tries to make portraits of urban functional zones. Previous studies stop at the recognition of functional zones’ categories, but categories are only the most basic information of functional zones. People’s emotions in the process of interaction with urban functional space, various types of POI, and the percentage of vegetation coverage can reflect the characteristics of functional zones from different aspects, which together form the portraits of functional zones.
Based on the above three objectives, a series of experiments are designed in this paper. This study contributes in three ways. First, this paper comprehensively describes the characteristics of urban functional zones in four different aspects, building-level metrics, landscape metrics, semantic metrics, and human activity metrics, and effectively identifies the categories of functional zones. Second, active learning is introduced in the process of sample labeling to balance the accuracy and the cost of sample labeling in large-scale urban functional zone recognition. Third, portraits of functional zones create a multiperspective description mode of functional zones.
2. Materials and Methods
2.1. Study Area
In this study, we selected the central urban area of Haidian District, Beijing, China as the study area. Specifically, the study area is part of Haidian District within the scope of the Fifth Ring Road (Figure 1), covering an area of approximately 145 square kilometers. The study area belongs to the center of Beijing, and its functional categories are complex and comprehensive. There are government agencies, campuses, technology companies, business centers, famous attractions, residential areas, and so on. The complexity of the functional categories of the study area is conducive to extending the method of this research to other regions.
2.2. Materials and Preprocessing
This paper involves multisource heterogeneous data. Table 1 is an overview of the data sources. Due to the different characteristics and data structures of these heterogeneous data, the corresponding preprocessing process for each type of data is also different. The subsequent Section 2.2.1, Section 2.2.2, Section 2.2.3 and Section 2.2.4 will introduce the basic information and preprocessing methods of various data in more detail.
2.2.1. High Spatial Resolution Remote Sensing Satellite Data
Two kinds of remote sensing images are used in this study: Google Maps images and GaoFen-2 (GF-2) images. The resolution of the selected Google Maps image is 0.6 m, and the image acquisition times are concentrated in 2018–2019. GF-2 is a high-resolution remote sensing satellite launched in 2014 equipped with panchromatic and multispectral sensors with corresponding resolutions of 1 m and 4 m, respectively [14]. A GF-2 multispectral image acquired on May 9, 2019 was used in this study. Its acquisition time was similar to that of the Google Maps image. The reason for choosing these two kinds of remote sensing image data sources is that Google Maps images have high spatial resolution, which can ensure the accurate extraction of buildings, but only the visible light band can be used. The multispectral band of the GF-2 image can provide more information for subsequent land cover extraction. Using a combination of multisource remote sensing data can highlight their respective advantages. The obtained Google Maps image can be used directly, but the GF-2 image requires a series of preprocessing steps. First, the parameters provided by the China Center for Resources Satellite Data and Application were used for radiometric calibration. Second, atmospheric correction was performed to eliminate errors caused by atmospheric scattering, absorption, and reflection. Third, orthorectification was performed by using the rational polynomial model. Finally, Google Maps images were used as a reference for georeferencing, which made the two images match completely.
2.2.2. Urban Road Network
Urban planning and development often take road-based parcels as the basic unit, and previous research on urban functional zones based on road networks has also achieved good results [7,28]. OSM is a crowdsourcing project to create a free and editable map service. In this study, the road networks in OSM were reclassified according to the importance level [29], and the results were consistent with the current “highway engineering technical standard” (JTG B01-2014). After removing the corresponding buffer zones of highways and level 1–3 roads, TAZs were obtained. Finally, after removing the TAZs surrounded by the ring-shaped overpass that were too small and had no socioeconomic functions, a total of 694 TAZs were obtained for subsequent analysis.
2.2.3. Semantic Data
In recent years, an increasing amount of semantic data with geographical markers have appeared in people’s lives, such as locations on Internet maps, comments on consumer review sites (e.g., Yelp), and real-time information shared on social network platforms (e.g., Twitter). All of these text data are geotagged. In this paper, two kinds of social sensing semantic data with geographical markers are used: POI data and Weibo (known as Chinese Twitter) check-in data.
The POI data come from Amap (https://www.amap.com) and Baidu map (https://map.baidu.com), which are two of the most popular Internet map service providers in China. A total of 223,088 POI data points were collected in the study area in June 2019. POI data have different levels: Baidu POI data contain two levels, while Amap POI data contain three levels. In this study, to fully extract the semantic information of land use in POI data and avoid data redundancy, we selected the second-level classification of all POI data. Therefore, the preprocessing process for POI data was mainly the process of data cleaning: discarding duplicate values, handling missing values, processing outliers, and allocating POI data to the corresponding TAZs.
Weibo is the largest microblogging social media platform in China. People often use Weibo to share immediate events or emotions. The sentiment analysis based on Weibo check-in data describes the functional zones from different aspects. In this study, we collected a total of 506,165 Weibo check-in data points in the study area from July 2017 to July 2018. The preprocessing of Weibo check-in data mainly included data cleaning (deleting the web page URL, @ user name, emoji, topic symbol contained in the text) [26], merging the check-in records according to the check-in points, and assigning the check-in points to the corresponding TAZs.
2.2.4. Human Activity Data
The change in population density in a period is one of the external manifestations of different functional zones. Therefore, the change in human activity density is also considered in this study. In past research on population spatialization, static population data have usually been derived from statistical yearbooks over the years. Population data are distributed in a certain size grid by gravity models, area weight models, inverse distance weighted models, or land use population models [30,31,32,33,34,35]. However, it is difficult for static data to support the study of urban functional zones. In recent years, an increasing number of mobile phone applications have provided more accurate services based on users’ location information. The data from Real-time Tencent user (RTU) used in this study are high-resolution (25 m) user density grade products of Tencent, one of the Internet enterprises with the largest number of users in China [13,36,37]. This study collected RTU data from September 2 to September 8, 2019 (one week). The change in human activity density over time is conducive to the identification of urban functional zones.
2.3. Methodology
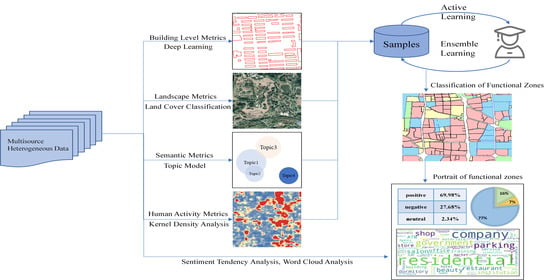
The flow chart of this method framework is shown in Figure 2. Image data, POI data, RTU data, and Weibo check-in data are used to describe the features of functional zones from different perspectives. These features can be summarized into four metrics in general: building-level metrics, landscape metrics, semantic metrics, and human activity metrics. In the TAZs obtained by taking road networks as the segmentation unit, the balance of accurately identifying functional zones and reducing the burden of sample labeling is achieved by combining the sampling method of active learning and the classification method of supervised ensemble learning. Subsequently, the results of category identification and sentiment analysis are combined to draw the portraits of urban functional zones.
2.3.1. Building-Level Metrics
Building-level metrics are important characteristics of functional zones [38]. Buildings are an important part of the city. The same types of buildings have similar requirements for area, location, and function, resulting in the gathering of the same types of buildings in the urban space [19]. For example, industrial areas or public service areas usually have large independent buildings with low aggregation density, while residential areas usually have continuous strip buildings with high aggregation density [39]. Previous studies have achieved a good distinction of functional zones by using building-based indicators [40]. Accurate and rapid large-scale building extraction is the key to obtaining building-level metrics. Traditional building extraction methods often have the disadvantage of ignoring the context information in the image [41,42]. In this study, we used a deep learning-based semantic segmentation method to extract urban buildings from 0.6 m resolution Google images. Submeter resolution images can ensure that buildings are more accurately extracted. Specifically, D-LinkNet, a deep semantic segmentation network, was used for building extraction in this paper [43]. This network has the typical encoder–decoder structure of semantic segmentation networks. Encoder ResNet34 [44] pretrained on ImageNet [45] ensured the effectiveness and stability of feature extraction. In the center part of the network, the dilated convolution layer [46] can enlarge the receptive field and capture multiresolution context information. For the decoder part, transposed convolution layers [47] are used for upsampling to restore the original image resolution. In this study, 26 sample patches with a size of 1000 × 1000 pixels were selected for network training. As far as possible, the samples should include various types of buildings in the study area. As shown in Figure 3, buildings are marked as targets, others are marked as backgrounds, and building extraction is a binary semantic segmentation task.
The accurate extraction of buildings based on high-resolution images and deep learning can provide convenience for the subsequent calculation of building-level metrics. The results of building extraction from semantic segmentation need to be vectorized in order to calculate the perimeter and area attributes of each building vector patch. Then, taking TAZ as the statistical unit, six indexes (Table 2) of the area and edge of buildings were calculated as the building-level metrics of each TAZ.
2.3.2. Landscape Metrics
Landscape refers to a geographical entity composed of mosaics of various land use types. Urban landscapes are landscape types dominated by human activities and are strongly affected by regional and urban socioeconomics, management, and residents’ living needs. Their composition structure and spatial distribution pattern are different from those of other ecosystems and landscapes [48]. In landscape ecology, the landscape index is used to describe all aspects of landscape structure. The landscape index refers to some simple quantitative indicators that can highly concentrate landscape pattern information and reflect aspects of landscape structure composition and spatial configuration. The characteristics of landscape patterns can be reflected in three levels: individual patch-level metrics, class-level metrics, and landscape mosaic-level metrics [49]. Since individual patch-level metrics are not of high explanatory value to understand the structure of the whole landscape, they are often used only as the basis for calculating other landscape metrics. Therefore, this study mainly focuses on class-level metrics and landscape mosaic-level metrics.
In this study, the professional landscape index software FRAGSTATS [50] was used to analyze the landscape pattern. Since landscape measurement is usually based on classified raster data, the calculation of the landscape index starts from the classification of land cover. With the improvement of the spatial resolution of remote sensing images, the phenomenon in which the same object has different spectra and different objects have the same spectrum has emerged. Compared with the pixel-based remote sensing interpretation method, geographic object-based image analysis (GEOBIA) has become a more reasonable land cover interpretation method [51,52]. The fractal net evolution approach (FNEA) is one of the common methods in GEOBIA [53,54]. By considering both spectrum heterogeneity and shape heterogeneity, the algorithm determines whether the merging between adjacent objects is terminated to obtain the final image segmentation result. In this paper, FNEA was used to classify the land cover types (impervious, water, vegetation, and barren soil) of GF-2 images. Due to the high correlation between some landscape indexes, it is necessary to analyze the correlation in the process of index selecting [14]. After taking into account the correlation between indexes and the information content, 20 landscape indexes were selected to quantify the landscape metrics based on the results of land cover classification, as shown in Table 3. Among them, there are 8 landscape mosaic-level indexes (beginning with “L_”) and 12 class-level indexes (beginning with “C_”).
2.3.3. Semantic Metrics
Landscape metrics describe more of the visual characteristics of urban functional zones, but the social and economic characteristics of functional zones are also worth exploring. POIs have become a common semantic information source to represent land use patterns. The topic model is a type of probability and statistics model that uses unsupervised learning to mine the hidden semantic structure of the corpus for clustering analysis [55]. Topic models are mainly used in semantic analysis and text mining in natural language processing (NLP), such as text representation, dimensionality reduction, and classification based on text topics. Latent Dirichlet allocation (LDA) is a common topic model [56]. In recent years, some studies have introduced this NLP technology into urban research to promote the study of urban functional zones [16,28,57]. In this paper, we use LDA to represent the semantic metrics of urban functional zones. As shown in Figure 4a,b, analogically speaking, the set of all POIs in the study area corresponds to the corpus, the functional zone unit corresponds to the document, and the POI in the functional unit corresponds to the word in the document. The process of semantic metric calculation corresponds to the process of document topic inference.
The topic inference process is shown in Figure 4c. Specifically, gensim, a natural language processing library, was used to calculate semantic measures in this paper [58]. All the secondary classifications of POIs were aggregated into the corpus according to TAZs. The ID of each word in the corpus was encoded, and each TAZ was represented as a vector in the form of a bag-of-words through the doc2bow model to train the LDA topic model and infer the TAZ functional topic vector. According to the topic coherence and the actual situation of the study area, we set the number of topics in the LDA model to 4.
2.3.4. Human Activity Metrics
Human activity is one of the most important characteristics of functional zones. The population density of different functional zones changes over time in a day. The RTU data used in this paper come from the location-based service data of users on all platforms of Tencent, including QQ instant messaging, WeChat, and Tencent Map [14]. The abundant user data ensure the validity and accuracy of human activity metrics. RTU data are a kind of vector data of point elements, which represent the level of human activity intensity. The space interval between adjacent points is about 25 m. In order to directly reflect the distribution of discrete human activity data in the continuous space of the study area and quantify the changes of human activity intensity over time in the functional zones, RTU data of 10:00, 15:00, and 22:00 (three typical time intervals) on weekdays and weekends were selected for kernel density analysis, and TAZs were used as the basic units to conduct zonal statistics on the results of kernel density analysis. In this paper, the maximum and average of human activity density in each TAZ unit were calculated to quantify the human activity metrics. Kernel density analysis and zonal statistics can both be completed in the software Arcgis 10.2. The visualization results of the mean value of human activity density are shown in Figure 5. Compared with specific values, Figure 5 focuses more on the distribution of the relative high and low of human activity density in spatial and temporal dimensions. In order to show the difference distribution of human activity density more clearly, we unify the legend value range of the subfigures, so that the relative change of human activity intensity with space and time can be seen at a glance. Figure 5(1)–(6) show the change of the mean value of human activity density over time in the whole study area and Figure 5(8)–(13) zoom in on the change of human activity density by taking two typical TAZs as examples.
2.3.5. Classification Based on Ensemble Learning with Active Sample Labeling
The data preparation of the four metrics mentioned above is the data basis of functional zone identification. At the same time, an excellent classifier is also an important factor to ensure the accuracy of supervised classification. Specifically, this paper uses an ensemble learning method to classify functional zones. Ensemble learning, also known as committee-based learning or multiple classifier systems, usually trains multiple learners and combines them to solve a problem [59]. The ensemble of a group of classifiers produces a more accurate prediction than the optimal single classifier [60]. More specifically, the XGBoost algorithm [61] is applied in this study as an excellent representative of ensemble learning. The XGBoost algorithm is helpful for identifying functional zones due to the following aspects: first, the generalization ability and robustness of multiclassifier combinations are stronger; second, XGBoost supports shrinkage and column subsampling tricks, which can effectively prevent overfitting and reduce the amount of calculation; third, XGBoost can effectively deal with sparse data, which are suitable for case studies.
How to ensure the accuracy and reduce the cost of labeling are problems that supervised learning has been facing, especially when the small-scale experimental methods are extended to a large-scale practical application. As an iterative sampling method, active learning [62,63,64] can effectively meet our requirement of reducing manual labeling. A small number of representative samples are selected to train the initial classifier. By using the query function, the samples with sufficient information are selected to label, which provides new knowledge for the next round of classifier training. Active learning adjusts training samples iteratively until the requirements are met. In this paper, active learning uses a query function based on information entropy to select a certain proportion of confusing samples with large uncertainty to participate in classifier training. The calculation method of sample information entropy is shown in Equation (1).
In Equation (1), represents the total number of functional zone categories. represents the probability that sample is classified into category () by the current classifier. is the information entropy of sample .
The process of active learning is shown in Figure 6a. The query function selects confusing samples with high information entropy for manual labeling and adds them to the sample set to make the classifier better by iteration. Figure 6b shows the schematic diagram of the distribution of samples in the feature space. Compared with random selection, the samples located near the boundary of the classification hyperplane have a greater impact on the final classification boundary. It is more conducive to balance the accuracy and labeling cost to select these samples first.
2.3.6. Sentiment Analysis of Functional Zones
Urban functional zones are closely related to human activities, and human activities are inevitably accompanied by the generation and expression of emotions. This paper provides a new perspective for the understanding of functional zones by analyzing the sentiment of location-based Weibo check-in data. The Baidu AI open platform [65] was used to analyze emotion in Weibo data and explore the emotional polarity of functional zones in the study area. Specifically, the core emotional analysis module, Sentiment Knowledge Enhanced Pretraining (SKEP) [66], which achieved new state-of-the-art performance on typical specific sentiment analysis tasks, was used in this study. SKEP can distinguish the emotional polarity categories (positive, negative, and neutral) of texts containing subjective opinion information and provide the corresponding confidence level. When the probability of positive emotion is less than 45%, it is regarded as negative polarity; if it is greater than 55%, it is regarded as positive polarity; otherwise, it is considered neutral. Through the emotional polarity analysis of the Weibo check-in data and the reorganization and statistics according to the functional zone units, the sentiment distribution of each functional zone can be understood. This part of the experiment is based on the Baidu PaddlePaddle open-source framework and Senta sentiment analysis system.
3. Results
3.1. Classification Results of Urban Functional Zones
For the functional zone samples, 60% were divided into a training set and 40% were divided into a testing set. The actual functional categories of these samples were identified by experienced analysts based on high-resolution remote sensing images, Internet maps, and field surveys. The results of functional zone identification of the whole research area are shown in Figure 7. From the results, the urban green space zones in the north and northwest of the study area show a certain concentration trend, corresponding to the Old Summer Palace, the Summer Palace, Yuquan Park, and the golf club. Some public service zones are gathered in the northeast, such as Tsinghua University, Peking University, Beijing Forestry University, Beijing Language and Culture University, China University of Geosciences (Beijing), etc. There are more residential zones in the south part of the study area. The commercial zones show the pattern of overall dispersion and local aggregation.
The confusion matrix is shown in Table 4. From the confusion matrix, it can be seen that the overall recognition accuracy of the functional zones in the study area reaches 82.37%, which shows the effectiveness of the method in this paper. As for the specific categories of functional zones, residential zones and urban green space zones have higher user accuracy and producer accuracy. Of real residential zones, 89.68 percent are accurately identified and the user’s accuracy of green space zones is 100%. However, some of the public service zones are mistakenly divided into residential zones. After careful analysis, it is found that some administrative agencies have family dormitory buildings in their blocks, which are the supporting facilities of administrative agencies. The existence of these family dormitory buildings leads to the incorrect classification of the public service zones.
3.2. Portraits of Typical Functional Zones
In previous studies, the study of functional zones often stopped at the recognition of their categories. However, categories are only the basic description of functional zones and cannot establish the overall understanding of functional zones. Similar to other cognitive processes, functional zones need to be described from multiple perspectives to establish their overall concept. As shown in Figure 8, four blocks are selected as representative of typical functional zones. Blocks a, b, c, and d correspond to commercial zones, residential zones, public service zones, and urban green space zones, respectively. Combined with the above experimental results, word clouds (due to the limited number of POIs in a single block, the word clouds in Figure 8 are generated by all POIs of the corresponding functional zone categories), pie charts of land cover categories, and block sentiment analysis results are identified to describe a functional zone. From the word clouds, it can be seen that there is a common phenomenon of mixed function in each category of functional zones. The size of the font in the word clouds represents the frequency with which the category of POI emerges. In commercial zones, residential zones, and urban green space zones, the main categories of POIs (companies, residential areas, scenic spots) have absolute quantity superiority. However, for public service zones, many government agencies, scientific research institutions, and universities contain a large number of family areas or dormitories, resulting in a proportion of the word “residential” in the word cloud. At the same time, subsidiary companies or affiliated companies of some institutions also appear in public service zones, which makes the degree of mixing of functional areas more serious. However, it is obvious that compared with the word clouds of other categories of functional zones, “government”, “scientific”, “institution”, and “dormitory” emerged more frequently.
In addition to the word clouds, the typical functional zone portraits in Figure 8 show the land cover type proportion map of the current TAZ and the results of sentiment analysis. Since none of the four selected blocks contains water, the pie charts show only three types of land cover (vegetation, barren soil, impervious surface). The results of sentiment analysis show the emotional tendency of Weibo check-in records in each TAZ and the proportion of various emotional tendencies (positive, negative, neutral). The portraits of functional zones describe the features of functional zones from multiple perspectives so that people can clearly understand the characteristics of a certain functional zone. In the future, with the increasing abundance and availability of multisource data, the aspects of functional zone description can also be increased.
4. Discussion
4.1. Comparison of Different Metric Sets and Methods
In this paper, four metrics are selected to describe the functional zones from different aspects. A set of experiments, shown in Table 5, were designed to verify the necessity of selecting each metric. The experimental results show that when the building-level metrics, the landscape metrics, the semantic metrics, and the human activity metrics are removed in turn, the overall classification accuracy of the ensemble model decreases by approximately 6.5%, 9.0%, 9.0%, and 7.2%, respectively. The results show that any one of the four metrics contributes to improving the accuracy of functional zone recognition. In addition, the comparison between ensemble model (XGBoost) and non-ensemble model (DecisionTree) is also designed in the experiment. Unlike the DecisionTree model which uses a single tree model to simulate the mapping relationship between samples’ features and categories, XGBoost combines a series of basic tree models to get an enhanced classifier, which has better results for functional zone recognition. As shown in Table 5, the overall classification accuracy of the decision tree model is 67.75%, which is much lower than the 82.37% of XGBoost.
Figure 9 shows the ranking result of the importance of all features. Among the 42 features, the top 10 features involve each of the four metrics, which confirm the conclusion mentioned above that the four metrics are closely related to the identification of functional zones. In the top 10 features, there are four features of human activity metrics and two features of semantic metrics. Their high ranking is in line with the expectation that functional zones are closely related to land use and human behavior. In building-level and landscape metrics, features named “BA_P” (percentage of building area), “C_SHAPE_MN_V” (mean shape index of the vegetation patches), “L_PD” (patch density of all patches), and “C_AREA_MN_B” (mean area of the barren soil patches in the parcel) are in the top 10. These features fully show that the proportion, shape, area, and aggregation degree of different land cover types are the external representation of functional zones.
4.2. Efficiency and Accuracy of Active Sampling Method
Supervised classification usually uses labeled samples to train classifiers. Different from the small-scale research area experiment, when the research method is extended to the application of large-scale functional zone recognition, in addition to the well-designed classifier, the sampling method also has higher requirements. The process of sample labeling requires considerable time and labor, which is an unavoidable problem in machine learning and deep learning. The model needs to be fed a large number of samples to become stable and robust. In small-scale experiments, satisfactory accuracy can be obtained by completely labeling the training samples, but large-scale functional zone identification needs to balance accuracy and cost. Therefore, this paper added the experiment of active learning sample selection. Forty percent of the samples were considered as testing samples. In the rest of the samples, only 10% of the representative samples with obvious features of functional zones were manually labeled for training basic classifiers at first. Then the samples with larger information entropy relative to the current classifier were selected by an iteration method for active annotation, and the classifier was updated. Three groups of experiments were designed to verify the effectiveness of active learning. Samples (10%, 25%, and 40%) were selected to update the classifier. Compared with the classifier trained by the same proportion of random samples, the classifier trained by active selection samples shows better accuracy, as shown in Table 6.
The experimental results show that, in three groups of experiments with different proportions of samples, the sample selection method based on active learning can perform better with the same manual labeling burden, which can provide a strategy to balance the recognition accuracy and labeling cost in the process of large-scale functional zone recognition. The targeted sample selection method can quickly meet certain accuracy requirements. However, it must be noted that there is still a small gap in the results of active learning compared with the way that training samples are all labeled. The purpose of active learning for sample selection is to take into account both the labeling burden and the recognition accuracy while identifying the urban functional zones on a large scale.
4.3. Sentiment Analysis of Urban Functional Zones
Functional zones are the objective function distribution in a city, and the Weibo check-in data represent people’s subjective emotional expression. However, the statistical results obtained from the sentiment analysis of a large amount of Weibo check-in data are the objective reflection of the functional zones in the dimension of sentiment characteristics. Table 7 shows the mean sentiment score of the four kinds of functional zones and the proportion of positive Weibo check-in data to the total number. Based on the analysis of 506,165 Weibo check-in data points in the study area, it is found that the emotional tendencies of the four functional zones are all positive. In comparison, the statistical results of sentiment analysis in commercial zones, residential zones, and public service zones are not significantly different.
Through careful observation of the check-in records, it is found that most of the specific Weibo check-in records have obvious positive or negative emotional tendencies. These check-in records reflect different topics or relate different events. However, when taking a TAZ as the spatial statistical unit and a whole year as the time statistical unit, these obvious emotional tendencies are averaged. Even so, urban green space has a significantly higher score and proportion of positive sentiment. The results show that urban green space plays a role in promoting people’s positive emotions. Parks, lakesides, and gardens provide people with space for relaxation, leisure, and entertainment. This finding suggests that in urban built-up areas where the functional pattern is difficult to change, the development of new types of urban green space, such as roof greening and garden-type commercial blocks, can be regarded as an effective way to relieve daily pressure and improve people’s happiness index.
4.4. Limitations and Possible Improvements
In this paper, the building-level metrics are calculated based on the semantic segmentation results of high-resolution images, including the perimeter, area, and other statistical information of buildings in TAZs. This method can extract building information quickly, accurately, and widely. However, due to the limitation of data sources, the features of building metrics are still two-dimensional. In fact, the height and number of floors of a building are related to its functional types. For example, residential and office buildings in cities generally have more floors, while shopping malls and supermarkets have fewer floors. High-precision Light Detection and Ranging (LiDAR) data [67] and oblique photogrammetry modeling technology [68,69] can be used in the future to provide more 3D information of buildings.
The distribution difference of human activity intensity in spatial and temporal dimensions is an important metric to distinguish different functional zones. The RTU data used in this paper reflect the spatial distribution of the activity intensity levels of Tencent users. Although the Tencent platform has a wide range of users in China, its platform applications are more focused on providing instant messaging and social network services. There is a certain age bias among its user groups. Compared with the elderly group, the young and middle-aged user groups are larger. This kind of user age bias is also limited by the data source. The mobile phone signaling data can relieve the age bias of users to a certain extent. It is conceivable that in the near-future era of the Internet of Things, new sensors can provide more comprehensive population density or human activity intensity data.
5. Conclusions
This paper proposes a framework to quantitatively describe functional zones, identify functional zone categories, and draw functional zone portraits. With the characteristics of repeatability, comprehensiveness, and large-scale implementation, it describes the features of functional zones from multiple perspectives and realizes the accurate identification of functional zones based on the supervised ensemble learning algorithm XGBoost. Within the Fifth Ring Road, Haidian District, Beijing, the study area of this paper, experimental results fully prove the effectiveness of the method proposed in this paper. Based on the classification of functional zones, the method of sample labeling is optimized and the portraits of typical functional zones are drawn.
The contribution of this study is mainly concentrated in three aspects. First, this paper integrates multisource heterogeneous data and an ensemble learning method to effectively identify the categories of urban functional zones, and the overall recognition accuracy reaches 82.37%. Based on VHR remote sensing images, Internet map POI data, and real-time human activity density data, this study uses deep learning technology, the landscape ecological index calculation method, the NLP theme model, and the kernel density analysis method to sort out and calculate four kinds of metrics: building-level metrics, landscape metrics, semantic metrics, and human activity metrics. These four metrics describe urban functional zones comprehensively and lay a good foundation for the category identification. Compared with a single classifier method (random forest), the ensemble learning method (XGBoost) improves the overall classification accuracy by 14.62%. Second, considering the burden of sample labeling when expanding the method of functional zone identification from a small experimental area to a large-scale application, this paper proposes a sample labeling method based on active learning to balance the accuracy of identification and the cost of sample labeling. Compared with the random sampling method, it is found that the sampling method based on active learning effectively improves the identification accuracy of the functional zone with the same sample labeling burden. Third, this paper goes beyond the classification of functional zones by adding sentiment analysis, word clouds, and land cover proportion maps to the portraits of functional zones, making the image of functional zones clear at a glance. The functional zone portraits show the characteristics of the functional zones from multiple perspectives. Even if there are supplements of new source data in the future, the analysis results can be added to the portraits, so as to increase new perspectives of people’s cognition of functional zones.
The research framework of this paper involves the construction of a metrics system, sample labeling, ensemble learning, and category portraits. This framework can be transferred to some supervised classification scenarios. For example, land use and land cover classification. However, it is necessary to adjust the data source and metrics system according to the application scenarios to ensure good classification results.
The next step of our study will focus on how to integrate urban traffic big data into the research of urban functional zones to analyze the impact range of functional zones. Furthermore, it can also analyze the origin and destination of the people flow in the functional zones, and the results can help companies to reasonably arrange off-peak commuting, or help shopping malls to accurately formulate shopping shuttle routes.
Author Contributions
Conceptualization, N.X. and J.L.; Data curation, W.L. and N.Z.; Formal analysis, N.X.; Funding acquisition, J.L.; Investigation, N.X.; Methodology, N.X. and T.W.; Project administration, J.L.; Resources, J.L.; Supervision, J.L. and W.D.; Validation, N.X.; Visualization, N.X.; Writing—original draft, N.X.; Writing—review and editing, W.D. and T.W. All authors have read and agreed to the published version of the manuscript.
Funding
This research was funded by the National Natural Science Foundation of China (grant number 41631179), and the National Key R&D Program of China (grant number 2017YFB0503603).
Institutional Review Board Statement
Not applicable.
Informed Consent Statement
Not applicable.
Data Availability Statement
Data is available upon request.
Conflicts of Interest
The authors declare no conflict of interest.
References
- Zhang, X.; Du, S.; Zheng, Z. Heuristic sample learning for complex urban scenes: Application to urban functional-zone mapping with VHR images and POI data. ISPRS J. Photogramm. Remote Sens. 2020, 161, 1–12. [Google Scholar] [CrossRef]
- Yao, Y.; Li, X.; Liu, X.; Liu, P.; Liang, Z.; Zhang, J.; Mai, K. Sensing spatial distribution of urban land use by integrating points-of-interest and Google Word2Vec model. Int. J. Geogr. Inf. Sci. 2017, 31, 825–848. [Google Scholar] [CrossRef]
- Zhang, X.; Du, S.; Wang, Q. Integrating bottom-up classification and top-down feedback for improving urban land-cover and functional-zone mapping. Remote Sens. Environ. 2018, 212, 231–248. [Google Scholar] [CrossRef]
- Zhang, X.; Du, S.; Zhang, Y. Semantic and spatial co-occurrence analysis on object pairs for Urban scene classification. IEEE J. Sel. Top. Appl. Earth Observ. Remote Sens. 2018, 11, 2630–2643. [Google Scholar] [CrossRef]
- Du, B.; Wang, Y.; Wu, C.; Zhang, L. Unsupervised scene change detection via latent Dirichlet allocation and multivariate alteration detection. IEEE J. Sel. Top. Appl. Earth Observ. Remote Sens. 2018, 11, 4676–4689. [Google Scholar] [CrossRef]
- Zhang, X.; Du, S. Learning selfhood scales for urban land cover mapping with very-high-resolution satellite images. Remote Sens. Environ. 2016, 178, 172–190. [Google Scholar] [CrossRef]
- Song, J.; Lin, T.; Li, X.; Prishchepov, A.V. Mapping urban functional zones by integrating very high spatial resolution remote sensing imagery and points of interest: A case study of Xiamen, China. Remote Sens. 2018, 10, 1737. [Google Scholar] [CrossRef]
- Shin, H.B. Residential redevelopment and the entrepreneurial local state: The implications of Beijing’s shifting emphasis on urban redevelopment policies. Urban Stud. 2009, 46, 2815–2839. [Google Scholar] [CrossRef]
- Jiang, S.; Alves, A.; Rodrigues, F.; Ferreira, J., Jr.; Pereira, F.C. Mining point-of-interest data from social networks for urban land use classification and disaggregation. Comput. Environ. Urban Syst. 2015, 53, 36–46. [Google Scholar] [CrossRef]
- Wu, J.; Jelinski, D. Pattern and Scale in Ecology: The Modifiable Areal Unit Problem; Science Press: Beijing, China, 1995; pp. 1–9. [Google Scholar]
- Zhou, W.; Ming, D.; Lv, X.; Zhou, K.; Bao, H.; Hong, Z. SO–CNN based urban functional zone fine division with VHR remote sensing image. Remote Sens. Environ. 2020, 236, 111458. [Google Scholar] [CrossRef]
- Tu, W.; Hu, Z.; Li, L.; Cao, J.; Jiang, J.; Li, Q.; Li, Q. Portraying urban functional zones by coupling remote sensing imagery and human sensing data. Remote Sens. 2018, 10, 141. [Google Scholar] [CrossRef]
- Zhang, Y.; Li, Q.; Tu, W.; Mai, K.; Yao, Y.; Chen, Y. Functional urban land use recognition integrating multi-source geospatial data and cross-correlations. Comput. Environ. Urban Syst. 2019, 78, 101374. [Google Scholar] [CrossRef]
- Zhang, Y.; Li, Q.; Huang, H.; Wu, W.; Du, X.; Wang, H. The combined use of remote sensing and social sensing data in fine-grained urban land use mapping: A case study in Beijing, China. Remote Sens. 2017, 9, 865. [Google Scholar] [CrossRef]
- Zhang, X.; Li, W.; Zhang, F.; Liu, R.; Du, Z. Identifying urban functional zones using public bicycle rental records and point-of-interest data. ISPRS Int. Geo Inf. 2018, 7, 459. [Google Scholar] [CrossRef]
- Yuan, N.J.; Zheng, Y.; Xie, X.; Wang, Y.; Zheng, K.; Xiong, H. Discovering urban functional zones using latent activity trajectories. IEEE Comput. Soc. 2014, 27, 712–725. [Google Scholar] [CrossRef]
- Plotnick, R.E.; Gardner, R.H.; O’Neill, R.V. Lacunarity indices as measures of landscape texture. Landsc. Ecol. 1993, 8, 201–211. [Google Scholar] [CrossRef]
- Liu, X.; Long, Y. Automated identification and characterization of parcels with OpenStreetMap and points of interest. Environ. Plan. B Plan. Des. 2016, 43, 341–360. [Google Scholar] [CrossRef]
- Bao, H.; Ming, D.; Guo, Y.; Zhang, K.; Zhou, K.; Du, S. DFCNN-Based Semantic Recognition of Urban Functional Zones by Integrating Remote Sensing Data and POI Data. Remote Sens. 2020, 12, 1088. [Google Scholar] [CrossRef]
- Feng, Y.; Du, S.; Myint, S.W.; Shu, M. Do urban functional zones affect land surface temperature differently? A case study of Beijing, China. Remote Sens. 2019, 11, 1802. [Google Scholar] [CrossRef]
- Zhang, X.; Du, S. A linear dirichlet mixture model for decomposing scenes: Application to analyzing urban functional zonings. Remote Sens. Environ. 2015, 169, 37–49. [Google Scholar] [CrossRef]
- Zhan, Q.; Molenaar, M.; Tempfli, K. Hierarchical image object-based structural analysis toward urban land use classification using high-resolution imagery and airborne LIDAR data. In Proceedings of the 3rd International Conference on Remote Sensing of Urban Areas, Istanbul, Turkey, 11–13 June 2002; pp. 11–13. [Google Scholar]
- Heiden, U.; Heldens, W.; Roessner, S.; Segl, K.; Esch, T.; Mueller, A. Urban structure type characterization using hyperspectral remote sensing and height information. Landsc. Urban Plan. 2012, 105, 361–375. [Google Scholar] [CrossRef]
- Du, S.; Du, S.; Liu, B.; Zhang, X. Context-Enabled Extraction of Large-Scale Urban Functional Zones from Very-High-Resolution Images: A Multiscale Segmentation Approach. Remote Sens. 2019, 11, 1902. [Google Scholar] [CrossRef]
- Zhang, X.; Du, S.; Wang, Q.; Zhou, W. Multiscale geoscene segmentation for extracting urban functional zones from VHR satellite images. Remote Sens. 2018, 10, 281. [Google Scholar] [CrossRef]
- Ye, C.; Zhang, F.; Mu, L.; Gao, Y.; Liu, Y. Urban function recognition by integrating social media and street-level imagery. Environ. Plan. B 2020. [Google Scholar] [CrossRef]
- Long, Y.; Shen, Z. Discovering functional zones using bus smart card data and points of interest in Beijing. In Geospatial Analysis to Support Urban Planning in Beijing; Springer: Berlin, Germany, 2015; pp. 193–217. [Google Scholar]
- Yuan, J.; Zheng, Y.; Xie, X. Discovering regions of different functions in a city using human mobility and POIs. In Proceedings of the 18th ACM SIGKDD International Conference on Knowledge Discovery and Data Mining, Beijing, China, 12–16 August 2012; pp. 186–194. [Google Scholar]
- OSM. Chinese Tagging Guidelines. Available online: https://wiki.openstreetmap.org/wiki/Zh-hans:Chinese_tagging_guidelines (accessed on 15 May 2020).
- Yue, T.; Wang, Y.; Chen, S.; Liu, J.; Qiu, D.; Deng, X.; Liu, M.; Tian, Y. Numerical simulation of population distribution in China. Popul. Environ. 2003, 25, 141–163. [Google Scholar] [CrossRef]
- Balk, D.L.; Deichmann, U.; Yetman, G.; Pozzi, F.; Hay, S.I.; Nelson, A. Determining global population distribution: Methods, applications and data. Adv. Parasitol. 2006, 62, 119–156. [Google Scholar]
- Goodchild, M.F.; Anselin, L.; Deichmann, U. A framework for the areal interpolation of socioeconomic data. Environ. Plan. A 1993, 25, 383–397. [Google Scholar] [CrossRef]
- Martin, D. Mapping population data from zone centroid locations. Trans. Inst. Br. Geogr. 1989, 14, 90–97. [Google Scholar] [CrossRef]
- Bracken, I.; Martin, D. The generation of spatial population distributions from census centroid data. Environ. Plan. A 1989, 21, 537–543. [Google Scholar] [CrossRef]
- Eicher, C.L.; Brewer, C.A. Dasymetric mapping and areal interpolation: Implementation and evaluation. Cartogr. Geogr. Inf. Sci. 2001, 28, 125–138. [Google Scholar] [CrossRef]
- Zhang, Y.; Li, Q.; Wang, H.; Du, X.; Huang, H. Community scale livability evaluation integrating remote sensing, surface observation and geospatial big data. Int. J. Appl. Earth Obs. Geoinf. 2019, 80, 173–186. [Google Scholar] [CrossRef]
- Xu, N.; Luo, J.; Zuo, J.; Hu, X.; Dong, J.; Wu, T.; Wu, S.; Liu, H. Accurate Suitability Evaluation of Large-scale Roof Greening Based on RS and GIS Methods. Sustainability 2020, 12, 4375. [Google Scholar] [CrossRef]
- Steiniger, S.; Lange, T.; Burghardt, D.; Weibel, R. An approach for the classification of urban building structures based on discriminant analysis techniques. Trans. GIS 2008, 12, 31–59. [Google Scholar] [CrossRef]
- Xing, H.; Meng, Y. Integrating landscape metrics and socioeconomic features for urban functional region classification. Comput. Environ. Urban Syst. 2018, 72, 134–145. [Google Scholar] [CrossRef]
- Vanderhaegen, S.; Canters, F. Mapping urban form and function at city block level using spatial metrics. Landsc. Urban Plan. 2017, 167, 399–409. [Google Scholar] [CrossRef]
- Liu, Z.; Wang, J.; Liu, W. Building extraction from high resolution imagery based on multi-scale object oriented classification and probabilistic Hough transform. In Proceedings of the 2005 IEEE International Geoscience and Remote Sensing Symposium, Seoul, Korea, 29 July 2005; pp. 2250–2253. [Google Scholar]
- Jiang, N.; Zhang, J.; Li, H.; Lin, X. Semi-automatic building extraction from high resolution imagery based on segmentation. In Proceedings of the 2008 International Workshop on Earth Observation and Remote Sensing Applications, Beijing, China, 30 June–2 July 2008; pp. 1–5. [Google Scholar]
- Zhou, L.; Zhang, C.; Wu, M. D-LinkNet: LinkNet With Pretrained Encoder and Dilated Convolution for High Resolution Satellite Imagery Road Extraction. In Proceedings of the 2018 IEEE/CVF Conference on Computer Vision and Pattern Recognition Workshops (CVPRW), Salt Lake City, UT, USA, 18–22 June 2018; pp. 182–186. [Google Scholar]
- He, K.; Zhang, X.; Ren, S.; Sun, J. Deep residual learning for image recognition. In Proceedings of the IEEE Conference on Computer Vision and Pattern Recognition, Las Vegas, NV, USA, 27–30 June 2016; pp. 770–778. [Google Scholar]
- Deng, J.; Dong, W.; Socher, R.; Li, L.-J.; Li, K.; Fei-Fei, L. Imagenet: A large-scale hierarchical image database. In Proceedings of the 2009 IEEE Conference on Computer Vision and Pattern Recognition, Miami, FL, USA, 20–25 June 2009; pp. 248–255. [Google Scholar]
- Yu, F.; Koltun, V. Multi-scale context aggregation by dilated convolutions. arXiv 2015, arXiv:1511.07122. [Google Scholar]
- Zeiler, M.D.; Taylor, G.W.; Fergus, R. Adaptive deconvolutional networks for mid and high level feature learning. In Proceedings of the 2011 International Conference on Computer Vision, Barcelona, Spain, 7 November 2011; pp. 2018–2025. [Google Scholar]
- Thomlinson, J.R.; Rivera, L.Y. Suburban growth in Luquillo, Puerto Rico: Some consequences of development on natural and semi-natural systems. Landsc. Urban Plan. 2000, 49, 15–23. [Google Scholar] [CrossRef]
- Wu, J.-G. Landscape Ecology: Pattern, Process, Scale and Hierarchy; Beijing Higher Education Press: Beijing, China, 2000. [Google Scholar]
- FRAGSTATS. Available online: http://www.umass.edu/landeco/research/fragstats/downloads/fragstats_downloads.html (accessed on 15 September 2020).
- Blaschke, T. Object based image analysis for remote sensing. ISPRS J. Photogramm. Remote Sens. 2010, 65, 2–16. [Google Scholar] [CrossRef]
- Blaschke, T.; Hay, G.J.; Kelly, M.; Lang, S.; Hofmann, P.; Addink, E.; Feitosa, R.Q.; Van der Meer, F.; Van der Werff, H.; Van Coillie, F. Geographic object-based image analysis–towards a new paradigm. ISPRS J. Photogramm. Remote Sens. 2014, 87, 180–191. [Google Scholar] [CrossRef]
- Baatz, M.; Schäpe, A.; Strobl, J.; Blaschke, T.; Griesebner, G. Multiresolution Segmentation-an optimization approach for high quality multi-scale image segmentation. Angew. Geogr. Inf. 2000, 12, 12–23. [Google Scholar]
- Benz, U.C.; Hofmann, P.; Willhauck, G.; Lingenfelder, I.; Heynen, M. Multi-resolution, object-oriented fuzzy analysis of remote sensing data for GIS-ready information. ISPRS J. Photogramm. Remote Sens. 2004, 58, 239–258. [Google Scholar] [CrossRef]
- Papadimitriou, C.H.; Raghavan, P.; Tamaki, H.; Vempala, S. Latent semantic indexing: A probabilistic analysis. J. Comput. Syst. Sci. 2000, 61, 217–235. [Google Scholar] [CrossRef]
- Blei, D.M.; Ng, A.Y.; Jordan, M.I. Latent dirichlet allocation. J. Mach. Learn. Res. 2003, 3, 993–1022. [Google Scholar]
- Gao, S.; Janowicz, K.; Couclelis, H. Extracting urban functional regions from points of interest and human activities on location-based social networks. Trans. GIS 2017, 21, 446–467. [Google Scholar] [CrossRef]
- Gensim. Available online: https://radimrehurek.com/gensim/ (accessed on 15 May 2020).
- Zhou, Z.-H. Ensemble Methods: Foundations and Algorithms; CRC Press: Boca Raton, FL, USA, 2012. [Google Scholar]
- Hansen, L.K.; Salamon, P. Neural network ensembles. IEEE Trans. Pattern Anal. Mach. Intell. 1990, 12, 993–1001. [Google Scholar] [CrossRef]
- Chen, T.; Guestrin, C. Xgboost: A scalable tree boosting system. In Proceedings of the 22nd ACM SIGKDD International Conference on Knowledge Discovery and Data Mining, San Francisco, CA, USA, 12–17 August 2016; pp. 785–794. [Google Scholar]
- Settles, B. Active Learning Literature Survey; University of Wisconsin-Madison Department of Computer Sciences: Madison, WI, USA, 2009. [Google Scholar]
- Ma, L.; Fu, T.; Li, M. Active learning for object-based image classification using predefined training objects. Int. J. Remote Sens. 2018, 39, 2746–2765. [Google Scholar] [CrossRef]
- Wang, K.; Zhang, D.; Li, Y.; Zhang, R.; Lin, L. Cost-effective active learning for deep image classification. IEEE Trans. Circuits Syst. Video Technol. 2016, 27, 2591–2600. [Google Scholar] [CrossRef]
- Baidu AI. Available online: https://ai.baidu.com/ (accessed on 15 May 2020).
- Tian, H.; Gao, C.; Xiao, X.; Liu, H.; He, B.; Wu, H.; Wang, H.; Wu, F. SKEP: Sentiment Knowledge Enhanced Pre-training for Sentiment Analysis. arXiv 2020, arXiv:2005.05635. [Google Scholar]
- Park, Y.; Guldmann, J.-M. Creating 3D city models with building footprints and LIDAR point cloud classification: A machine learning approach. Comput. Environ. Urban Syst. 2019, 75, 76–89. [Google Scholar] [CrossRef]
- Yalcin, G.; Selcuk, O. 3D city modelling with Oblique Photogrammetry Method. Procedia Technol. 2015, 19, 424–431. [Google Scholar] [CrossRef]
- Toschi, I.; Ramos, M.; Nocerino, E.; Menna, F.; Remondino, F.; Moe, K.; Poli, D.; Legat, K.; Fassi, F. Oblique photogrammetry supporting 3D urban reconstruction of complex scenarios. Int. Arch. Photogramm. Remote Sens. Spat. Inf. Sci. 2017. [Google Scholar] [CrossRef]
Figure 1.
The study area is located within the Fifth Ring Road of Haidian District, Beijing.

Figure 2.
Diagram of the methodological framework of urban functional zone identification. Traffic analysis zones (TAZs) are taken as the basic functional units in this study.
Figure 2.
Diagram of the methodological framework of urban functional zone identification. Traffic analysis zones (TAZs) are taken as the basic functional units in this study.

Figure 3.
Examples of building extraction samples. The left column is the original image patches, and the right column is the corresponding label patches.
Figure 3.
Examples of building extraction samples. The left column is the original image patches, and the right column is the corresponding label patches.

Figure 4.
Semantic metrics calculation: (a,b) represent the analogy between the semantic calculation of the functional zone and the process of text topic inference; (c) is the flow chart of the topic model. In subgraph (c), “w”represents “word”, ”fq” represents “word frequency”, “θ” represents the distribution of words in a topic. “ID” corresponds to the unique identification of each word. “LDA” is short for “Latent Dirichlet allocation”.

Figure 5.
The density of human activities in the study area. (1–6) show the distribution of human activity density at three typical moments in the whole study area. (7) shows the locations of a typical commercial zone (a) and a typical residential zone (b). (8–13) are the enlarged details of human activity density of (a,b).

Figure 6.
Sample selection by active learning. In subfigure (a), L, C, U, and Q represent the labeled sample set, classifier, unlabeled sample set, and query function, respectively. Subfigure (b) is a schematic diagram of the distribution of confused samples.
Figure 6.
Sample selection by active learning. In subfigure (a), L, C, U, and Q represent the labeled sample set, classifier, unlabeled sample set, and query function, respectively. Subfigure (b) is a schematic diagram of the distribution of confused samples.

Figure 7.
Functional zone identification results.
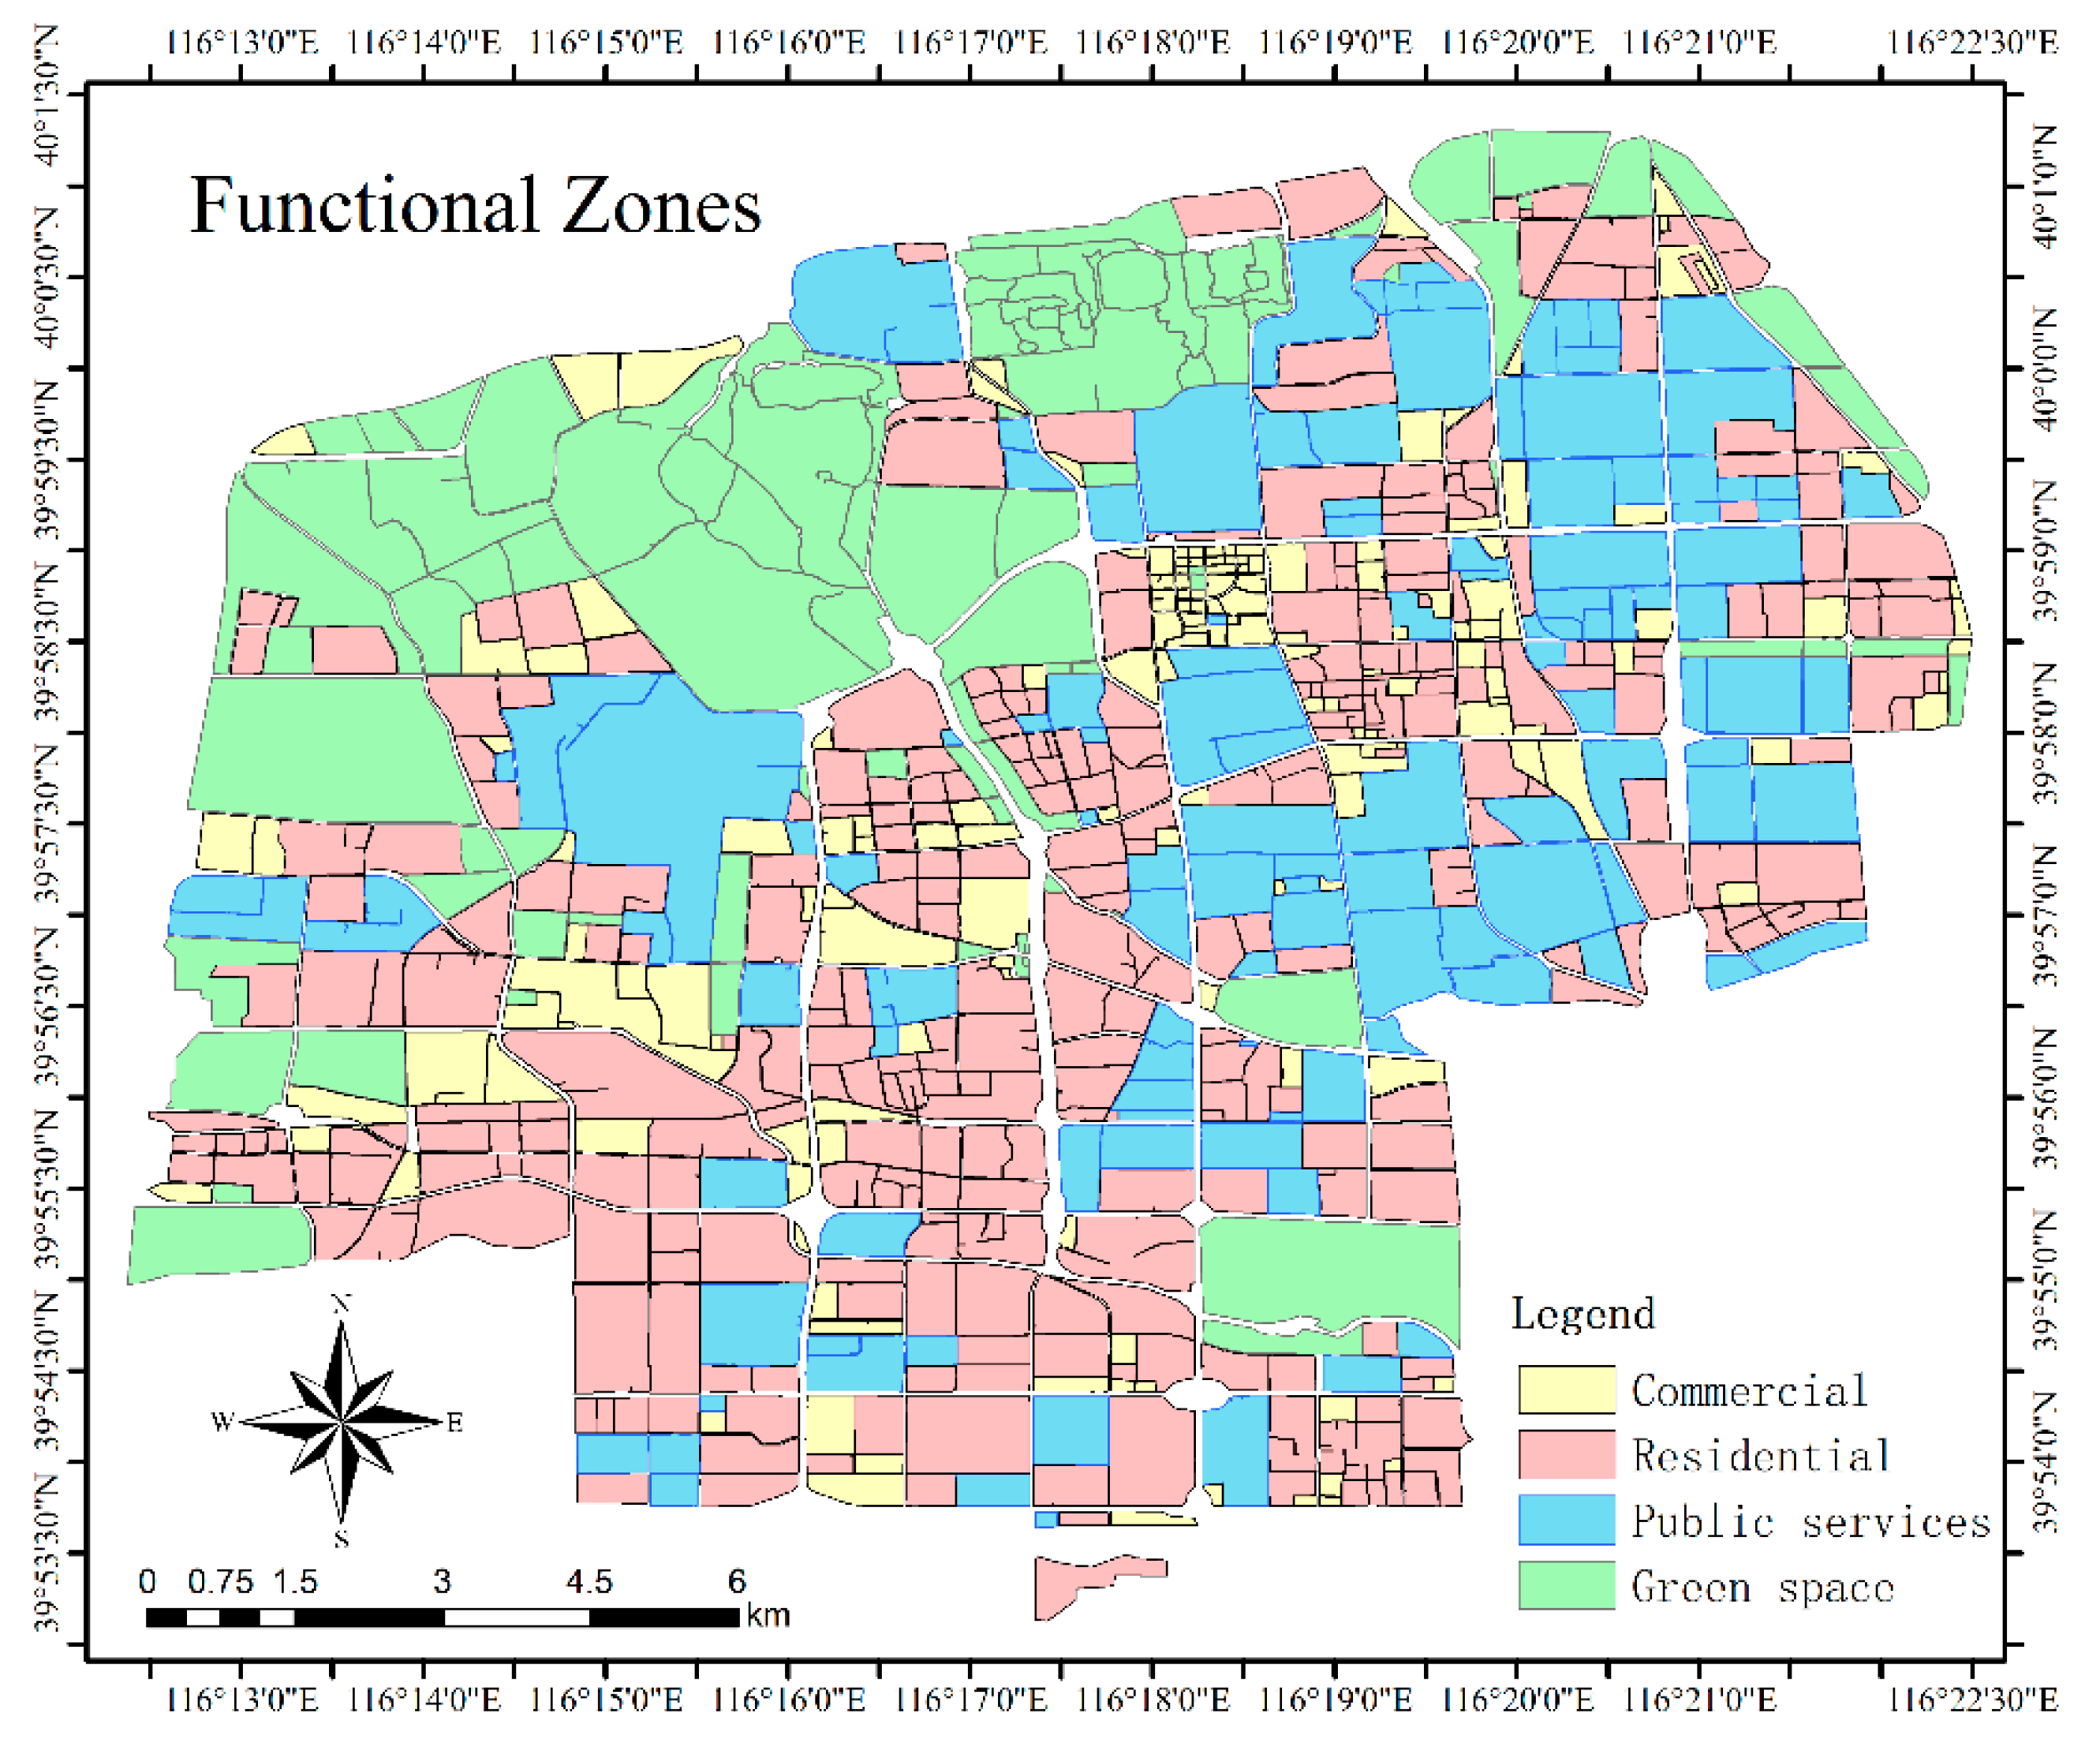
Figure 8.
Portraits of typical urban functional zones. From block (a) to block (d), they are commercial zone, residential zone, public service zone, and urban green space zone.
Figure 8.
Portraits of typical urban functional zones. From block (a) to block (d), they are commercial zone, residential zone, public service zone, and urban green space zone.

Figure 9.
Importance ranking of features.


Table 1.
Data and sources involved in this paper.
| Data | Data Source |
|---|---|
| GaoFen-2 (GF-2) images | China Centre for Resources Satellite Data and Application |
| Google Maps images | Google Maps |
| Road network | OpenStreetMap (OSM) |
| Point of interest (POI) data | Amap and Baidu map |
| Geotagged check-in data | Weibo application |
| Real-time Tencent user (RTU) data | Tencent Easygo application |
Table 2.
Building-level metrics of TAZs.
| Type | Building-Level Index | Description |
|---|---|---|
| Area | BA_MN | Mean of building area |
| BA_MAX | Maximum of building area | |
| BA_SD | Standard deviation of building area | |
| BA_P | Percentage of building area | |
| Edge | BE_MN | Mean of building perimeter |
| BE_SD | Standard deviation of building perimeter |
Table 3.
Landscape metrics of TAZs.
| Landscape Index | Description |
|---|---|
| L_LPI | Percentage of the parcel comprising the largest patch. |
| L_ED | Edge density of all patches within the parcel. |
| L_PD | Patch density of all patches within the parcel. |
| L_SHDI | Shannon’s diversity index, based on information theory; measures the complexity of the structure of the parcel. |
| L_CONTIG_MN | Mean contiguity index of all patches in the parcel; assesses the spatial connectedness of cells within a grid-cell patch. |
| L_SHAPE_MN | Mean shape index of all patches in the parcel. Shape index is used to measure the degree of deviation from a square of the same area. |
| L_CONTAG | Contagion index reflects the nonrandomness or aggregation degree of different patch types in the parcel. |
| L_AREA_MN | Mean area of all patches in the parcel. |
| C_PLAND_I | The percentage of land area occupied by impervious surfaces. |
| C_PLAND_V | The percentage of land area occupied by vegetation. |
| C_AREA_MN_W | Mean area of the water patches in the parcel. |
| C_AREA_MN_I | Mean area of the impervious surface patches in the parcel. |
| C_AREA_MN_B | Mean area of the barren soil patches in the parcel. |
| C_SHAPE_MN_V | Mean shape index of the vegetation patches in the parcel. |
| C_PD_W | Patch density of the water patches within the parcel. |
| C_PD_V | Patch density of the vegetation patches within the parcel. |
| C_PD_B | Patch density of the barren soil patches within the parcel. |
| C_AI_W | Aggregation index shows the frequency of different pairs of patch types appearing side by side on the map. AI_W is the aggregation index of the water patches. |
| C_AI_I | AI_I is the aggregation index of the impervious surface patches. |
| C_AI_B | AI_B is the aggregation index of the barren soil patches. |
Table 4.
Confusion matrix of test set.
| Predicted | C | R | P | G | Producer’s Accuracy | |
|---|---|---|---|---|---|---|
| Actual | ||||||
| C | 49 | 6 | 6 | 0 | 80.33% | |
| R | 7 | 113 | 6 | 0 | 89.68% | |
| P | 5 | 17 | 28 | 0 | 56.00% | |
| G | 2 | 0 | 0 | 39 | 95.12% | |
| User’s accuracy | 77.78% | 83.09% | 70.00% | 100.00% | OA = 82.37% | |
C = Commercial zones; R = Residential zones; P = Public services; G = Green space; and OA = Overall accuracy.
Table 5.
Comparison of different metric sets and methods.
| Metrics | B | L | S | H | OA | Kappa | |
|---|---|---|---|---|---|---|---|
| Process | |||||||
| XGBoost | √ | √ | √ | 75.90% | 0.6451 | ||
| √ | √ | √ | 73.38% | 0.6077 | |||
| √ | √ | √ | 73.38% | 0.6095 | |||
| √ | √ | √ | 75.18% | 0.6316 | |||
| √ | √ | √ | √ | 82.37% | 0.7415 | ||
| DecisionTree | √ | √ | √ | √ | 67.75% | 0.5229 | |
B = Building metrics; L = Landscape metrics; S = Semantic metrics; H = Human activity metrics; and OA = Overall accuracy.
Table 6.
Overall accuracy comparison of sample selection methods: active learning and random selection.
Table 6.
Overall accuracy comparison of sample selection methods: active learning and random selection.
| Sample Proportion | Active Learning | Random Selection |
|---|---|---|
| basic 10% | 69.92% | |
| +10% | 75.00% | 71.74% |
| +25% | 79.34% | 77.54% |
| +40% | 80.43% | 79.71% |
Table 7.
The statistical results of sentiment analysis in the functional zone: “mean” represents the mean value of the sentiment score, and “proportion” represents the proportion of positive sentiment Weibo check-in records.
Table 7.
The statistical results of sentiment analysis in the functional zone: “mean” represents the mean value of the sentiment score, and “proportion” represents the proportion of positive sentiment Weibo check-in records.
| Function Types | Mean | Proportion |
|---|---|---|
| C | 0.7056 | 70.98% |
| R | 0.6844 | 68.75% |
| P | 0.6997 | 70.38% |
| G | 0.7516 | 75.89% |
C = Commercial zones; R = Residential zones; P = Public services; G = Green space.
Publisher’s Note: MDPI stays neutral with regard to jurisdictional claims in published maps and institutional affiliations. |
© 2021 by the authors. Licensee MDPI, Basel, Switzerland. This article is an open access article distributed under the terms and conditions of the Creative Commons Attribution (CC BY) license (http://creativecommons.org/licenses/by/4.0/).
Share and Cite
MDPI and ACS Style
Xu, N.; Luo, J.; Wu, T.; Dong, W.; Liu, W.; Zhou, N. Identification and Portrait of Urban Functional Zones Based on Multisource Heterogeneous Data and Ensemble Learning. Remote Sens. 2021, 13, 373. https://doi.org/10.3390/rs13030373
AMA Style
Xu N, Luo J, Wu T, Dong W, Liu W, Zhou N. Identification and Portrait of Urban Functional Zones Based on Multisource Heterogeneous Data and Ensemble Learning. Remote Sensing. 2021; 13(3):373. https://doi.org/10.3390/rs13030373
Chicago/Turabian StyleXu, Nan, Jiancheng Luo, Tianjun Wu, Wen Dong, Wei Liu, and Nan Zhou. 2021. "Identification and Portrait of Urban Functional Zones Based on Multisource Heterogeneous Data and Ensemble Learning" Remote Sensing 13, no. 3: 373. https://doi.org/10.3390/rs13030373
Note that from the first issue of 2016, this journal uses article numbers instead of page numbers. See further details here.