
Achieving High Reliability in Data Acquisition
by
 ,
,
Ivan Šećerov
1, 
Srđan Popov
2,*,
Srđan Sladojević
3, 
Dragana Milin
4,
Lazar Lazić
1,
Dragan Milošević
1 ,
,
Daniela Arsenović
1 and
Stevan Savić
1 1
Climatology and Hydrology Research Centre, Faculty of Sciences, University of Novi Sad, Trg Dositeja Obradovića 3, 21000 Novi Sad, Serbia
2
Faculty of Technical Sciences, Chair of Applied Computer Science, University of Novi Sad, Trg Dositeja Obradovića 6, 21000 Novi Sad, Serbia
3
Faculty of Technical Sciences, Chair of Information and Communication Systems, University of Novi Sad, Trg Dositeja Obradovica 6, 21000 Novi Sad, Serbia
4
PUC Informatika, Bulevar cara Lazara 3, 21000 Novi Sad, Serbia
*
Author to whom correspondence should be addressed.
Remote Sens. 2021, 13(3), 345; https://doi.org/10.3390/rs13030345
Submission received: 21 December 2020
/
Revised: 4 January 2021
/
Accepted: 16 January 2021
/
Published: 20 January 2021
(This article belongs to the Special Issue Integrating Remote Sensing and Urban Informatics)
Abstract
:An urban environment defines a specific micro-climate which directly affects the quality of life in urbanized areas and often has a negative impact on urban populations. Phenomena like urban heat and surface heat islands are direct products of an urban lifestyle. Urban meteorological networks (UMNs) are a tool that can help to better understand and analyze the current situation and make the right decisions about future urban development. Deployed to monitor and record different objects and their states inside urban areas, UMNs build a long-term meteorological data time series database. The most commonly used systems for achieving this goal include wireless sensor networks (WSNs). This paper presents a combined experience in deploying three different WSN systems. During seven years of research in this field, the authors have recognized the importance of data reliability in data acquisition. More importantly, due to the lack of research addressing the reliability of the data received from WSNs by the core segment of the server (processes used in receiving, validating, parsing, and storing data into a database instance), the received data are used in scientific studies without questioning their reliability. To determine the possibility of shifting information provided by the data measured from sensor networks before it is stored in a desired form of database, this paper proposes a highly reliable socket server model. The model is built with high reliability and performance in mind and it includes three major processes, which use a combination of signals and control messages to pass information about their states. A case study is performed using high-end hardware, running a Linux operating system stressed to its limits. Repetition testing revealed inconsistency in the information provided by the operating system to the application layer, which could lead to the loss of information about short-term and rarely occurring monitored objects. The results lead to the conclusion that there is a clear need for a higher level of data reliability in the process of data acquisition by UMNs. The proposed socket server should fill this gap within the server’s core segment.
1. Introduction
Global climate change amplifies a specific micro-climate in urban environments, especially in terms of temperature load and thermal sensation [1]. This micro-climate directly affects the quality of life in urbanized areas [2,3], resulting in increased air/surface temperatures, intensive heatwave and urban heat island (UHI) phenomena, pluvial floods, etc. Today, more than half of the global human population lives in urban areas. It is expected that by 2050, more than two-thirds of the global human population will occupy this type of environment [4].
Studies prove that urban climate directly affects urban inhabitants [5]. In contrast to nature areas, in urban areas, climate is modified in a way that often has a negative impact on the urban population, especially during extreme weather conditions. Artificial surfaces, urban roughness, the density of the urban population, traffic, and urban metabolism have a significant impact on urban climate [6]. These impacts contribute to the creation of UHI [7] or surface urban heat islands (SUHI) [8], which are defined as differences in temperature between built-up urban areas and surrounding rural/non-urbanized areas [9]. UHI intensity is positive in urban areas [10]. Furthermore, heatwaves tend to be more intensive in built-up urban areas, directly affecting public health, urban ecosystems, and local infrastructures, while decreasing human thermal comfort [11,12,13,14]. Beside the thermal load issues, there are pluvial floods, which occur more often during summer periods, when rain intensity is high over short periods of time. In most cases, this directly influences traffic and sometimes even leads to a drastic increase in the consumption of material resources [15]. Differences in air humidity observed in urban areas can vary depending on the current synoptic situation [16] just like with very complex wind directions, which are determined by the orientation of the street buildings [17].
A constant demand for a better quality of living and urban environment imposes a better understanding of the urban climate and its patterns. Different factors lead to varying thermal comfort and discomfort in urban population. This is in direct correlation with urban planning and design, while various studies highlight different bio-climate comfort zones [12]. To create a better urban environment that would ensure a higher quality of living conditions, it is necessary to conduct a detailed analysis and understand urban climate conditions.
In this context, establishing a long-term high-resolution database is of paramount importance. The technical implementation of this goal is exemplified by urban meteorological networks (UMNs). Often, the role of such systems is to collect data from a large number of measurements in short periods of time [18]. The high life span of this type of systems poses a great challenge. The problems with UMNs are associated with rapid technology modifications, a lack of funding, and the specific features of the monitoring area. Over the past few decades, a large number of UMNs have been deployed at different locations with the goal of collecting data about atmospheric conditions in urban areas [19]. This data could also be used in transformative computing, IoT systems, or in smart home energy strategy solutions [20]. The most common implementation of UMNs is wireless sensor networks (WSNs). A WSN system that includes different types of measuring stations (air temperature/humidity, precipitation, and automatic weather stations) is located in the urban area of Novi Sad (Serbia). The ongoing development of Novi Sad’s urban network system (NSUNET), launched in 2013, is co-funded through two European programs: the Interreg-IPA CBC Hungary-Serbia Program (projects URBAN-PATH and URBAN-PREX), the Interreg-IPA CBC Croatia-Serbia Program (project GReENENERGY), and the Horizon 2020–project SENSIBLE (Project Grant: 734331). Through its design, NSUNET (a) proposes new terminology in the system topology, (b) introduces an open data structure in data transmission, (c) integrates a reliable algorithm for data acquisition embedded in the station firmware, (d) provides open data access on the server side, and (e) offers low transmission costs using the GSM providing. The precipitation network includes automatic rain detection and a web-based algorithm used in an early warning system informing about urban floods. Based on the data provided by NSUNET, local government institutions could provide better solutions in urban planning.
The Research Questions involve Data reliability in urban meteorological networks server segment as well as inter-process communication in a wireless sensor networks server segment.
In summary, the main contributions of this paper include:
- (a).
- This is one of very few research studies discussing the core segment (server side) data acquisition environment as a possible point of failure in urban meteorological network systems (UMNs).
- (b).
- There are no clear references to the problem of data reliability within the core segment. Based on seven years of experiences in UMNs research and development, this issue is a clear one.
- (c).
- The proposed model of a socket server addresses the problem of the reliability of received data, offering a high performance solution of data acquisition.
- (d).
- The paper offers an insight into real problems that could happen and are occurring in the core segment.
2. Related Work—Review of the Current WSN Systems and Introduction of Possible Points of Failure in Data Reliability
This research draws on the interdisciplinary studies on urban climatology and applied computer sciences.
2.1. Related Work—A Review of Current WSN Systems
The monitoring and acquisition of various events and conditions in our environment indisputably enable a deeper and easier analysis. Over the past few decades, there have been numerous examples of systems developed and deployed with the goal of detecting such conditions. The acquired data have a wide variety of applications, while opportunities for their utilization are constantly expanded with each use case.
Wireless sensor networks have been identified as a promising alternative to complement conventional water quality monitoring solutions [21]. An advanced vineyard network system was developed and deployed in Italy for meteorological real-time data monitoring in a vineyard [22]. The dispersion of wireless network sensors used in precision farming could lead to Byzantine faults or could be caused by safety factors leading to misinterpretation by the data analysis system [23].
Smart sensing technology enables data streaming from sites to the office, making it possible to monitor and to provide proper inputs for corrosion models [24]. The degree of corrosion of steel in concrete is just one of many examples of different monitoring systems and their implementation in the process of detecting and measuring conditions in our immediate environment [25].
WSNs have become an integral part of urban scenarios [26], including examples such as structural health monitoring of asphalt pavements [27] and a cyber-physical-social design approach for temperature monitoring [28]. The latest research includes opportunistic sensing and attempts to acquire data using devices like mobile phones. Acquired data could be used for crowdedness detection in buses [29] or in the hydro-meteorological monitoring of the densely populated Amsterdam metropolitan area [30].
The Global Positioning System (GPS) used in indoor environments causes huge localization inaccuracies within the Internet of Things (IoT) sensor nodes. In recent times, indoor localization has been based on wireless sensor networks [31]. WSNs are a suitable choice for the sensory layer of ambient intelligence systems [32]. Wireless sensor networks (WSNs) are systems for monitoring data in real time [33]. Measuring stations, which are organized as wireless sensor networks, collect data within defined time intervals, transmit the collected data using different radio technologies, and provide notifications about the critical conditions of monitored objects. The use of WSNs is not limited only to the monitoring of natural phenomena. Wireless sensor networks are expected to monitor expensive equipment in a Smart Grid [34]. The reliability analysis of the condition monitoring network of a wind turbine blade based on WSN is just one of many examples of the variety of WSN applications [35]. Unobtrusive wireless sensors can be embedded into the components of wind turbines [36]. A review of modern solutions applied in industrial plants, together with their integration with wireless sensors on hard-to-reach places (spots where the deployment of wired sensors would require greater financial resources), is often a subject of scientific analysis. The ability to adapt and reconfigure quickly makes WSN monitoring a system of choice in installations prone to hazards. Implementing less complex communication protocols is a prerequisite for reliable data transmission between measuring stations [37]. Due to the rapid development of microelectronics, WSNs have become one of the most active fields in computer network research [38]. A related study presents the possibility of a wireless sensors support in a Fog computing system used in emergency management architectures [39]. The elderly fall location could be accurately determined based on a neural network and the received signal strength of three beacons deployed within a ZigBee-based WSN [40].
Studies about these types of solutions often only analyze the data acquired by the systems and deal with one additional property—data acquisition reliability. To analyze different monitoring instances and their states, the measured data is a mandatory requirement. Frequently, the data acquired by measuring nodes are considered to be absolutely valid and they remain unmodified. Keeping in mind all the phases involved in the process of environment monitoring, reliance on this approach could lead to unreliable conclusions. Occurrences that could modify measured data are present in almost every segment of the acquisition system. First of all, measuring station hardware within the remote segment [41] could modify or perform an incorrect measurement. The analyses of such occurrences pose a significant challenge in terms of data reliability in WSNs. It is subject to discussion whether analyzing the reliability of the WSN hardware with the help of reliability standards would result in accurate estimations or whether this is just a starting point in the analysis, thus making accelerated tests for WSN hardware mandatory [42]. A reliable measuring sensor operation in long term structural monitoring (SHM—process of damage detection and characterization strategies for engineering structures) is an indisputable prerequisite [43].
Nevertheless, the question about data reliability (whether measured data provides an actual record of atmospheric conditions in urban areas), when received by this system, presents a subject of scientific research. Most of the scientific analyses expose possible points of data misinterpretation, starting with the sensors up to the data transmission to the server segment.
2.2. Communication between the Measuring Stations and the Server—Introduction to the Data Reliability Problem in WSNs
Most of the analyses take place on the communication segment between measuring stations and the server, mostly on modulations and signal coding, higher-level transmission protocols, and the WSN network topology. Two widely used network topologies in WSN networks are the mesh topology, implemented in the solutions such as the Trout Lake watershed monitoring network [44], and the star topology [45]. NSUNET is organized as a star topology with only one hop distance from the core segment (Figure 1). Blue boxes represent four different types of measuring stations used in NSUNET WSN system. Text colored in red provides data structures used in transmission of measurements from stations to the core segment while the orange box represents the central, core segment in star topology.
Studies prove that 100% reliability in this type of measuring networks is a challenge, especially on spots where the monitored object is of critical importance. Time-division multiple access (TDMA) networks organized in a mesh topology could meet 99.99% reliability criteria without additional human intervention [46]. Solutions such as reduced ordered binary decision diagrams (ROBDD) could increase the overall communication effectiveness of the measuring station’s infrastructure [47]. The same approach proved itself to be useful in modeling and evaluating signal quality reliability and common-cause failures [48]. Studies also confirm that the reliability of data transmission inside WSN is increased, thereby introducing fault tolerance. They also reveal a lack of further analysis of the relationship between implemented security and reliability [49]. The existing literature reflects a lack of research regarding the use of a hybrid mechanism involving both re-transmission and redundancy-based techniques to provide reliability in WSNs [50]. In order to solve large time delays and accuracy issues, attempts have been made, using Kalman-filter-based data fusion, to make a precise measurement of displacements in civil structures and infrastructures [51]. Energy consumption, data delivery reliability, and coverage are deemed to be the most important factors in this type of sensor networks [52,53]. However, due to possible geographic constraints, WSN deployment does not necessarily ensure strong network connectivity [54].
2.3. Points of Failure
Studies present the results of analyses of different data delivery models, used in wireless sensor networks [55]. Susceptibility to the noise effect and defected sensors are some of the problems that occur in wireless sensor networks [56]. Factors that frequently lead to the malfunctioning of the entire measuring system include continuous network device failures [57]. Keeping in mind that sensor networks are usually deployed in harsh environments, the penetration of WSN imposes a high demand on reliable data storage [58]. Establishing trust between nodes is a prerequisite for any distributed network to function properly and to ensure protection against malicious traffic [59,60]. Trust management can be ensured in the context of WSN [61]. Various network attacks, such as DoS (denial of service), an analysis of possible strategies that could prevent such occurrences, along with introducing experimental modeling, could illustrate the feasibility of trust management as part of a future decision support system [62]. Research proves that a trust-based DA (data aggregation) protocol using data validation and integrity verification in WSN increases data correctness [63]. A distributed data storage protocol, such as ProFlex, should guarantee robustness in data collection [64]. Monitoring and diagnostic WSN operation, especially of all its segments and parts, is an unavoidable aspect of troubleshooting and solving future implementations [65] even with the help of lightweight monitoring systems [66]. Even though fault tolerance analyses indicate possible solutions to the problems, none of them offer a unique technique or algorithm that could apply as a reliable solution to WSN problems [67]. There are recent cases of addressing the problem of data storage reliability in storage nodes, deployed in wireless sensor networks [68]. Analyses and discussions on the problems occurring in the communication between processes in the WSN core segment are seldom documented. Scientific literature deals with general problems of inter-process communication (IPC) within concurrently organized systems [69], communication mechanisms between process [70], and their implementation on kernel and user space libraries [71]. Improvements to the design of high-performance computing (HPC) systems, further monitoring and understanding their operation, still pose a challenge, mostly because of the existence and interaction of a large number of parallel processes [72]. Attempts were made to solve challenges associated with WSN deployment in remote and hazardous areas by using Honeywell’s message handling system [73].
3. Methodology behind the Case Study
To determine the reliability of the acquired data measured by remote stations in WSN system, stored and sent via the transparent data structure [74] used in NSUNET a socket server model has been developed along with its client counterpart. The purpose of the developed solution, is to simulate the transmission and reception of a large number of measurement data to the server. The socket server model (algorithm implemented to detect operating system inconsistencies, which could question received data reliability together with its approach to solve the problems of inter-process communication), is developed as a C language application which listens to defined IP (Internet protocol) addresses on the server. The case study should demonstrate whether the proposed application could become a reliable candidate for the reception of WSN measurements implemented in UMNs.
3.1. High-Demand Socket Server Model
WSN systems development requires analysis of possible points of failures. Such points could pose possible security issues. Based on previous projects, study has been conducted, mainly to determine future courses of development. Previous projects included propriety solutions (Wahastrat, Meriexva) on both segments (remote and core) [75]. Based on the authors’ experience and the need to integrate entire future systems into well established infrastructure and to open data structure that can be used for data transmission [41], the entire core segment of the NSUNET system is based on open-source solutions [41]. Data reliability, in the context of security and potential threats, for these solutions is a topic for future works. The development of a highly reliable socket server (HRSS) follows this design and it is in line with the concepts underlying Linux operating systems. Requirements, demands, and the rapid development of software solutions unconditionally influence the application design. Portable software is the basis for a vast number of developed solutions, mostly because of its affordability and rapid development. Sometimes portability is also required [76]. Segments requiring performance and high operation reliability could shift the development process towards a different approach. Since the case study presented in this paper analyzes the reliability of the core segment in the proposed systems, in a large number of concurrently distributed measurements, the emphasis in the HRSS design is placed on high data reliability. The programs developed using the concurrent design are mostly based on threads, which define the key model integrated in current computers, programming languages, and operating systems [77], mostly because of the access to the same memory locations. In concurrent software development, race conditions that often occur in this approach are a frequent source of problems that undermine such solutions [78]. Other mechanisms used in IPC are shared memory and pipes [79]. Shared memory introduces mutual exclusion of critical sections (mutex) [80]. Message queues could remain in the operating system until they are read or explicitly deleted, which is a case similar to using shared memory.
Keeping in mind the aforementioned facts, HRSS development is based on the following premises: the specific operational role of each process determines its role in the system. Within the HRSS model, there are three main processes: core, accept, and control. An additional process group is defined as the worker.
3.2. Core Process Role
The core process is the main, parent, and process of the entire HRSS system and it has a double role: (a) to create the accept and control processes using the traditional UNIX fork() call; (b) to monitor their state and to perform a system respawn if one of the child processes has ended prematurely. Each process in the HRSS system remains blocked in read() (except for the accept process, which is blocked with a Linux accept() call).
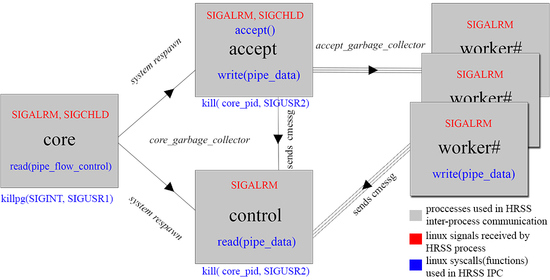
Based on the POSIX standard (Portable Operating System Interface) documentation which guarantees the development of two signals of the same type to the process, the HRSS model uses four signals for its inter-process communication: SIGALRM, SIGINT, SIGUSR1, and SIGUSR2 (Figure 2).
The role of SIGINT is defined only to intentionally terminate the operation of the entire system. Each process, based on a predefined time interval, interrupts its operation with the delivery of SIGALRM, whose role is defined as being a maintenance one. When the core process reaches its maintenance stage, a check for the system suspend state is performed. The maintenance mode also includes a process list loop for child processes, which performs waitpid(). If a child is not active anymore, then SIGUSR1 is sent to the entire process group that defines a critical error. The SIGUSR1 received by the core process defines a system respawn, which starts new instances of the accept and control processes. The delivery of SIGCHLD to the core process initializes a best-effort scenario and resets the process list value (if the checked child process is not active anymore). If one of the child processes detects an error inside its code, then SIGUSR2 is sent to the core process, informing it that the operation of the system is not reliable anymore, leading to the shutdown of the entire system (if such a mode is defined during the compilation time).
3.3. Accept, Control and Worker Processes
Each process (except accept) remains blocked in a read() call. A core process listens on pipe_flow_control. The use of this pipe is left for future implementations and it should expand information about the critical work of its child process. The role of the control process is to log information about the system’s operation. Remaining blocked on pipe_data, it receives control messages from the accept and worker processes. Besides logging, the control process provides a comparison of the system operation statistics between all processes, making information about the system reliability more detailed. The communication inside pipe_data is defined using control messages, which allows for the control process to recognize different states in other processes. Maintenance is initiated with SIGALRM, which checks inside the control and accept processes for the state of the core process. If the core process is not active anymore, then control and accept perform a smooth exit.
The role of the accept process is to listen to network connections on the configured socket. The time spent without being blocked in an accept() call could lead to a missed client request. Furthermore, this could lead to a loss of the measured data and, from a global perspective, a loss of information about the state of the monitored object. A new client connection triggers the fork of the new worker process (if there are a sufficient number of free slots in the process list). The worker role is to receive and manipulate data from the client connection. To free space in the process list, an accept_garbage_collector is activated, performing waitpid() on each entry and resetting the current value, if a child has been reaped. Since the design of the model is based on high operation reliability, when the maximum number of running worker process is reached, then the accept process will gracefully exit (configurable using the pre-processor macro value).
The signals SIGINT, SIGALRM, and SIGUSR1 have the same function as the one used in the control process with the additional accept_garbage_collector execution. The delivery of SIGCHLD in the main code of the accept process is followed with the best-effort scenario. Before blocking itself in an accept() call, the maximum allowed number of running worker processes is checked together with the maximum number of allowed slots in the process list.
Whether client connection will remain active during the accept_garbage_collector operation, or it will be dropped, depends only on the implementation of a system network stack, which makes the efficiency of accept_garbage_collector highly important. The failure to free a slot in the process list within this time frame could lead to a loss of the measured data.
The role of the worker process is to address the connected client. When a process starts, a HTTP parser is invoked to gather the data sent from the client and exit gracefully (if no errors have occurred). SIGALRM in the worker process defines the HTTP session timeout.
The final code segment in all processes, as well as the maintenance part, are always followed by the key variable output. The analysis performed on this data provides information about the reliability of the HRSS system.
Signal handlers implemented in the core, control, and accept processes increment the statistical variables about the operation of the system and set the global processes.handler value. To ensure that a process spends as little time as possible in the signal handler code, the processes.handler variable is used to provide information to the main code, which signals specific operations to perform. An exception to this is the signal handler defined for SIGCHLD. Based on the HRSS model, the information about this condition is not acceptable, although it is possible that SIGCHLD is missing. Therefore, to optimize the signal handler performance, a best-effort scenario is invoked. If the waitpid() of the previous SIGCHLD signal handler has detected that a child is still running, its state is checked again. Within the accept process, the process list is checked for the child’s pid, facilitating a free slot. When working with a large number of client connections within a short period, a large number of SIGCHLD signals may be dropped by the operating system, making the accept process unaware of the states of its child processes. Even though this does not directly lead to the question of data reliability within HRSS inter-process communication, loss of information about end of child process work (SIGCHLD reception) would make HRSS work less reliable. To solve this problem, several mechanisms are implemented in the entire HRSS system.
3.4. Data Flow and Control Messages
During operation, each process in the HRSS system sends information about its current state to the control process, together with statistical variables. This redundant information about the operation of the system is used in the reliability analysis of the HRSS system. Most variables that contain information about the operation of the system are organized as C language data structures. The data flow between processes is performed using the S_ipc_messg structure. To maintain successful communication while using pipe_data flow, lightweight protocol has been developed, enabling the control process to determine the type of information and its origin. Every received packet includes the sender’s pid, a control message (numerical value identifying packet type), and payload (messages delivering numerical data).
3.5. Extreme Cases of System Operation
The HRSS model was developed to cope with a large number of concurrent client connections. This approach can starve the resources of the underlying operating system, especially when the maximum number of allowed processes per system and control group is reached. During its initial code segment, the core process gets values for the maximum number of the soft and hard limits of active processes. Each time a new client connection is received, if the number of active worker processes reaches the stored value for the soft limit, then the accept process will yield() to give the dispatcher a chance to finish some of the active worker processes code. At the moment when the hard limit is reached, the client connection will be dropped. To prevent this, the accept process includes a connection scheduler, whose role is to help the dispatcher in finishing the active worker processes more efficiently. Utilization per specific cpu core(s) is an additional feature that makes HRSS more adaptable to specific hardware.
The HRSS system includes many options defined as C language macro values. The levels of the output of debug messages is defined in the same manner.
The maintenance mode in the core process also performs checks for log partition usage. If the defined limit is reached, the core process uses the same mechanism as that implemented for the delivery of SIGINT. In this case, the core process modifies the suspended processes value. It is only when log partition usage is lowered that the core process will respawn the system and create the accept and control processes.
3.6. Discussion about the Operation of the HRSS System
The HRSS system uses the UNIX fork() call as a method of creating child processes. This excludes any race-conditions and locking the critical code sections in the system design. Small control messages and data flows between all processes are organized using only two pipes. It has been demonstrated that control messages sent through pipes in combination with a single signal as a means of communication between processes are an effective solution. Organizing each process per its role adds additional effectiveness to the HRSS system. The core process creates two child processes (accept and control) and during its operation, it is in charge of monitoring their state and log file usage. All instructions toward child processes are made using the signal. The role of the control process is to log the current system status. The accept process is in charge of listening on the network socket for client connections and maintaining information about its worker processes. Both the accept and control processes check for the overall system state by maintaining information about the core process. All other additional operations, such as analyzing the received data, storing data into files, storing data or in some form of a database structure, have fallen upon worker processes. Any additional requirements related to the expanding of system abilities can be done in the worker code.
4. Case Study
To present valid information about reliability in IPC data exchange, the HRSS system operation should be pushed to its limits.
4.1. Case Study—Ipc in the Acquisition of Large Time Series
A highly reliable test client (HRTC) in charge of simulating a large number of connections, based on the same design as HRSS, has been developed. The main differences between HRSS and HRTC is that the latter’s core process populates the process list with child pids and creates all child processes in a single turn. The created child processes simulate data measured by sensors, create HTTP sessions to the HRSS worker process, and transfer pseudo climate data. Each successful data connection is followed by the CMESSG_REQ_TERMINATE control message to the core process. In response, the core process acknowledges SIGUSR1 so that a child can finish its code. While waiting for SIGUSR1, the child remains blocked in read() call on pipe_fd_core_2_child, which is implemented for future purposes. If SIGUSR1 is not received before SIGALRM, the child will inform the core process using the CMESSG_WORKER_TIMEOUT and finish its code gracefully.
Until the child processes remains active, core performs maintenance triggered with SIGALRM by running core_garbage_collector. When all child processes finish their work, core_zombie_tracker is activated to reap any missed child; it is followed by SIGUSR1, sent to the entire process group. HRTC implements the same method of providing information about its operation as HRSS.
The case study was performed on three server-oriented IBM/Lenovo Xeon dual processor computers, with aggregated links to 2 Gbps (HRTC1 and HRSS instances) and 4 Gbps (HRTC2 instance) connected in a layer 2 Allied Telesis AT9000 switch. The test was expected to provide information about inter-process communication reliability within the HRTC/HRSS system instances, making all implemented features that could prevent this deactivated. A series of data sent via HRTC1/2 used the measurement sent from the URBAN-PREX AWS station [81] defined as:
#define HTTP_CONTENT_MESSAGE_WORKER “107!2020-8-2 21:40:2!+0.000+0.000+0.000!+0.000+0.000+1.306!+21.56+0+0.00!+0.00+0.00+0.00!+0.00+0.00+0.00!215!188!0!0 × 638980!21\r”
4.2. Initial Tests
The initial tests placed both instances (HRTC, HRSS) on each of the three computers used in the case study. The communication between processes using pipes was monitored via 10,000 and 20,000 simultaneous client connections with a timeout set to 60 (core) and 240 s (child processes). Both cases were successful (Table 1). The time required for the 20,000 concurrent processes (HRTC1 192 s, HRTC2 170 s, and HRSS 187 s) to finish their operations was 2.5 (HRTC1), 2.8 (HRTC2), 2.4 (HRSS) times longer than in case of the 10,000 concurrent processes.
The second test involved communication using the network socket and data transmission via the HTTP protocol. The overall number of simultaneous client connections was 10,000, while the maintenance timeout for HRSS processes was 5 and 50 s for the accept and worker, respectively, while the control and core maintenance was set to 1 s. HRTC1 needed 302 s to send all data, while HRTC2 performed the same task in 69 s. The number of sent CMESSG_REQ_TERMINATE messages in HRTC2 was 10,000. The HRTC1 client delivered only 6733 CMESSG_REQ_TERMINATE control messages. The operating system TCP stack returned 3267 ‘Connection timed out’ errors, while only 194 child processes finished the code successfully. The SIGALRM timeout was reached in 6539 child processes.
Out of 20,000 expected connections, HRSS received 16,716 (confirmed with a control message of the type: CMESSG_WORKER_REACHED_END_LABEL); 3 CMESSG_WORKER_TIMEOUT had confirmed an interrupted HTTP connection before all 91 bytes were received. The maximum number of connections per second was 217, while the average amount was 80. The number of simultaneously running HRSS worker processes totaled 15,408. Even though it was expected that the number of failed HRTC1 connections (3267) would match the number of HRSS errors, HRSS detected 3284 uncompleted connections.
During the tests, the number of sent bytes measured by the Linux netfilter on both clients was equal to the number of received bytes on the server HRSS instance. Reliable information about errors was not received by the operating system during the performed test.
The following series of testing was expected to prove a higher consistency in data transmission by increasing intervals between each HRTC fork() (FORK_DELAY in nanoseconds). A series of 100 consecutive HRSS invocations calculated the value for FORK_DELAY (70,000 nanoseconds), which resulted in a lack of errors in data transmission.
By using 70,000 nanoseconds as the timeout between each fork(), 100 consecutive HRTC invocations were performed. If an error was detected, then the delay between each loop increased by one second. Out of expected 2,000,000 (10,000 × 100 × 2) connections, HRSS received 1,990,642 (9358 failed to reach accept() call). The maximum number of simultaneous connections was 246, while the number of simultaneous running HRSS worker processes totaled 60,000. The client HRTC1 detected 261 errors, while HRTC2 detected 621 errors. The frequency of the delay variable in HRTC1 (time between each HRTC invocation) was 30 and 39 for delay == 2 and delay == 3, respectively. In HRTC2, the frequency for the same variable was 40 and 27 for delay == 1 and delay == 2, respectively. During these tests, the HRSS accept process successfully detected documented errors (man accept(2), accept(3p)) while accepting Linux system call. HRSS included the variable stats.socket_accept_default_errors, which would detect errors undocumented in man pages. Throughout the operation of HRSS, this variable value should be equal to zero. However, HRSS detected undocumented system errors using stats.socket_accept_default_errors (Table 2).
To confirm the influence of FORK_DELAY on reliability between IPC, a series of 1000 HRTC repetitions should increase its value by 500,000 nanoseconds, if errors occur. The initial FORK_DELAY was 700,000 nanoseconds, while the maximum detected in HRTC1 was 10,200,000 nanoseconds (45.6% of cases). The calculated value for HRTC2 was 2,700,000 nanoseconds. In 42.8% cases, the HRTC2 client calculated the FORK_DELAY value of 1,200,000 nanoseconds (Figure 3). The number of lost HRSS connections was 133,004. The total number of simultaneously running HRSS processes was 59,996, with a maximum of 241 connections per second (most of the time, the interval was between 201 and 291 connections per second). HRSS detected 28 stats.socket_accept_default_errors (Table 3). There were 116,261 detected errors in HRTC1 operation (86.1% cases with no errors), while HRTC2 produced 766 errors (99.6% cases with no errors).
4.3. Final Pseudo Climate Data Reliability Check
The final test was expected to prove high reliability in pseudo climate data transmission using a large number of simultaneous client connections. The delay between each data packet sent (FORK_DELAY) is set to the detected value of 10,200,000 nanoseconds. During 1000 repetitions, both HRTC clients should produce a transmission without errors, while HRSS should successfully process all 20,000,000 connections.
Both HRTC clients successfully performed 1000 loops with 10,000 child connections per each loop. The minimum time required to send data per turn for HRTC2 equals to 139 s, while the longest transmission was 230 s. In case of HRTC1, the fastest turn took 169 s, while the longest took 231 s. While time frequencies between two consecutive transmissions in HRTC2 did not show a pattern, time frequencies in HRTC1 were grouped around 172, 173, 174, and 175 s. HRSS successfully processed all 20,000,000 transmissions, with the maximum of 127 connections per second (in most cases, 118 connections per second). The maximum detected simultaneous HRSS processes totaled 34,679.
5. Conclusions
To monitor and collect information about urban climate conditions in Novi Sad region (Serbia), the NSUNET system has been developed as result of four international European projects (URBAN-PATH, URBAN-PREX, GReENENERGY and SENSIBLE), co-funded through the Interreg-IPA CBC Hungary-Serbia, Croatia-Serbia Program and Horizon 2020. It includes 28 measuring stations with additional 19 precipitation stations, placed within an area of 102 km2 in the Novi Sad urban area as well as four automatic weather stations monitoring outdoor human thermal comfort. The time series collected by NSUNET should provide information about differences between intra- and inter-urban environments. The temporal resolution allows the exploration of both diurnal and seasonal peculiarities. The acquired knowledge should contribute to the effectiveness of sustainable development and future climate-conscious urban planning strategies, to the mitigation of the current impacts of global climate change, and the maintenance of the health status of the current and the future urban population. The system’s design provides urban citizens with both early warnings of extreme weather conditions and reliable information about weather conditions in the monitored urban area. The process of collecting large time series of climate data is a requirement for successful scientific analyses.
Modern scientific research provides scarce information about the operation of urban meteorological networks, and especially about data structures used in data transmission. Algorithms used for error detection in deployed WSN systems are seldom discussed in scientific literature. Such systems remain “closed” solutions, due to which the reliability of the provided data is not tested. The lack of this information degrades and, above all, slows down the development of urban meteorological networks.
The segments of the NSUNET system ensure high data reliability as measured by station sensors. Since the remote segment is defined as low-resource hardware, the reliability of measured data is performed before the activation of the GSM modem. The modem and some of the implemented sensors include firmware. These are the “closed” points in terms of data reliability. Upon a successful data delivery to the core segment, a data reliability check is performed.
The core segment is a point with the most complex code in the entire system. The complexity of the operating system, the FTP and WEB server instances, and data flow from the network interface to the file as the final result of the measured data offer an opportunity for data modification. To determine the reliability of collected climate data provided by remote measuring stations, for the purpose of this case study, the data acquisition system has been developed (HRSS), together with its client segment (HRTC). The final result of this system development is its integration in NSUNET’s core segment as a data input module. HRTC/HRSS records information about its operation on multiple points. Each running process monitors and stores its states, as well as the states of other processes. These attributes make it possible to detect the origin of each error.
The tests included in the case study were performed on three server-oriented computers (two running a HRTC instance and one running a HRSS instance). The initial tests proved a high reliability in inter-process communication between the large number of running processes. Further activation of the network socket and the transmission of 10,000 pseudo climate measurements using the HTTP protocol showed inconsistencies in the information provided about detected errors. This information was not passed to the application level. The case study network environment included aggregated links to 2 Gbps and 4 Gbps used in HRTC/HRSS communication. It was observed that the intensity of the simultaneous client data transmission should be lowered. Sending data without delay between new client connections produced undesired effects. The client side TCP/IP stack provided information about the network connection timeout (even though the HRTC child spent less time running). The server side network socket received no information about new connections (HRSS accept() call). In addition, the C language global errno variable, which should contain information about detected errors (notified in accept() call), contained an undocumented value in a small number of cases. During the transmission time, all participants in the network environment produced a valid number of sent/received data (packets marked by the Linux net-filter).
Data reliability in the HRTC/HRSS system inter-process communication reaches an adequate quality level due to the introduction of a delay between each fork() call. The value detected in the tested environment, which produces desired results, is equal to 10,200,000 nanoseconds. The number of running HRSS processes directly influences the IPC reliability in the transmission of measured climate data. This process can be active or placed in a zombie state (parent process does not receive information about it). In addition to this cause, there is a lower intensity of client data transmission. The critical value for the test environment is around 35,000 active HRSS worker processes. Method of detection of possible data reliability failure implemented in proposed socket server model, proved that it can provide a clear picture of the reliability of UMNs measurements sent to the core segment. An implemented mechanism of inter-process communication solves possible problems of data loss in current Linux operating systems.
The intensity of pseudo climate data transmission tested in the case study environment is not a scenario in which urban meteorological networks are used. The monitoring and early warning of rare and short-term urban climate details demand a high degree of reliability in urban meteorological networks. To determine this degree, the case study environment must be able to make the tested system work within its limits. Even though the final test produced the expected results, the lack of constant reliability of the information provided to the application layer about detected errors was not adequate in the context of this analysis.
The concepts of the HRSS worker processes in the proposed socket server model does not require simultaneous access to same variable. Modifying the data structure used in the monitoring of the worker process could allow the proposed HRSS model to introduce concepts of threads in its design. This should lower the impact on the underlying operating system, while the principles of the HRSS design should remain unchanged. The proposed modification would allow a parallel analysis of both concepts, thereby increasing the reliability of climate data in urban meteorological networks and information that they provide.
The analysis and improvement of the current points that lead to inconsistencies in the Linux operating system used in HRSS data acquisition are topics for future studies. Critical network oriented services place their instances on operating systems with low network latency, such as FreeBSD. Porting HRTC/HRSS code and adapting it to such environments should provide new information about the degree of reliability in urban studies.
The HRSS socket server model could find its place as an input module in acquisition systems where data reliability is highly demanded. Even though it places a high burden of performance due to context switching, it has proven itself to be adequate when reliably accepting approximately 104 simultaneous connections in a high bandwidth network environment.
Author Contributions
I.Š.: Conceptualization, Methodology, Software, Investigation, Writing-Original Draft, Writ-ing-Review & Editing. S.P.: Conceptualization, Methodology, Writing-Review & Editing, Valida-tion. S.S. (Srđan Sladojević): Writing-Review & Editing, Validation. D.M. (Dragana Milin): Writ-ing-Review & Editing, Validation. L.L.: Writing-Review & Editing, Resources, Validation. D.M. (Dragan Milošević): Writing-Review & Editing, Validation. D.A.: Writing-Review & Editing, Val-idation. S.S. (Stevan Savić): Funding acquisition, Writing-Review & Editing, Validation. All authors have read and agreed to the published version of the manuscript.
Funding
This research was funded by Horizon 2020-project SENSIBLE (Project Grant: 734331).
Informed Consent Statement
Not applicable.
Data Availability Statement
The data presented in this study are available on request from the corresponding author. The data are not publicly available due to security issues.
Acknowledgments
This study is a result of the following projects: URBAN-PATH project funded by the Interreg-IPA CBC Hungary-Serbia Program (Project Grant: HUSRB/1203/122/166). (a) URBAN-PREX project by the Interreg-IPA CBC Hungary-Serbia Program (Project Grant:HUSRB/1602/11/0097). (b) GReENERGY project by the Interreg-IPA CBC Croatia-Serbia Program (Project Grant: HR-RS290). (c) This research is partly supported by the Ministry of Education, Science and Technological Development of the Republic of Serbia (Grant No. 451-03-68/2020-14/200125).
Conflicts of Interest
We declare that we have no financial and personal relationships with other people or organizations that can inappropriately influence our work, there is no professional or other personal interest of any nature or kind in any product, service, and/or company that could be construed as influencing the position presented in, or the review of the manuscript entitled. The title of our manuscript is “Achieving high reliability in data acquisition”.
References
- Hoegh-Guldberg, O.; Jacob, D.; Taylor, M.; Bindi, M.; Brown, S.; Camilloni, I.; Diedhiou, A.; Djalante, R.; Ebi, K.L.; Engelbrecht, F.; et al. Impacts of 1.5 °C Global Warming on Natural and Human Systems. In Global Warming of 1.5 °C; An IPCC Special Report on the Impacts of Global Warming of 1.5 °C above Pre-Industrial Levels and Related Global Greenhouse Gas Emission Pathways, in the Context of Strengthening the Global Response to the Threat of Climate Change, Sustainable Development, and Efforts to Eradicate Poverty; Masson-Delmotte, V., Zhai, H.-O.P., Pörtner, D., Roberts, J., Skea, P.R., Shukla, A., Pirani, W., Moufouma-Okia, C., Péan, X., Pidcock, S., et al., Eds.; 2018; Available online: https://www.researchgate.net/publication/329988490_Chapter_3_Impacts_of_15C_global_warming_on_natural_and_human_systems_In_Global_Warming_of_15_C_An_IPCC_special_report_on_the_impacts_of_global_warming_of_15_C_above_preindustrial_levels_and_related_gl (accessed on 20 January 2021).
- EU. Human Health Impacts of Climate Change in Europe; JRC Technical Reports; European Commission, Joint Research Centre, Institute for Prospective Technological Studies: Seville, Spain, 2014; p. 32. [Google Scholar]
- Gehrels, H.; van der Meulen, S.; Schasfoort, F.; Bosch, P.; Brolsma, R.; van Dinther, D.; Geerling, G.; Goossen, M.; Jacobs, C.; de Jong, M.; et al. Designing Green and Blue Infrastructure to Support Healthy Urban Living; TO2 federatie, De samenwerkende organisaties in toegepast onderzoek: Wageningen, The Netherlands, 2016; p. 109. [Google Scholar]
- UN. World Urbanization Prospects—The 2014 Revision; UN Department of Economic and Social Affairs: New York, NY, USA, 2015; p. 517. [Google Scholar]
- Ellena, M.; Breil, M.; Soriani, S. The heat-health nexus in the urban context: A systematic literature review exploring the socio-economic vulnerabilities and built environment characteristics. Urban Clim. 2020, 34, 100676. [Google Scholar] [CrossRef]
- Stewart, I.D.; Oke, T.R. Local climate zones for urban temperature studies. Bull. Am. Meteorol. Soc. 2012, 93, 1879–1900. [Google Scholar] [CrossRef]
- Oke, T.R. The energetic basis of the urban heat island. Q. J. R. Meteorol. Soc. 1982, 108, 1–24. [Google Scholar] [CrossRef]
- Voogt, J.A.; Oke, T.R. Thermal remote sensing of urban climates. Remote Sens. Environ. 2003, 86, 370–384. [Google Scholar] [CrossRef]
- Depietri, Y.; Renaud, F.G.; Kallis, G. Heat waves and floods in urban areas: A policy-oriented review of ecosystem services. Sustain. Sci. 2011, 7, 95–107. [Google Scholar] [CrossRef]
- Memon, R.A.; Leung, D.Y.; Liu, C.H. An investigation of urban heat island intensity (UHII) as an indicator of urban heating. Atmos. Res. 2009, 94, 491–500. [Google Scholar] [CrossRef]
- Wilhelmi, O.V.; Hayden, M.H. Connecting people and place: A new framework for reducing urban vulnerability to extreme heat. Environ. Res. Lett. 2010, 5, 1–7. [Google Scholar] [CrossRef]
- Cetin, M. Determining the bioclimatic comfort in Kastamonu City. Environ. Monit. Assess. 2015, 187, 640. [Google Scholar] [CrossRef]
- Cetin, M.; Adiguzel, F.; Kaya, O.; Sahap, A. Mapping of bioclimatic comfort for potential planning using GIS in Aydin. Environ. Dev. Sustain. 2018, 20, 361–375. [Google Scholar] [CrossRef]
- Savić, S.; Marković, V.; Šećerov, I.; Pavić, D.; Arsenović, D.; Milošević, D.; Dolinaj, D.; Nagy, I.; Pantelić, M. Heat wave risk assessment and mapping in urban areas: Case study for a midsized Central European city, Novi Sad (Serbia). Nat. Hazards 2018, 91, 891–911. [Google Scholar] [CrossRef]
- Prokić, M.; Savić, S.; Pavić, D. Pluvial flooding in urban areas across the European continent. Geogr. Pannonica 2019, 23, 216–232. [Google Scholar] [CrossRef] [Green Version]
- Milošević, D.; Kresoja, M.; Savić, S.; Lužanin, Z. Intraurban analysis of relative humidity and its cross-correlation with air temperature in Central-European city. In Proceedings of the 10th International Conference on Urban Climate Jointly with 14th Symposium on the Urban Environment, New York, NY, USA, 6–10 August 2018. [Google Scholar]
- Savić, S.; Lužanin, Z.; Milošević, D.; Kresoja, M. Intraurban analysis of air temperature in Central-European city. In Proceedings of the 10th International Conference on Urban Climate (ICUC10) with the 14th Symposium on the Urban Environment (SUE), New York, NY, USA, 6–10 August 2018. [Google Scholar]
- Grimmond, C.S.B. Progress in measuring and observing the urban atmosphere. Theor. Appl. Climatol. 2006, 84, 3–22. [Google Scholar] [CrossRef]
- Muller, C.L.; Champan, L.; Grimmond, C.S.B.; Young, D.T.; Cai, X.-M. Sensors and the city: A review of urban meteorological networks. Int. J. Climatol. 2013, 33, 1585–1600. [Google Scholar] [CrossRef]
- Ko, H.; Kim, J.H.; An, K.; Mesicek, L.; Marreiros, G.; Pan, S.B.; Kim, P. Smart home energy strategy based on human behaviour patterns for transformative computing. Inf. Process. Manag. 2020, 57. [Google Scholar] [CrossRef]
- Pule, M.; Yahya, A.; Chuma, J. Wireless sensor networks: A survey on monitoring water quality. J. Appl. Res. Technol. 2017, 15, 562–570. [Google Scholar] [CrossRef]
- Wang, N.; Li, Z. 8-Wireless sensor networks (WSNs) in the agricultural and food industries. Robot. Autom. Food Ind. 2013, 171–199. [Google Scholar] [CrossRef]
- Souza, P.S.S.; Rubin, F.P.; Hohemberger, R.; Ferreto, T.C.; Lorenzo, A.F.; Luizelli, M.C.; Rossi, F.D. Detecting abnormal sensors via machine learning: An IoT farming WSN-based architecture case study. Measurement 2020, 164, 108042. [Google Scholar] [CrossRef]
- Tsai, Y.H.; Wang, Y.; Chien, W.T.; Wei, C.Y.; Wang, X.; Hsieh, S.H. A BIM-based approach for predicting corrosion under insulation. Autom. Constr. 2019, 107. [Google Scholar] [CrossRef]
- Parthiban, T.; Ravi, R.; Parthiban, G.T. Potential monitoring system for corrosion of steel in concrete. Adv. Eng. Softw. 2005, 37, 375–381. [Google Scholar] [CrossRef]
- Carrero, M.A.; Musicante, M.A.; dos Santos, A.L.; Hara, C.S. A DSL for WSN software components coordination. Inf. Syst. 2019. [Google Scholar] [CrossRef]
- Di Graziano, A.; Marchetta, V.; Cafiso, S. Structural health monitoring of asphalt pavements using smart sensor networks: A comprehensive review. J. Traffic Transp. Eng. 2020, 7, 639–651. [Google Scholar] [CrossRef]
- Chen, S.; Lanxue, Z.; Tang, Y.; Shend, C.; Kumar, R.; Yu, K.; Tariq, U.; Bashiri, A.K. Indoor temperature monitoring using wireless sensor networks: A SMAC application in smart cities. Sustain. Cities Soc. 2020, 61. [Google Scholar] [CrossRef]
- Rajput, P.; Chaturvedi, M.; Patel, V. Opportunistic sensing based detection of crowdedness in public transport buses. Pervasive Mobile Comput. 2020, 68. [Google Scholar] [CrossRef]
- De Vos, L.W.; Droste, A.M.; Zander, M.J.; Overeem, A.; Leijnse, H.; Heusinkveld, B.G.; Steeneveld, G.J.; Uijlenhoet, R. Hydrometeorological Monitoring Using Opportunistic Sensing Networks in the Amsterdam Metropolitan Area. Bull. Am. Meteorol. Soc. 2020, 101, E167–E185. [Google Scholar] [CrossRef]
- Sotenga, P.Z.; Djouani, K.; Kurien, A.; Mwila, M. Implementation of an indoor localisation algorithm for Internet of Things. Futur. Gener. Comput. Syst. 2020, 107, 1037–1046. [Google Scholar] [CrossRef]
- De Paola, A.; Gaglio, S.; Re, G.L.; Ortolani, M. Sensor9k: A testbed for designing and experimenting with WSN-based ambient intelligence applications. Pervasive Mobile Comput. 2012, 8, 448–466. [Google Scholar] [CrossRef]
- Wang, A.; Shen, J.; Vijayakumar, P.; Zhu, Y.; Tian, L. Secure big data communication for energy efficient intra-cluster in WSNs. Inf. Sci. 2019, 505, 586–599. [Google Scholar] [CrossRef]
- Ergul, O.; Bicen, A.O.; Akan, O.B. Opportunistic reliability for cognitive radio sensor actor networks in smart grid. Ad Hoc Netw. 2016, 41, 5–14. [Google Scholar] [CrossRef] [Green Version]
- Fu, Z.; Luo, Y.; Gu, C.; Li, F.; Yue, Y.; Yuan, Y. Reliability Analysis of Condition Monitoring Network of Wind Turbine Blade Based on Wireless Sensor Networks. IEEE Trans. Sustain. Energy 2019, 10, 549–557. [Google Scholar] [CrossRef]
- Carbajo, R.S.; Carbajo, E.S.; Basu, B.; McGoldrick, C. Routing in wireless sensor networks for wind turbine monitoring. Pervasive Mobile Comput. 2017, 39, 1–35. [Google Scholar] [CrossRef] [Green Version]
- Islam, K.; Shen, W.; Wang, X. Wireless Sensor Network Reliability and Security in Factory Automation: A Survey. IEEE Trans. Syst. Man Cybern. Part C (Appl. Rev.) 2012, 42. [Google Scholar] [CrossRef]
- Deng, R.; Chen, J.; Fan, J.; Sun, Y. A general approach for building Linux on sensor node Imote2. Comput. Stand. Interfaces 2012, 34, 101–108. [Google Scholar] [CrossRef]
- Campanile, L.; Gribaudo, M.; Iacono, M.; Mastroianni, M. Performance evaluation of a fog WSN infrastructure for emergency management. Simul. Model. Pr. Theory 2020, 104. [Google Scholar] [CrossRef]
- Mahdi, S.Q.; Gharghan, S.K.; Hasan, M.A. FPGA-Based neural network for accurate distance estimation of elderly falls using WSN in an indoor environment. Measurement 2020, 167, 108276. [Google Scholar] [CrossRef]
- Šećerov, I.; Savić, S.; Milošević, D.; Arsenović, M.; Dolinaj, D.; Popov, S. Progressing urban climate research using a high-density monitoring network system. Environ. Monit. Assess. 2019, 191. [Google Scholar] [CrossRef]
- Virkki, J.; Zhu, Y.; Meng, Y.; Chen, L. Reliability of WSN Hardware. Int. J. Embed. Syst. Appl. (IJESA). 2011, 1. [Google Scholar] [CrossRef]
- Smarsly, K.; Law, K.H. Decentralized fault detection and isolation in wireless structural health monitoring systems using analytical redundancy. Adv. Eng. Softw. 2014, 73, 1–10. [Google Scholar] [CrossRef] [Green Version]
- Watras, C.J.; Morrow, M.; Morrison, K.; Scannell, S.; Yaziciaglu, S.; Read, J.S.; Hu, Y.; Hanson, P.C.; Kratz, T. Evaluation of wireless sensor networks (WSNs) for remote wetland monitoring: Design and initial results. Environ. Monit. Assess. 2013, 186, 919–934. [Google Scholar] [CrossRef]
- Reina, D.G.; Toral, S.L.; Barrero, F.; Bessis, N.; Asimakopoulou, E. The role of ad hoc networks in the internet of things: A case scenario for smart environments. In Internet of Things and Intercooperative Computational Technologies for Collective Intelligence; Bessis, N., Xhafa, F., Varvarigou, D., Hill, R., Li, M., Eds.; Springer: New York, NY, USA, 2013; pp. 89–113. [Google Scholar] [CrossRef]
- Doherty, L.; Teasdale, D.A. Towards 100% Reliability in Wireless Monitoring Networks. In Proceedings of the 3rd ACM International Workshop on Performance Evaluation of Wireless ad Hoc, Sensor and Ubiquitous Networks, Terromolinos, Spain, 2–6 October 2006; pp. 132–135. [Google Scholar] [CrossRef]
- Shrestha, A.; Xing, L.; Liu, H. Infrastructure Communication Reliability of Wireless Sensor Networks. In Proceedings of the 2nd IEEE International Symposium on Dependable, Autonomic and Secure Computing, Indianapolis, IN, USA, 29 September–1 October 2006. [Google Scholar] [CrossRef]
- Shrestha, A.; Xing, L.; Liu, H. Modeling and Evaluating the Reliability of Wireless Sensor Networks. In Proceedings of the 2007 Proceedings Annual Reliability and Maintainability Symposium, Orlando, FL, USA, 22–25 January 2007; pp. 186–191. [Google Scholar] [CrossRef]
- Venkatesan, L.; Shanmugavel, S.; Subramaniam, C. A Survey on Modeling and Enhancing Reliability of Wireless Sensor Network. Wirel. Sens. Netw. 2013, 5, 41–51. [Google Scholar] [CrossRef] [Green Version]
- Mahmood, M.A.; Seah, W.K.G.; Welch, I. Reliability in wireless sensor networks: A survey and challenges. Comput. Netw. 2015, 79, 166–187. [Google Scholar] [CrossRef]
- Casciati, S.; Vece, M. Real-time monitoring system for local storage and data transmission by remote control. Adv. Eng. Softw. 2017, 112, 46–53. [Google Scholar] [CrossRef]
- Jeske, M.; Rosset, V.; Nascimento, M.C.V. Determining the trade-offs between data delivery and energy consumption in large-scale WSNs by multi-objective evolutionary optimization. Comput. Netw. 2020, 179. [Google Scholar] [CrossRef]
- Rao, A.N.; Naik, B.R.; Devi, L.N. On the relay node placement in WSNs for lifetime maximization through metaheuristics. Mater. Today Proc. 2020. [Google Scholar] [CrossRef]
- Tao, M.; Li, X.; Yuan, H.; Wei, W. UAV-Aided trustworthy data collection in federated-WSN-enabled IoT applications. Inf. Sci. 2020, 532, 155–169. [Google Scholar] [CrossRef]
- Zahariev, P.Z.; Hristov, G.V. Performance evaluation of data delivery approaches for wireless sensor networks. Procedia Comput. Sci. 2011, 3, 714–720. [Google Scholar] [CrossRef] [Green Version]
- Ayadi, A.; Ghorbel, O.; BenSalah, M.S.; Abid, M. Spatio-temporal correlations for damages identification and localization in water pipeline systems based on WSNs. Comput. Netw. 2020, 171. [Google Scholar] [CrossRef]
- Silva, I.; Guedes, L.A.; Portugal, P.; Vasques, F. Reliability and Availability Evaluation of Wireless Sensor Networks for Industrial Applications. Sensors 2012, 12, 806–838. [Google Scholar] [CrossRef] [Green Version]
- Li, F.; Yang, H.; Zou, Y.; Yu, D.; Yu, J. Joint Optimization of Routing and Storage Node Deployment in Heterogeneous Wireless Sensor Networks Towards Reliable Data Storage. In Wireless Algorithms, Systems, and Applications; Biagioni, E., Zheng, Y., Cheng, S., Eds.; Lecture Notes in Computer Science; Springer: Cham, Switzerland, 2019. [Google Scholar] [CrossRef]
- Momani, M.; Takruri, M.; Al-Hmouz, R. Risk assessment algorithm in wireless sensor networks using beta distribution. Int. J. Comput. Netw. Commun. 2014, 6, 157–166. [Google Scholar] [CrossRef]
- Sun, Y.L.; Yang, Y. Trust Establishment in Distributed Networks: Analysis and Modeling. In Proceedings of the 2007 IEEE International Conference on Communications, Glasgow, UK, 24–28 June 2007; pp. 1266–1273. [Google Scholar] [CrossRef]
- Espositoa, C.; Tamburisb, O.; Suc, X.; Choi, C. Robust Decentralised Trust Management for the Internet of Things by Using Game Theory. Inf. Process. Manag. 2020, 57. [Google Scholar] [CrossRef]
- Yarbrough, B.; Wagner, N.; Wagner, N. Assessing security risk for wireless sensor networks under cyber attack. In Proceedings of the Annual Simulation Symposium, Baltimore, MD, USA, 15–18 April 2018; pp. 1–12. [Google Scholar]
- Anita Daniel, D.; Roslin, S.E. Data Validation and Integrity Verification for Trust based Data Aggregation Protocol in WSN. Microprocess. Microsyst. 2020. [Google Scholar] [CrossRef]
- Maia, G.; Guidoni, D.L.; Viana, A.C.; Aquino, A.A.F.; Mini, R.A.F.; Loureiro, A.A.F. A distributed data storage protocol for heterogeneous wireless sensor networks with mobile sinks. Ad Hoc Netw. 2013, 11, 1588–1602. [Google Scholar] [CrossRef]
- Aboelfotoh, H.M.F.; ElMallah, E.S.; Hassanein, H.S. On the Reliability of Wireless Sensor Networks. In Proceedings of the 2006 IEEE International Conference on Communications, Istanbul, Turkey, 11–15 June 2006. [Google Scholar] [CrossRef]
- Chiang, Y.-H.; Keller, M.; Lim, R.; Huang, P.; Beutel, J. Light-weight Network Health Monitoring. In Proceedings of the 2012 ACM/IEEE 11th International Conference on Information Processing in Sensor Networks (IPSN), Beijing, China, 16–20 April 2012. [Google Scholar] [CrossRef]
- Raji, K.A.; Gbolagade, K.A. A Survey of Different Techniques for Energy-Efficient, Reliability and Fault Tolerant in Wireless Sensor Networks. Int. J. Wirel. Commun. Mobile Comput. 2019, 7, 19–26. [Google Scholar] [CrossRef]
- Yang, H.; Li, F.; Yu, D.; Zou, Y.; Yu, J. Reliable data storage in heterogeneous wireless sensor networks by jointly optimizing routing and storage node deployment. Tsinghua Sci. Technol. 2021, 26, 230–238. [Google Scholar] [CrossRef]
- Hossain, M.A.; Tokhi, M.O. Inter-processor and inter-process communication in realtime multi-process computing. IFAC Proc. 2002, 35, 337–342. [Google Scholar] [CrossRef] [Green Version]
- Shamsudeen, E. A study on inter process communications in distributed computer systems. IOSR J. Eng. (IOSRJEN) 2018, 8, 9–15. [Google Scholar]
- Khaneghah, E.M.; Mirtaheri, S.L.; Sharifim, M. Evaluating the Effect of Inter Process Communication Efficiency on High Performance Distributed Scientific Computing. In Proceedings of the IEEE/IFIP International Conference on Embedded and Ubiquitous Computing, Shanghai, China, 17–20 December 2008. [Google Scholar] [CrossRef]
- Alawneh, L.; Hamou-Lhadj, A.; Hassine, J. Segmenting large traces of inter-process communication with a focus on high performance computing systems. J. Syst. Softw. 2016, 120, 1–16. [Google Scholar] [CrossRef]
- Shahzada, F. Satellite Monitoring of Wireless Sensor Networks (WSNs). Procedia Comput. Sci. 2013, 21, 479–484. [Google Scholar] [CrossRef] [Green Version]
- Šećerov, I.; Savić, S.; Milošević, D.; Marković, V.; Bajšanski, I. Development of an automated urban climate monitoring system in Novi Sad (Serbia). Geogr. Pannonica 2015, 19, 174–183. [Google Scholar] [CrossRef] [Green Version]
- Šećerov, I.; Dolinaj, D.; Pavić, D.; Milošević, D.; Savić, S.; Popov, S.; Živanov, Ž. Environmental Monitoring Systems: Review and Future Development. Wirel. Eng. Technol. 2019, 10, 1–18. [Google Scholar] [CrossRef] [Green Version]
- Mooney, J.D. Developing Portable Software. In Information Technology; Reis, R., Ed.; IFIP International Federation for Information Processing; Springer: Boston, MA, USA, 2014; p. 157. [Google Scholar] [CrossRef] [Green Version]
- Lee, E. The Problem with Threads. Computer 2006, 39, 33–42. [Google Scholar] [CrossRef]
- Von Praun, C. Race Detection Techniques. In Encyclopedia of Parallel Computing; Padua, D., Ed.; Springer: Boston, MA, USA, 2011. [Google Scholar] [CrossRef]
- Hajduković, M. Operativni Sistemi: (Problemi i Struktura), 1 izd. ed; Fakultet Tehničkih Nauka: Novi Sad, Serbia, 2013; p. 281. [Google Scholar]
- Tanenbaum, A.S.; Bos, H. Modern Operating Systems, 2nd ed.; Prentice Hall: Englewood Cliffs, NJ, USA, 2002; p. 951. [Google Scholar]
- Savić, S.; Gál, T.; Milošević, D.; Bajšanski, I.; Zénó Gyöngyösi, A.; Šećerov, I.; Gulyás, A.; Hévizi, B. Development of Adaptation System to Prevent Consequences of Extreme Precipitations and Pluvial Floods in Central European Cities; University of Novi Sad, Faculty of Technical Sciences (UNSFTN): Novi Sad, Serbia, 2019; ISBN 978-86-7031-522-8. [Google Scholar]
Figure 1.
Novi Sad’s urban network system (NSUNET), star topology, and data structures used in communication.
Figure 1.
Novi Sad’s urban network system (NSUNET), star topology, and data structures used in communication.

Figure 2.
A highly reliable socket server (HRSS) system model, process organization, and data flows.
Figure 2.
A highly reliable socket server (HRSS) system model, process organization, and data flows.

Figure 3.
Dynamically detected fork_delay values with corresponding errors in 1000 cases (for HRTC1, to provide better data visibility, only cases with frequent errors are shown).
Figure 3.
Dynamically detected fork_delay values with corresponding errors in 1000 cases (for HRTC1, to provide better data visibility, only cases with frequent errors are shown).


Table 1.
Initial test results. The table provides information about the number of expected and received connections per client.
Table 1.
Initial test results. The table provides information about the number of expected and received connections per client.
| Client | Childs | UNRESPONDING_CHILD_PROC_TIMEOUT | UNRESPONDING_PROC_TIMEOUT | Overall Time Needed | CMESSG_REQ_TERMINATE | Expected Amount of Transfer Bytes | Actual Amount of Transferred Bytes | No. Errors |
|---|---|---|---|---|---|---|---|---|
| HRTC1 | 10,000 | 60 | 240 | 74 | 10,000 | 2,240,000 | 2,240,000 | 0 |
| 20,000 | 192 | 20,000 | 4,480,000 | 4,480,000 | ||||
| HRTC2 | 10,000 | 60 | 240 | 60 | 10,000 | 2,240,000 | 2,240,000 | 0 |
| 20,000 | 170 | 20,000 | 4,480,000 | 4,480,000 | ||||
| HRSS | 10,000 | 60 | 240 | 76 | 10,000 | 2,240,000 | 2,240,000 | 0 |
| 20,000 | 187 | 20,000 | 4,480,000 | 4,480,000 |
Table 2.
Results of 100 consecutive HRSS invocations using a delay between each HRTC fork(). The table presents information about the expected number of connections sent from both clients (HRTC1, HRTC2) and those received by the HRSS.
Table 2.
Results of 100 consecutive HRSS invocations using a delay between each HRTC fork(). The table presents information about the expected number of connections sent from both clients (HRTC1, HRTC2) and those received by the HRSS.
| HRTC1 + HRTC2 | HRSS | Connections per Second | Stats.Socket_Accept_Default_Errors | Total of HRSS Processes | ||
|---|---|---|---|---|---|---|
| expected connections | received connections | lost connections | max | most of the time | 12 | 60,003 |
| 10,000 × 100 × 2 (2,000,000) | 1,990,642 | 9358 | 246 | 209 | ||
Table 3.
Results of 1000 consecutive HRSS invocations using dynamic FORK_DELAY.
| HRTC1 + HRTC2. | HRSS | Connections per Second | Stats.Socket_Accept_Default_Errors | Total of HRSS Processes | ||
|---|---|---|---|---|---|---|
| expected connections | received connections | lost connections | max | most of the time | 12 | 59,996 |
| 10,000 × 100 × 2 (2,000,000) | 19,866,996 | 133,004 | 241 | 201–219 | ||
Publisher’s Note: MDPI stays neutral with regard to jurisdictional claims in published maps and institutional affiliations. |
© 2021 by the authors. Licensee MDPI, Basel, Switzerland. This article is an open access article distributed under the terms and conditions of the Creative Commons Attribution (CC BY) license (http://creativecommons.org/licenses/by/4.0/).
Share and Cite
MDPI and ACS Style
Šećerov, I.; Popov, S.; Sladojević, S.; Milin, D.; Lazić, L.; Milošević, D.; Arsenović, D.; Savić, S. Achieving High Reliability in Data Acquisition. Remote Sens. 2021, 13, 345. https://doi.org/10.3390/rs13030345
AMA Style
Šećerov I, Popov S, Sladojević S, Milin D, Lazić L, Milošević D, Arsenović D, Savić S. Achieving High Reliability in Data Acquisition. Remote Sensing. 2021; 13(3):345. https://doi.org/10.3390/rs13030345
Chicago/Turabian StyleŠećerov, Ivan, Srđan Popov, Srđan Sladojević, Dragana Milin, Lazar Lazić, Dragan Milošević, Daniela Arsenović, and Stevan Savić. 2021. "Achieving High Reliability in Data Acquisition" Remote Sensing 13, no. 3: 345. https://doi.org/10.3390/rs13030345
Note that from the first issue of 2016, this journal uses article numbers instead of page numbers. See further details here.