
The Influence of Green Space Patterns on Land Surface Temperature in Different Seasons: A Case Study of Fuzhou City, China

 , ,
, ,
Abstract
: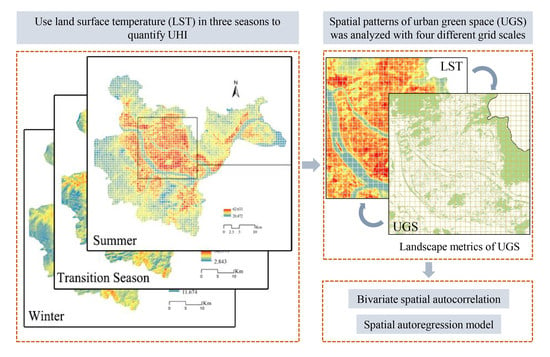
1. Introduction
2. Methods
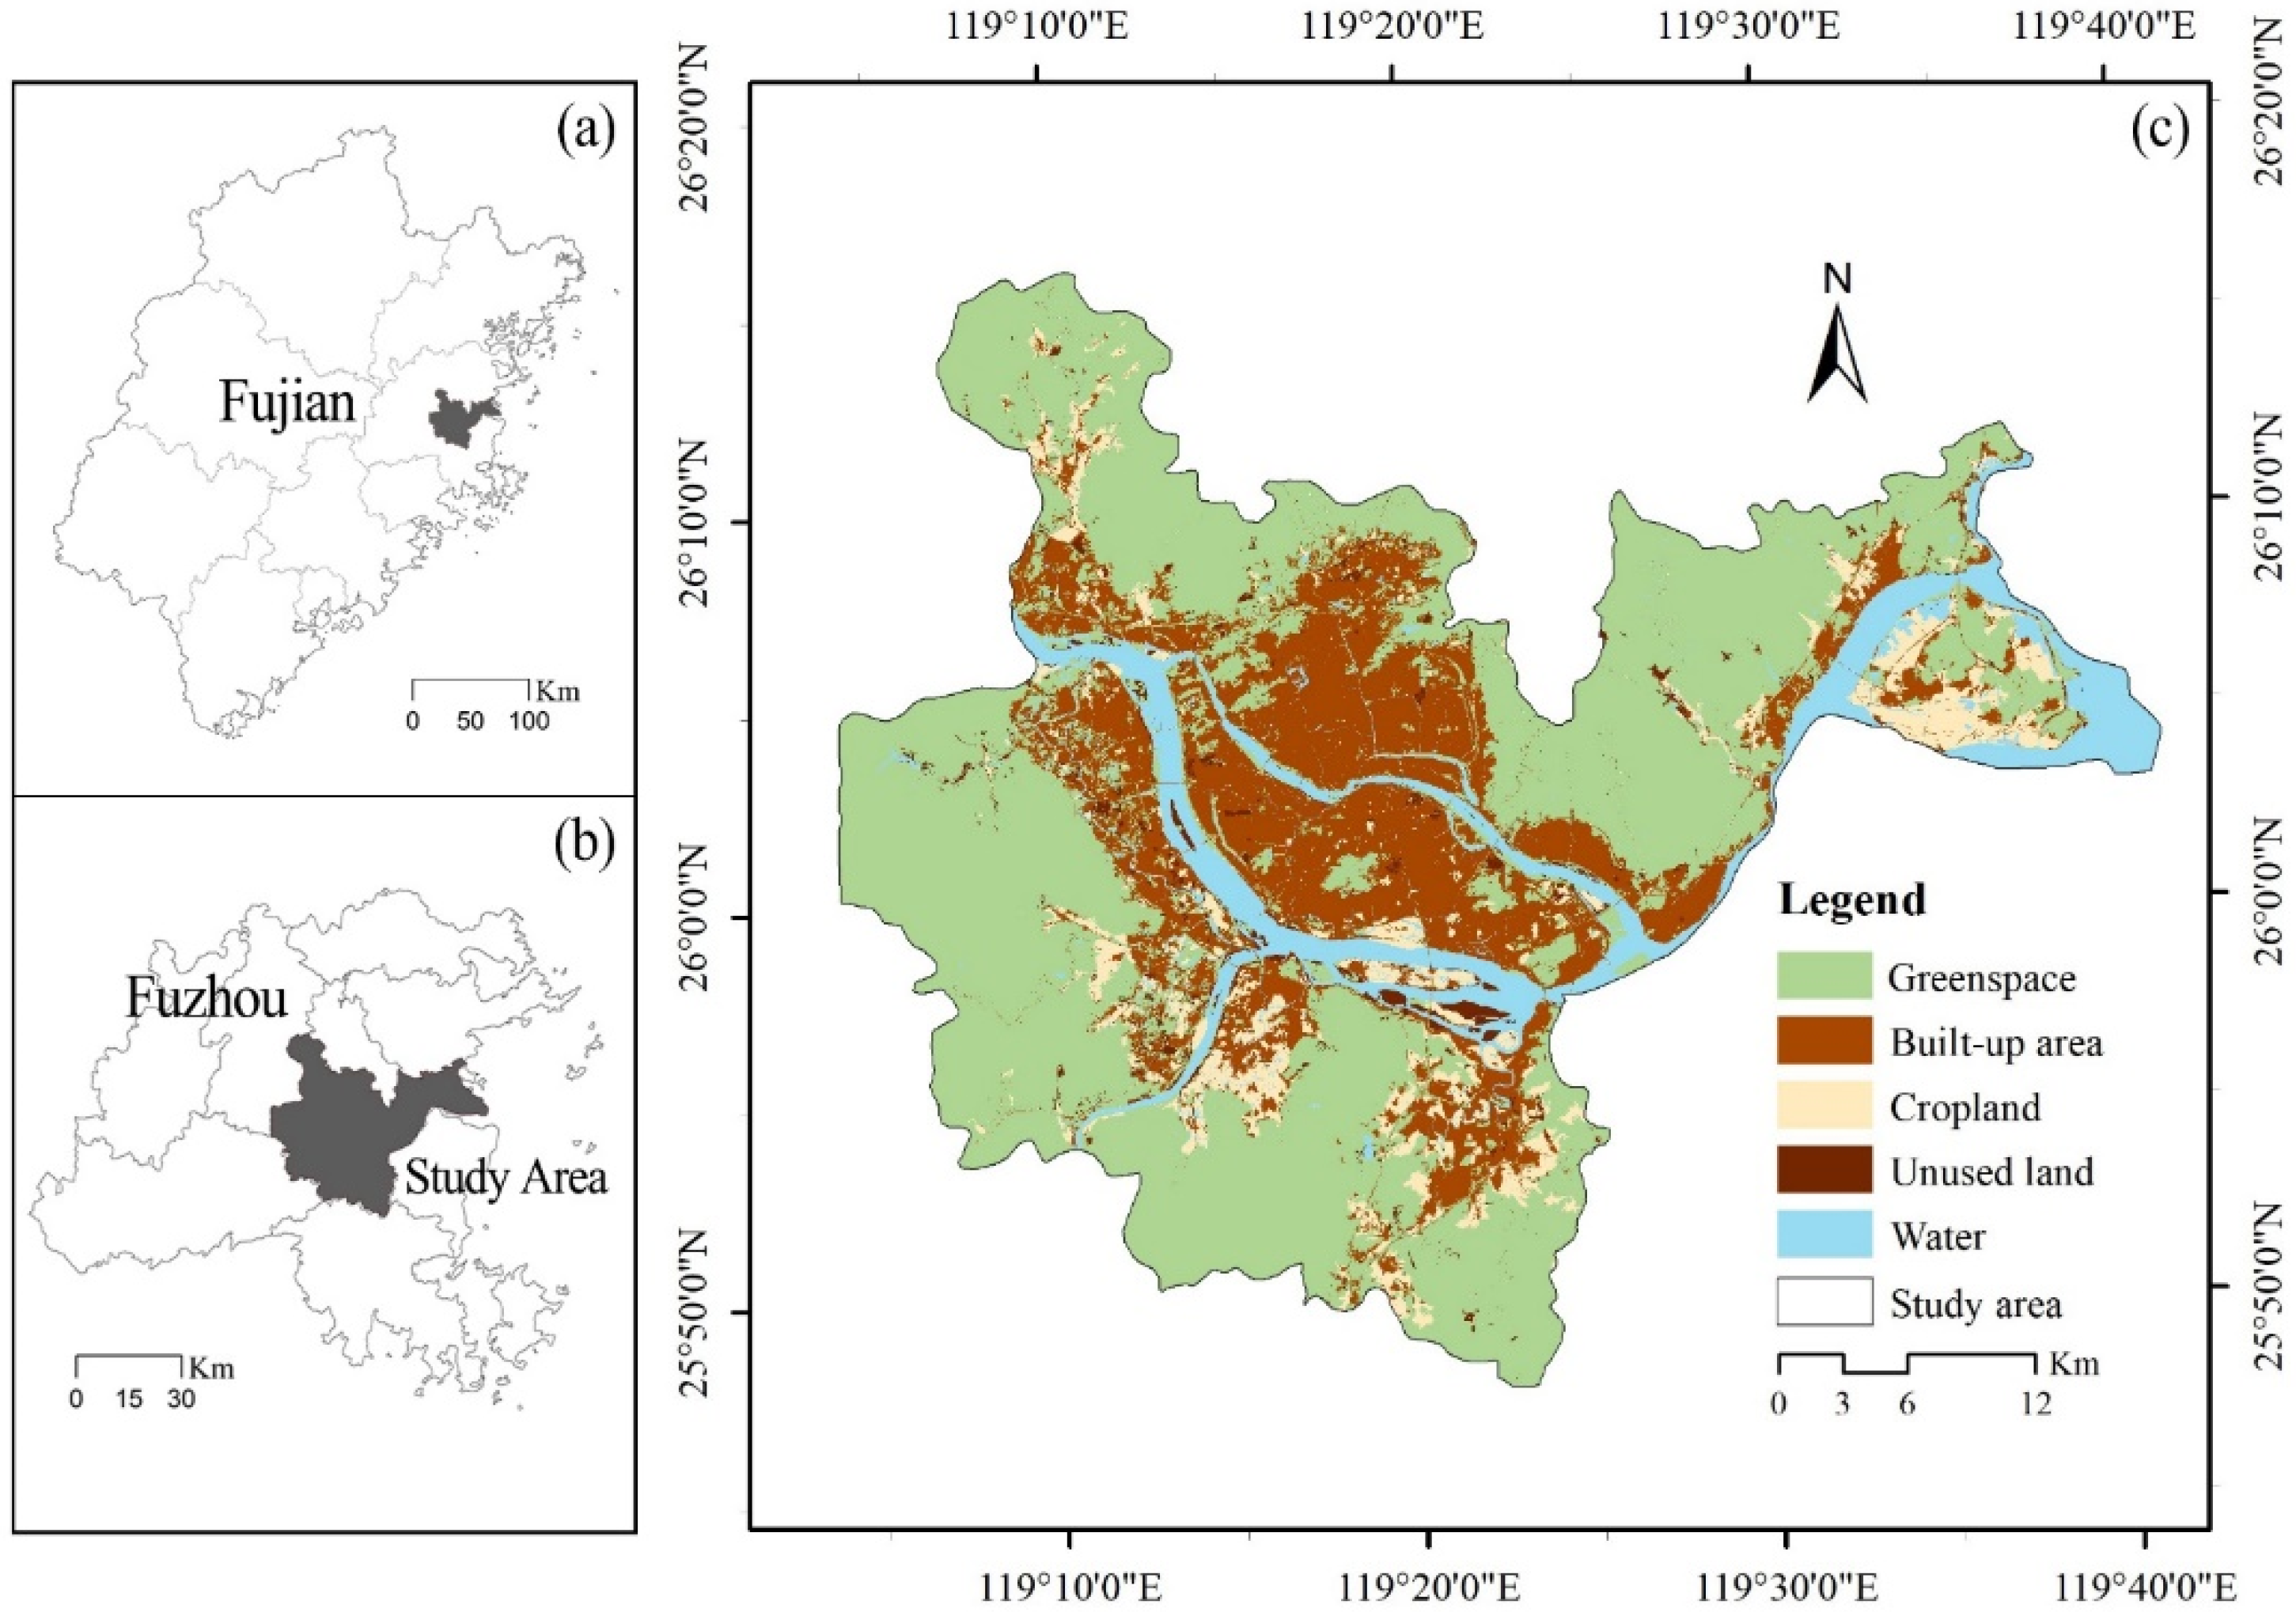
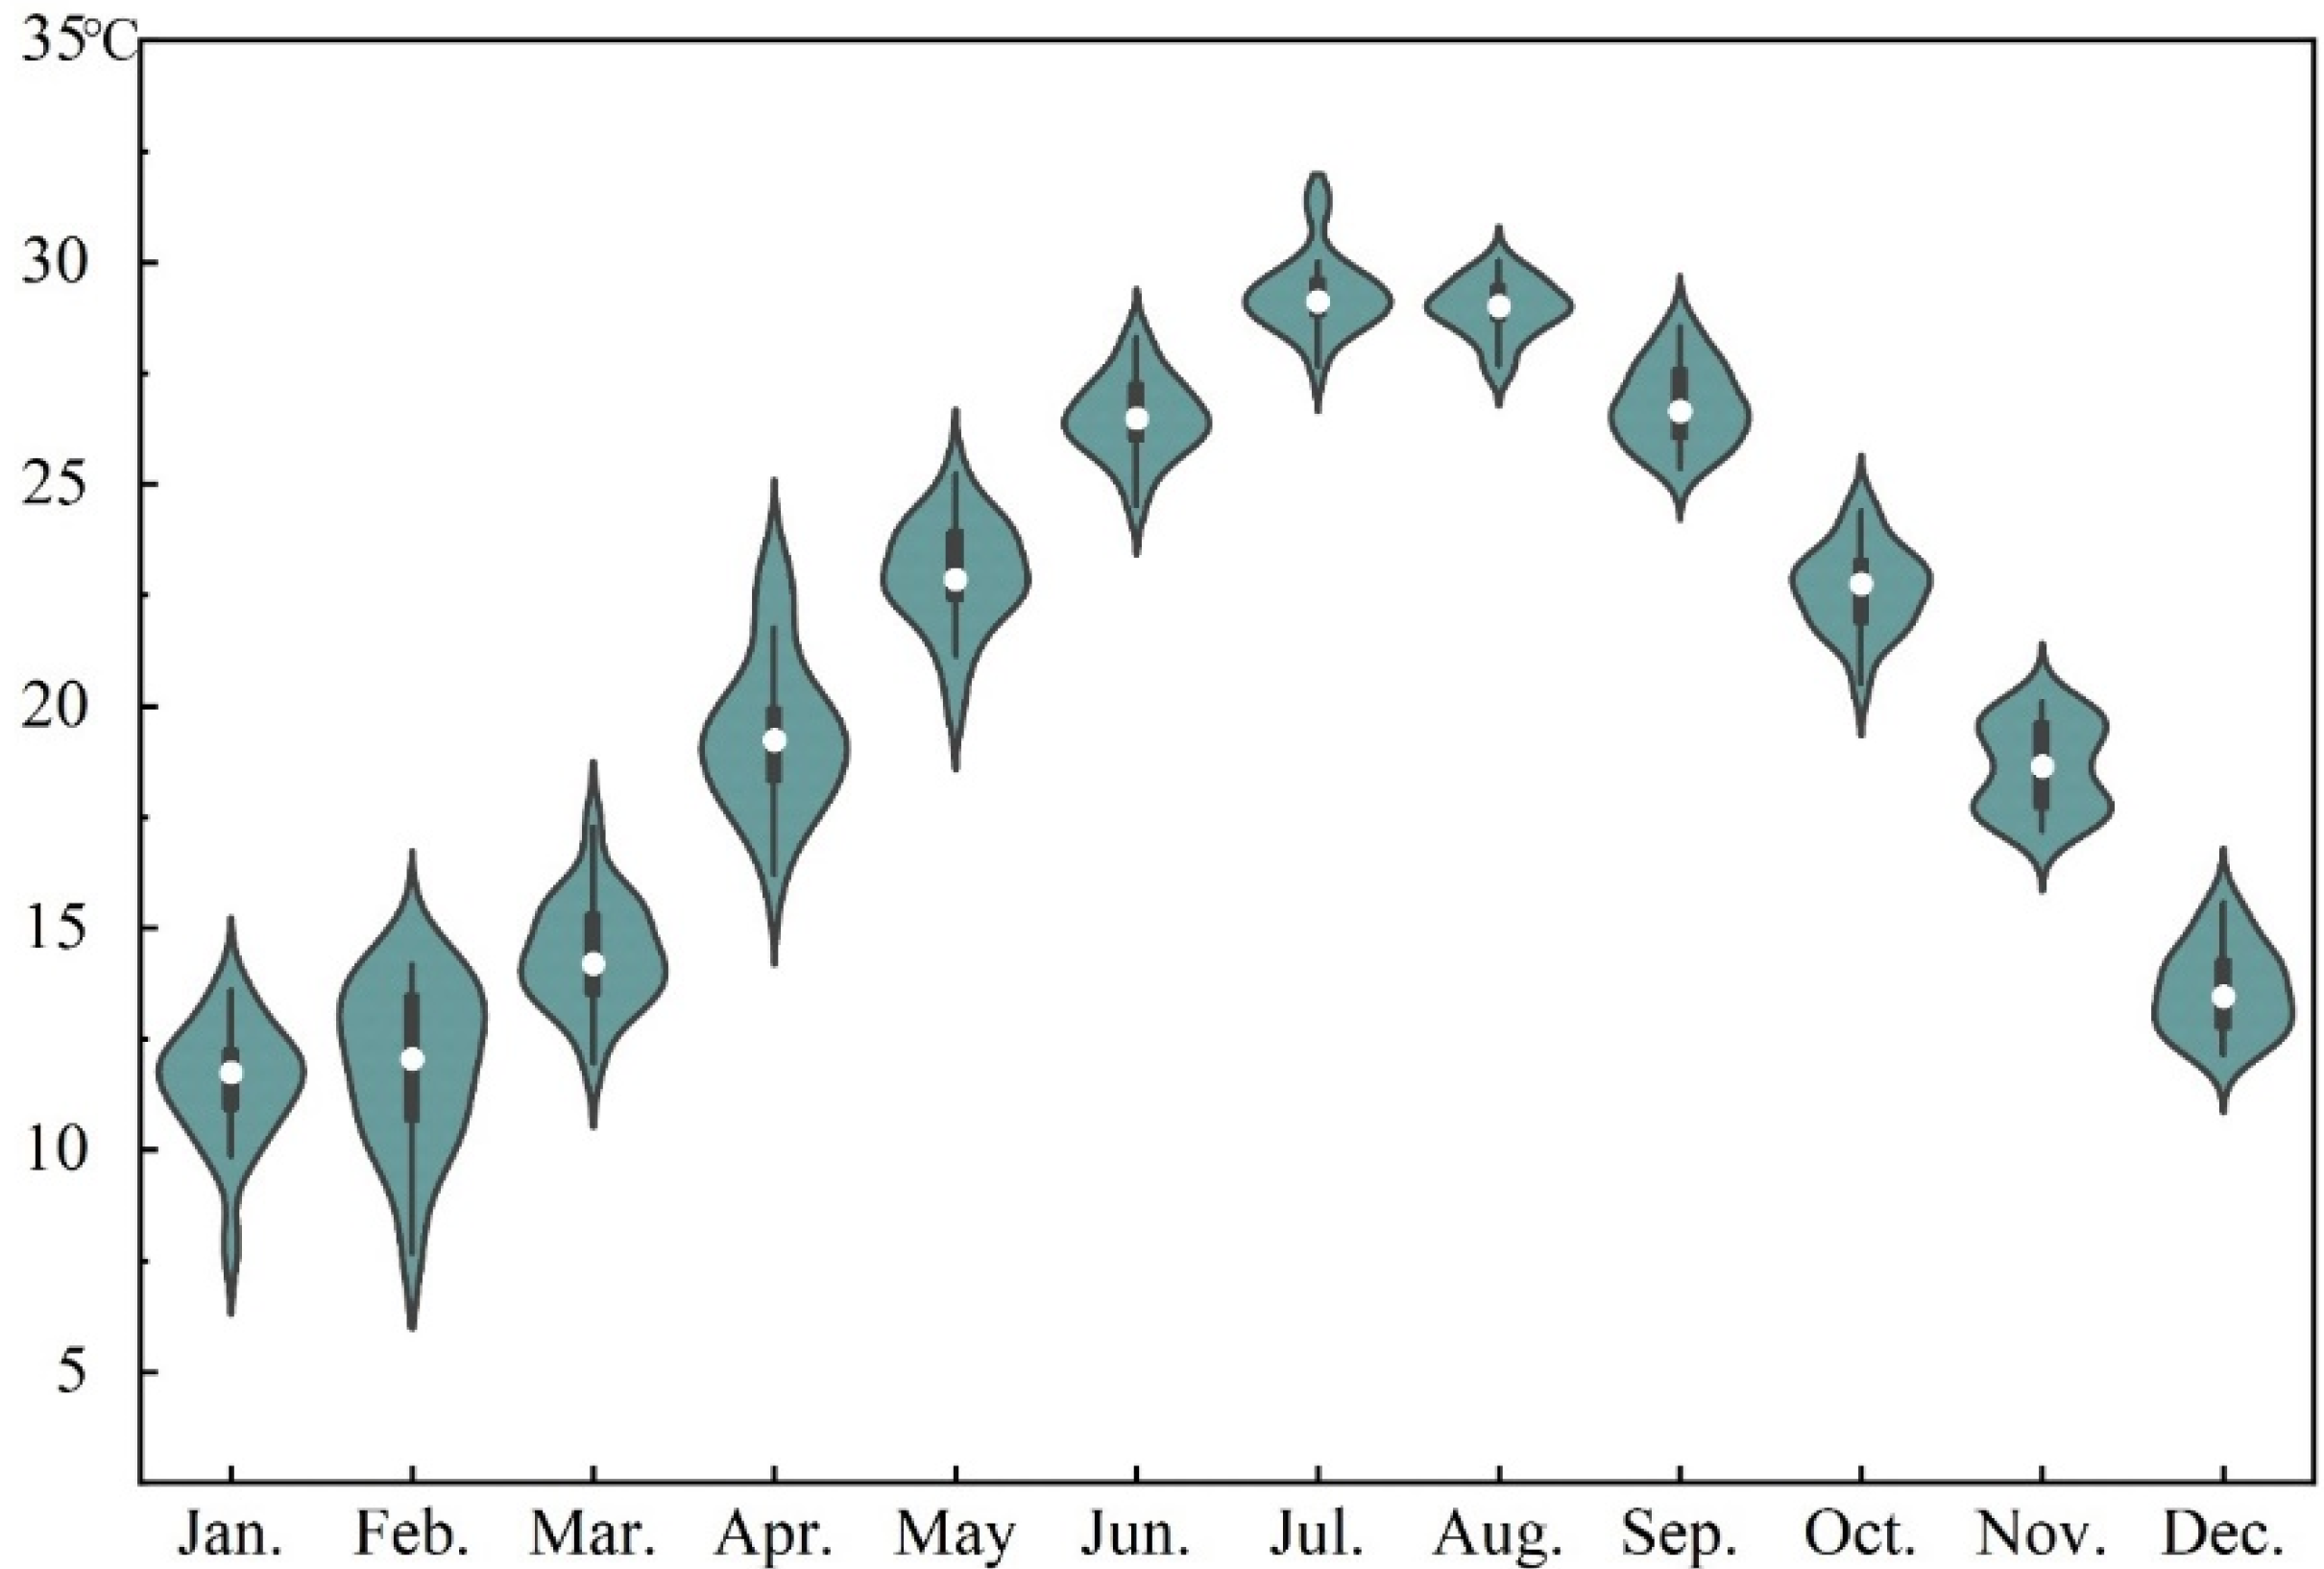
2.1. Study Area and Data Source
2.2. Retrieving Land-Surface Temperature (LST)
2.3. Influencing Factors Selection
2.4. Spatial Autocorrelation and Spatial Autoregressive Model
3. Results
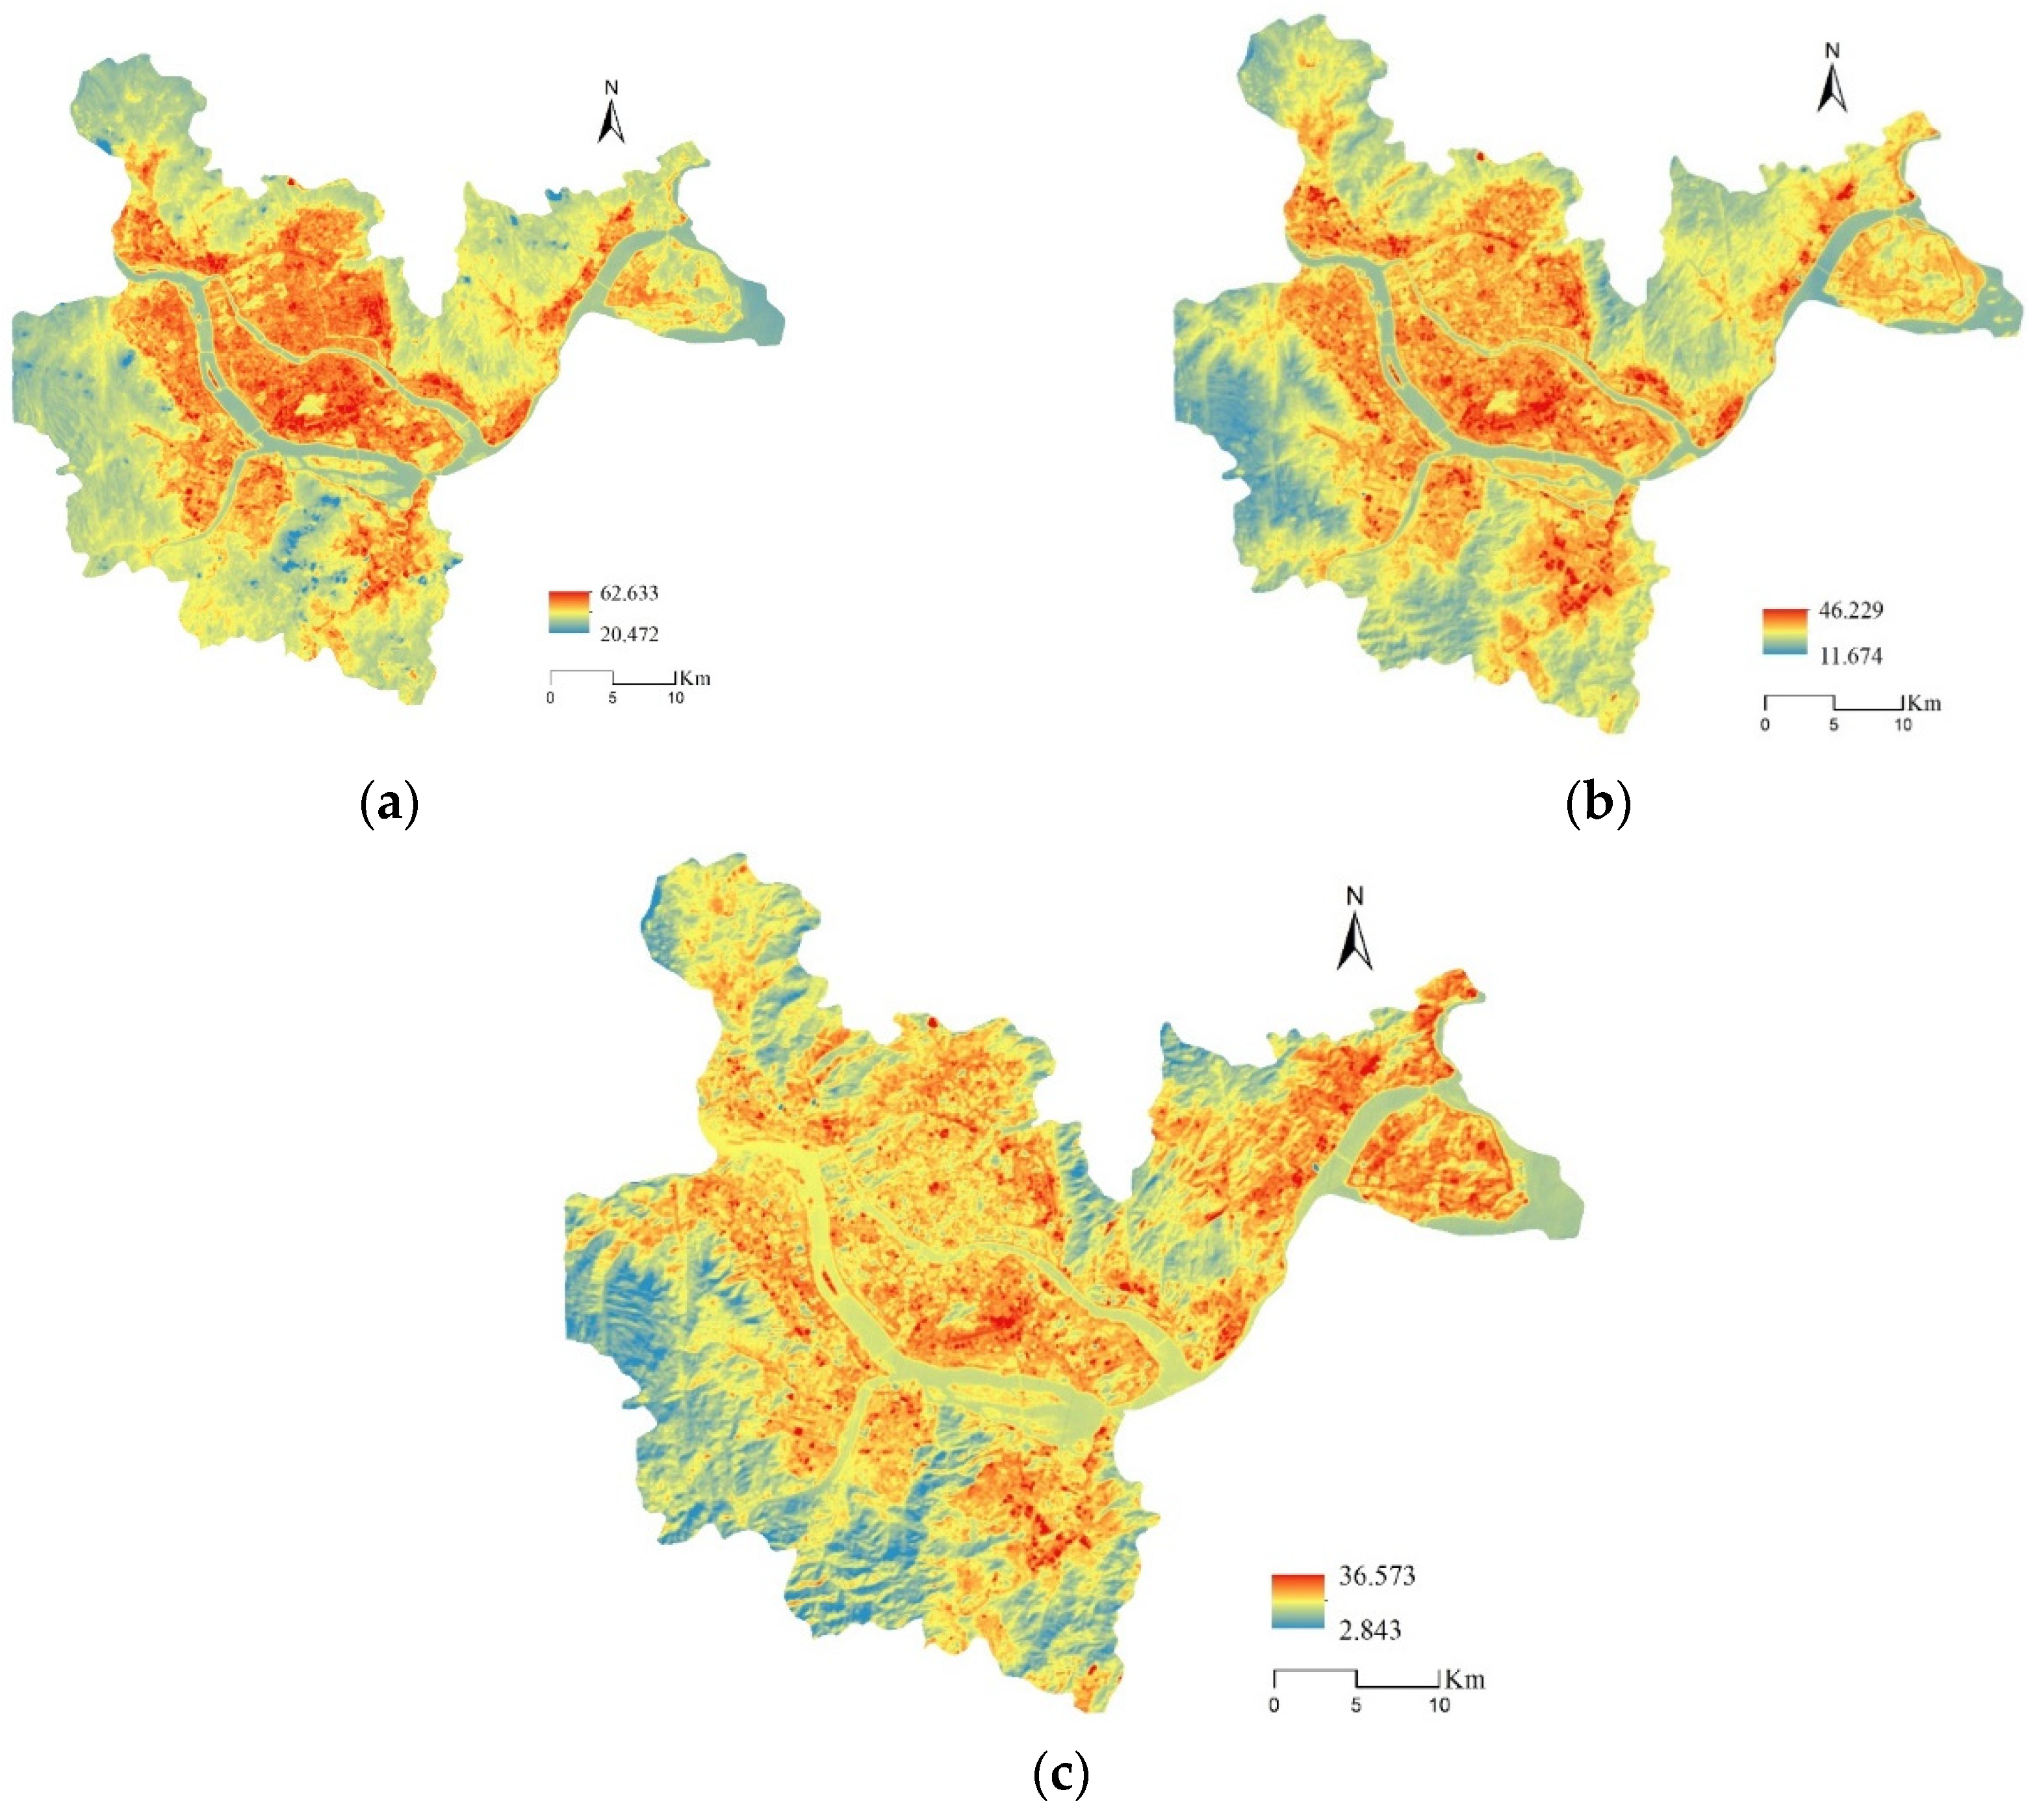
3.1. Spatial Characteristics of LST
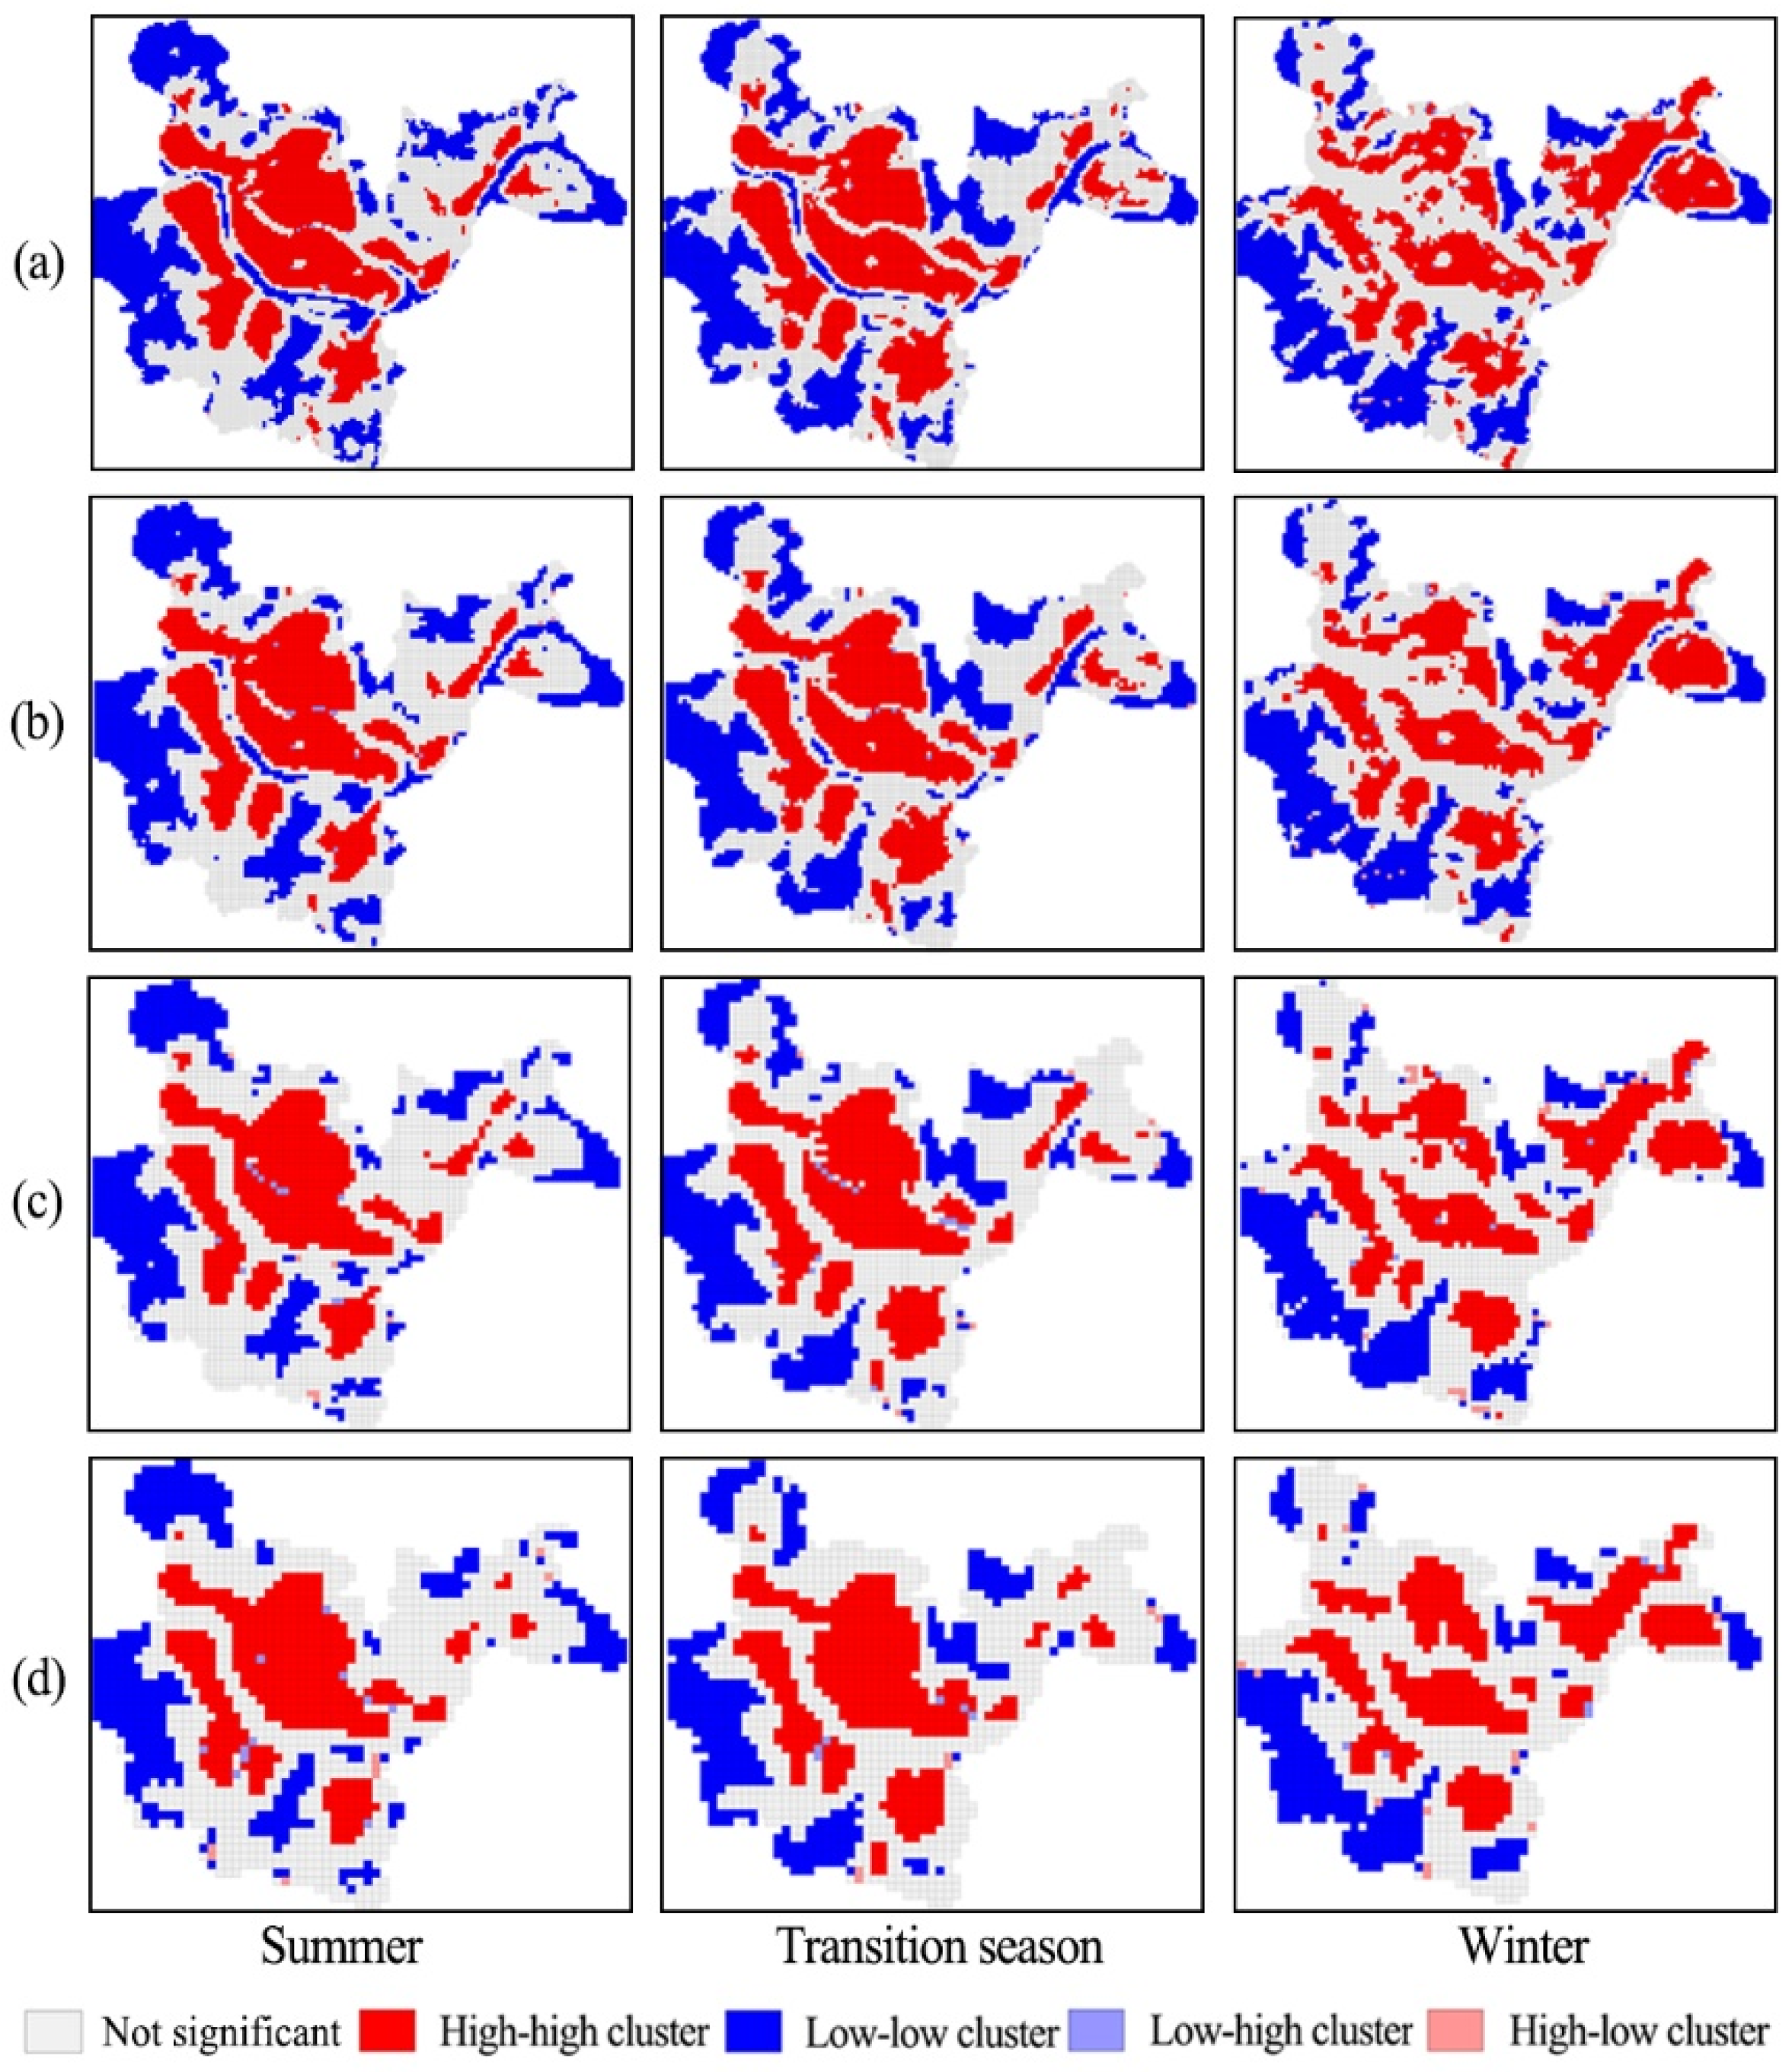
3.2. LST and UGS Spatial Pattern Analysis
3.2.1. Analysis of the Spatial Pattern of Green Space
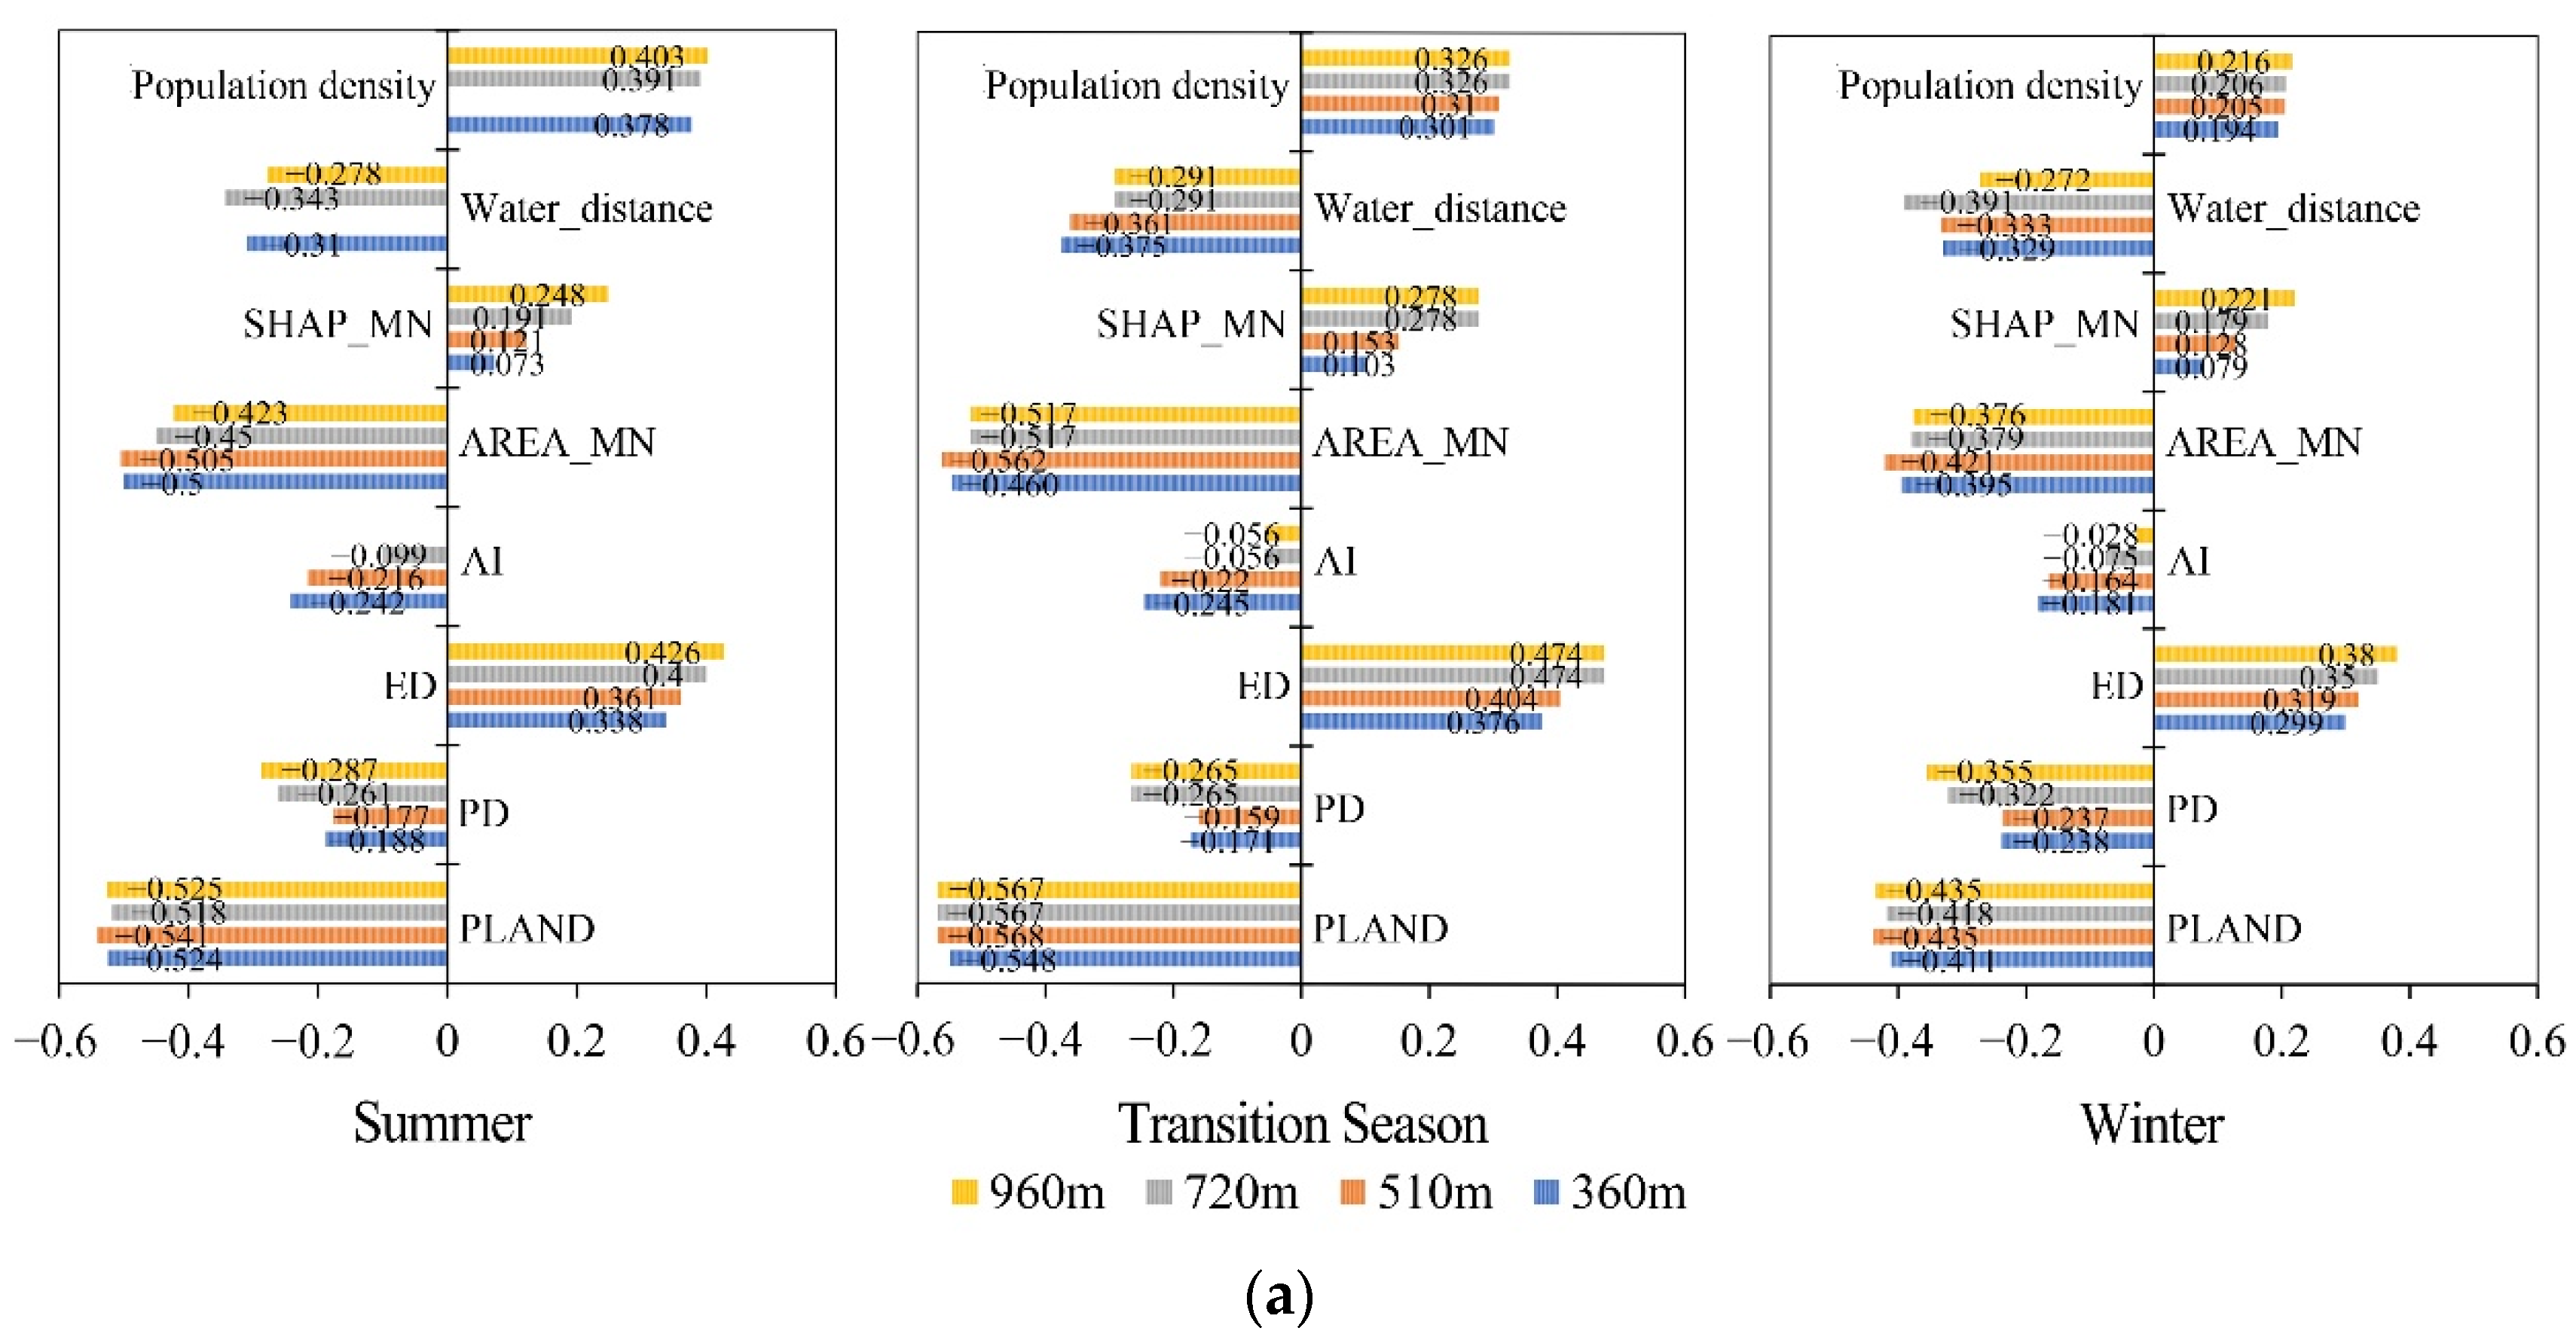
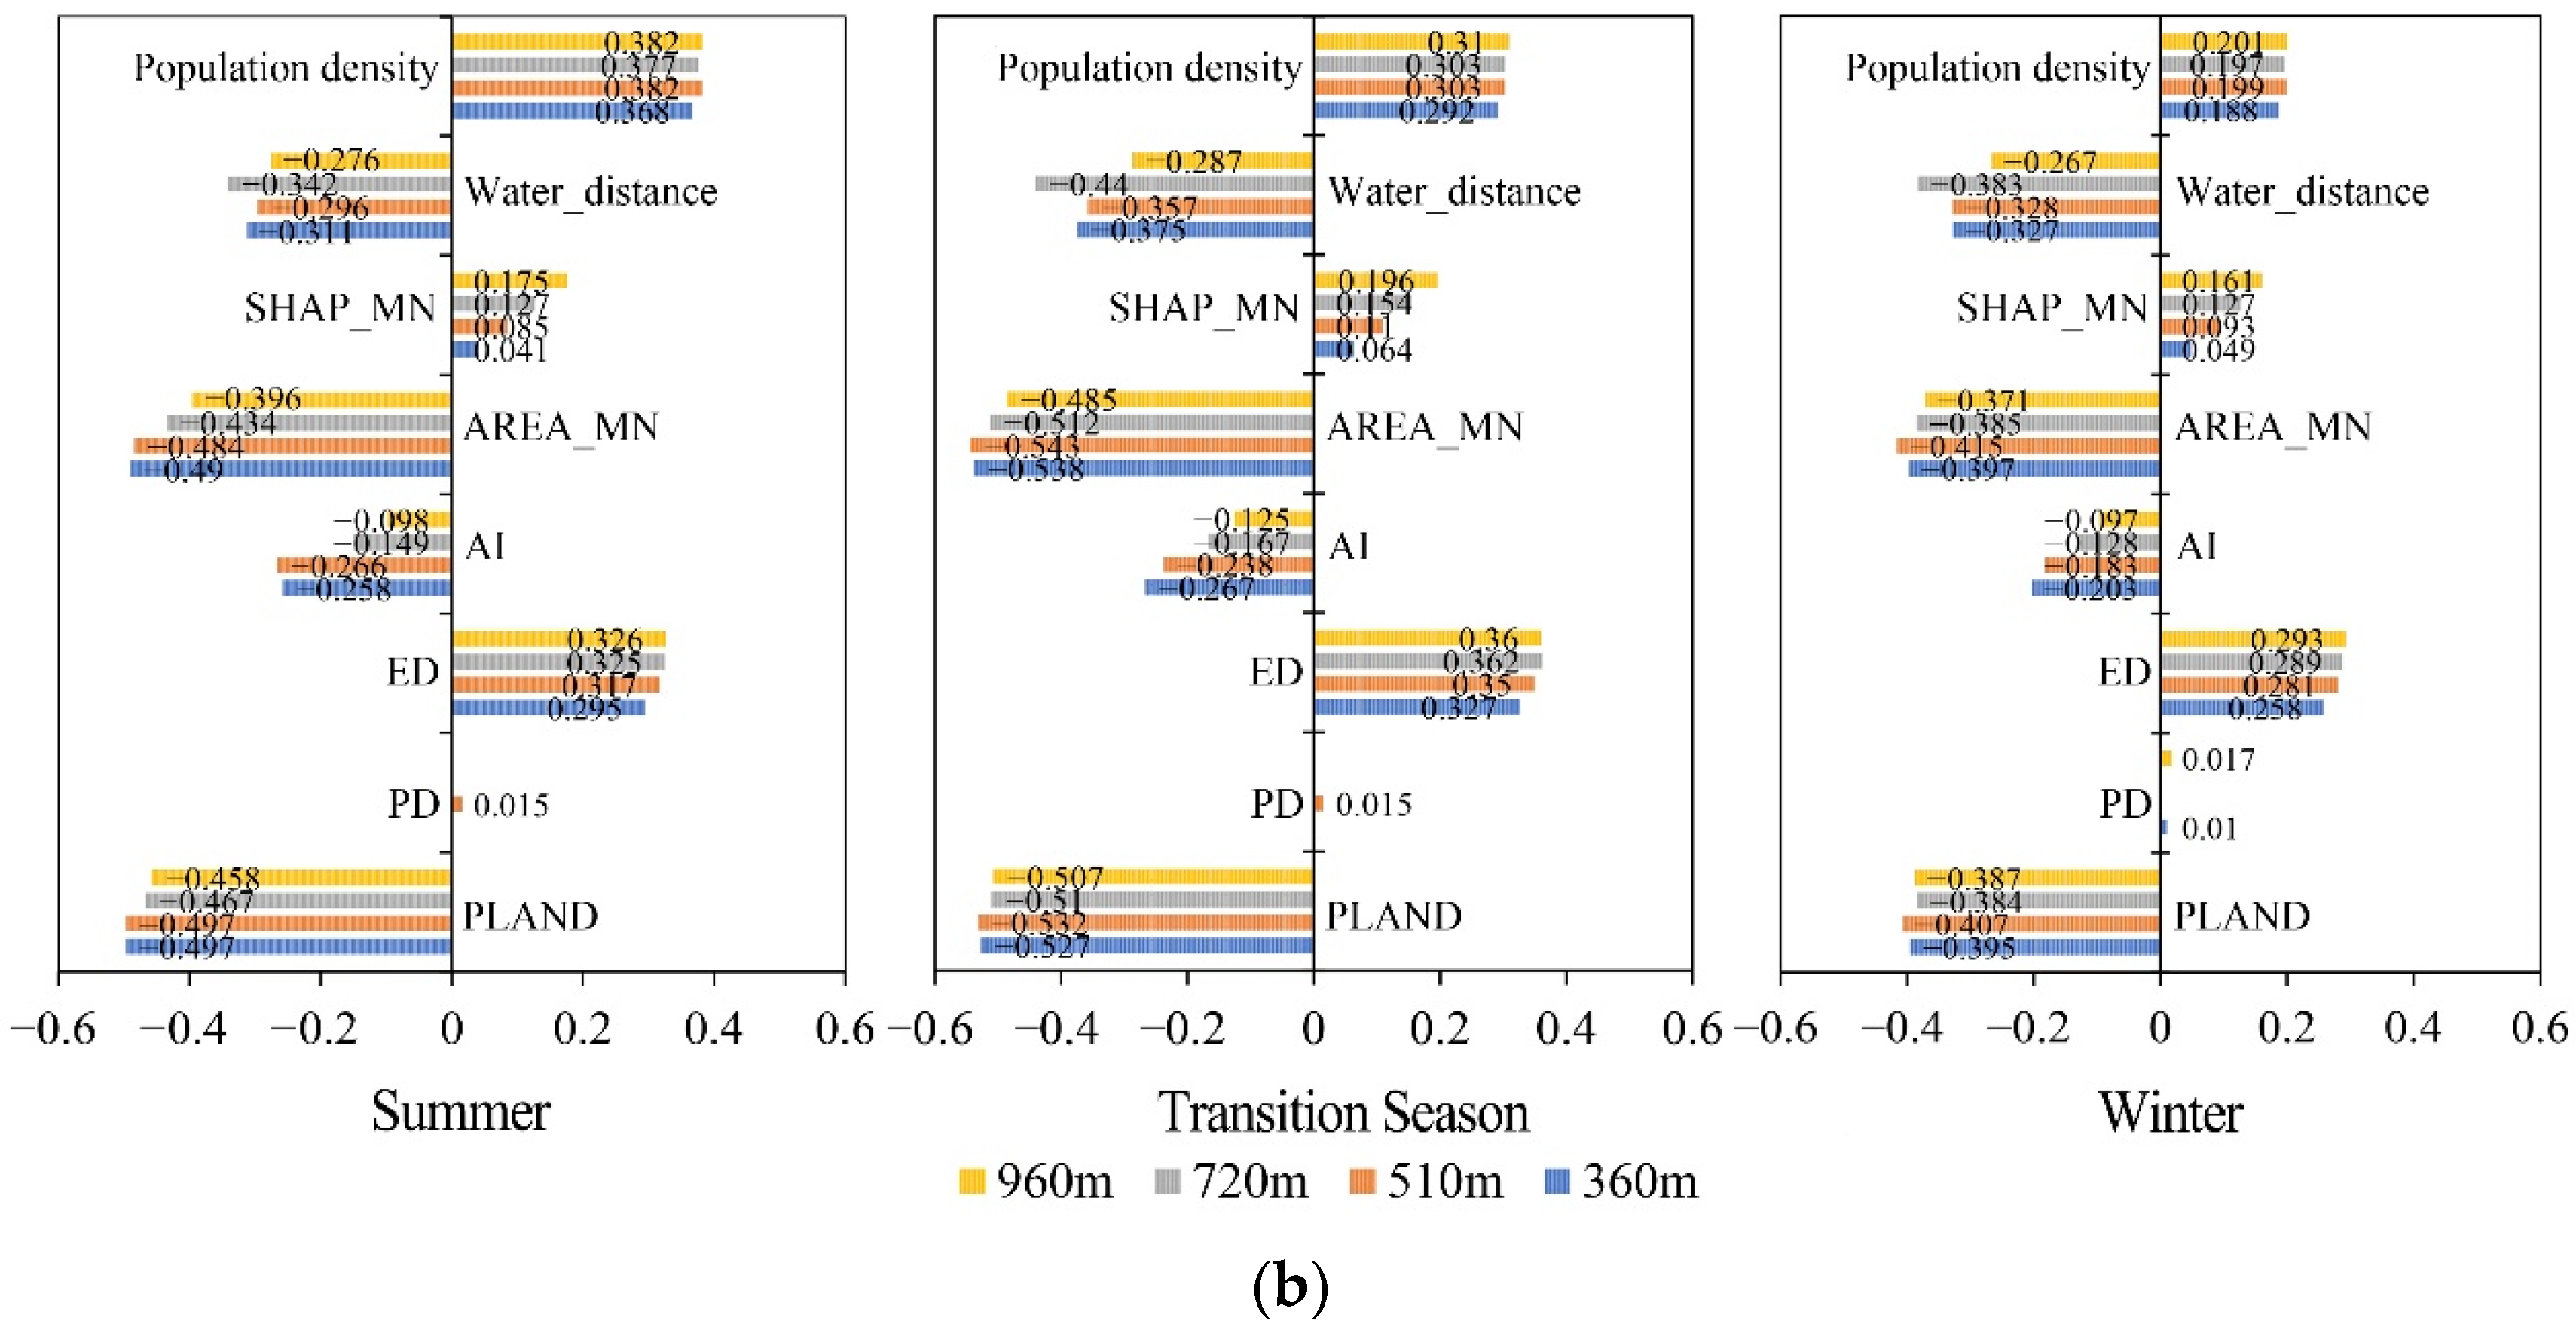
3.2.2. Bivariate Analysis of Green Space Landscape Pattern Index and LST
3.2.3. Spatial Autoregressive Analysis
4. Discussion
4.1. Spatial Variation of LST
4.2. Differences in the Impact of UGS on UHI Mitigation
4.3. UHI Mitigation Implications by Urban Greening
4.4. Limitations and Future Research
5. Conclusions
Author Contributions
Funding
Institutional Review Board Statement
Informed Consent Statement
Data Availability Statement
Acknowledgments
Conflicts of Interest
Appendix A
Appendix B

| Value | p-Value | ||||||
|---|---|---|---|---|---|---|---|
| Scale (m) | Summer | Transition Season | Winter | Summer | Transition Season | Winter | |
| 360 m | LM (SLM) | 17,669.722 | 17,554.956 | 14,749.657 | 0.000 | 0.000 | 0.000 |
| Robust LM (SLM) | 751.682 | 817.425 | 335.424 | 0.000 | 0.000 | 0.000 | |
| LM (SEM) | 18,289.119 | 17,995.990 | 15,079.633 | 0.000 | 0.000 | 0.000 | |
| Robust LM (SEM) | 1371.078 | 1258.459 | 665.401 | 0.000 | 0.000 | 0.000 | |
| Moran’s I (error) | 0.638 | 0.633 | 0.576 | 0.000 | 0.000 | 0.000 | |
| 510 m | LM (SLM) | 8980.604 | 8785.118 | 8081.876 | 0.000 | 0.000 | 0.000 |
| Robust LM (SLM) | 315.210 | 375.142 | 134.112 | 0.000 | 0.000 | 0.000 | |
| LM (SEM) | 9733.919 | 9383.335 | 8577.889 | 0.000 | 0.000 | 0.000 | |
| Robust LM (SEM) | 1068.525 | 973.335 | 630125 | 0.000 | 0.000 | 0.000 | |
| Moran’s I (error) | 0.646 | 0.634 | 0.606 | 0.000 | 0.000 | 0.000 | |
| 720 m | LM (SLM) | 2777.740 | 2600.889 | 2244.589 | 0.000 | 0.000 | 0.000 |
| Robust LM (SLM) | 164.529 | 165.802 | 62.053 | 0.000 | 0.000 | 0.000 | |
| LM (SEM) | 2892.608 | 2658.432 | 2314.228 | 0.000 | 0.000 | 0.000 | |
| Robust LM (SEM) | 279.137 | 223.345 | 131.692 | 0.000 | 0.000 | 0.000 | |
| Moran’s I (error) | 0.506 | 0.485 | 0.453 | 0.000 | 0.000 | 0.000 | |
| 960 m | LM (SLM) | 1229.250 | 1196.510 | 1335.168 | 0.000 | 0.000 | 0.000 |
| Robust LM (SLM) | 52.147 | 77.669 | 38.198 | 0.000 | 0.000 | 0.000 | |
| LM (SEM) | 1393.353 | 1308.945 | 1443.972 | 0.000 | 0.000 | 0.000 | |
| Robust LM (SEM) | 216.250 | 190.104 | 147.002 | 0.000 | 0.000 | 0.000 | |
| Moran’s I (error) | 0.466 | 0.451 | 0.474 | 0.000 | 0.000 | 0.000 |
References
- Oke, T.R. The energetic basis of the urban heat island. Q. J. R. Meteorol. Soc. 1982, 108, 1–24. [Google Scholar] [CrossRef]
- Morris, K.I.; Chan, A.; Morris, K.J.K.; Ooi, M.C.G.; Oozeer, M.Y.; Abakr, Y.A.; Nadzir, M.S.M.; Mohammed, I.Y.; Al-Qrimli, H.F. Impact of urbanization level on the interactions of urban area, the urban climate, and human thermal comfort. Appl. Geogr. 2017, 79, 50–72. [Google Scholar] [CrossRef]
- Li, H.; Meier, F.; Lee, X.; Chakraborty, T.; Liu, J.; Schaap, M.; Sodoudi, S. Interaction between urban heat island and urban pollution island during summer in Berlin. Sci. Total Environ. 2018, 636, 818–828. [Google Scholar] [PubMed]
- Jochner, S.; Menzel, A. Urban phenological studies—Past, present, future. Environ. Pollut. 2015, 203, 250–261. [Google Scholar] [CrossRef]
- Zhou, D.; Zhao, S.; Zhang, L.; Liu, S. Remotely sensed assessment of urbanization effects on vegetation phenology in China’s 32 major cities. Remote. Sens. Environ. 2016, 176, 272–281. [Google Scholar] [CrossRef] [Green Version]
- Grimm, N.B.; Faeth, S.H.; Golubiewski, N.E.; Redman, C.L.; Wu, J.; Bai, X.; Briggs, J.M. Global change and the ecology of cities. Science 2008, 319, 756–760. [Google Scholar] [CrossRef] [Green Version]
- Ingole, V.; Marí-Dell’Olmo, M.; Deluca, A.; Borrell, C.; Basagaa, X. Spatial Variability of Heat-Related Mortality in Barcelona from 1992-2015: A Case Crossover Study Design. Int. J. Environ. Res. Public Health 2020, 17, 2553. [Google Scholar] [CrossRef] [PubMed] [Green Version]
- Kim, S.W.; Brown, R.D. Urban heat island (UHI) variations within a city boundary: A systematic literature review. Renew. Sustain. Energy Rev. 2021, 148, 111256. [Google Scholar] [CrossRef]
- Xu, H.Q. Quantitative analysis on the relationship of urban impervious surface with other components of the urban ecosystem. Acta Ecol. Sin. 2009, 29, 2456–2462. [Google Scholar]
- Yu, Z.; Yao, Y.; Yang, G.; Wang, X.; Vejre, H. Spatiotemporal patterns and characteristics of remotely sensed region heat islands during the rapid urbanization (1995–2015) of Southern China. Sci. Total Environ. 2019, 674, 242–254. [Google Scholar] [CrossRef]
- Shukla, A.; Jain, K. Analyzing the impact of changing landscape pattern and dynamics on land surface temperature in Lucknow city, India. Urban For. Urban Green. 2021, 58, 126877. [Google Scholar] [CrossRef]
- Estoque, R.C.; Murayama, Y.; Myint, S.W. Effects of landscape composition and pattern on land surface temperature: An urban heat island study in the megacities of Southeast Asia. Sci. Total Environ. 2017, 577, 349–359. [Google Scholar] [CrossRef]
- Chrysoulakis, N.; Feigenwinter, C.; Triantakonstantis, D.; Penyevskiy, I.; Tal, A.; Parlow, E.; Fleishman, G.; Düzgün, S.; Esch, T.; Marconcini, M. A Conceptual List of Indicators for Urban Planning and Management Based on Earth Observation. ISPRS Int. J. Geo-Inf. 2014, 3, 980–1002. [Google Scholar] [CrossRef] [Green Version]
- Mitraka, Z.; Chrysoulakis, N.; Doxani, G.; Del Frate, F.; Berger, M. Urban Surface Temperature Time Series Estimation at the Local Scale by Spatial-Spectral Unmixing of Satellite Observations. Remote Sens. 2015, 7, 4139–4156. [Google Scholar] [CrossRef] [Green Version]
- Fidani, S.; Daliakopoulos, I.; Manios, T.; Grillakis, M.; Charalampopoulou, V.; Nektarios, P. Evaluating the Effect of Green Infrastructure in Mitigating the Urban Heat Island Effect Using Remote Sensing. In Proceedings of the EGU General Assembly 2021, online, 19–30 April 2021. [Google Scholar] [CrossRef]
- Jiang, Y.; Fu, P.; Weng, Q. Assessing the Impacts of Urbanization-Associated Land Use/Cover Change on Land Surface Temperature and Surface Moisture: A Case Study in the Midwestern United States. Remote Sens. 2015, 7, 4880–4898. [Google Scholar] [CrossRef] [Green Version]
- Xie, Q.; Sun, Q. Monitoring thermal environment deterioration and its dynamic response to urban expansion in Wuhan, China. Urban Clim. 2021, 39, 100932. [Google Scholar] [CrossRef]
- Cai, Y.; Chen, Y.; Tong, C. Spatiotemporal evolution of urban green space and its impact on the urban thermal environment based on remote sensing data: A case study of Fuzhou City, China. Urban For. Urban Green. 2019, 41, 333–343. [Google Scholar] [CrossRef]
- Oliveira, S.; Andrade, H.; Vaz, T. The cooling effect of green spaces as a contribution to the mitigation of urban heat: A case study in Lisbon. Build. Environ. 2011, 46, 2186–2194. [Google Scholar] [CrossRef]
- Zhou, W.; Huang, G.; Cadenasso, M.L. Does spatial configuration matter? Understanding the effects of land cover pattern on land surface temperature in urban landscapes. Landsc. Urban Plan. 2011, 102, 54–63. [Google Scholar]
- Liu, G.; Zhang, Q.; Li, G.; Doronzo, D.M. Response of land cover types to land surface temperature derived from Landsat-5 TM in Nanjing Metropolitan Region, China. Environ. Earth Sci. 2016, 75, 1381–1386. [Google Scholar] [CrossRef]
- Asgarian, A.; Amiri, B.J.; Sakieh, Y. Assessing the effect of green cover spatial patterns on urban land surface temperature using landscape metrics approach. Urban Ecosyst. 2015, 18, 209–222. [Google Scholar] [CrossRef]
- Peng, J.; Hu, Y.; Dong, J.; Liu, Q.; Liu, Y. Quantifying spatial morphology and connectivity of urban heat islands in a megacity: A radius approach. Sci. Total Environ. 2020, 714, 136792. [Google Scholar] [CrossRef]
- Lv, H.; Yang, Y.; Zhang, D.; Du, H.; Zhang, J.; Wang, W.; He, X. Perimeter-area ratio effects of urbanization intensity on forest characteristics, landscape patterns and their associations in Harbin City, Northeast China. Urban Ecosyst. 2019, 22, 631–642. [Google Scholar] [CrossRef]
- Maimaitiyiming, M.; Ghulam, A.; Tiyip, T.; Pla, F.; Latorre-Carmona, P.; Halik, Ü.; Sawut, M.; Caetano, M. Effects of green space spatial pattern on land surface temperature: Implications for sustainable urban planning and climate change adaptation. ISPRS J. Photogramm. 2014, 89, 59–66. [Google Scholar] [CrossRef] [Green Version]
- Richards, D.R.; Fung, T.K.; Belcher, R.N.; Edwards, P.J. Differential air temperature cooling performance of urban vegetation types in the tropics. Urban For. Urban Green. 2020, 50, 126651. [Google Scholar] [CrossRef]
- Rakoto, P.Y.; Deilami, K.; Hurley, J.; Amati, M.; Sun, Q.C. Revisiting the cooling effects of urban greening: Planning implications of vegetation types and spatial configuration. Urban For. Urban Green. 2021, 64, 127266. [Google Scholar] [CrossRef]
- Li, J.; Song, C.; Cao, L.; Zhu, F.; Meng, X.; Wu, J. Impacts of landscape structure on surface urban heat islands: A case study of Shanghai, China. Remote Sens. Environ. 2011, 115, 3249–3263. [Google Scholar] [CrossRef]
- Ke, X.; Men, H.; Zhou, T.; Li, Z.; Zhu, F. Variance of the impact of urban green space on the urban heat island effect among different urban functional zones: A case study in Wuhan. Urban For. Urban Green. 2021, 62, 127159. [Google Scholar] [CrossRef]
- Li, X.; Zhou, W.; Ouyang, Z. Relationship between land surface temperature and spatial pattern of greenspace: What are the effects of spatial resolution? Landsc. Urban Plan. 2013, 114, 1–8. [Google Scholar] [CrossRef]
- Hou, H.; Estoque, R.C. Detecting Cooling Effect of Landscape from Composition and Configuration: An Urban Heat Island Study on Hangzhou. Urban For. Urban Green. 2020, 53, 126719. [Google Scholar] [CrossRef]
- Du, J.; Xiang, X.; Zhao, B.; Zhou, H. Impact of urban expansion on land surface temperature in Fuzhou, China using Landsat imagery. Sustain. Cities Soc. 2020, 61, 102346. [Google Scholar] [CrossRef]
- Peng, J.; Jia, J.; Liu, Y.; Li, H.; Wu, J. Seasonal contrast of the dominant factors for spatial distribution of land surface temperature in urban areas. Remote Sens. Environ. 2018, 215, 255–267. [Google Scholar] [CrossRef]
- Geng, S.; Yang, L.; Sun, Z.; Wang, Z.; Qian, J.; Jiang, C.; Wen, M. Spatiotemporal patterns and driving forces of remotely sensed urban agglomeration heat islands in South China. Sci. Total Environ. 2021, 800, 149499. [Google Scholar] [CrossRef] [PubMed]
- Feng, L.; Zhao, M.; Zhou, Y.; Zhu, L.; Tian, H. The seasonal and annual impacts of landscape patterns on the urban thermal comfort using Landsat. Ecol. Indic. 2020, 110, 105798. [Google Scholar] [CrossRef]
- Lu, Y.; Yue, W.; Liu, Y.; Huang, Y. Investigating the spatiotemporal non-stationary relationships between urban spatial form and land surface temperature: A case study of Wuhan, China. Sustain. Cities Soc. 2021, 72, 103070. [Google Scholar] [CrossRef]
- Fu, B.; Wang, Y.; Campbell, A.; Li, Y.; Zhang, B.; Yin, S.; Xing, Z.; Jin, X. Comparison of object-based and pixel-based Random Forest algorithm for wetland vegetation mapping using high spatial resolution GF-1 and SAR data. Ecol. Indic. 2017, 73, 105–117. [Google Scholar] [CrossRef]
- Peng, J.; Wang, Y.; Zhang, Y.; Wu, J.; Li, W.; Li, Y. Evaluating the effectiveness of landscape metrics in quantifying spatial patterns. Ecol. Indic. 2010, 10, 217–223. [Google Scholar] [CrossRef]
- Zhang, Y.; Balzter, H.; Zou, C.; Xu, H.; Tang, F. Characterizing bi-temporal patterns of land surface temperature using landscape metrics based on sub-pixel classifications from Landsat TM/ETM+. Int. J. Appl. Earth Obs. 2015, 42, 87–96. [Google Scholar] [CrossRef] [Green Version]
- Li, X.; Zhou, W.; Ouyang, Z.; Xu, W.; Zheng, H. Spatial pattern of greenspace affects land surface temperature: Evidence from the heavily urbanized Beijing metropolitan area, China. Landsc. Ecol. 2012, 27, 887–898. [Google Scholar] [CrossRef]
- Liu, H.; Weng, Q. Scaling Effect on the Relationship between Landscape Pattern and Land Surface Temperature. Photogramm. Eng. Remote. Sens. 2009, 75, 291–304. [Google Scholar] [CrossRef] [Green Version]
- Guo, G.; Zhou, X.; Wu, Z.; Xiao, R.; Chen, Y. Characterizing the impact of urban morphology heterogeneity on land surface temperature in Guangzhou, China. Environ. Model. Softw. 2016, 84, 427–439. [Google Scholar] [CrossRef]
- Yang, C.; He, X.; Wang, R.; Yan, F.; Lingxue, Y.; Bu, K.; Yang, J.; Chang, L.; Zhang, S. The Effect of Urban Green Spaces on the Urban Thermal Environment and Its Seasonal Variations. Forests 2017, 8, 153. [Google Scholar] [CrossRef] [Green Version]
- Song, J.; Du, S.; Feng, X.; Guo, L. The relationships between landscape compositions and land surface temperature: Quantifying their resolution sensitivity with spatial regression models. Landsc. Urban Plan. 2014, 123, 145–157. [Google Scholar] [CrossRef]
- Tan, M.; Li, X. Quantifying the effects of settlement size on urban heat islands in fairly uniform geographic areas. Habitat Int. 2015, 49, 100–106. [Google Scholar] [CrossRef]
- Yao, L.; Sun, S.; Song, C.; Li, J.; Xu, W.; Xu, Y. Understanding the spatiotemporal pattern of the urban heat island footprint in the context of urbanization, a case study in Beijing, China. Appl. Geogr. 2021, 133, 102496. [Google Scholar] [CrossRef]
- Liang, Z.; Huang, J.; Wang, Y.; Wei, F.; Wu, S.; Jiang, H.; Zhang, X.; Li, S. The mediating effect of air pollution in the impacts of urban form on nighttime urban heat island intensity. Sustain. Cities Soc. 2021, 74, 102985. [Google Scholar] [CrossRef]
- Mcgarigal, K.S.; Cushman, S.A.; Neel, M.C.; Ene, E. FRAGSTATS: Spatial Pattern Analysis Program for Categorical Maps. 2002. Available online: www.umass.edu/landeco/research/fragstats/fragstats (accessed on 15 September 2020).
- Getis, A. Spatial Autocorrelation: A Primer. Econ. Geogr. 1988, 64, 88. [Google Scholar] [CrossRef]
- Chi, G.; Zhu, J. Spatial Regression Models for Demographic Analysis. Popul. Res. Policy Rev. 2008, 27, 17–42. [Google Scholar] [CrossRef]
- Scott, L.M.; Janikas, M.V. Handbook of Applied Spatial Analysis; Springer: Berlin/Heidelberg, Germany, 2010. [Google Scholar]
- Anselin, L. Local Indicators of Spatial Association—ISA. Geogr. Anal. 2010, 27, 93–115. [Google Scholar] [CrossRef]
- Tian, X.; Deng, Y.; Wargocki, P.; Liu, W. Effects of increased activity level on physiological and subjective responses at different high temperatures. Build. Environ. 2021, 201, 108011. [Google Scholar] [CrossRef]
- Shen, Z.; Zeng, J.; Liang, C. Spatial relationship of greenspace landscape pattern with land surface temperature in three cities of southern Fujian. Chin. J. Ecol. 2020, 39, 245–253. [Google Scholar]
- Chen, A.; Yao, L.; Sun, R.; Chen, L. How many metrics are required to identify the effects of the landscape pattern on land surface temperature? Ecol. Indic. 2014, 45, 424–433. [Google Scholar] [CrossRef]
- Zhou, W.; Wang, J.; Cadenasso, M.L. Effects of the spatial configuration of trees on urban heat mitigation: A comparative study. Remote Sens. Environ. 2017, 195, 1–12. [Google Scholar] [CrossRef]
- Yang, J.; Sun, J.; Ge, Q.; Li, X. Assessing the impacts of urbanization-associated green space on urban land surface temperature: A case study of Dalian, China. Urban For. Urban Green. 2017, 22, 1–10. [Google Scholar] [CrossRef]
- Kong, F.; Yin, H.; James, P.; Hutyra, L.R.; He, H.S. Effects of spatial pattern of greenspace on urban cooling in a large metropolitan area of eastern China. Landsc. Urban Plan. 2014, 128, 35–47. [Google Scholar] [CrossRef]
- Guo, G.; Wu, Z.; Chen, Y. Complex mechanisms linking land surface temperature to greenspace spatial patterns: Evidence from four southeastern Chinese cities. Sci. Total Environ. 2019, 674, 77–87. [Google Scholar] [CrossRef] [PubMed]
- Zhang, X.; Zhong, T.; Feng, X.; Wang, K. Estimation of the relationship between vegetation patches and urban land surface temperature with remote sensing. Int. J. Remote Sens. 2009, 30, 2105–2118. [Google Scholar] [CrossRef]
- Zhou, D.; Zhao, S.; Liu, S.; Zhang, L.; Zhu, C. Surface urban heat island in China’s 32 major cities: Spatial patterns and drivers. Remote Sens. Environ. 2014, 152, 51–61. [Google Scholar] [CrossRef]
- Wu, W.; Li, L.; Li, C. Seasonal variation in the effects of urban environmental factors on land surface temperature in a winter city. J. Clean. Prod. 2021, 299, 126897. [Google Scholar] [CrossRef]
- Xiang, Y.; Huang, C.; Huang, X.; Zhou, Z.; Wang, X. Seasonal variations of the dominant factors for spatial heterogeneity and time inconsistency of land surface temperature in an urban agglomeration of central China. Sustain. Cities Soc. 2021, 75, 103285. [Google Scholar] [CrossRef]
- Cai, Z.; Han, G.; Chen, M. Do water bodies play an important role in the relationship between urban form and land surface temperature? Sustain. Cities Soc. 2018, 39, 487–498. [Google Scholar] [CrossRef]
| Variables | Description | Formula | Unit |
|---|---|---|---|
| Percentage of landscape (PLAND) | The proportional abundance of each patch type in the landscape within an analysis unit. | Percent | |
| Patch density (PD) | Density of landscape patches within an analysis unit, reflects the degree of fragmentation and spatial heterogeneity of landscape patches. | n/km² | |
| Edge density (ED) | The total perimeter of landscape patches per ha within an analysis unit, reflects the degree of fragmentation of the patch. | m/ha | |
| Aggregation Index (AI) | Aggregating degree of the corresponding patches within an analysis unit. | Percent | |
| Mean patch area (AREA_MN) | The average area of landscape patches within an analysis unit. | Hectares | |
| Mean patch shape index (SHAPE_MN) | The average shape index of landscape patches within an analysis unit, for reflecting the complexity of individual patch shapes. | unitless | |
| Water_distance | Analyze the Euclidean distance of each unit to the water bodies. | Km | |
| Population density | The population density within an analysis unit. | People/km2 |
| Season | Data Date | Local Time | Minimum | Maximum | Average | Std. Dev. |
|---|---|---|---|---|---|---|
| Summer | 22 July 2020 | 02:32:25 | 20.473 | 62.633 | 43.417 | 5.556 |
| Transition season | 16 March 2020 | 02:32:22 | 11.674 | 46.229 | 22.305 | 3.168 |
| Winter | 11 December 2019 | 02:32:49 | 2.843 | 36.573 | 18.225 | 1.901 |
| Scale (m) | Global Moran’s I | |||
|---|---|---|---|---|
| Summer | Transition Season | Winter | p-Value | |
| 360 m | 0.766 | 0.773 | 0.653 | <0.01 |
| 510 m | 0764 | 0772 | 0668 | <0.01 |
| 720 m | 0.664 | 0.673 | 0.546 | <0.01 |
| 960 m | 0.620 | 0.644 | 0.548 | <0.01 |
| Landscape Metrics | Moran’s I | |||||
|---|---|---|---|---|---|---|
| PLAND (%) | PD (n/km2) | ED (m/ha) | AI (%) | AREA_MN (ha) | SHAPE_MN | |
| 58.379 | 33.869 | 65.510 | 82.582 | 10.222 | 1.197 | 0.869 |
| Season | Scale (m) | PLAND | PD | ED | AI | AREA_MN | SHAPE_MN | Water_Distance | Population Density | AIC | R² |
|---|---|---|---|---|---|---|---|---|---|---|---|
| Summer | 360 m | −0.081 *** | −0.002 *** | 0.014 *** | 0.025 *** | 0.075 *** | −0.179 | 0.000 *** | 0.022 *** | 67,392.8 | 0.424 |
| (−0.610) | (−0.181) | (0.250) | (0.155) | (0.077) | (−0.019) | (0.058) | (0.215) | ||||
| 510 m | −0.076 ** | −0.003 *** | 0.017 *** | 0.024 *** | 0.028 ** | −0.220 | 0.000 *** | 0.022 *** | 34,568.3 | 0.459 | |
| (−0.585) | (−0.221) | (0.289) | (0.143) | (0.057) | (−0.022) | (0.077) | (0.217) | ||||
| 720 m | −0.077 ** | −0.001 *** | 0.017 *** | 0.039 *** | 0.016 * | −0.022 | 0.000 ** | 0.024 *** | 17,156.5 | 0.474 | |
| (−0.562) | (−0.226) | (0.256) | (0.193) | (0.061) | 0.000 ** | (0.051) | (0.219) | ||||
| 960 m | −0.073 ** | −0.001 *** | 0.019 *** | 0.056 *** | 0.008 * | −0.177 | 0.000 | 0.024 *** | 9729.38 | 0.551 | |
| (−0.533) | (−0.241) | (0.264) | (0.238) | (0.056) | (−0.015) | (0.013) | (0.223) | ||||
| Transition Season | 360 m | −0.040 *** | −0.001 *** | 0.007 *** | 0.012 *** | −0.008 | 0.102 | 0.000 * | 0.007 *** | 53,706 | 0.432 |
| (−0.540) | (−0.169) | (0.235) | (0.131) | (−0.014) | (0.019) | (−0.018) | (0.117) | ||||
| 510 m | −0.038 *** | −0.002 *** | 0.009 *** | 0.012 *** | −0.011 * | 0.040 | 0.000 | 0.006 *** | 27,337.2 | 0.472 | |
| (−0.526) | (−0.207) | (0.277) | (0.123) | (0.040) | (0.007) | (0.008) | (0.112) | ||||
| 720 m | −0.036 *** | −0.001 *** | 0.009 *** | 0.019 *** | −0.006 | 0.197 | 0.000 *** | 0.007 *** | 13,485 | 0.495 | |
| (−0.474) | (−0.212) | (0.236) | (0.167) | (0.041) | (0.032) | (0.070) | (0.114) | ||||
| 960 m | −0.040 *** | −0.001 *** | 0.010 *** | 0.030 *** | −0.006 * | −0.007 | 0.000 | 0.007 *** | 7571.76 | 0.538 | |
| (−0.533) | (−0.226) | (0.258) | (0.231) | (−0.068) | (−0.001) | (0.019) | (0.113) | ||||
| Winter | 360 m | −0.019 *** | −0.001 *** | 0.004 *** | 0.004 *** | 0.022 ** | 0.034 | 0.000 *** | 0.002 *** | 45,041.6 | 0.290 |
| (−0.425) | (−0.231) | (0.218) | (0.081) | (0.065) | (0.010) | (−0.076) | (0.049) | ||||
| 510 m | −0.018 *** | −0.002 *** | 0.005 *** | 0.004 ** | 0.004 | 0.070 | 0.000 *** | 0.001 *** | 22,555 | 0.334 | |
| (−0.407) | (−0.274) | (0.248) | (0.071) | (0.023) | (0.021) | (−0.064) | (0.044) | ||||
| 720 m | −0.016 *** | −0.001 *** | 0.005 *** | 0.006 ** | 0.003 | 0.193 | 0.000 *** | 0.002 ** | 11,323.9 | 0.362 | |
| (−0.333) | (−0.299) | (0.202) | (0.089) | (0.039) | (0.050) | (−0.151) | (0.048) | ||||
| 960 m | −0.018 *** | −0.001 *** | 0.005 *** | 0.012 ** | −0.001 | 0.084 | 0.000 * | 0.002 * | 6371.76 | 0.399 | |
| (−0.392) | (−0.325) | (0.225) | (0.150) | (0.012) | (0.020) | (−0.064) | (0.044) |
| Season | Scale(m) | PLAND | PD | ED | AI | AREA_MN | SHAPE_MN | Water_Distance | Population Density | AIC | R² |
|---|---|---|---|---|---|---|---|---|---|---|---|
| Summer | 360 m | −0.035 *** (−0.269) | −0.001 *** (−0.174) | 0.005 *** (0.089) | 0.008 *** (0.049) | 0.0422 *** (0.043) | −0.009 (0.000) | 0.000 *** (0.154) | 0.007 *** (0.064) | 55,629.1 | 0.827 |
| 510 m | −0.049 *** (−0.380) | −0.003 *** (−0.205) | 0.008 *** (0.146) | 0.006 ** (0.033) | 0.022 ** (0.044) | −0.083 (−0.009) | 0.000 *** (0.183) | 0.003 * (0.034) | 28,148.5 | 0.845 | |
| 720 m | −0.054 *** (−0.394) | −0.001 *** (−0.236) | 0.008 *** (0.134) | 0.016 ** (0.081) | 0.009 (0.035) | −0.022 (0.002) | 0.000 *** (0.177) | 0.006 * (0.059) | 15,234.9 | 0.763 | |
| 960 m | −0.059 *** (−0.437) | −0.002 *** (−0.281) | 0.012 *** (0.175) | 0.018 ** (0.077) | 0.003 (0.024) | 0.155 (0.013) | 0.000 * (0.162) | 0.006 * (0.063) | 8734 | 0.763 | |
| Transition Season | 360 m | −0.016 *** (−0.218) | −0.000 *** (−0.162) | 0.003 *** (0.093) | 0.005 *** (0.054) | 0.018 ** (0.033) | 0.024 (0.005) | 0.000 ** (0.099) | 0.003 *** (0.059) | 41,941.6 | 0.830 |
| 510 m | −0.023 *** (−0.318) | −0.002 *** (−0.186) | 0.005 *** (0.154) | 0.0038 ** (0.040) | 0.011 ** (0.040) | −0.032 (−0.006) | 0.000 *** (0.119) | 0.0012 * (0.033) | 21,081.8 | 0.844 | |
| 720 m | 0.026 *** (−0.338) | −0.000 *** (−0.214) | 0.005 *** (0.144) | 0.008 *** (0.076) | 0.003 (0.024) | 0.077 (0.012) | 0.000 (0.039) | 0.003 * (0.050) | 11,714.4 | 0.759 | |
| 960 m | −0.029 *** (−0.397) | −0.000 *** (−0.239) | 0.007 *** (0.188) | 0.014 *** (0.106) | −0.000 (−0.005) | 0.057 (0.009) | 0.000 (0.096) | 0.003 (0.048) | 6637 | 0.767 | |
| Winter | 360 m | −0.009 *** (−0.207) | −0.000 *** (−0.217) | 0.002 *** (0.093) | 0.003 *** (0.057) | 0.014 ** (0.043) | −0.012 (−0.004) | −0.000 *** (−0.139) | 0.002 ** (0.046) | 36,329 | 0.711 |
| 510 m | −0.014 *** (−0.326) | −0.001 *** (−0.257) | 0.003 *** (0.163) | 0.003 ** (0.054) | 0.010 *** (0.062) | −0.077 (−0.023) | 0.000 (−0.016) | 0.000 (0.028) | 17,549.6 | 0.749 | |
| 720 m | −0.013 *** (−0.284) | −0.000 *** (−0.289) | 0.002 *** (0.128) | 0.006 ** (0.079) | 0.005 * (0.053) | −0.028 (−0.007) | −0.000 *** (−0.153) | 0.001 (0.042) | 9942.35 | 0.639 | |
| 960 m | −0.016 *** (−0.336) | −0.000 *** (−0.319) | 0.004 *** (0.166) | 0.007 *** (0.091) | 0.001 (0.031) | −0.029 (−0.007) | −0.000 (−0.025) | 0.001 (0.047) | 5439.88 | 0.693 |
Publisher’s Note: MDPI stays neutral with regard to jurisdictional claims in published maps and institutional affiliations. |
© 2021 by the authors. Licensee MDPI, Basel, Switzerland. This article is an open access article distributed under the terms and conditions of the Creative Commons Attribution (CC BY) license (https://creativecommons.org/licenses/by/4.0/).
Share and Cite
Yang, L.; Yu, K.; Ai, J.; Liu, Y.; Lin, L.; Lin, L.; Liu, J. The Influence of Green Space Patterns on Land Surface Temperature in Different Seasons: A Case Study of Fuzhou City, China. Remote Sens. 2021, 13, 5114. https://doi.org/10.3390/rs13245114
Yang L, Yu K, Ai J, Liu Y, Lin L, Lin L, Liu J. The Influence of Green Space Patterns on Land Surface Temperature in Different Seasons: A Case Study of Fuzhou City, China. Remote Sensing. 2021; 13(24):5114. https://doi.org/10.3390/rs13245114
Chicago/Turabian StyleYang, Liuqing, Kunyong Yu, Jingwen Ai, Yanfen Liu, Lili Lin, Lingchen Lin, and Jian Liu. 2021. "The Influence of Green Space Patterns on Land Surface Temperature in Different Seasons: A Case Study of Fuzhou City, China" Remote Sensing 13, no. 24: 5114. https://doi.org/10.3390/rs13245114