
Long-Term Gully Erosion and Its Response to Human Intervention in the Tableland Region of the Chinese Loess Plateau


1
College of Soil and Water Conservation, Beijing Forestry University, Beijing 100083, China
2
Forest Ecosystem Studies, National Observation and Research Station, Jixian 042200, China
*
Author to whom correspondence should be addressed.
Remote Sens. 2021, 13(24), 5053; https://doi.org/10.3390/rs13245053
Submission received: 8 November 2021
/
Revised: 4 December 2021
/
Accepted: 9 December 2021
/
Published: 13 December 2021
(This article belongs to the Special Issue Agricultural Water Management Using Geospatial Technologies)
Abstract
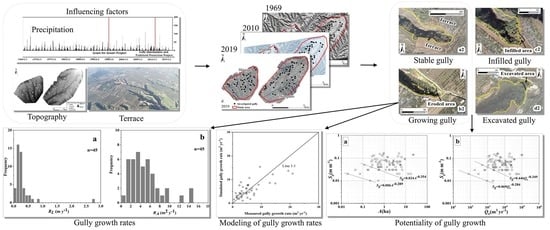
:The gully erosion process is influenced by both natural conditions and human activities on the tableland region, the Chinese Loess Plateau, which is a densely populated agricultural area with unique topography. For the purpose of assessing long-term gully growth rates, the influencing factors and potential of gully growth, KH-4B satellite images, Quickbird-2 images, and unmanned aerial vehicle (UAV) images were used to assess gully erosion from 1969 to 2019. The effects of runoff, topography and human activities were analyzed with information derived from historical and present images. Ninety-five investigated gullies were classified into four types: 45 growing, 25 stable, 21 infilled and four excavated gullies. The rates (RA) of 45 growing gullies ranged from 0.50 to 20.94 m2·yr−1, with an average of 5.66 m2·yr−1 from 1969 to 2010. The present drainage area, local slope, average drainage slope, annual runoff, and ratio of the terraced area were all significantly different between the stable and growing gullies. The long-term gully growth rate could be estimated using a nonlinear regression model with annual runoff (Qa) and the slope of the drainage area (Sd) as predictors (RA = 0.301Qa0.562 Sd, R2 = 0.530). Based on the Sg-A and Sg-Qa relationship that was used to reveal the threshold conditions for gully growth, all growing gullies still have the potential to keep growing, but soil and water conservation measures, including terraces, could change the threshold condition by reducing the effective drainage area. The results of this study could be helpful for preventing further gully erosion by dealing with gullies far above the threshold line.
1. Introduction
Gully erosion is the process whereby water accumulates and often recurs in narrow channels and, over short periods, removes the soil from this narrow area to considerable depths, as defined by the Soil Science Society of America (https://www.soils.org/publications/soils-glossary/#, accessed on 1 October 2021). Gully erosion represents a minimum of 10% to a maximum of 94% of the total sediment yield caused by water erosion [1], which is a major driver of land degradation on the global scale [2,3,4,5]. To control gully erosion, understanding gully head initiation and growth is necessary [1,2,3,4,6,7]. Gullies were developed only when the intensity of concentrated (overland) water flows during a rain event exceeded the threshold [1]. However, flow hydraulics for gully initiation are constrained in field measurements [1,3]. The critical environmental conditions of gullies were assessed in terms of precipitation [8], topography [7,9], soils and land use [10,11]. These factors control either the runoff hydraulics (e.g., precipitation, topography) or the resistance of the soil surface to incision (e.g., soils) or both (e.g., land use) [1].
Frankl et al. [12] found that the average headcut growth rate during the 2010 rainy season was 0.34 m·yr−1, compared with 3.8 m·yr−1 during medium to long time periods (1–47 years) in northern Ethiopia. Vandekerckhove et al. [13] found that gully headcut growth rates varied from 0.00 to 0.86 m·yr−1 during the medium term (21–38 years) in Southeast Spain. Ionita et al. [14] found that the mean gully head retreat rate of 14 gullies was 7.7 m·yr−1 during 1961–2020 on the Moldavian Plateau of Romania. However, Nicu [15] investigated the gully erosion rate of three typical gullies also on the Moldavian Plateau from 1976 to 2013 and found that the average rate was approximately 0.1–0.15 m·yr−1. These studies show that gully growth rates vary greatly under different conditions. Vanmaercke et al. [4,5] pointed out that gully head growth rates can be subject to very large temporal variabilities. Nevertheless, understanding gully growth over a long-term period is essential, especially when addressing the consequences of future land use and climate change scenarios [1,2,16].
It is difficult to detect long-term gully growth rates in many regions because of the unavailability of historical data. Satellite and airborne images have been widely used for measuring gully head retreats over medium- to long-term time scales [13,17,18,19,20,21,22]. Good estimations of gully retreat by remote sensing require a high spatial resolution of the images [13]. Recently, widespread unmanned aerial vehicles (UAVs) have become flexible and cost-efficient for acquiring gully statuses. Simultaneous advances in computer vision and digital photogrammetry, which enable the fast and facile generation of digital surface models (DSMs) with high resolution and accuracy [23,24,25], have boosted the establishment of UAVs as a suitable field survey method. Several previous studies already adopted DSMs with as high as cm-accurate resolution calculated from UAV images for volume estimations, erosion rate measurements, morphological analyses and monitoring of gully growth [8,17,22,25,26]. Therefore, a good way to detect long-term and large-scale gully growth rates is to compare historical satellite images with present UAV images.
On the Chinese Loess Plateau, severe soil erosion has carved hundreds of thousands of gullies in the landscape [27], and gully erosion is an important soil erosion process, contributing 60~90% of the total sediment production in agricultural areas [28,29]. The hilly gully region, which is the main part of the Loess Plateau, has received wide attention with respect to gully erosion and its controlling factors in previous studies [30,31,32]. However, the tableland region, which covers approximately 2 × 10⁵ km2, is the most important agricultural region on the Loess Plateau [33]. The tableland region is characterized by broad and flat top surfaces (average slope gradient < 0.09 m·m−1) threatened by surrounding deep gully systems (Figure 1). Gully erosion induced by concentrated flow generated from the loess tableland top flat surface is the main source of sediment yield in the tableland region [34], and many soil conservation measures have been put into practice, such as water barriers along gully boundaries and terraces on the sloping cropland to control gully erosion around the tableland, check dams to stabilize the channel since the 2010’s. In Romania, these measures, like check dams [14] are also used to control gully erosion. However, the understanding of gully head growth in the loess tableland region, especially in the long term, has been limited in previous studies. The unique topography of the tableland region and the dense population have led to differences in hydrologic conditions (e.g., runoff discharge and velocity) and hydrological connectivity as well as human intervention from other regions, which may influence gully erosion processes [35,36,37]. Therefore, investigation of the long-term gully erosion dynamics in such areas is of great significance for broadening the knowledge of gully erosion and its relationships with human activities.
This study aimed to examine the changes in gullies over a time scale of 50 years under the influence of intense human activities in the tableland region of the Loess Plateau. The specific objectives of this study were to (1) estimate gully head growth rates and the main factors influencing these growth rates from 1969 to 2019, (2) build a regression model of gully growth rates for gullies with little human intervention, and (3) determine the topographic thresholds and potentials of gully growth in the tableland region on the Loess Plateau.
2. Materials and Methods
2.1. Study Area
The Zhongduo tableland (110.67–110.75°E, 35.97–36.04°N; 32 km2) and the Shiquan tableland (110.60–110.66°E, 35.97–36.03°N; 20 km2) on the southeastern Loess Plateau were selected as study areas; they are located in Jixian County, Shanxi Province, China (Figure 1). The loess cover is approximately 150 m thick, and the main soil type is loessial carbonate cinnamon soil with weak alkalinity in the study area. There is a typical temperate continental monsoon climate with an average annual precipitation of 507.47 mm and an average annual erosive precipitation (precipitation > 12 mm·d−1) of 314.71 mm (1957–2019) (based on meteorological records from the China Meteorological Data Service Centre [CMDC], http://data.cma.cn/, accessed on 9 August 2020). Approximately 70% of precipitation events occur from June to September. People mainly live on the flat surface of the tableland, which has agricultural advantages. Most of the tableland area was reclaimed as farmland in the study area. Before the implementation of the Grain for Green Project (GFGP) in 2000, the main land use types were croplands for growing wheat (Triticum aestivum), corn (Zea mays), soybeans (Glycine max), and flue-cured tobacco (Nicotiana tabacum). Since 2000, most of the croplands have been converted into apple orchards for both economic benefits and mitigating soil erosion. The valley area is dominated by forestland and shrubland due to natural vegetation restoration. The Gully Stabilization and Tableland Protection Project (GSTP) was launched in the 2010s to stabilize the channel and control gully erosion around the tableland, which includes water barriers, terraces, check dams, etc.
2.2. Base Data Collection and Gully Sampling
KH-4B satellite images, Quickbird-2 satellite images and UAV images were used to acquire information about topography, land use and land cover in 1969, 2010 and 2019, respectively (Table 1). KH-4B (where KH is Key Hole), a space reconnaissance satellite launched during the cold war era, offered the best ground resolution of approximately 1.8 m [38]. During the operational phase, panchromatic images of large areas of the world were recorded on film. These satellite images were declassified in 1995 and have been available to the public since then and are used for environmental and resource research [38,39] (KH-4B images can be downloaded from the U.S. Geological Survey website, https://earthexplorer.usgs.gov/, accessed on 19 May 2020). The Quickbird-2 images contained four multispectral bands (MULs) with a 2.44 m spatial resolution and one panchromatic band (PAN) with a 0.61 m spatial resolution, which were fused to create a 0.61 m pansharpened image after the images were preprocessed (Table 1). UAV images were acquired in 2019 with a 0.14 m ground sampling distance (GSD) with a flying height of 500 m. Pix4Dmapper 4.4.12 software was used to automatically mosaic and process UAV images, to generate digital orthograph models (DOMs) and digital elevation models (DEMs) with a spatial resolution of 0.14 m. KH-4B and Quickbird-2 images were georeferenced to UAV images with a set of ground control points (GCPs) visible in all three image phases.
Gullies along the tableland boundary were investigated by even sampling, but the selected gullies needed to be easy to identify in the 1969, 2010, and 2019 images. The gully edges were interpreted visually from the KH-4B, Quickbird-2, and UAV images, and linear and areal gully growth rates (RL, m·yr−1 and RA, m2·yr−1) were calculated. The present drainage area (A, m2) of each investigated gully head, slope gradient at the gully head (Sg, m·m−1), and average slope of the drainage area (Sd, m·m−1) were extracted based on the DEMs generated from the UAV images. The land use types, including cropland, apple orchards, forestland, shrubland, grassland, bare land, fallow fields, paved roads, unpaved roads and construction sites as well as terraces in the drainage area in 1969, 2010, and 2019 were interpreted visually based on those images. All map layers were georeferenced to the UTM Zone 49N coordinate system.
Precipitation data from 1969 to 2019 were obtained from the CMDC (Figure 2). The precipitation records were divided into three periods (1969–1999, 2000–2014, and 2015–2019), representing records before the GFGP, after the GFGP, and after the GSTP. To explore the relationship between gully growth rates and precipitation characteristics, precipitation parameters were calculated, i.e., average annual precipitation, average annual erosive precipitation (>12 mm·d−1) [40], rainfall amount in storm events (>50 mm·d−1), and rainfall amount in heavy rainstorm events (>100 mm·d−1) [41].
2.3. Topographic and Hydraulic Parameter Calculation and Data Analysis
The stream power index (SPI) is a parameter related to surface and subsurface runoff transport processes [42] and has been widely used in gully erosion susceptibility research [43,44,45,46]. The SPI at the gully head was calculated as follows:
where A is the present drainage area (m2) and Sd is the average slope in the drainage area (m·m−1).
SPI = A0.5Sd
The runoff onto one gully head (Qgh, m3) from the drainage area with certain land use scenarios was calculated as follows:
where Qi is the runoff depth (mm) of land use type i, Ai is the area (m2) of land use type i in the drainage area of each gully head, and n is the number of land use types in the drainage area of each gully head.
The NRC runoff curve number method (CN method, USDA-National Engineering Handbook, Part 630, Chapter 10, www.nrcs.usda.gov/wps/portal/nrcs/detailfull/national/water/manage/hydrology, accessed on 13 January 2021) was used to estimate the event runoff of land use type i onto the gully head from the drainage area (Qi), which takes the impact of land use and precipitation into account [5,47,48].
where P is rainfall (mm), Si is the maximum potential loss to runoff for land use type i (mm), λ is the fraction of S representing the initial abstraction coefficient (λ is 0.2 in this paper), and CNi is the curve number of land use type i. Key impact factors of the curve number (CN) include soil properties, land use type, slope, antecedent moisture conditions, vegetation coverage, and land management practices [49,50]. Different land uses were assigned to different CN values (Table 2) based on previous research on similar land uses on the Loess Plateau [51].
Runoff in 3 periods (1969–1999, 2000–2014, and 2015–2019) generated by annual average total precipitation (Pa69, Pa10, and Pa19), erosive precipitation (Pae69, Pae10, and Pae19), accumulated rainfall in rainstorm events (Pr69, Pr10, and Pr19), and accumulated rainfall in heavy rainstorm events (Phr69, Phr10, and Phr19) were calculated via Equation (3) and corresponding land use scenarios (1969, 2010, and 2019) as follows:
where Qa (m3·yr−1) and Qae (m3·yr−1) are the annual average runoff in 51 years from 1969 to 2019 caused by total precipitation and erosive precipitation, respectively; Qr (m3) and Qhr (m3) are the accumulated runoff generated by rainstorms (39 events) and heavy rainstorms (2 events), respectively, from 1969 to 2019. The same method can be used to calculate the annual average runoff (Qa6910 and Qae6910, m3·yr−1) and accumulated runoff (Qr6910, m3) generated by rainstorms (38 events) from 1969 to 2010.
2.4. Statistical Analysis and Assessment Methods
Classical statistics, such as measures of center, variation and shape, were used to assess the change of gully dimensions. The Mann–Whitney test and Pearson chi-square test (χ2) were used to compare the differences in A, Sd, Sg, and Qgh between the 2 types of gullies (growing and stable). Pearson correlation coefficients (r) were used to evaluate the relationships of A, Sd, Sg, and Qgh to the gully head growth rates. Nonlinear regression was used to fit models for the gully growth rates. The coefficient of determination (R2) and significant level of F test were used to evaluate the performance of the regression models. SPSS 24 software was used for statistical calculation and model parameter calibration.
3. Results
3.1. Gully Growth from 1969 to 2019
According to changes in the gully edges from 1969 to 2019, 95 investigated gullies were classified into four types: stable, growing, infilled, and excavated (Figure 3). Twenty-five gullies were classified as stable and had no obvious changes between the 1969 and 2019 images. Infilled and excavated gullies showed obvious gully area changes caused by human activities. Twenty-one gullies were infilled with a decrease in gully area ranging from 30.22 to 708.17 m2, with an average of 257.15 m2. These infilled gullies enlarged the tableland area and prevented further gully headcuts locally. Four gullies were excavated with increases in gully areas of 71.74, 185.41, 244.16, and 355.16 m2. Two of the four excavated gullies were excavated for cave dwellings, and another two gullies were cut on slopes to prevent landslides. The average present drainage area, local slope, and average annual linear/areal gully growth rate of the four types of gullies are listed in Table 3. Among the 95 investigated gullies, 51 gullies were located on the Zhongduo tableland, and 44 gullies were located on the Shiquan tableland (Figure 4).
Forty-five gullies developed from 1969 to 2010. However, 26 of the 45 growing gullies were stable, and 2 of the 45 gullies were infilled during 2010–2019. Only 17 gullies kept growing from 2010 to 2019. The RL values from 1969 to 2010 of the 45 growing gullies ranged from 0.04 to 2.78 m·yr−1, with an average of 0.30 m·yr−1, and the RL values of 34 gullies were less than 0.30 m·yr−1. The highest RL value was 2.78 m·yr−1, which was probably due to the unpaved road on the gully head as a concentrated channel for runoff leading to gully growth (Figure 5a). The RA values from 1969 to 2010 of the 45 growing gullies ranged from 0.50 to 20.94 m2·yr−1, with an average of 5.66 m2·yr−1. Fifty percent of the RA values ranged from 2.64 to 6.72 m2·yr−1 (Figure 5b).
3.2. Influencing Factors of and Modeling of Gully Growth Rates
Infilled and excavated gullies were controlled by human activity; therefore, they were not taken into consideration for further analysis of the factors that influence gully growth rates.
Gullies without obvious human intervention were analyzed to determine the influencing factors from the aspects of topography and hydraulics. The Mann–Whitney test indicated that the differences in four influencing factors (A, Sg, Sd, and Qgh) between growing gullies and stable gullies were statistically significant (p < 0.05). The average A values of growing and stable gullies were 2.96 ha and 2.08 ha, respectively. The average Sg values of the growing and stable gully heads were 0.07 m·m−1 and 0.05 m·m−1, respectively. The average Sd values of the growing and stable gully heads were 0.11 m·m−1 and 0.16 m·m−1, respectively. The Qa values of the growing and stable gully heads were 12942.49 m3·yr−1 and 8351.19 m3·yr−1, respectively. The Pearson chi-square test indicated that gullies were growing or stable and depended significantly on the presence/absence of terraces in 1969 (χ2 = 14.731, p < 0.001). Among the 25 stable gullies from 1969 to 2019, 15 were drained areas with terraces since 1969, while among the 45 growing gullies, 7 were drained areas with terraces since 1969. This result showed that terraces, as an effective soil and water conservation measure, had strong effects on gully growth in the past 50 years in the tableland region.
Pearson’s correlation tests were used to examine the relationship between 45 growing gullies and their influencing factors. No significant correlations were found between Sd or Sg and gully growth rates from 1969 to 2010, while A, Qa6910, Qae6910, Qr6910, and Qhr correlated significantly with the gully head growth rates from 1969 to 2010 (Table 4). Compared to the relationship between RL and its influencing factors, larger correlation coefficients were found between RA and its factors. The correlation coefficients between RA and Qa6910, Qae6910, and Qhr were larger than those between RA and A. These results indicate that gully growth rates were significantly influenced by runoff.
Nonlinear regression models for the gully growth rate from 1969 to 2010 were fitted, as summarized in Table 5. Drainage areas were widely used as surrogates for surface or subsurface runoff in previous studies of gully erosion [52], but the low R2 indicated that they did not work well in this study. Compounding the average annual runoff (Qa6910) and average slope of the drainage area (Sd) presented a better performance in modeling the gully growth rate, as shown in Equation (12) in Table 5. The measured RA of each gully and the corresponding RA simulated by Equation (12) is plotted in Figure 6, suggesting the good performance of Equation (12).
3.3. Threshold Conditions of Gully Head Growth
The topographic slope-area (Sg-A) relationship has been widely used to understand the threshold conditions for gully initiation and development [7,52] and is commonly expressed in critical Sg-A relationships, i.e., Sg = kA−b. The Sg-A relationship of stable gullies was fitted with the lowermost data points with Sg = 0.006−0.289, and the threshold condition for growing gullies was Sg = 0.024A−0.354 (Figure 7a). The present drainage area (A) of 45 growing gullies ranged from 0.25 to 22.44 ha, with an average of 2.96 ha, and the Sg values ranged from 0.02 to 0.16 m·m−1, with an average of 0.07 m·m−1. The A values of 25 stable gullies ranged from 0.02 to 17.2 ha, with an average of 2.08 ha, and the Sg values ranged from 0.01 to 0.13 m·m−1, with an average Sg of 0.05 m·m−1. Both the average A and average Sg of growing gullies were larger than those of stable gullies, and the k values of growing gullies were much larger than the k values of stable gullies, indicating that growing gullies have the potential to keep growing (Figure 7a).
On the other hand, Figure 7a shows that 17 stable gullies were above the line Sg = 0.024 A−0.354, among which 10 gullies developed terraces in their drainage area since 1969, indicating that the terraces could change the threshold condition by reducing the effective drainage area. Then, the critical relationship Sg-Qa can reveal the threshold conditions for gully growth better than the Sg-Qa relationship because gully erosion is driven mainly by accumulated runoff, which is usually substituted with drainage area (Figure 7b). Critical conditions for stable and growing gullies were Sg = 0.483Qa−0.359 and Sg = 0.070Qa−0.286, respectively. The minimum annual average runoff onto the investigated growing gullies was approximately 1000 m3·yr−1, compared with 80 m3·yr−1 for the investigated stable gullies. Among 45 growing gullies, 17 gullies that still grew from 2010 to 2019 are marked as gray dots in Figure 7.
4. Discussion
4.1. Long-Term Gully Growth Rates in the Tableland of the Loess Plateau
Gully growth rates in different studies are listed in Table 6. Compared with the hilly gully region in the medium- or long-term, the average RL (0.30 m·yr−1) in the tableland region in this study was lower. The first reason may be the much smaller slope gradients of the drainage area on the tableland than in the hilly gully region. When the hydraulic radius is constant, the shear stress of the shallow flow is proportional to the slope gradient [53]; therefore, gentler slopes may produce a smaller shear stress of the shallow flow. At the same time, the slope gradient is related to hydrological connectivity [35,36,37]. Hydrological connectivity can be quantitatively described by topographic parameters, including the slope gradient and upslope area [54], so that gentler slopes may result in lower hydrological connectivity. In addition, soil and water conservation measures are very common in the study area and have an effect on hydrological connectivity. The tableland boundary was ridged with a shrub belt, and small reservoirs in the drainage area could reduce direct runoff into gullies. Terraces can also lead to a further decrease in hydrological connectivity [36,55]. The hydrological connectivity of the drainage area on the tableland should be lower than that in the hilly gully region owing to the gentler slope, soil and water conservation measures, and piping erosion in the drainage area. Lower hydrological connectivity may be the main reason for the lower gully growth rates in the tableland region. The average RL (0.30 m·yr−1) in this study was also lower (Table 6) than the gully growth rate in the Moldavian Plateau of Romania, where the topographical characters are similar to the hilly gully region of the Loess Plateau and the higher RL could be owed to the massive deforestation in 1990. Although the gully growth rates in the tableland regions were relatively low, unpaved roads with high erodibility, as the key components of hydrological connectivity [36], could lead to gully growth [56,57]. An unpaved road to the gully head may be the main reason for the largest erosion rate. Thus, soil and water conservation measures should focus on unpaved roads in tableland regions in the future.
Runoff is the main driver of gully headcuts because gully heads can only develop if concentrated (overland) flow intensity during a rain event exceeds a threshold value [1]. However, measuring critical flow hydraulics (e.g., runoff discharge and velocity) for gully erosion is constrained under field conditions [1,3,5]. The CN method provides an approach to estimate direct runoff in a certain land use type [47,48,49]. Likewise, combining a pixel-based CN approach with flow-routing algorithms makes it possible to account for the effect of the spatial patterns of topography, soil conditions and land cover [5]. Resent research has also found that runoff estimated by the CN method could be a good predictor for gully erosion at the rainstorm event scale [57]. In this study, the annual average runoff estimated by the CN method (Qa) was used to fit a nonlinear regression model for the long-term areal gully growth rate (RA =0.301Qa0.562 Sd, R2 = 0.530), suggesting that the long-term gully growth rate could be estimated with runoff and the slope of the drainage area as predictors. Soil and water conservation measures affect gully erosion by reducing runoff or slope gradients, which could be taken into account with the model presented in this study. However, it is difficult to accurately estimate runoff from the drainage area in the tableland of the Loess Plateau because soil and water conservation measures, including small reservoirs, could reduce runoff into the gullies, and there is sometimes piping erosion in the drainage areas. This can explain why the gully growth rate model built in this study with runoff as a predictor did not work as well as the models in previous studies [56,57]. This study mainly focused on the effects of topography, land uses and conservation practices with a reasonable assumption that soil properties varies slightly on the loess covered area [60]. The main soil type in the study area is the loessial soil that has a composition of more than 50% silt (0.002–0.05 mm) and less than 20% clay (<0.002 mm), and a porosity of approximately 50% [61], leading to very high infiltration capacity [61]. Nevertheless, further researches should be carried to investigate the variation of the soil properties and the infiltration rates caused by land use changes.
4.2. Topographic Thresholds of Gully Growth
The topographic threshold is the most common approach to understanding the critical condition for gully initiation and development [5,7,52]. Based on 45 growing gully heads and 25 stable gully heads, S-A relationships were fitted in this study, following the methods in previous research [7,52]. Parameters k and b showed very large variabilities in different environments [7], and variations in k seem mainly attributable to differences in land cover under the assumption that b is relatively constant [5,7]. The low k value indicated that the land cover condition in the study area was more prone to erosion [7]. For exponent b, the results of this study (b = 0.289) are comparable to those of several previous studies (Table 7).
The Sg-Qa relationship can express the threshold conditions better than the Sg-A relationship [57] because the drainage area is only a substitute for runoff [52]. However, runoff from the drainage area was not estimated accurately in the tableland of the Loess Plateau (Section 4.1) so that the Sg-Qa relationship is not much better than the Sg-A relationship in this study.
4.3. Potentiality of Gully Growth
Gully erosion occurs when threshold conditions are exceeded and is controlled by the integrated effects of rainfall, flow hydraulics, topography, soil type, and land use [62,65,66,67]. In other words, a gully can be stable if the threshold is not exceeded. Topographic thresholds can partly explain the development of gullies. Figure 7a shows that growing gullies are far above the critical line, Sg = 0.006A−0.289, indicating that, in terms of topographic conditions, these growing gullies have the potential to continue growing and gullies farther away from the threshold line have greater potential to grow. However, 25 gullies remained stable during 1969–2019, among which 15 gullies had terraces in their drainage area according to the images of 1969 and 2019, and 24 gullies had terraces in their drainage area according to the images of 2019. Terraces can change the effective drainage area by reducing runoff from the drainage area and then influencing gully erosion.
Since the GFGP and GSTP were put into practice in the tableland region of the Loess Plateau, soil and water conservation measures, including small reservoirs, terraces, shrub belts, and water barriers, have been widely adopted (Figure 8). Among 45 growing gullies from 1969 to 2010, only 17 continued to grow from 2010 to 2019, suggesting that the GFGP and GSTP reduced gully erosion to some extent. Gully erosion in the study area has been intervened with greatly by human activity. Some gullies were infilled and excavated by human activities directly, which are easily recognized. However, in most cases, gully development is influenced indirectly by soil and water conservation measures, land use changes, roads constructions, water conservancy facilities, etc. Quantifying of these effects need to be integrated with reliable runoff simulation model, which should be taken into consideration for future studies. On the other hand, studies have reported that several single rainfall events with high rainfall intensities promote the formation and development of gullies [56,65,68,69,70]. With the gully growth potential in terms of topographic conditions, whether soil and water conservation measures are effective for gully erosion under extremely high rainfall intensity needs further investigation. However, the results of this study are still helpful for preventing further gully erosion by dealing with gullies far above the threshold line.
5. Conclusions
In this study, high-resolution images were used to investigate gully growth rates from 1969 to 2019. Forty-five of 95 investigated gullies grew from 1969 to 2010 at rates ranging from 0.50 to 20.94 m2·yr−1 (0.04 to 2.78 m·yr−1), with an average of 5.66 m2·yr−1 (0.30 m·yr−1). Twenty-five gullies were stable, 21 gullies were infilled, and four were excavated by human intervention. The present drainage area, local slope, average drainage slope, annual runoff, and ratio of terraced area were all significantly different between the stable and growing gullies. For growing gullies, runoff is an important factor that influences the gully growth rates. The long-term areal gully growth rate (RA) could be estimated using a nonlinear regression model with the annual average runoff (Qa) and average slope of the drainage area (Sd) as predictors (RA = 0.301Qa0.562 Sd, R2 = 0.530). Based on 45 growing gullies and 25 stable gullies, the Sg-Qa relationship was able to reveal the threshold conditions for gully growth. Based on the threshold conditions, all growing gullies still have the potential to keep growing, while soil and water conservation measures could change the threshold condition by reducing the effective drainage area. An increasing number of gullies would possibly remain stable in the future since GFGP and GSTP were launched. Many soil and water conservation measures (including terraces, small reservoirs, shrub belts, etc.) and change of cropland to apple orchards have strong effects on gully erosion mitigation. The results of this study could be helpful for preventing further gully erosion by dealing with gullies far above the threshold line.
Author Contributions
Conceptualization, Y.Z. (Yan Zhang); methodology, Y.Z. (Yan Zhang) and J.W.; software, J.W.; validation, J.W.; formal analysis, J.W.; investigation, J.W., J.D., S.Y. and Y.Z. (Yiyang Zhao); resources, Y.Z. (Yan Zhang); data curation, Y.Z. (Yan Zhang) and J.W.; writing—original draft preparation, Y.Z. (Yan Zhang) and J.W.; writing—review and editing, Y.Z. (Yan Zhang) and J.W.; visualization, J.W.; supervision, Y.Z. (Yan Zhang); project administration, Y.Z. (Yan Zhang); funding acquisition, Y.Z. (Yan Zhang). All authors have read and agreed to the published version of the manuscript.
Funding
This study was supported by the State Key Program of National Natural Science of China (No. 42130701) and the National Natural Science Foundation of China (No. 42177309).
Institutional Review Board Statement
Not applicable.
Informed Consent Statement
Not applicable.
Data Availability Statement
The data presented in this study are available on request from the corresponding author.
Acknowledgments
The authors thank Dong Wei for his assistance with fieldwork.
Conflicts of Interest
The authors declare no conflict of interest.
References
- Poesen, J.; Nachtergaele, J.; Verstraeten, G.; Valentin, C. Gully erosion and environmental change: Importance and research needs. Catena 2003, 50, 91–133. [Google Scholar] [CrossRef]
- Valentin, C.; Poesen, J.; Li, Y. Gully erosion: Impacts, factors and control. Catena 2005, 63, 132–153. [Google Scholar] [CrossRef]
- Castillo, C.; Gómez, J.A. A century of gully erosion research: Urgency, complexity and study approaches. Earth-Sci. Rev. 2016, 160, 300–319. [Google Scholar] [CrossRef]
- Vanmaercke, M.; Poesen, J.; Van Mele, B.; Demuzere, M.; Bruynseels, A.; Golosov, V.; Bezerra, J.F.R.; Bolysov, S.; Dvinskih, A.; Frankl, A.; et al. How fast do gully headcuts retreat? Earth-Sci. Rev. 2016, 154, 336–355. [Google Scholar] [CrossRef]
- Vanmaercke, M.; Panagos, P.; Vanwalleghem, T.; Hayas, A.; Foerster, S.; Borrelli, P.; Rossi, M.; Torri, D.; Casali, J.; Borselli, L.; et al. Measuring, modelling and managing gully erosion at large scales: A state of the art. Earth-Sci. Rev. 2021, 218, 103637. [Google Scholar] [CrossRef]
- Burkard, M.B.; Kostaschuk, R.A. Initiation and evolution of gullies along the shoreline of Lake Huron. Geomorphology 1995, 14, 211–219. [Google Scholar] [CrossRef]
- Torri, D.; Poesen, J. A review of topographic threshold conditions for gully head development in different environments. Earth-Sci. Rev. 2014, 130, 73–85. [Google Scholar] [CrossRef]
- Yuan, M.T.; Zhang, Y.; Zhao, Y.Y.; Deng, J.Y. Effect of rainfall gradient and vegetation restoration on gully initiation under a large-scale extreme rainfall event on the hilly Loess Plateau: A case study from the Wuding River basin, China. Sci. Total Environ. 2020, 739, 140066. [Google Scholar] [CrossRef]
- Vandaele, K.; Poesen, J.; Govers, G.; van Wesemael, B. Geomorphic threshold conditions for ephemeral gully incision. Geomorphology 1996, 16, 161–173. [Google Scholar] [CrossRef]
- Samani, A.N.; Chen, Q.W.; Khalighi, S.; Wasson, R.J.; Rahdari, M.R. Assessment of land use impact on hydraulic threshold conditions for gully head cut initiation. Hydrol. Earth Syst. Sci. 2016, 20, 3005–3012. [Google Scholar] [CrossRef] [Green Version]
- Rossi, M.; Torri, D.; Santi, E. Bias in topographic thresholds for gully heads. Nat. Hazards 2015, 79, 51–69. [Google Scholar] [CrossRef]
- Frankl, A.; Poesen, J.; Deckers, J.; Haile, M.; Nyssen, J. Gully head retreat rates in the semi-arid highlands of Northern Ethiopia. Geomorphology 2012, 173, 185–195. [Google Scholar] [CrossRef] [Green Version]
- Vandekerckhove, L.; Poesen, J.; Govers, G. Medium-term gully headcut retreat rates in Southeast Spain determined from aerial photographs and ground measurements. Catena 2003, 50, 329–352. [Google Scholar] [CrossRef]
- Ionita, I.; Niacsu, L.; Poesen, J.; Fullen, M.A. Controls on the development of continuous gullies: A 60 year monitoring study in the Moldavian Plateau of Romania. Earth Surf. Process. Landforms 2021, 46, 2746–2763. [Google Scholar] [CrossRef]
- Nicu, I.C. Is digital shoreline analysis system “fit” for gully erosion assessment? Catena 2021, 203, 105307. [Google Scholar] [CrossRef]
- Slimane, A.B.; Raclot, D.; Rebai, H.; Le Bissonnais, Y.; Planchon, O.; Bouksila, F. Combining field monitoring and aerial imagery to evaluate the role of gully erosion in a Mediterranean catchment (Tunisia). Catena 2018, 170, 73–83. [Google Scholar] [CrossRef]
- Marzolff, I.; Ries, J.B.; Poesen, J. Short-term versus medium-term monitoring for detecting gully-erosion variability in a Mediterranean environment. Earth Surf. Process. Landforms 2011, 36, 1604–1623. [Google Scholar] [CrossRef]
- Grellier, S.; Kemp, J.; Janeau, J.L.; Florsch, N.; Ward, D.; Barot, S.; Podwojewski, P.; Lorentz, S.; Valentin, C. The indirect impact of encroaching trees on gully extension: A 64 year study in a sub-humid grassland of South Africa. Catena 2012, 98, 110–119. [Google Scholar] [CrossRef]
- Frankl, A.; Poesen, J.; Haile, M.; Deckers, J.; Nyssen, J. Quantifying long-term changes in gully networks and volumes in dryland environments: The case of Northern Ethiopia. Geomorphology 2013, 201, 254–263. [Google Scholar] [CrossRef] [Green Version]
- Guyassa, E.; Frankl, A.; Zenebe, A.; Poesen, J.; Nyssen, J. Gully and soil and water conservation structure densities in semi-arid northern Ethiopia over the last 80 years. Earth Surf. Process. Landforms 2018, 43, 1848–1859. [Google Scholar] [CrossRef]
- Yibeltal, M.; Tsunekawa, A.; Haregeweyn, N.; Adgo, E.; Meshesha, D.T.; Aklog, D.; Masunaga, T.; Tsubo, M.; Billi, P.; Vanmaercke, M.; et al. Analysis of long-term gully dynamics in different agro-ecology settings. Catena 2019, 179, 160–174. [Google Scholar] [CrossRef]
- Guan, Y.B.; Yang, S.T.; Zhao, C.S.; Lou, H.Z.; Chen, K.; Zhang, C.B.; Wu, B.W. Monitoring long-term gully erosion and topographic thresholds in the marginal zone of the Chinese Loess Plateau. Soil Till. Res. 2021, 205, 104800. [Google Scholar] [CrossRef]
- James, M.R.; Robson, S. Mitigating systematic error in topographic models derived from UAV and ground-based image networks. Earth Surf. Process. Landforms 2014, 39, 1413–1420. [Google Scholar] [CrossRef] [Green Version]
- James, M.R.; Robson, S.; d’Oleire-Oltmanns, S.; Niethammer, U. Optimising UAV topographic surveys processed with structure-from-motion: Ground control quality, quantity and bundle adjustment. Geomorphology 2017, 280, 51–66. [Google Scholar] [CrossRef] [Green Version]
- Stöcker, C.; Eltner, A.; Karrasch, P. Measuring gullies by synergetic application of UAV and close range photogrammetry-A case study from Andalusia, Spain. Catena 2015, 132, 1–11. [Google Scholar] [CrossRef]
- Hosseinalizadeh, M.; Kariminejad, N.; Chen, W.; Pourghasemi, H.R.; Alinejad, M.; Behbahani, A.M.; Tiefenbacher, J.P. Spatial modelling of gully headcuts using UAV data and four best-first decision classifier ensembles (BFTree, Bag-BFTree, RS-BFTree, and RF-BFTree). Geomorphology 2019, 329, 184–193. [Google Scholar] [CrossRef]
- Chen, Y.P.; Wang, K.B.; Lin, Y.S.; Shi, W.Y.; Song, Y.; He, X.H. Balancing green and grain trade. Nat. Geosci. 2015, 8, 739–741. [Google Scholar] [CrossRef]
- Li, Y.; Poesen, J.; Yang, J.C.; Fu, B.; Zhang, J.H. Evaluating gully erosion using 137Cs and 210Pb/137Cs ratio in a reservoir catchment. Soil Till. Res. 2003, 69, 107–115. [Google Scholar] [CrossRef]
- Wu, Y.Q.; Cheng, H. Monitoring of gully erosion on the Loess Plateau of China using a global positioning system. Catena 2005, 63, 154–166. [Google Scholar] [CrossRef]
- Li, Z.; Zhang, Y.; Zhu, Q.K.; He, Y.M.; Yao, W.J. Assessment of bank gully development and vegetation coverage on the Chinese Loess Plateau. Geomorphology 2015, 228, 462–469. [Google Scholar] [CrossRef]
- Li, Z.; Zhang, Y.; Zhu, Q.K.; Yang, S.; Li, H.; Ma, H. A gully erosion assessment model for the Chinese Loess Plateau based on changes in gully length and area. Catena 2017, 148, 195–203. [Google Scholar] [CrossRef]
- Guo, W.Z.; Xu, X.Z.; Wang, W.L.; Liu, Y.K.; Guo, M.M.; Cui, Z.Q. Rainfall-triggered mass movements on steep loess slopes and their entrainment and distribution. Catena 2019, 183, 104238. [Google Scholar] [CrossRef]
- Guo, Q.K.; Ding, Z.W.; Qin, W.; Cao, W.H.; Lu, W.; Xu, X.M.; Yin, Z. Changes in sediment load in a typical watershed in the tableland and gully region of the Loess Plateau, China. Catena 2019, 182, 104132. [Google Scholar] [CrossRef]
- Guo, M.M.; Wang, W.L.; Wang, T.C.; Wang, W.X.; Kang, H.L. Impacts of different vegetation restoration options on gully head soil resistance and soil erosion in loess tablelands. Earth Surf. Process. Landforms 2020, 45, 1030–1050. [Google Scholar] [CrossRef]
- Fryirs, K. (Dis)Connectivity in catchment sediment cascades: A fresh look at the sediment delivery problem. Earth Surf. Process. Landforms 2012, 38, 30–46. [Google Scholar] [CrossRef]
- Bracken, L.J.; Wainwright, J.; Ali, G.A.; Tetzlaff, D.; Smith, M.W.; Reaney, S.M.; Roy, A.G. Concepts of hydrological connectivity: Research approaches, pathways and future agendas. Earth-Sci. Rev. 2013, 119, 17–34. [Google Scholar] [CrossRef] [Green Version]
- Conoscenti, C.; Agnesi, V.; Cama, M.; Caraballo-Arias, N.A.; Rotigliano, E. Assessment of gully erosion susceptibility using multivariate adaptive regression splines and accounting for terrain connectivity. Land Degrad. Dev. 2018, 29, 724–736. [Google Scholar] [CrossRef]
- Sohn, H.G.; Kim, G.H.; Yom, J.H. Mathematical modelling of historical reconnaissance CORONA KH-4B Imagery. Photogramm. Rec. 2004, 19, 51–66. [Google Scholar] [CrossRef]
- Altmaier, A.; Kany, C. Digital surface model generation from CORONA satellite images. ISPRS J. Photogramm. Remote Sens. 2002, 56, 221–235. [Google Scholar] [CrossRef]
- Xie, Y.; Liu, B.Y.; Zhang, W.B. Study on standard of erosive rainfall. J. Soil Water Conserv. 2000, 14, 6–11. [Google Scholar]
- Tang, X.; Miao, C.Y.; Xi, Y.; Duan, Q.Y.; Lei, X.H.; Li, H. Analysis of precipitation characteristics on the loess plateau between 1965 and 2014, based on high-density gauge observations. Atmos. Res. 2018, 213, 264–274. [Google Scholar] [CrossRef]
- Moore, I.D.; Gessler, P.E.; Nielsen, G.A.; Peterson, G.A. Soil attribute prediction using terrain analysis. Soil Sci. Soc. Am. J. 1993, 57, 443–452. [Google Scholar] [CrossRef]
- Conforti, M.; Aucelli, P.P.C.; Robustelli, G.; Scarciglia, F. Geomorphology and GIS analysis for mapping gully erosion susceptibility in the Turbolo stream catchment (Northern Calabria, Italy). Nat. Hazards 2011, 56, 881–898. [Google Scholar] [CrossRef]
- Conoscenti, C.; Angileri, S.; Cappadonia, C.; Rotigliano, E.; Agnesi, V.; Märker, M. Gully erosion susceptibility assessment by means of GIS-based logistic regression, A case of Sicily (Italy). Geomorphology 2014, 204, 399–411. [Google Scholar] [CrossRef] [Green Version]
- Garosi, Y.; Sheklabadi, M.; Conoscenti, C.; Pourghasemi, H.R.; Van Oost, K. Assessing the performance of GIS- based machine learning models with different accuracy measures for determining susceptibility to gully erosion. Sci. Total Environ. 2019, 664, 1117–1132. [Google Scholar] [CrossRef]
- Arabameri, A.; Pradhan, B.; Rezaei, K.; and Conoscenti, C. Gully erosion susceptibility mapping using GIS-based multi-criteria decision analysis techniques. Catena 2019, 180, 282–297. [Google Scholar] [CrossRef]
- Ponce, V.M.; Hawkins, R.H. Runoff curve number: Has it reached maturity? J. Hydrol. Eng. 1996, 1, 11–19. [Google Scholar] [CrossRef]
- Hawkins, R.H.; Theurer, F.D.; Rezaeianzadeh, M. Understanding the basis of the curve number method for watershed models and TMDLs. J. Hydrol. Eng. 2019, 24, 06019003. [Google Scholar] [CrossRef]
- Boughton, W.C. A Review of the USDA SCS Curve Number Method. Aust. J. Soil Res. 1989, 27, 511–523. [Google Scholar] [CrossRef]
- Lian, H.; Yen, H.; Huang, J.C.; Feng, Q.; Qin, L.; Bashir, M.A.; Wu, S.; Zhu, A.X.; Luo, J.; Di, H.; et al. CN-China: Revised runoff curve number by using rainfall-runoff events data in China. Water Res. 2020, 177, 115767. [Google Scholar] [CrossRef]
- Feng, J.; Wei, W.; Feng, Q.Y. The runoff curve number of SCS-CN method in loess hilly region. Sheng Tai Xue Bao 2021, 41, 4170–4181. [Google Scholar]
- Montgomery, D.R.; Dietrich, W.E. Landscape dissection and drainage area-slope thresholds. In Process. Models and Theorical Geomorphology; Kirkby, M.J., Ed.; John Wiley & Sons: Hoboken, NJ, USA, 1994; pp. 221–246. [Google Scholar]
- Yalin, M.S. An expression for bed-load transportation. J. Hydraul. Div. 1963, 89, 221–250. [Google Scholar] [CrossRef]
- Heckmann, T.; Cavalli, M.; Cerdan, O.; Foerster, S.; Javaux, M.; Lode, E.; Smetanová, A.; Vericat, D.; Brardinoni, F. Indices of sediment connectivity: Opportunities, challenges and limitations. Earth Sci. Rev. 2018, 187, 77–108. [Google Scholar] [CrossRef] [Green Version]
- Arnáez, J.; Lana-Renault, N.; Lasanta, T.; Ruiz-Flaño, P.; Castroviejo, J. Effects of farming terraces on hydrological and geomorphological processes. A review. Catena 2015, 128, 122–134. [Google Scholar] [CrossRef] [Green Version]
- Zhang, Y.; Zhao, Y.Y.; Liu, B.Y.; Wang, Z.Q.; Zhang, S. Rill and gully erosion on unpaved roads under heavy rainfall in agricultural watersheds on China’s Loess Plateau. Agri. Ecosyst. Environ. 2019, 284, 106580. [Google Scholar] [CrossRef]
- Zhao, Y.Y.; Zhang, Y.; Yuan, M.T.; Yang, M.; Deng, J.Y. Estimation of initiation thresholds and soil loss from gully erosion on unpaved roads on China’s Loess Plateau. Earth Surf. Process. Landforms 2021, 46, 1713–1724. [Google Scholar] [CrossRef]
- Chen, Y.X.; Jiao, J.Y.; Wei, Y.H.; Zhao, H.K. Characteristics of gully development in Northern Shaanxi Hilly Loess Region before Grain-for-Green Programme (1976–1997). Trans. CSAE 2017, 33, 120–127. [Google Scholar]
- Romanescu, G.; Cotiuga, V.; Asandulesei, A.; Stoleriu, C. Use of the 3-D scanner in mapping and monitoring the dynamic degradation of soils: Case study of the Cucuteni-Baiceni Gully on the Moldavian Plateau (Romania). Hydrol. Earth Syst. Sci. 2012, 16, 953–966. [Google Scholar] [CrossRef] [Green Version]
- Sun, D.H.; Bloemendal, J.; Rea, D.K.; An, Z.S.; Vandenberghe, J.; Lu, H.Y.; Su, R.X.; Liu, T.S. Bimodal grain-size distribution of Chinese loess, and its palaeoclimatic implications. Catena 2004, 55, 325–340. [Google Scholar] [CrossRef]
- Wang, S.; Fu, B.J.; Gao, G.Y.; Liu, Y.; Zhou, J. Responses of soil moisture in different land cover types to rainfall events in a re-vegetation catchment area of the Loess Plateau, China. Catena 2013, 101, 122–128. [Google Scholar] [CrossRef]
- Knapen, A.; Poesen, J. Soil erosion resistance effects on rill and gully initiation points and dimensions. Earth Surf. Process. Landforms 2010, 35, 217–228. [Google Scholar] [CrossRef]
- Vandekerckhove, L.; Poesen, J.; Oostwoud-Wijdene, D.; Nachtergaele, J.; Kosmas, C.; Roxo, M.J.; de Figueiredo, T. Thresholds for gully initiation and sedimentation in Mediterranean Europe. Earth Surf. Process. Landforms 2000, 25, 1201–1220. [Google Scholar] [CrossRef]
- Cheng, H.; Zou, X.Y.; Wu, Y.Q.; Zhang, C.L.; Zheng, Q.H.; Jiang, Z.Y. Morphology parameters of ephemeral gully in characteristics hillslopes on the Loess Plateau of China. Soil Till. Res. 2007, 94, 4–14. [Google Scholar] [CrossRef]
- Capra, A.; Porto, P.; Scicolone, B. Relationships between rainfall characteristics and ephemeral gully erosion in a cultivated catchment in Sicily (Italy). Soil Till. Res. 2009, 105, 77–87. [Google Scholar] [CrossRef]
- Svoray, T.; Markovitch, H. Catchment scale analysis of the effect of topography, tillage direction and unpaved roads on ephemeral gully incision. Earth Surf. Process. Landforms 2009, 34, 1970–1984. [Google Scholar] [CrossRef]
- Zgłobicki, W.; Baran-Zgłobicka, B.; Gawrysiak, L.; Telecka, M. The impact of permanent gullies on present-day land use and agriculture in loess areas (E. Poland). Catena 2015, 126, 28–36. [Google Scholar] [CrossRef]
- Beuselinck, L.; Steegen, A.; Govers, G.; Nachtergaele, J.; Takken, I.; Poesen, J. Characteristics of sediment deposits formed by intense rainfall events in small catchments in the Belgian Loam Belt. Geomorphology 2000, 32, 69–82. [Google Scholar] [CrossRef]
- Casalí, J.; López, J.J.; Giráldez, J.V. Ephemeral gully erosion in southern Navarra (Spain). Catena 1999, 36, 65–84. [Google Scholar] [CrossRef]
- Prosser, I.P.; Soufi, M. Controls on gully formation following forest clearing in a humid temperate environment. Water Resour. Res. 1998, 34, 3661–3671. [Google Scholar] [CrossRef]
Figure 1.
Location of the study area. (a) Location of the study area on the Loess Plateau; (b–d) are KH-4B satellite images (ground sampling distance, GSD: 3.10 m), Quickbird-2 satellite images (GSD: 0.61 m) and UAV images (GSD: 0.14 m) of the study area in 1969, 2010 and 2019, respectively.
Figure 1.
Location of the study area. (a) Location of the study area on the Loess Plateau; (b–d) are KH-4B satellite images (ground sampling distance, GSD: 3.10 m), Quickbird-2 satellite images (GSD: 0.61 m) and UAV images (GSD: 0.14 m) of the study area in 1969, 2010 and 2019, respectively.

Figure 2.
Daily precipitation record and annual precipitation from 1969 to 2019. The annual precipitation ranged from 277.6 to 697.4 mm, with an average of 496.62 mm. Annual erosive precipitation ranged from 130.4 to 588.0 mm, with an average of 302.81 mm. The thresholds of erosive precipitation (>12 mm·d−1), rainstorms (>50 mm·d−1), and heavy rainstorms (>100 mm·d−1) are marked as dashed lines a, b, and c, respectively. From 1969 to 2019, there were 39 rainstorm events and 2 heavy rainstorm events (20–21 August 1971 and 29 July 2011, respectively).
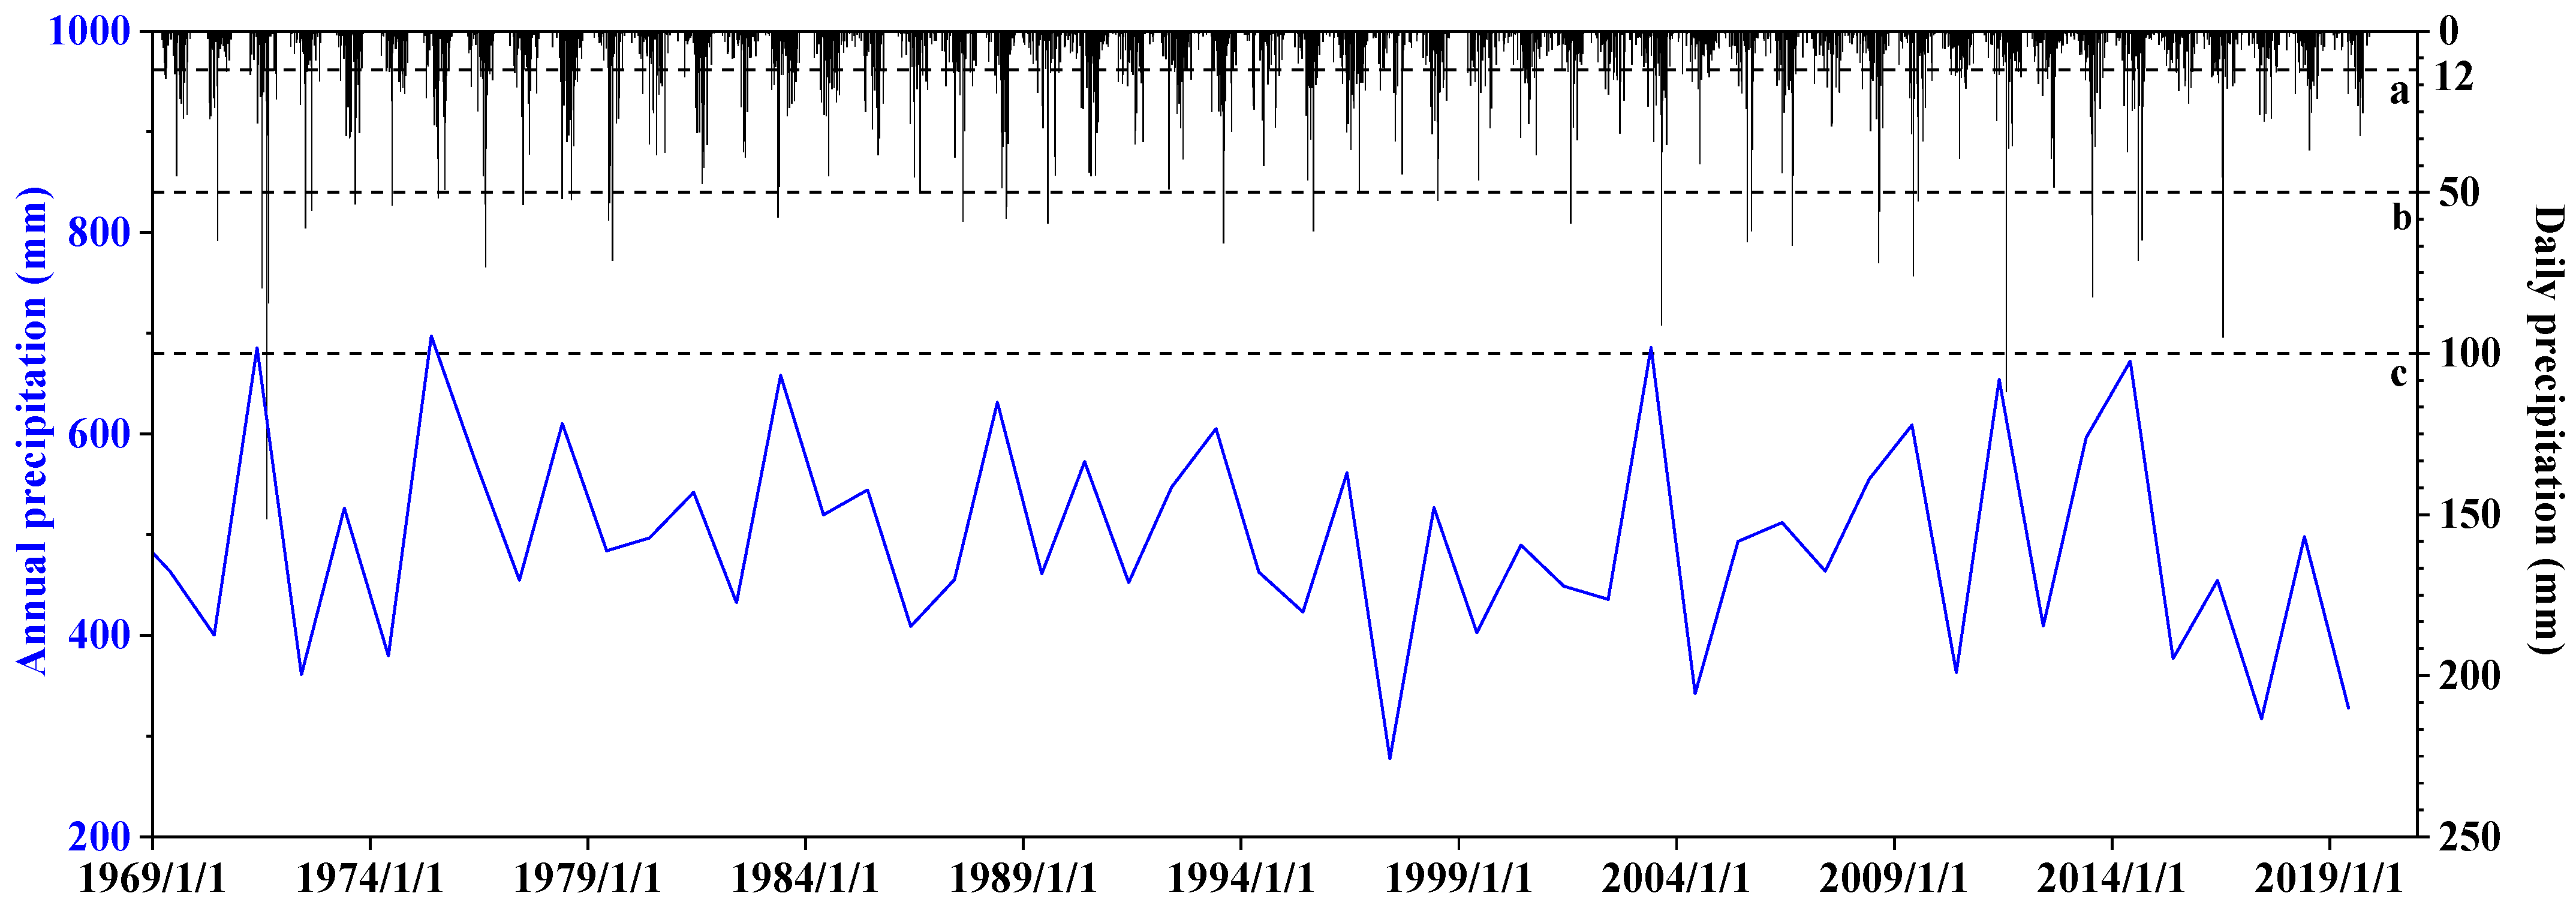
Figure 3.
Examples of 4 gully types. (a–d) are stable, growing, infilled, and excavated gullies, respectively; (1) and (2) represent 1969 and 2019, respectively. Gully edge lines in 1969 and 2019 are colored in black and yellow, respectively.
Figure 3.
Examples of 4 gully types. (a–d) are stable, growing, infilled, and excavated gullies, respectively; (1) and (2) represent 1969 and 2019, respectively. Gully edge lines in 1969 and 2019 are colored in black and yellow, respectively.
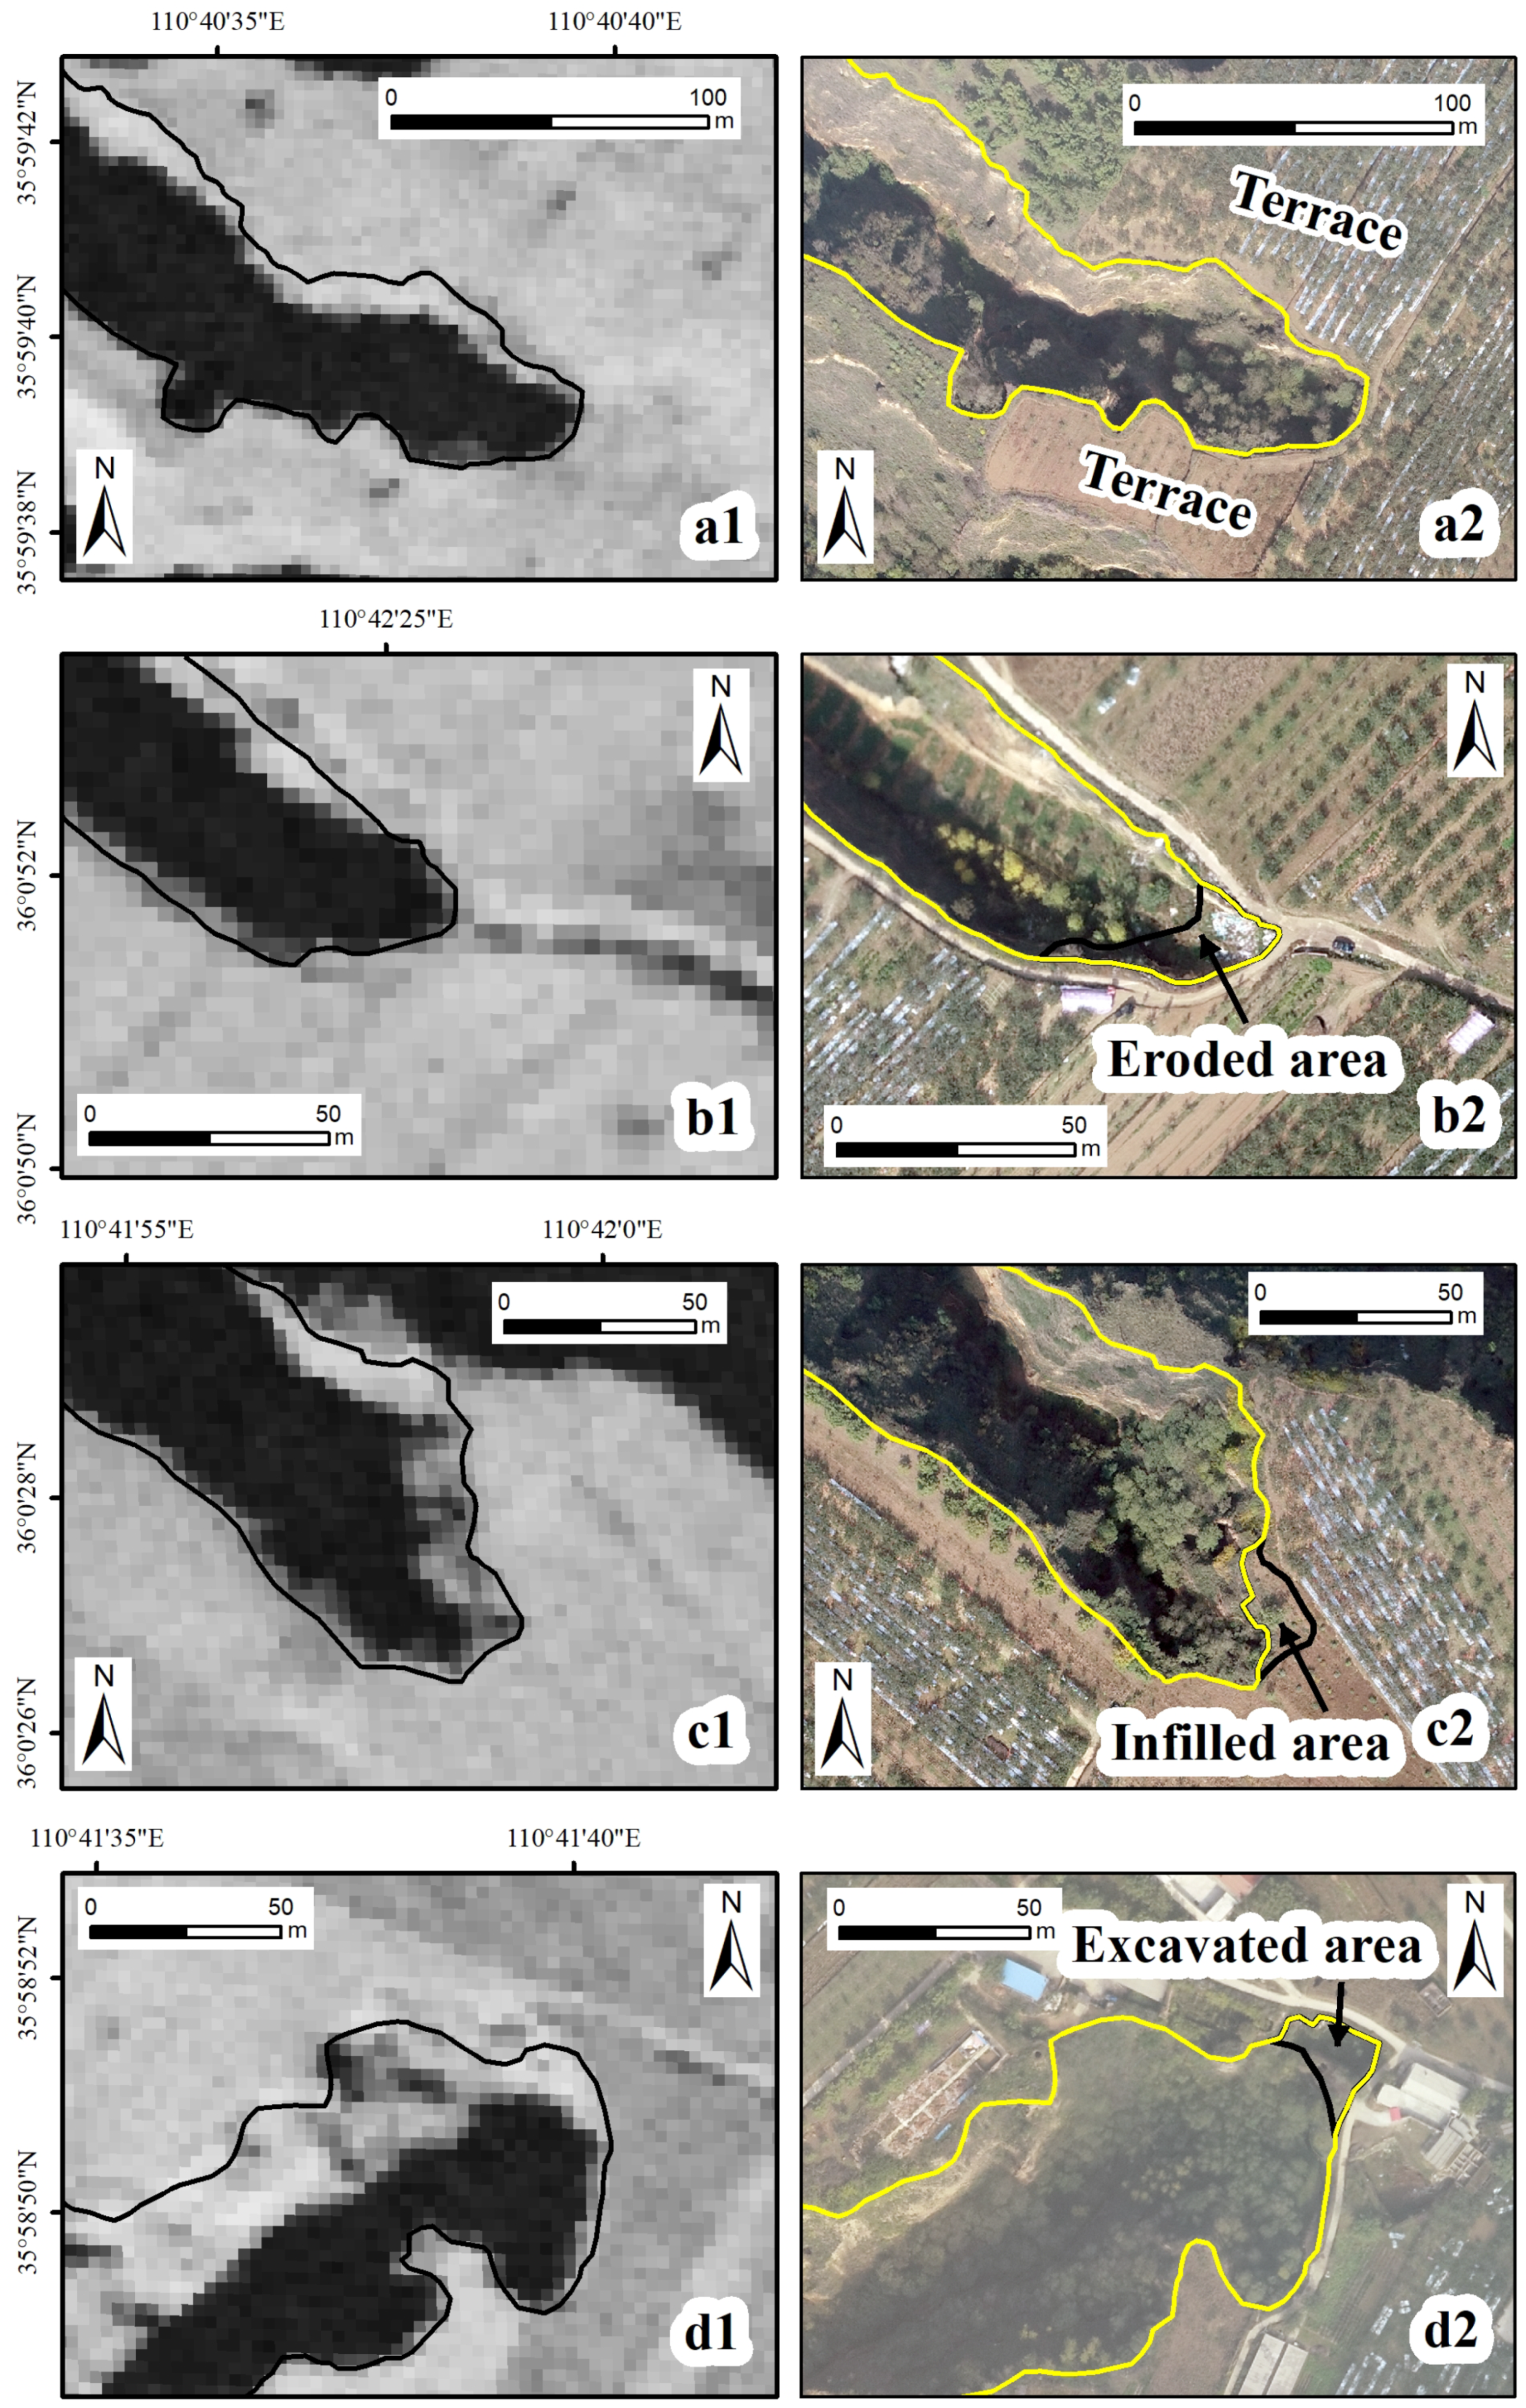
Figure 4.
Distribution of the 4 types of gullies on the Zhongduo and Shiquan tablelands. The background images are the digital elevation models (DEMs) derived from the 2019 UAV images.
Figure 4.
Distribution of the 4 types of gullies on the Zhongduo and Shiquan tablelands. The background images are the digital elevation models (DEMs) derived from the 2019 UAV images.
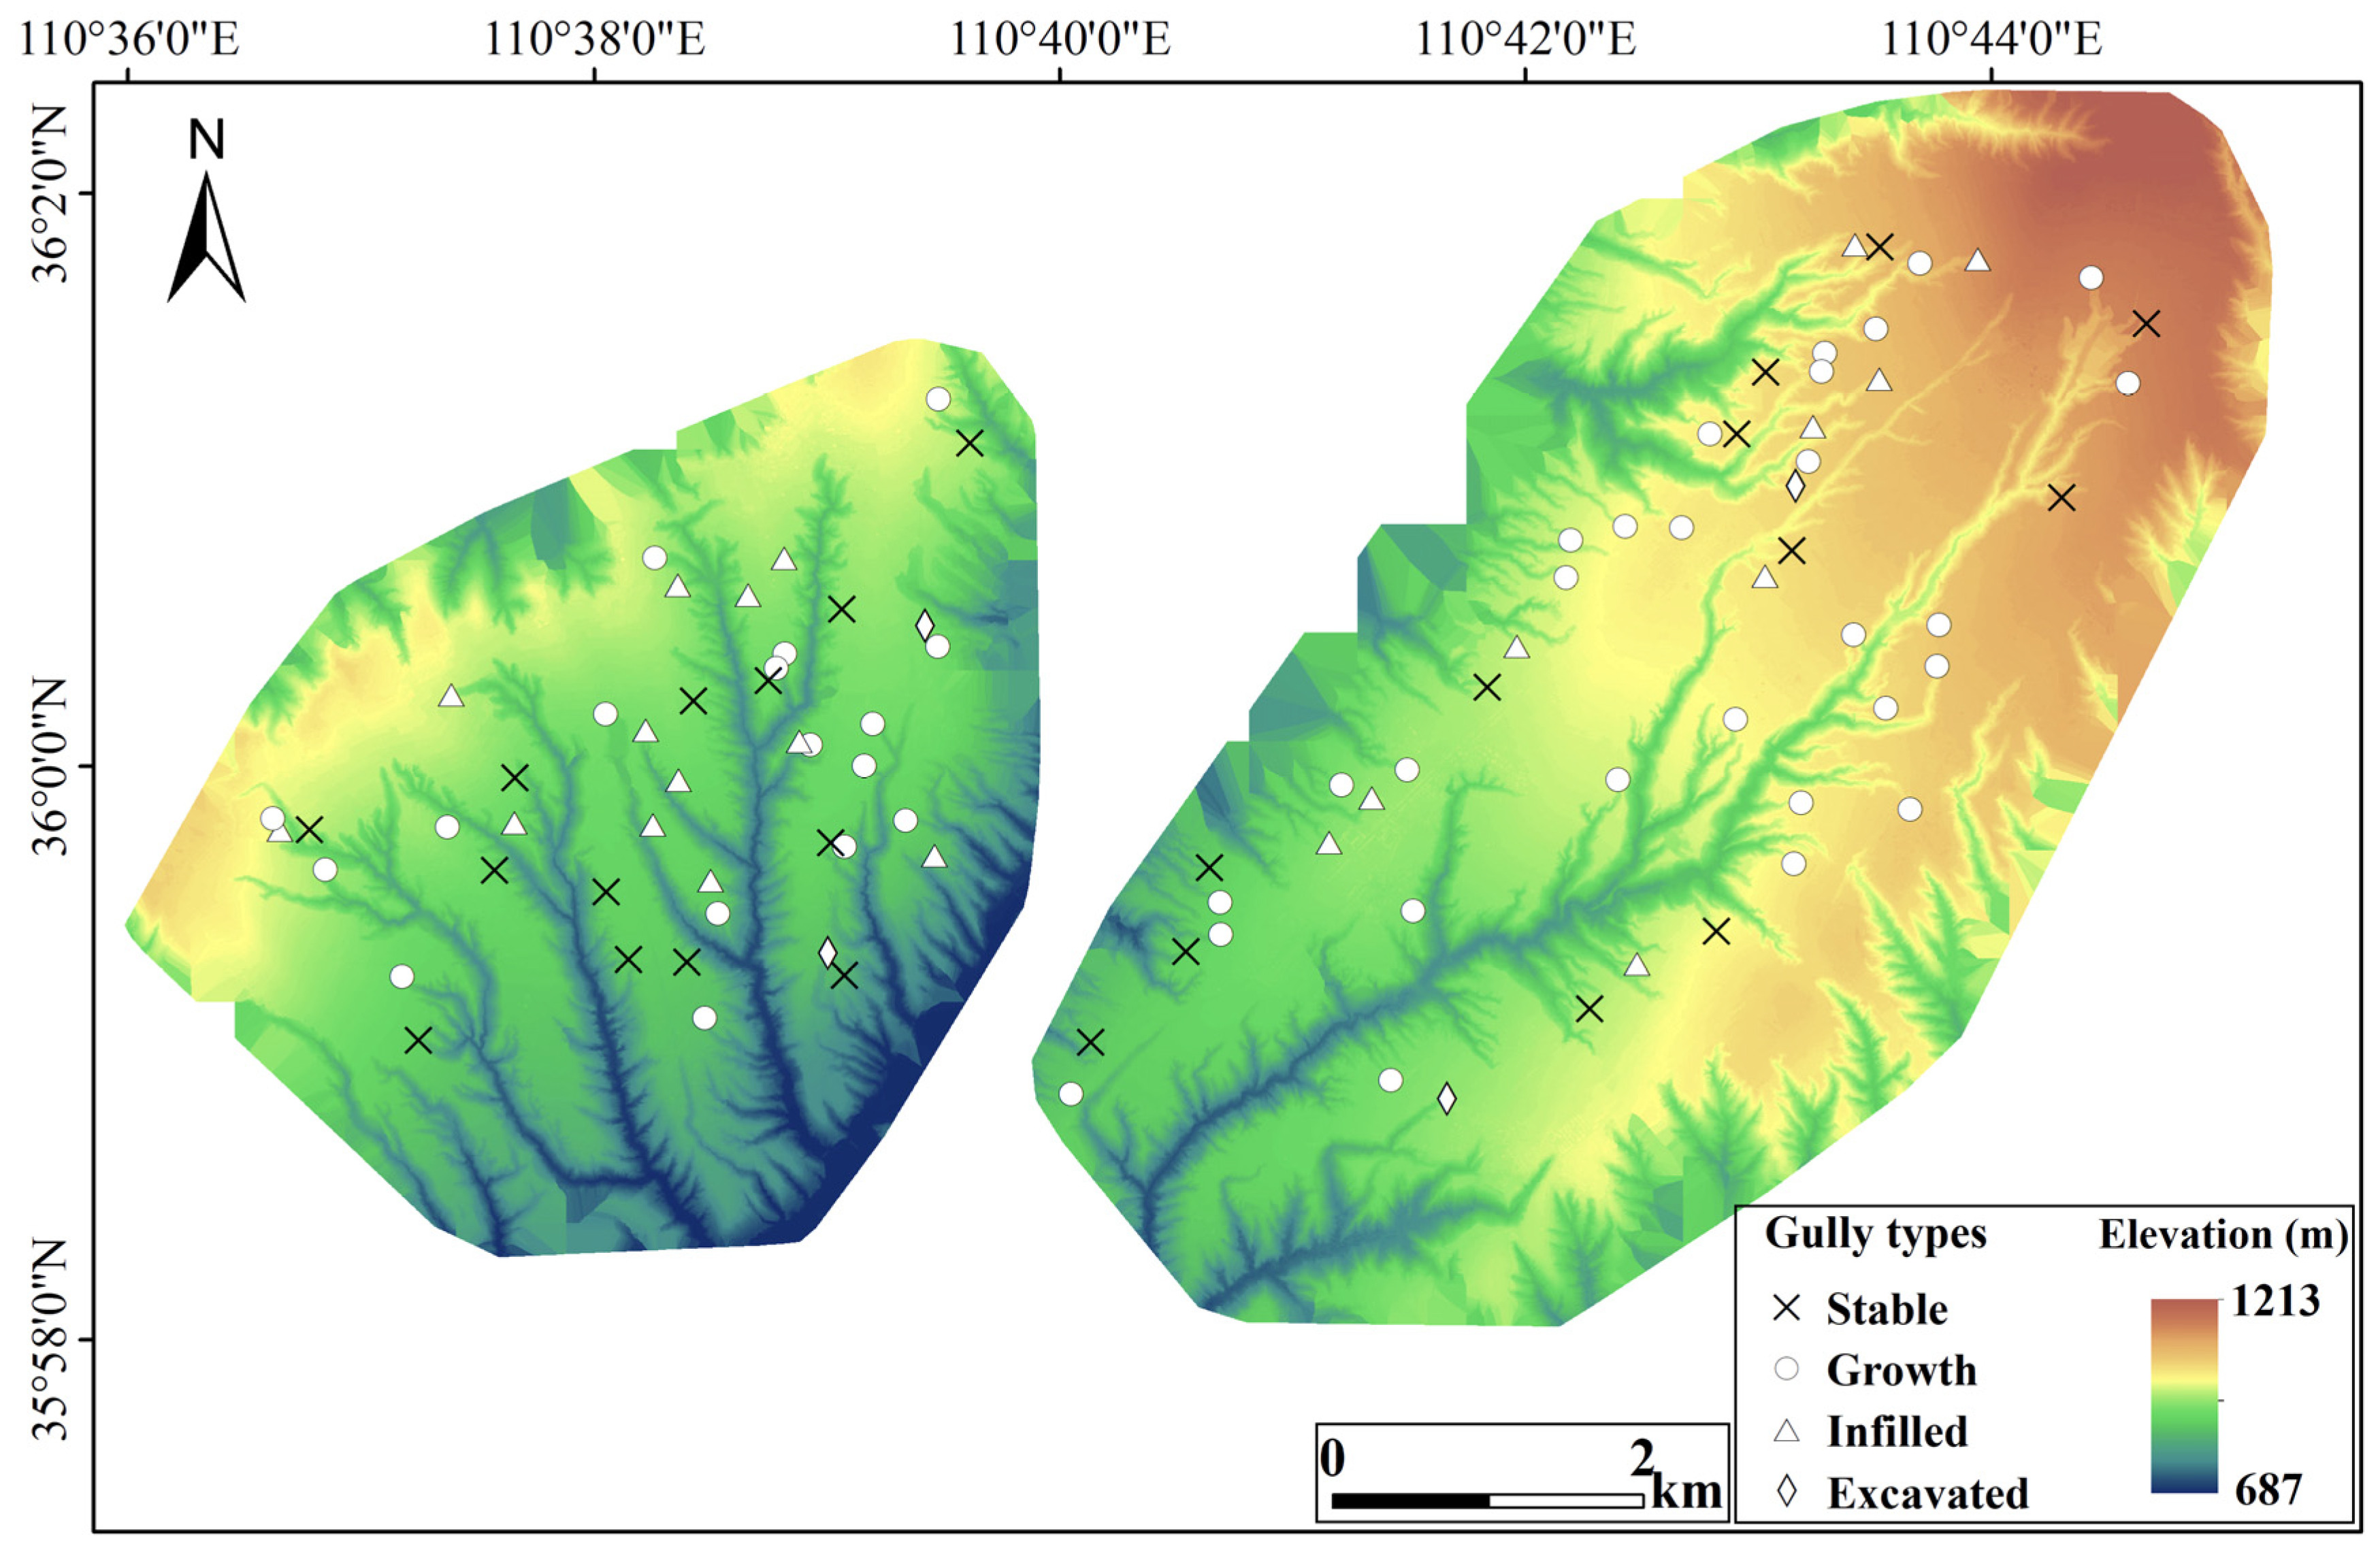
Figure 5.
(a) Frequency distribution of linear gully head growth rates (RL) and (b) areal gully head growth rates (RA) for 45 growing gullies.
Figure 5.
(a) Frequency distribution of linear gully head growth rates (RL) and (b) areal gully head growth rates (RA) for 45 growing gullies.
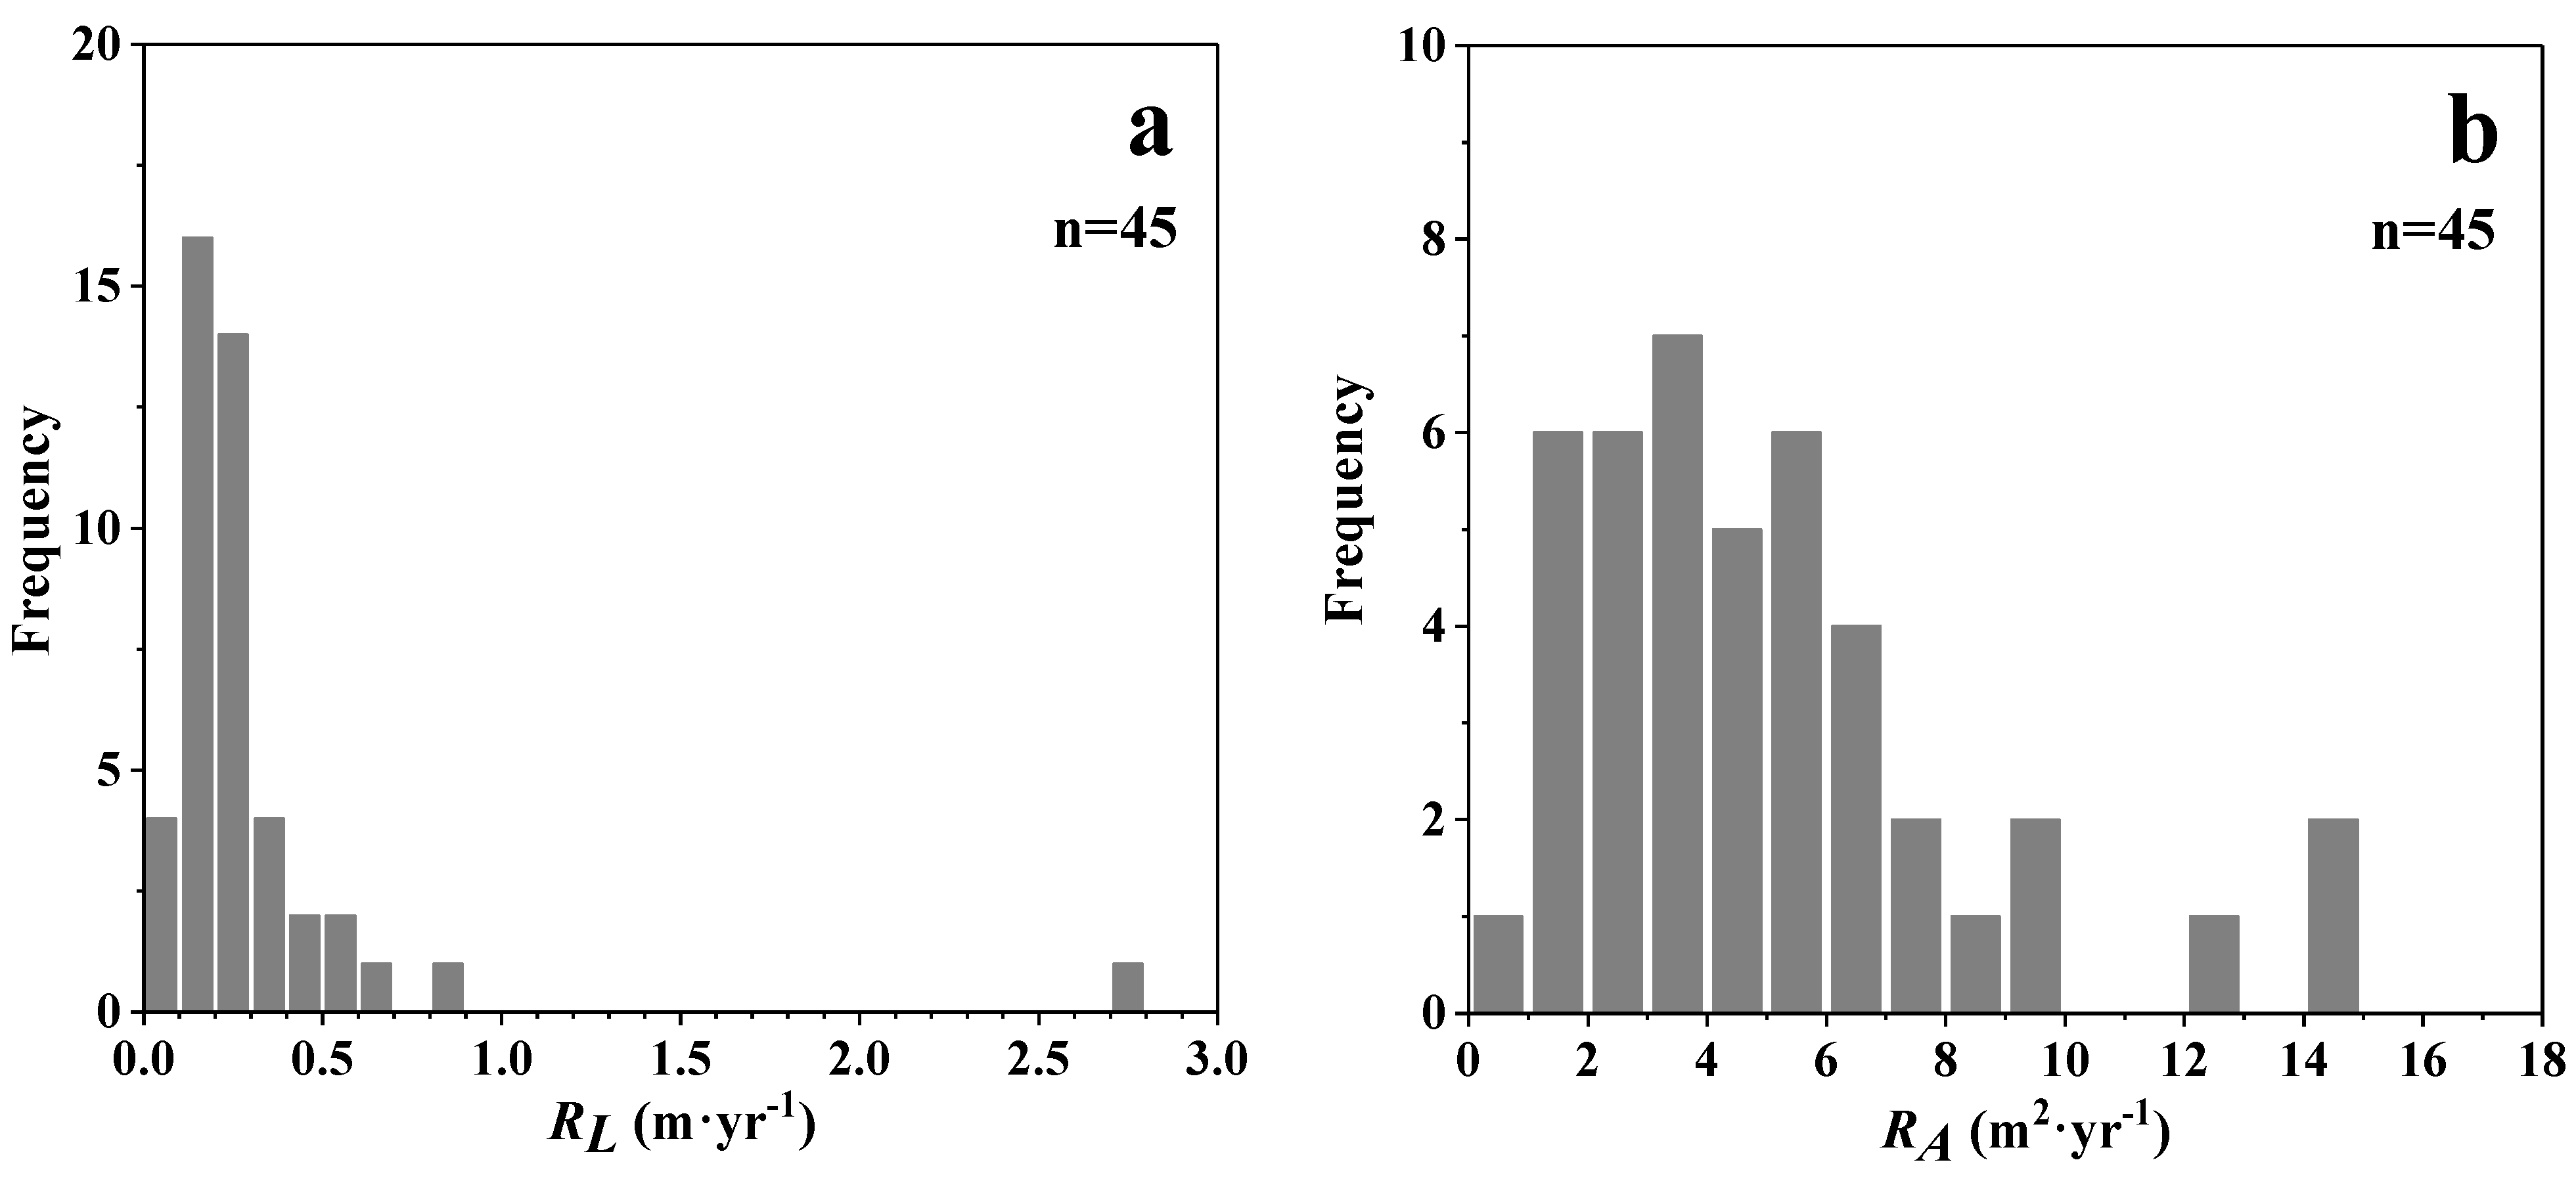
Figure 6.
Both the average annual runoff (Qa, m3·yr−1) and average slope of the drainage area (Sd, m·m−1) were used to fit the annual areal gully growth rate (RA, m2·yr−1), with an R2 of 0.530.
Figure 6.
Both the average annual runoff (Qa, m3·yr−1) and average slope of the drainage area (Sd, m·m−1) were used to fit the annual areal gully growth rate (RA, m2·yr−1), with an R2 of 0.530.
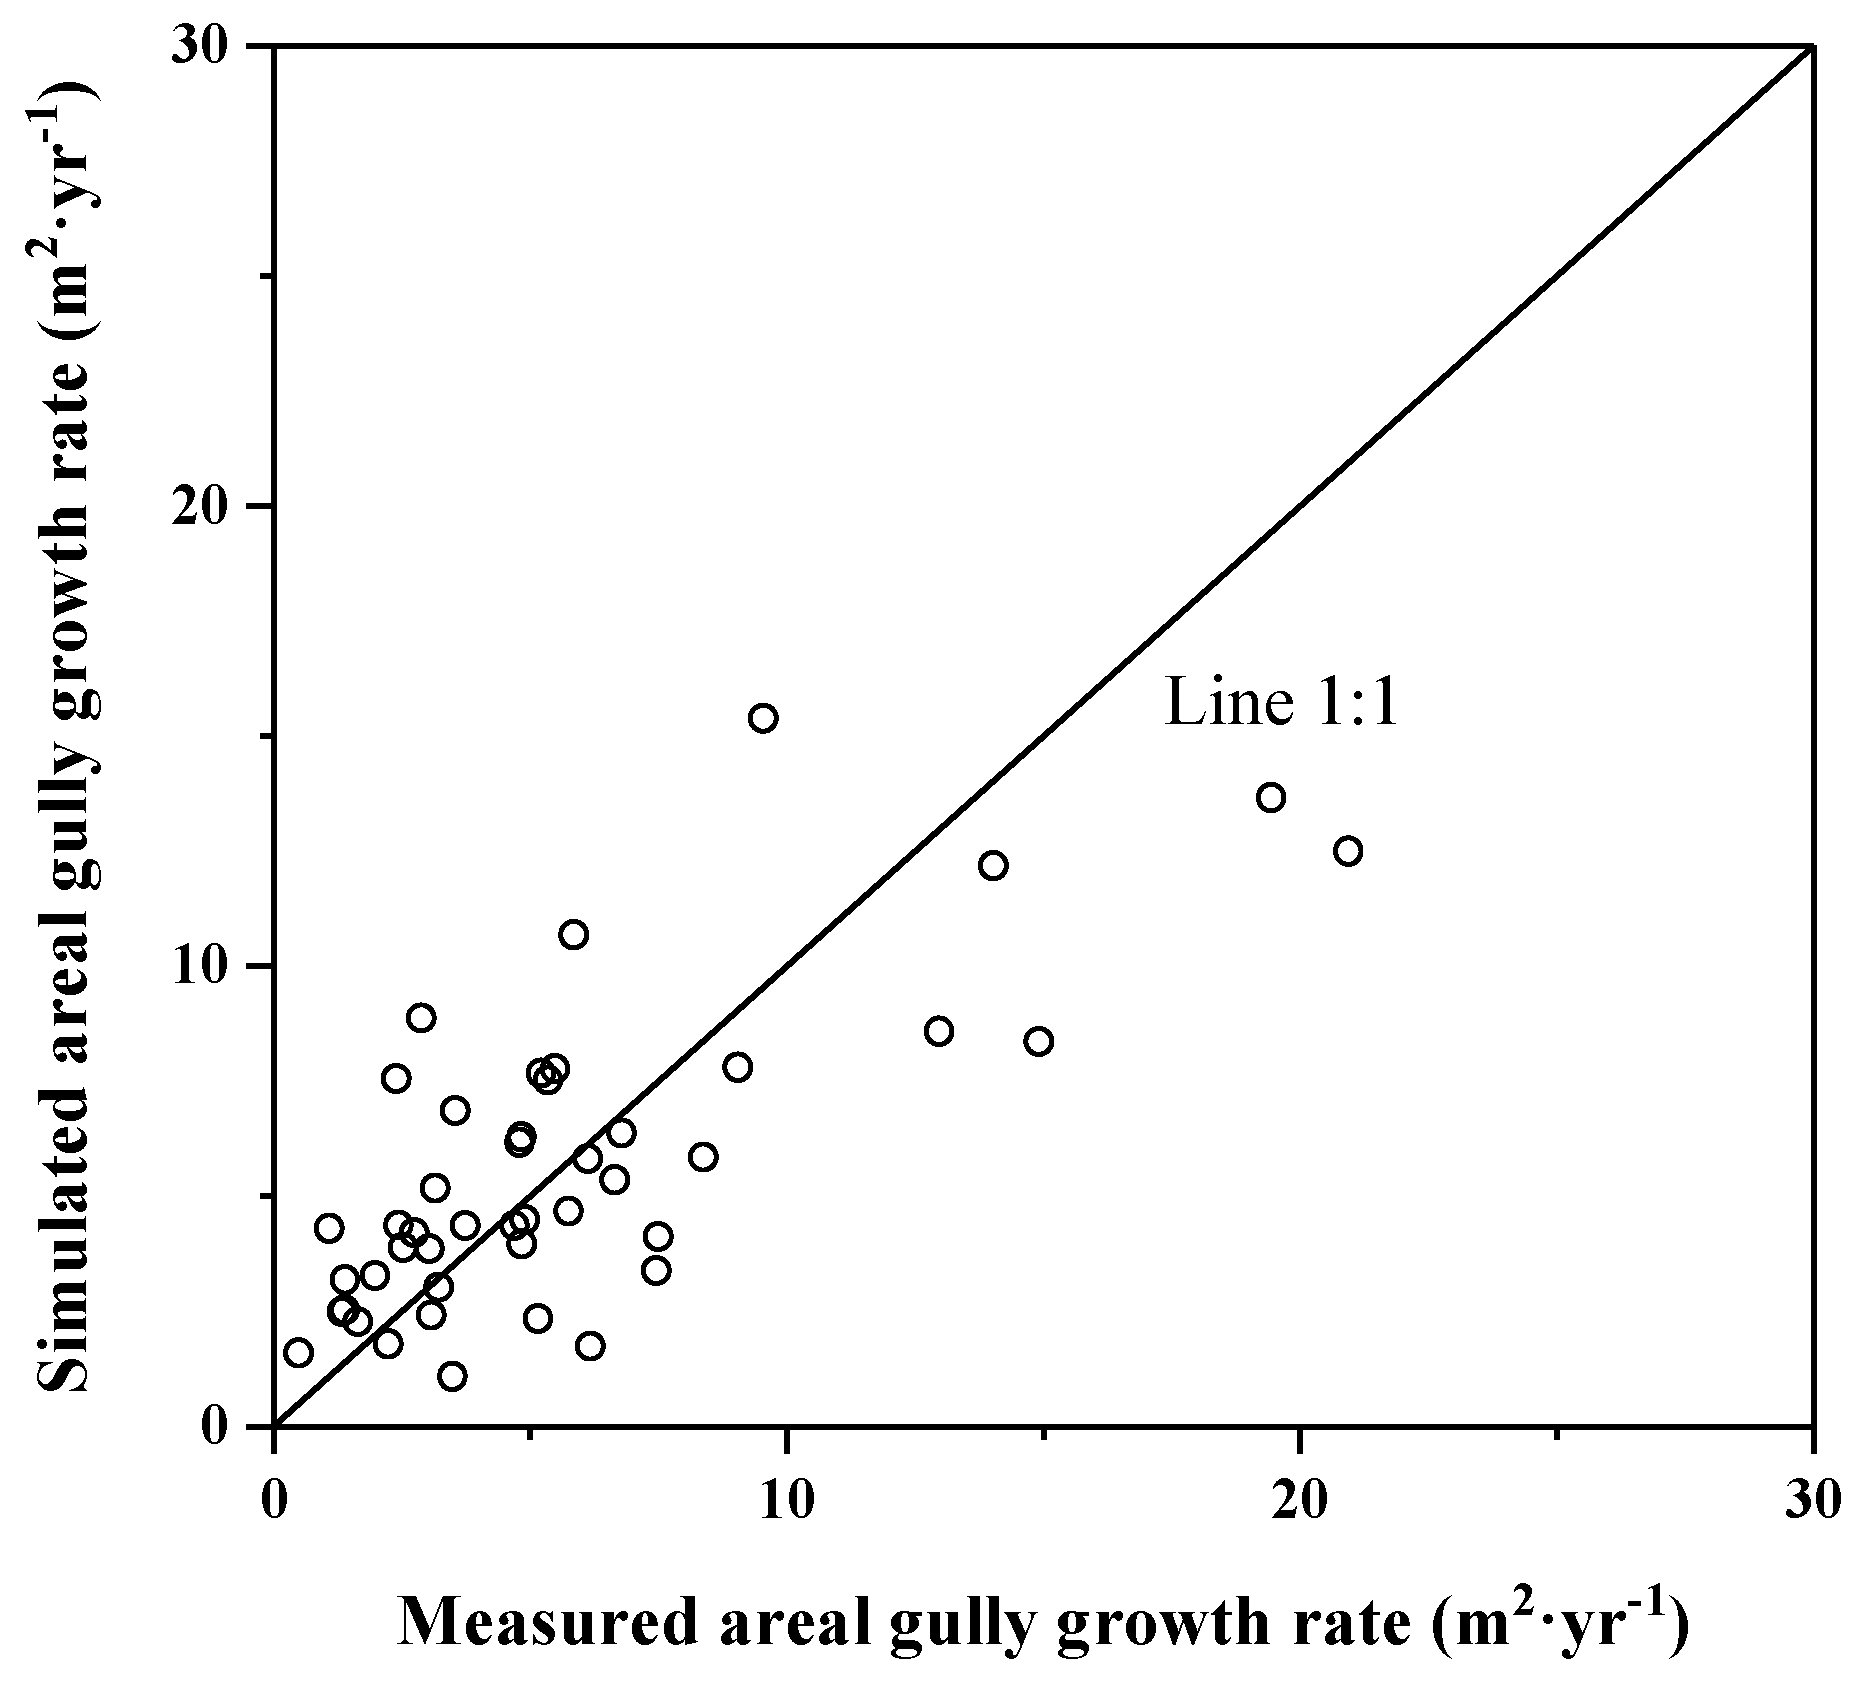
Figure 7.
(a) Sg-A topographic threshold in the study area. A-present drainage area; Sg-slope gradient of the soil surface near the gully head. (b) Sg-Qa threshold in the study area. Qa-average annual runoff to the gully head.
Figure 7.
(a) Sg-A topographic threshold in the study area. A-present drainage area; Sg-slope gradient of the soil surface near the gully head. (b) Sg-Qa threshold in the study area. Qa-average annual runoff to the gully head.
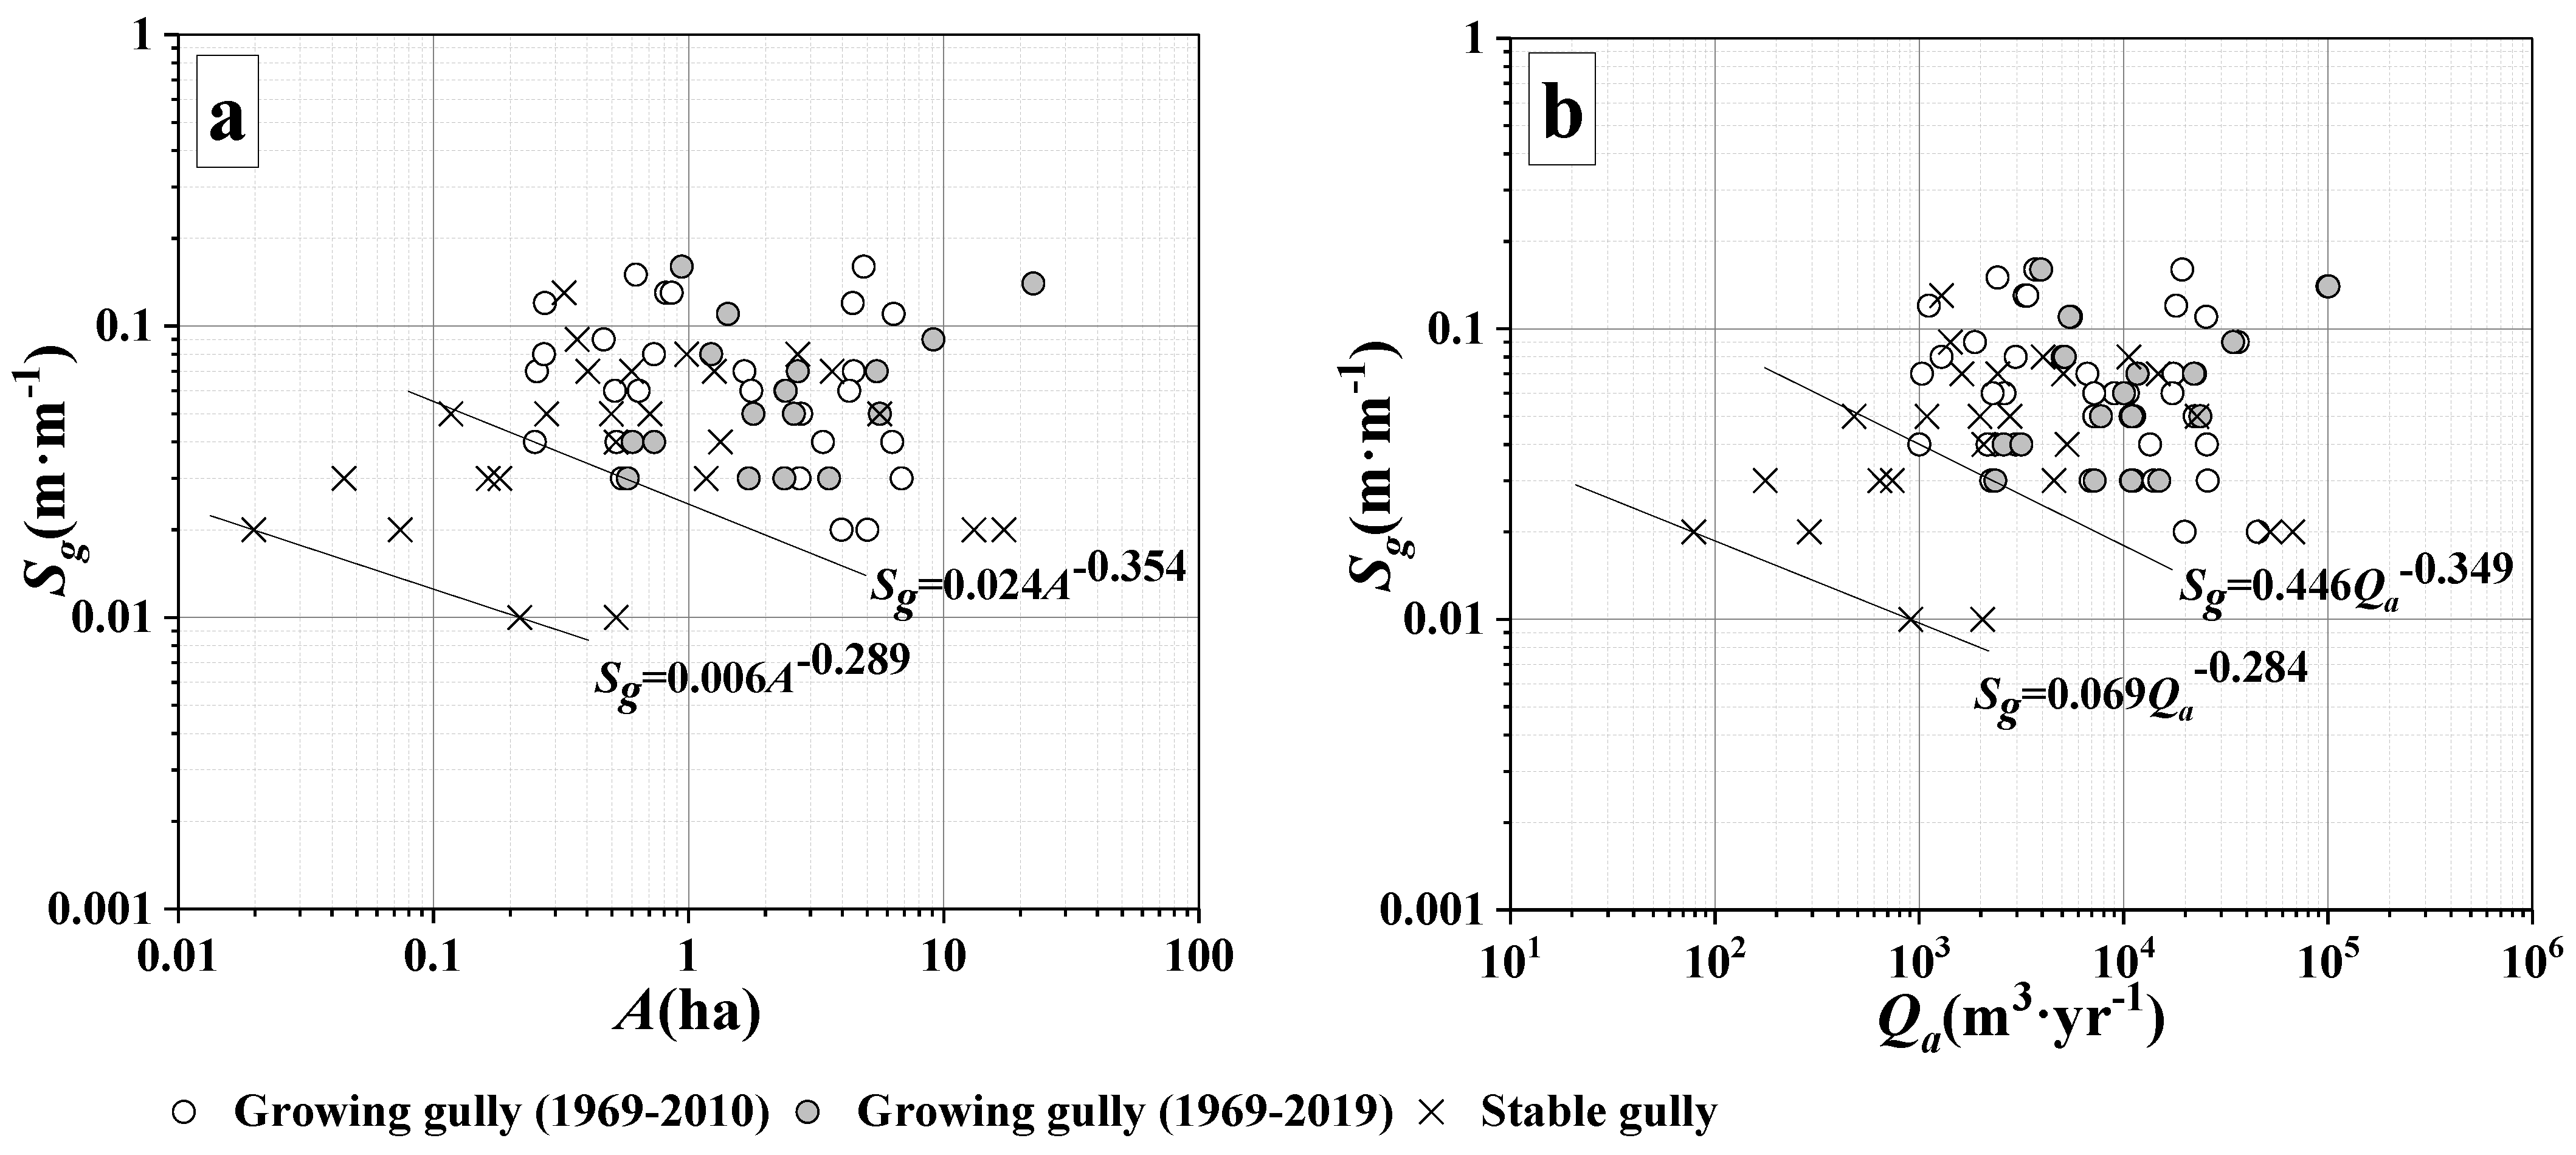
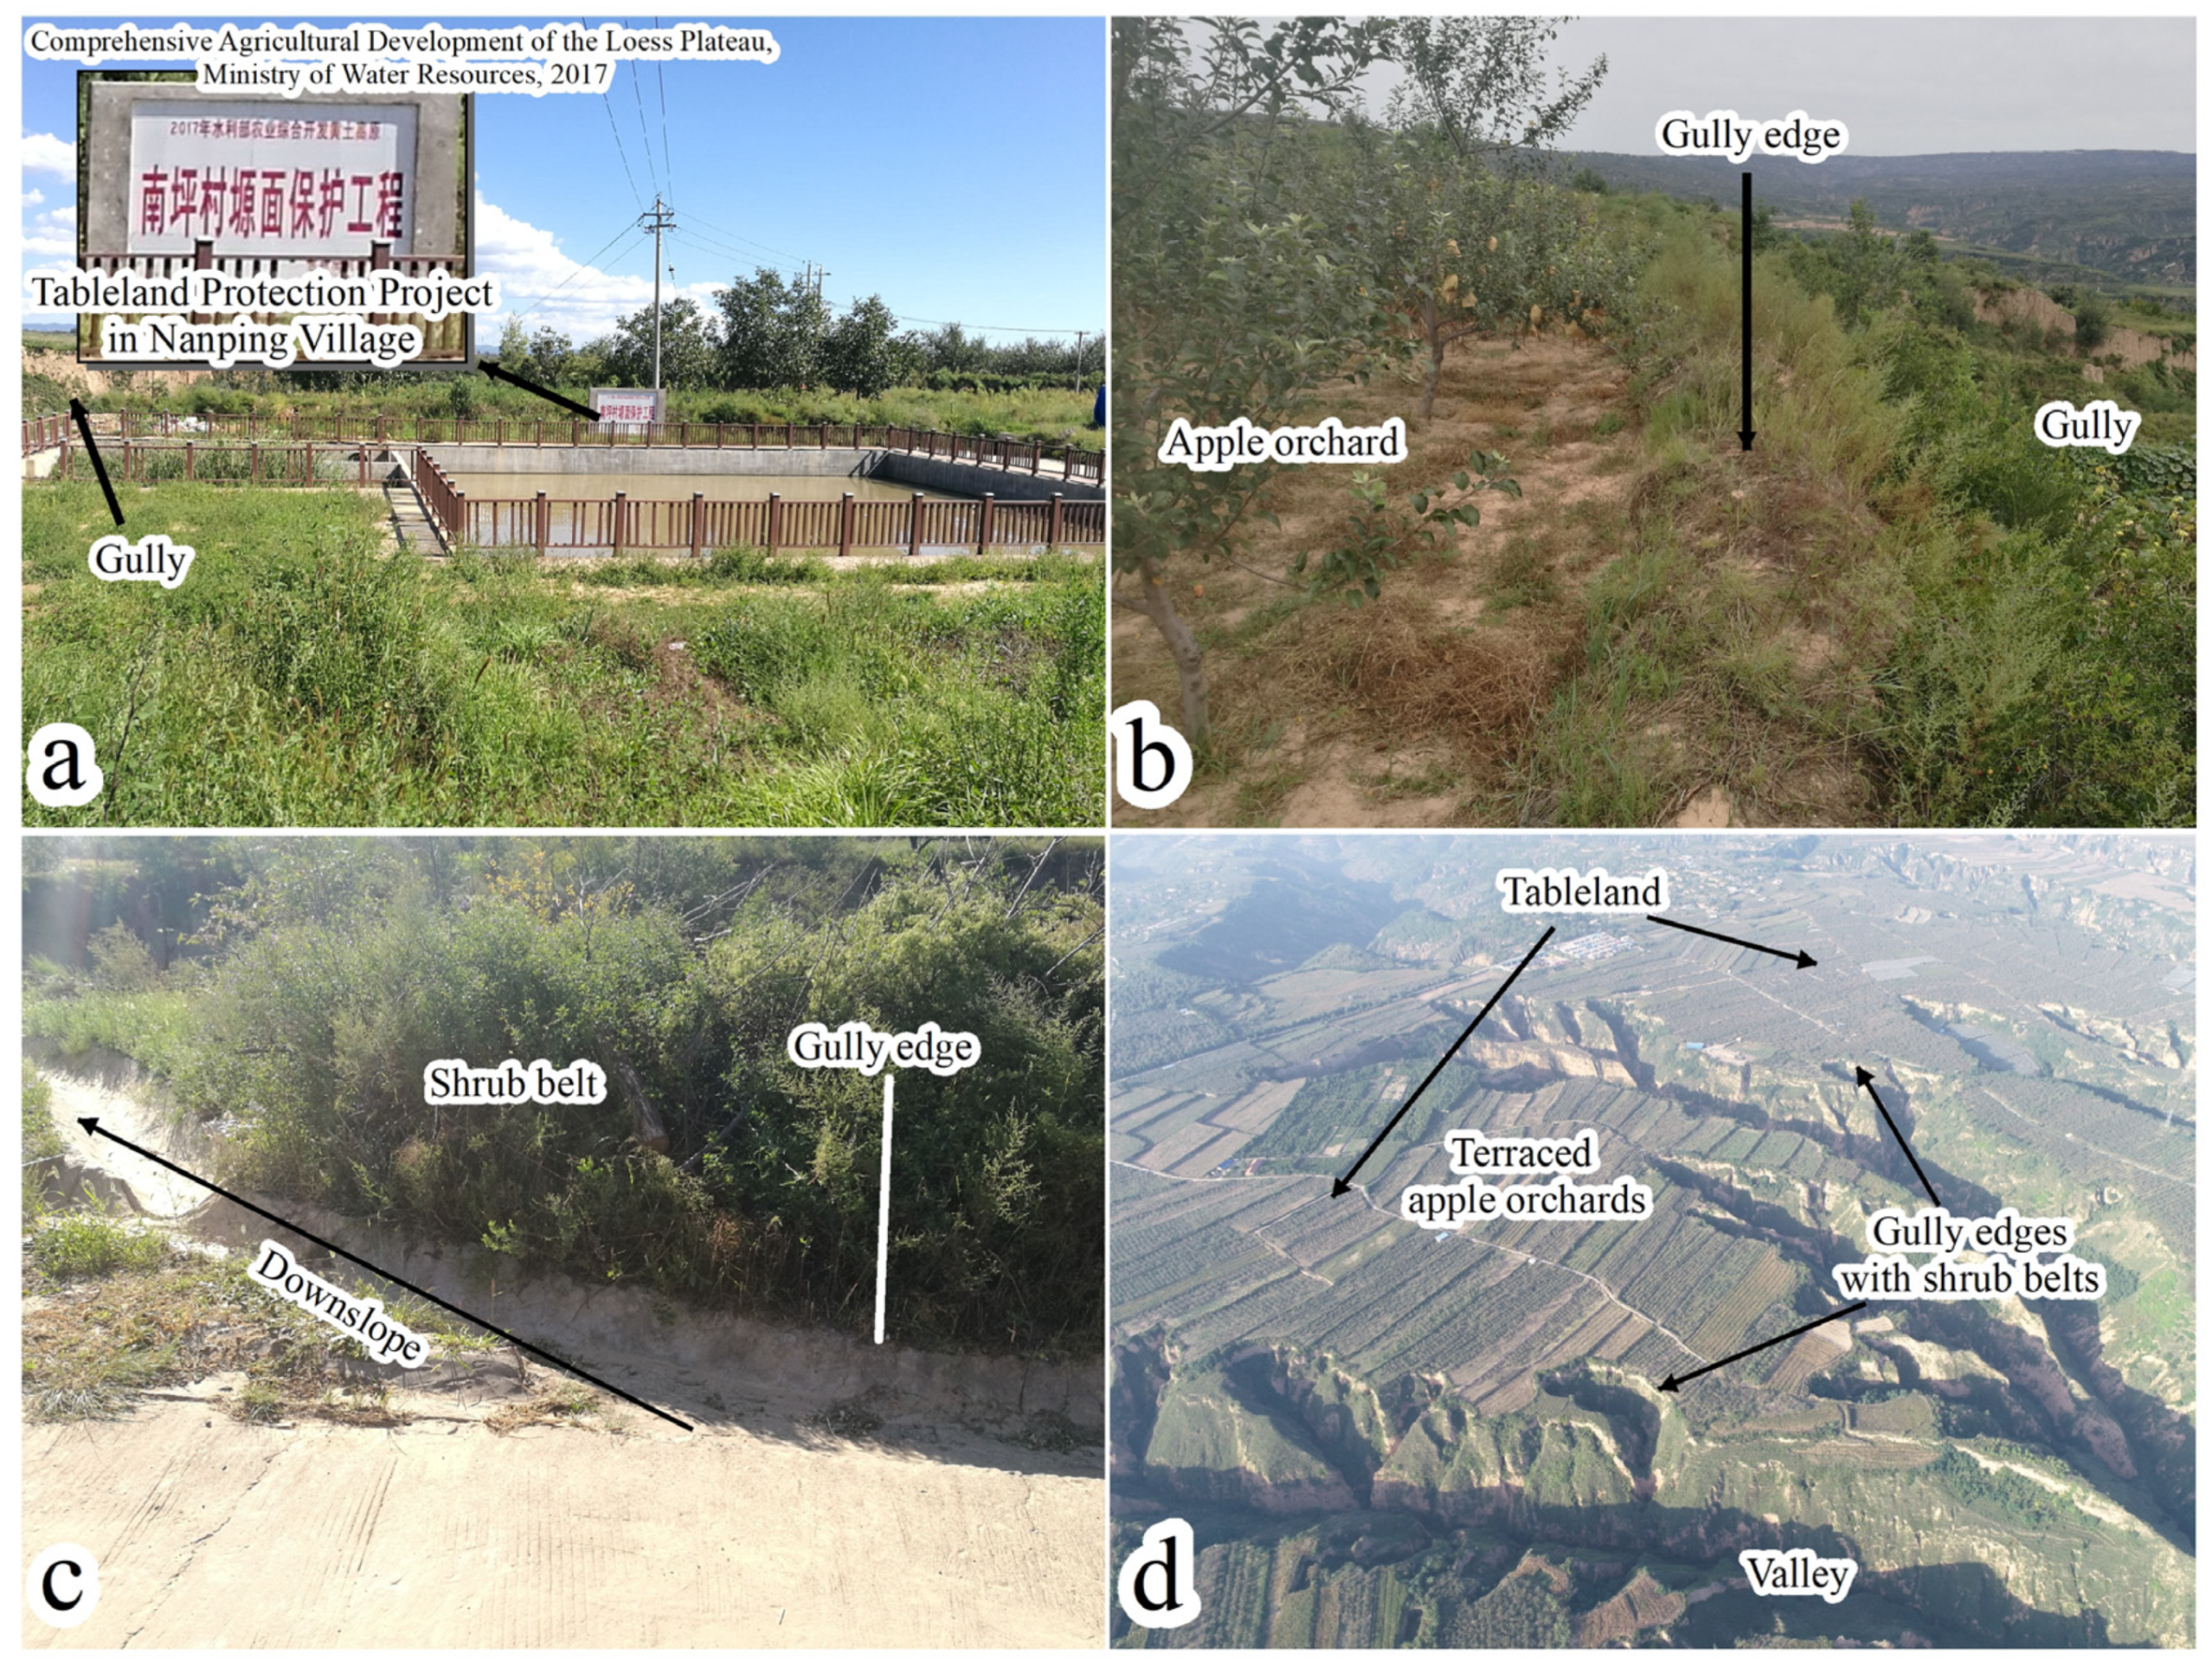
Figure 8.
Some measures of the Grain for Green Project (GFGP); and Gully Stabilization and Tableland Protection Project (GSTP) were implemented in the study area. (a) A reservoir (20 × 20 m) to hold back the direct runoff into gullies, (b) the tableland boundary was ridged with a shrub belt to reduce direct runoff into gullies. (c) The human-made loessial ridge and shrub belt at the gully edges lead runoff downslope, reducing direct runoff into the gully head. (d) The tableland margin area was terraced and reclaimed as apple orchards, with shrub belts at the gully edges.

Table 1.
Information for the images used in this study.
| Platform | Photo Date | Ground Sampling Distance (GSD) | Number of Bands 2 |
|---|---|---|---|
| KH-4B | 13/12/1969 | 3.10 m | 1 (photographic film) |
| Quickbird-2 | 12/12/2010 | 0.61 m 1 | 4 (MUL) + 1 (PAN) |
| DJI Inspire 2 | 17/10–19/10/2019 | 0.14 m | 3 (MUL) |
1. The panchromatic and multispectral bands were fused to create a 0.61 m pansharpened image using ENVI 5.3 software. 2. PAN indicates a panchromatic band; MUL indicates multispectral bands.
Table 2.
CN values used to estimate runoff from the drainage area of each gully head.
| Land Use Type | Curve Number (CN) 1 |
|---|---|
| Apple orchard (crown density < 20%) | 79.6 |
| Apple orchard (20% < crown density < 60%) | 78.8 |
| Apple orchard (crown density > 60%) | 78.5 |
| Cropland (vegetation coverage < 20%) | 79.6 |
| Cropland (20% < vegetation coverage < 60%) | 77.3 |
| Cropland (vegetation coverage > 60%) | 75.6 |
| Forestland | 78.5 |
| Shrub land | 78.1 |
| Grassland | 77 |
| Fallow field | 77.8 |
| Bare land | 79.6 |
| Construction land | 100 2 |
| Unpaved road | 79.6 3 |
1. The CN values were calculated according to Feng et al. [51] based on observed data from runoff plots on the Chinese Loess Plateau; CN values are reduced by 11.1% when land use types have terraces [51]. 2. Construction land consists of village buildings and paved roads that usually have little or no infiltration; therefore, the CN value is 100. 3. The CN values of the roads were determined according to the bare land.
Table 3.
Information of investigated gullies.
| Gully Type | Sample Size | Number of Gullies with Terraces 1 | A (ha) | Sg (m·m−1) | RL2 (m·yr−1) | RA (m2·yr−1) | ||||||
|---|---|---|---|---|---|---|---|---|---|---|---|---|
| 1969 | 2010 | 2019 | Min | Max | Average | Min | Max | Average | ||||
| Growing | 45 | 8 | 27 | 35 | 2.96 | 0.07 | 0.04 | 2.78 | 0.30 | 0.50 | 20.94 | 5.66 |
| Stable | 25 | 14 | 22 | 24 | 2.08 | 0.05 | - | - | - | - | - | - |
| Infilled | 21 | 0 | 14 | 16 | 3.08 | 0.05 | - | - | - | −0.60 | −14.16 | −5.14 |
| Excavated | 4 | 0 | 3 | 4 | 9.30 | 0.06 | - | - | - | 1.43 | 7.10 | 4.28 |
A—Average present drainage area; Sg—average slope gradient near the gully head; RL—linear gully growth rate; RA—areal gully growth rate. 1. Number of gullies with terraces in drainage areas in 1969, 2010, and 2019. 2. The RL and RA values of the growing gullies were from 1969 to 2010; the RL and RA values of the infilled and excavated gullies were from 1969 to 2019.
Table 4.
Pearson’s correlation coefficients (r) of the gully growth rate and influencing factors.
| RL | RA | A | Sg | Sd | Qa6910 | Qae6910 | Qr6910 | Qhr | SPI | |
|---|---|---|---|---|---|---|---|---|---|---|
| RL | 1 | 0.504 ** | 0.132 | −0.148 | 0.038 | 0.416 ** | 0.416 ** | 0.259 | 0.330 * | 0.174 |
| RA | 1 | 0.426 ** | −0.104 | 0.061 | 0.533 ** | 0.526 ** | 0.366 * | 0.457 ** | 0.640 ** |
RL—Linear gully growth rate from 1969 to 2010 in m·yr−1; RA—areal gully growth rate from 1969 to 2010 in m2·yr−1; A—present drainage area in m2; Sg—local slope gradients near the gully head in m·m−1; Sd—slope gradients of the drainage area in m·m−1; Qa6910 and Qae6910—annual average runoff in 41 years from 1969 to 2010 calculated with total precipitation and erosive precipitation, respectively, in m3·yr−1; Qr6910 and Qhr—accumulated runoff generated by rainstorms (38 events) and heavy rainstorms (2 events), respectively, in m3. SPI—stream power index. ** Correlation is significant at the 0.01 level. * Correlation is significant at the 0.05 level.
Table 5.
Summary of the models of gully growth rates from 1969 to 2010 (n = 45).
| Parameter | Model Equation | R2 | Equation No. |
|---|---|---|---|
| A | RA = 4.317A0.4369 | 0.273 | (9) |
| SPI | RA = 0.302SPI1.060 | 0.411 | (10) |
| Qa6910 | RA = 0.117Qa69100.422 | 0.364 | (11) |
| Qa6910, Sd | RA = 0.301Qa69100.562 Sd | 0.530 | (12) |
A—Present drainage area in ha; SPI-stream power index calculated by Equation (1); Qa6910—estimated average annual runoff from 1960 to 2010 in m3·yr−1; Sd—average slope of the drainage area in m·m−1; RA—areal gully retreat rate from 1969 to 2010 in m2·yr−1.
Table 6.
Gully growth rates in different parts of the Loess Plateau in published papers and this study.
Table 6.
Gully growth rates in different parts of the Loess Plateau in published papers and this study.
| No. | Region and Location | Average RL (m·yr−1) | Average RA (m2·yr−1) | Land Use Types | Average Pa (mm) | MP (yr.) | Number of Samples | Reference |
|---|---|---|---|---|---|---|---|---|
| 1 | Tableland region on the southeastern Loess Plateau | 0.30 | 5.66 | Orchard, cropland | 500.48 (1969–2010) | 40 | 45 | This study |
| 2 | Hilly gully region on the northeastern Loess Plateau | 0.54 | 9.1 | Cropland | 397 (1959–2018) | 59 | 30 | [22] |
| 3 | Hilly gully region on the central Loess Plateau | 0.49 | - | Cropland, grassland | 520.54 (1976–1997) | 21 | 138 | [58] |
| 4 | The Moldavian Plateau of Romania | 0.61 | - | Deforestation | 500–700 | 65 | 1 | [59] |
RL—Linear gully growth rate; RA—areal gully growth rate; Pa—annual precipitation; MP—monitoring period.
Table 7.
Topographic threshold of gully erosion in published papers and this study.
| Country | Study Area | k | b | Main Land Use Type | Reference |
|---|---|---|---|---|---|
| Belgium | Vlaams Brabant | 0.050 | 0.400 | Cropland | [62] |
| Spain | Cerro Tonosa | 0.230 | 0.100 | Cropland | [63] |
| USA | Standford Hills, California | 0.180 | 0.500 | Rangeland | [52] |
| China | Hilly gully region, Loess Plateau | 0.184 | 0.239 | Cropland | [29] |
| China | Hilly gully region, Loess Plateau | 0.058 | 0.300 | Cropland | [64] |
| China | Hilly gully region, Loess Plateau | 0.053 | 0.379 | Unpaved road 1 | [57] |
| China | Tableland region, Loess Plateau | 0.006 | 0.289 | Apple orchard, cropland | This study 2 |
1. Gully erosion on unpaved road with multiple land uses in the drainage area. 2. These k and b values are for 70 gullies, including those that are stable and growing.
Publisher’s Note: MDPI stays neutral with regard to jurisdictional claims in published maps and institutional affiliations. |
© 2021 by the authors. Licensee MDPI, Basel, Switzerland. This article is an open access article distributed under the terms and conditions of the Creative Commons Attribution (CC BY) license (https://creativecommons.org/licenses/by/4.0/).
Share and Cite
MDPI and ACS Style
Wang, J.; Zhang, Y.; Deng, J.; Yu, S.; Zhao, Y. Long-Term Gully Erosion and Its Response to Human Intervention in the Tableland Region of the Chinese Loess Plateau. Remote Sens. 2021, 13, 5053. https://doi.org/10.3390/rs13245053
AMA Style
Wang J, Zhang Y, Deng J, Yu S, Zhao Y. Long-Term Gully Erosion and Its Response to Human Intervention in the Tableland Region of the Chinese Loess Plateau. Remote Sensing. 2021; 13(24):5053. https://doi.org/10.3390/rs13245053
Chicago/Turabian StyleWang, Jiaxi, Yan Zhang, Jiayong Deng, Shuangwu Yu, and Yiyang Zhao. 2021. "Long-Term Gully Erosion and Its Response to Human Intervention in the Tableland Region of the Chinese Loess Plateau" Remote Sensing 13, no. 24: 5053. https://doi.org/10.3390/rs13245053
Note that from the first issue of 2016, this journal uses article numbers instead of page numbers. See further details here.