Article

Is It All the Same? Mapping and Characterizing Deprived Urban Areas Using WorldView-3 Superspectral Imagery. A Case Study in Nairobi, Kenya

1
Department of Geoscience, Environment & Society, Université Libre de Bruxelles (ULB), 1050 Bruxelles, Belgium
2
Division of Geoinformatics, KTH Royal Institute of Technology, 10044 Stockholm, Sweden
3
School of Architecture, University of Navarra, 31009 Pamplona, Spain
4
Faculty of Geo-Information Science & Earth Observation (ITC), University of Twente, 5414 AE Enschede, The Netherlands
*
Author to whom correspondence should be addressed.
Those authors contributed equally to the work.
Remote Sens. 2021, 13(24), 4986; https://doi.org/10.3390/rs13244986
Submission received: 8 November 2021 / Revised: 30 November 2021 / Accepted: 3 December 2021 / Published: 8 December 2021
(This article belongs to the Special Issue Optical Remote Sensing Applications in Urban Areas II)

Abstract

:
In the past two decades, Earth observation (EO) data have been utilized for studying the spatial patterns of urban deprivation. Given the scope of many existing studies, it is still unclear how very-high-resolution EO data can help to improve our understanding of the multidimensionality of deprivation within settlements on a city-wide scale. In this work, we assumed that multiple facets of deprivation are reflected by varying morphological structures within deprived urban areas and can be captured by EO information. We set out by staying on the scale of an entire city, while zooming into each of the deprived areas to investigate deprivation through land cover (LC) variations. To test the generalizability of our workflow, we assembled multiple WorldView-3 datasets (multispectral and shortwave infrared) with varying numbers of bands and image features, allowing us to explore computational efficiency, complexity, and scalability while keeping the model architecture consistent. Our workflow was implemented in the city of Nairobi, Kenya, where more than sixty percent of the city population lives in deprived areas. Our results indicate that detailed LC information that characterizes deprivation can be mapped with an accuracy of over seventy percent by only using RGB-based image features. Including the near-infrared (NIR) band appears to bring significant improvements in the accuracy of all classes. Equally important, we were able to categorize deprived areas into varying profiles manifested through LC variability using a gridded mapping approach. The types of deprivation profiles varied significantly both within and between deprived areas. The results could be informative for practical interventions such as land-use planning policies for urban upgrading programs.

1. Introduction

Over the past few decades, Sub-Saharan Africa (SSA) has been facing an extensive and overwhelming population growth, mainly occurring in urban regions [1]. The lack of provisions to address this phenomenon has further exaggerated socio-economic fragmentation within cities [2], leading to the proliferation of deprived urban areas (DUAs) that often lack basic services, such as access to clean water and sanitation, among others [3]. Within DUAs, urban dwellers are often exposed to unhealthy and unsuitable physical environments, with hazardous effects on their health. For instance, as pointed out by Aliu et al. [4] in a case study on Lagos, Nigeria, residents of the most deprived areas of the city were surrounded by solid waste and stagnant water, which contributes to the degree of overall deprivation. Additionally, the issue of waste disposal and its effect on disease burden was demonstrated by Muoki et al. [5] using, as a case study, the Mukuru slums of Nairobi, Kenya. In the current COVID-19 pandemic, DUAs are largely neglected and face a disproportionate epidemiological burden of diseases in comparison to more affluent neighborhoods [6]. Demonstrated difficulties to maintain social distancing and maintain necessary livelihood activities have been emphasized, while the disruption of global supply chains has led to food shortages in several of the most vulnerable and deprived areas [7,8,9,10]. The situation is a matter of great concern, considering the fact that the number of dwellers residing in these areas often represent the majority of a city’s population and is likely highly underestimated [11]. For example, in Nairobi DUAs occupy less than five percent of the city extension but are home to more than sixty percent of the population [12].
International efforts to improve the well-being of the most vulnerable urban residents, such as the United Nations (UN) Sustainable Development Goal 11 (SDG11), require a large amount of information to be regularly assembled and analyzed for adequately monitoring progress towards their targets. To address the issue of data gaps, Earth observation (EO) has been proposed as a way to map various aspects of DUAs, such as the physical environment, socio-economic status, human population counts, and health risk, among others [13,14,15]. Nonetheless, the majority of EO-based studies on DUAs focus on mapping their location and extent within a city’s boundaries but not their inter- or intra-DUA variations, which is a necessary prerequisite towards evidence-based policy making [16]. In fact, DUAs can be vastly different from each other, even within the same city, as they reflect the various socio-economic processes that created them. Their differences may lie in their infrastructure (i.e., the provision of basic services), their socio-economic status, or their land tenure status, but also in their physical characteristics (i.e., urban patterns, size and materials of dwellings, width of streets, and areas of open space). As such, it is imperative to acquire a better understanding of these variations in order to converge towards global or local DUA typologies and support policy-making efforts [17,18]. The combination of very-high-resolution (VHR) EO data and machine-learning-based processing is a powerful approach to unveil the intra-variation in DUAs based upon the physical characteristics captured on satellite images, while it can also analyze geographical regions spread throughout an entire city at unprecedented levels of spatial detail.
Nonetheless, the potential of EO data to analyze DUAs at large geographic scales brings its own limitations and must be further explored [19], despite efforts to link EO data and socio-economic elements [20,21,22,23]. There have been only limited attempts to create parsimonious and transferable models as most EO studies focus on small urban snippets while not accounting for the complexity of the applications [24]. Moreover, as DUAs can be highly heterogeneous within a city, an appropriate adaptation of existing mapping frameworks to accurately depict them is necessary. This relates to the selection of the classification scheme (i.e., including classes such as waste piles) as well as tackling frequently encountered challenges, such as limited data availability and transferability of city-wide applications, as well as increasing our understanding of the remotely sensed data that are needed to achieve these goals. As such, by using Nairobi, Kenya, as a case study we go beyond the current state of the art and investigate a novel, multifaceted set of objectives:
(1)
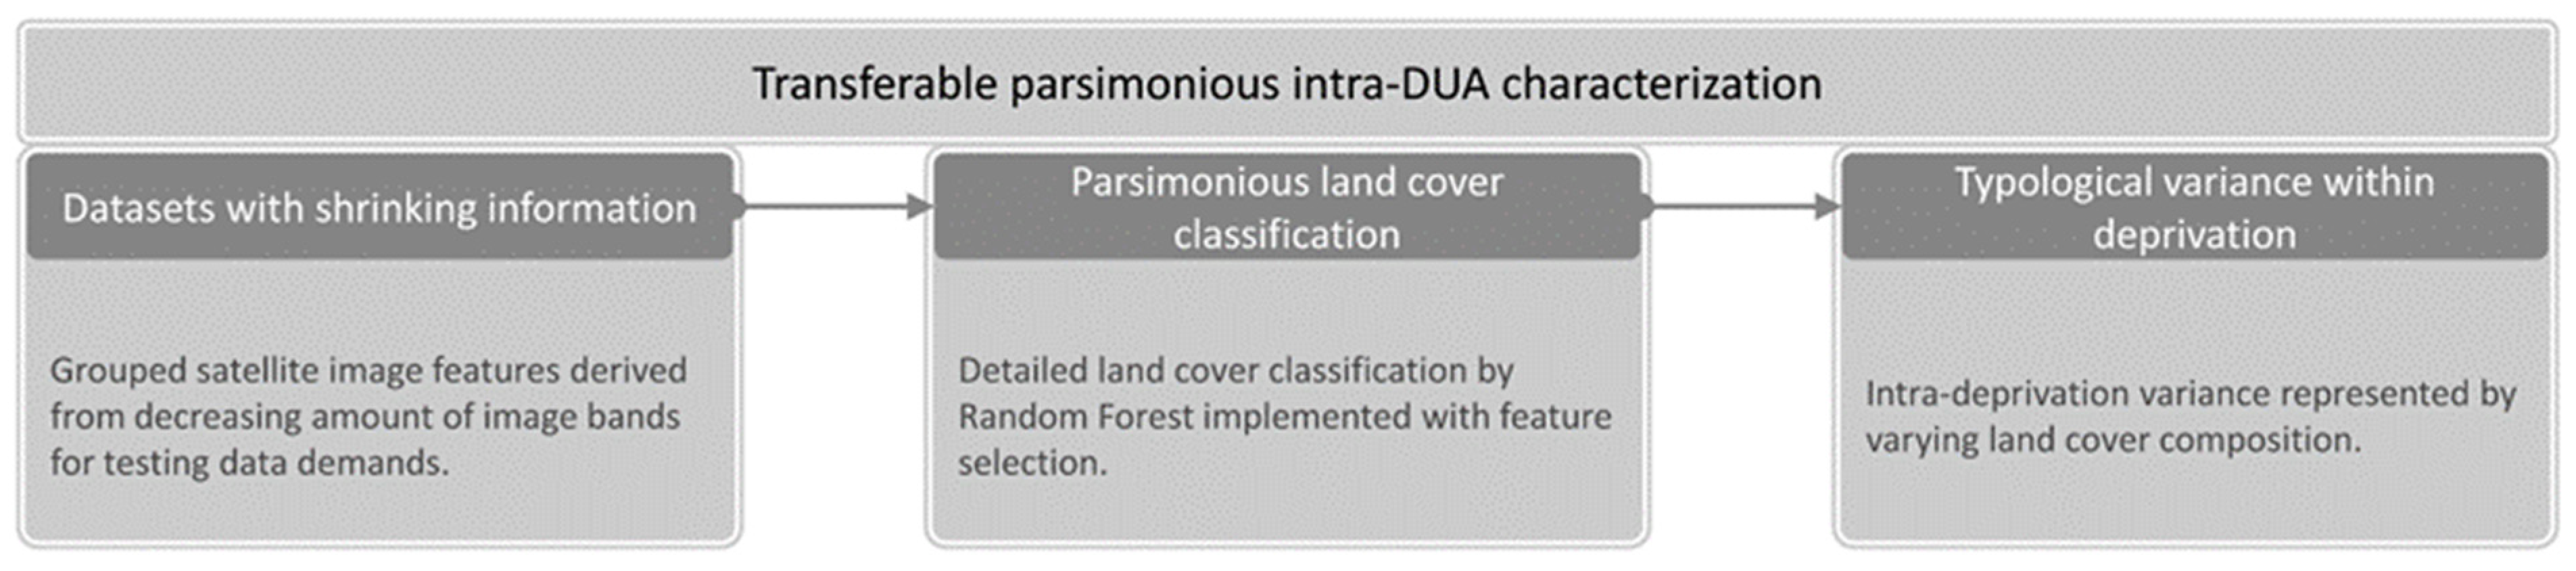
Detailed characterization within and between DUAs based on their land cover (LC) indicators and the potential of mapping rarely mapped deprived urban LC classes, such as waste piles and vehicles.
(2)
The transferability potential of EO-based LC models across various deprived areas in Nairobi, using multisource and multiresolution satellite data, taking parsimony into consideration.
(3)
The potential contribution of infrequently used satellite datasets for the task of urban LC mapping, such as the full multispectral (MS) eight-band bundle of the WordView-3 (WV-3) sensor, along with its full set of shortwave infrared (SWIR) bands.
Finally, adhering to open science standards, a processing framework has been developed through mostly open access software to facilitate its replication and use by other stakeholders, researchers, and organizations. In Section 2, we describe the materials and methods used in our work as well as their availability.

2. Materials and Methods

We developed a transferable and parsimonious workflow that can be generalized for a scientific understanding of DUA diversity in terms of detailed LC composition analysis (Figure 1).

2.1. Study Area and Data

The study area is found in Nairobi City County, Kenya. Nairobi comprises many DUAs, such as Kibera, the largest slum in Africa and one of the largest globally. DUAs are commonly referred to as “slums” or “informal settlements” by local authorities (e.g., by Kenyan slum upgrading programs, such as KESIP) and international authorities [25]. In this paper, we denote all these regions as DUAs, in order to escape from any pejorative connotation that the word “slum” implies for Nairobi citizens. Nairobi DUA dwellers constitute more than sixty percent of the city population [12], with current estimates putting the number up to 2.5 million [26], and are characterized by a low socio-economic status and poor-quality houses [27]. As Abascal et al. [28] point out, there is no agreement yet on the area-based characterization of DUAs, and poverty is still being measured only with socio-economic household-level indicators, often at administrative levels. The DUA layer utilized in this study was provided by the Spatial Collective (SC) company in 2020. SC is a Nairobi-based organization working in the field of geographic information systems (GISs) in SSA cities. SC empowers and supports DUA communities and organizations by collecting data needed by the communities. The operational approach is to work with people in the communities, using available technologies to collect the geographic data that matters to them. As such, the study extent is valuable as it represents local dwellers’ understanding and perceptions of the extent and location of the settlements.
An extended set of WV-3 bands acquired in 2020 was employed, comprising of a panchromatic band (0.30 m), 8 multispectral bands (1.24 m), and 8 SWIR bands (3.70 m) (Table 1). The WV-3 MS bands were pansharpened through the PANSHARP module of the PCI Geomatica software using the panchromatic band. The WV-3 MS bands contain rich spectral information across the visible and near-infrared spectrum (coastal, blue, green, yellow, red, red edge, NIR 1, and NIR 2 bands), while the SWIR bands provide detailed information of the shortwave spectrum and have been used for a variety of applications [29,30,31]. Additionally, we co-registered the WV-3 SWIR bands to the WV-3 MS ones to account for a small positional shift between them. False-color composites of MS and SWIR imagery along with the DUAs of Nairobi used in the study are illustrated in Figure 2. Finally, areas with clouds or cloud shadows were masked from any subsequent analysis.

2.2. Geographic Object-Based Image Analysis Processing (GEOBIA)

The data pre-processing, segmentation, and feature extraction were developed using the open source software GRASS GIS [32] and the processing chain proposed by Grippa et al. [33] in a Jupyter Notebook environment [34]. The feature selection algorithms, predictions, and accuracy measurements were performed through the R statistical software. The GEOBIA-related code and resultant maps are publicly available in the Zenodo scientific repository [35].

2.2.1. Spectral Layers and Textures
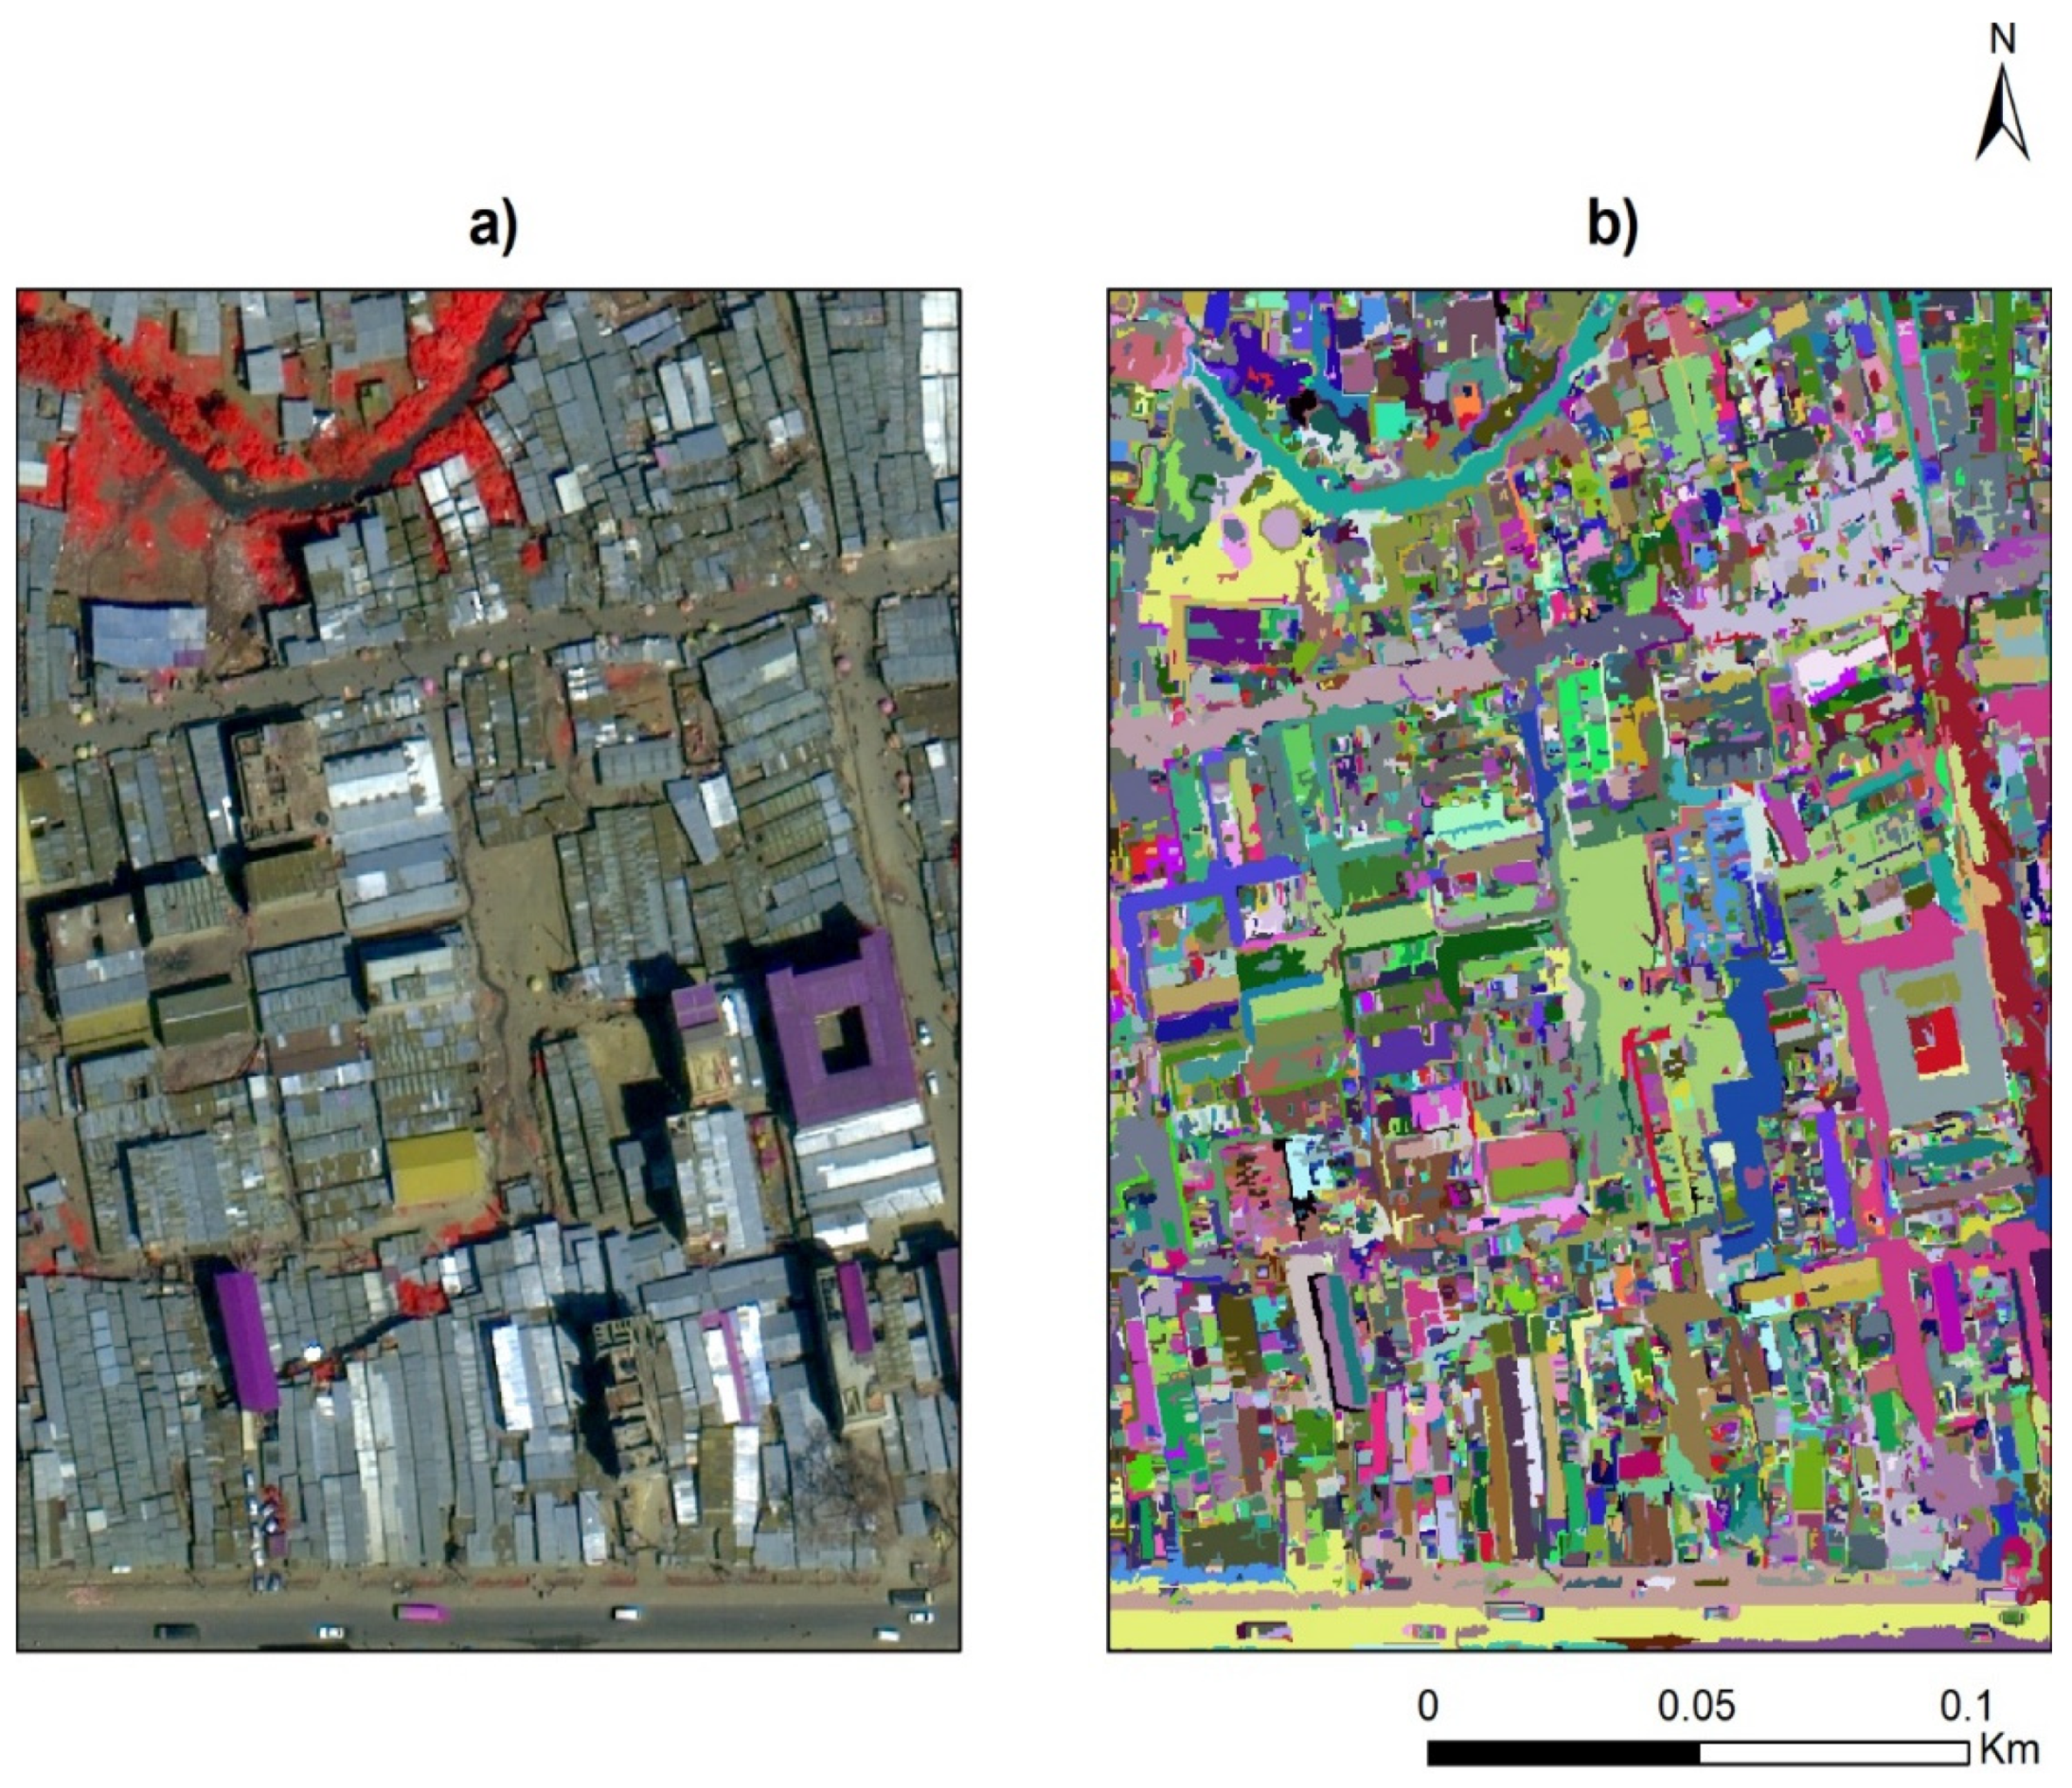
The initial features were the eight multispectral and eight shortwave infrared bands of the WV-3 satellite. Additionally, we computed the normalized difference vegetation index (NDVI). Finally, for each multispectral, shortwave, and NDVI band we computed an extensive set of first- and second-order texture layers, which can be observed in detail in Appendix A Table A1. The textures were computed at three kernel sizes (3, 9, and 19), representing different spatial scales and capturing different levels of spatial information.

2.2.2. Segmentation

To start with, we applied a 50 m buffer to our DUA layer in order to remove potential artifacts and merge very small adjacent areas. We applied a GEOBIA framework to derive the segments using a locally adapted unsupervised segmentation parameter optimization (USPO) procedure, as proposed by Grippa et al. [36]. First, the RGBNIR bands of the WV-3 images were used as an input for the region-growing segmentation algorithm of GRASS GIS [37]. The segmentation process was optimized using the F-measure, which considers both intra- and inter-segment heterogeneity, by utilizing the Moran’s I and variance spatial metrics, and has been demonstrated as one of the most robust unsupervised segmentation practices [38]. The segmentations that best optimized these combined measures were selected for further processing, such as feature extraction and classification.

2.2.3. Simulation of Limited Training Data

One of the critical objectives was to investigate the transferability of the LC models between the various DUAs in Nairobi. To achieve this, we used one of the DUAs for which we have the best field knowledge and local contacts, Mathare, to assemble a database of training data. Mathare consists of 13 neighborhoods (1.43 km2 and 11.4% of the total DUA area in Nairobi) and is visualized in Figure 3. We collected training data through random and manual sampling. The classification scheme was designed to reflect indicators of openness, density, socio-economic status, and environmental health hazards [39]. We sampled standard LC classes such as buildings, types of vegetation but also classes that may relate to socio-economic profiles of urban areas such as waste piles and vehicles. A category representing shadows was additionally sampled. Using computer-assisted photo interpretation by remote sensing experts, we labelled 6240 segments within Mathare with their underlying LC class (Table 2). Notably, the mapping of waste piles has been strongly desired by local communities and stakeholders during the COVID-19 crisis. Locations of waste piles collected by ground field checks were provided by the SC.
The reason for using training data from only one DUA in Nairobi was to simulate the common scenario where an abundance of data is only available at a small, specific location of a larger study area due to the availability of ground surveys and local contacts there. Equally important, it allowed us to investigate the transferability of the LC models across other DUAs in the city, even if they conform to different morphological typologies. Afterwards, we proceeded to the transfer of the LC models and subsequent LC typological grouping to other DUA locations in Nairobi (Figure 1).

2.2.4. Descriptive Statistics

The features used in the classification consist of a set of descriptive statistics calculated for each layer and at the segment level, such as the mean, median, and standard deviation. A full list of the computed statistics can be found in Appendix A Table A2. Additionally, the mean and standard deviation of each layer were also extracted in all the neighboring segments. This allowed us to capture high levels of contextual information. Finally, we partitioned the features into four categories to test different scenarios and assess the assets and drawbacks of using several band combinations. In detail, we categorized the predictive features into those derived from the RGB bands, the RGBNIR bands, all 8 WV-3 multispectral bands (hereby denoted as MS-8), and finally all 8 MS bands with all 8 SWIR bands (hereby denoted as All).

2.2.5. Feature Selection

One of the primary objectives of this study was to create parsimonious models, eliminate the computational burden of such a large-scale application, and avoid the “curse of dimensionality” [24]. Moreover, using only a limited number of well-selected features is desirable when seeking to develop transferable models. To do so, we employed a state-of-the-art feature selection (FS) method, namely the popular variable selection using random forests (VSURF) algorithm [40]. VSURF is a wrapper algorithm that creates iterative and nested random forest (RF) models and evaluates the importance of each predictive feature in the classification task. As a final step, it recommends the feature subset that is most discriminant while maintaining or increasing classification accuracy. Using our training data, we ran the VSURF algorithm for each of the four EO datasets and produced a list of the most predictive variables (Table A3). Notably, the lack of spectral richness of some combinations is compensated for by using more texture features. For instance, the RGB and RGBNIR FS subsets contain 62% textural features, while the MS-8 and All subsets contain only 46%. The proportions of NDVI-based features appear to be similar across datasets, as for the RGBNIR, MS-8, and All sources the prevalence was 23%, 23%, and 18%, respectively. In the All dataset, 11% of the features were SWIR-based. Ultimately, the number of selected variables was dramatically lower than using the initial set of features, as evidently demonstrated in Table 3.

2.2.6. Classification

To perform the classification, we used the commonly employed RF algorithm. RF is an ensemble of classification decision trees, quite resistant to overfitting due to its strong bootstrapping nature of repeatedly utilizing only subsets of data and features, that has been widely used in the remote sensing literature [26]. The RF algorithm provides a pseudo-independent internal accuracy metric, namely out-of-bag (OOB) accuracy, which can unveil a first and relatively robust impression of model performance [41]. The important hyperparameters that need to be defined in an RF algorithm are the number of grown decision trees and the number of selected features at each of the nodes. Both parameters were tuned through cross-validation through the “caret” package in R statistical software [42].

2.2.7. Validation

To validate our results we collected an extensive, independent validation dataset from the DUA layer of Nairobi. To start with, across all DUAs, we sampled 3000 segments. Those related to inland water, vehicles, and waste piles were collected non-randomly, while the rest of the samples were randomly allocated. Moreover, we fully labeled nine 50 m × 50 m rectangular tiles, randomly placed across the study area, to account for the accuracy using dense-level sampling. Table 4 presents the validation data collected.

3. Results

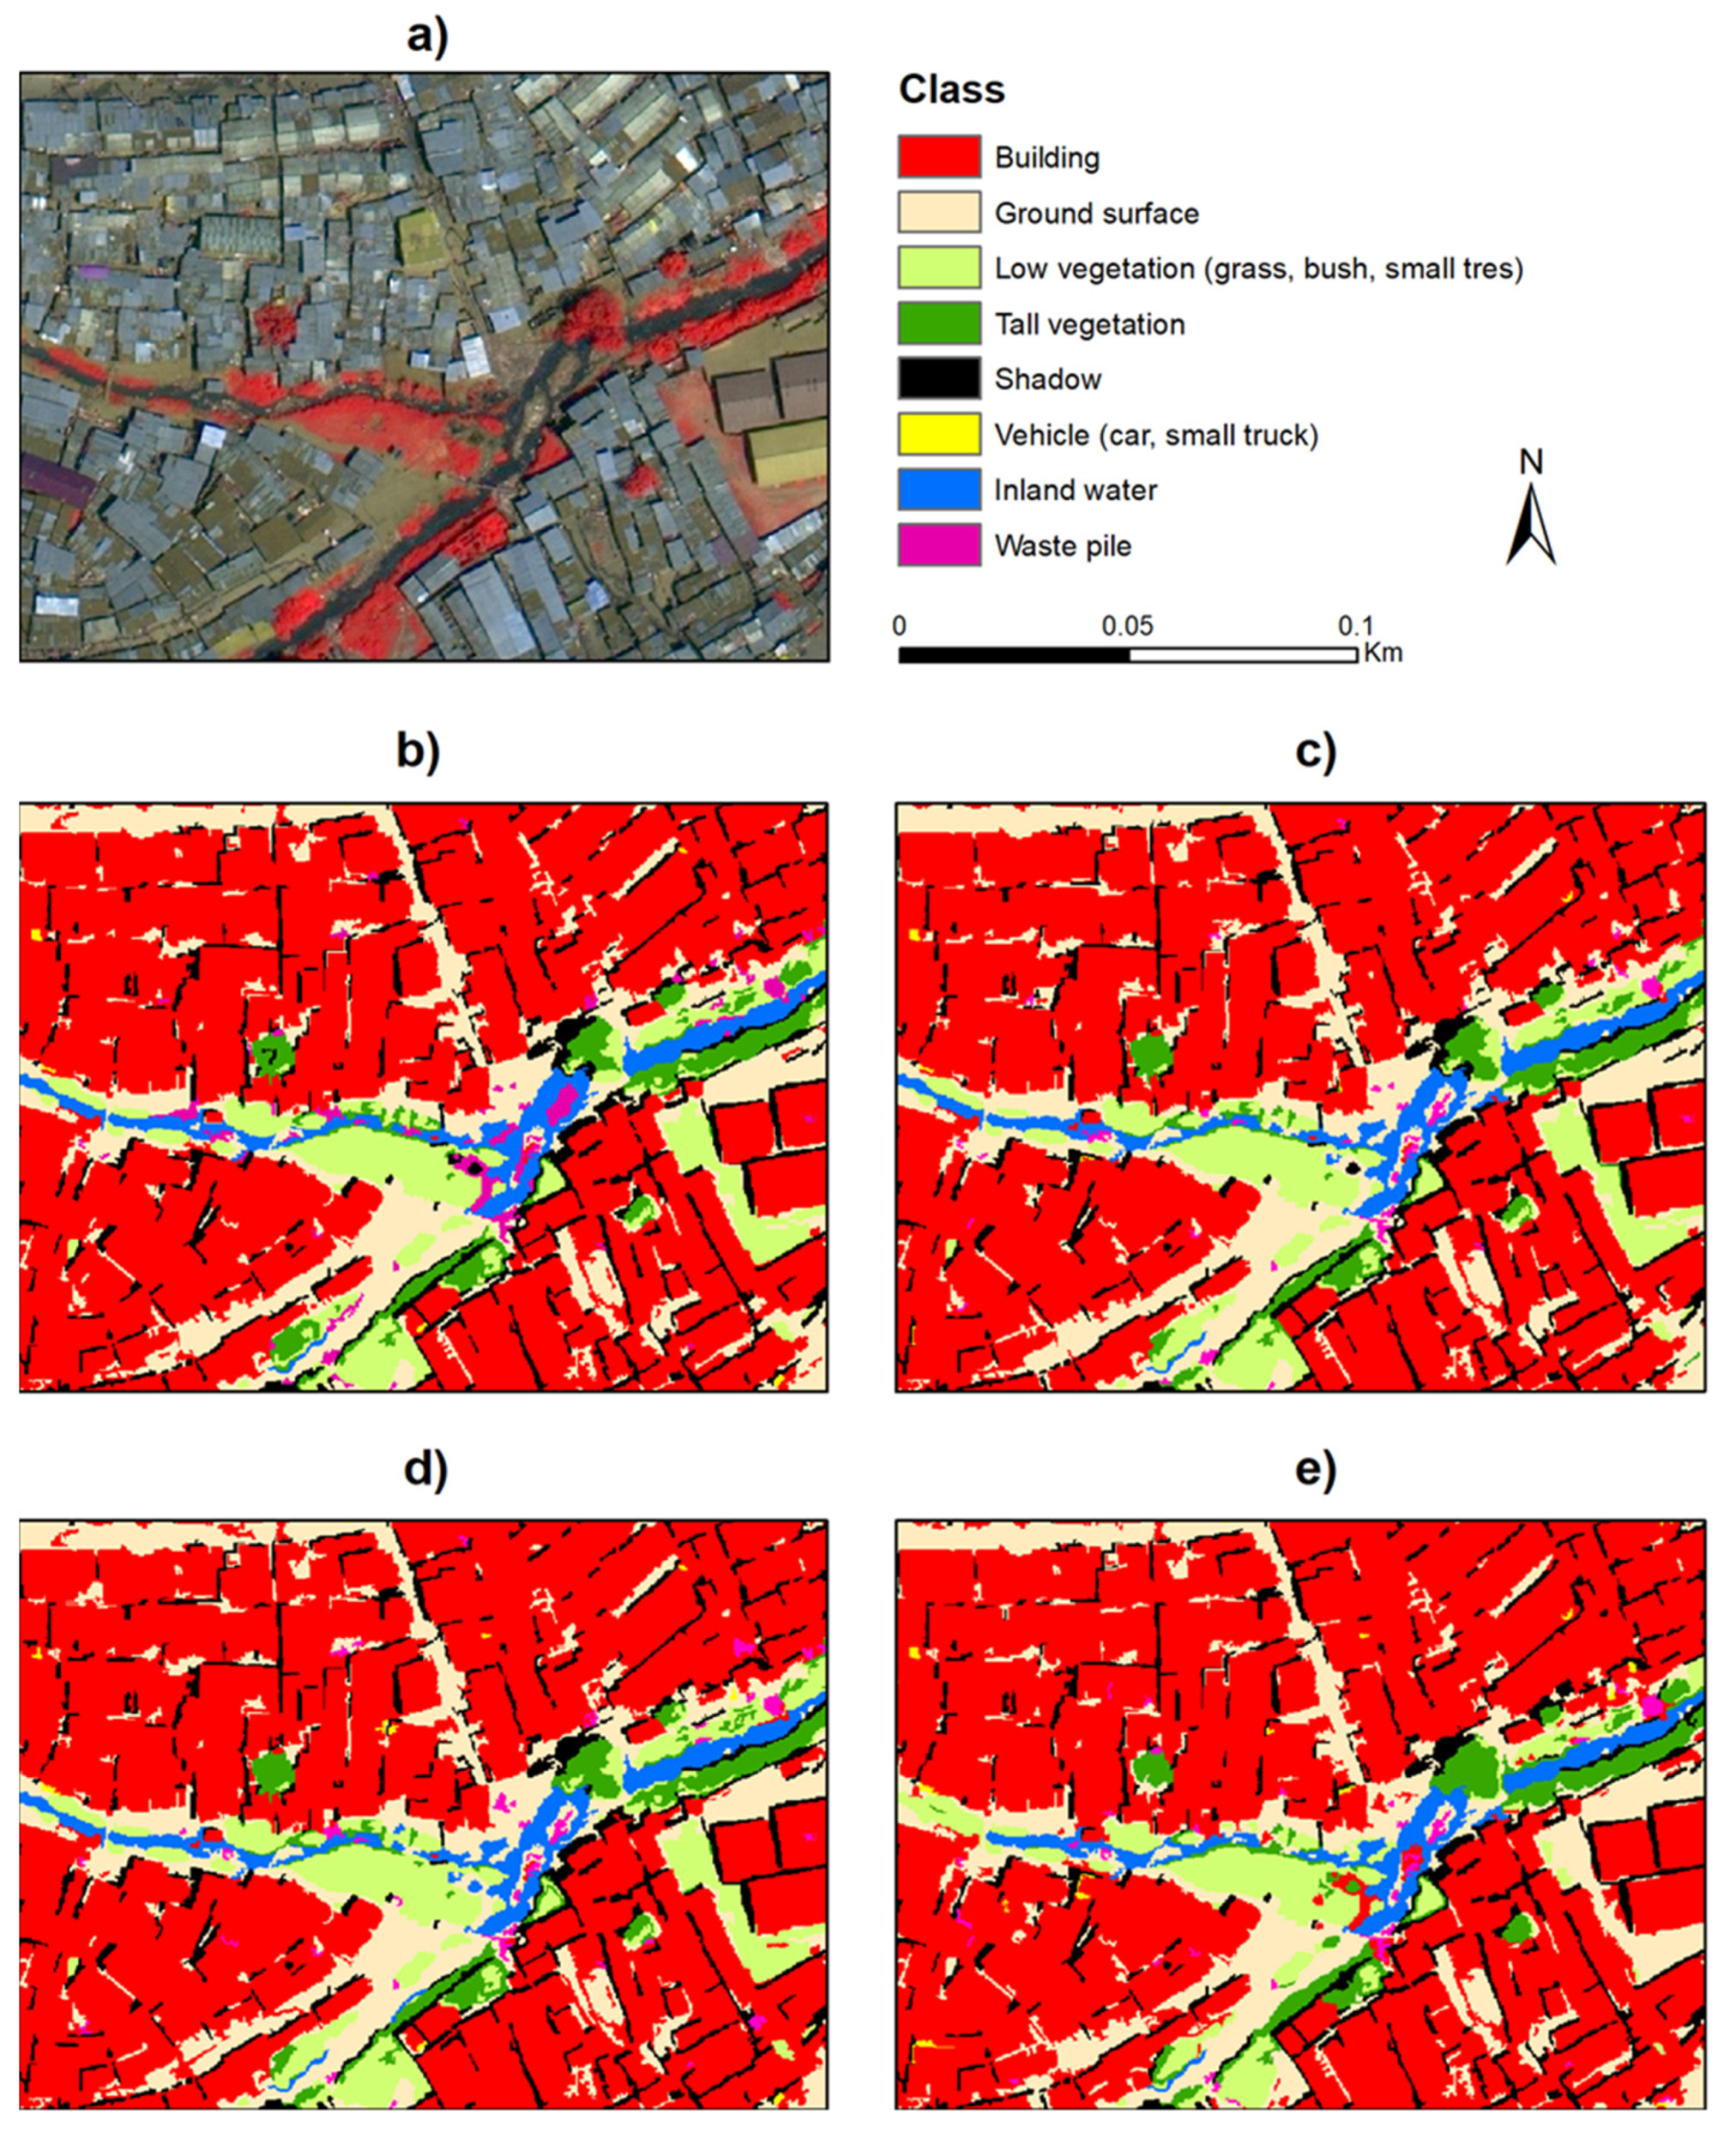
3.1. Land Cover Mapping Using GEOBIA

3.1.1. Land Cover Mapping Using GEOBIA

A snippet of the segmentation output can be found in Figure 4. Despite the complexity and heterogeneity of the urban landscape in DUAs, the unsupervised segmentation appeared satisfactory as the produced segments represented whole, or parts of, land surface objects, such as building roofs and trees. A total of 1,933,484 segments were produced for the whole study area.

3.1.2. Model Evaluation on the Training Data

As a first step, we assess the OOB accuracy of the RF-based LC models in Mathare, using the various datasets, with or without FS methods (Table 5). It is evident that while performing FS does not influence the OOB model accuracy in all four datasets, it dramatically decreases the training time of the model. Additionally, the overall accuracy (OA) in all experiments except for the RGB-based models shows non-significant differences and reaches an excellent level of around 89%. Given these preliminary findings, we only further investigate models incorporating FS. Subsets of the various LC model predictions in Mathare are visualized in Figure 5. As a large number of training data was available in Mathare, it is not unexpected that all classification models exhibit a remarkably high classification accuracy there.

3.1.3. Model Transferability

The trained models were used to predict the LC in other DUAs of Nairobi, where no training data were available. Using our validation dataset, we computed the overall accuracy (OA) and balanced accuracy per class (Table 6). Notably, the RGBNIR dataset provides the best results. Nonetheless, all band combinations, except for the RGB models, demonstrate remarkably similar performance. The RGB models overestimated built-up regions, which is reasonable given the lack of infrared information. In general, and in all models, the best-mapped classes were buildings, vegetation, and shadows. The classification of waste piles and vehicles was satisfactory (Figure 6 and Figure 7), especially since the trained models were spatially transferred to other parts of the city that do not necessarily contain the same spectral, spatial, or morphological distributions as the training area. In particular, the accuracy of waste piles ranged between 62–76%, depending on the dataset employed. Adding SWIR or all 8 WV-3 multispectral bands improved the results compared to the RGBNIR or RGB models. Interestingly, SWIR indicators improved water class accuracy by a margin of about 6 percent. Additional examples of the LC maps can be found in Figure A1, Figure A2, Figure A3, Figure A4, Figure A5 and Figure A6, while the detailed confusion matrixes can be found in Table A4, Table A5, Table A6 and Table A7.

3.1.4. Model Scalability

The effect of FS in large-scale applications is not only reflected in the reduced training time of the machine learning models, but also in the time reduction in the feature engineering process. For instance, computing a single texture (on a three-by-three kernel window) over the study area, requires roughly 15 min of processing time (on a single processing thread) and requires about 17 gigabytes of space as a GeoTiff file. This being the case, it would require massive amounts of time and storage space to deal with such an application if the number of features was multiplied to a few dozen. Running an LC model across a study area with 5000 features would require more than 2000 h of processing time and more than 15,000 GB of storage space (Figure 8). Alternatively, by focusing on computing large numbers of features only in the training data locations, as in this study, we can exponentially reduce the computational burden, efficiently select the most discriminant features, and use only them on the rest of the study area.

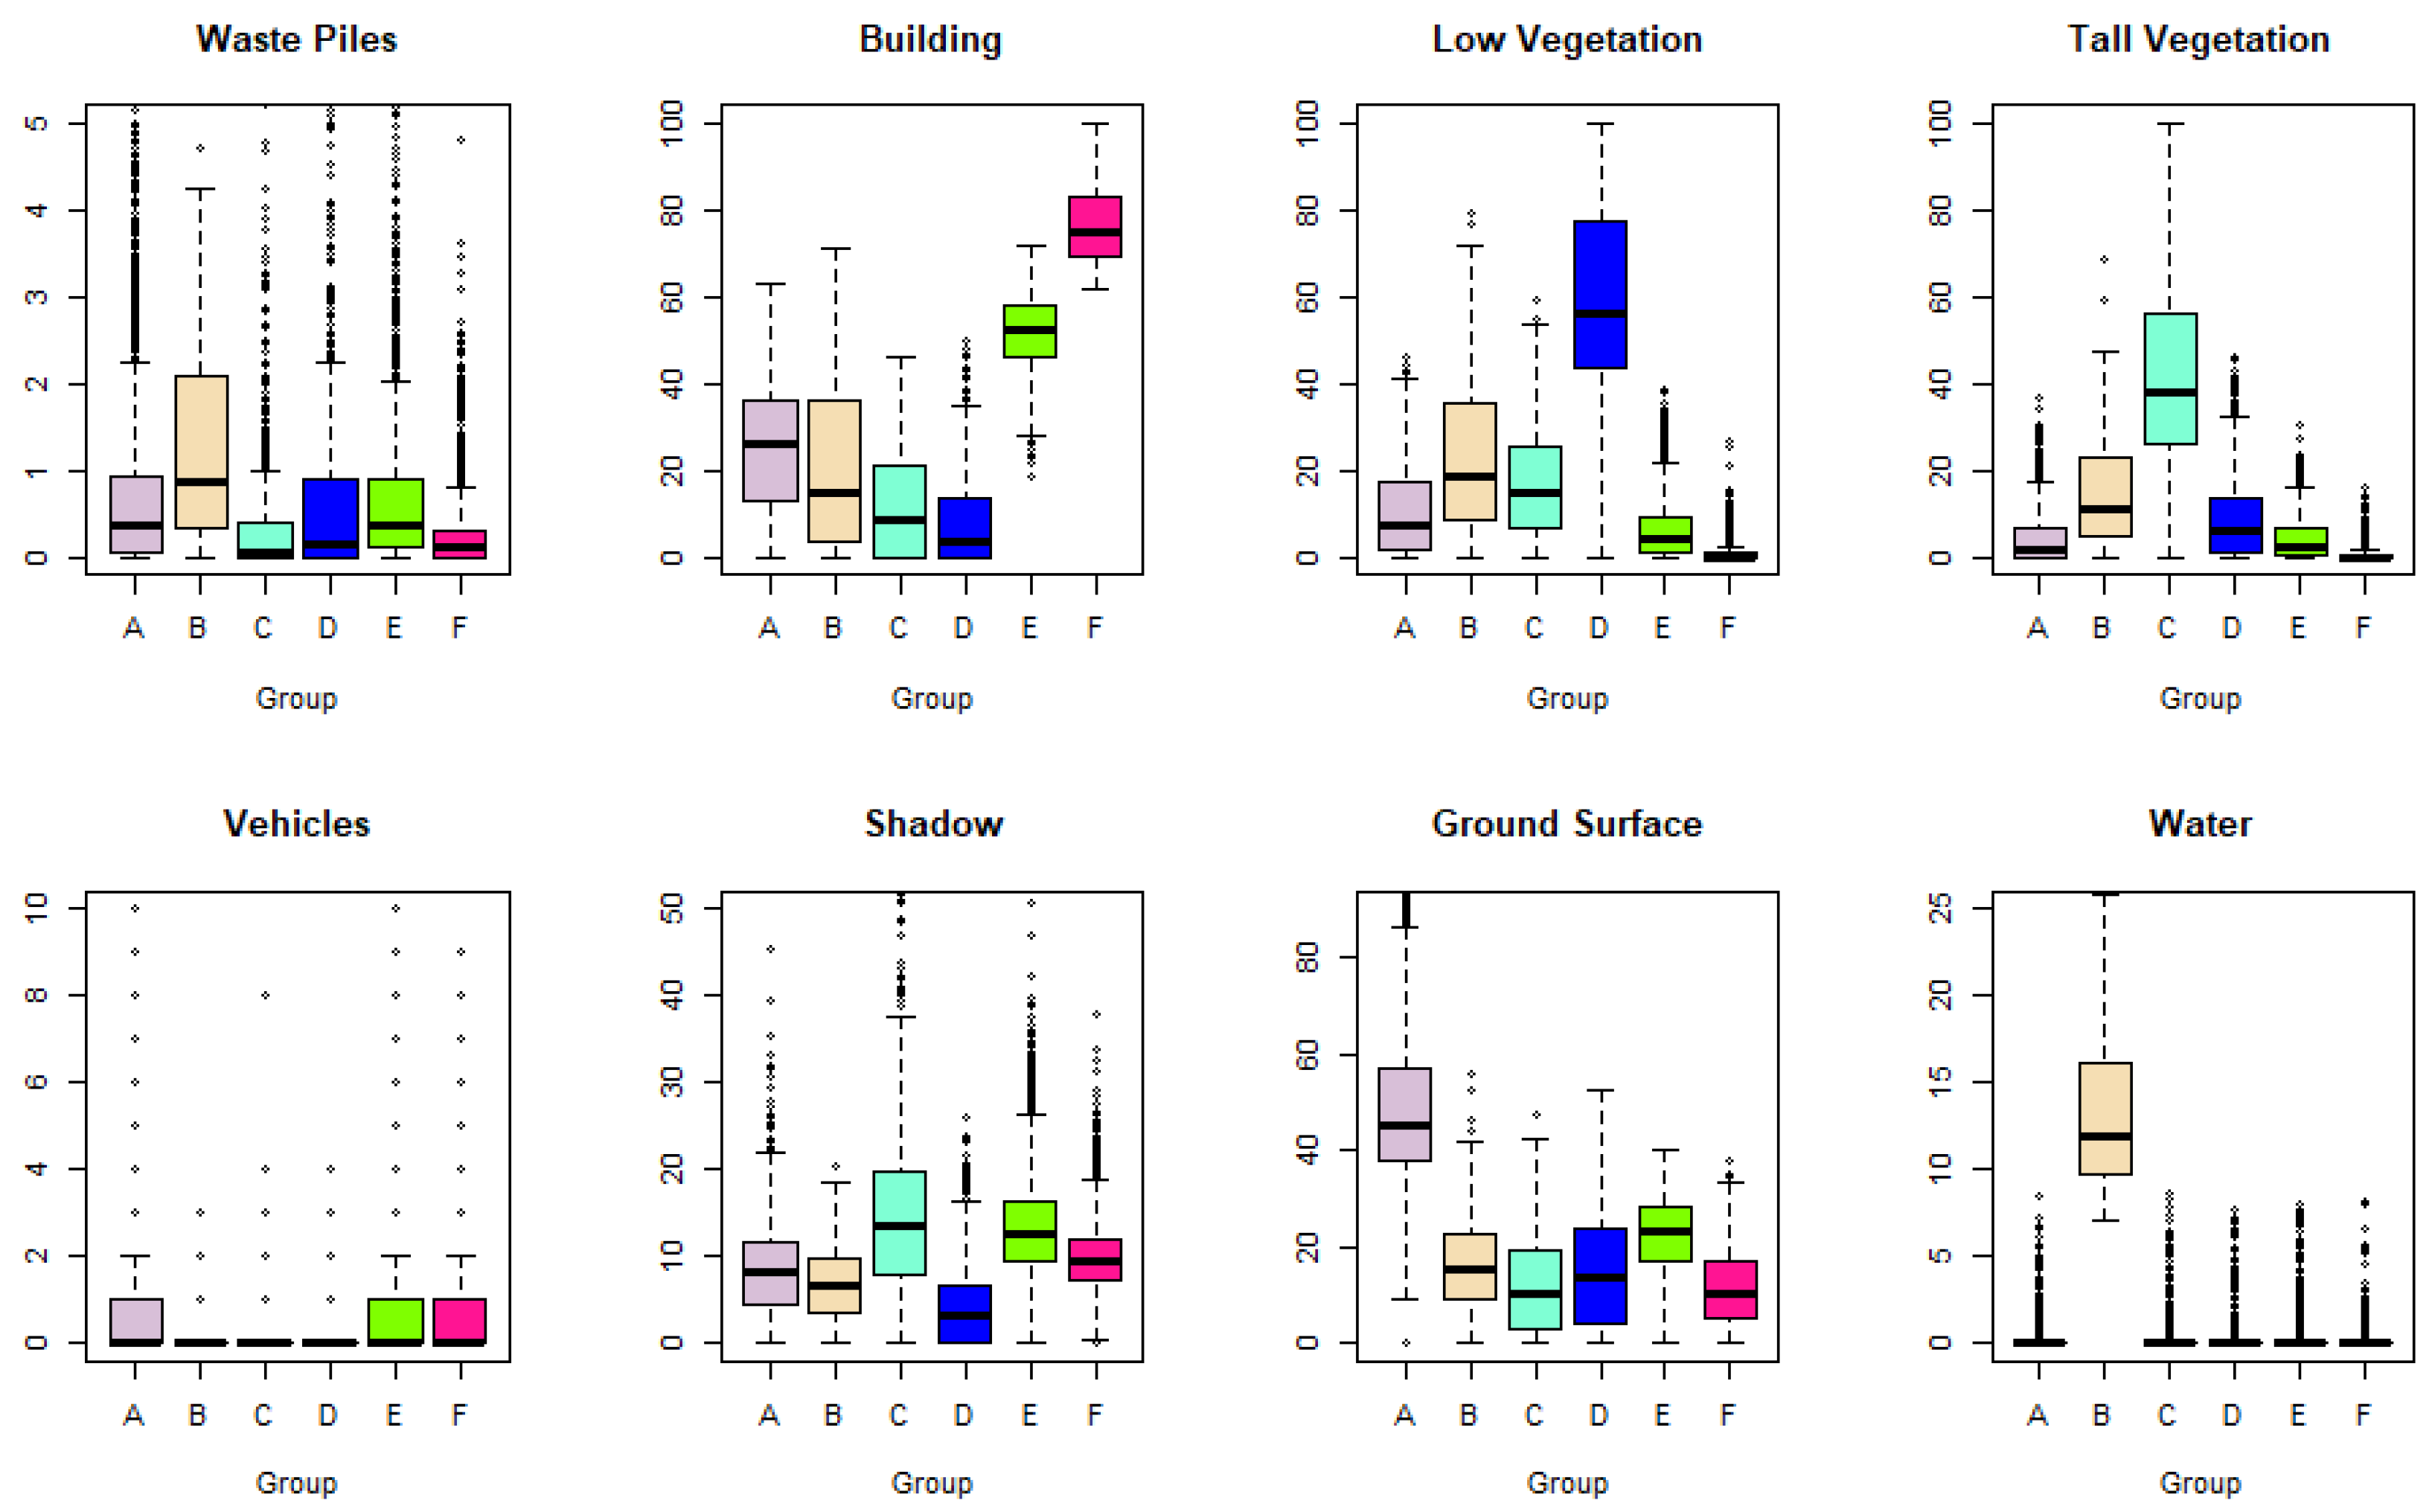
3.2. Inter- and Intra-DUA Variability

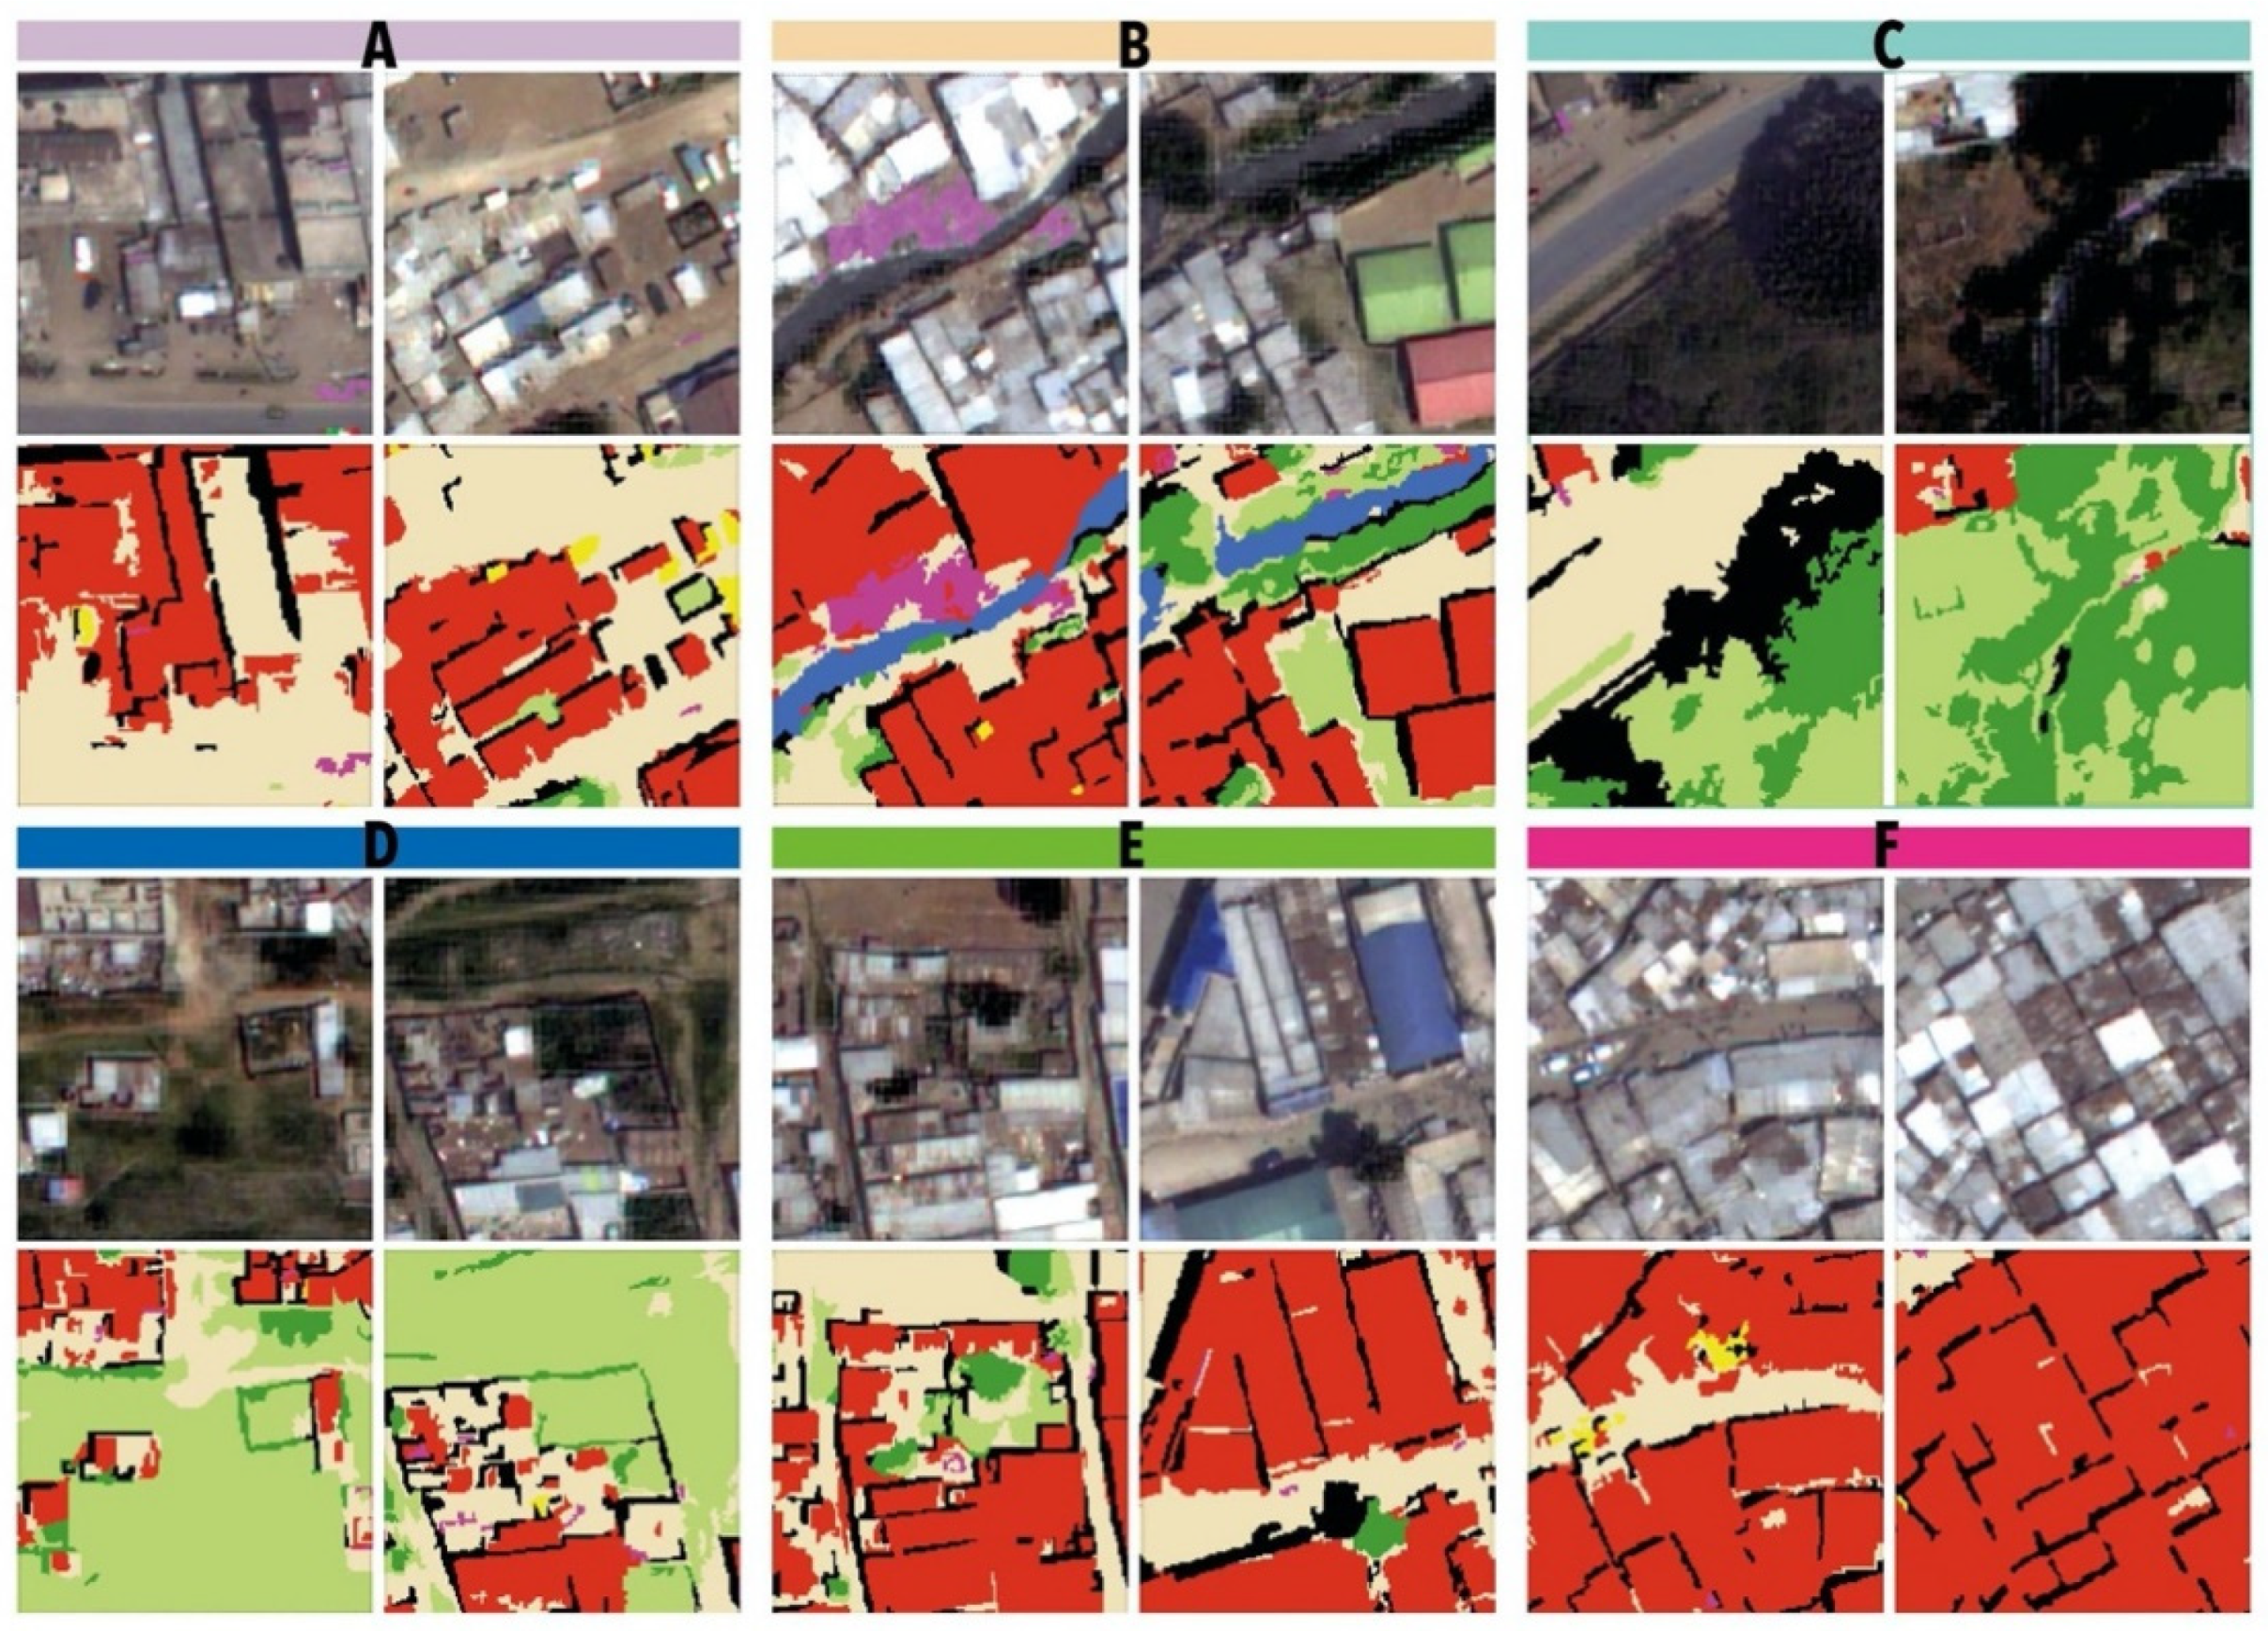
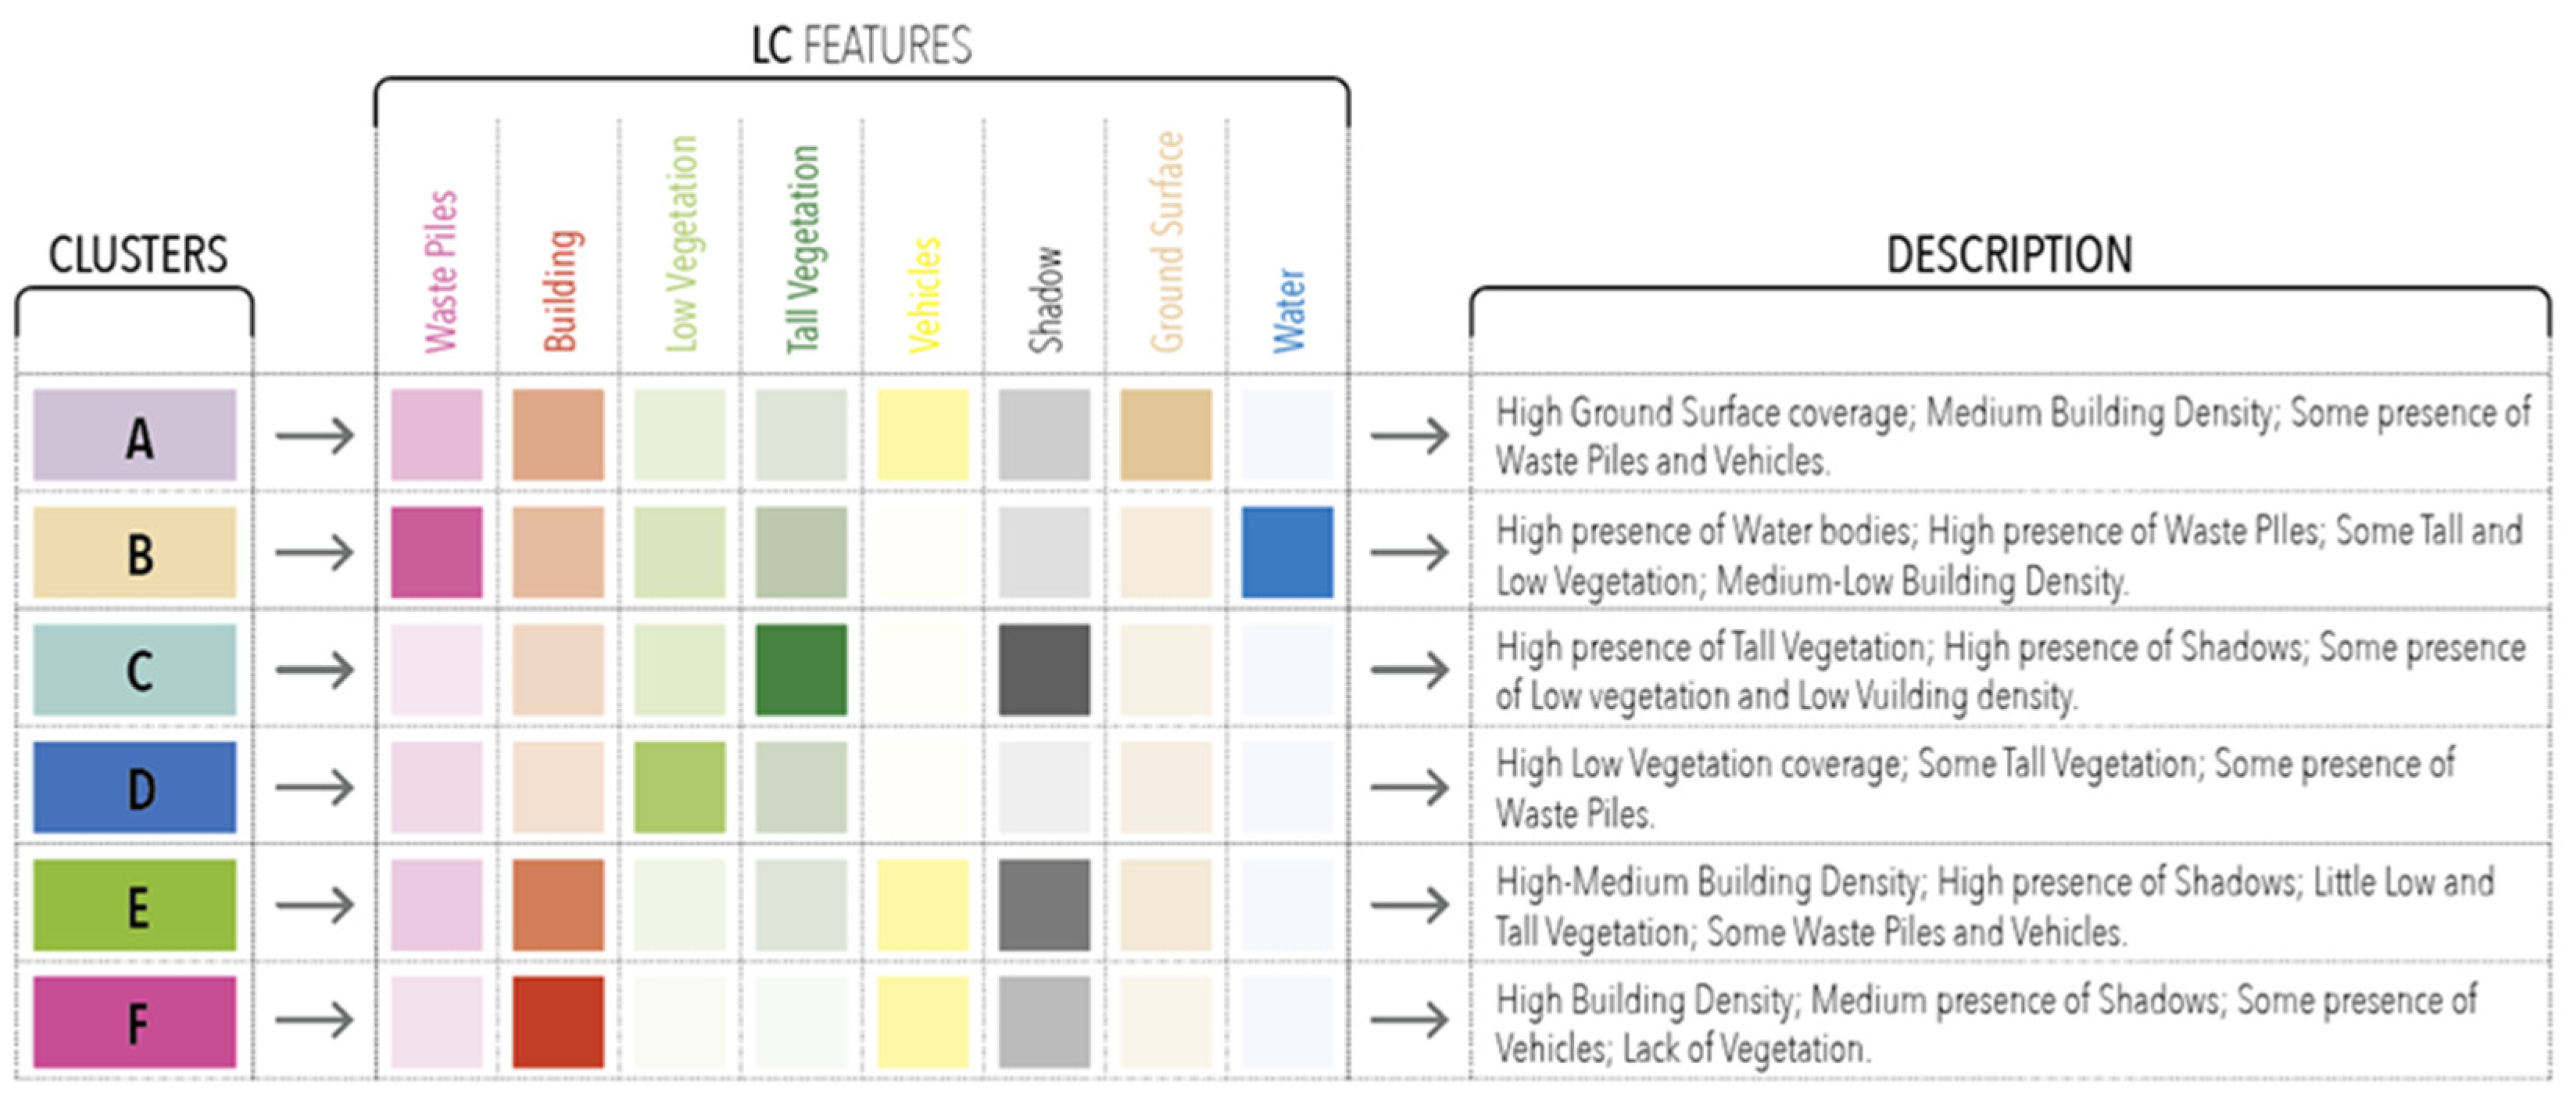
3.2.1. Unsupervised Clustering

To provide the first LC-based typology of DUAs, we used the model that performed best (RGBNIR). The RGBNIR LC map was aggregated to a 50 m × 50 m grid extending over all DUAs in Nairobi by calculating the proportion of each LC class. Next, the aggregated grid values were used in a sequential, unsupervised k-means clustering. Various experimentations on the number of clusters were undertaken; the one with the best trade-off between identifying meaningful urban clusters and their number was selected.

3.2.2. Description of the Extracted Clusters

Six clusters (A to F) were produced to show land-cover differences across (inter-DUA) and within (intra-DUA) settlements. Each cluster is defined by different proportions of the eight LC features: waste piles; building; low vegetation; tall vegetation; vehicles; shadow; ground surface; and water. As shown in Figure 9, each LC class is reflected in different proportions within each morphological cluster. Figure 10 demonstrates examples of grid cells (50 m × 50 m) that belong to these clusters, both on the satellite image and respective LC map.
Notably, there is a clear signature in each morphological cluster with respect to its LC distribution (Figure 11). The clusters from A to D represent low-density areas of the settlements, usually located at the edge of the neighborhood or on the main streets, while groups E and F represent high-density, built-up areas. For instance, group F is associated with extremely high building density and an almost complete absence of vegetation, while group E, although densely built, contains significantly taller buildings, i.e., a higher value of shadows as well as more vegetation and open space. Cluster A stands out for having the highest presence of ground surface. Cluster B is associated with the presence of large proportions of garbage and water areas. Cluster C is defined by having the greater presence of tall trees as well as shadows. Most zones in Cluster D are low-vegetation, and the presence of buildings in them is almost non-existent.

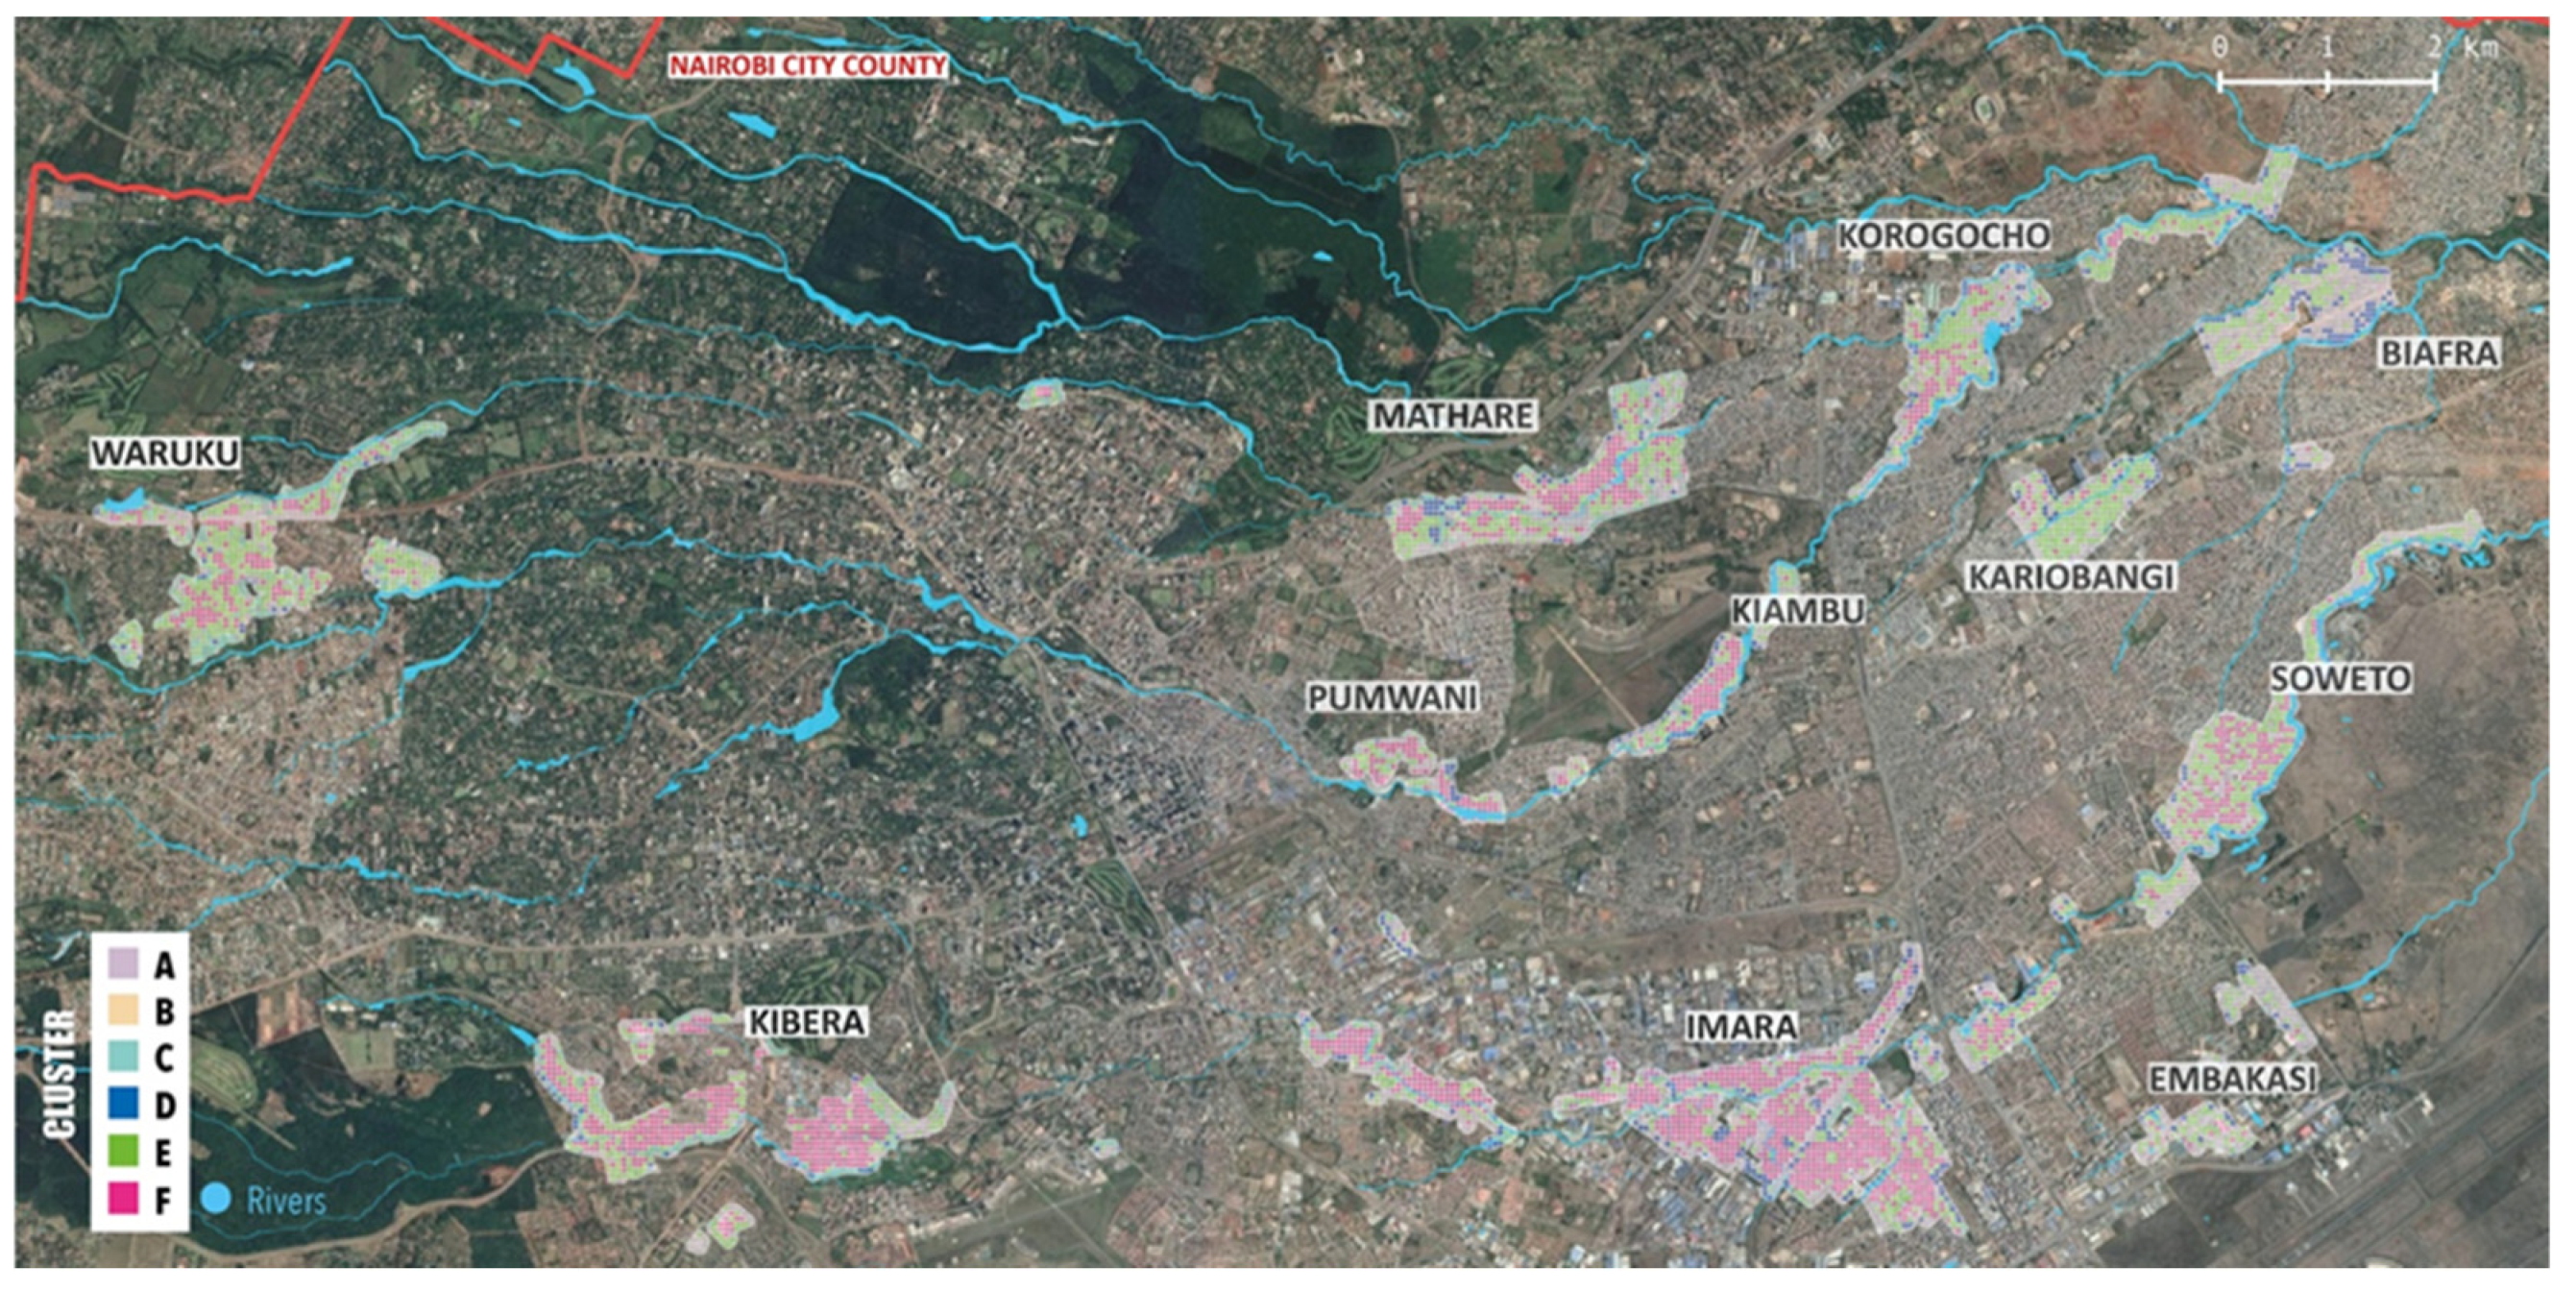
3.2.3. Inter-DUA Variability

On a city scale, there are some common patterns across DUAs (Figure 12). For instance, cluster A or cluster E occupy a large fraction of each DUA (i.e., cluster A or cluster E cover > 40% of the total DUA area, except in Imara). Additionally, cluster B is insignificant in all DUAs, not exceeding 10% of their area. Nonetheless, despite these common characteristics, there is a high degree of variability across DUAs, exceeding 20% in some cases, as shown in Table 7 where their proportions are documented.

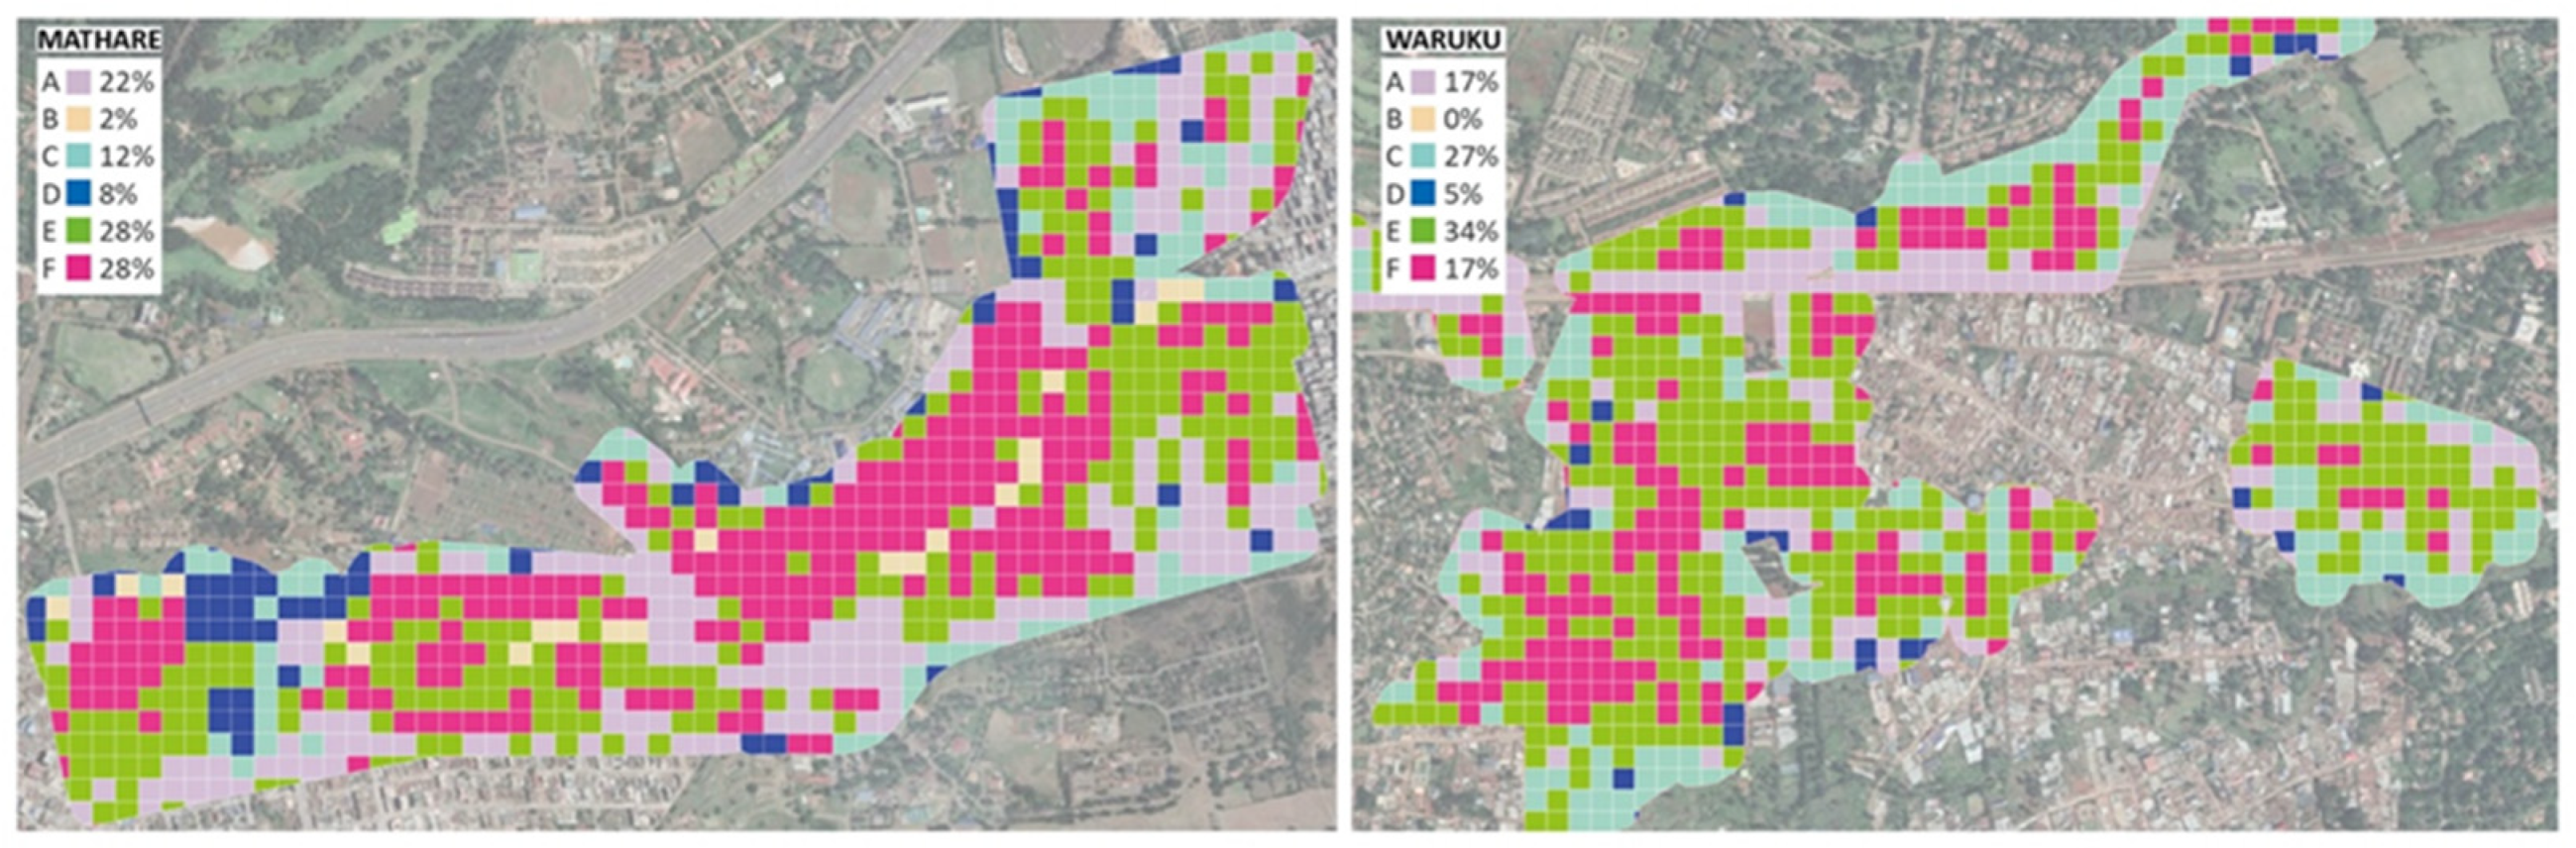
3.2.4. Intra-DUA Variability

The spatial arrangement of the clusters is also a point of interest. For instance, Mathare and Waruku show similar proportions of each cluster but differ significantly in their spatial distribution (Figure 13). In the former cluster A (open space, streets, and built-up to a low degree) is more widespread, while in the latter it only follows the central street network, indicating a less-developed street network and fewer open spaces.
DUAs north-east of Nairobi (e.g., Biafra and Korogocho) exhibit stronger intra-urban differences than in the south (e.g., Imara). There, DUAs are more homogeneous, with highly dense areas (cluster F dominating the landscape; Figure 14). On the other hand, Korogocho is characterized by a high proportion of open spaces, but also with moderately to highly dense built-up areas. Elevated buildings are found at the center of the settlement, while the perimeter is composed of green areas. Similarly, Biafra is characterized by a high proportion of open spaces as ground surfaces and low vegetation, while tall vegetation is also located at the edges of the settlement.

4. Discussion

4.1. On the Potential of Transferability, Interpretability, and Scalability

Through the results of this work, it was demonstrated that it is possible to create robust and transferable EO-based VHR LC models across the various DUAs of Nairobi, even if the availability of training data is restricted to a small fraction of the study area. This is owed largely to (i) computing a vast number of predictive features, which is rarely seen in GEOBIA studies, and (ii) using refined FS techniques to select the smallest, yet most discriminant of them to create parsimonious applications. The positive effects of developing small, yet highly predictive classification models were demonstrated in Georganos et al. [24], both in terms of accuracy and reduced complexity. Notably, the transferability of models was satisfactory, even though Mathare is not similar to all DUAs with respect to morphological characteristics. For instance, some of the DUAs exhibit lower building density with more regular layouts, in contrast to the highly dense built-up areas of Mathare. The most problematic class in terms of accuracy and visual inspection was the water bodies, which can be explained by the small number of training samples and can be alleviated by using water data in other areas of the city, which can be well-known and quickly derived from services such as OpenStreetMap. Interestingly, the mapping of waste piles was relatively robust across the city, which can rapidly provide information for epidemiological and health risk analyses.
The proposed data extraction approach can be compared to classical deep learning (DL) applications, with the difference being that the retrieved features are not the outputs of a black box algorithm but engineered by a transparent automated process. DL-based approaches usually outperform classical ML methods but require large amounts of training data, often inaccessible in DUAs, which is not the case in this application [43]. Nonetheless, the increased generalization potential of DL architectures through advances in the area of domain adaptation encourages their exploration in future applications in DUAs, particularly with the steady increase in the availability of training data sources.
With respect to the comparative experiments, all approaches produced satisfactory predictions. Nonetheless, it was surprising that the best model was the one using only the four RGBNIR bands of the WV-3 sensor. This can be explained under the scenario that the most discriminant information for the DUA LC classification is contained in the RGBNIR bands. As such, adding more bands can produce noise and redundancy. Moreover, the FS approaches, being heuristic algorithms, likely perform better to find an optimal solution the smaller the feature space is. Navigating a space of roughly 4000 features rather than 10,000 to find an optimal solution can further explain this outcome. Nonetheless, given that classes such as waste piles are crucial for adequately characterizing DUAs, adding SWIR information or all eight WV-3 multispectral bands can be of benefit compared to the RGBNIR-based model. The varying spectral signature of waste piles (i.e., due to their complex mixture of materials, such as various types of colored plastics) can be a likely explanation for this effect [31]. With respect to the merits of using SWIR information, the large mismatch in spatial resolution (0.3 m for the MS bands and 3.7 m for the SWIR ones) diminished its full potential contribution. However, the SWIR data appeared to be partially useful for some specific classes that are expressed as large objects—large trees, water, and, as mentioned previously, waste piles. It is therefore implied that SWIR data at a finer resolution, or fusion techniques that may account for such large differences in the spatial resolution, might further improve the results. Another relevant and salient outcome is that scalability is possible as (i) only a few bands are needed for satisfactory results, which can be realized by openly available sources of VHR imagery such as Google Earth imagery, and (ii) a few well-picked features are sufficient, exponentially decreasing the computational burden of a large-scale application.

4.2. On the Potential of Transferability, Interpretability, and Scalability

Our efforts to categorize intra-DUA variability based on their LC fractions highlighted the existence of different morphological profiles. The differences were mainly related to the built-up density, absence or presence of vegetation, vehicles, and waste piles. Consequently, they provide a first step to better understand the internal structure of deprived areas and provide meaningful indicators in support of pro-poor policies and evidence-based policy making towards sustainable cities. For instance, the extracted morphological clusters can be linked with urban health issues such as waste disposal. As the Nairobi River enters the city from the west and branches into several rivers, all of them are polluted with waste. Most of the waste from these deprived areas is discharged directly into surface waters, as can be seen in Figure 15. Additionally, when it rains, the surface water often transports the waste into the water bodies or adjacent areas, causing deteriorating health conditions through events such as bacterial infection outbreaks [36]. This pollution causes health problems, not only in the deprived settlements but also in the rest of the city, leading to the large-scale pollution of local rivers [44]. These areas are accurately reflected in the morphological clusters and can be spatially mapped with unprecedented precision.
Nonetheless, the results are subject to the sensitivities or degree of sophistication of the clustering algorithm. It is advised that a combination of expert knowledge encompasses the data-driven results from the clustering procedure, with respect to issues such as the number of clusters. Moreover, alternative approaches to computing deprivation levels should be explored through supervised classification, provided that the availability of in situ information is sufficient. At the same time, although there was intrinsic variation in terms of LC typology within each DUA, there were also significant differences across them. It is important to understand these typological differences to develop local context-based policies, i.e., upgrading programs related to each settlement. As reflected by their typological profiles, each settlement responds to different social processes, and knowing that each DUA has an intrinsic history behind it this is not an unexpected outcome [45,46]. Finally, this research paves the way for assessing the temporal evolution of deprived areas.

4.3. Future Prospects

Future work should tackle several issues, both from a technical and applied perspective. To start with, efforts to replicate this framework with more easily accessible RS data, such as Sentinel 1 and 2 or Google Earth imagery, should be attempted [47]. A positive outcome of the replication, even with less thematic details can enhance the scalability of this work to national or continental levels, producing crucial interpretable indicators that can readily be integrated in global slum mapping efforts. Additionally, efforts to transfer the proposed framework to other cities should be investigated. Moreover, in order to improve the typology more information should be taken into consideration, such as landscape metrics (capturing the spatial arrangement of the LC) along with land-use information. Finally, a comparative analysis in terms of predictive algorithms should be investigated in further by including more machine and deep learning approaches.

5. Conclusions

Our work has provided a novel framework with which to characterize deprived urban areas (DUAs) through Earth observation (EO) datasets. We tailored a GEOBIA processing chain to our requirements for mapping the specificities of the land cover in DUAs. Additionally, we considered factors such as model complexity and the computational burden; we endeavored to favor the potential of the transferability of the whole process. Using an extended set of WorldView-3 data (panchromatic, eight multispectral, and eight shortwave infrared bands), we found that the visible and near-infrared bands are sufficient (i.e., overall accuracy of 88.07%) to produce high-quality land-cover maps while maximizing effectiveness and reducing the financial cost of acquiring more extensive spectral information. Furthermore, we proposed a way to transform land-cover maps into gridded spatial units that reflect deprivation profiles. We discussed and identified novel insights into the variations in the physical morphology between and within deprived areas. Notably, the morphological clusters show variations between DUAs in terms of density, environmental, and infrastructure characteristics. Such information could be used to understand geographic patterns of differences, identify hotspots for interventions (e.g., health interventions), and monitor changes across space as well as (if using multitemporal imagery) time. Our results help to pave the road for more integrative EO-based research towards evidence-based policy making in support of the most vulnerable urban populations.

Author Contributions

S.G. and A.A. are the main authors of the study; they wrote the manuscript, processed the data, and analyzed the results. M.K., J.W., M.O., E.W. and S.V. helped conceptualize the study and reviewed as well as edited the manuscript. All authors have read and agreed to the published version of the manuscript.

Funding

The research pertaining to these results received financial aid from the Belgian Federal Science Policy (BELSPO) according to the agreement of subsidy no. (SR/11/380) (SLUMAP: http://slumap.ulb.be/, accessed on 2 December 2021).

Data Availability Statement

The code and resultant maps are publicly available in the Zenodo scientific repository https://zenodo.org/record/5205477#.YYjiK2DMKUk, accessed on 2 December 2021.

Conflicts of Interest

The authors declare no conflict of interest.

Appendix A

Table A1. Textures computed on the multispectral and shortwave infrared bands of the WorldView-3 imagery.
Texture
Angular second moment
Contrast
Correlation
Variance
Inverse difference moment
Sum average
Sum variance
Sum entropy
Entropy
Difference variance
Difference entropy
Information measures of correlation
Table A2. Extracted descriptive statistics at the object level in all the input bands for the land-cover classification.
Statistic
Minimum
Maximum
Range
Mean
Median
Standard deviation
Coefficient of variation
First quartile
Third quartile
90% percentile
Table A3. VSURF-retained features for each dataset.
RGBRGBNIRMS-8All
Blue band texture kernel 9 × 9 entropy 90th percentile neighboring standard deviationNDVI first quartileNDVI first quartileNDVI first quartile
Blue band texture kernel 9 × 9 sum entropy third quartile neighboring standard deviationNDVI medianNDVI 90th percentileNDVI mean
Green band first quartileNDVI texture kernel 3 × 3 difference entropy 90th percentileNDVI texture kernel 19 × 19 information measure of correlation rangeNDVI texture kernel 19 × 19 entropy maximum
Green band medianNDVI texture kernel 3 × 3 difference entropy third quartileNDVI texture kernel 3 × 3 difference entropy 90th percentileNDVI texture kernel 3 × 3 difference entropy 90th percentile
Blue band first quartileNDVI texture kernel 3 × 3 sum average meanNDVI third quartileNDVI third quartile
Red band first quartileNDVI texture kernel 9 × 9 correlation 90th percentileYellow band texture kernel 9 × 9 correlation maximum neighboring standard deviationCoastal band texture kernel 19 × 19 contrast third
Blue band meanNIR band texture kernel 19 × 19 sum variance max neighboring meanRed band texture kernel 3 × 3 correlation 90th percentile neighboring meanCoastal band texture kernel 3 × 3 difference entropy median
Green band third quartileBlue band first quartileRed edge band texture kernel 9 × 9 information measure of correlation minimum neighboring meanCoastal band texture kernel 3 × 3 difference entropy standard deviation
Red band medianGreen band first quartileNIR band texture 19 × 19 sum variance maximum neighboring standard deviationRed band texture kernel 3 × 3 correlation 90th percentile neighboring mean
Blue band 90th percentileBlue band medianNIR band texture 9 × 9 difference entropy maximum neighboring meanRed band texture kernel 3 × 3 difference entropy first quartile
Red band texture kernel 3 × 3 variance 90th percentileBlue band third quartileCoastal band first quartileRed edge band texture kernel 19 × 19 contrast mean
Red band texture kernel 3 × 3 difference entropy meanRed band coefficient of variationCoastal band meanNIR band texture kernel 19 × 19 difference variance third quartile
Green band texture kernel 3 × 3 variance 90th percentileNIR band first quartileBlue band first quartileNIR band texture kernel 19 × 19 sum variance maximum neighboring mean
Blue band texture kernel 3 × 3 correlation third quartile neighboring meanNIR band medianGreen band medianNIR band texture kernel 3 × 3 sum average minimum
Blue band texture kernel 9 × 9 information measure of correlation 90th percentileNIR band third quartileRed band first quartileNIR second band texture kernel 3 × 3 difference entropy first quartile
Green band texture kernel 3 × 3 sum average first quartileBlue band texture kernel 19 × 19 variance medianRed edge band first quartileCoastal band first quartile
Green band texture kernel 3 × 3 difference entropy medianBlue band texture kernel 9 × 9 variance medianRed edge band medianBlue band first quartile
Green band texture kernel 3 × 3 sum average coefficient of variationGreen band texture kernel 19 × 19 variance medianNIR band first quartileGreen band median
Red band texture kernel 3 × 3 contrast 90th percentileGreen band texture kernel 9 × 9 information measure of correlation third quartileNIR 2nd band first quartileRed band coefficient of variation
Red band texture kernel 9 × 9 variance third quartileRed band texture kernel 19 × 19 correlation maximumBlue texture kernel 3 × 3 difference entropy medianRed edge band first quartile
Blue band texture kernel 9 × 9 angular second moment coefficient of variationRed band texture kernel 3 × 3 difference entropy first quartileBlue band texture kernel 9 × 9 information measure of correlation third quartileRed edge band mean
Red band texture kernel 9 × 9 contrast meanRed edge band texture kernel 19 × 19 contrast meanRed edge band median
Red band texture kernel 9 × 9 correlation first quartileNIR band texture 19 × 19 difference variance third quartileNIR band first quartile
Red band texture kernel 9 × 9 variance first quartileNIR band texture kernel 3 × 3 sum average minimumNIR second band first quartile
NIR band texture 3 × 3 sum average minimumNIR second band texture kernel 3 × 3 difference entropy first quartileNIR second band mean
NDVI texture kernel 19 × 19 angular second moment minimumNIR second band texture kernel 3 × 3 variance medianSWIR first band texture kernel 3 × 3 angular second moment standard deviation neighboring standard deviation
SWIR fifth band first quartile
SWIR seventh band first quartile
Table A4. Confusion matrix using validation data and features from all sensors and bands (All dataset).
ClassBuildingBare, Asphalted GroundLow VegetationTreeShadowVehicleWaterWaste Pile
Building78,567882010608772650498
Bare, asphalted ground709257,24111546036921880524
Low vegetation15471234,9551533099025
Tree220221225,44719710038
Shadow381890038218,1908410
Vehicle3320000417019
Water01480031703470
Waste piles106881863332661052
Table A5. Confusion matrix using validation data and features from the 8 WV-3 multispectral bands (MS-8 dataset).
ClassBuildingBare, Asphalted GroundLow VegetationTreeShadowVehicleWaterWaste Pile
Building78,4349321106074831914362
Bare, asphalted ground753456,94410905687081990451
Low vegetation7674735,016161400025
Tree22132236425,95811760038
Shadow498861047818,0068410
Vehicle2360000513019
Water191380030603490
Waste piles20845818033266643
Table A6. Confusion matrix using validation data and features from the RGB and NIR bands (RGBNIR dataset).
ClassBuildingBare, Asphalted GroundLow VegetationTreeShadowVehicleWaterWaste Pile
Building79,145856010719332570130
Bare, asphalted ground689957,2641122389766219211624
Low vegetation12494234,7601491066095
Tree00211927,2852480038
Shadow3745190154117,38610800
Vehicle2070000495066
Water91470029603600
Waste piles19535817033266757
Table A7. Confusion matrix using validation data and features from the RGB WV-3 bands (RGB dataset).
ClassBuildingBare, Asphalted GroundLow VegetationTreeShadowVehicleWaterWaste Pile
Building80,0536805573187135497865
Bare, asphalted ground15,10050,4183707562713000279
Low vegetation3916603925,93512848000224
Tree5331379122323,576293422122
Shadow1056718028917,75311200
Vehicle255000051300
Water1713821424430700
Waste piles7001590266300471
Figure A1. LC maps in Kibera, Kianda community. (a) WorldView-3 false-color composite. LC predictions using (b) all available data sources (WV-3 8 MS bands and 8 SWIR bands), (c) WV-3 8 multispectral bands, (d) WV-3 RGBNIR bands, and (e) WV-3 RGB bands.
Remotesensing 13 04986 g0a1
Figure A2. LC maps in the Gigachi community. (a) WorldView-3 false-color composite. LC predictions using (b) all available data sources (WV-3 8 MS bands and 8 SWIR bands), (c) WV-3 8 multispectral bands, (d) WV-3 RGBNIR bands, and (e) WV-3 RGB bands.
Remotesensing 13 04986 g0a2
Figure A3. LC maps in the Kabagarei community. (a) WorldView-3 false-color composite. LC predictions using (b) all available data sources (WV-3 8 MS bands and 8 SWIR bands), (c) WV-3 8 multispectral bands, (d) WV-3 RGBNIR bands, and (e) WV-3 RGB bands.
Remotesensing 13 04986 g0a3
Figure A4. LC maps in the Aasain community. (a) WorldView-3 false-color composite. LC predictions using (b) all available data sources (WV-3 8 MS bands and 8 SWIR bands), (c) WV-3 8 multispectral bands, (d) WV-3 RGBNIR bands, and (e) WV-3 RGB bands.
Remotesensing 13 04986 g0a4
Figure A5. LC maps in the Vumila community. (a) WorldView-3 false-color composite. LC predictions using (b) all available data sources (WV-3 8 MS bands and 8 SWIR bands), (c) WV-3 8 multispectral bands, (d) WV-3 RGBNIR bands, and (e) WV-3 RGB bands.
Remotesensing 13 04986 g0a5
Figure A6. LC maps in the Kwareuben community. (a) WorldView-3 false-color composite. LC predictions using (b) all available data sources (WV-3 8 MS bands and 8 SWIR bands), (c) WV-3 8 multispectral bands, (d) WV-3 RGBNIR bands, and (e) WV-3 RGB bands.
Remotesensing 13 04986 g0a6

References

  1. United Nations Department of Economic and Social Affairs Sustainable Development Goals. Available online: https://unstats.un.org/sdgs/report/2021/ (accessed on 2 December 2021).
  2. Georganos, S. The Use of Very-High-Resolution Earth Observation Satellite Data for Multi-Thematic Urban Mapping in Sub-Saharan Africa: Applications in Population, Household Wealth and Epidemiological Modeling. Ph.D. Thesis, Universite Libre de Bruxelles (ULB), Brussels, Belgium, 2021. [Google Scholar]
  3. Kuffer, M.; Pfeffer, K.; Sliuzas, R. Slums from Space—15 Years of Slum Mapping Using Remote Sensing. Remote Sens. 2016, 8, 455. [Google Scholar] [CrossRef] [Green Version]
  4. Aliu, I.R.; Akoteyon, I.S.; Soladoye, O. Living on the margins: Socio-spatial characterization of residential and water deprivations in Lagos informal settlements, Nigeria. Habitat Int. 2021, 107, 102293. [Google Scholar] [CrossRef]
  5. Muoki, M.A.; Tumuti, D.S.; Rombo, D. Nutrition and public hygiene among children under five years of age in Mukuru slums of Makadara Division, Nairobi. East Afr. Med. J. 2008, 85, 386–397. [Google Scholar] [CrossRef] [Green Version]
  6. Haddout, S.; Priya, K.L.; Hoguane, A.M.; Ljubenkov, I. Water scarcity: A big challenge to slums in Africa to fight against COVID-19. Sci. Technol. Libr. 2020, 39, 281–288. [Google Scholar] [CrossRef]
  7. Mollah, S.; Islam, Z. Dhaka Slums: Where Covid is Curiously Quiet. The Daily Star, 26 July 2020. [Google Scholar]
  8. Brotherhood, L.; Cavalcanti, T.; Da Mata, D.; Santos, C. Slums and Pandemics; CEPR Discussion Paper No. DP15131; CEPR: London, UK, 2020. [Google Scholar]
  9. Brito, P.L.; Kuffer, M.; Koeva, M.; Pedrassoli, J.C.; Wang, J.; Costa, F.; De Freitas, A.D. The Spatial Dimension of COVID-19: The Potential of Earth Observation Data in Support of Slum Communities with Evidence from Brazil. ISPRS Int. J. Geo-Inf. 2020, 9, 557. [Google Scholar] [CrossRef]
  10. Auerbach, A.M.; Thachil, T. How does Covid-19 affect urban slums? Evidence from settlement leaders in India. World Dev. 2021, 140, 105304. [Google Scholar] [CrossRef]
  11. Kuffer, M.; Persello, C.; Pfeffer, K.; Sliuzas, R.; Rao, V. Do we underestimate the global slum population? In Proceedings of the 2019 Joint Urban Remote Sensing Event (JURSE), Piscataway, NJ, USA, 22–24 May 2019; pp. 1–4. [Google Scholar]
  12. Habitat, U. Urbanization and development: Emerging futures. World Cities Rep. 2016, 3, 4–51. [Google Scholar]
  13. Grippa, T.; Linard, C.; Lennert, M.; Georganos, S.; Mboga, N.; Vanhuysse, S.; Gadiaga, A.; Wolff, E. Improving urban population distribution models with very-high resolution satellite information. Data 2019, 4, 13. [Google Scholar] [CrossRef] [Green Version]
  14. Georganos, S.; Gadiaga, A.N.; Linard, C.; Grippa, T.; Vanhuysse, S.; Mboga, N.; Wolff, E.; Dujardin, S.; Lennert, M. Modelling the Wealth Index of Demographic and Health Surveys within Cities Using Very High-Resolution Remotely Sensed Information. Remote Sens. 2019, 11, 2543. [Google Scholar] [CrossRef] [Green Version]
  15. Georganos, S.; Brousse, O.; Dujardin, S.; Linard, C.; Casey, D.; Milliones, M.; Parmentier, B.; Van Lipzig, N.P.M.; Demuzere, M.; Grippa, T.; et al. Modelling and mapping the intra-urban spatial distribution of Plasmodium falciparum parasite rate using very-high-resolution satellite derived indicators. Int. J. Health Geogr. 2020, 19, 38. [Google Scholar] [CrossRef]
  16. Kuffer, M.; Thomson, D.R.; Boo, G.; Mahabir, R.; Grippa, T.; Vanhuysse, S.; Engstrom, R.; Ndugwa, R.; Makau, J.; Darin, E.; et al. The Role of Earth Observation in an Integrated Deprived Area Mapping “System” for Low-to-Middle Income Countries. Remote Sens. 2020, 12, 982. [Google Scholar] [CrossRef] [Green Version]
  17. Stark, T.; Wurm, M.; Zhu, X.X.; Taubenböck, H. Satellite-Based Mapping of Urban Poverty with Transfer-Learned Slum Morphologies. IEEE J. Sel. Top. Appl. Earth Obs. Remote Sens. 2020, 13, 5251–5263. [Google Scholar] [CrossRef]
  18. Friesen, J.; Friesen, V.; Dietrich, I.; Pelz, P.F. Slums, space, and state of health—A link between settlement morphology and health data. Int. J. Environ. Res. Public Health 2020, 17, 2022. [Google Scholar] [CrossRef] [PubMed] [Green Version]
  19. Georganos, S.; Vanhuysse, S.; Abascal, Á.; Kuffer, M. Extracting Urban Deprivation Indicators Using Superspectral Very-High-Resolution Satellite Imagery. In Proceedings of the 2021 IEEE International Geoscience and Remote Sensing Symposium IGARSS, Brussels, Belgium, 11–16 July 2021; pp. 2114–2117. [Google Scholar]
  20. Tapiador, F.J.; Avelar, S.; Tavares-corrêa, C.; Zah, R.; Tapiador, F.J.; Avelar, S.; Tavares-corrêa, C. Deriving fine-scale socioeconomic information of urban areas using very high-resolution satellite imagery. Int. J. Remote Sens. 2017, 1161, 6437–6456. [Google Scholar] [CrossRef]
  21. Avelar, S.; Zah, R.; Tavares-Corrêa, C. Linking socioeconomic classes and land cover data in Lima, Peru: Assessment through the application of remote sensing and GIS. Int. J. Appl. Earth Obs. Geoinf. 2009, 11, 27–37. [Google Scholar] [CrossRef]
  22. Duque, J.C.; Patino, J.E.; Ruiz, L.A.; Pardo-Pascual, J.E. Measuring intra-urban poverty using land cover and texture metrics derived from remote sensing data. Landsc. Urban Plan. 2015, 135, 11–21. [Google Scholar] [CrossRef]
  23. Hacker, K.P.; Seto, K.C.; Costa, F.; Corburn, J.; Reis, M.G.; Ko, A.I.; Diuk-Wasser, M.A. Urban slum structure: Integrating socioeconomic and land cover data to model slum evolution in Salvador, Brazil. Int. J. Health Geogr. 2013, 12, 45. [Google Scholar] [CrossRef] [PubMed] [Green Version]
  24. Georganos, S.; Grippa, T.; Vanhuysse, S.; Lennert, M.; Shimoni, M.; Kalogirou, S.; Wolff, E. Less is more: Optimizing classification performance through feature selection in a very-high-resolution remote sensing. GISci. Remote Sens. 2017, 55, 221–242. [Google Scholar] [CrossRef]
  25. United Nations Human Settlements Programme. State of the World’s Cities 2010/2011: Bridging the Urban Divide; Earthscan: London, UK, 2010. [Google Scholar]
  26. Amnesty International. The Unseen Majority: Nairobi’s Two Million Slum-Dwellers. Amnesty Int. 2009, 1–39. [Google Scholar]
  27. Kenya National Bureau of Statistics. The 2019 Kenya Population and Housing Census: Population by County and Sub-County; Kenya National Bureau of Statistics: Nairobi, Kenya, 2019.
  28. Abascal, Á.; Rothwell, N.; Shonowo, A.; Thomson, D.R.; Elias, P.; Elsey, H.; Yeboah, G.; Kuffer, M. “Domains of Deprivation Framework” for Mapping Slums, Informal Settlements, and Other Deprived Areas in LMICs to Improve Urban Planning and Policy: A Scoping Review. Preprints 2021. [Google Scholar]
  29. Asadzadeh, S.; De Souza Filho, C.R. Investigating the capability of WorldView-3 superspectral data for direct hydrocarbon detection. Remote Sens. Environ. 2016, 173, 162–173. [Google Scholar] [CrossRef]
  30. Herrmann, I.; Bdolach, E.; Montekyo, Y.; Rachmilevitch, S.; Townsend, P.A.; Karnieli, A. Assessment of maize yield and phenology by drone-mounted superspectral camera. Precis. Agric. 2020, 21, 51–76. [Google Scholar] [CrossRef]
  31. Guo, X.; Li, P. Mapping plastic materials in an urban area: Development of the normalized difference plastic index using WorldView-3 superspectral data. ISPRS J. Photogramm. Remote Sens. 2020, 169, 214–226. [Google Scholar] [CrossRef]
  32. GRASS Development Team Geographic Resources Analysis Support System (GRASS GIS) Software, Version 7.2 2017. Available online: http://wgbis.ces.iisc.ernet.in/grass/download/index.html (accessed on 2 December 2021).
  33. Grippa, T.; Lennert, M.; Beaumont, B.; Vanhuysse, S.; Stephenne, N.; Wolff, E. An Open-Source Semi-Automated Processing Chain for Urban Object-Based Classification. Remote Sens. 2017, 9, 358. [Google Scholar] [CrossRef] [Green Version]
  34. Kluyver, T.; Ragan-Kelley, B.; Pérez, F.; Granger, B.; Bussonnier, M.; Frederic, J.; Kelley, K.; Hamrick, J.; Grout, J.; Corlay, S.; et al. Jupyter Notebooks—A publishing format for reproducible computational workflows. In Proceedings of the 20th International Conference on Electronic Publishing, Göttingen, Germany, 7–9 June 2016; pp. 87–90. [Google Scholar]
  35. Kuffer, M.; Wang, J.; Thomson, D.R.; Georganos, S.; Abascal, A.; Owusu, M.; Vanhuysse, S. Spatial Information Gaps on Deprived Urban Areas (Slums) in Low-and-Middle-Income-Countries: A User-Centered Approach. Urban Sci. 2021, 5, 72. [Google Scholar] [CrossRef]
  36. Grippa, T.; Georganos, S.; Vanhuysse, S.G.; Lennert, M.; Wolff, E. A local segmentation parameter optimization approach for mapping heterogeneous urban environments using VHR imagery. Remote Sens. Technol. Appl. Urban Environ. II 2017, 20, 104310G. [Google Scholar] [CrossRef]
  37. Momsen, E.; Metz, M. Grass Development Team Module i.segment. In Geographic Resources Analysis Support System (GRASS) Software; Version 7.0; GRASS Development Team: Bonn, Germany, 2015. [Google Scholar]
  38. Johnson, B.; Bragais, M.; Endo, I.; Magcale-Macandog, D.; Macandog, P. Image Segmentation Parameter Optimization Considering Within- and Between-Segment Heterogeneity at Multiple Scale Levels: Test Case for Mapping Residential Areas Using Landsat Imagery. ISPRS Int. J. Geo-Inf. 2015, 4, 2292–2305. [Google Scholar] [CrossRef] [Green Version]
  39. Thomson, D.R.; Kuffer, M.; Boo, G.; Hati, B.; Grippa, T.; Elsey, H.; Linard, C.; Mahabir, R.; Kyobutungi, C.; Maviti, J.; et al. Need for an Integrated Deprived Area “Slum” Mapping System (IDEAMAPS) in Low-and Middle-Income Countries (LMICs). Soc. Sci. 2020, 9, 80. [Google Scholar] [CrossRef]
  40. Genuer, R.; Poggi, J.-M.; Tuleau-Malot, C. VSURF: An R Package for Variable Selection Using Random Forests. R J. 2015, 7, 19–33. [Google Scholar] [CrossRef] [Green Version]
  41. Breiman, L. Random forests. Mach. Learn. 2001, 45, 5–32. [Google Scholar] [CrossRef] [Green Version]
  42. Kuhn, M.; Wing, J.; Weston, S.; Williams, A.; Keefer, C.; Engelhardt, A.; Cooper, T.; Mayer, Z.; Kenkel, B.; Team, R.C.; et al. Caret: Classification and Regression Training; R Package Version 6.0-21; CRAN: Wien, Austria, 2014. [Google Scholar]
  43. Jozdani, S.E.; Johnson, B.A.; Chen, D. Comparing deep neural networks, ensemble classifiers, and support vector machine algorithms for object-based urban land use/land cover classification. Remote Sens. 2019, 11, 1713. [Google Scholar] [CrossRef] [Green Version]
  44. Wang, H.; Wang, T.; Zhang, B.; Li, F.; Toure, B.; Omosa, I.B.; Chiramba, T.; Abdel-Monem, M.; Pradhan, M. Water and wastewater treatment in Africa--current practices and challenges. CLEAN–Soil Air Water 2014, 42, 1029–1035. [Google Scholar] [CrossRef]
  45. Taubenbock, H.; Wurm, M.; Setiadi, N.; Gebert, N.; Roth, A.; Strunz, G.; Birkmann, J.; Dech, S. Integrating remote sensing and social science. 2009 Jt. Urban Remote Sens. Event 2009, 1–7. [Google Scholar] [CrossRef]
  46. Ezeh, A.; Oyebode, O.; Satterthwaite, D.; Chen, Y.; Ndugwa, R.; Sartori, J.; Mberu, B.; Haregu, T.; Watson, S.I.; Caiaff, W.; et al. The history, geography, and sociology of slums and the health problems of people who live in slums. Lancet 2017, 389, 547–558. [Google Scholar] [CrossRef]
  47. Duque, J.C.; Patino, J.E.; Betancourt, A. Exploring the potential of machine learning for automatic slum identification from VHR imagery. Remote Sens. 2017, 9, 895. [Google Scholar] [CrossRef] [Green Version]
Figure 1. Workflow of the proposed framework.
Remotesensing 13 04986 g001
Figure 2. (a) Study area in Nairobi City County, Kenya. We studied the DUAs that were covered by the complete set of WorldView-3 multispectral and SWIR bands. (b) Location map of Nairobi within national and international borders.
Remotesensing 13 04986 g002
Figure 3. Mathare DUA in Nairobi, delineated into 13 neighborhoods, where training data for the LC models were sampled and assembled.
Remotesensing 13 04986 g003
Figure 4. Subset of the segmentation results. (a) False-color composite of the WV-3 satellite and (b) optimized segmentation layer for the same area (segments are displayed in random colors).
Remotesensing 13 04986 g004
Figure 5. Snippet of the LC models predictions in an area in Mathare, Nairobi. (a) WV-3 false-color composite. LC predictions using (b) all available bands (WV-3 8 MS bands and 8 SWIR bands), (c) WV-3 8 multispectral bands, (d) WV-3 RGBNIR bands, and (e) WV-3 RGB bands.
Remotesensing 13 04986 g005
Figure 6. LC maps in the Uboja community, which contains a remarkable amount of waste piles. (a) WV-3 false-color composite. LC predictions using (b) all available bands (WV-3 8 MS bands and 8 SWIR bands), (c) WV-3 8 multispectral bands, (d) WV-3 RGBNIR bands, and (e) WV-3 RGB bands.
Remotesensing 13 04986 g006
Figure 7. LC maps in the Embakasi community. (a) WorldView-3 false-color composite. LC predictions using (b) all available bands (WV-3 8 MS bands and 8 SWIR bands), (c) WV-3 8 multispectral bands, (d) WV-3 RGBNIR bands, and (e) WV-3 RGB bands.
Remotesensing 13 04986 g007
Figure 8. Simulation of (a) storage and (b) computational burden as a function of the computed features, highlighting the positive merits of feature selection in large-scale applications.
Remotesensing 13 04986 g008
Figure 9. Boxplots illustrating the relationship between each k-means cluster and LC fraction. The y-axes indicate the proportions of each class extracted at the grid level (50 m).
Remotesensing 13 04986 g009
Figure 10. Examples of the LC signature within each morphological cluster.
Remotesensing 13 04986 g010
Figure 11. Cluster description based on LC feature distribution.
Remotesensing 13 04986 g011
Figure 12. Distribution of the morphological clusters at the DUAs of Nairobi at a spatial resolution of 50 m. Diversity can be observed across and between DUAs. Source: Back image: Google Satellite, LC clusters: authors.
Remotesensing 13 04986 g012
Figure 13. Morphological cluster distribution in Mathare and Waruku.
Remotesensing 13 04986 g013
Figure 14. Morphological cluster distribution in Korogocho, Biafra and Imara.
Remotesensing 13 04986 g014
Figure 15. Street view images of waste piles in a river flowing through a Nairobi DUA.
Remotesensing 13 04986 g015
Table 1. WorldView-3 bands used and their wavelengths.
Multispectral BandsWavelength (nm)SWIR BandsWavelength (nm)
Coastal397–454SWIR-11184–1235
Blue445–517SWIR-21546–1598
Green507–586SWIR-31636–1686
Yellow580–629SWIR-41702–1759
Red626–696SWIR-52137–2191
Red edge698–749SWIR-62174–2232
Near-IR1765–899SWIR-72228–2292
Near-IR2857–1039SWIR-82285–2373
Panchromatic band450–800
Table 2. Training data used for the training of the LC models and corresponding deprivation domain captured [39].
ClassSamplesDeprivation Domain Captured
Building2839Unplanned morphology (e.g., density)
Ground surface842Unplanned morphology (open space)
Low vegetation (grass, bushes)186Environmental assets (green space)
Tall vegetation249Environmental assets (green space)
Shadow414Unplanned morphology (e.g., distance between buildings, height)
Vehicles270Road infrastructure (accessibility), economic activity
Water28Physical and health-related hazard (e.g., floods, water-borne diseases)
Waste piles149Health-related hazards (e.g., due to air, soil and water pollution, and vector-borne diseases)
Table 3. Number of computed features per different experiment.
SourceTotal Number of FeaturesFeatures Retained after VSURF Selection
RGB361321
RGBNIR601327
MS-8 1081326
All 14,17328
Table 4. Validation data for the various LC model predictions at the pixel level.
Class TotalDense Labeling (Pixels)Non-Dense Labeling (Segments)
Building89,13387,9011232
Ground surface67,49467,006488
Low vegetation 37,47837,184294
Tall vegetation29,69029,504186
Shadow19,92819,683245
Vehicle768607161
Inland water812653159
Waste piles15991388211
Table 5. Out-of-bag accuracy on the training data for every comparative experiment. FS stands for the reduced dataset post-feature selection.
SourceOverall Accuracy (%)Training Time (s)
All FS89.47.62
All89.999.00
MS-8 FS89.25.20
MS-889.580.04
RGBNIR FS89.26.57
RGBNIR89.558.60
RGB FS85.23.96
RGB86.149.88
Table 6. Overall accuracy of the LC maps and balanced accuracy of the various CL classes using data from all the investigated DUAs in Nairobi. Values in bold indicate the best performing model.
ClassALLMSRGBNIRRGB
Overall accuracy87.5787.4388.0780.51
Building92.0491.7292.3986.26
Bare soil89.2988.5589.3883.68
Low vegetation94.8694.7794.9494.37
Tree94.4394.5093.8793.36
Shadow90.8692.5593.7289.22
Vehicle69.6772.8971.5069.66
Water78.1672.9071.4170.68
Waste pile74.2975.7771.9662.42
Table 7. Cluster proportions in each DUA. Values in bold indicate the highest percentage of a cluster for each DUA.
SettlementTotal Area km2A% B%C%D%E%F%
Biafra1.27547.30.23.925.721.41.6
Embakasi0.94553.20.02.612.222.89.3
Imara4.02024.41.42.110.315.446.4
Kariobangi0.97020.90.34.113.150.511.1
Kiambu0.88516.45.913.620.121.522.6
Kibera2.67721.80.311.84.422.139.6
Korogocho1.44524.910.06.615.226.317.0
Mathare2.20522.12.411.98.527.427.7
Pumwani0.67222.73.75.69.720.138.3
Soweto2.38726.30.07.214.632.719.3
Waruku2.65216.80.026.74.734.617.2
Publisher’s Note: MDPI stays neutral with regard to jurisdictional claims in published maps and institutional affiliations.

