1. Introduction
Land use and land cover change (LUCC) is an area of study that examines the relationship between human economic activities and ecology and helps explain these interactions [
1,
2,
3]. LUCC is an important driving force that substantially affects the operation of Earth systems and has been widely applied to fields including ecosystem service assessment, desertification monitoring, and forest inventory [
4,
5,
6]. LUCC activity not only directly changes the surface landscape and terrestrial ecosystem but also affects the surface roughness, albedo, and biogeochemical cycle through these changes and thereby affects regional and even global-scale climate and environmental changes [
7,
8,
9]. With the successive implementation of the Land-Use and Land-Cover Change Science/Research Plan, Global Land Project (GLP) [
10], Future Earth [
11] and other major international scientific programs, the theory and technology of land change science has advanced significantly. In this research field, the land system is the research object of interest to systematically measure, model, and understand the coupled human–environmental system [
12]. The improvement and supplementation of long-term series LUCC data with high-resolution information is essential to promote the systematic and comprehensive study of LUCC processes and their effects [
13]. With the rapid development of remote sensing technology, the number of high-resolution, wide-coverage satellite images has increased exponentially, providing broad prospects for using intelligent recognition technology to generate spatiotemporal land use (LU) data [
14]. However, obtaining high-quality interannual images covering large areas is challenging, and some historical data and documents are no longer available. Therefore, it is particularly valuable to use natural geographic features and the related human activities to generate LUCC with a high resolution for a given year. The interannual reconstruction of LUCC is useful for understanding the LUCC processes (such as temporal and spatial characteristics and causes), the impact of LUCC on terrestrial ecosystem climate regulation services, the impact of LUCC on soil conservation services, and the impact of LUCC on food-supply services. LUCC modeling methods can also be used to predict LUCC in to the future and hence the future land use state. Thus, long-term LUCC scenarios could be forecasted by integrating historical land use data and future simulated data, which would offer scientific and practical value for the study of environmental and ecological changes [
15].
LUCC models facilitate interpreting the causes and consequences of land-use dynamics and support policy-makers in making informed and rational decisions [
16,
17]. Moreover, LUCC models have been found to be effective in predicting the future state and spatial distribution of land use by using the knowledge acquired from previous years [
18,
19]. The modeling method has proven most effective in LUCC reconstruction and simulation [
20]. The literature offers numerous LUCC model methods, each with its own advantages and drawbacks [
17]. Current LUCC models offer multiple methodological approaches [
21]. They can be static or dynamic, spatial or nonspatial, deductive or inductive, and agent based or pattern based [
17]. Generally, empirical statistical models use a variety of element statistical analyses. By analyzing the importance of each element to LUCC, it quantifies the mutual influence of LUCC and each driving factor and characterizes the statistical cause of LUCC. Empirical statistical models include linear regression models, logistic regression models, principal component analysis, gray relational analysis, canonical correlation analysis, and system dynamics methods. Spatial statistical models and nonlinear regression models are usually based on massive data of changes in the spatial distribution of LU, LUCC, and various factors. The stochastic model is mainly based on various conversion probability models of LUCC, such as the Markov chain model, land conversion model, and cellular automata (CA)–Markov model. The conceptual mechanism model can analyze the causality of LUCC. This approach uses theories and physical laws to simulate the behavioral mechanism of each driving force. Integrated models generally consider spatial and nonspatial features and, according to the research objectives, integrate different models to determine the most appropriate means to solve the problem, incorporating statistical calculations and the expertise of specialists in the field [
22,
23,
24]. The LUCC process is divided into relatively simple subprocesses. Each subprocess uses related models for modeling. Truly integrated models include a feedback land system related to other systems such as climate and hydrology [
25].
A review of the current state-of-the-art approaches to LUCC modeling noted a growing interest in spatial LUCC modeling. However, there are some deficiencies of the traditional models. On the one hand, the models do not implement the LUCC classification of multilevel categories (including Level I and Level II categories). The Level I level categories can only describe LUCC in general. In the multilevel classification model we studied, the Level II category is subdivided into 24 types according to the classification system provided by the Chinese Academy of Sciences (
Table A1 shows the LU classification and coding). For example, forestland is subdivided into four types—forestlands, spinneys, open woodland, and other forestland—in Level II. Only by considering all the subtypes can we accurately implement targeted policies for all types of forestlands to effectively manage and calculate carbon emissions. The previous model cannot guarantee that all types of LUs are accurately reconstructed. Therefore, data can only be assembled based on various thematic maps or manual interpretations of remote sensing images. On the other hand, the reconstruction accuracy, especially on a spatial scale of more than 10,000 square kilometers, does not meet research requirements [
26]. The accuracy of LUCC is the basis for studying the changes and mechanisms of LUCC and is a prerequisite for the scientific application of LUCC. The lack of an integrated model for accurate annual reconstruction and prediction makes it difficult to provide scientific data support for land planning and global environmental change research [
27]. In this context, exploring a novel modeling method to solve these problems is an urgent need.
Deep learning in neural networks has strong learning ability, the increase in data volume has an obvious effect in terms of improved accuracy, and the characteristics of cumbersome feature engineering are no longer needed. Various neural networks are changing how we interact with the world. Among them, the recurrent neural network (RNN) has the characteristics of a recursive mechanism, which can transmit historical information between time steps. Long short-term memory (LSTM) with long-term sequence images can effectively learn long-term time dependence and perform accurate land cover classification. The convolutional neural network (CNN) is another type of deep neural network that usually uses convolution filters to extract hidden features of local regions [
28,
29,
30]. This research uses natural geographic features and geographic features related to human activities, combines temporal and spatial relationship information and integrates them into CNNs, and establishes a CNN LUCC reconstruction and prediction model (CLRPM) to meet the growing demand for fine-scale LUCC reconstruction and prediction, thereby innovating to address existing research gaps [
31,
32,
33].
2. Materials and Methods
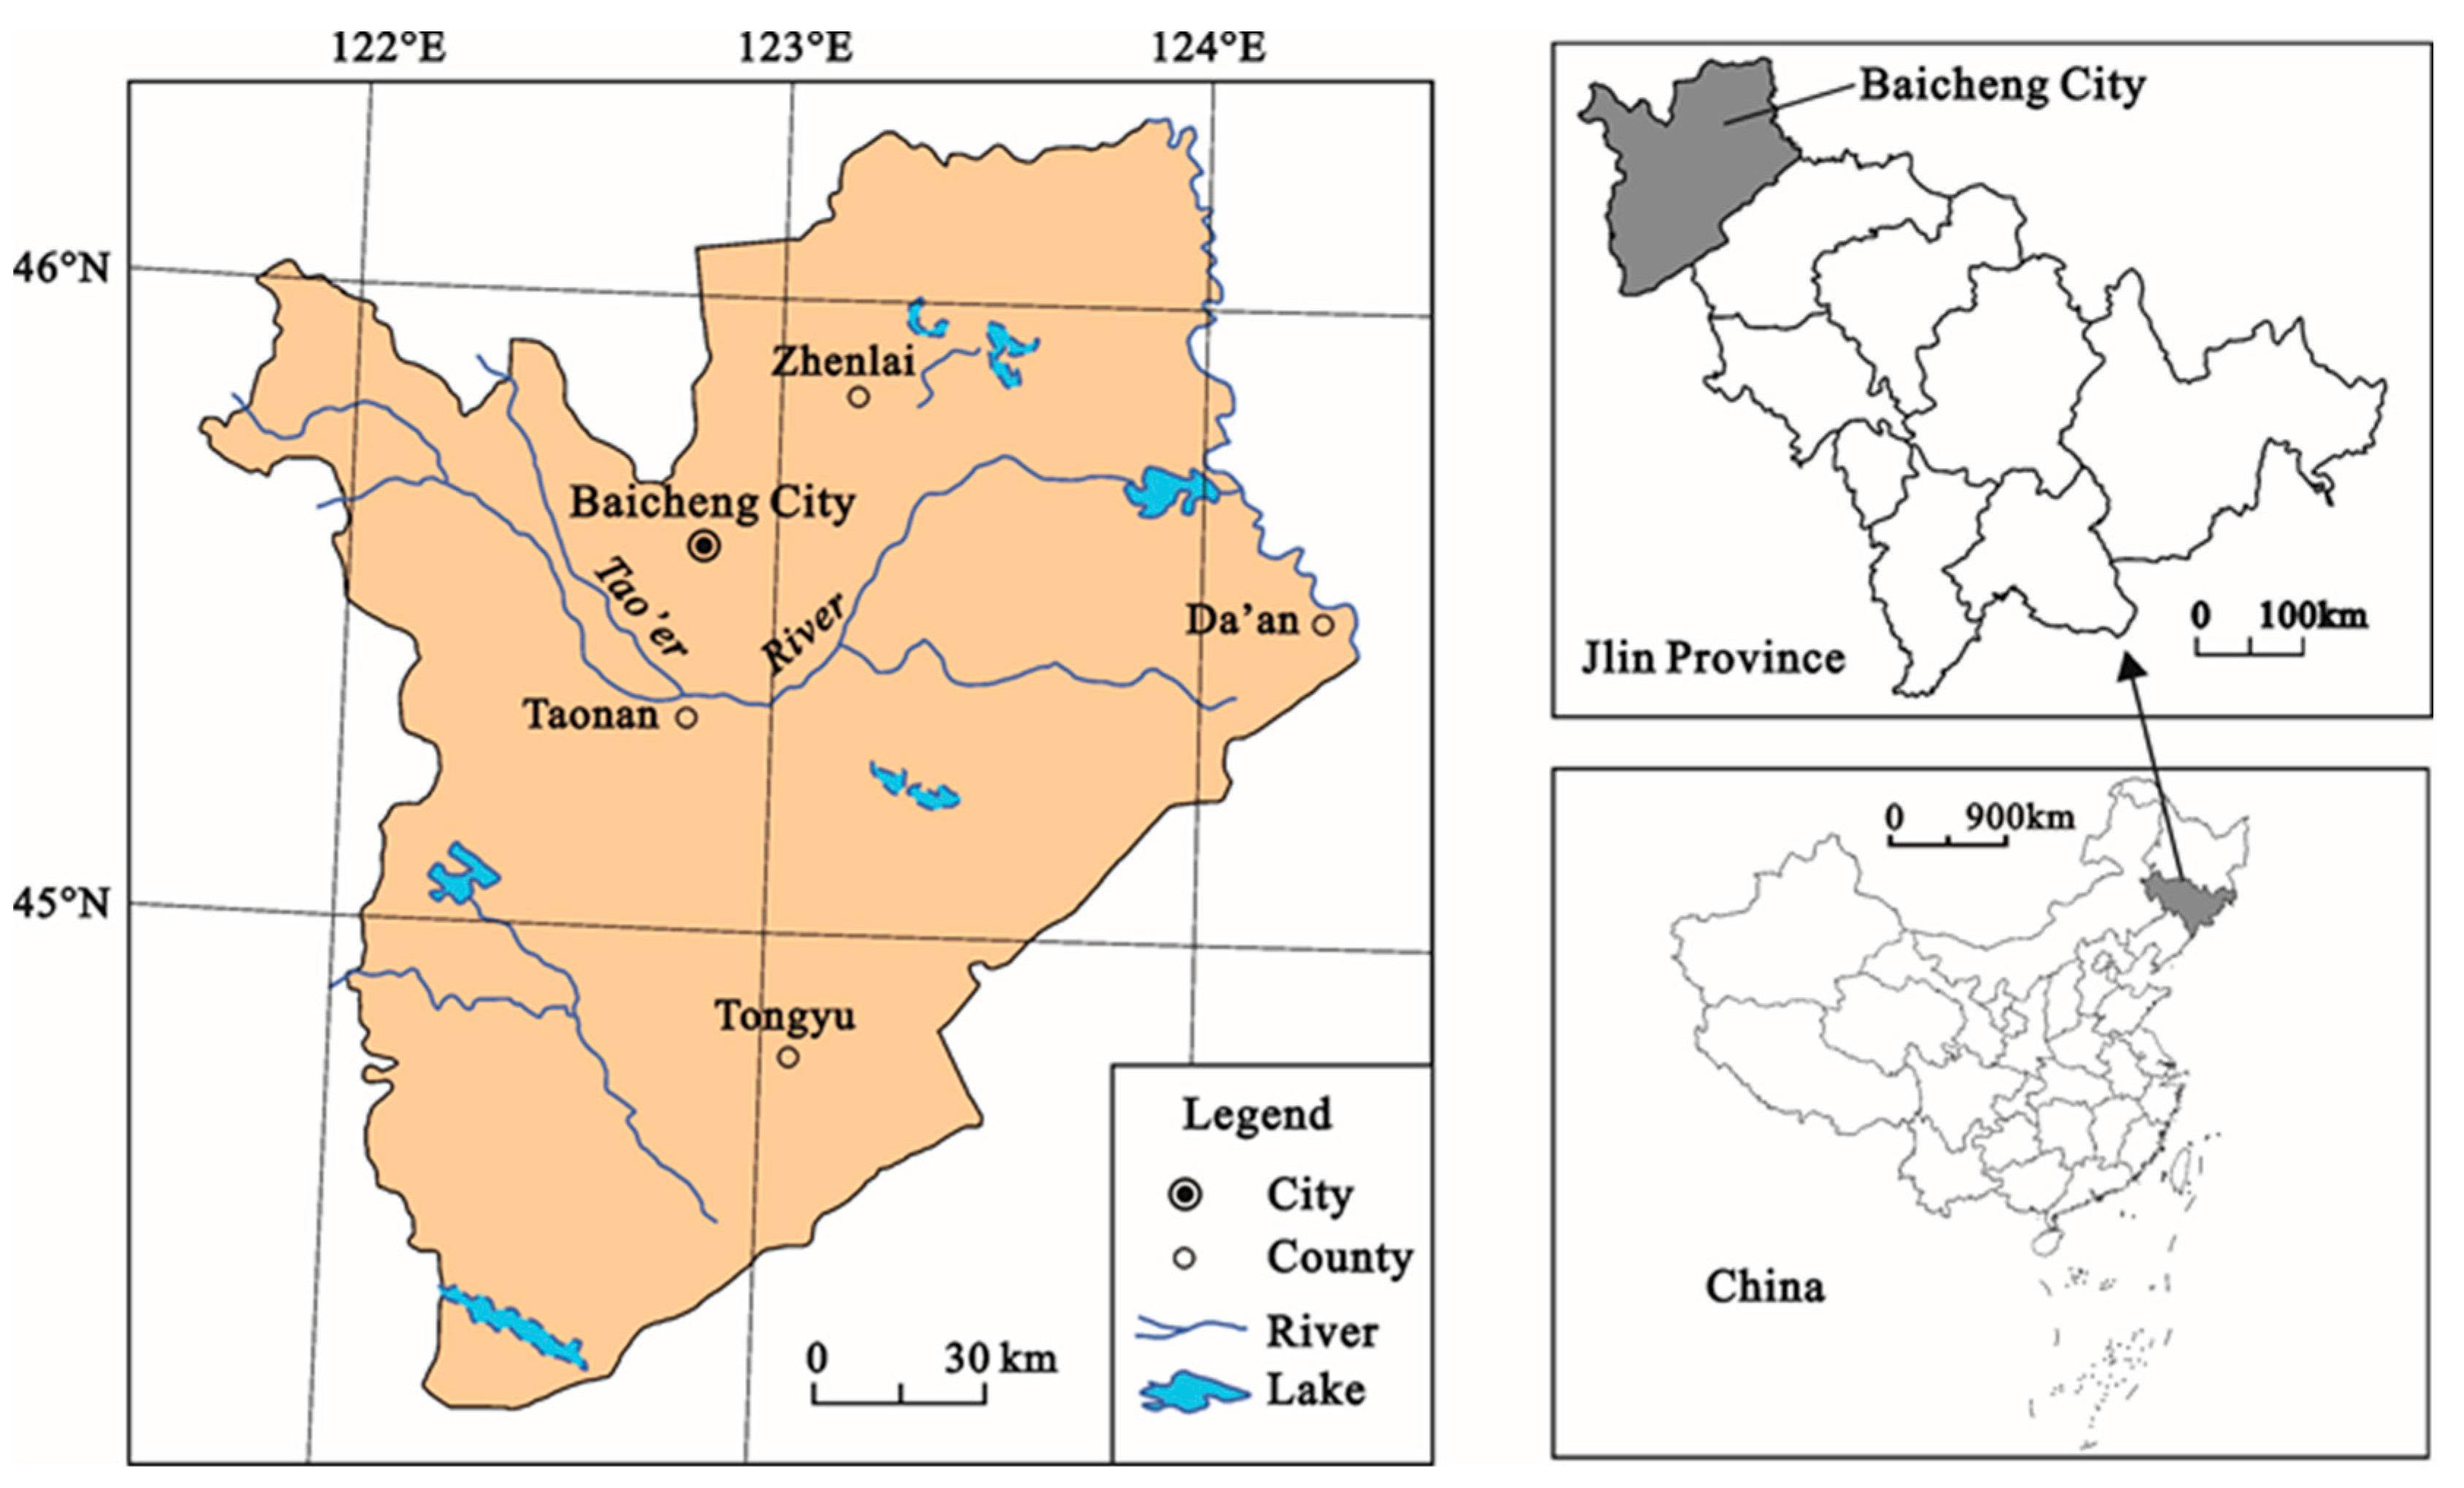
2.1. Study Area
The Baicheng area is located in northwestern Jilin Province, China (121°38′–124°22′E, 44°13′57″–46°18′N,
Figure 1). From northwest to southeast, the terrain shifts from low mountains to hills and then plains, with a slight rise in the southwest. Situated on and around the plain at the eastern foot of the Daxinganling Mountains, the Baicheng area is located at an altitude of 120–673 m. The study area experiences a temperate continental monsoon climate (with the climatic characteristics of sufficient sunlight, high precipitation variability, frequent drought but rare flooding, and overlapping rainy and hot seasons), an average annual precipitation of 399.9 mm, an average annual temperature of 5.2 °C, and an average ≥10 °C active accumulated temperature of 2996.2 °C, which are suitable conditions for the growth of mid- and late-maturing crop varieties. The per capita coverage of arable land, grassland, forestland, water surface, and reed areas is highest for Baicheng city within the Jilin Province. Baicheng City includes one district, two cities, and two counties under its jurisdiction, with a total area of 26,000 square kilometers. The population count has varied over the last few decades from 2,025,891 in 2000 to 2,032,356 in 2010 to 1,551,378 in 2020.
Baicheng is in a typical area where agriculture and animal husbandry interlace, with various landforms and a temperate, semiarid, and semi-humid monsoon climate. The distribution and changes in LU types fully reflect the combined effects of the natural environment and human activities.
2.2. Data and Processing
In this study, we used the China’s Land Use/Cover Dataset (CLUD), which was developed by the Chinese Academy of Sciences (CAS), with a mapping scale of 1:100,000 [
34] and 24 LU categories. The length of each time section was set to five years, i.e., 2000, 2005, 2010, 2015, and 2020. The remote sensing information was from the Landsat imagery database, and all the remote sensing images were downloaded from the U.S. Geological Survey (USGS) website (
www.usgs.gov, accessed on 12 December 2020).
The 90 m Shuttle Radar Topography Mission (SRTM) digital elevation model (DEM) data were adopted, and the aspect, slope, elevation, and other surface information were obtained using Surface Tool in ArcGIS Version 10.7.0.10450. The geomorphological data were from the Geomorphologic Atlas of the People’s Republic of China [
35]. The soil data were from the 1:500,000 soil type map for Jilin Province. The soil texture was determined based on the contents of sand, silt, and clay. The contents of the particles in these three size classes are expressed as percentages.
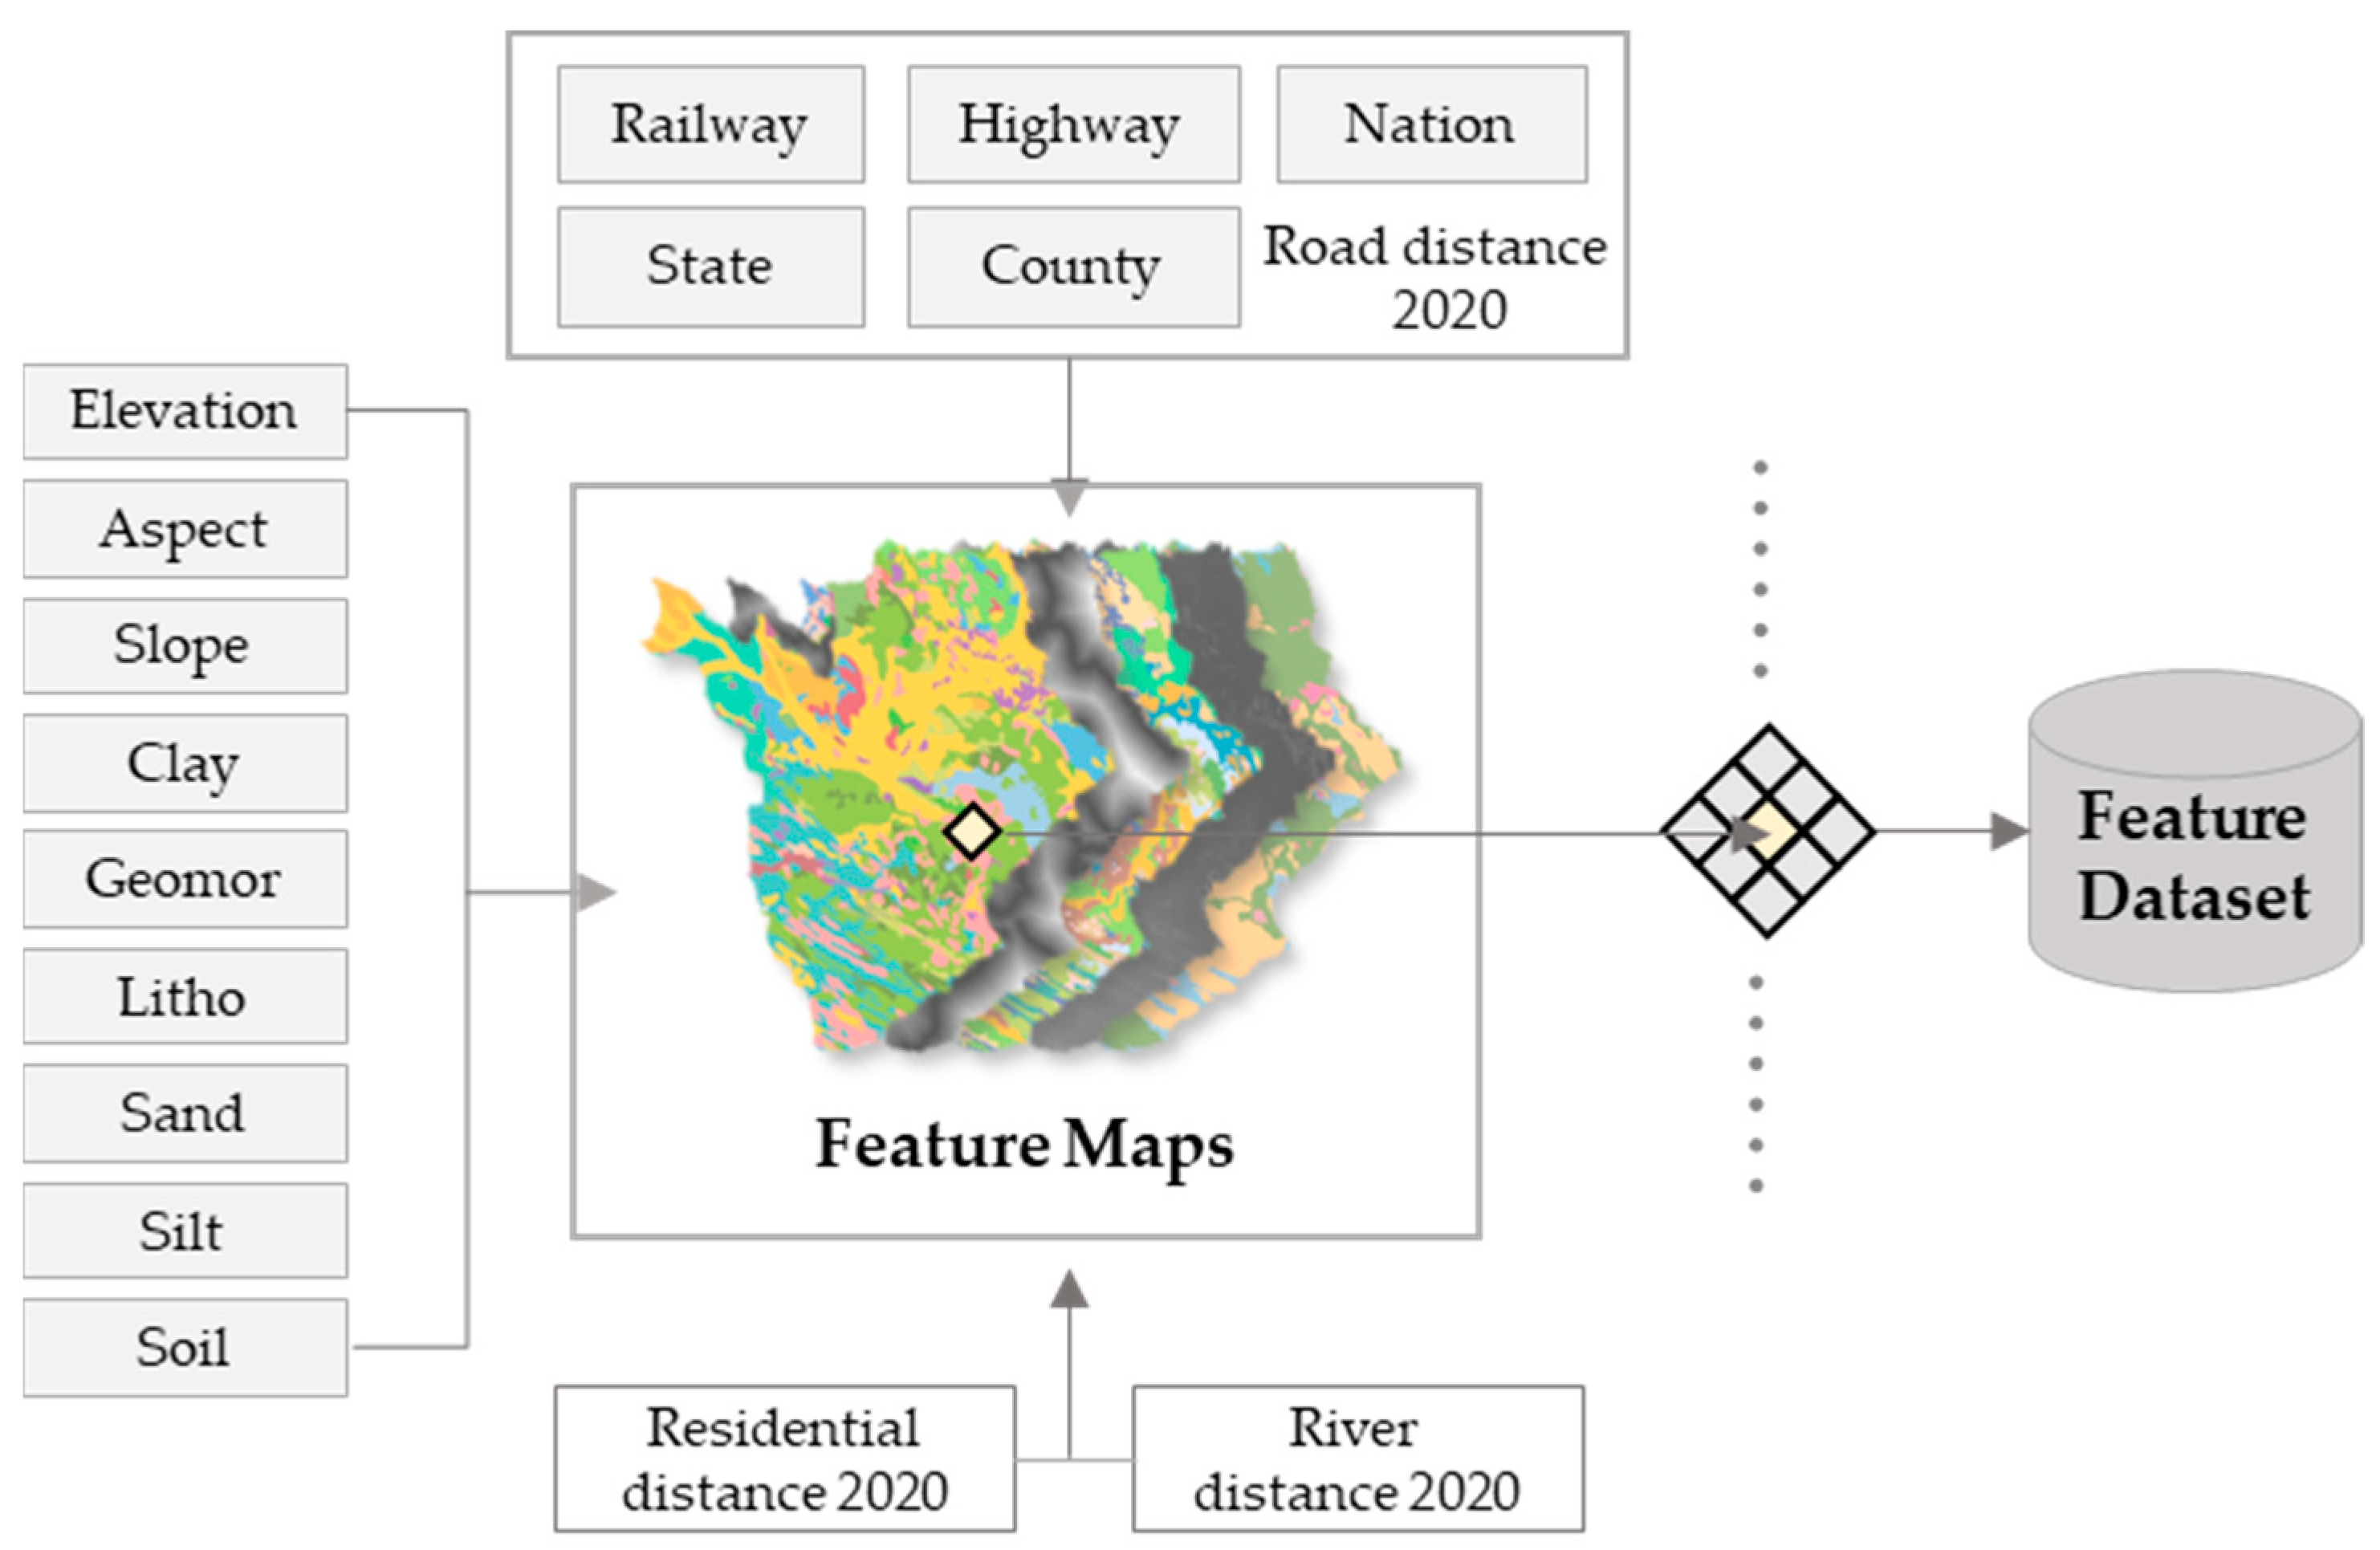
When constructing the dataset of factors affecting LU suitability, nine natural geographic features, i.e., aspect, clay, elevation, geomorphology, lithology, sand, silt, slope, and distance to river, were chosen. Considering the interaction between the LU system and human activities, using the LU type data for 5-year intervals (2000 to 2020), the distances to residential areas, national roads, provincial roads, county roads, village roads, highways, and railways were obtained using the Near tool in ArcGIS software.
To reconstruct and predict the LUCC for a specific year, spatial feature maps were generated for the 17 features described above (the geomorphological classification and coding are described in
Table A2; the soil classification and coding are presented in
Table A3, and the lithological classification and coding are described in
Table A4). This process was followed by temporal selection and configuration, resulting in a feature dataset. (In
Figure 2, the process for the year 2025 is illustrated as an example, and the feature dataset was formed based on the natural geographic features and geographic features related to human activities). The mapping relationship between the features in 2020 and the LUCC distribution in 2025 was simulated through the MLAs used for the LRPM.
2.3. Methods
The reconstruction and prediction of LUCC can be seen as the process of studying the entire grid.
Figure 3 describes the LRPM framework, taking the LUCC forecast in 2025 as an example. Taking the 2020 feature dataset and the corresponding LUCC dataset as the learning set, MLAs are used to build a model to analyze the relationship between the LU distribution and the various natural environmental and socio-economic conditions. The probability of each LU type in a given research unit (one pixel) is calculated by inputting a feature dataset in 2025 (based on the natural geographic features and geographic features related to human activities in 2020) and using it to generate a probability map (
Figure S1). The LU type with the highest probability is the simulation result of the grid, and all grids ultimately constitute a simulated map [
36,
37,
38,
39]. When the total amount of each LU type can be determined, we can generate the reconstruction or prediction of LUCC year by year [
40,
41]. According to the order of probability from high to low, the land cover is allocated, and each LU type is allocated to the corresponding geographic location and area according to the determined amount.
In this research, the data of a certain year are used as the test set, and the remaining data are the training and validation sets. The training and validation sets are divided into ten parts using the 10-fold cross-validation method, in which nine of the parts are used as a training set and one is used for the validation set. The training set is the data sample used for model fitting. The validation set is a set of samples set aside separately during the model training. The validation set can be used to adjust the hyperparameters of the model and to conduct a preliminary evaluation of the model’s capabilities. The testing set is used to evaluate the generalization ability of the final model. However, it cannot be used as a basis for algorithm-related selection such as parameter tunings and selection of features. The mean value of the ten results is used to estimate the accuracy of the algorithm to obtain more accurate model results.
2.4. Machine Learning Algorithms (MLAs)
2.4.1. K-Nearest Neighbor (KNN)
KNN is a nonparametric example-based learning algorithm that is not trained to generate a classification model. In contrast, the category of an unknown sample is determined by calculating the average of the response variables of the K-adjacent training samples closest to the unknown sample according to Euclidean distances [
42,
43].
2.4.2. Support Vector Machine (SVM)
SVM is a nonparametric learning algorithm that is often used in remote sensing applications [
44]. In SVM theory, for a nonlinearly separable dataset composed of two classes of points, all points of one class can be separated from all points of the other class by an infinite number of hyperplanes. The hyperplane featuring the greatest margin between the two classes is selected by using a subset of the training samples called the support vectors [
45]. SVM aims to classify objects separated by the most favorable hyperplane into recognized categories.
2.4.3. Random Forest (RF)
RF is an ensemble classifier that is widely used due to its classification accuracy [
46]. RF applies a bagging operation to generate multiple decision trees based on randomly selected training data subsets. Each tree is grown independently to its maximum size based on a bootstrap sample from the training dataset, without any pruning, and each node is split using the most favorable value in the input variable subset [
47]. Then, the category receiving the most votes in each tree predictor is used to predict the classification.
2.4.4. Deep Learning (DL)
DL is a new direction in the machine learning field and has been introduced to move closer to machine learning’s original goal (artificial intelligence, AI) [
28,
29,
30,
41,
48].
ANN is an MLA that was originally developed to simulate the ability of the human brain to solve pattern recognition problems. In recent years, ANNs have been increasingly used for remote sensing image classification. The basic ANN framework consists of dense networks composed of interconnected neurons organized in layers, with weights assigned to the connections. These weights are first determined randomly and then iteratively adjusted for training. We compute the loss—a measure of the difference between the values predicted by the model and the intended/true/provided value. Then, iteratively and usually using the gradients computed with backpropagation and an optimizer, we modify the weights of the model so that the loss is reduced [
49].
CNNs are currently very popular in the field of deep learning, and CNN models have been used in various applications and fields, especially for image- and video-processing projects. The main building block of a CNN is the filter, i.e., the kernel, the function of which is to extract relevant features from the input using the convolution operation.
2.5. Algorithm Selection and Optimization
Previous studies have shown SVM to be unsuitable for analyzing large datasets. In our experiment, we were not able to obtain a result through SVM after more than 200 h of computation, indicating that SVM is indeed not suitable for use in LUCC reconstruction and prediction over large areas. When using KNN, the default n-neighbors value of 5 was chosen. When using RF, the n-tree value was set to 512 [
50].
CNNs are relatively complex and have been developing rapidly. AlexNet [
51], VGGNet [
52], inceptionNet [
53], ResNet [
54], and DenseNet [
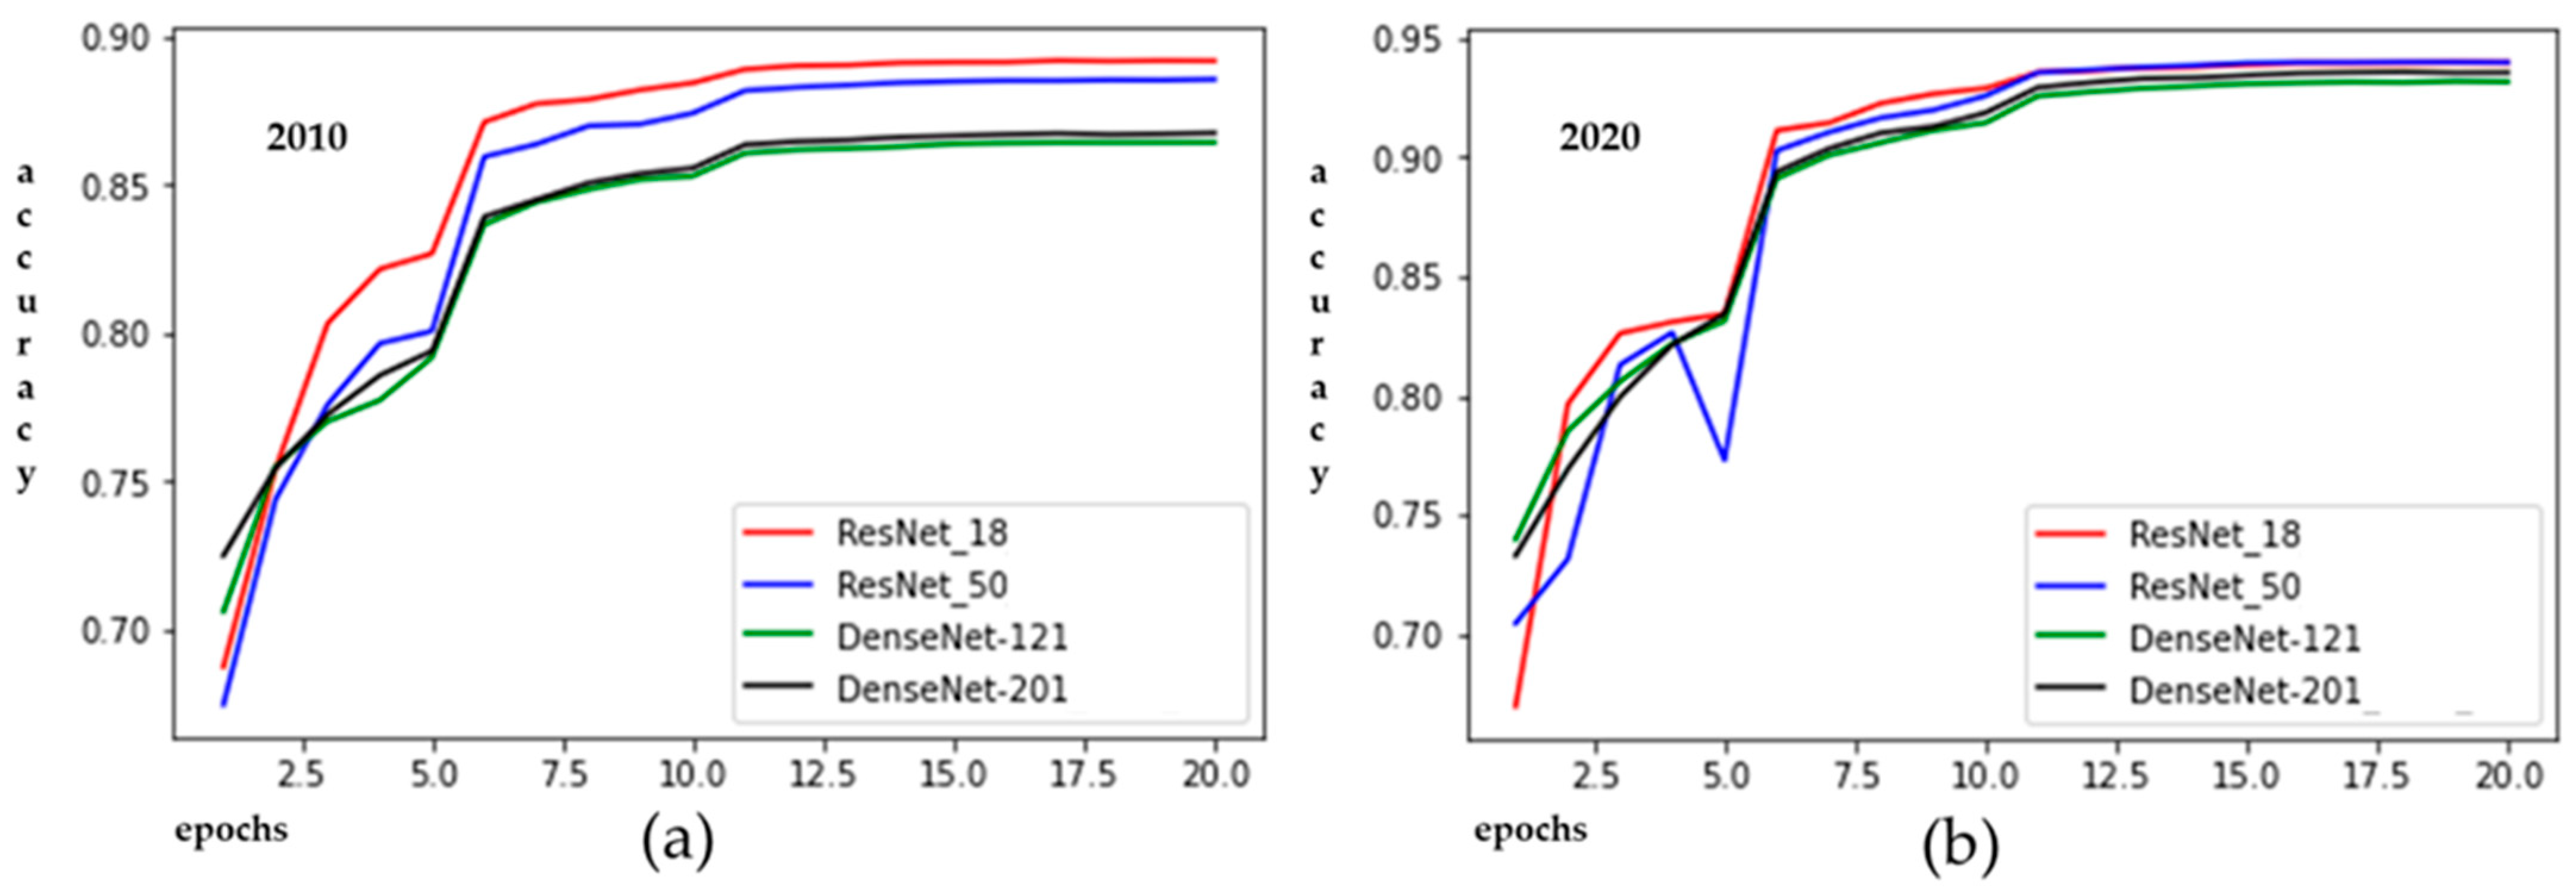
55] have had especially great impacts. In this study, for comparison, we adopted two algorithms, ResNet and DenseNet, which exhibit outstanding performance and have been widely accepted by researchers (
Figure 4).
ResNet is characterized by easy optimization and an accuracy that can be improved by appropriately increasing the depth. Its internal residual blocks are connected in a jumping manner, which alleviates the problem of gradient disappearance caused by increased depths in deep neural networks.
DenseNet is a CNN with dense connections in which any two layers are directly connected, i.e., the input of each layer of the network is the union of the outputs of all the previous layers, and the feature map learned by this layer is directly passed to all the following layers as an input. The use of dense connections alleviates the problem of gradient disappearance, strengthens feature propagation, encourages feature reuse and greatly reduces the number of parameters.
ANN and CNN (ResNet, DenseNet) frameworks are shown in
Figure 4. The main hyperparameters used can be found in the original text (17 is the number of features (
Figure 2), and N×N is the size of the tensor centered on the prediction grid):
A pooling layer is another building block of a CNN. The function of pooling is to progressively reduce the spatial size of the representation to reduce the network complexity and computational cost.
Batch normalization is a regularization technique and usually facilitates training by adding extra layers to a deep neural network. The new layer performs standardizing and normalizing operations on the input of a layer coming from a previous layer. The normalizing process in batch normalization takes place in batches, not as a single input.
The accuracy of each training epoch during the training process of CNNs network is shown in
Figure 5. In terms of overall accuracy and computation time (
Table 1), ResNet-18 outperformed the other networks. Thus, we chose it to be integrated with the CNN to perform LUCC reconstruction and prediction.
2.6. Prediction Assessment
To estimate the LUCC predictions, we used overall accuracy to evaluate the prediction capability of various algorithms. This metric is expressed as the following equation (Equation (1)):
where
CC denotes the number of samples of correctly classified values and
TS denotes the total number of samples.
Another standard method for evaluating the accuracy of LUCC simulations is the three-map comparison method, which determines the amount of error and the spatial allocation error of a simulation map mainly by superimposing the simulated change map and the reference change map for comparison and analysis. The accuracy of the model was determined by comparing the model with the blank model (a model without any change) [
56,
57,
58].
This method requires three LU maps, i.e., the reference map at the simulation start time (t1), the reference map at the simulation end time (t2), and the simulation map at the simulation end time (t2), for comparative analysis in validating the LU change model. The observed LU change map, i.e., the reference change map, which reflects the actual dynamic LU changes, can be obtained by superimposing the reference map at time t1 and the reference map at time t2. Similarly, the simulated LU change information (i.e., the simulated change map), which reflects the simulated behavior of the model, can be obtained by superimposing the reference map at time t1 and the simulation map at time t2. This verification method allows us to understand the consistency (or deviation) of the comparative analysis between the simulated map and the reference map (i.e., the actual LU type map) at time t2. The accuracy of the model in simulating LUCC changes can be determined by comparing the reference change map and the simulated change map based on four indicators that indicate whether the pixel change is correct or incorrect: hits, misses, false alarms, and null success. These indicators are defined below.
Hit: a certain pixel is predicted to change and has indeed changed.
Miss: a certain pixel is predicted to be unchanged but has actually changed.
False alarm: a certain pixel is predicted to change and has actually not changed.
Null success (also referred to as “correct rejection”): a certain pixel is predicted to be unchanged and has actually not changed, i.e., neither the simulated change map nor the reference change map show changes.
4. Discussion
4.1. Comparisons with Previous Studies
In a previous study, we proposed a model that integrates deep learning for LUCC reconstruction, namely, DLURM. Zhenlai County, China was selected in that study, and the performance of the proposed DLURM was validated by comparing the DLURM to the HLURM and CA–Markov models. (HLURM is an excellent integrated model that has been published, is widely recognized and exemplifies the capabilities of the current mature models.) The experimental results showed that DLURM had a significantly better overall accuracy in terms of reconstruction, reaching 92.87%. Compared with the results of the traditional models, the overall accuracy of the DLURM model improved by 9.66 and 6.89%, i.e., the error rate decreased by 57.53 and 49.14%, respectively. The DLURM model also had high robustness. Compared with the simulation results of the HLURM and CA–Markov models, the spatial distribution of LUCC based on DLURM can better match the actual LU spatial distribution. DLURM has been demonstrated to be one of the best LUCC reconstruction models [
1].
In order to show the innovative progress and value of CLRPM, we used DLURM and CLRPM to complete the LUCC reconstruction of Baicheng City in 2005, 2010, 2015, and 2020, and to compare them in
Figure S4.
Table 5 shows the overall accuracy of DLURM and CLRPM. Compared with that of DLURM, the overall accuracy of CLRPM increased by 9.38%, which indicates that the error rate decreased by 49.5%.
Table 6 shows the evaluation results using the three-map evaluation method. By comparison, CLRPM has a higher reconstruction accuracy on a spatial scale of more than 10,000 square kilometers and can therefore accurately predict LUCC. CLRPM is an integrated model for high-accuracy annual LUCC reconstructions and predictions.
The implementation of the LUCC classification of multilevel categories (including Level I and Level II categories) adheres to the following standards:
1. Effective multilevel classification of LUCC should not simply consider the overall accuracy rate; the reconstruction accuracy rate of each Level II category must also reach a very high level.
2. The Level II category with a reconstruction accuracy rate greater than 80% is considered an effective reconstruction, and most Level II category reconstructions should meet this standard.
3. The secondary category with a reconstruction accuracy rate of less than 66% is considered an invalid reconstruction, and there should be no Level II category reconstruction below this standard.
We use DLURM and CLRPM to implement the LUCC classification of multilevel categories (including Level I and Level II categories).
Table 7 presents the reconstruction accuracy for 24 types of LUs (with “n/a”, indicating that no such LU distribution exists in the Baicheng area). Compared with the representative DLURM of the traditional model, only two types of LUs have lower overall reconstruction accuracy. The 15 types of reconstruction accuracies of DLURM are less than 80%. The overall accuracy of CLRPM reconstruction is higher than 80% for all 21 existing LUs in the Baicheng area except three. There is no LU with an accuracy of less than 66% achieved by CLRPM, and there are six types of DLURM. These results show that CLRPM can achieve LUCC classification of multilevel categories (including Level I and Level II categories).
The comparison between DLURM and CLRPM shows that CLRPM innovatively fills the gaps in the previous research.
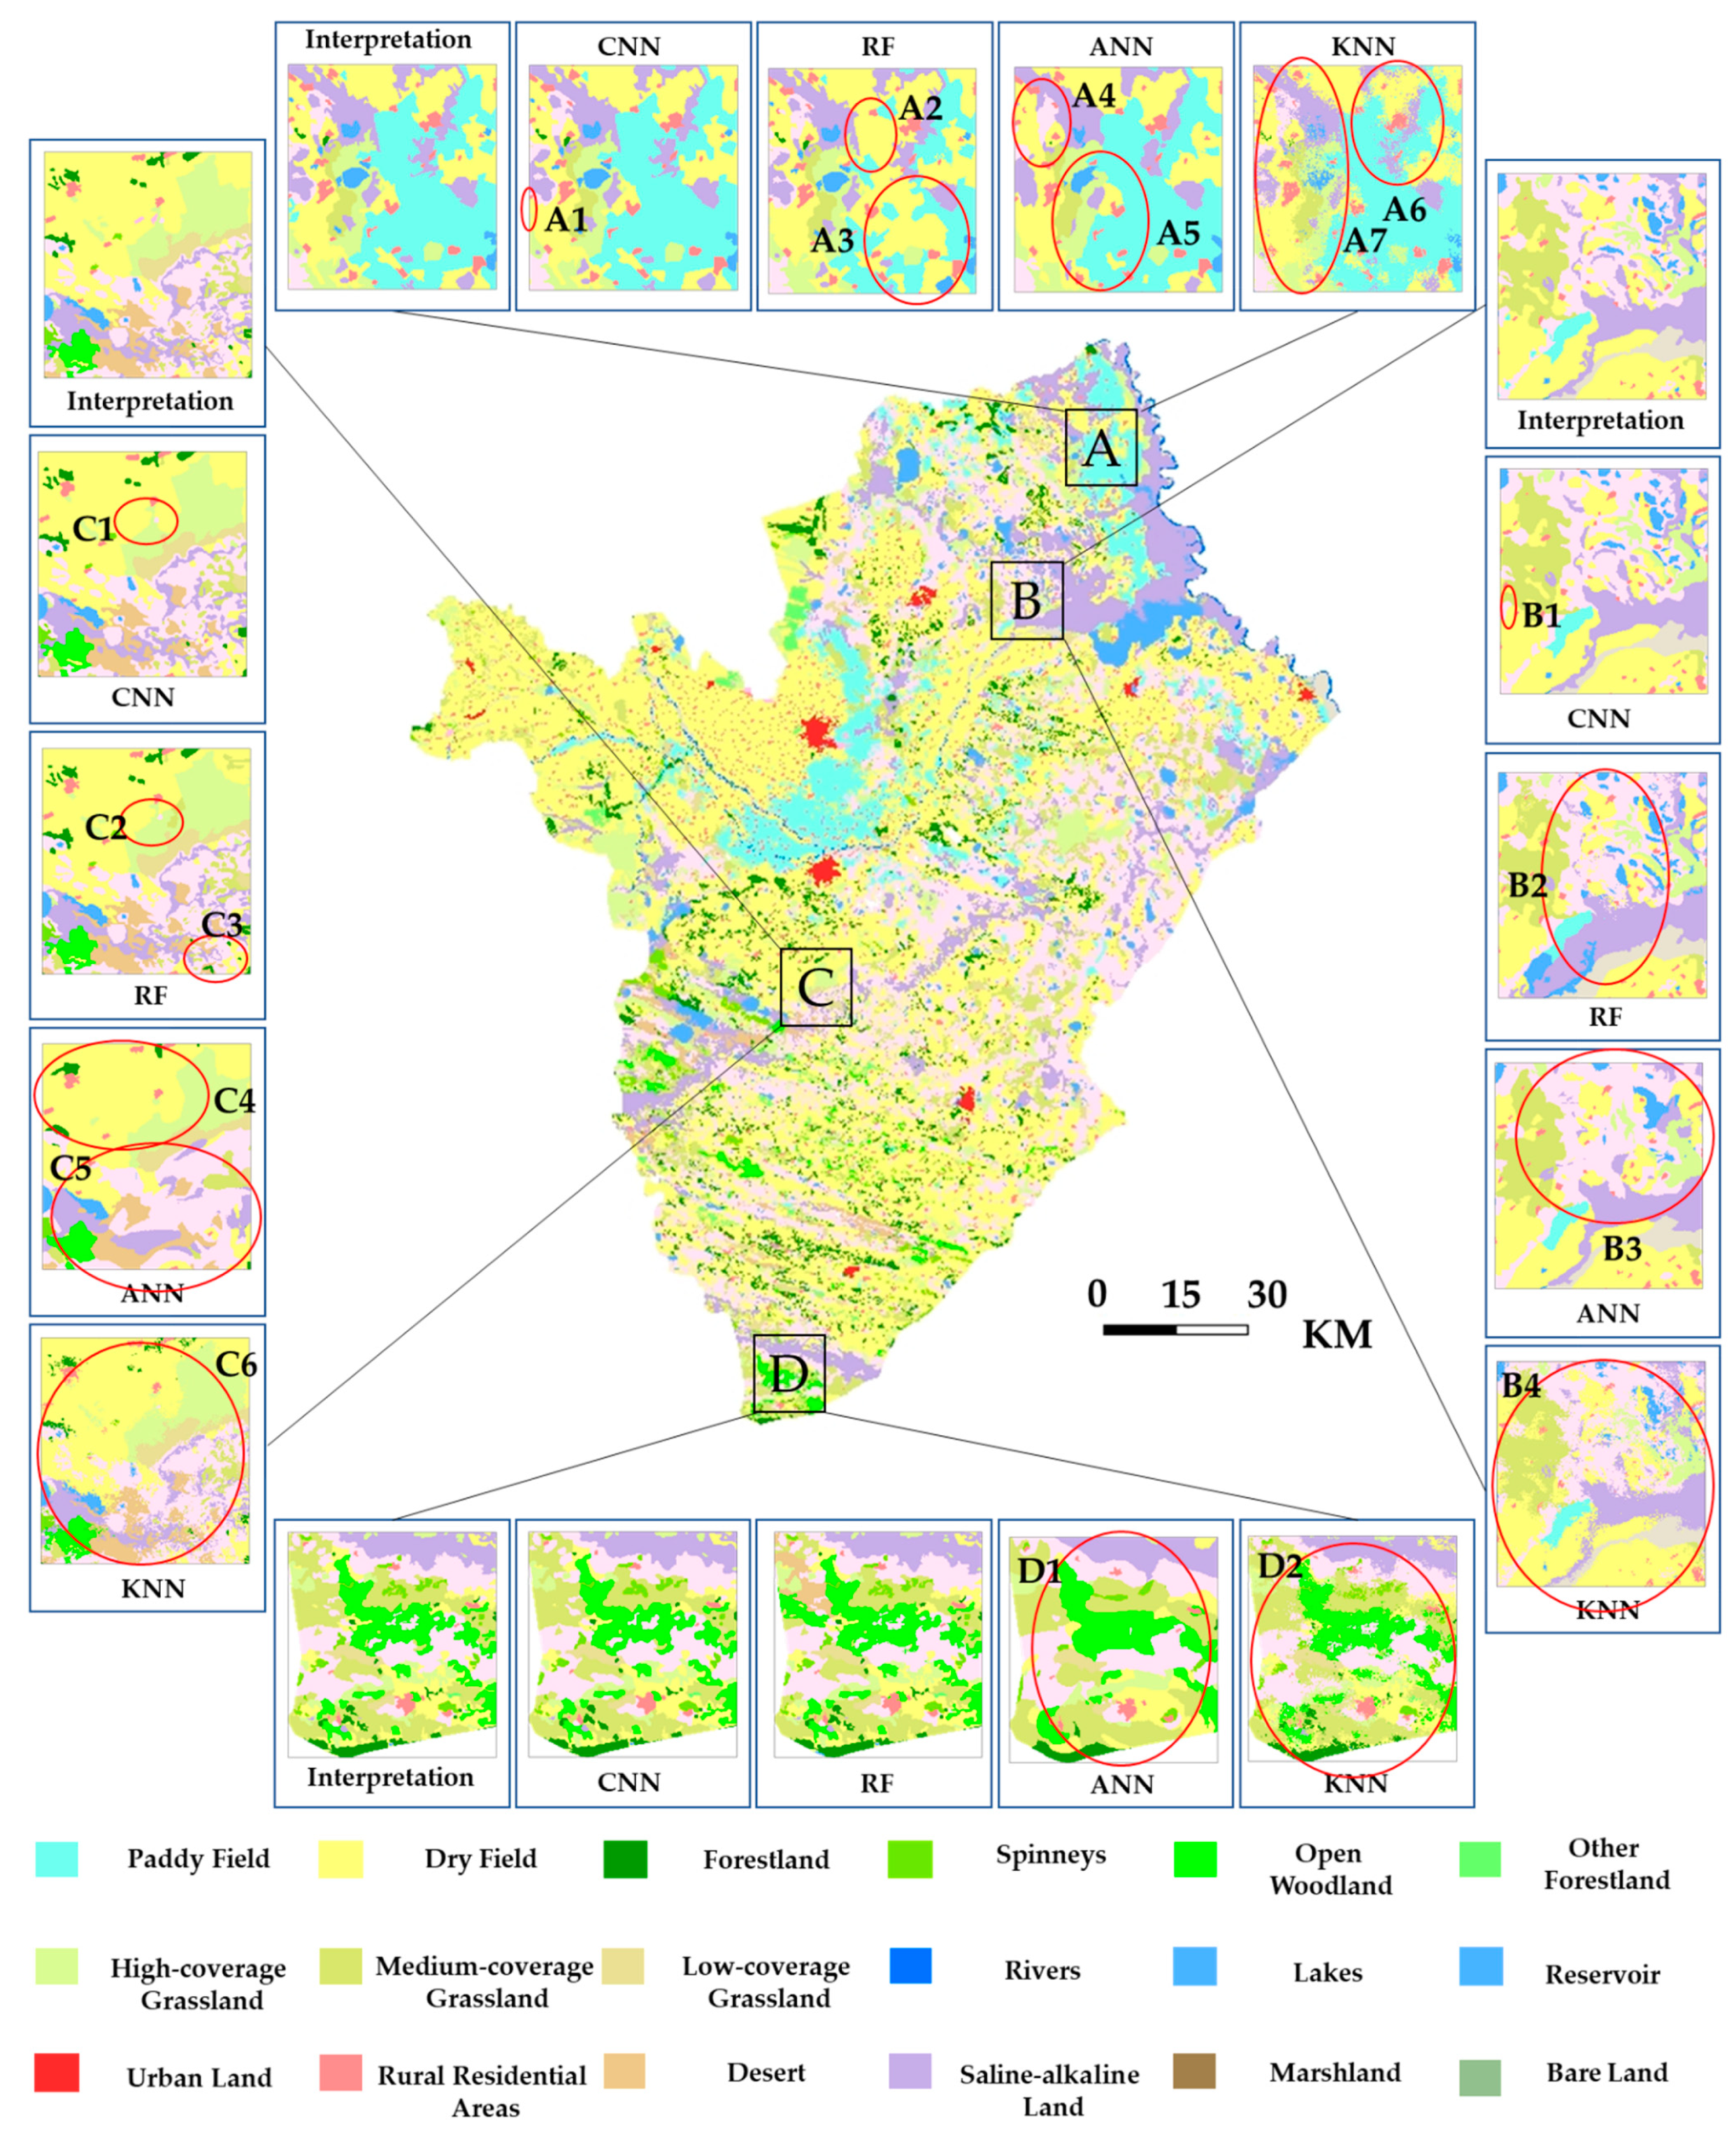
We take 2020 as an example and compare the reconstruction results of CLRPM and DLURM with a manual interpretation in
Figure 7. We compared seven of the typical research areas, and the CLRPM simulation results marked in red are significantly better. It can be found that our new reconstruction model CLRPM has obvious advantages as detailed below.
The overall accuracy rate is significantly higher, and the simulation results are more in line with the actual spatial distribution.
Many traditional methods cannot effectively distinguish the secondary classification (Forestland, Spinneys, Open Woodland and Other Forestland; High-coverage Grassland, Medium-coverage Grassland and Low-coverage Grassland; Bare Land and Bare Rock). The improvement of the reconstruction accuracy of each of the Level II categories of CLRPM is exceptional. Comprehensive consideration of each subcategory is the basis for our accurate implementation of policies, effective management, and calculation of carbon emissions.
The integration of LUCC reconstruction and prediction is successfully achieved.
4.2. Reason for Improvement
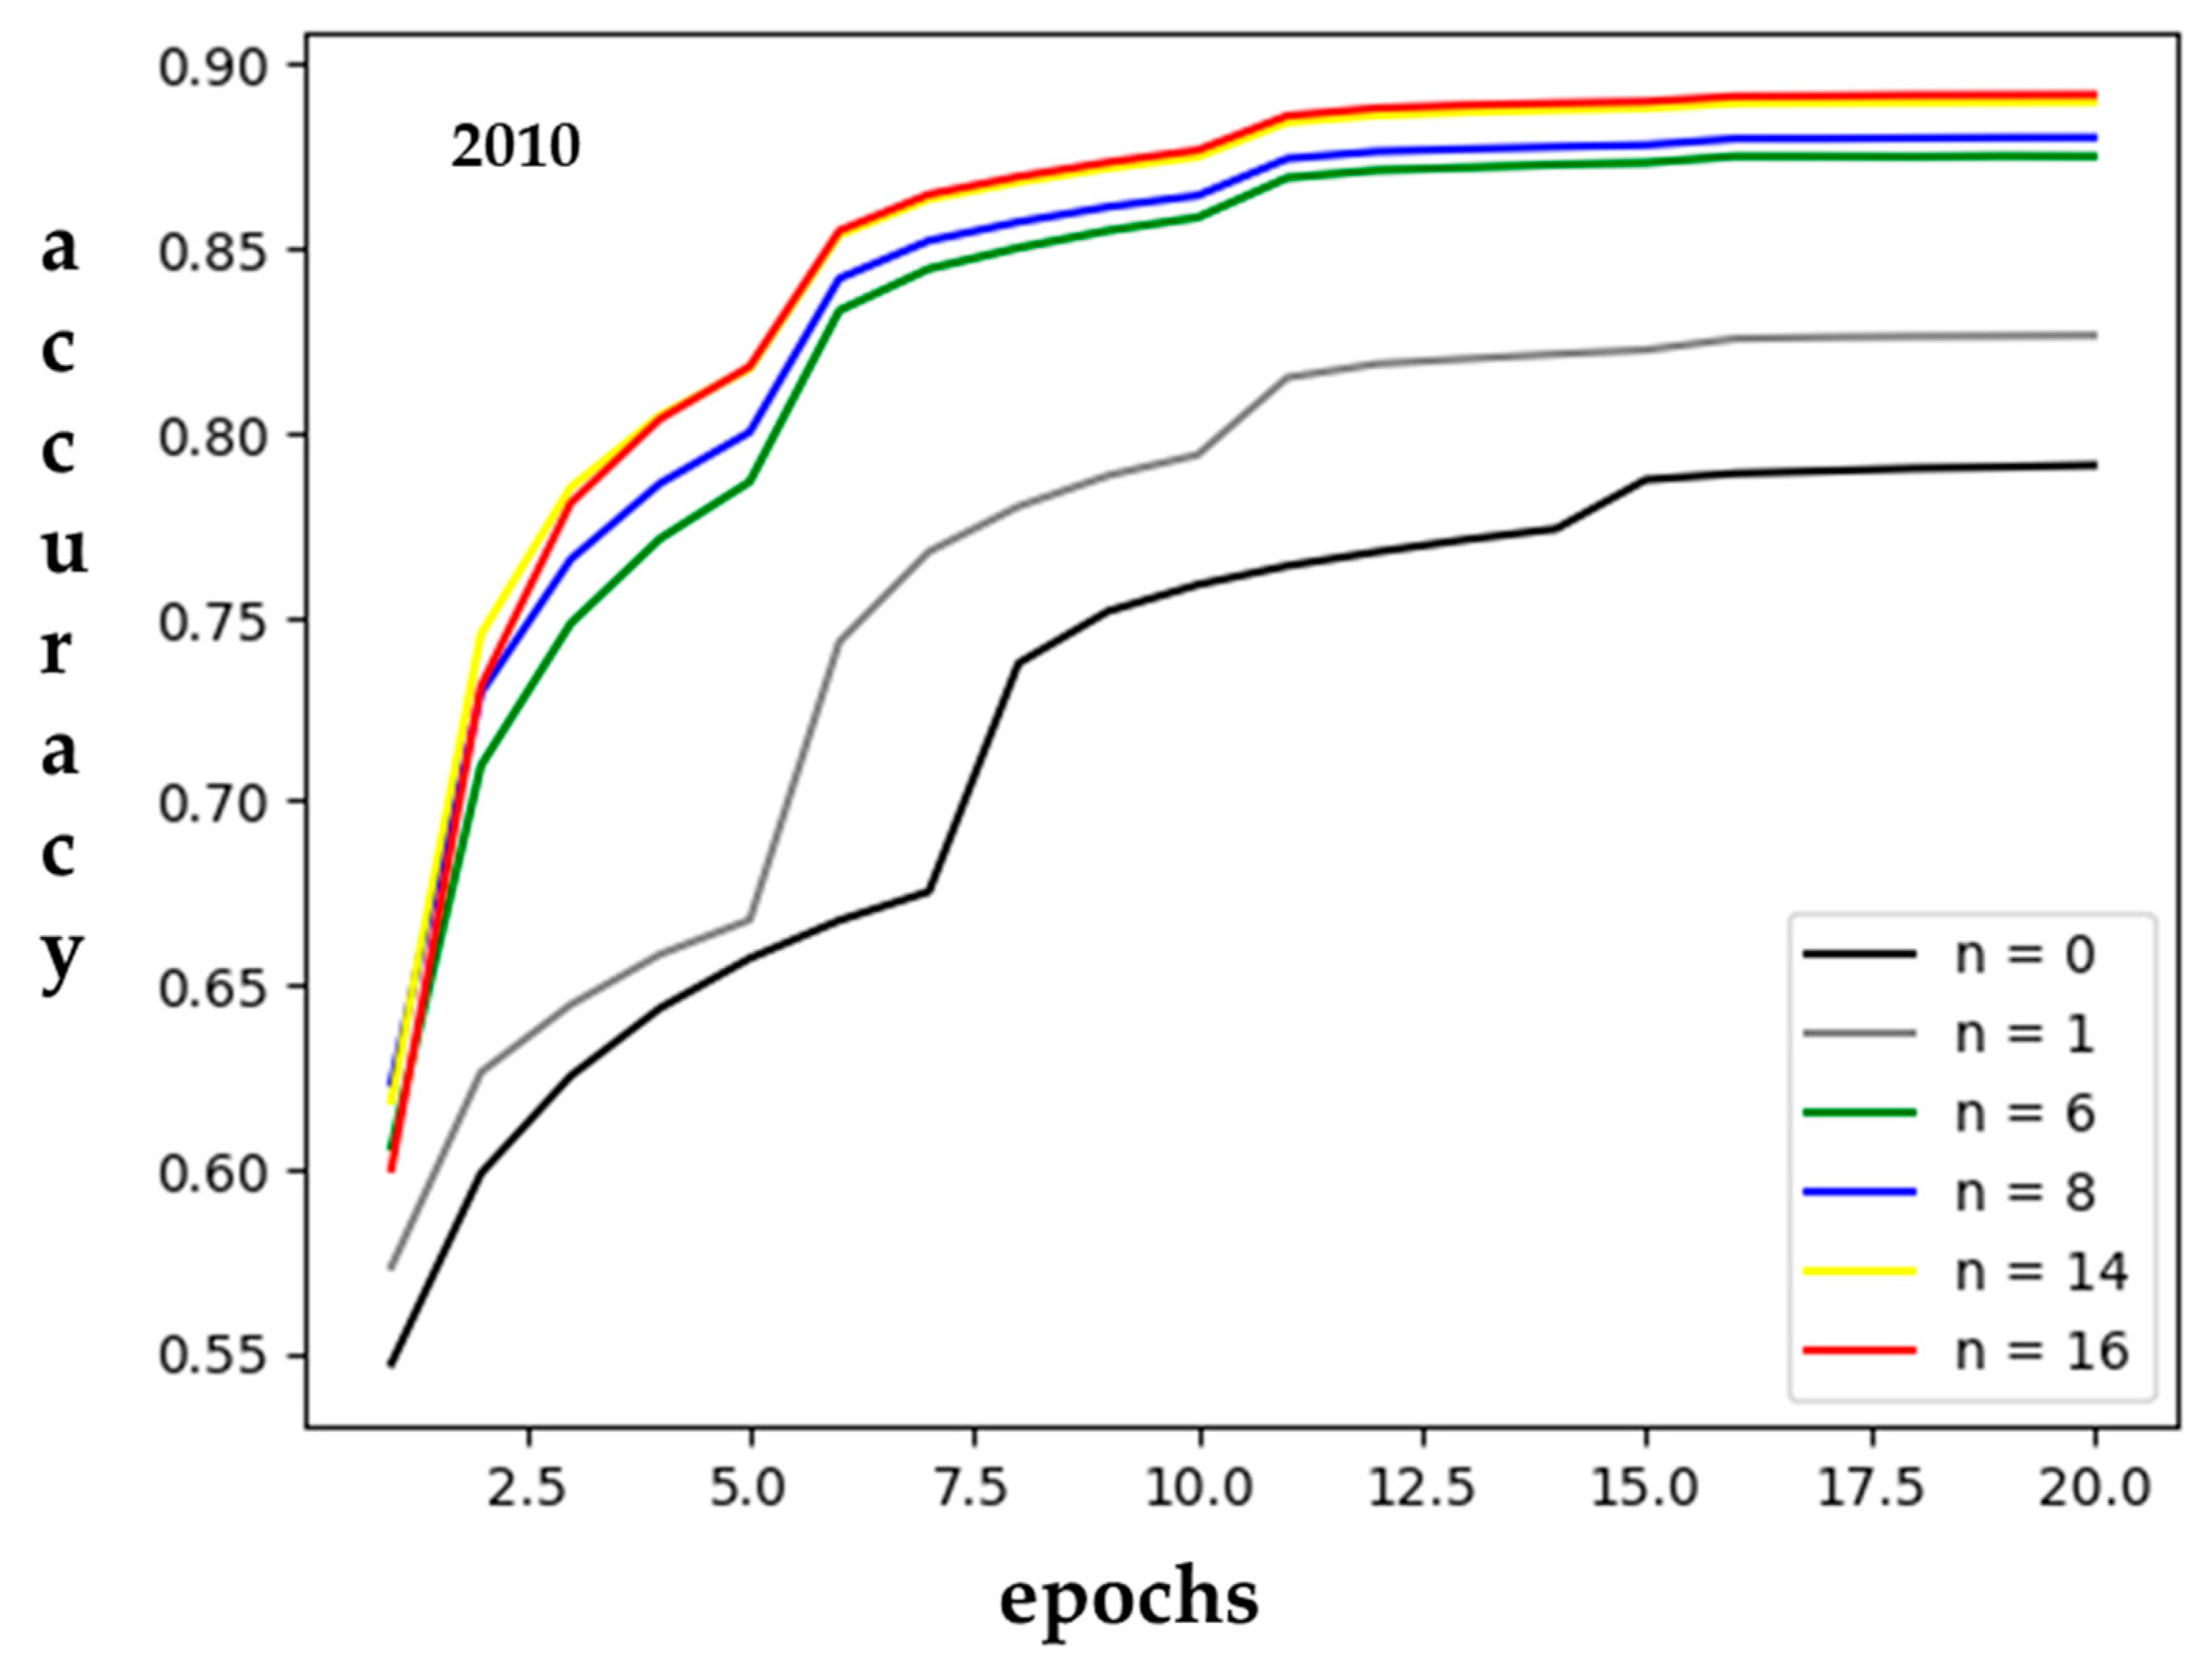
The LUCC suitability of each grid point depends not only on the point itself but also on the values of the features of the point and its neighboring points as well as their spatial relationships. The accuracy of the calculated suitability improved as the adjacent grid range expanded, and the fit between the reconstructed and predicted LUCC and the actual LUCC also improved.
Figure 8 takes 2010 as an example to show the training process under different proximity training processes.
Table 8 shows the overall accuracy of different proximities. The results confirm the improved accuracy with an expanding grid range, and as the proximity increased, the marginal benefit gradually decreased. In this study, the adjacent grid range was expanded to 17 × 17 (with 16 adjacent grids), and the potential spatial elements were captured through the CNN so that the neighborhood effect could be comprehensively represented.
The CNN makes good use of the expansion of proximity to improve accuracy, which the other MLAs cannot do (the performance of the other MLAs does not improve for n > 2). The CLRPM is better than the traditional LUCC reconstruction model, precisely because it can learn the location distribution information and consider the influence of proximity [
51].
4.3. Study Limitations
As shown in
Figure 8, after the proximity exceeds 17 × 17, the performance no longer increases, which means that CNN cannot further clarify the value of the LUCC spatial distribution, and CLRPM cannot further improve the accuracy of LUCC reconstruction and prediction.
CLRPM cannot obtain the reconstruction and prediction of LUCC in a wider spatial range. Since CLRPM needs to create N×N tensors of all grids and perform operations, the expansion of the space range will cause an exponential increase in the demand for storage space and floating-point operations per second. Currently, reconstruction and prediction of more than 100,000 square kilometers cannot be completed, such as in the Jilin Province in Northeast China.
CLRPM cannot make full use of data from multiple years. At present, many years of data only provide a larger training set, and the relevance of the relationship between grid evolution and the improvement in LUCC reconstruction and prediction accuracy is ignored.
The following research directions should be pursued in future studies.
The use of semantic segmentation models should be explored to study the reconstruction and prediction of LUCC over large temporal and spatial areas and regions with different ecological geographic features.
LSTM could be introduced to determine the patterns of temporal and spatial evolution to obtain more accurate LUCC predictions.
Future studies should use high-resolution datasets and consider various drivers such as land-use policies, population density, space, and geophysical and socioeconomic factors, and the impacts of different factors should be analyzed.
4.4. Conclusions
Overall, the novel research garnered in this paper can be summarized as follows:
We launched CLRPM, an integrated solution model that accurately completes the annual reconstruction and prediction of LUCC. Long-term LUCC prediction and reconstruction implemented by CLRPM are of great value for the study of global environmental changes and climate impacts. The more accurate LUCC parameters provided by CLRPM are important model input parameters for evaluating the impact of human activities on the environment and climate. The scientific basis it provides is used to formulate laws and plans.
CLRPM is a model used to implement multilevel (including Level I and Level II categories) LUCC classification. The overall reconstruction accuracy of most LU subdivision types exceeds 80%. The multilevel classification of LUCC plays a critical role in LU and land protection. This metric is the basis for natural resource protection, effective management, and carbon emission calculations.
At a spatial scale of more than 10,000 square kilometers, the reconstruction accuracy of CLRPM is higher than that of the previous model. Compared with that of DLURM, the overall accuracy of CLRPM increased by 9.38%, which means that the error rate decreased by 49.5%. The LUCC simulation is more accurate and better matches the actual LU spatial distribution. CLRPM can help us obtain an accurate and in-depth understanding of LUCC changes.


 ,
, 

