
Sargassum Detection Using Machine Learning Models: A Case Study with the First 6 Months of GOCI-II Imagery
by
 , and
, and
Jisun Shin
1 ,
,
Jong-Seok Lee
1,
Lee-Hyun Jang
2,
Jinwook Lim
2,
Boo-Keun Khim
1 and
Young-Heon Jo
1,* 1
BK21 School of Earth and Environmental Systems, Pusan National University, 2, Busandaehak-ro 63 beon-gil, Busan 46241, Korea
2
LION PLUS Corp., 38, Jungang-daero 1367 beon-gil, Busan 47728, Korea
*
Author to whom correspondence should be addressed.
Remote Sens. 2021, 13(23), 4844; https://doi.org/10.3390/rs13234844
Submission received: 22 October 2021
/
Revised: 25 November 2021
/
Accepted: 26 November 2021
/
Published: 29 November 2021
(This article belongs to the Section Ocean Remote Sensing)
Abstract
:A record-breaking agglomeration of Sargassum was packed along the northern Jeju coast in Korea in 2021, and laborers suffered from removing them from the beach. If remote sensing can be used to detect the locations at which Sargassum accumulated in a timely and accurate manner, we could remove them before their arrival and reduce the damage caused by Sargassum. This study aims to detect Sargassum distribution on the coast of Jeju Island using the Geostationary KOMPSAT 2B (GK2B) Geostationary Ocean Color Imager-II (GOCI-II) imagery that was launched in February 2020, with measurements available since October 2020. For this, we used GOCI-II imagery during the first 6 months and machine learning models including Fine Tree, a Fine Gaussian support vector machine (SVM), and Gentle adaptive boosting (GentleBoost). We trained the models with the GOCI-II Rayleigh-corrected reflectance (RhoC) image and a ground truth map extracted from high-resolution images as input and output, respectively. Qualitative and quantitative assessments were carried out using the three machine learning models and traditional methods such as Sargassum indexes. We found that GentleBoost showed a lower false positive (6.2%) and a high F-measure level (0.82), and a more appropriate Sargassum distribution compared to other methods. The application of the machine learning model to GOCI-II images in various atmospheric conditions is therefore considered successful for mapping Sargassum extent quickly, enabling reduction of laborers’ efforts to remove them.
1. Introduction
Sargassum is a genus of brown macro algae and is a vital producer in oceanic ecosystems [1]. In particular, Sargassum horneri is the only species that causes golden tides [2]. They, moving in the form of a slick or a patch, can become wrapped around ships’ screws and interfere with fishing and navigation or stick to fishing nets, causing damage to facilities and the loss of Pyropia yezoensis aquaculture [3]. It harms the surrounding landscape and affects the lives of nearby residents due to odors, which can be reduced by collecting the algae before it can enter coastal areas or fish farms (Figure 1). Golden tides of Sargassum have been reported in the East China Sea (ECS) since the early 2000s, and floating golden tides have frequently been appeared in the Yellow Sea (YS) [4]. In general, Sargassum first appears near the southeastern coast of China in January or February. It floats to the coast of Jeju Island and Jeollanamdo in Korea by May or June. According to the Ministry of Oceans and Fisheries (MOF) in Korea, 18,221 tons of Sargassum flowed into the seas around Korea from January to April 2021 of which 15,843 tons were collected, surpassing the 15,640 tons collected in 2015 and becoming the highest annual collection in the last six years. In particular, 94% of the total Sargassum observed around Jeju Island encroaches the northern coast [5]. To reduce the damage caused by Sargassum, the MOF has been conducting pre-collection of Sargassum via satellite data and field observations. The early detection and removal of Sargassum are critically important for sustaining both a healthy marine ecology and local economies such as fishing, tourism, and recreation [3,6]. It is, therefore, necessary to detect the location and extent of the Sargassum on time. Remote sensing approaches using satellite data can be an effective tool for detecting Sargassum and can overcome the spatial and temporal limitations of field sampling [6,7].
To date, both satellite sensors and satellite-based algorithms have been used to detect Sargassum. Ocean color sensors such as the Medium Resolution Imaging Spectrometer (MERIS), MODerate resolution Imaging Spectroradiometer (MODIS), Visible Infrared Imager Radiometer Suite (VIIRS), and Geostationary Ocean Color Imager (GOCI) have been applied to identify Sargassum distribution with the synoptic scale because large swathes can be covered with a coarse spatial resolution [8,9,10,11,12]. Hence, ocean color sensors play a critical role in determining historical Sargassum distributions regarding bloom occurrence. The Maximum Chlorophyll Index (MCI) was proposed for use with MERIS to facilitate the systematic monitoring of Sargassum distribution [8,13,14,15,16]. Wang and Hu [10,11] constructed a framework to retrieve maps describing the distribution of Sargassum from MODIS Alternative FAI (AFAI) and VIIRS. These methods allowed the generation of long-term statistics describing the extent of Sargassum during 2000–2016 in the Central West Atlantic. Qi et al. [4] identified the movement of Sargassum on the southeastern coast of China in 2015 and 2017 using MODIS and confirmed the existence of an extensive Sargassum extending from the southern YS to the ECS, including the waters near Jeju Island. Kim et al. [7] identified the long-term dispersion of floating golden tides in the eastern YS during 2008–2017 using GOCI images and confirmed that the amount of Sargassum reaching the eastern YS increased gradually over time. However, a coarse spatial resolution (>500 m) is often considered a full cloud by pixels associated with partial cloud coverage, resulting in cloud coverage being overestimated and less valid observations compared to the results of higher-resolution imagery. The existence of mixed pixels containing both water and land, along with interference arising from high total suspended particles or shallow water bottom, often means that Sargassum detection in coastal waters is not valid. Ocean color sensors are also unable to identify small Sargassum features.
On the other hand, terrestrial sensors with high spatial resolution have the advantage of being able to recognize small Sargassum patches and can detect the algae with some accuracy in nearshore areas. Xing and Hu [17] developed the Virtual-Baseline Floating macroAlgae Height (VB-FAH) index for terrestrial sensors such as HJ-1A and HJ-1B. VB-FAH index can compensate the lack of a short-wave infrared (SWIR) waveband. They were able to reveal the bloom occurrence in the YS and ECS during the periods of 1995–2006 and 2009–2014, respectively. Xing et al. [18] confirmed the migration of floating Sargassum heading south of the western YS using GaoFen-1 (GF1) and GF2, which was thought to have originated near the eastern Shandong Peninsula in China. Landsat and Sentinel-2 Multispectral Instrument (MSI) images have also been used to detect Sargassum distributions [6,19,20,21]. These methods have all been used to effectively diagnose Sargassum slicks through the use of a pre-determined threshold.
However, the threshold-based approach is of no use to an image contaminated by clouds, aerosols, or sun glint, which can limit the usefulness of the data gathered. To overcome the issues surrounding the use of the threshold-based approach, Wang and Hu [22] developed an automatic method for detecting Sargassum with MSI imagery. An approach using the difference of various spectral features in an image was proposed, with explicit rules covering the masking of clouds and the elimination of other sources of noises, allowing the delineation of Sargassum-containing pixels. Although the rules and the possible reason failure are easy to understand, 20% of the detection made using this method is false–negative because of weak Sargassum signals [22]. Unlike Ulva prolifera, weak Sargassum features are not easily delineated from the background water. This is because no conspicuous differences can be observed between the spectral shapes of refection from thin cloud, wave, and weak Sargassum features in their enhanced near infrared (NIR). However, the accurate estimation of weak Sargassum spectral signals is essential for long-term monitoring and biomass estimation.
Several studies have successfully applied machine learning and deep learning approaches to objectively extract spatial and spectral properties that can be used to define and classify various conditions without the requirement for subjective human annotation or a threshold-based method [23,24,25,26,27]. These approaches have been applied as an adequate solution for dealing with non-linear problems [28,29] and have previously been utilized to identify Sargassum features from remote sensing data. Cuevas et al. [30] implemented a methodological approach to identify the distribution of Sargassum using Landsat OLI and random forest. Monthly analyses were performed from 2014 to 2015 for the northeastern Yucatan Peninsula, Mexico, with good performance. Chen et al. [31] performed automatic extraction of Sargassum based on spectral-texture features and a support vector machine (SVM) using GF-1. They achieved superior results than the conventional threshold-based method. ArellanoVerdejo et al. [32] proposed a new algorithm to detect pelagic Sargassum on the coast of Quintana Roo, Mexico using MODIS and ERISNet with deep neural networks. ERISNet hypothesized that it automatically learns the relationships between reflectance and the existence of Sargassum without the need for existing indices and also achieved high probabilities in classifying the pixels of Sargassum and non-Sargassum.
Geostationary KOMPSAT 2B (GK2B) GOCI-II with the new satellite observations was launched in February 2020. Data were available from October 2020. GOCI-II images can provide valuable measurements of the coastlines of Jeju Island because of high temporal resolution and the spatial resolution of 250 m. In addition, the enhanced wavelength information can highlight the optical properties of Sargassum. Furthermore, high temporal resolution with 10 times every day enables us to employ machine learning algorithms because it is possible to acquire effective pixels of Sargassum compared to other sensors obtained once a day or three days.
Therefore, this study employed machine learning algorithms to detect Sargassum with GOCI-II images obtained for the first 6 months. For this, in situ Sargassum spectral analysis was performed using field survey data. Then, spectra obtained from the GOCI-II images for both Sargassum and the surrounding waters were investigated. We trained machine learning models using the GOCI-II images and Sargassum maps. Traditional methods using Sargassum indexes and machine learning models were qualitatively and quantitatively assessed.
2. Materials and Methods
2.1. Satellite Image Processing
In this study, GOCI-II data were used to extract the pixel-wise existence of Sargassum. The study area is the coast near Jeju Island, which belongs to the YS and ECS (Figure 2). The YS is adjacent to both Korean Peninsula and China and is connected to the ECS and has a complex current system that can be affected by both tidal and subtidal components [33]. The invasion of the Kuroshio Current branch and wind stress in the East Asian Monsoon tends to dominate the seasonal current pattern of the YS [34,35] and often results in the southwestward and northeastward Ekman surface currents that occur during the winter and summer, respectively. The YS contains a considerable quantity of Sargassum, which is generally transported from the ECS to the north [4]. Over the last five years, a huge amount of Sargassum has been observed flowing into the sea on the northern coast of Jeju Island, especially from January to April 2021, during which time it exceeded all previously observed levels.
Table 1 shows an overview of GOCI-II onboard GK2B. The launch date is 18 February 2020. The satellite orbits at an altitude of 35,768 km, and centers on the locations at 128.2°E. The mission is expected to last 10 years. The local mode provides images with 250m spatial resolution up to 10 times per day at hourly intervals from 23 UTC to 8 UTC. Local modes are composed of 12 slots with a total coverage of 2500 km × 2500 km in Northeast Asia. Slot 7 includes the area around the Korean Peninsula shown in Figure 1. The global mode includes images from the entire hemisphere, which are acquired once a day at a spatial resolution of 1 km and are composed of 235 slots. Each image pixel covers 12 spectral bands ranging from 380 to 865 nm.
The GOCI-II data were obtained from the Korea Hydrographic and Oceanographic Agency (KHOA) [36] from October 2021 and the GOCI-II Level-2 data were obtained using the GOCI-II atmospheric correction algorithm (G2AC). Rayleigh-corrected reflectance (RhoC, unitless) with 12 wavelength spectral bands was used to train the machine learning models. RhoC was used instead of fully corrected reflectance (remote sensing reflectance, Rrs) because aerosol correction often fails for pixels containing Sargassum or floating algae as a result of the contributions these features make to aerosol correction bands such as NIR and SWIR [37]. Hence, the use of RhoC follows the tradition used for the remote sensing of floating matter [38]. RhoC was derived using Equation (1):
where is the calibrated top-of-atmosphere radiance at band after gaseous absorption and whitecap correction, is the extraterrestrial solar irradiance at the data acquisition time, is the solar zenith angle, and is the Rayleigh reflectance. GOCI-I RhoC data were obtained from the Korea Ocean Satellite Center (KOSC) [39].
The Sargassum ground truth map was generated from the higher resolution multispectral Landsat OLI and Sentinel-2 MSI images. The OLI images were downloaded from the U.S. Geological Survey [40] with spatial resolution of 30 m and revisit periods of 16 days. The two European Space Agency (ESA) Sentinel-2 satellites are equipped with MSIs that have spatial resolutions of 10 and 20 m. The MSIs from both satellites can achieve a revisit period of 5 days. MSI L1C images collected near Jeju Island (tile: T52SBC) were therefore downloaded from the Copernicus Open Access Hub [41]. The Case 2 Regional CoastColour (C2RCC) processor from the Sentinel Application Platform (SNAP, version 6.0) was used for atmospheric correction of OLI and MSIs.
Table 2 presents a list of date of Sargassum discovery and satellite images available. Based on the sparse information provided by MOF, we investigated the inflow timing of Sargassum entering Jeju Island from October 2020 to April 2021 using satellite images. It was found that there was a large influx of Sargassum off the coast of Jeju Island between January 2021 and February 2021. We found that Sargassum had flowed into the Jeju coast by 16 February. GOCI-II images were available 10 times per day, and MSI images were acquired at 5-day intervals from a combination of the Sentinel-2A and 2B satellites. OLI images were obtained for the area surrounding Jeju Island (Path 116 row 37 or Path 115 row 37). OLI and MSI images were obtained of the Korean Peninsula at approximately 2 UTC. Of the eight OLI and MSIs images, only six images with cloud coverage of 70% or less were selected as ground truth data. GOCI-II images were obtained covering 1 to 7 UTC on the same dates for use as training data. Finally, 42 GOCI-II images were used in this study.
2.2. In Situ Spectrum Measurement
Figure 3 shows an example of Sargassum patches appearing in the form of a black slick in the RhoC Sentinel-2 MSI true-color composite images near the northern coast of Jeju Island in Korea on 27 January 2021. In situ observations of Sargassum were also conducted during the period 17–19 February 2021. As shown in Figure 3a–e, Sargassum was found in a total of five sites, including Samyang-dong Beach, Samyang Beach, Shinchon Beach, Jukdo Beach, and Shinheung-lee Beach. Spectral measurements were performed at Sinchon Beach using a hyperspectral radiometer (TriOS RAMSES), which provides spectra over a range of 318–952 nm with a bandwidth comprising 3.3 and 192 nm wavelength bands. The radiometer consists of a RAMSES-ACC sensor for down-welling irradiance (Ed, Wm−2nm−1) and a RAMSES-ARC sensor for sky radiance (Lsky, Wm−2nm−1sr−1) and total water-leaving radiance (LwT, Wm−2nm−1s−1) and a field of view (FOV) covering 7°. Both sensors measure Lsky, LwT, and Ed simultaneously at 40° and 135°. Rrs was calculated through the following procedure:
The sky glint radiance was calculated as Lsky multiplied by the constant , which represents the effects of sun glint, wind speed, and the distribution of radiance in the sky similarly to Fresnel reflectance with 0.025 [42]. The water-leaving radiance (Lw) was calculated by subtracting the sky glint radiance from LwT. Then, Lw was divided by Ed to obtain Rrs.
2.3. Methods
Figure 4a,b shows a schematic diagram of the procedure used for detecting Sargassum. Of the 42 GOCI-II RhoC images, 30 images were used for training and 12 for validation. The training input data consisted of 30 GOCI-II RhoC images covering 12 wavelength bands obtained at 1, 2, 4, 6, and 7 UTC on the six days mentioned in Table 2. As the training output data, the corresponding ground-truth Sargassum maps were derived from high-resolution images using the information provided by the MOF and Sargassum detection indexes. The extent of the ground truth maps on each date was determined by the region in which high-resolution images were acquired (Figure 2). To match GOCI-II data, high-resolution images such as OLI and MSIs were resampled to 250 m of spatial resolution. Then, Sargassum ground truth map was generated using the difference vegetation index (DVI) and threshold-based method. One of the ground-truth OLI images is illustrated in Figure 3 as an example, using the satellite imagery listed in Table 2. The validation data used 12 GOCI-II images obtained at 3 and 5 UTC and the ground truth Sargassum maps. We extracted valid pixel pairs for each training and validation dataset. For the training dataset of the machine learning models, 214,071 valid pixel pairs were generated between the GOCI-II images and the corresponding ground-truth maps (Figure 4a), and 82,368 matched pairs were used as the validation dataset (Figure 4b). The proportions of valid pixel pairs for the training and the validation were 72 and 28%, respectively. In the case of Sargassum pixels, all Sargassum pixels extracted from the image were used. Non-Sargassum pixels were used twice Sargassum pixels for each dataset. The proportions of Sargassum and non-Sargassum pixels in the two datasets were 33 and 67%, respectively. The estimation performances of the machine learning models and traditional methods were assessed using a confusion matrix. A case study based on the GOCI-II images was presented in which Sargassum was detected on the coast of Jeju Island.
2.3.1. Sargassum Indexes as Traditional Methods
Three Sargassum indexes were used to compare the performance of the machine learning approaches. The DVI proposed by Richardson and Wiegand [43] was used first as it shows good performance in reducing the impacts of sun glint and thin clouds compared to the normalized DVI (NDVI) [17,18]. The DVI is calculated using the equation:
where RhoC,NIR and RhoC,Red denote the RhoC of the near-infrared (NIR) band and red band, respectively. A pixel was flagged as Sargassum when the DVI value was >0.
Second, the slope of the red–green (SRG) index developed by Min et al. [44] was used to distinguish U. prolifera from Sargassum via use of RhoC slopes of the green and red bands. To reduce the impact of interference from seawater, the RhoC was used in SRG RhoC of Sargassum after removing RhoC of nearby seawater from the entire reflectance. The SRG of Sargassum is always >0 if the algae is present. It can be calculated as follows:
Third, the Sargassum Index (SI) developed by Dierssen et al. [45] was used, which uses the bands of 650 and 630 nm. Sargassum has the absorption feature at 630 nm, while other floating vegetation does not have this feature. Based on these features, this index can be used to distinguish Sargassum from other floating vegetation:
A pixel was flagged as Sargassum when the SI value was >1. In both DVI and SRG, RhoC,Green, RhoC,Red, and RhoC,NIR were used for 555 nm (band 6), 660 nm (band 8), and 865 nm (band 12), respectively. In addition, RhoC,650 nm and RhoC,630 nm were used for 660 nm (band 8) and 620 nm (band 7), respectively.
2.3.2. Machine Learning Models for Sargassum Detection
Table 3 shows an overview of the types of machine learning models used for Sargassum detection in this study. We used classification learner of MATLAB R2020b developed by MathWorks. Decision trees, SVM, and ensemble classifiers are representative machine learning algorithms that are used for both regression and classification. In particular, decision trees are easy to interpret, are fast in fit and prediction, and use less memory, but can be less accurate in prediction. Gini’s diversity index was used as the split criterion for the decision tree. The maximum number of splits was set to 100 with a short training time of only 10.79 s. SVM is a kernel-based machine learning model that specifies the kernel for the transformation of support vectors to feature space and determines the best hyperplane on which the transformed features can be classified by solving a quadratic optimization problem [46]. The Gaussian kernel function was selected with a kernel scale of 0.87. SVM took the longest time to train at 1914.36 s, which may be because ensemble classifiers mix the results of many weak learners in this method into one high-quality ensemble model. The adaptive boosting algorithm solves many of the practical challenges associated with previous boosting algorithms and is a method of learning that uses a sequence of multiple weak learners while weighting the incorrectly predicted data to improve errors [47]. This method may be less vulnerable to overfitting compared to other algorithms. Individual learners may be weak, but the performance of each learner is slightly better than that obtained by random guessing and the final model converges to produce strong learners. In this study, the Gentle Adaptive Boosting (GentleBoost) suggested by Friedman et al. [48] was selected as this algorithm minimizes the exponential loss and every weak learner fits a regression model to the response values. As shown in Table 3, the learner type selected for decision tree, with the maximum number of splits and learners set at 20 and 30, respectively. The learning rate was 0.1, and the training time was 124.82 s.
2.3.3. Performance Assessment
To evaluate the performance of Sargassum detection, traditional methods were qualitatively and quantitatively assessed and the machine learning models trained. The qualitative assessment involved visually comparing the ground truth Sargassum maps with the Sargassum maps generated through the three Sargassum indexes and the three machine learning models from the GOCI-II images taken on 27 January and 10 February 2021. A quantitative assessment of the performance was carried out using a confusion matrix to evaluate the accuracy of the Sargassum detection [49]. The sr and nsr symbols in Table 4 indicate the presence of Sargassum and non-Sargassum pixels in the ground truth Sargassum maps, respectively, while SR and nSR indicate Sargassum and non-Sargassum pixels in the predicted Sargassum maps, respectively.
Three figure-of-merits (FOMs), sensitivity, precision, and F-Measure, were calculated from the confusion matrix. The sensitivity ((1)/[(1)+(2)]) and precision ((1)/[(1)+(3)]) were evaluated using only Sargassum pixels from the ground truth and the predicted red tide maps. The F-measure, which is the harmonic mean of the precision and sensitivity, was evaluated using [49]:
3. Results
3.1. In Situ Sargassum Spectrum
Figure 5 shows in situ spectrum of the pure Sargassum endmember and the Sargassum containing seawater. The spectral signatures of Sargassum obtained in the field represent typical vegetation patterns with strong absorption feature at 650–685 nm that is associated with photosynthetic pigments and a peak at 675 nm that correlates with high NIR reflectance, which may be due to the internal organizational structures [50]. All vegetations have the common feature of red edge reflectance, but this is often not observed in marine environments because of the high absorption of water molecule at red and NIR wavelengths as reported in a previous study [44]. The spectra describing the Sargassum endmember (“Out of water”) showed similar patterns at 400–700 nm but considerable higher NIR reflectance above 700 nm than those obtained from Sargassum at the air–water interface (“In water”). In addition, Sargassum contains the accessory pigments chlorophyll c and fucoxanthin [51]. The absorption peaks of chlorophyll c appear at 460, 485, and 635 nm, while the in vivo absorption peaks of fucoxanthin appear at 480 and 520 nm. Hence, chlorophyll c and fucoxanthin both lead to high reflectance at red wavelengths. In particular, the Sargassum spectrum is characterized by a distinct dip at 632 nm that is due to the absorption of chlorophyll c at 630–635 nm [52,53]. However, if there is no specific wavelength band to reflect these optical features because the spectral resolution is wide, the band ratios or indexes that use these spectral features cannot be utilized for Sargassum detection.
3.2. Sargassum Spectrum from GOCI-II
Although the atmospheric correction product provided with GOCI-II is relatively accurate, hazy sky is known to interfere with Sargassum detection. Correcting for hazy conditions is almost impossible, and thus results obtained in such conditions require careful classification. Figure 6 shows the spectra of Sargassum-free water and Sargassum-containing pixels in clear and hazy conditions. Spectral analysis was performed using several randomly selected pixels from the surrounding waters and Sargassum slicks from GOCI-II RhoC images at 2 UTC on the 3rd (clear sky) and 10th (hazy sky) February 2021 on the northern coast of Jeju Island. As shown in Figure 5, the spectral shape obtained differs from those of the in situ Sargassum spectrum. However, the spectral shapes of both pixel groups possess a local ridge in the red band in both clear and hazy sky conditions. Note that due to the strong water absorption that occurs at wavelengths >600 nm, nearly all signals at >600 nm in the spectrum of the surrounding waters come from the atmosphere when this type of sediment-poor water is investigated in clear sky conditions unlike the results obtained under hazy sky. Some Sargassum pixels with increased reflectance are observed near the NIR region, but the majority of Sargassum pixels have decreased NIR reflectance. These results are similar to those reported by Qi and Hu [54], who examined the Sentinel-3 OLCI (Ocean and Land Colour Instrument) RhoC spectrum extracted from Sargassum-containing pixels and nearby Sargassum-free water pixels and found that it is difficult to visualize even the red-edge reflectance when the fractional coverage of Sargassum is low (~1–2%), and almost impossible to obtain spectral shapes at visible wavelengths.
Ideally, the RhoC spectrum of the Sargassum endmember, that is, a pixel that is completely covered by Sargassum, has the optical characteristics of elevated reflectance near the NIR wavelength, similar to the in situ Sargassum spectrum (Figure 5). Pure Sargassum pixels are rarely present. The spectral features of Sargassum patches or slicks that are smaller than the size of a pixel may not appear properly in an image. A pixel that receives a mixed signal over 250 m contains optical properties that are not associated with Sargassum. The GOCI-II spectra obtained therefore suggest that it is difficult to distinguish Sargassum from its surroundings meaning that an algorithm with good performance is required to detect it.
3.3. Traditional Methods and Machine Learning Models
Figure 7 shows the ground-truth and Sargassum maps that were generated through traditional methods and machine learning models using GOCI-II images that were obtained at 2 UTC on January 27 (clear sky) and February 10 (hazy sky) 2021 from the coast of Jeju. Reference to the ground-truth map indicates that Sargassum maps produced using traditional methods did not show appropriate patterns under either clear or hazy sky conditions. The results of the DVI in both cases tended to identify land areas as Sargassum and, particularly under hazy sky, thick clouds tended to be identified as Sargassum. The areas of Sargassum produced from the SRG were therefore overestimated in both cases. The maps produced by SI recognized some areas of Sargassum as land or thin cloud. On the other hand, the Sargassum maps that were estimated using machine learning models showed reasonable distributions as compared to the traditional methods. Fine Tree and Fine Gaussian SVM overestimated Sargassum areas under clear sky conditions, while the GentleBoost model appears to be the most accurate in producing a reasonable Sargassum distribution. However, while Fine Tree showed the most appropriate distribution in hazy sky conditions, Fine Gaussian SVM and GentleBoost showed a slight overestimation in terms of distribution under these conditions.
Table 5 shows the quantitative performance of the traditional methods and machine learning models using a validation dataset. In the case of the traditional methods, SRG showed the highest FOMs and DVI showed the lowest FOMs, with a sensitivity value of 94.1%, which is comparable to that of the machine learning models. However, SRG generated the highest number of false positives at 62.1%. Indeed, as shown in Figure 6, SRG significantly overestimated the distribution of Sargassum. On the other hand, the maps estimated by DVI and SI underestimated the extent of the Sargassum distribution with high false negatives and low sensitivities. Compared to the traditional methods, the FOMs of the machine learning models showed good results. Fine Gaussian SVM showed the highest sensitivity (98.9%) and F-Measure (0.84), whereas GentleBoost showed the highest precision (82.2%). In addition, GentleBoost had a lower false-positive rate (6.2%) and a high F-Measure level (0.82). We performed the performance evaluation according to atmospheric conditions, GentleBoost showed high F-Measure levels with 0.84 under clear sky and 0.9 under hazy sky conditions. Considering the quantitative and qualitative assessment, GentleBoost was selected as providing the optimal results.
4. Discussion
4.1. Comparison of Ocean Color Sensors
Table 6 shows the specifications of various ocean color sensors such as GOCI-II, GOCI-I, OLCI, MODIS, VIIRS, and MERIS. These sensors have low spatial resolution and a wide swath. Therefore, ocean color sensors are suitable for detection in broad areas. The revisit period is short than that of terrestrial sensors. In particular, due to geostationary satellite, GOCI-I and GOCI-II can obtain 8 and 10 images per day, respectively. The spectral ranges of ocean color sensors generally include the visible regions. GOCI-II showed improvement over other ocean color sensors in terms of temporal resolution and spatial resolution. In the case of the number of spectral wavelength bands, GOCI-II has four more bands than GOCI-I.
For verification of GOCI-II product, we compared VIIRS Rrs and GOCI-II Rrs because Rrs product is the end products through atmospheric correction (Figure 8). We used 865,656 pixel pairs of VIIRS Rrs and GOCI-II Rrs obtained from the six dates used in this study (Table 2). The pixel pairs were obtained in the Slot 7 of GOCI-II image. The 410, 443, 486, 551, and 671 nm of VIIRS wavelength bands matched with 412, 443, 490, 555, and 680 nm of GOCI-II bands, respectively. As a result of comparing the matched bands, the R2 of five wavelength bands showed a high value (0.79–0.97). The red wavelength bands showed the highest R2 level (0.97) and the lower RMSE (0.0006), while the shorter blue wavelength band showed the lower R2 level (0.79) and the highest RMSE (0.0016). Therefore, we judged that GOCI-II product provides scientifically reliable data compared to the verified VIIRS product.
These improvements of GOCI-II can affect the detection capability for Sargassum. First, the high temporal resolution of GOCI-II can compensate for the limitations associated with coarse resolution, which tends to increase cloud coverage and reduce the number of valid observations. Jo et al. [54] mentioned that the clouds around Jeju Island for approximately 330 days/year hinders the observation with ocean color sensor. Increasing the number of observations enables the acquisition of more valid pixels of Sargassum than other sensors. For example, compared to OLCI images acquired once a day, GOCI-II images can be obtained 10 times every day. To take advantage of this, the machine learning models in this study were trained using hourly GOCI-II images, but only six high-resolution images were used as ground truth. Because images were not available for 0, 1, and 8 h, seven images per day were used for training. It is thought that the training information for the model could be enriched if all 10 images could have been acquired.
In general, Sargassum moves in the form of a long slick or thin patch. Hence, the detection rate of Sargassum for a particular pixel is lower if the width of the patch is narrower than the spatial resolution of the image. For example, the lower detection limit of GOCI-I was estimated to be 1% for a 500 m pixel, which is equivalent to Sargassum approximately 10 m × 250 m in size. Compared to GOCI-I, the spatial resolution of GOCI-II is quadrupled from 500 to 250 m. This implies an increase in the detectable sensitivity to smaller patches with the lower detection limit reaching up to 4% for the same patch. Qi and Hu [55] expressed the subpixel coverage (0–100%) as a percentage of the pixel size rather than a physical area, although the coverage is equivalent for any satellite sensor with finite pixel size or spatial resolution. In the case of OLCI with a spatial resolution of 300 m, the red-edge reflectance is visual when the subpixel coverage of Sargassum reaches 5%. In fact, the spatial resolution of GOCI-II was higher than that of OLCI. There is a higher probability that red-edge reflectance will be observed using GOCI-II than OLCI when the same patch is observed. However, in our study, spectra with red-edge reflectance were extremely rare, indicating that most patches were small in size. Another advantage of fine spatial resolution is possible for early detection of Sargassum patches. For example, if Sargassum is detected 2 km away from a coastline, it will float to the shorelines in 5–6 h, as in the coastal currents around Jeju Island, because it typically moves at approximately 10 cm s−1. If operational removal teams know the exact location and extent of a Sargassum, the algae can be removed quickly, economically benefitting aquaculture, fisheries, tourism, and recreation activities in the area.
Figure 9a shows the average Sargassum spectrum acquired by GOCI-I RhoC at 2 UTC on 3 February 2021, which was acquired on the same date as the GOCI-II spectrum (Figure 6). Similar to the GOCI-II spectrum, some Sargassum pixels show increased reflectance near the NIR region. However, the majority showed decreased NIR reflectance. The average Sargassum spectra of GOCI-I and GOCI-II show similar patterns at all wavelengths (Figure 9b). Only four additional spectral bands showed slightly different patterns; 380, 510, 620, and 709 nm. To investigate the effects that the additional four bands had on the detection of Sargassum, the performance of the machine learning models was calculated using 8 and 12 bands, with results showing that the performances did not differ significantly when the additional bands were used. The FineTree, Fine Gaussian SVM, and GentleBoost models show F-measures of 0.8, 0.84, and 0.84, respectively, meaning that the additional GOCI-II bands do not significantly affect the detection rate of Sargassum. Indeed, the additional GOCI-II bands are of no use in detecting Sargassum. The wavelength band at 380 nm is used to detect dissolve organic matter (DOM), while the 510 and 620 nm bands are used to extract sediment loading. In particular, the 510 nm band can detect chlorophyll, turbidity, and red tides, and the 709 nm band is used to ascertain the chlorophyll fluorescence baseline and the atmospheric corrections. The characteristics of these bands, therefore, indicate that the increase in the number of bands does not affect Sargassum detection.
4.2. Limitations of Sargassum Indexes
Because Sargassum has the optical characteristics of typical vegetation, the same indices have been used for other types of floating algae such as U. prolifera. The reflectance of typical vegetation increases rapidly around 700 nm, known as the red edge. Hence, the difference between the red and the NIR bands is used as an index for vegetation. Normalization of the sum of red and NIR reflectance partially eliminate atmospheric effects. NDVI is a representative index that utilizes these characteristics and is therefore useful for identifying floating algae from the surrounding waters. However, the NDVI values are sensitive to observing and various environmental conditions, including solar/viewing geometry and aerosols. In other words, NDVI suffers from sensor dependency, thin clouds, and atmospheric effects. These conditions cause problems in visualization and quantitative analysis because they affect the absolute NDVI values as well as the visual contrast between floating algae and nearby waters in the NDVI imagery.
Manual delineation interactive color stretching of the region of interest is useful in mitigating these issues [56], meaning that these processes are generally implemented in routine applications. To overcome these difficulties, several indexes, such as the DVI and the enhanced vegetation index (EVI), have been proposed [57]. Nevertheless, these indices also show deficiencies that are similar to those that affect the NDVI. Hu et al. [37] found that in the case of clear sky, floating algae looks like green slicks in MODIS images, while it is barely visible when the atmosphere is hazy. They developed a floating algae index (FAI) that is less sensitive to changes in environmental and observing conditions as most of the atmospheric effects are removed. Hence, FAI imagery derived from various sensors can be used for mapping floating algae in a variety of environments. However, FAI cannot be used with GOCI-II because it is calculated using the SWIR wavelength band. In fact, we found that Sargassum slicks or patches were not visible in the GOCI-II true-color RGB image near the coasts of Jeju Island, even when the atmosphere was clear, because of the weak signal of Sargassum. As shown in Figure 3, it is quite difficult to distinguish between Sargassum spectra when it is mixed with ambient signals from the surrounding water.
To overcome this, the SRG index was developed, for which seawater was subtracted from the Sargassum spectrum. However, we found that it was not suitable for use with GOCI-II images because of its dependence on a threshold. SI uses information from the wavelength 620 nm, which is not applicable in GOCI-I, but can be used with GOCI-II. In fact, most of the Sargassum spectra observed in this wavelength band showed no difference from the surrounding waters, indicating that the Sargassum distribution was poor as shown in Figure 7. Sargassum indices, therefore, showed low performance in our study. To investigate how the wavelength bands used in these indexes affect Sargassum detection, we calculated the performance of models with eight bands, not including those at 555, 620, 660, and 865 nm. The resulting performances of the three models were very low, with F-Measures of 0.22 (Fine Tree), 0.15 (Fine Gaussian SVM), and 0.08 (GentleBoost). These results suggest that the wavelength bands played an important role in Sargassum detection when a machine learning model is used, even though visually noticeable spectral features are not observed at these wavelengths.
4.3. Performance of Machine Learning Models
To alternate threshold-based Sargassum indexes, we attempted to train machine learning models for Sargassum detection. Of the three models used in this study, the decision-tree model had the fastest training time of 10.79 s. In decision tree, the finer the tree, the more complex the model, and the more prone the model is to overfitting. We, therefore, pre-constrained the size of the tree to 100. The Leafy Fine tree model typically had very high accuracy during training, but with independent datasets, tree accuracy may not be comparable. In our fine tree model, the performances of the training and validation datasets were similar. On the other hand, a coarse tree did not have high training accuracy. In practice, coarse tree models that were trained with the validation dataset had 9.9% lower F-Measure and 18.1% lower precision than the fine tree model. Furthermore, Sargassum maps generated with the fine tree model are shown to have a more reasonable distribution than those produced with the coarse tree model.
SVM has been used in many studies as a classification technique that works well with various data distributions. However, the disadvantage is that the intuitive interpretation of the results is difficult compared to the decision-tree model. We trained a Fine Gaussian SVM for Sargassum detection. In fact, it is known that Gaussian SVM can resolve non-linear problems with high performance, while it has more difficult interpretability and lower model flexibility than linear SVM. Nevertheless, when we trained SVM with our dataset, the result of the Fine Gaussian SVM was better than that of the linear SVM with 83.9% sensitivity, 54.6% precision, and an F-Measure of 0.66, while coarse Gaussian SVM showed a lower performance than Fine Gaussian SVM (with 80.6% sensitivity, 54.6% precision, and an F-Measure of 0.65). These results indicate that our dataset had fairly non-linear features and that the Fine Gaussian SVM was the best fit for our data among the SVM models.
Practically, Adaptive Boost is simple, easy, and fast to program [46]. Because prior knowledge of weak learners is not required, it is flexible to combine with other methods for finding weak hypotheses. Lastly, it comes with a theoretical set of assurances with enough data and a weak learner that only accurate and weak hypotheses can be reliably provided. Meanwhile, the actual performance of boosting for a particular problem depends on the weak learner and the data. Boosting also seems to be especially susceptible to noise [58]. An important property of Adaptive Boost is the ability to figure out outliers, i.e., incorrectly labeled or innately equivocal and difficult to classify in training data. Because Adaptive Boost focuses on the most difficult examples, instances with the highest weight are often shown as outliers. When the number of outliers is very high, focusing on a difficult instance can degrade the performance of Adaptive Boost. Friedman et al. [45] proposed a variant of Adaptive Boost, called “Gentle Adaptive Boost (GentleBoost)” which emphasizes outliers less. We found that GentleBoost performed better than the Adaptive Boost model, particularly in terms of precision, with GentleBoost 15.45% higher than Adaptive Boost. Even the number of false positives (12.7%) was approximately twice as low when using GentleBoost (6.2%). GentleBoost, which focuses less on the outliers in our dataset, is therefore better under the conditions of this study.
The performance assessment of the machine learning models was successful. Nevertheless, several factors can affect the performance when predicting Sargassum maps with machine learning models. First, the coarse resolution of GOCI-II may affect the performance of the models. Of course, the 250 m spatial resolution of GOCI-II is a vast improvement on ocean color sensors, but thin patches of Sargassum still have weak optical signals when using coarse pixels, and a signal may not appear. In addition, Sargassum sinks under the water when moving from the ECS to the coast of Jeju Island, also weakening the Sargassum signal. Second, discrepancies in the time at which GOCI-II images and ground truth images are acquired can affect the performance. We used GOCI-II images at 1, 2, 4, 6, and 7 UTC for training. However, the ground truth images with high resolution were acquired at approximately 2 UTC and the validation dataset used GOCI-II images at 3 and 5 UTC. In fact, these images observed the movement of Sargassum over time, although there was no visual change observed in the coarse pixels. However, the difference in the image acquisition time may also affect the performance because the machine learning model is learned from the spectral information of each pixel.
5. Conclusions
In this study, a novel method was introduced to detect the Sargassum on the coast of Jeju Island from GOCI-II images within the first 6 months. The significant results are as follows:
(1) Comparison between the machine learning models and the traditional methods indicated that the former outperformed the latter. In particular, GentleBoost, a variant of Adaptive Boost, showed the best performance, both qualitatively and quantitatively.
(2) GOCI-II imagery has advantages in terms of spatial resolution (250 m), spectral wavelength bands (12 bands), and temporal resolution (10 times/day). The fine spatial resolution of GOCI-II enables early detection of Sargassum, meaning that it can be removed before reaching the shore. Thus, GOCI-II allows more frequent observation of Sargassum and increase the chance of finding Sargassum patches.
Our research results could be a good case study for an upcoming new space mission. The Geosynchronous Littoral Imaging and Monitoring Radiometer (GLIMR) with a hyperspectral sensor will be launched in 2026 (NASA Targets Coastal Ecosystems with New Space Sensor|NASA). The machine learning model demonstrated in this study can also be helpful for the GLIMR. Therefore, this study could shed light on how measurements by different satellites with varying spatial, temporal, and spectral resolutions can be used to estimate the extent and location of harmful marine organisms by using machine learning algorithms.
Author Contributions
Conceptualization, J.S. and Y.-H.J.; funding acquisition, B.-K.K., L.-H.J. and J.L.; methodology, J.S.; investigation, J.-S.L.; supervision, Y.-H.J.; writing—original draft, J.S.; writing—review and editing, J.S. and Y.-H.J. All authors have read and agreed to the published version of the manuscript.
Funding
This study was supported in part by the project titled “UAV-based marine Safety, Illegal Fishing and Marine Ecosystem Management Technology Development”, and the project titled “Technology development for Practical Applications of Multi-Satellite data to maritime issues” funded by the Ministry of Oceans and Fisheries, Korea.
Acknowledgments
The authors thank the Ministry of Oceans and Fisheries (MOF) for providing red tide information.
Conflicts of Interest
The authors declare no conflict of interest.
References
- Hu, Z.M.; Uwai, S.; Yu, S.H.; Komatsu, T.; Duan, D.L. Phylogeographic heterogeneity of the brown macroalga Sargassum horneri (Fucaceae) in the northwestern Pacific in relation to late Pleistocene glaciation and tectonic configurations. Mol. Ecol. 2011, 20, 3894–3909. [Google Scholar] [CrossRef]
- Zhang, J.H.; Ding, X.W.; Zhuang, M.M.; Wang, S.Y.; Chen, L.; Shen, H.; He, P.M. An increase in new Sargassum (Phaeophyceae) blooms along the coast of the East China Sea and Yellow Sea. Phycologia 2019, 58, 374–381. [Google Scholar] [CrossRef]
- Zhuang, M.; Liu, J.; Ding, X.; He, J.; Zhao, S.; Wu, L.; Gao, S.; Zhao, C.; Liu, D.; Zhang, J.; et al. Sargassum blooms in the East China Sea and Yellow Sea. Mar. Pollut. Bull. 2021, 162, 111845. [Google Scholar] [CrossRef]
- Qi, L.; Hu, C.; Wang, M.; Shang, S.; Wilson, C. Floating algae blooms in the East China Sea. Geophy. Res. Lett. 2017, 44, 11501–11509. [Google Scholar] [CrossRef]
- Press Release Provided by the Ministry of Oceans and Fisheries in Korea. Available online: https://www.korea.kr/news/pressReleaseView.do?newsId=156448342 (accessed on 30 October 2021).
- Webster, R.K.; Linton, T. Development and implementation of Sargassum early advisory system (SEAS). Shore Beach 2013, 81, 1. [Google Scholar]
- Kim, K.; Shin, J.; Kim, K.Y.; Ryu, J.H. Long-term trend of green and golden tide in the eastern Yellow Sea. J. Coast. Res. 2019, SI90, 317–323. [Google Scholar] [CrossRef]
- Gower, J.F.R.; King, S.A. Distribution of floating Sargassum in the Gulf of Mexico and the Atlantic Ocean mapped using MERIS. Int. J. Remote Sens. 2011, 32, 1917–1929. [Google Scholar] [CrossRef]
- Gower, J.; King, S. The distribution of pelagic Sargassum observed with OLCI. Int. J. Remote Sens. 2019, 41, 5669–5679. [Google Scholar] [CrossRef]
- Wang, M.; Hu, C. Mapping and quantifying Sargassum distribution and coverage in the Central West Atlantic using MODIS observations. Remote Sens. Environ. 2016, 183, 350–367. [Google Scholar] [CrossRef]
- Wang, M.; Hu, C. On the continuity of quantifying floating algae of the Central West Atlantic between MODIS and VIIRS. Int. J. Remote Sens. 2018, 39, 3852–3869. [Google Scholar] [CrossRef]
- Wang, M.; Hu, C.; Barnes, B.B.; Mitchum, G.; Lapointe, B.; Montoya, J.P. The great Atlantic Sargassum belt. Science 2019, 365, 83–87. [Google Scholar] [CrossRef]
- Gower, J.; King, S.; Borstad, G.; Brown, L. Detection of intense plankton blooms using the 709 nm band of the MERIS imaging spectrometer. Int. J. Remote Sens. 2005, 26, 2005–2012. [Google Scholar] [CrossRef]
- Gower, J.; Hu, C.; Borstad, G.; King, S. Ocean Color Satellites Show Extensive Lines of Floating Sargassum in the Gulf of Mexico. IEEE Trans. Geosci. Remote Sens. 2006, 44, 3619–3625. [Google Scholar] [CrossRef]
- Gower, J.; King, S. Satellite images show the movement of floating Sargassum in the Gulf of Mexico and Atlantic Ocean. Nat. Prec. 2008. [Google Scholar] [CrossRef]
- Gower, J.; Young, E.; King, S. Satellite images suggest a new Sargassum source region in 2011. Remote Sens. Lett. 2013, 4, 764–773. [Google Scholar] [CrossRef]
- Xing, Q.; Hu, C. Mapping macroalgal blooms in the Yellow Sea and East China Sea using HJ-1 and Landsat data: Application of a virtual baseline reflectance height technique. Remote Sens. Environ. 2016, 178, 113–126. [Google Scholar] [CrossRef]
- Xing, Q.; Guo, R.; Wu, L.; An, D.; Cong, M.; Qin, S.; Li, X. High-resolution satellite observations of a new hazard of golden tides caused by floating Sargassum in winter in the Yellow Sea. IEEE Geosci. Remote Sens. Lett. 2017, 178, 113–126. [Google Scholar] [CrossRef]
- Hardy, R.F.; Hu, C.; Witherington, B.; Lapointe, B.; Meylan, A.; Peebles, E.; Meirose, L.; Hirama, S. Characterizing a sea turtle developmental habitat using Landsat observations of surface-pelagic drift communities in the eastern Gulf of Mexico. IEEE J. Sel. Top. Appl. Earth Obs. Remote Sens. 2018, 11, 3646–3659. [Google Scholar] [CrossRef]
- Hedley, J.D.; Roelfsema, C.; Brando, V.; Giardino, C.; Kutser, T.; Phinn, S.; Mumby, P.J.; Barrilero, O.; Laporte, J.; Koetz, B. Coral reef applications of Sentinel-2: Coverage, characteristics, bathymetry and benthic mapping with comparison to Landsat 8. Remote Sens. Environ. 2018, 216, 598–614. [Google Scholar] [CrossRef]
- Hu, C.; Murch, B.; Barnes, B.B.; Wang, M.; Maréchal, J.P.; Franks, J.; Lapointe, B.E.; Goodwin, D.; Schell, J.; Siuda, A. Sargassum watch warns of incoming seaweed. Eos 2016, 97, 10–15. [Google Scholar] [CrossRef] [Green Version]
- Wang, M.; Hu, C. Automatic Extraction of Sargassum Features from Sentinel-2 MSI Images. IEEE Trans. Geosci. Remote Sens. 2020, 59, 2579–2597. [Google Scholar] [CrossRef]
- Kim, S.M.; Shin, J.; Baek, S.; Ryu, J.H. U-Net convolutional neural network model for deep red tide learning using GOCI. J. Coast. Res. 2019, SI90, 302–309. [Google Scholar] [CrossRef]
- Qiu, Z.; Li, Z.; Bilal, M.; Wang, S.; Sun, D.; Chen, Y. Automatic method to monitor floating macroalgae blooms based on multilayer perceptron: Case study of Yellow Sea using GOCI images. Opt. Express 2018, 26, 26810–26829. [Google Scholar] [CrossRef]
- Shin, J.; Kim, S.M.; Ryu, J.H. Machine learning approaches for quantifying Margalefidinium polykrikoides bloom from airborne hyperspectral imagery. J. Coast. Res. 2019, 90, 202–207. [Google Scholar] [CrossRef]
- Shin, J.; Jo, Y.H.; Ryu, J.H.; Khim, B.K.; Kim, S.M. High spatial red tide detection in the Southern Coast of Korea using U-Net from PlanetScope imagery. Sensors 2021, 21, 4447. [Google Scholar] [CrossRef]
- Wang, S.; Liu, L.; Qu, L.; Yu, C.; Sun, Y.; Gao, F.; Dong, J. Accurate Ulva prolifera regions extraction of UAV images with superpixel and CNNs for ocean environment monitoring. Neurocomputing 2019, 348, 158–168. [Google Scholar] [CrossRef]
- Minsky, M.; Papert, S.A. Perceptrons: An Introduction to Computational Geometry; MIT Press: Cambridge, MA, USA, 2017. [Google Scholar]
- Zhang, Q.; Yang, L.T.; Chen, Z.; Li, P. A survey on deep learning for big data. Inf. Fusion 2018, 42, 146–157. [Google Scholar] [CrossRef]
- Cuevas, E.; Uribe-Martínez, A.; Liceaga-Correa, M.D.L.Á. A satellite remote-sensing multi-index approach to discriminate pelagic Sargassum in the waters of the Yucatan Peninsula, Mexico. Int. J. Remote Sens. 2018, 39, 3608–3627. [Google Scholar] [CrossRef]
- Chen, Y.; Wan, J.; Zhang, J.; Zhao, J.; Ye, F.; Wang, Z.; Liu, S. Automatic Extraction Method of Sargassum Based on Spectral-Texture Features of Remote Sensing Images. In Proceedings of the IGARSS 2019–2019 IEEE International Geoscience and Remote Sensing Symposium, Yokohama, Japan, 28 July–2 August 2018. [Google Scholar]
- Arellano-Verdejo, J.; Lazcano-Hernandez, H.E.; Cabanillas-Terán, N. ERISNet: Deep neural network for Sargassum detection along the coastline of the Mexican Caribbean. PeerJ 2019, 7, e6842. [Google Scholar] [CrossRef] [Green Version]
- Kim, C.H. A review of the yellow sea circulation models. Ocean Res. 1998, 20, 325–335. [Google Scholar]
- Hsueh, Y.; Romea, R.D.; Dewitt, P.W. Wintertime winds and coastal sealevel fluctuations in the northeast china sea. Part II: Numerical model. J. Phys. Oceanogr. 1986, 16, 241–261. [Google Scholar] [CrossRef] [Green Version]
- Naimie, C.E.; Blain, C.A.; Lynch, D.R. Seasonal mean circulation in the Yellow Sea—A model-generated climatology. Cont. Shelf Res. 2001, 21, 667–695. [Google Scholar] [CrossRef]
- Korea Hydrographic and Oceanographic Agency (KHOA). Available online: http://khoa.go.kr (accessed on 30 October 2021).
- Hu, C. A novel ocean color index to detect floating algae in the global oceans. Remote Sens. Environ. 2009, 113, 2118–2129. [Google Scholar] [CrossRef]
- Qi, L.; Hu, C.; Mikelsons, K.; Wang, M.; Lance, V.; Sun, S.; Barnes, B.B.; Zhao, J.; der Zande, D.V. In search of floating algae and other organisms in global oceans and lakes. Remote Sens. Environ. 2020, 239, 111659. [Google Scholar] [CrossRef]
- Korea Ocean Satellite Center (KOSC). Available online: http://kosc.kiost.ac.kr (accessed on 30 October 2021).
- U.S. Geological Survey. Available online: http://glovis.usgs.gov (accessed on 30 October 2021).
- Copernicus Open Access Hub. Available online: https://scihub.copernicus.eu (accessed on 30 October 2021).
- Mobley, C.D. Estimation of the remote-sensing reflectance from above-surface measurements. Appl. Opt. 1999, 38, 7442–7455. [Google Scholar] [CrossRef] [PubMed]
- Richardson, A.J.; Wiegand, C.L. Distinguishing vegetation from soil background information. Photogram. Eng. Remote Sens. 1977, 43, 1541–1552. [Google Scholar]
- Min, S.H.; Hwang, J.D.; Oh, H.J.; Son, Y.B. Reflectivity characteristics of the green and golden tides from the Yellow Sea and East China Sea. J. Coast. Res. 2019, SI90, 310–316. [Google Scholar] [CrossRef]
- Dierssen, H.M.; Chlus, A.; Russell, B. Hyperspectral discrimination of floating mats of seagrass wrack and the macroalgae Sargassum in coastal waters of Greater Florida Bay using airborne remote sensing. Remote Sens. Environ. 2015, 167, 247–258. [Google Scholar] [CrossRef]
- Vapnik, V. The Nature of Statistical Learning Theory; Springer: New York, NY, USA, 1995. [Google Scholar]
- Freund, Y.; Schapire, R.; Abe, N. A short introduction to boosting. J. Jpn. Soc. Artif. Intell. 1999, 14, 771–780. [Google Scholar]
- Friedman, J.; Hastie, T.; Tibshirani, R. Additive logistic regression: A statistical view of boosting (with discussion and a rejoinder by the authors). Ann. Stat. 2000, 28, 337–407. [Google Scholar] [CrossRef]
- Kohavi, R. Glossary of terms. Mach. Learn. 1998, 30, 127–132. [Google Scholar]
- Gitelson, A.; Merzlyak, M.N. Spectral reflectance changes associated with autumn senescence of Aesculus hippocastanum L. and Acer platanoides L. leaves. Spectral features and relation to chlorophyll estimation. J. Plant Physiol. 1994, 143, 286–292. [Google Scholar] [CrossRef]
- Johnsen, G.; Sakshaug, E. Bio optical characteristics of PSII and PSI in 33 species (13 pigment groups) of marine phytoplankton, and the relevance for pulse amplitude-modulated and fast-repetition-rate fluorometry1. J. Phycol. 2007, 43, 1236–1251. [Google Scholar] [CrossRef]
- Beach, K.S.; Borgeas, H.B.; Nishimura, N.J.; Smith, C.M. In vivo absorbance spectra and the ecophysiology of reef macroalgae. Coral Reefs 1997, 16, 21–28. [Google Scholar] [CrossRef]
- Grzymski, J.; Johnsen, G.; Sakshaug, E. The significance of intracellular self-shading on the bio-optical properties of brown, red, and green macroalgae. J. Phycol. 1997, 33, 408–414. [Google Scholar] [CrossRef]
- Jo, Y.H.; Kim, D.W.; Kim, H. Chlorophyll concentration derived from microwave remote sensing measurements using artificial neural network algorithms. J. Mar. Sci. 2018, 26, 102–110. [Google Scholar]
- Qi, L.; Hu, C. To what extent can Ulva and Sargassum be detected and separated in satellite imagery? Harmful Algae 2021, 103, 102001. [Google Scholar] [CrossRef]
- Hu, C.; He, M.X. Origin and offshore extent of floating algae in Olympic sailing area. Eos Trans. AGU 2008, 89, 302–303. [Google Scholar] [CrossRef]
- Huete, A.; Justice, C.; Van Leeuwen, W. MODIS vegetation index (MOD13). Algorithm Theor. Basis Doc. 1999, 3, 295–309. [Google Scholar]
- Dietterich, T.G. An experimental comparison of three methods for constructing ensembles of decision trees: Bagging, boosting, and randomization. Mach. Learn. 2000, 40, 139–157. [Google Scholar] [CrossRef]
Figure 1.
(a) Sargassum biomass affecting Pyropia yezoensis aquaculture area in the Yellow Sea (YS) [3]; (b) Sargassum patches in the East China Sea (ECS); (c) Sargassum biomass comes into Samyang Beach in Jeju Island [4]; (d) pre-collection of Sargassum biomass around the Korean Peninsula [4].
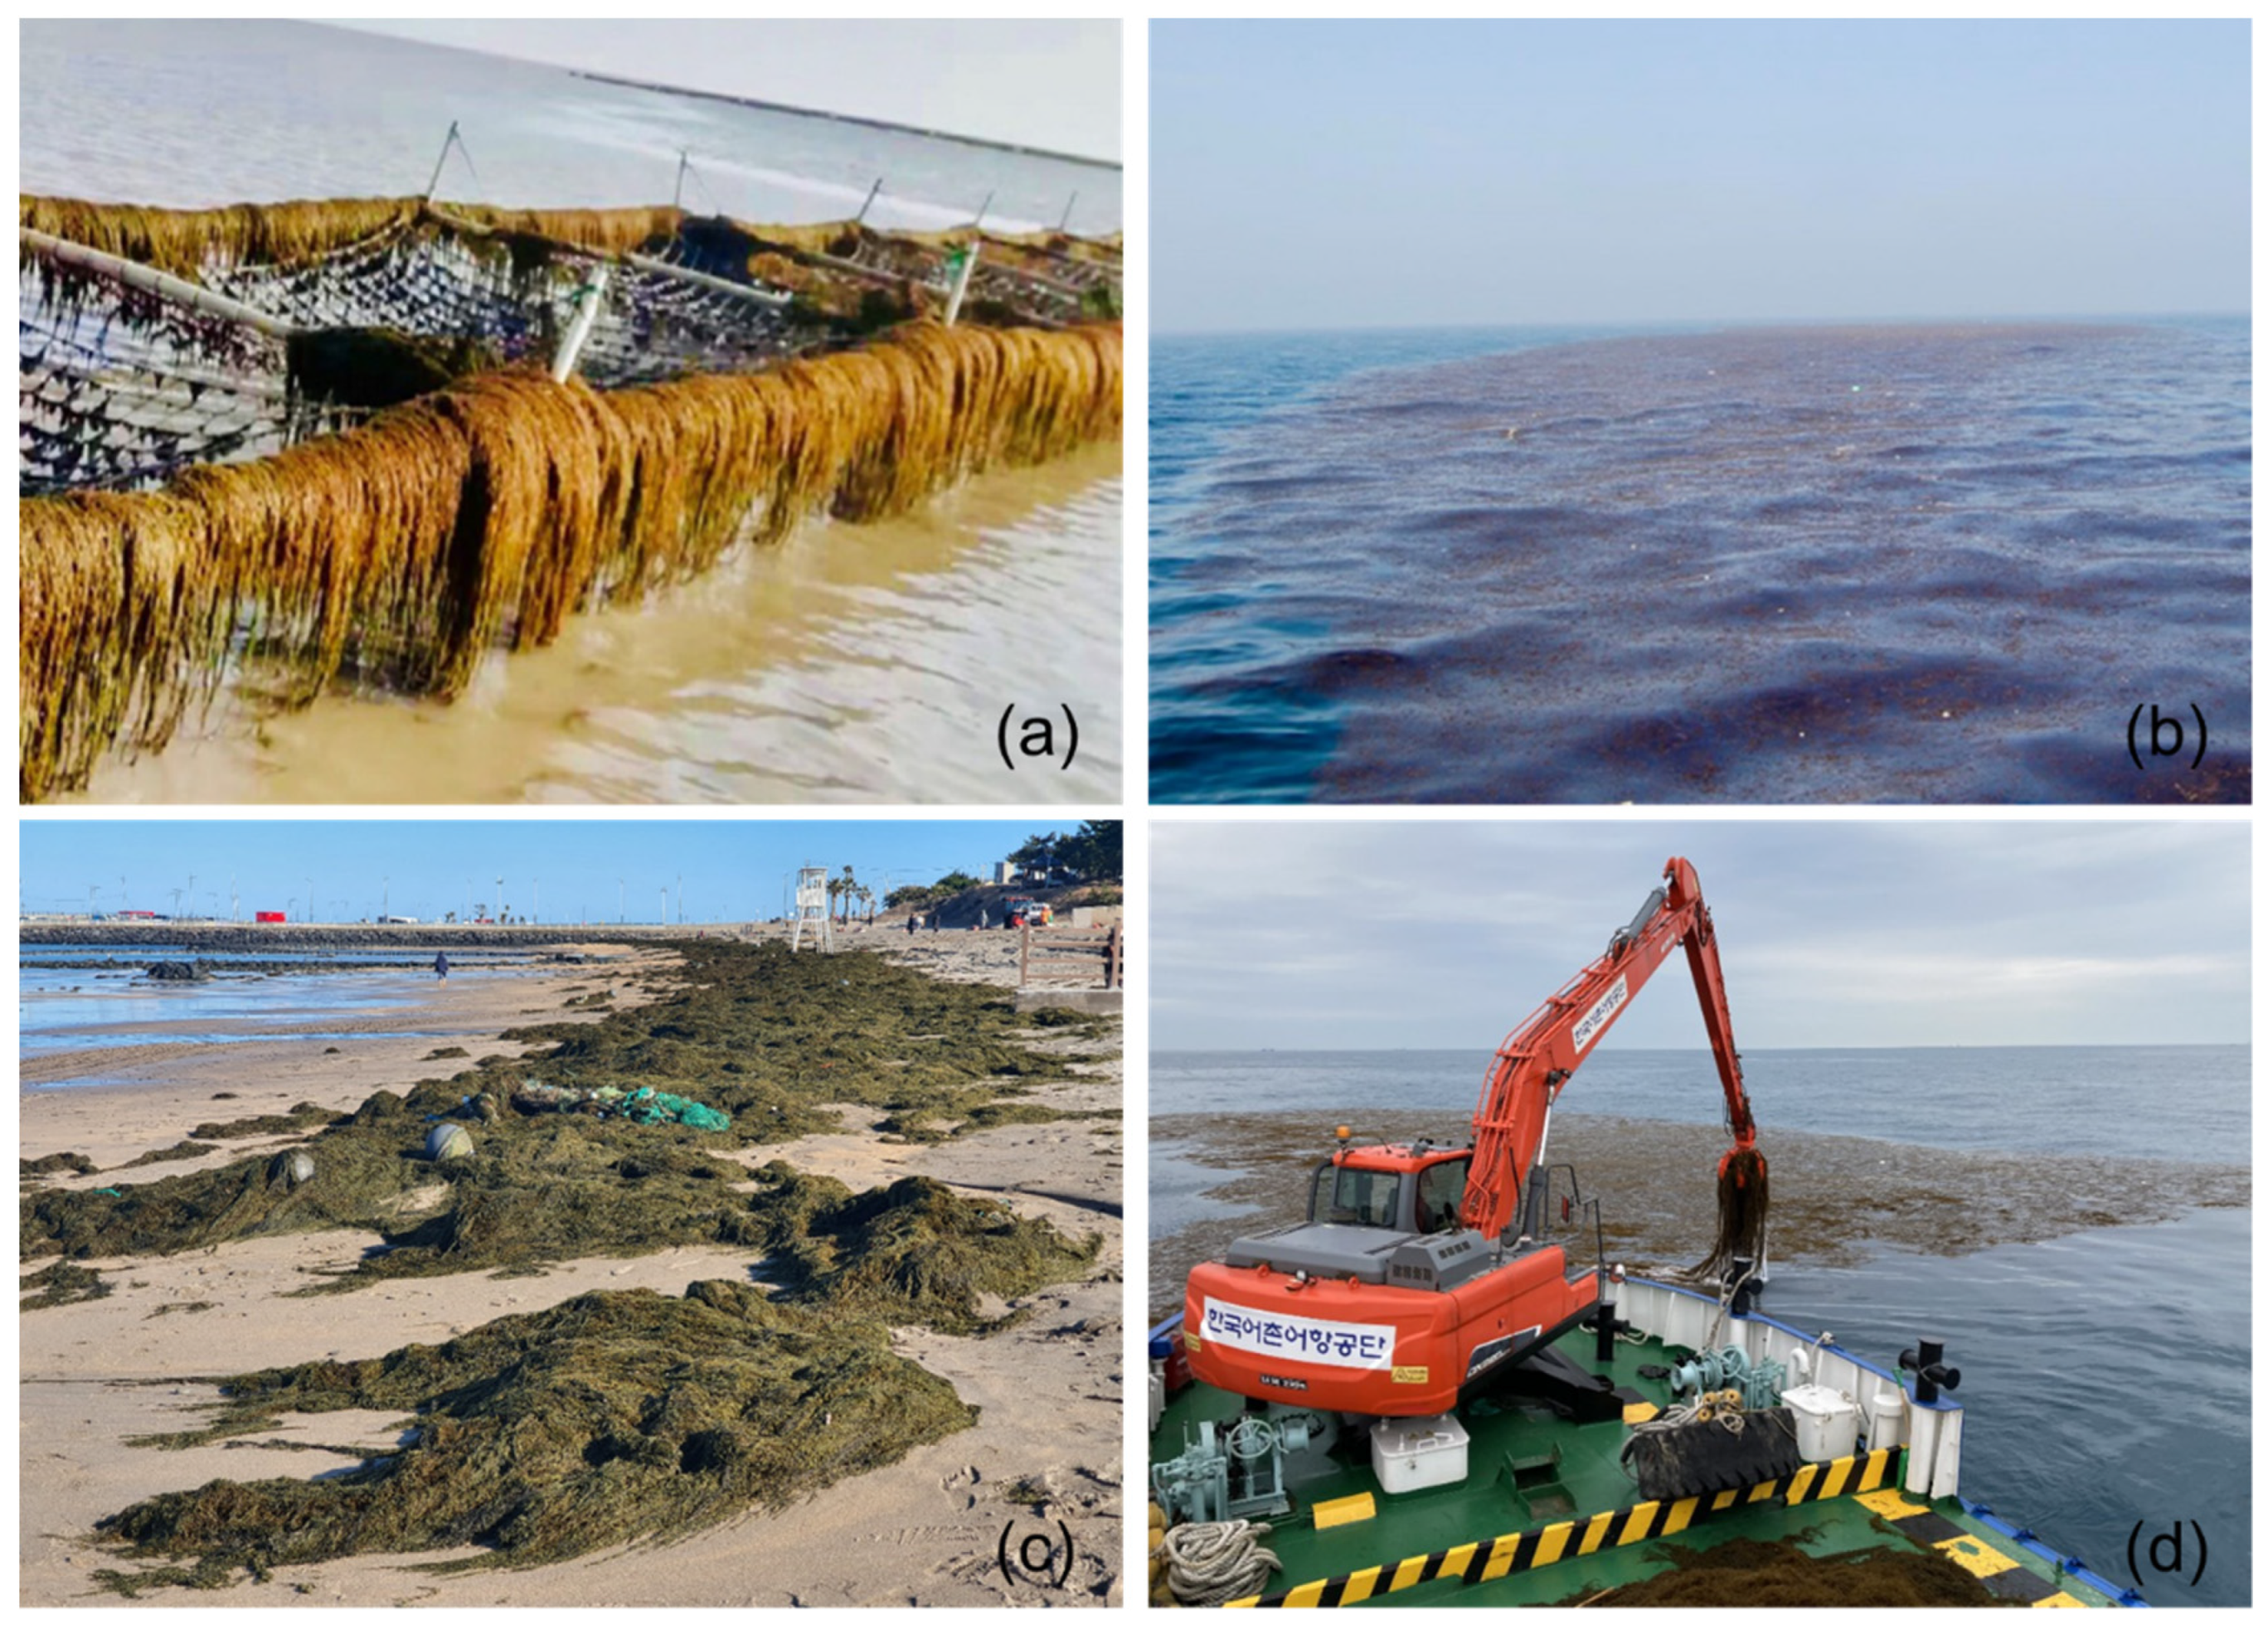
Figure 2.
The study area covers the coast near Jeju Island, which belongs to the Yellow Sea (YS) and the ECS. The black dotted box shows the area covered by GOCI-II Slot 7, and the black boxes represent the acquisition areas of Landsat OLI (Path 115 row 37 and path 116 row 37) and Sentinel-2 MSI (T52SBC) near Jeju Island in Korea.
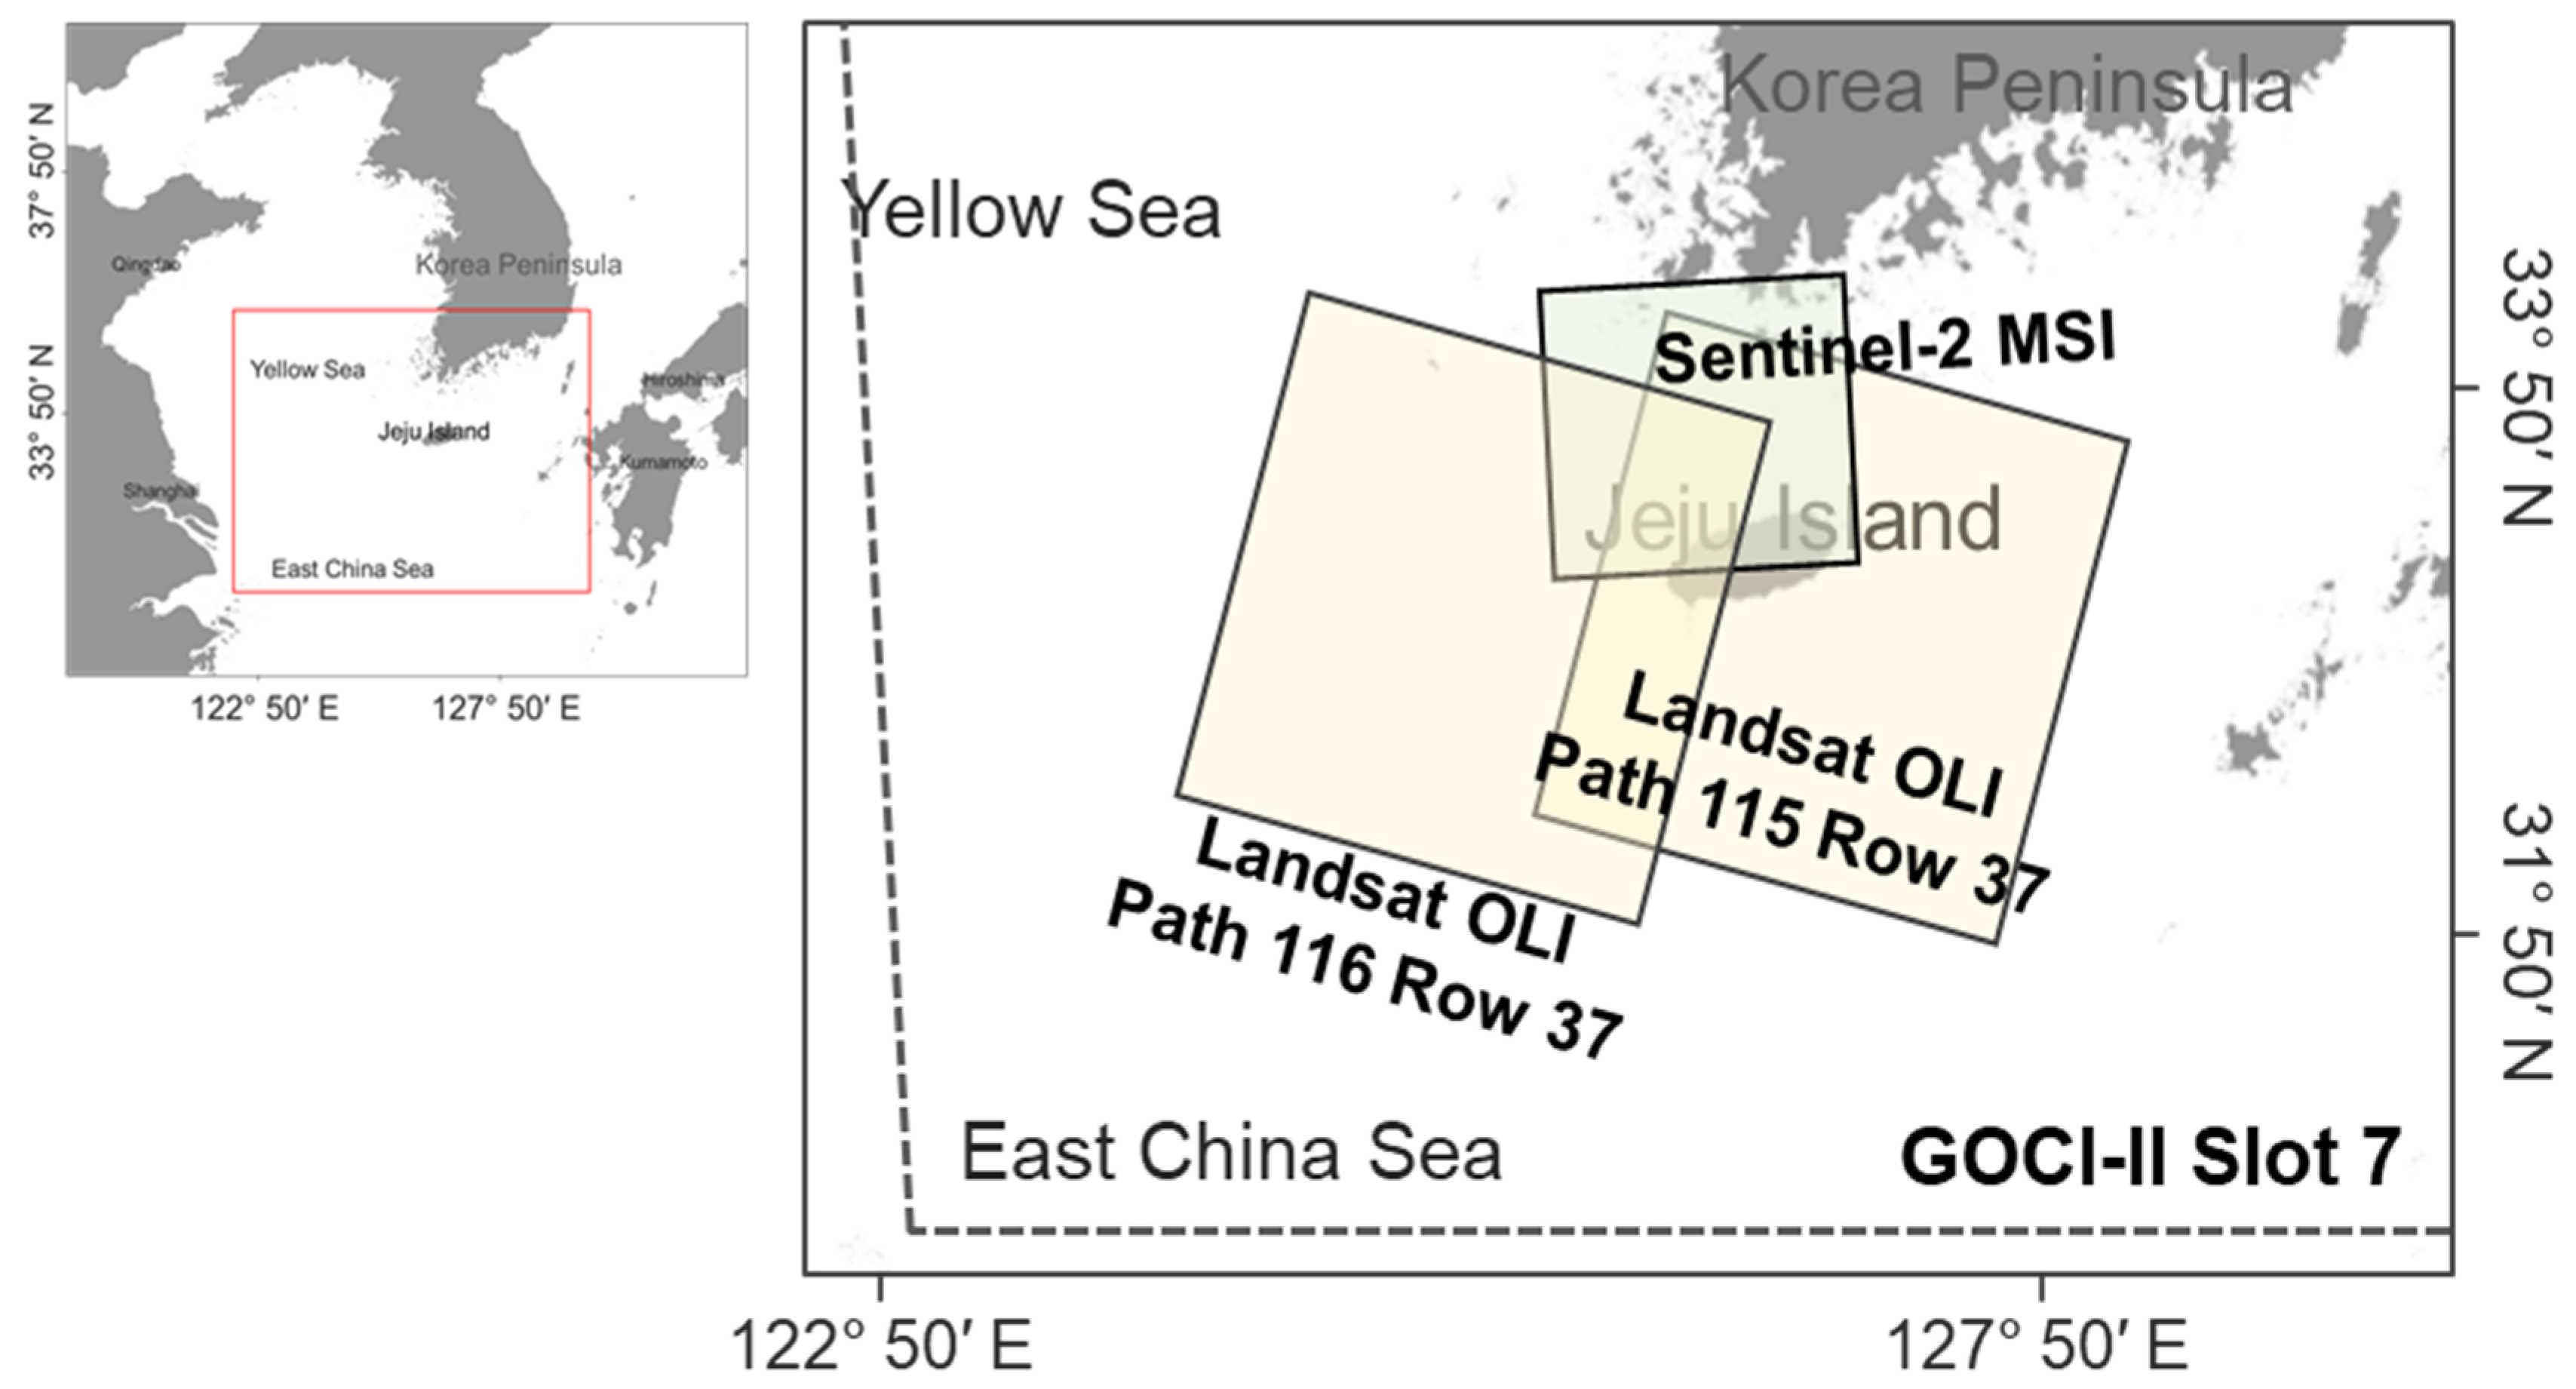
Figure 3.
Rayleigh-corrected reflectance (RhoC) Sentinel-2 MSI true-color composite image (R: 665 nm, G: 560 nm, B: 490 nm) acquired near the northern coast of Jeju Island on 27 January 2021. Sargassum is observed as black slicks in the water (yellow arrows). Locations of field surveys measuring Sargassum ((a). Samyang-dong Beach; (b). Samyang Beach; (c). Shinchon Beach; (d). Jukdo Beach; (e) Shinheung-lee Beach). Spectral measurements were performed on the Sargassum Sinchon Beach. These photos were obtained during field survey from 17 to 19 February 2021.

Figure 4.
Schematic diagram of the procedure used for detecting Sargassum. (a) Training step for machine learning models; (b) validation step for the evaluation of machine learning models and traditional methods. Training and validation dataset were composed of GOCI-II RhoC images with 12 wavelength spectral bands as input and ground truth data from OLI or MSIs as output (refer to Table 2).

Figure 5.
(a) Remote sensing reflectance spectra of pure Sargassum Endmember (Min et al., 2019) and Sargassum containing seawater measured on the coast of Jeju Island in Korea; (b) enlarged view of dotted oval in Figure 4a. Note the local reflectance minimum at around 632 nm (black arrow) that results from chlorophyll c pigment absorption, and the difference between the enhanced reflectance between 580 and 650 nm (dotted oval) and the reflectance below 550 nm.
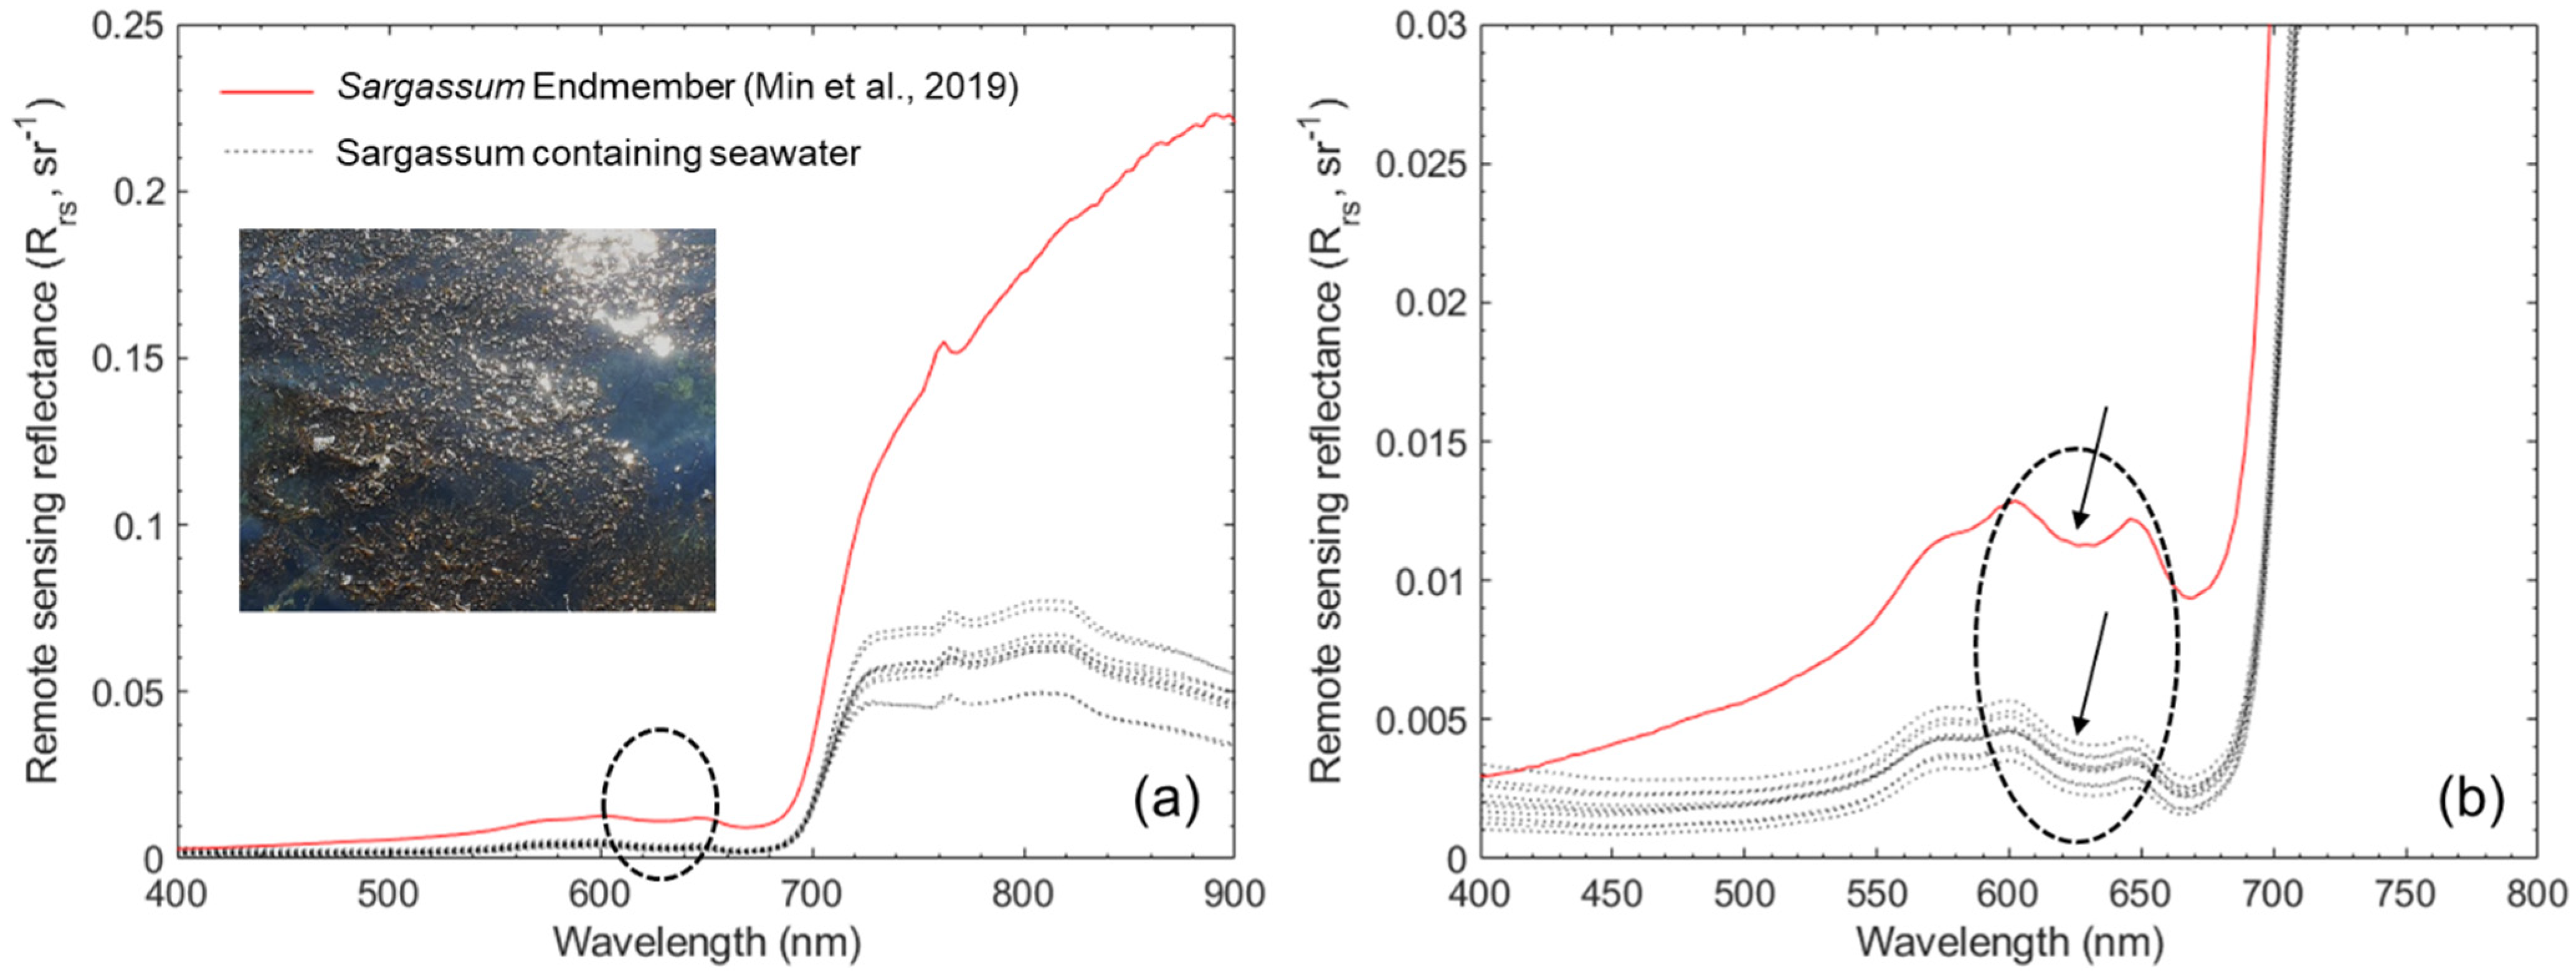
Figure 6.
GOCI-II Rayleigh-corrected spectral reflectance (RhoC (λ)) of Sargassum-free water and Sargassum-containing pixels 2 UTC on 3rd ((a): clear sky) and 10th ((b): hazy sky) February 2021 at the locations shown in Figure 3.
Figure 6.
GOCI-II Rayleigh-corrected spectral reflectance (RhoC (λ)) of Sargassum-free water and Sargassum-containing pixels 2 UTC on 3rd ((a): clear sky) and 10th ((b): hazy sky) February 2021 at the locations shown in Figure 3.

Figure 7.
Ground-truth maps and Sargassum maps generated using traditional methods and machine learning models from GOCI-II images obtained on 27 January ((a): clear sky) and 10 February ((b): hazy sky) near the coast of Jeju in Korea. Traditional methods include DVI, SRG, and SI (upper). Fine Tree, Fine Gaussian SVM, and GentleBoost are the results of machine learning (lower).
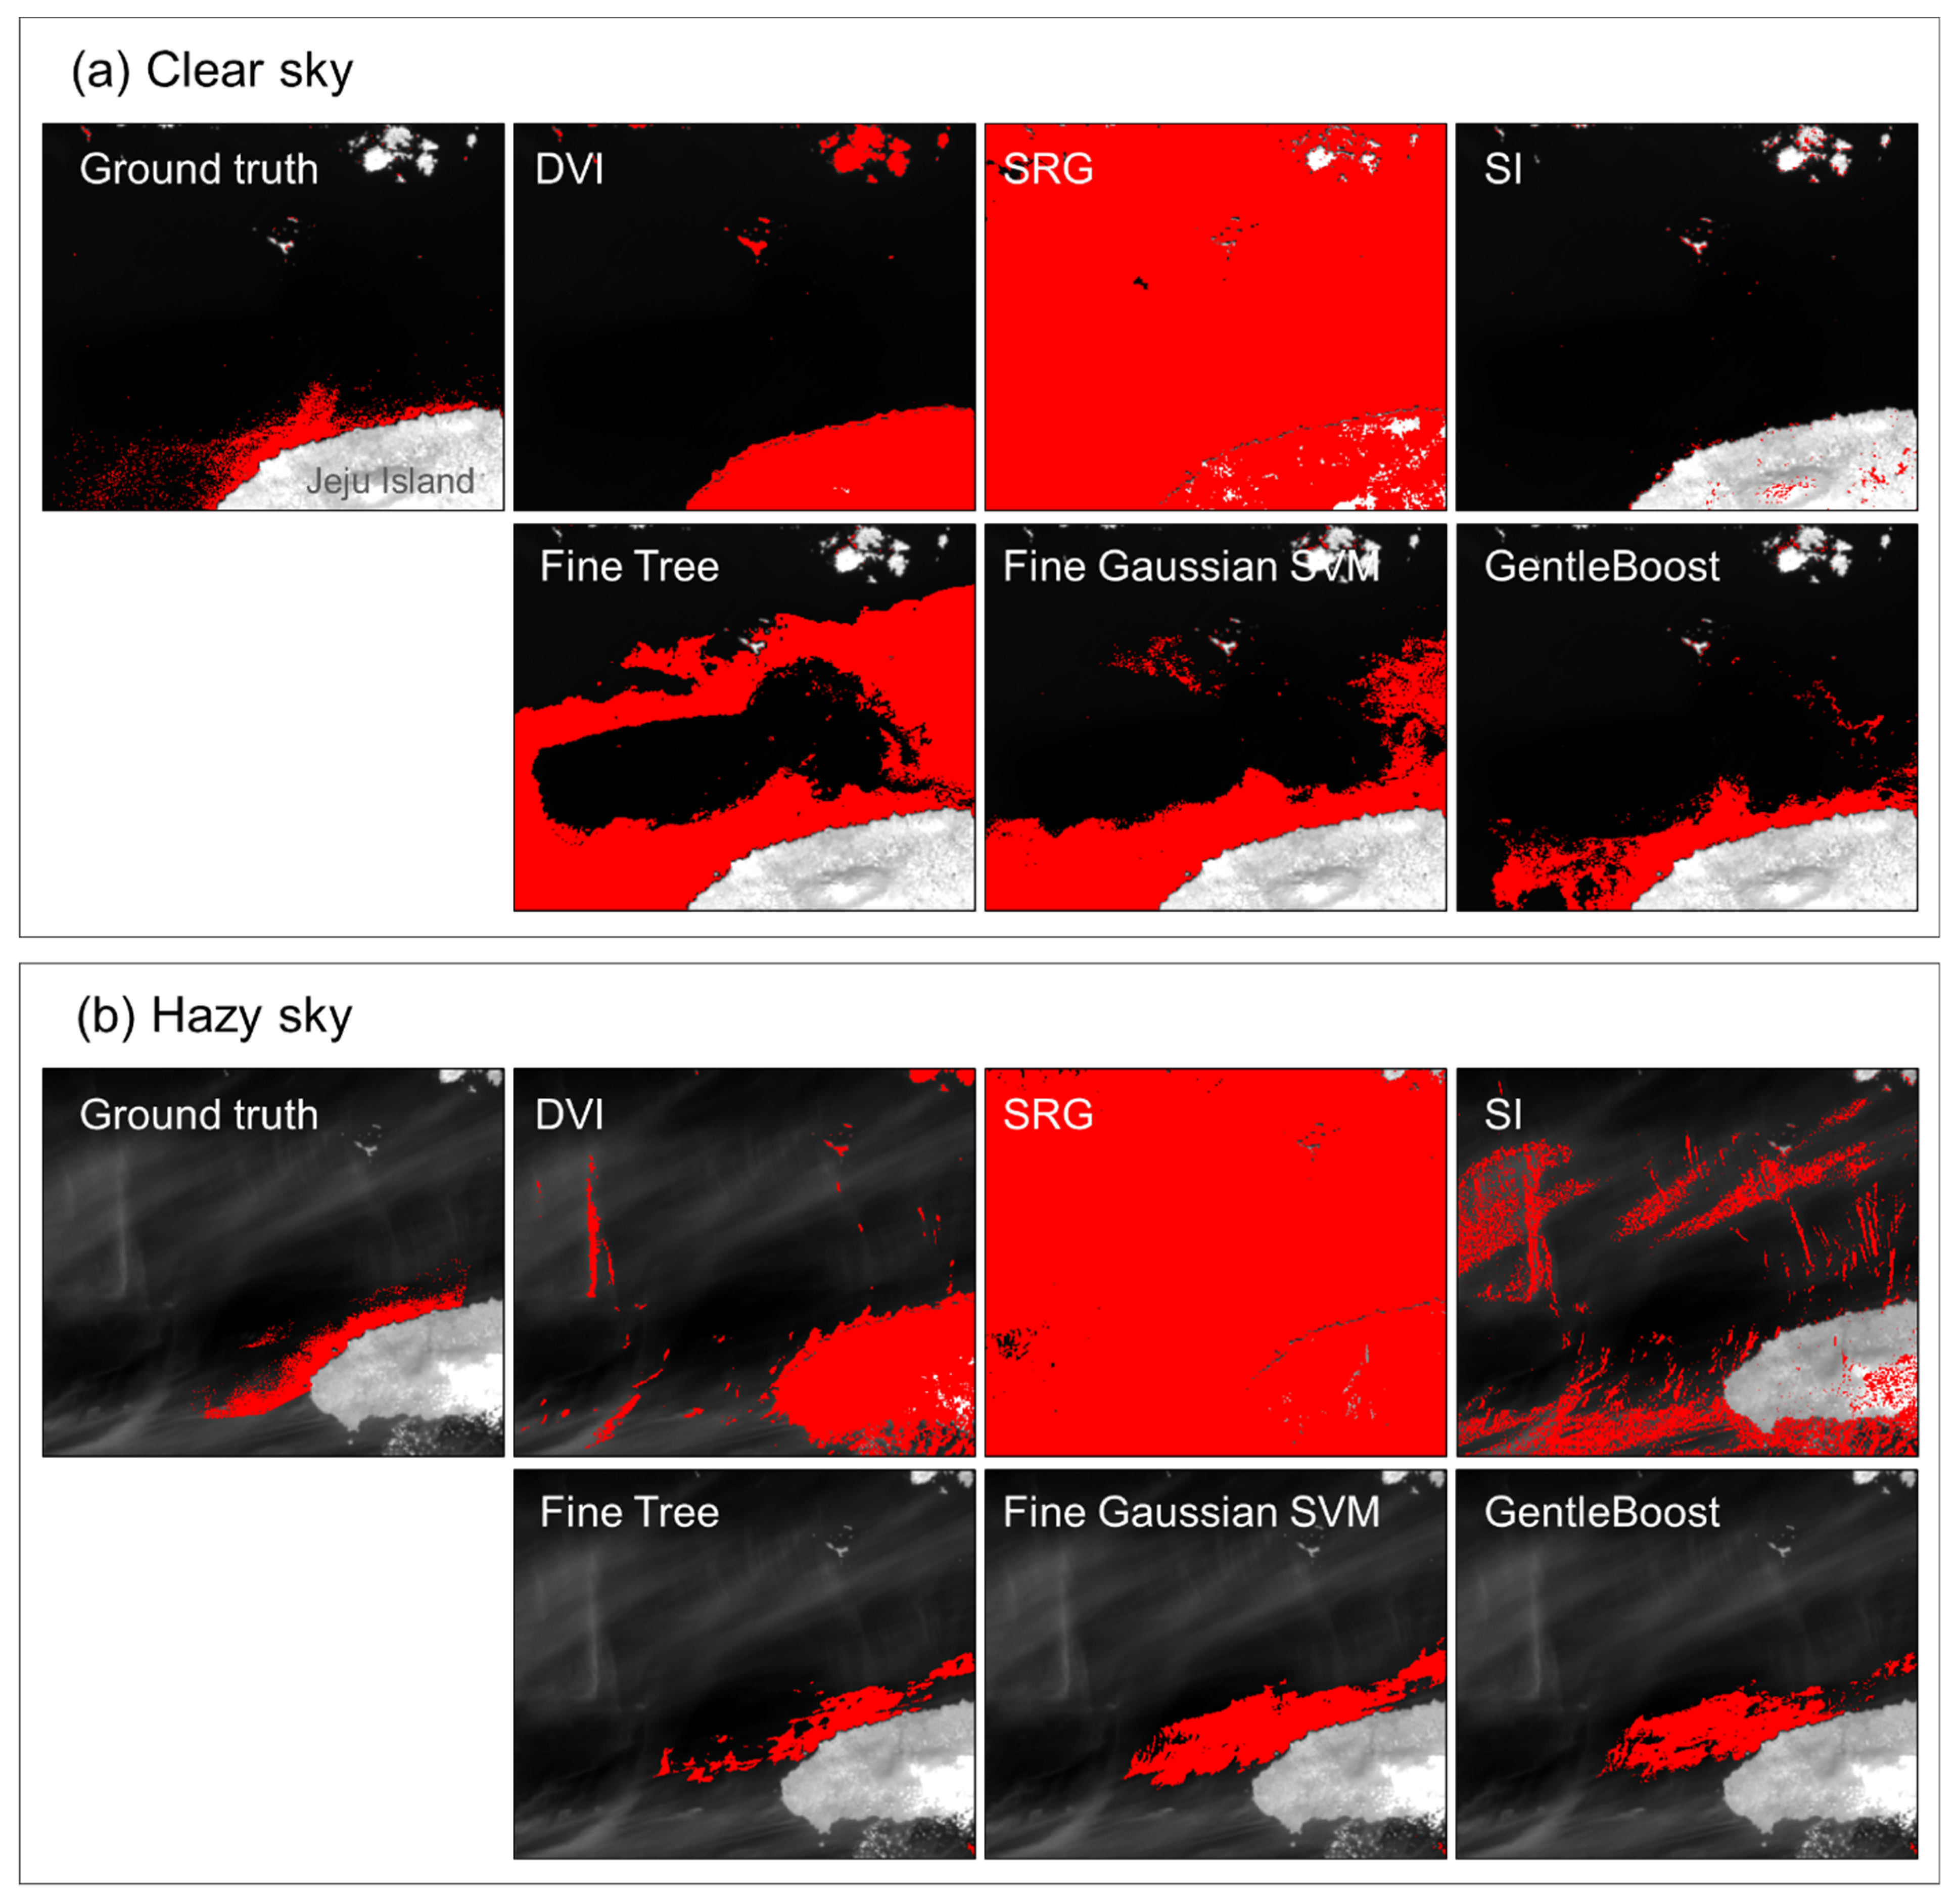
Figure 8.
Comparison between VIIRS Rrs and GOCI-II Rrs. The (a) 410; (b) 443; (c) 486; (d) 551, and (e) 671 nm of VIIRS wavelength bands matched with 412; 443; 490; 555, and 680 nm of GOCI-II wavelength bands, respectively.
Figure 8.
Comparison between VIIRS Rrs and GOCI-II Rrs. The (a) 410; (b) 443; (c) 486; (d) 551, and (e) 671 nm of VIIRS wavelength bands matched with 412; 443; 490; 555, and 680 nm of GOCI-II wavelength bands, respectively.
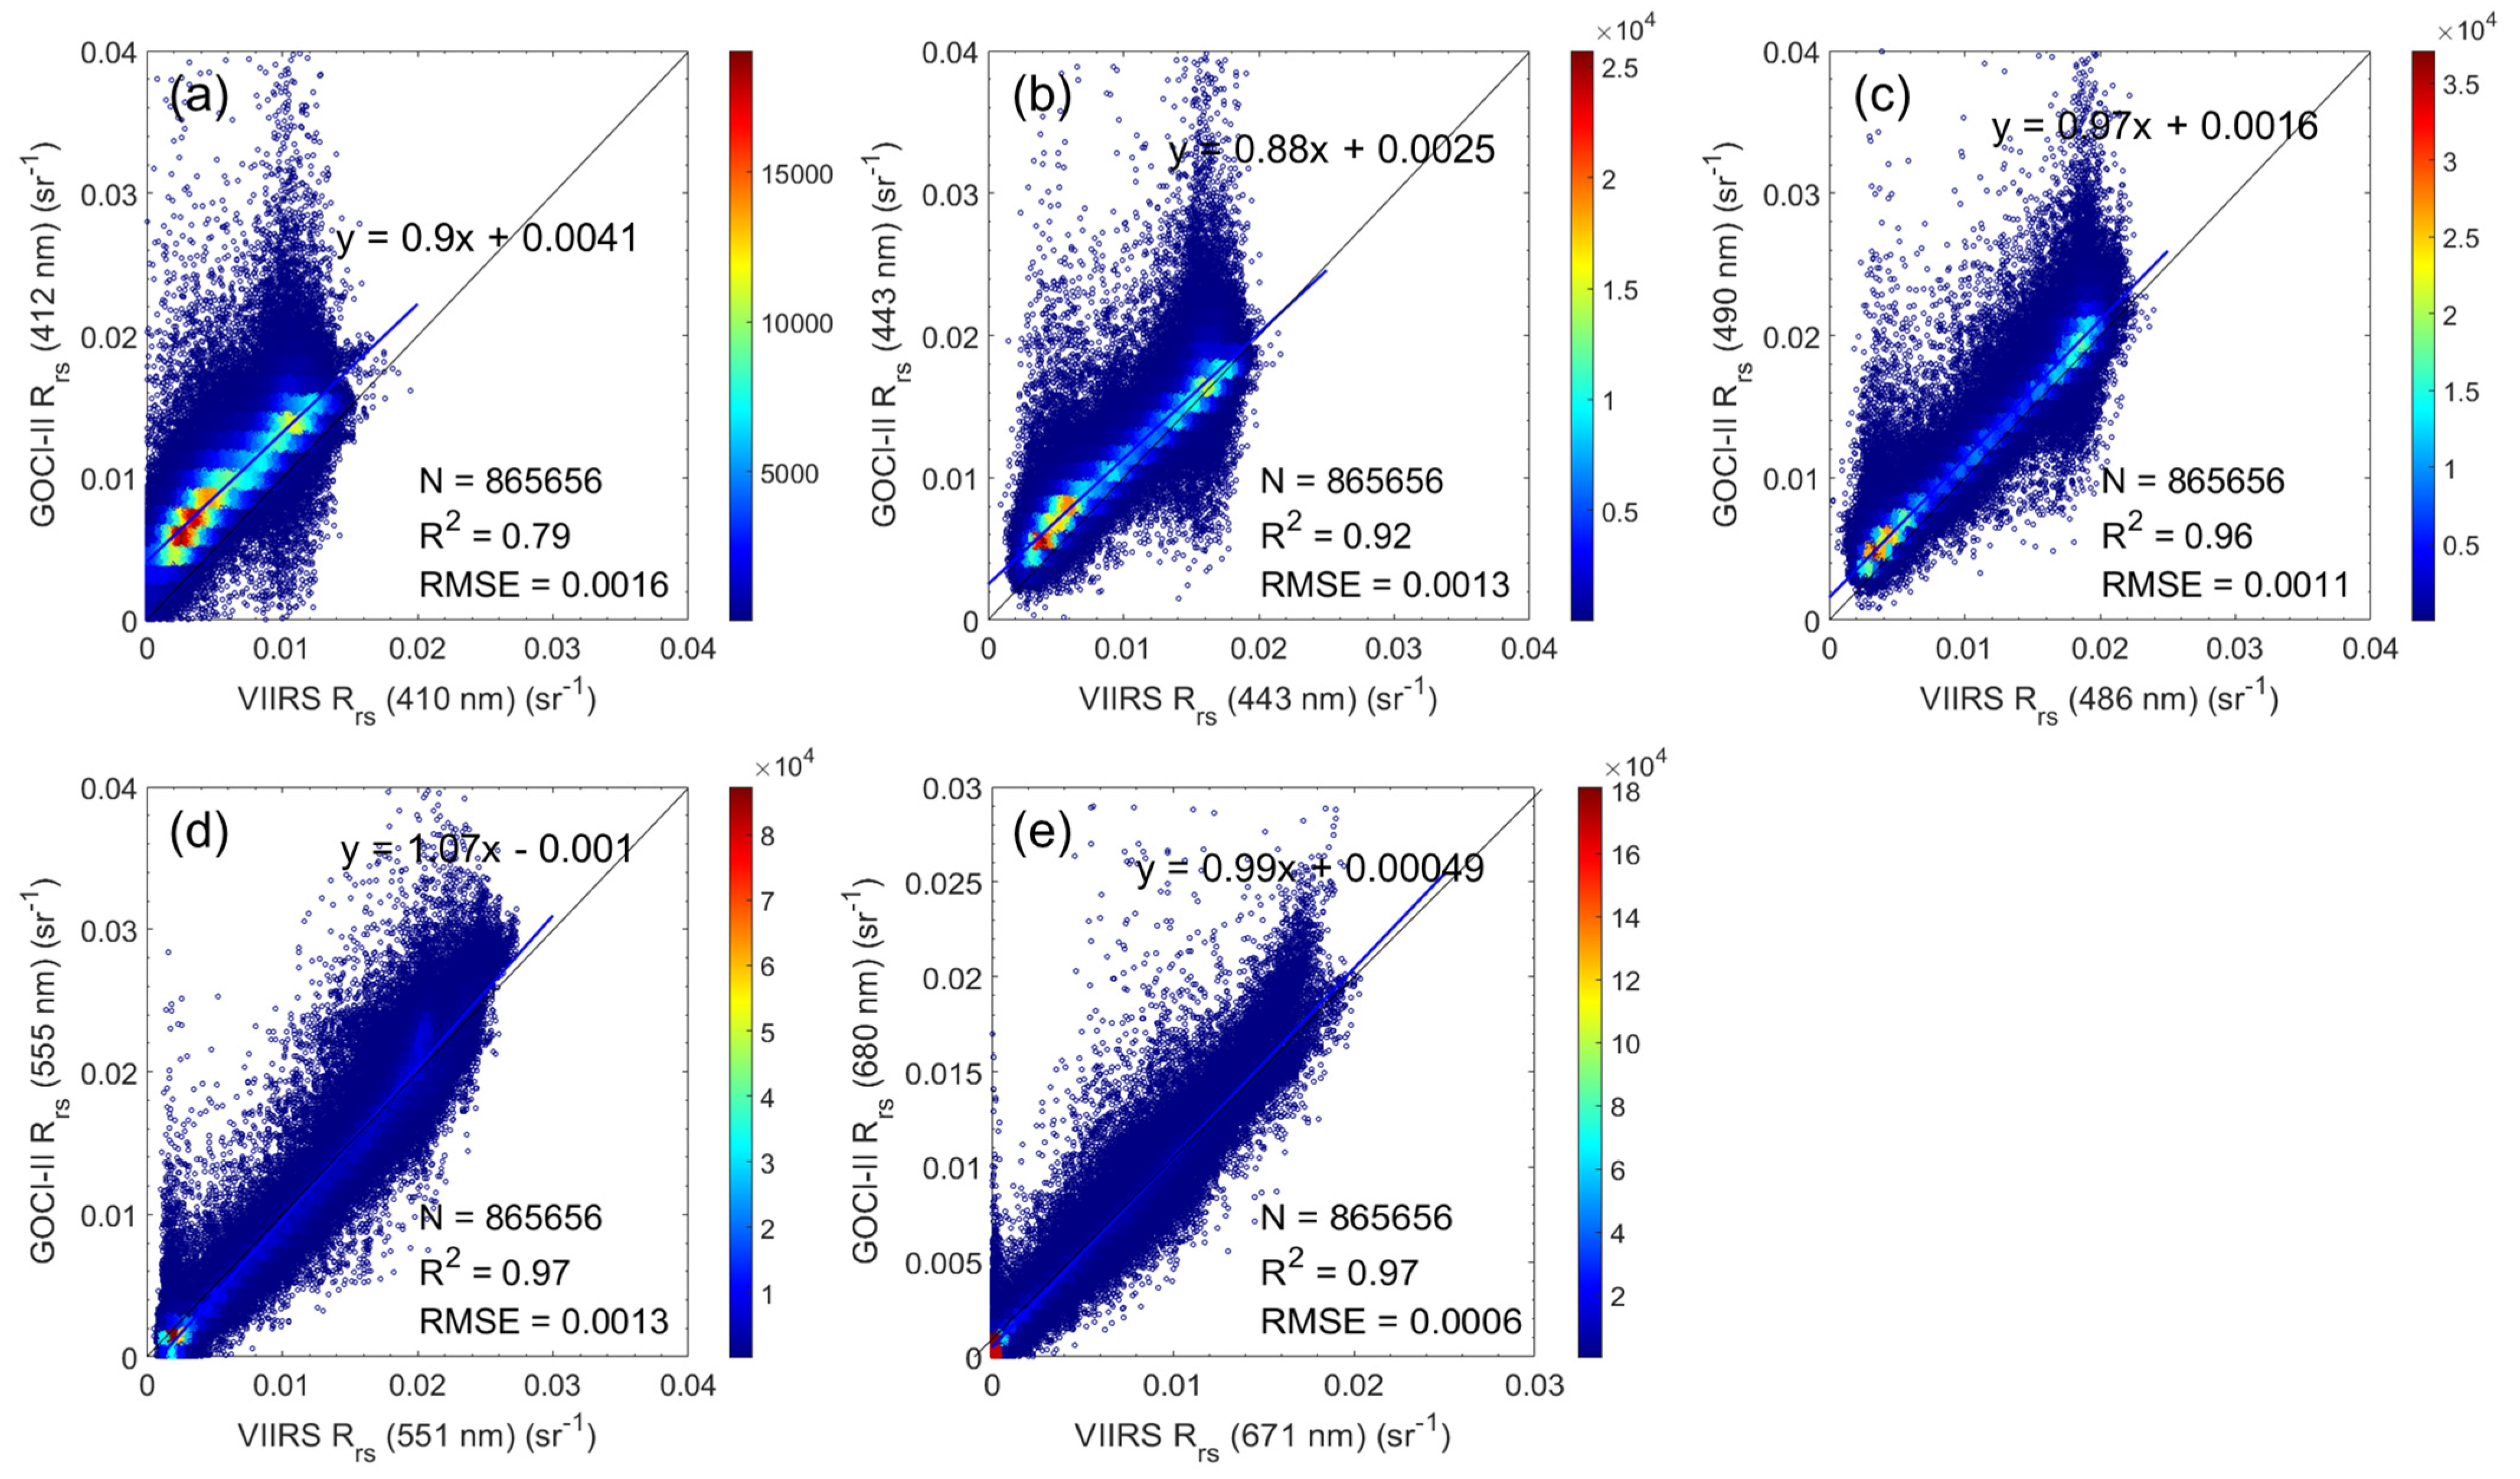
Figure 9.
(a) The average spectrum of Sargassum at 2 UTC on 3 February 2021 from GOCI-I RhoC; (b) Sargassum spectra obtained using GOCI-I (black star) and GOCI-II (red square). The additional GOCI-II bands include the wavelengths 380 (band 1); 510 (band 5); 620 (band 7), and 709 nm (band 10). These bands are represented by the filled red squares.


Table 1.
Overview of the GK2B GOCI-II characteristics.
| Mission Characteristics | |
|---|---|
| Satellite | Geostationary KOMPSAT 2B (GK2B) |
| Launch date | 18 February 2020 |
| Orbit altitude | 35,768 km (Center location, 128.2°E) |
| Mission lifetime | 10 years |
| Spatial resolution | 250 m (Local area)/1 km (Global area) |
| Temporal resolution | 1 h (Local, 10 times per day, 23 UTC~8 UTC), once per day (Global) |
| Field of regard | Local (2500 km × 2500 km, Center: 130°E, 36°N) |
| Slots | Local (12 slots, 2780 × 2780 pixels)/Global (235 slots) |
| Spectral bands | 380–865 nm (12 bands) |
Table 2.
List of date of Sargassum detection and satellite images available for the coast of Jeju Island from January to February 2021. Of the eight OLI and MSIs images, only six were selected as ground truth data due to cloud cover. GOCI-Ii images obtained on the selected date were used as a training dataset.
| January 2021 | February 2021 | |||||||||||||||||||||||
|---|---|---|---|---|---|---|---|---|---|---|---|---|---|---|---|---|---|---|---|---|---|---|---|---|
| Day | 27 | 28 | 29 | 30 | 31 | 1 | 2 | 3 | 4 | 5 | 6 | 7 | 8 | 9 | 10 | 11 | 12 | 13 | 14 | 15 | 16 | 17 | 18 | 19 |
| FS | v | v | v | v | v | v | v | v | v | v | v | v | v | v | v | v | v | v | v | v | v | |||
| G-II | v | v | v | v | v | v | ||||||||||||||||||
| S2A | ||||||||||||||||||||||||
| S2B | v | v | v | |||||||||||||||||||||
| OLI-I | v | |||||||||||||||||||||||
| OLI-II | v | v | ||||||||||||||||||||||
FS: Field survey; G-II: GOCI-II; S2A: Sentinel-2A; S2B: Sentinel-2B; OLI-I: Path 116 row 37; OLI-II: Path 115 row 37.
Table 3.
Machine learning model types for Sargassum detection.
| Model Types | |
|---|---|
| Decision Tree | Preset: Fine Tree Maximum number of splits: 100 Split criterion: Gini’s diversity index Training time: 10.79 s |
| Support Vector Machine | Preset: Fine Gaussian SVM Kernel function: Gaussian Kernel scale: 0.87 Training time: 1914.36 s |
| Ensemble classifier | Preset: Boosted Trees Ensemble method: GentleBoost Learner type: Decision tree Maximum number of splits: 20 Number of learners: 30 Learning rate: 0.1 Training time: 124.82 s |
Table 4.
Confusion matrix for evaluating the accuracy of the Sargassum detection.
| Sargassum in Ground Truth | ||||
|---|---|---|---|---|
| Ture (sr) | False (nsr) | |||
| Sargassum in the predicted maps | True (SR) | (1) True positive | (3) False positive | Precision (1)/[(1)+(3)] |
| False (nSR) | (2) False negative | (4) True negative | ||
| Sensitivity (1)/[(1)+(2)] | ||||
Table 5.
Performance evaluation of traditional methods and machine learning models using the validation dataset.
Table 5.
Performance evaluation of traditional methods and machine learning models using the validation dataset.
| (1) | (2) | (3) | (4) | Sens. | Prec. | F-Measure | ||
|---|---|---|---|---|---|---|---|---|
| Traditional methods | DVI | 3.5% | 29.8% | 13.9% | 52.8% | 10.5% | 20.2% | 0.14 |
| SRG | 31.4% | 2.0% | 62.1% | 4.6% | 94.1% | 33.6% | 0.49 | |
| SI | 7.5% | 25.8% | 18.8% | 47.9% | 22.5% | 28.5% | 0.25 | |
| Machine learning models | Fine tree | 30.8% | 2.6% | 12.2% | 54.4% | 92.3% | 71.6% | 0.81 |
| Fine Gaussian SVM | 33.0% | 0.4% | 12.5% | 54.1% | 98.9% | 72.5% | 0.84 | |
| GentleBoost | 28.4% | 6.3% | 6.2% | 60.4% | 81.9% | 82.2% | 0.82 |
(1): True positive; (2): false negative; (3): false positive; (4): true negative; sens.: sensitivity; prec.: precision.
Table 6.
Specifications of ocean color sensors, including GOCI-II, GOCI-I, Sentinel-3 OLCI, MODIS, and VIIRS.
Table 6.
Specifications of ocean color sensors, including GOCI-II, GOCI-I, Sentinel-3 OLCI, MODIS, and VIIRS.
| Sensor | Spatial Resolution (m) | Swath (km) | Revisit Period (per day) | Spectral Range (nm) |
|---|---|---|---|---|
| GOCI-II | 250 | 2500 | 10 times | 380–865 |
| GOCI-I (not operation) | 500 | 2500 | 8 times | 412–865 |
| OLCI | 300 | 1270 | 1–3 | 400–1020 |
| MODIS | 1000 | 2330 | 1 | 405–877 |
| VIIRS | 750 | 3000 | 1 | 412–1201 |
| MERIS (not operation) | 300 | 1.15 | 3 | 390–1040 |
Publisher’s Note: MDPI stays neutral with regard to jurisdictional claims in published maps and institutional affiliations. |
© 2021 by the authors. Licensee MDPI, Basel, Switzerland. This article is an open access article distributed under the terms and conditions of the Creative Commons Attribution (CC BY) license (https://creativecommons.org/licenses/by/4.0/).
Share and Cite
MDPI and ACS Style
Shin, J.; Lee, J.-S.; Jang, L.-H.; Lim, J.; Khim, B.-K.; Jo, Y.-H. Sargassum Detection Using Machine Learning Models: A Case Study with the First 6 Months of GOCI-II Imagery. Remote Sens. 2021, 13, 4844. https://doi.org/10.3390/rs13234844
AMA Style
Shin J, Lee J-S, Jang L-H, Lim J, Khim B-K, Jo Y-H. Sargassum Detection Using Machine Learning Models: A Case Study with the First 6 Months of GOCI-II Imagery. Remote Sensing. 2021; 13(23):4844. https://doi.org/10.3390/rs13234844
Chicago/Turabian StyleShin, Jisun, Jong-Seok Lee, Lee-Hyun Jang, Jinwook Lim, Boo-Keun Khim, and Young-Heon Jo. 2021. "Sargassum Detection Using Machine Learning Models: A Case Study with the First 6 Months of GOCI-II Imagery" Remote Sensing 13, no. 23: 4844. https://doi.org/10.3390/rs13234844
Note that from the first issue of 2016, this journal uses article numbers instead of page numbers. See further details here.