
Central Courtyard Feature Extraction in Remote Sensing Aerial Images Using Deep Learning: A Case-Study of Iran

 ,
,  , ,
, ,  ,
, 
Abstract
:
1. Introduction
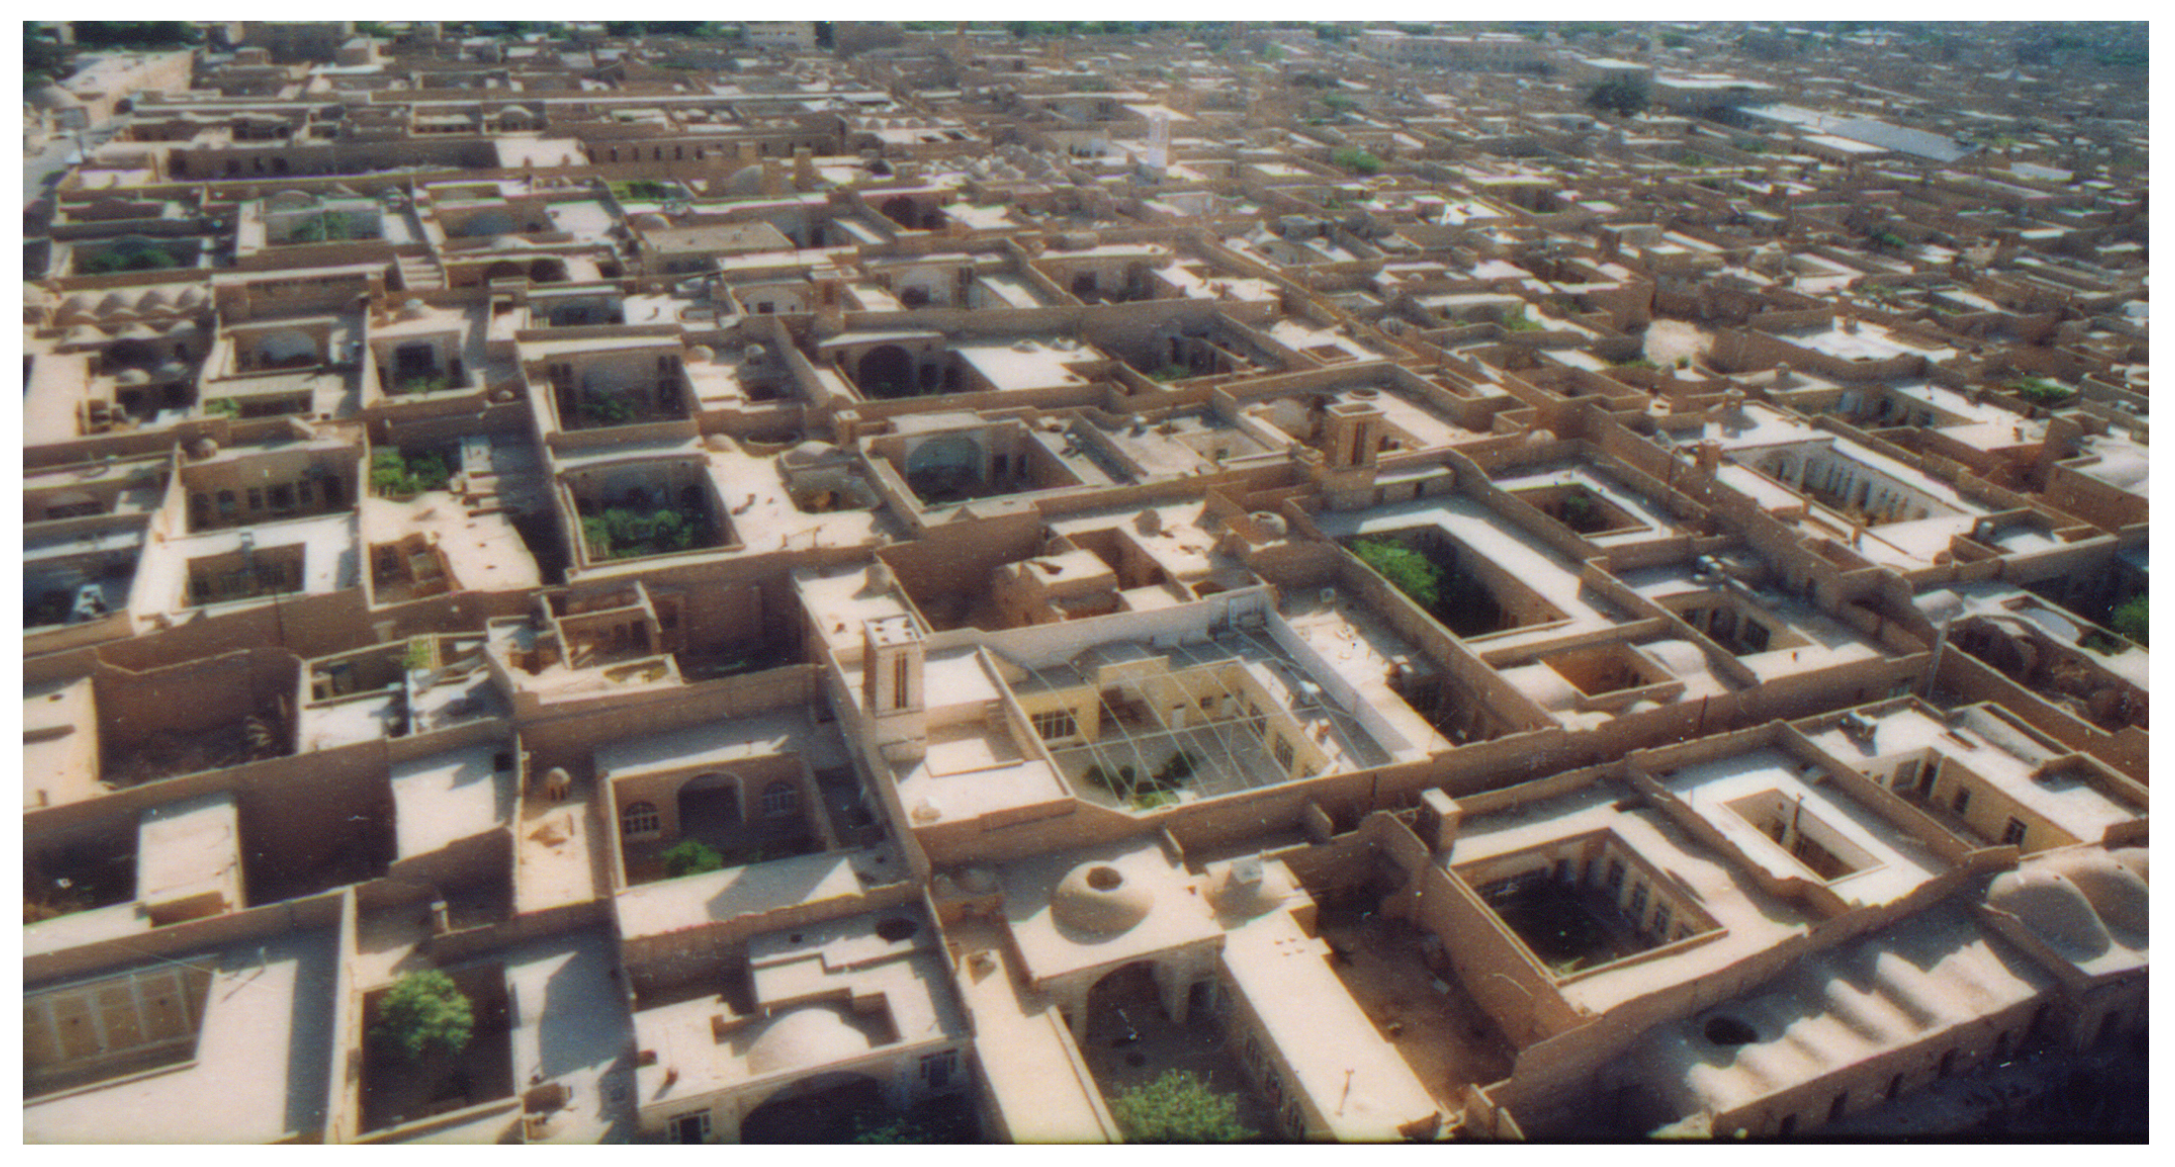
1.1. Historical Architecture of Iran
1.2. Deep Learning, Architecture, and Planning
1.3. State of Art
1.3.1. Central Courtyards Studies
1.3.2. Aerial Images Remote Sensing
1.4. Research Goals
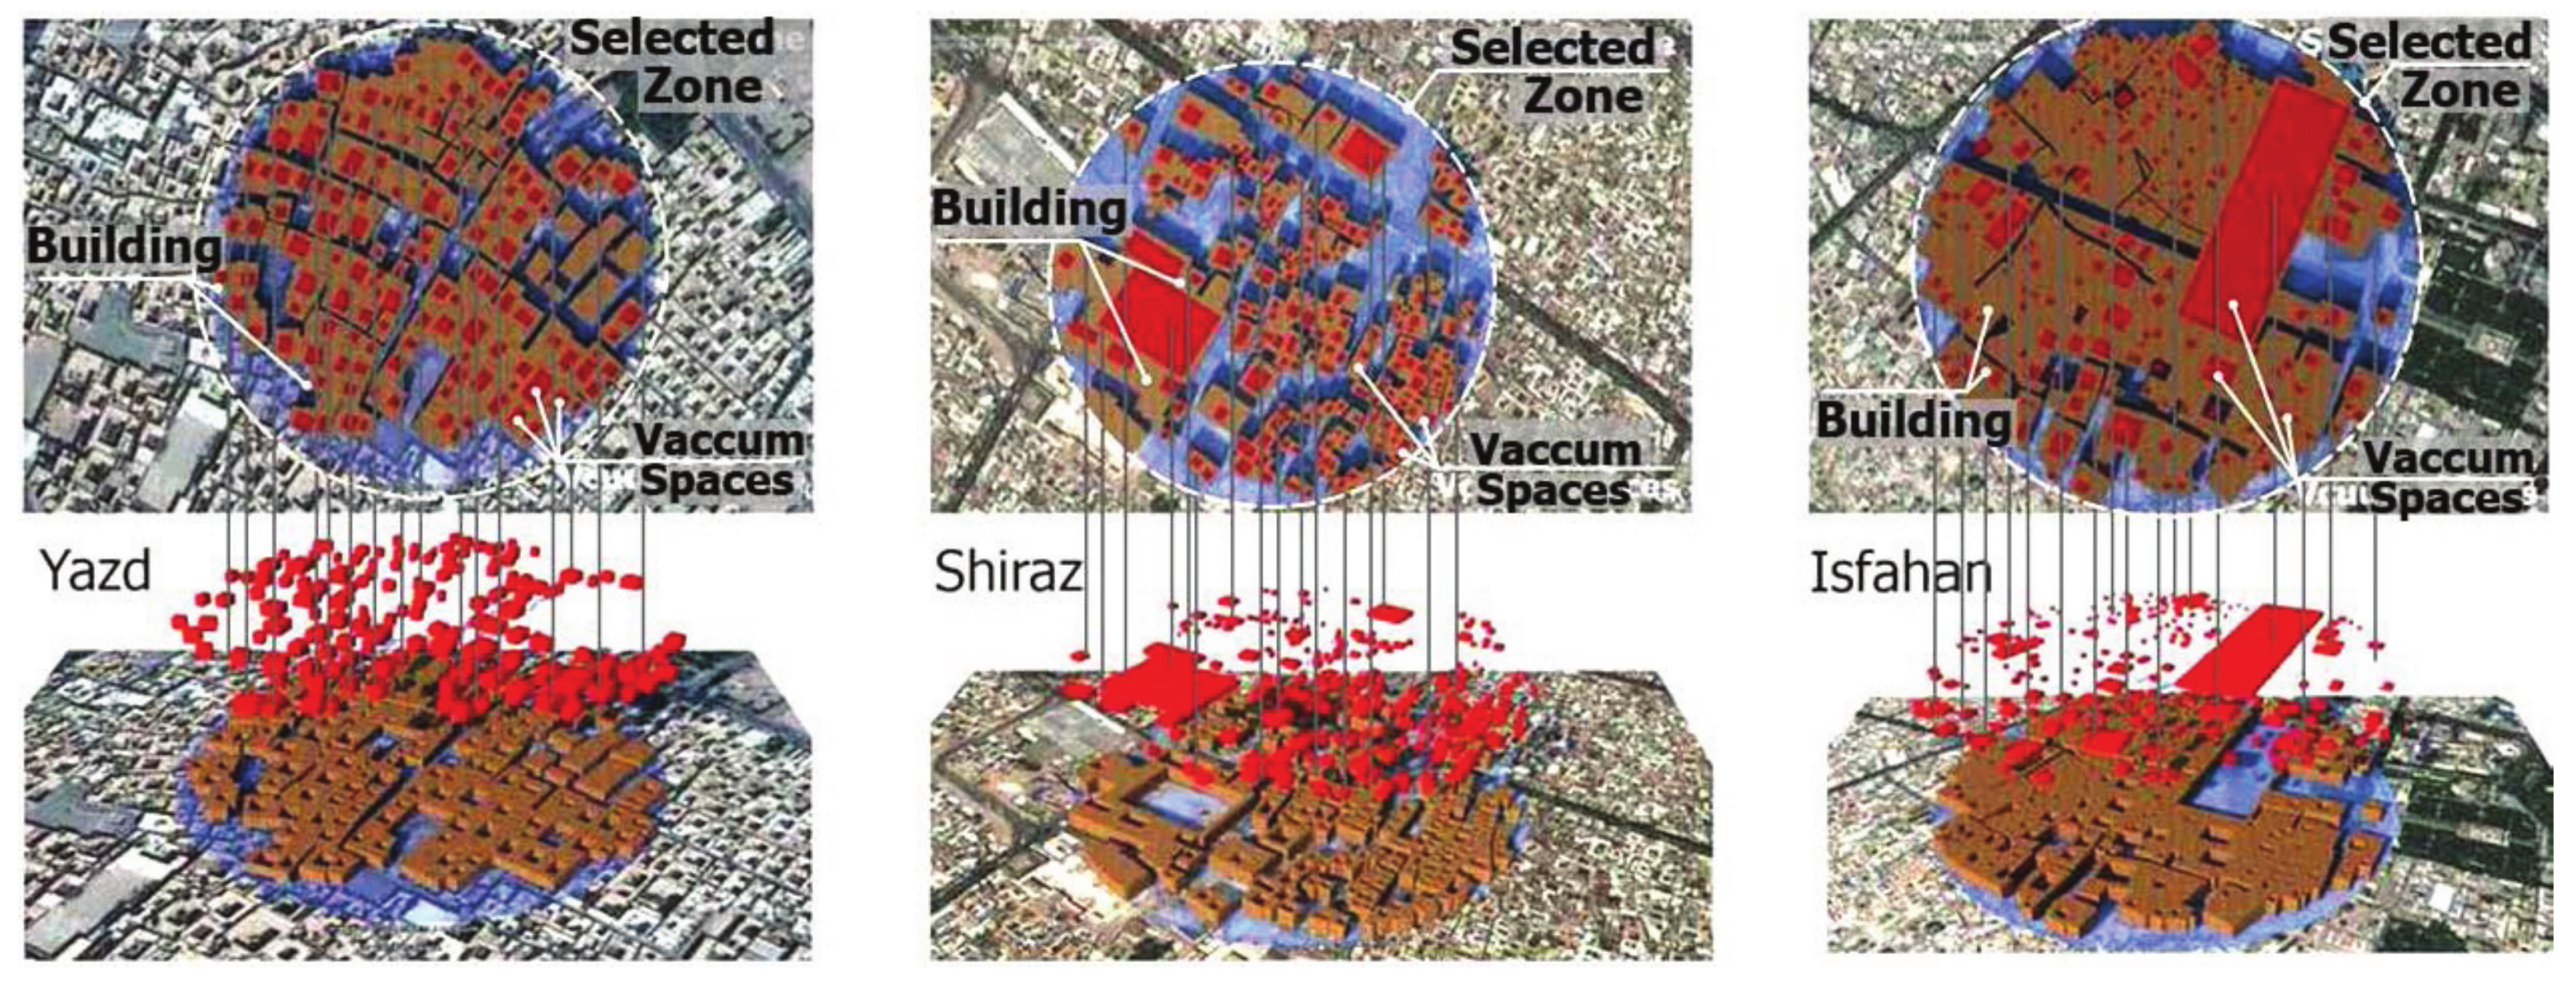
1.5. Case Study
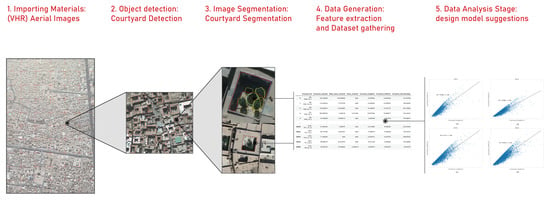
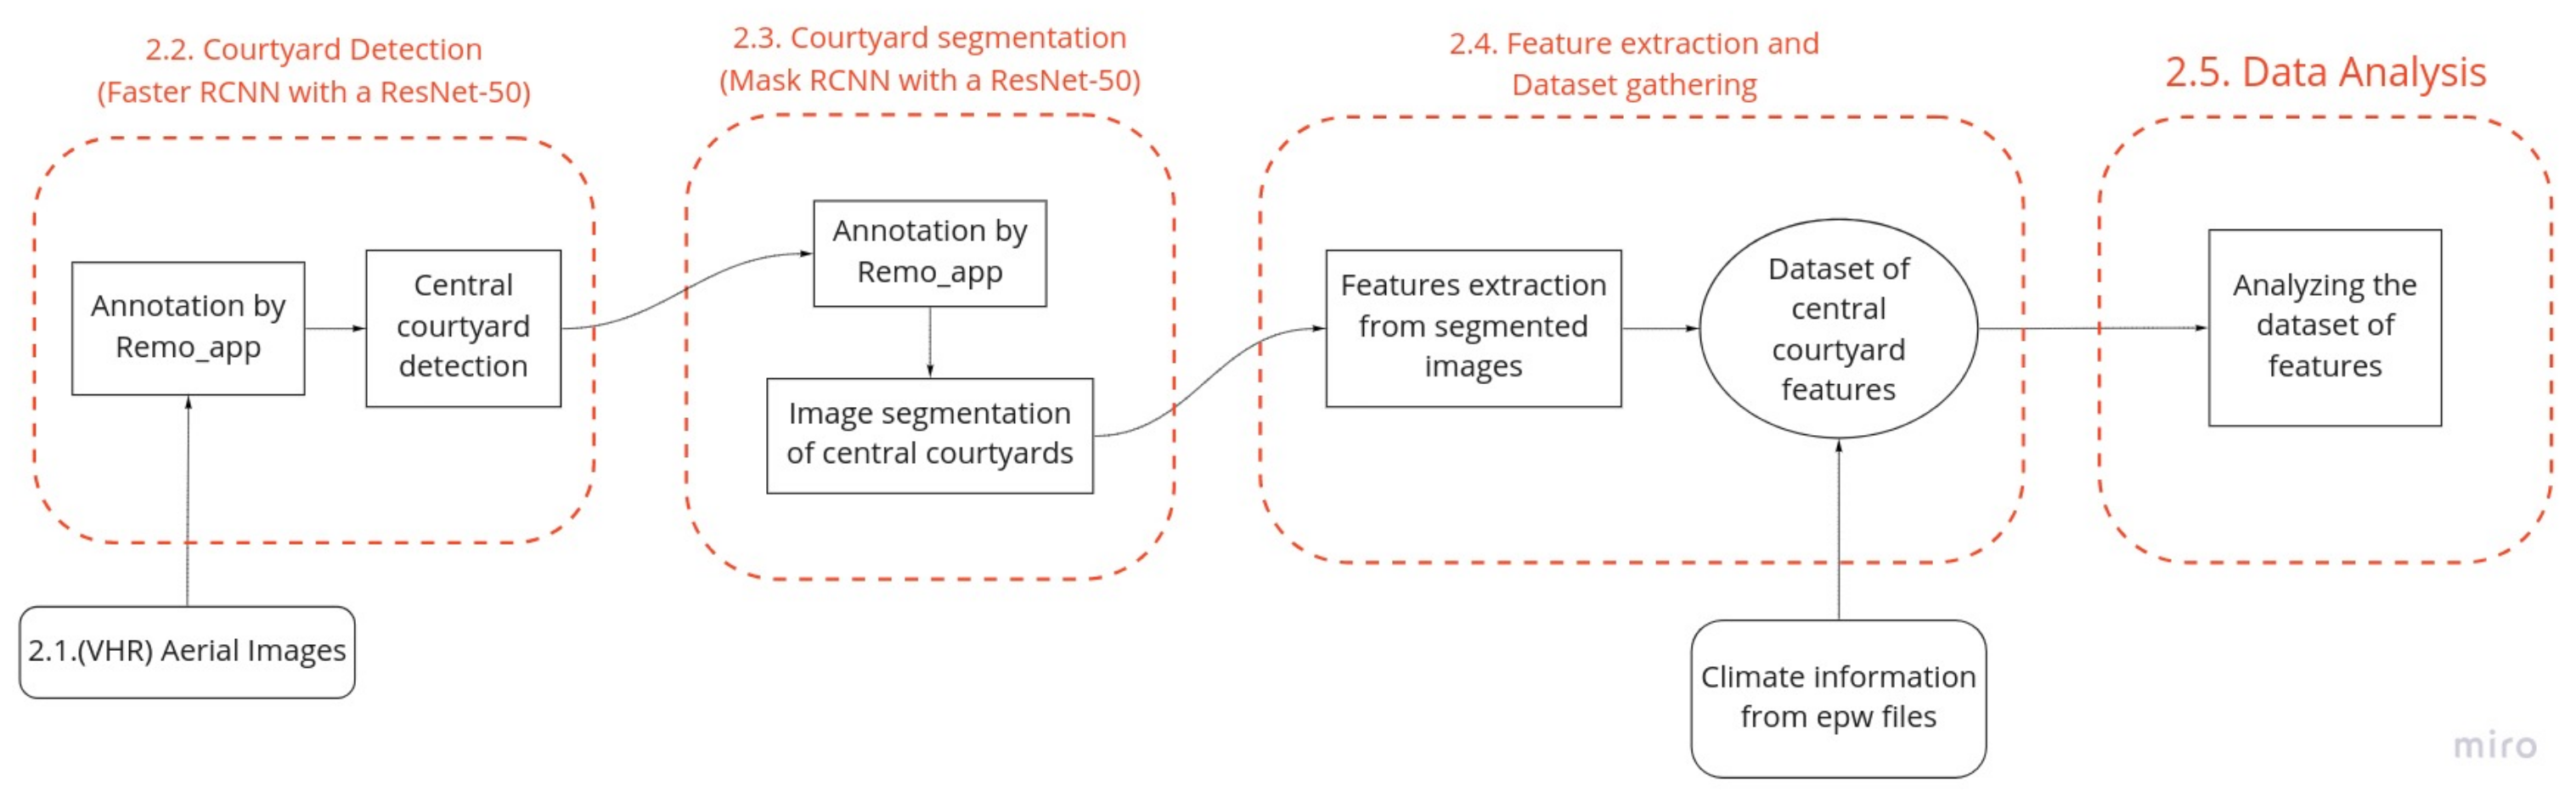
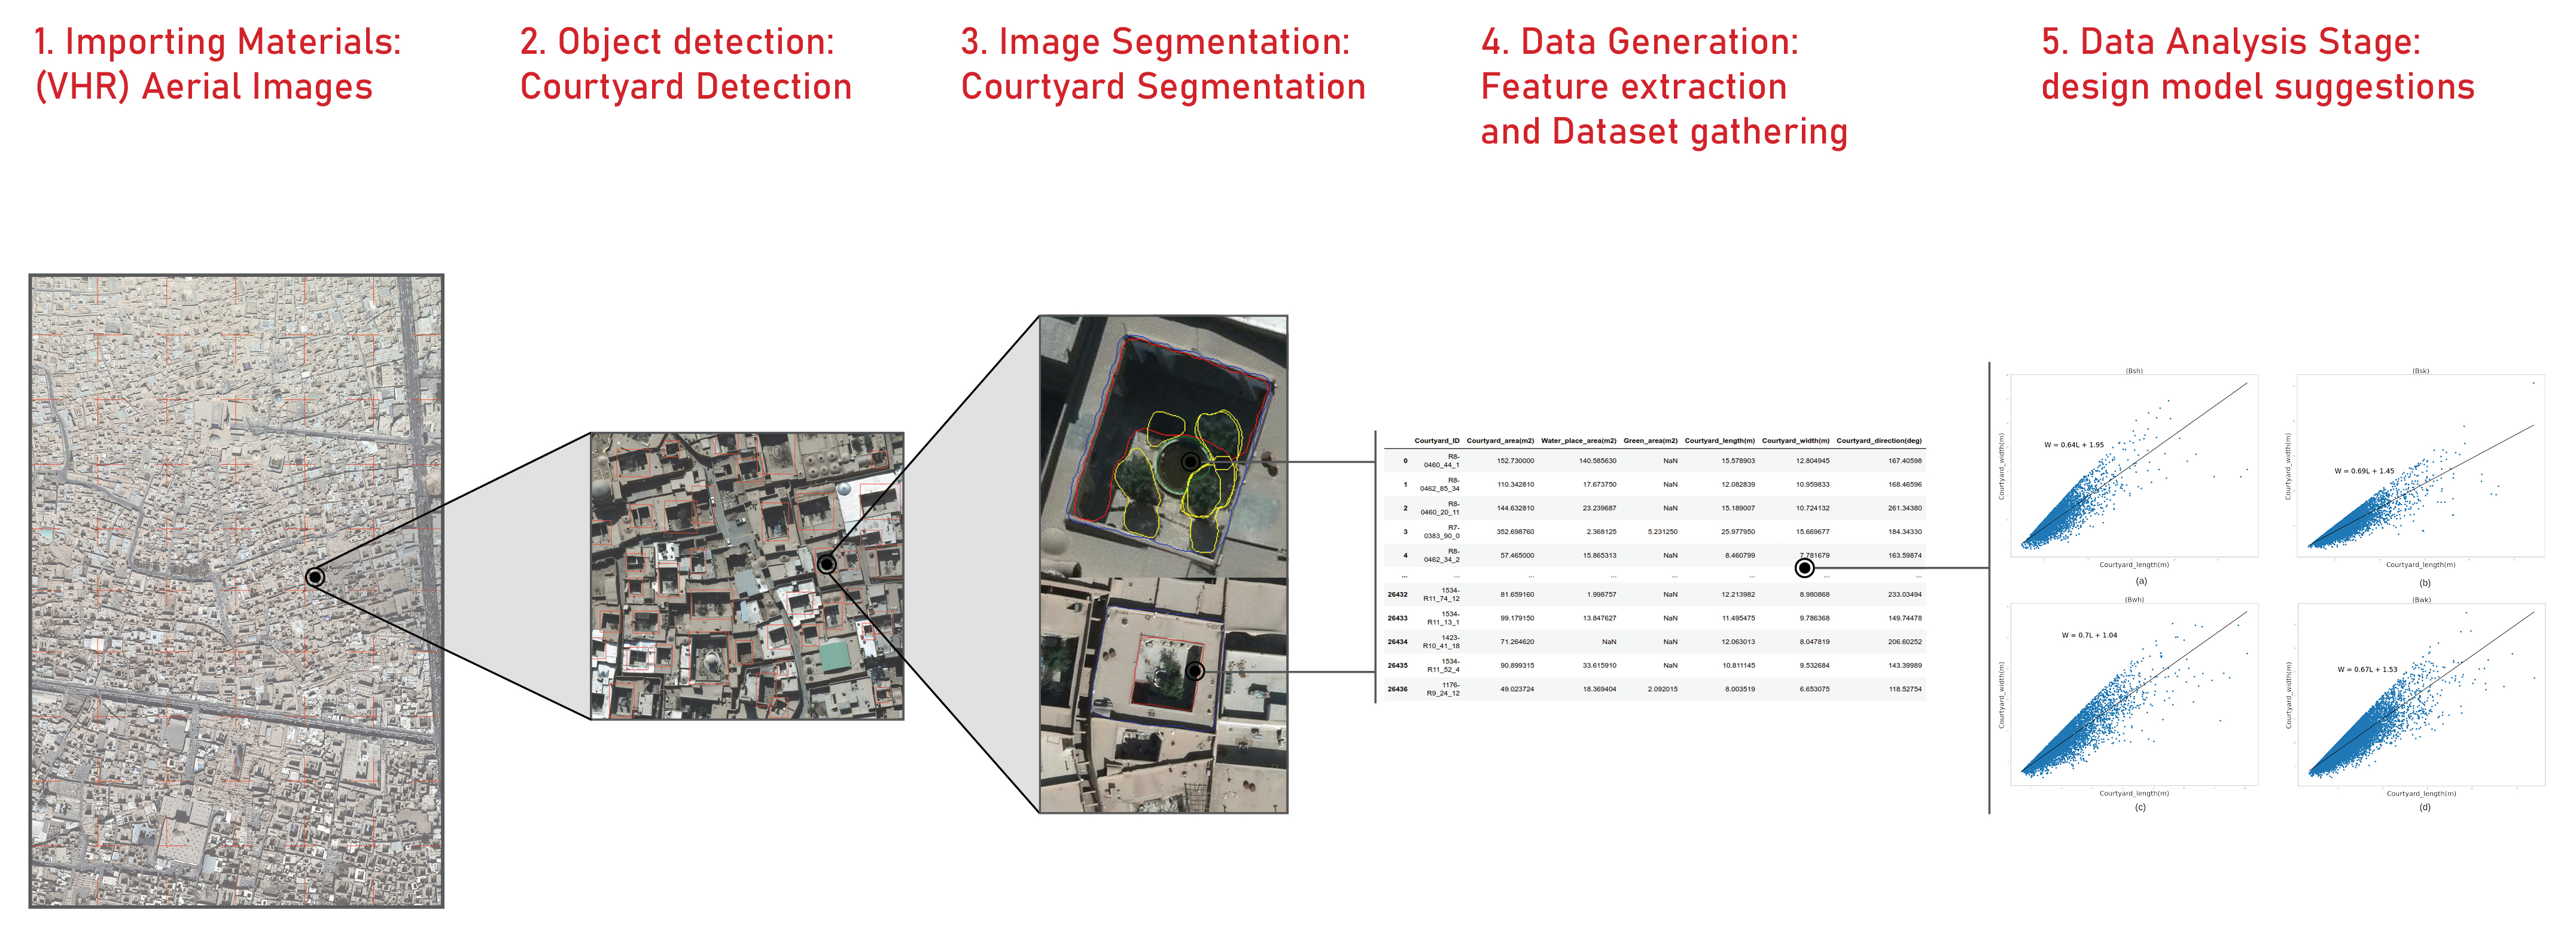
2. Material and Method
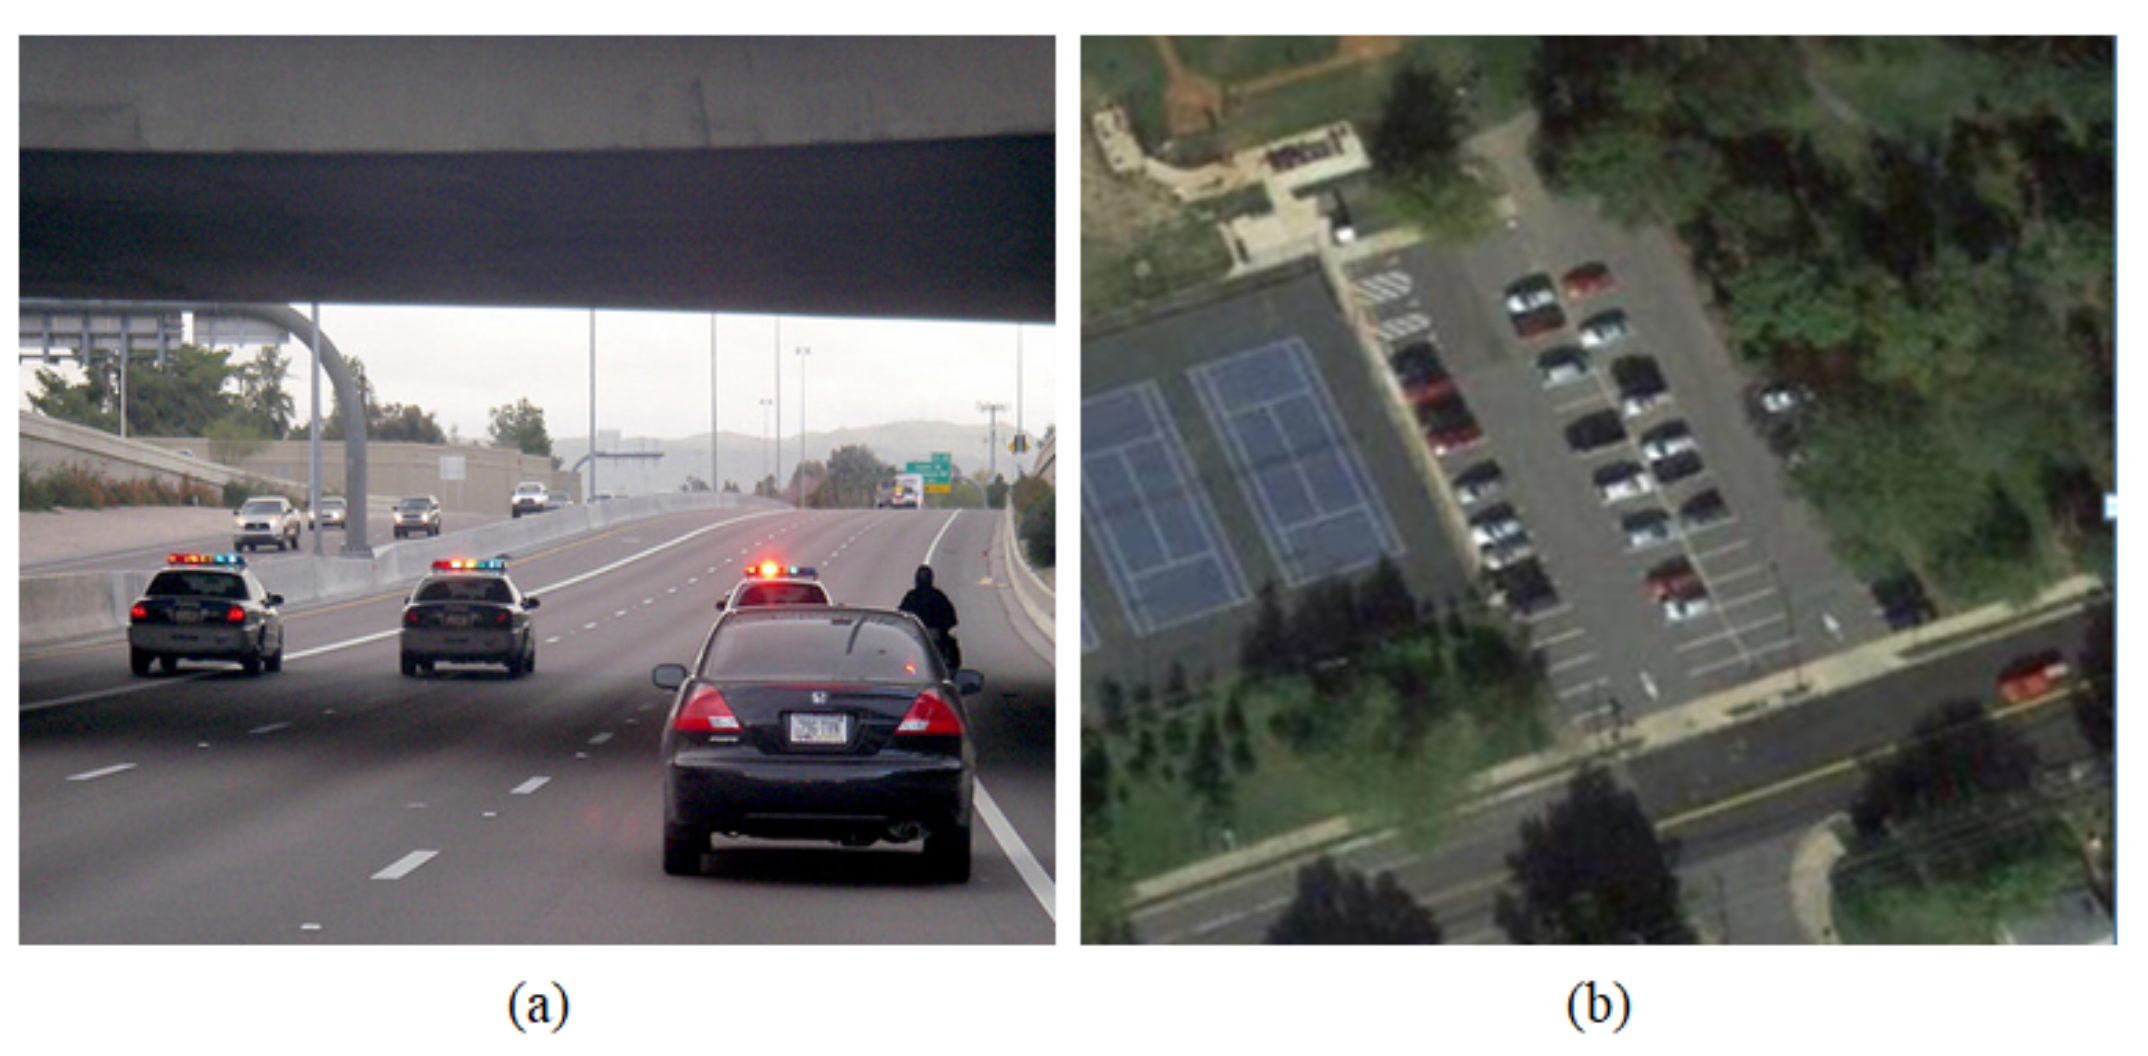
2.1. Very High-Resolution (VHR) Aerial Images
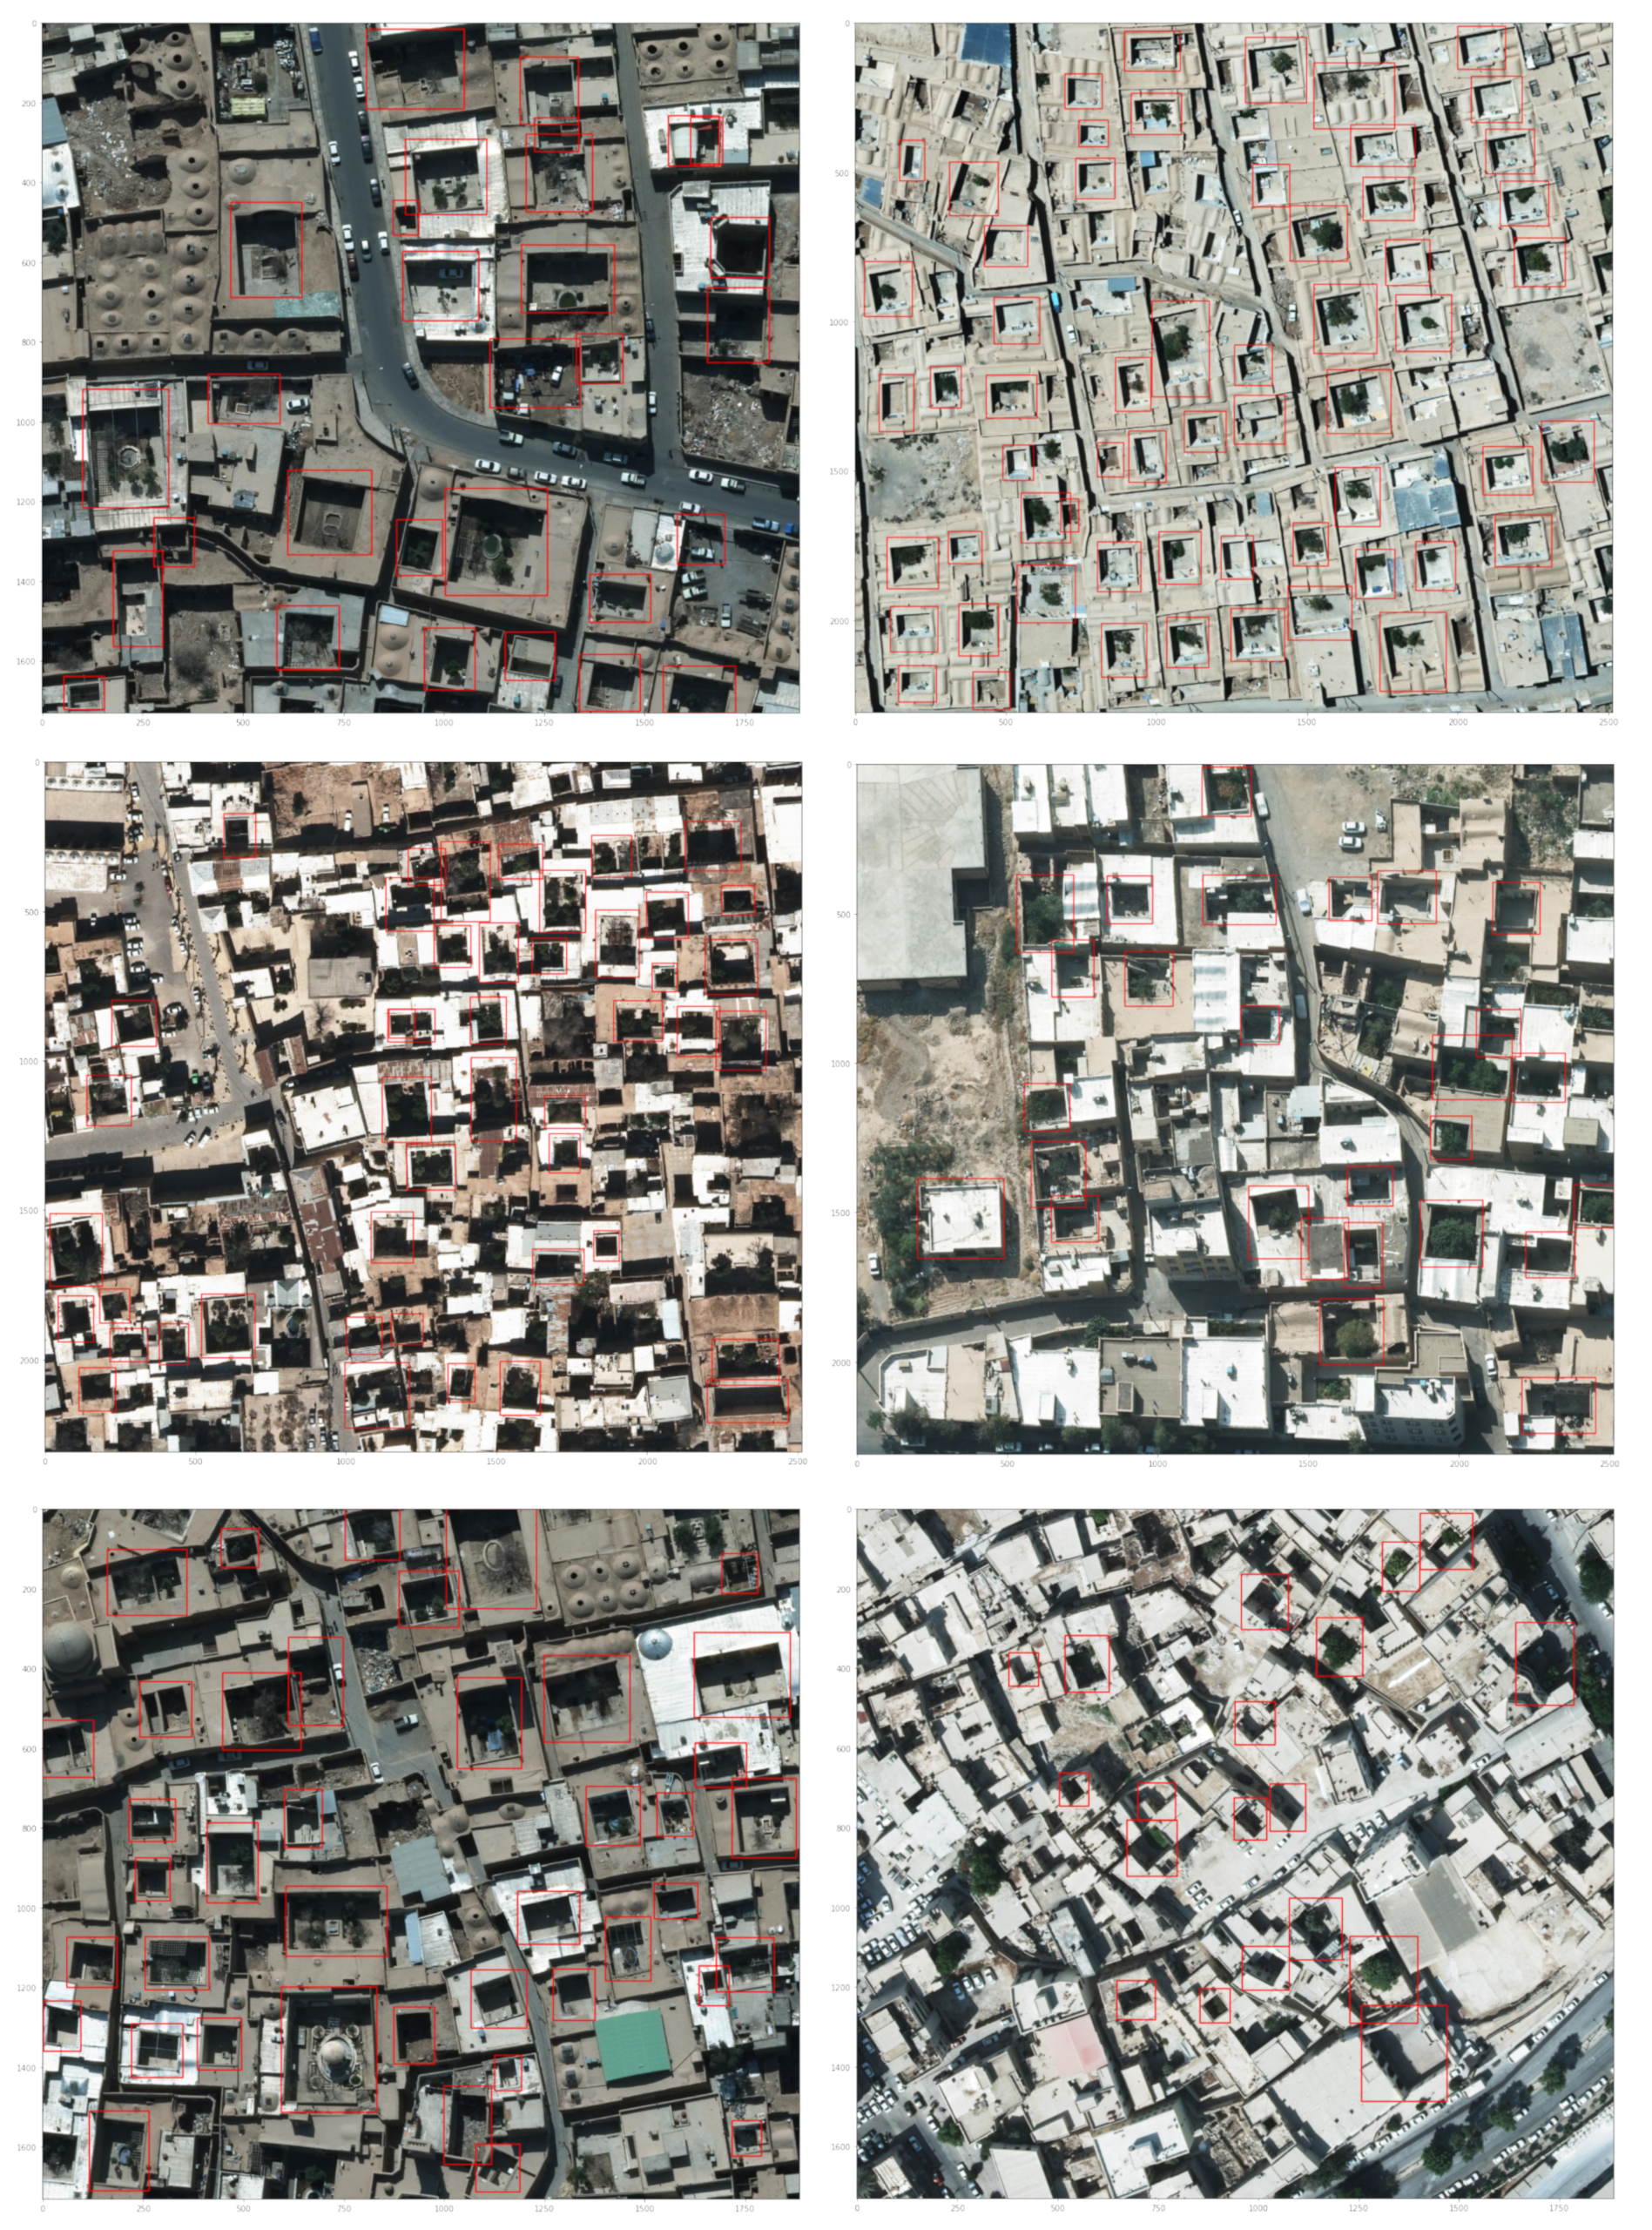
2.2. Central Courtyard Detection
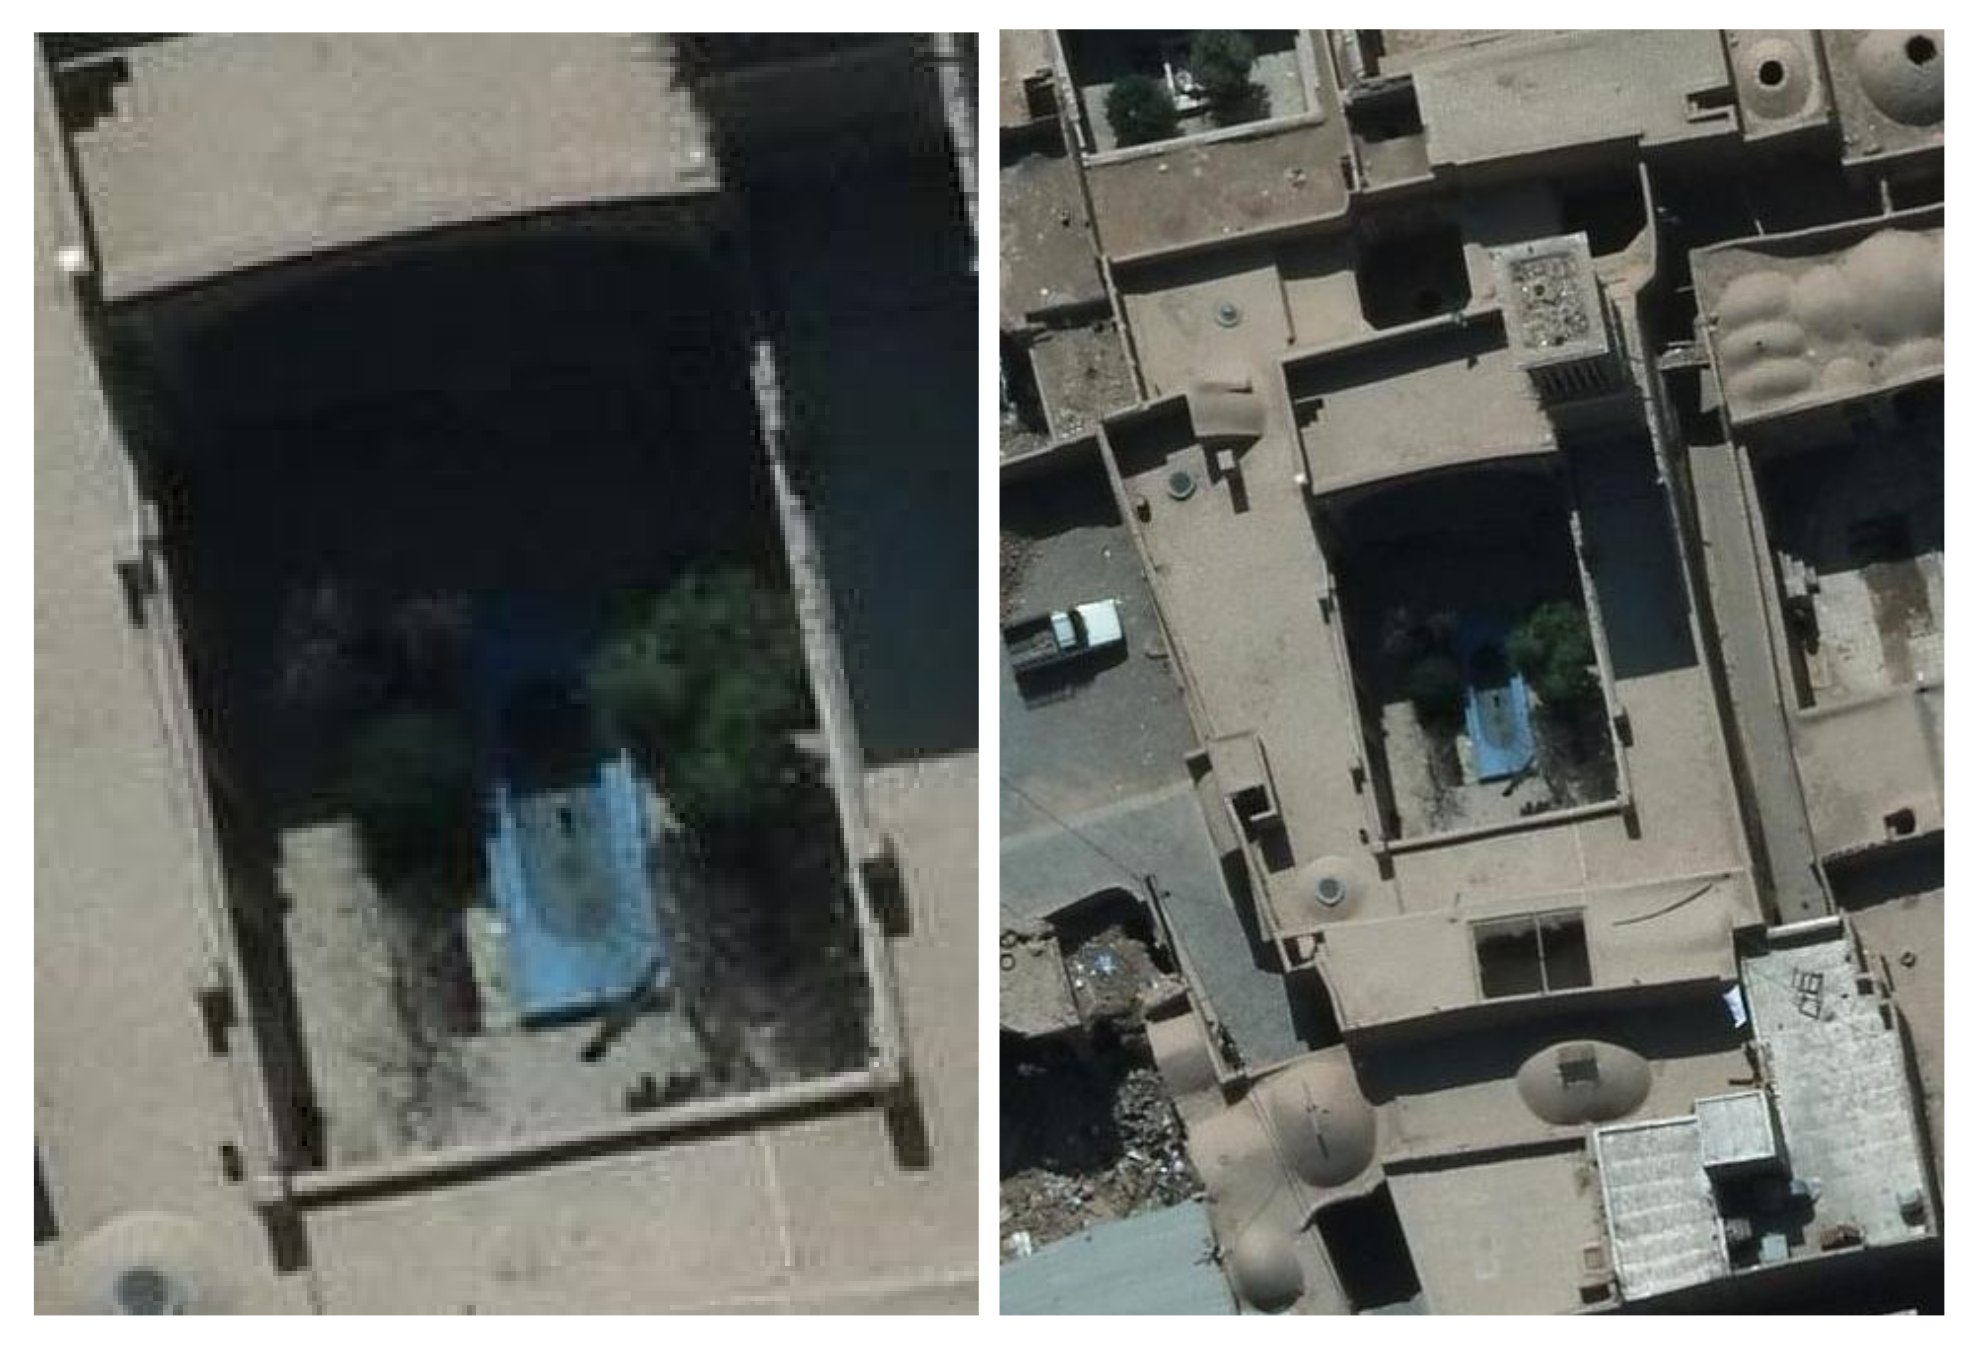
2.3. Image Segmentation
3. Results
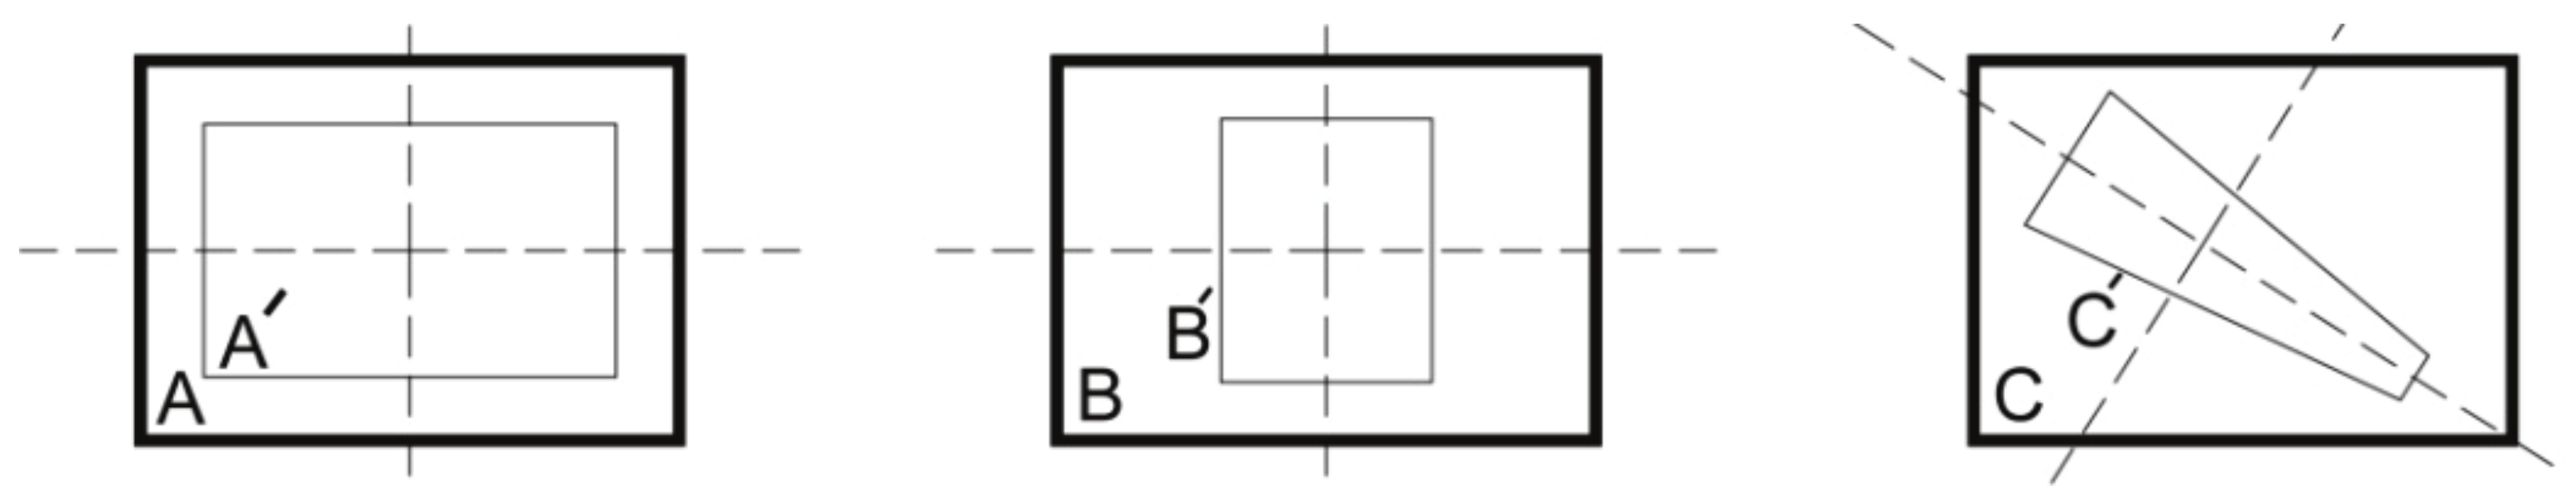
3.1. Feature Extraction and Dataset Gathering
3.2. Data Analysis
3.3. Dataset Analysis of the Cities
4. Discussion
Proposed Model for the Dimension of the Central Courtyard
5. Conclusions
Supplementary Materials
Author Contributions
Funding
Institutional Review Board Statement
Informed Consent Statement
Data Availability Statement
Acknowledgments
Conflicts of Interest
References
- Bonenberg, W. The Role of Cultural Heritage in Sustainable Development. Values and Valuation as Key Factors in Spatial Planning of Rural Areas. In Advances in Human Factors in Architecture, Sustainable Urban Planning and Infrastructure; Charytonowicz, J., Falco, C., Eds.; Springer International Publishing: Washington, DC, USA, 2020; pp. 124–134. [Google Scholar]
- Bazazzadeh, H.; Nadolny, A.; Attarian, K.; Safar ali najar, B.; Hashemi safaei, S. Promoting sustainable development of cultural assets by improving users’ perception through space configuration; Case study: The industrial heritage site. Sustainability 2020, 12, 5109. [Google Scholar] [CrossRef]
- Mahdavinejad, M.; Didehban, M.; Bazazzadeh, H. Contemporary architectural heritage and industrial identity in historic districts, case study: Dezful. J. Stud.-Iran.-Islam. City 2016, 6, 41–50. [Google Scholar]
- Pazder, D.; Kaźmierczak, B. Responsibility in the revitalization process—The aspect of the economic policy. Sci. Pap. Poznań Univ. Technol. Archit. Urban Plan. 2009, 17, 207–210. [Google Scholar]
- Pazder, D. The revitalization of the downtown cultural space as the factor of increasing the city attractiveness. Sci. Pap. Poznań Univ. Technol. Archit. Urban Plan. 2010, 22, 123–127. [Google Scholar]
- Sahebzadeh, S.; Heidari, A.; Kamelnia, H.; Baghbani, A. Sustainability Features of Iran’s Vernacular Architecture: A Comparative Study between the Architecture of Hot–Arid and Hot–Arid–Windy Regions. Sustainability 2017, 9, 749. [Google Scholar] [CrossRef] [Green Version]
- Bazazzadeh, H.; Mehan, A.; Nadolny, A.; Hashemi Safaei, S. The Importance of Flexibility in Adaptive Reuse of Industrial Heritage: Learning from Iranian Cases. Int. J. Conserv. Sci. 2021, 12, 113–128. [Google Scholar]
- Foruzanmehr, A. People’s perception of the loggia: A vernacular passive cooling system in Iranian architecture. Sustain. Cities Soc. 2015, 19, 61–67. [Google Scholar] [CrossRef]
- Bazazzadeh, H. Truth of sincerity and authenticity or lie of reconstruction; Whom do the visitors of cultural heritage trust? In Defining the Architectural Space—The Truth and Lie of Architecture; Battaino, C., Bonenberg, A., Dal Fabbro, A., Juzwa, N., Kobylarczyk, J., Malacarne, G., Segal, R., Słyk, J., Eds.; ATUT: Kraków, Poland, 2019; Volume 9, pp. 7–18. [Google Scholar]
- Ragette, F. Traditional Domestic Architecture of the Arab Region; Google-Books-ID: dLWm6eVwnwAC; Edition Axel Menges: Zlín, Czech Republic, 2003; ISBN 978-3-932565-30-4. [Google Scholar]
- Soleymanpour, R.; Parsaee, N.; Banaei, M. Climate Comfort Comparison of Vernacular and Contemporary Houses of Iran. Procedia—Soc. Behav. Sci. 2015, 201, 49–61. [Google Scholar] [CrossRef] [Green Version]
- Bazazzadeh, H.; Nadolny, A.; Hashemi Safaei, S. Climate Change and Building Energy Consumption: A Review of the Impact of Weather Parameters Influenced by Climate Change on Household Heating and Cooling Demands of Buildings. Eur. J. Sustain. Dev. 2021, 10, 1–12. [Google Scholar] [CrossRef]
- Bazazzadeh, H.; Pilechiha, P.; Nadolny, A.; Mahdavinejad, M.; Hashemi Safaei, S. The Impact Assessment of Climate Change on Building Energy Consumption in Poland. Energies 2021, 14, 4084. [Google Scholar] [CrossRef]
- Tabrizikahou, A.; Nowotarski, P. Mitigating the Energy Consumption and the Carbon Emission in the Building Structures by Optimization of the Construction Processes. Energies 2021, 14, 3287. [Google Scholar] [CrossRef]
- Khalili, M.; Amindeldar, S. Traditional solutions in low energy buildings of hot-arid regions of Iran. Sustain. Cities Soc. 2014, 13, 171–181. [Google Scholar] [CrossRef]
- Shahamat, H. Formal Sustainability in Traditional Architecture of Iran According to Five Principles of Traditional Architecture of Iran. J. Appl. Environ. Biol. Sci. 2014, 4, 100–110. [Google Scholar]
- Abouei, R. Conservation of Badgirs and Qanats in Yazd, Central Iran. In Proceedings of the 23rd Conference en Passive and Low Energy Architecture, Geneve, Switzerland, 6–8 September 2006. [Google Scholar]
- Tavassoli, M. Urban Structure and Architecture in the Hot Arid Zone of Iran; University of Tehran Press: Tehran, Iran, 1982. [Google Scholar]
- Keshtkaran, P. Harmonization Between Climate and Architecture in Vernacular Heritage: A Case Study in Yazd, Iran. Procedia Eng. 2011, 21, 428–438. [Google Scholar] [CrossRef] [Green Version]
- Amiriparyan, P.; Kiani, Z. Analyzing the Homogenous Nature of Central Courtyard Structure in Formation of Iranian Traditional Houses. Procedia–Soc. Behav. Sci. 2016, 216, 905–915. [Google Scholar] [CrossRef] [Green Version]
- Memariyan, G. Introduction to House Typology in Iran, House without Courtyard; University of Science and Technology: Tehran, Iran, 1990. [Google Scholar]
- Mahdavinejad, M.; Yazdi, H. Daylightophil Approach towards High-Performance Architecture for Hybrid-Optimization of Visual Comfort and Daylight Factor in BSk. Int. J. Archit. Environ. Eng. 2017, 11, 1324–1327. [Google Scholar]
- Krizhevsky, A.; Sutskever, I.; Hinton, G.E. ImageNet Classification with Deep Convolutional Neural Networks. Adv. Neural Inf. Process. Syst. 2012, 25, 1097–1105. [Google Scholar] [CrossRef]
- Lasaponara, R.; Masini, N. (Eds.) Satellite Remote Sensing: A New Tool for Archaeology; Remote Sensing and Digital Image Processing; Springer: Dordrecht, The Netherlands, 2012. [Google Scholar] [CrossRef] [Green Version]
- Leisz, S.J. An Overview of the Application of Remote Sensing to Archaeology During the Twentieth Century. In Mapping Archaeological Landscapes from Space; Comer, D.C., Harrower, M.J., Eds.; SpringerBriefs in Archaeology; Springer: New York, NY, USA, 2013; pp. 11–19. [Google Scholar] [CrossRef]
- Parcak, S.H. Satellite Remote Sensing for Archaeology; Routledge: Abingdon-on-Thames, UK, 2009. [Google Scholar] [CrossRef]
- Wiseman, J.R.; El-Baz, F. (Eds.) Remote Sensing in Archaeology; Interdisciplinary Contributions to Archaeology; Springer: New York, NY, USA, 2007. [Google Scholar] [CrossRef] [Green Version]
- Li, C.; Min, X.; Sun, S.; Lin, W.; Tang, Z. DeepGait: A Learning Deep Convolutional Representation for View-Invariant Gait Recognition Using Joint Bayesian. Appl. Sci. 2017, 7, 210. [Google Scholar] [CrossRef]
- Tajbakhsh, N.; Shin, J.Y.; Gurudu, S.R.; Hurst, R.T.; Kendall, C.B.; Gotway, M.B.; Liang, J. Convolutional Neural Networks for Medical Image Analysis: Full Training or Fine Tuning? IEEE Trans. Med Imaging 2016, 35, 1299–1312. [Google Scholar] [CrossRef] [Green Version]
- Pedraza, A.; Bueno, G.; Deniz, O.; Cristóbal, G.; Blanco, S.; Borrego-Ramos, M. Automated Diatom Classification (Part B): A Deep Learning Approach. Appl. Sci. 2017, 7, 460. [Google Scholar] [CrossRef] [Green Version]
- Sa, I.; Ge, Z.; Dayoub, F.; Upcroft, B.; Perez, T.; McCool, C. DeepFruits: A Fruit Detection System Using Deep Neural Networks. Sensors 2016, 16, 1222. [Google Scholar] [CrossRef] [Green Version]
- Goel, A.; Juneja, M.; Jawahar, C.V. Are buildings only instances? exploration in architectural style categories. In ICVGIP ’12: Proceedings of the Eighth Indian Conference on Computer Vision, Graphics and Image Processing, Mumbai, India, 16–19 December 2012; Association for Computing Machinery: New York, NY, USA, 2012; pp. 1–8. [Google Scholar] [CrossRef]
- Zhang, L.; Song, M.; Liu, X.; Sun, L.; Chen, C.; Bu, J. Recognizing architecture styles by hierarchical sparse coding of blocklets. Inf. Sci. 2014, 254, 141–154. [Google Scholar] [CrossRef]
- Chu, W.T.; Tsai, M.H. Visual pattern discovery for architecture image classification and product image search. In ICMR ’12: Proceedings of the 2nd ACM International Conference on Multimedia Retrieval, Hong Kong, China, 5–8 June 2012; Association for Computing Machinery: New York, NY, USA, 2012; pp. 1–8. [Google Scholar] [CrossRef]
- Oses, N.; Dornaika, F.; Moujahid, A. Image-Based Delineation and Classification of Built Heritage Masonry. Remote Sens. 2014, 6, 1863–1889. [Google Scholar] [CrossRef] [Green Version]
- Soflaei, F.; Shokouhian, M.; Mofidi Shemirani, S.M. Investigation of Iranian traditional courtyard as passive cooling strategy (a field study on BS climate). Int. J. Sustain. Built Environ. 2016, 5, 99–113. [Google Scholar] [CrossRef] [Green Version]
- Khoshelham, K.; Nardinocchi, C.; Frontoni, E.; Mancini, A.; Zingaretti, P. Performance evaluation of automated approaches to building detection in multi-source aerial data. ISPRS J. Photogramm. Remote Sens. 2010, 65, 123–133. [Google Scholar] [CrossRef] [Green Version]
- Xu, Y.; Wu, L.; Xie, Z.; Chen, Z. Building Extraction in Very High Resolution Remote Sensing Imagery Using Deep Learning and Guided Filters. Remote Sens. 2018, 10, 144. [Google Scholar] [CrossRef] [Green Version]
- Huang, J.; Zhang, X.; Xin, Q.; Sun, Y.; Zhang, P. Automatic building extraction from high-resolution aerial images and LiDAR data using gated residual refinement network. ISPRS J. Photogramm. Remote Sens. 2019, 151, 91–105. [Google Scholar] [CrossRef]
- Petrovska, B.; Zdravevski, E.; Lameski, P.; Corizzo, R.; Štajduhar, I.; Lerga, J. Deep Learning for Feature Extraction in Remote Sensing: A Case-Study of Aerial Scene Classification. Sensors 2020, 20, 3906. [Google Scholar] [CrossRef] [PubMed]
- Soroush, M.; Mehrtash, A.; Khazraee, E.; Ur, J.A. Deep Learning in Archaeological Remote Sensing: Automated Qanat Detection in the Kurdistan Region of Iraq. Remote Sens. 2020, 12, 500. [Google Scholar] [CrossRef] [Green Version]
- Wang, S.; Hou, X.; Zhao, X. Automatic Building Extraction From High-Resolution Aerial Imagery via Fully Convolutional Encoder-Decoder Network With Non-Local Block. IEEE Access 2020, 8, 7313–7322. [Google Scholar] [CrossRef]
- Xiong, Y.; Chen, Q.; Zhu, M.; Zhang, Y.; Huang, K. Accurate Detection of Historical Buildings Using Aerial Photographs and Deep Transfer Learning. In Proceedings of the IGARSS 2020—2020 IEEE International Geoscience and Remote Sensing Symposium, Waikoloa, HI, USA, 26 September–2 October 2020; pp. 1592–1595. [Google Scholar] [CrossRef]
- Yu, D.; Ji, S.; Liu, J.; Wei, S. Automatic 3D building reconstruction from multi-view aerial images with deep learning. ISPRS J. Photogramm. Remote Sens. 2021, 171, 155–170. [Google Scholar] [CrossRef]
- Memarian, G.; Brown, F.E. Climate, culture, and religion: Aspects of the traditional courtyard house in Iran. J. Archit. Plan. Res. 2003, 20, 181–198. [Google Scholar]
- Soflaei, F.; Shokouhian, M.; Mofidi Shemirani, S.M. Traditional Iranian courtyards as microclimate modifiers by considering orientation, dimensions, and proportions. Front. Archit. Res. 2016, 5, 225–238. [Google Scholar] [CrossRef] [Green Version]
- Zarei, E.M.; Ashkezari, S.F.M.; Yari, M. The investigation of the function of the central courtyard in moderating the harsh environmental conditions of a hot and dry climate (Case study: City of Yazd, Iran). Spatium 2018, 2017, 1–9. [Google Scholar] [CrossRef]
- Hajian, M.; Alitajer, S.; Mahdavinejad, M. The Influence of Courtyard on the Formation of Iranian Traditional Houses Configuration in Kashan. Arman. Archit. Urban Dev. 2020, 13, 43–55. [Google Scholar] [CrossRef]
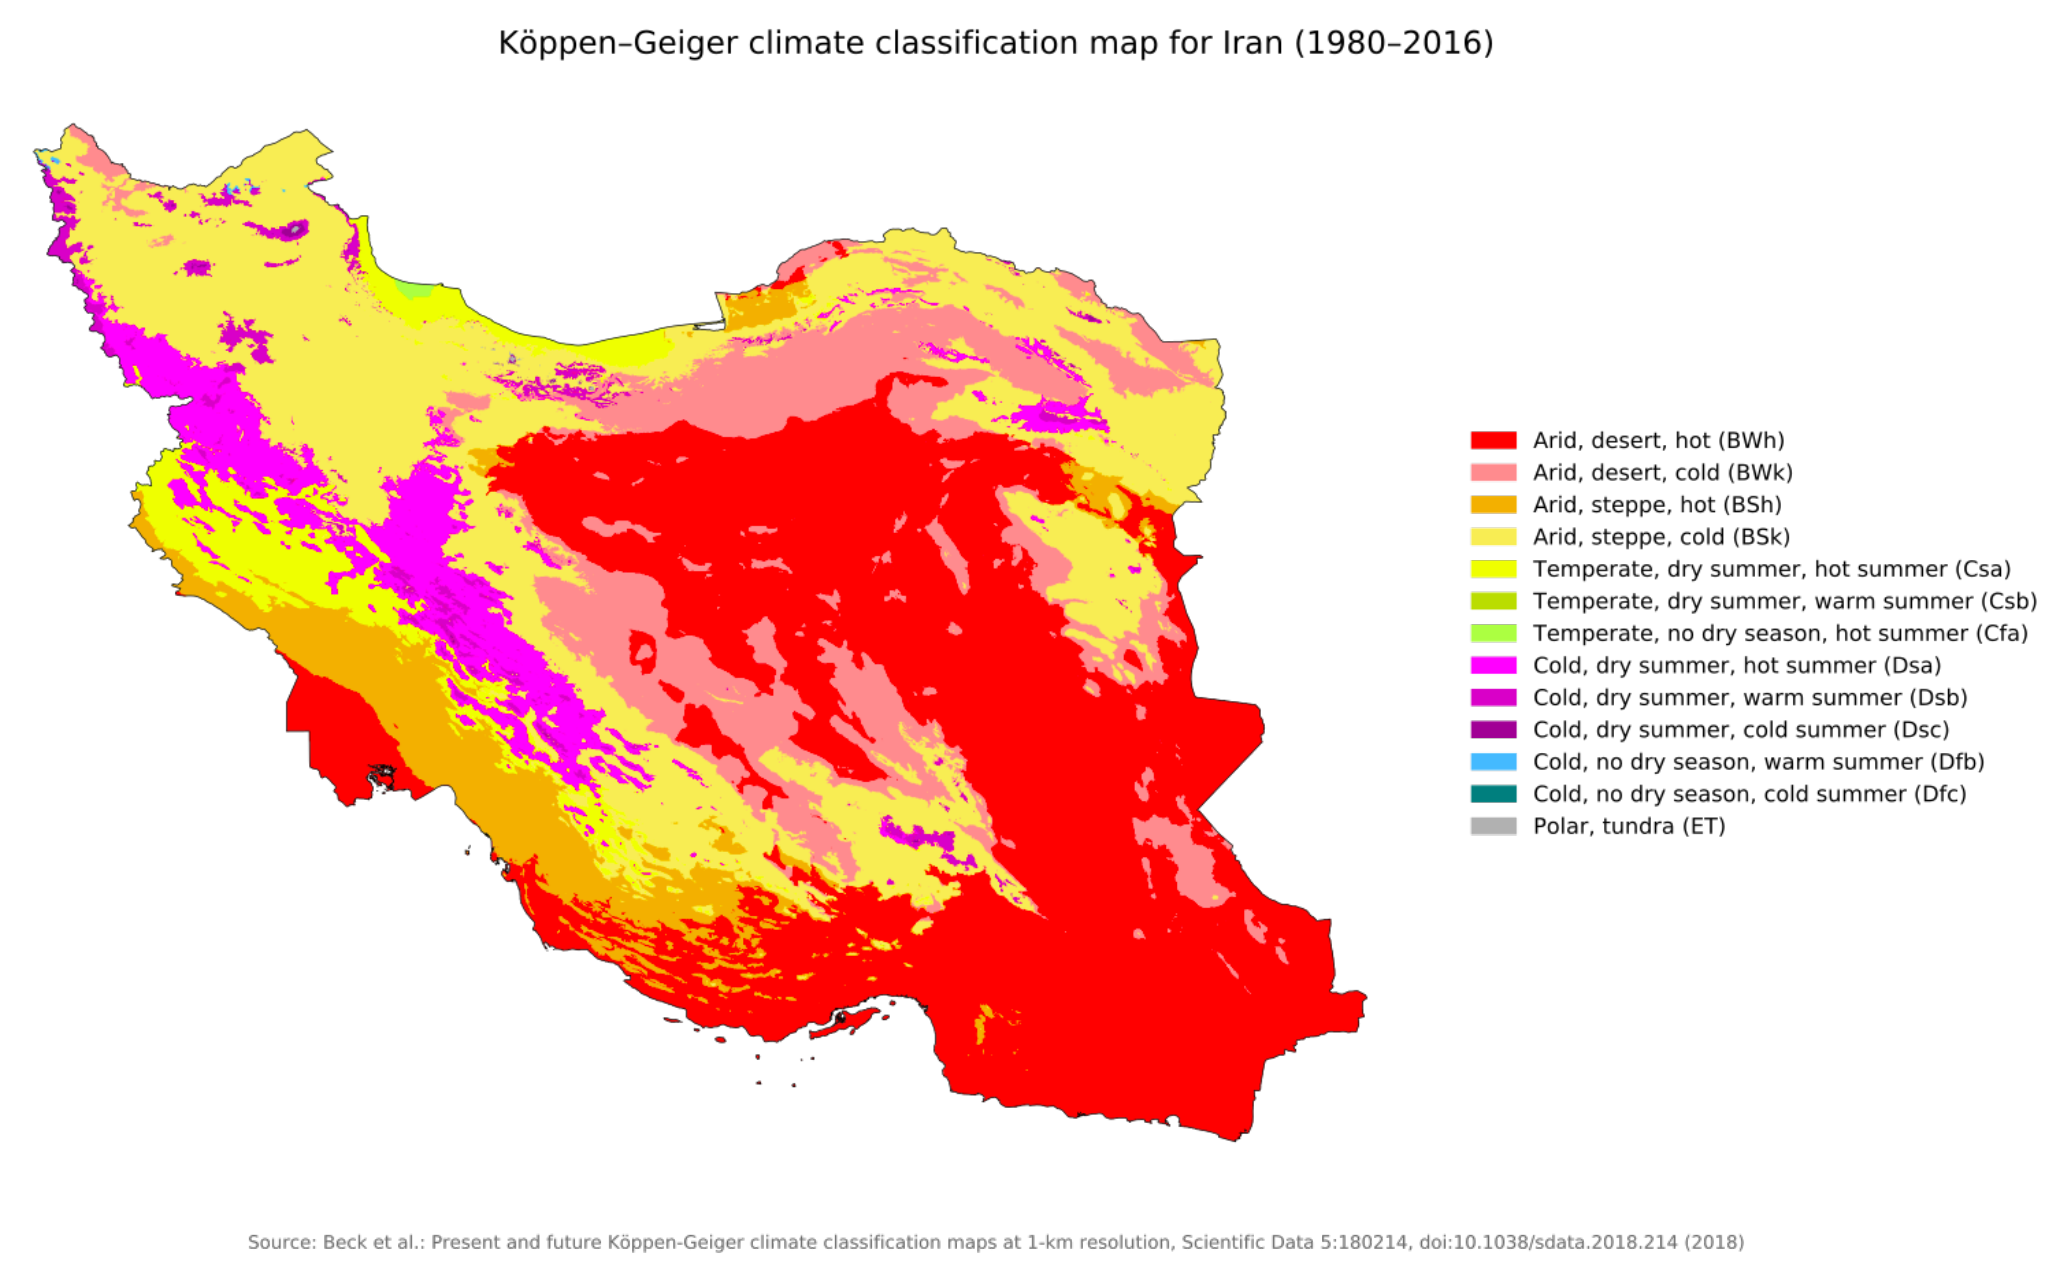
- Raziei, T. Köppen-Geiger climate classification of Iran and investigation of its changes during 20th century. J. Earth Space Phys. 2017, 43, 419–439. [Google Scholar] [CrossRef]
- Raziei, T. Köppen–Geiger Climate Classification Map for Iran. 2018. Available online: https://www.researchgate.net/figure/Koeppen-Geiger-climate-classification-of-Iran-22_fig1_341741246 (accessed on 4 October 2021).
- Dai, D.; Yang, W. Satellite Image Classification via Two-Layer Sparse Coding With Biased Image Representation. IEEE Geosci. Remote Sens. Lett. 2011, 8, 173–176. [Google Scholar] [CrossRef] [Green Version]
- Zhang, D.; Meng, D.; Han, J. Co-Saliency Detection via a Self-Paced Multiple-Instance Learning Framework. IEEE Trans. Pattern Anal. Mach. Intell. 2017, 39, 865–878. [Google Scholar] [CrossRef]
- Tian, Y.; Chen, C.; Shah, M. Cross-View Image Matching for Geo-Localization in Urban Environments. In Proceedings of the IEEE Conference on Computer Vision and Pattern Recognition, Honolulu, HI, USA, 21–26 July 2017; pp. 3608–3616. [Google Scholar]
- Girshick, R. Fast R-CNN. In Proceedings of the IEEE International Conference on Computer Vision, Santiago, Chile, 7–13 December 2015; pp. 1440–1448. [Google Scholar]
- Ren, S.; He, K.; Girshick, R.; Sun, J. Faster R-CNN: Towards Real-Time Object Detection with Region Proposal Networks. IEEE Trans. Pattern Anal. Mach. Intell. 2017, 39, 1137–1149. [Google Scholar] [CrossRef] [PubMed] [Green Version]
- Everingham, M.; Eslami, S.M.A.; Van Gool, L.; Williams, C.K.I.; Winn, J.; Zisserman, A. The Pascal Visual Object Classes Challenge: A Retrospective. Int. J. Comput. Vis. 2015, 111, 98–136. [Google Scholar] [CrossRef]
- Liu, W.; Anguelov, D.; Erhan, D.; Szegedy, C.; Reed, S.; Fu, C.Y.; Berg, A.C. SSD: Single Shot MultiBox Detector. In Computer Vision—ECCV 2016; Lecture Notes in Computer Science; Leibe, B., Matas, J., Sebe, N., Welling, M., Eds.; Springer International Publishing: Cham, Swizerland, 2016; pp. 21–37. [Google Scholar] [CrossRef] [Green Version]
- Redmon, J.; Divvala, S.; Girshick, R.; Farhadi, A. You Only Look Once: Unified, Real-Time Object Detection. In Proceedings of the IEEE Conference on Computer Vision and Pattern Recognition, Las Vegas, NV, USA, 27–30 June 2016; pp. 779–788. [Google Scholar]
- Lin, T.Y.; Maire, M.; Belongie, S.; Hays, J.; Perona, P.; Ramanan, D.; Dollár, P.; Zitnick, C.L. Microsoft COCO: Common Objects in Context. In Computer Vision—ECCV 2014; Fleet, D., Pajdla, T., Schiele, B., Tuytelaars, T., Eds.; Lecture Notes in Computer Science; Springer International Publishing: Cham, Switzerland, 2014; pp. 740–755. [Google Scholar] [CrossRef] [Green Version]
- Tayara, H.; Chong, K.T. Object Detection in Very High-Resolution Aerial Images Using One-Stage Densely Connected Feature Pyramid Network. Sensors 2018, 18, 3341. [Google Scholar] [CrossRef] [Green Version]
- He, K.; Zhang, X.; Ren, S.; Sun, J. Deep Residual Learning for Image Recognition. In Proceedings of the 2016 IEEE Conference on Computer Vision and Pattern Recognition (CVPR), Las Vegas, NV, USA, 27–30 June 2016; pp. 770–778. [Google Scholar] [CrossRef] [Green Version]
- Yosinski, J.; Clune, J.; Bengio, Y.; Lipson, H. How transferable are features in deep neural networks? arXiv 2014, arXiv:1411.1792. [Google Scholar]
- He, K.; Gkioxari, G.; Dollár, P.; Girshick, R. Mask R-CNN. arXiv 2018, arXiv:1703.06870v3. [Google Scholar]
- Jeong, D.; Kim, Y. Keypoint-based Deep Learning Approach for Building Footprint Extraction Using Aerial Images. Korean J. Remote Sens. 2021, 37, 111–122. [Google Scholar] [CrossRef]
- He, K.; Gkioxari, G.; Dollár, P.; Girshick, R. Mask R-CNN. In Proceedings of the 2017 IEEE International Conference on Computer Vision (ICCV), Venice, Italy, 22–29 October 2017; pp. 2980–2988. [Google Scholar] [CrossRef]
- Zhang, X. Simple Understanding of Mask RCNN. 2018. Available online: https://alittlepain833.medium.com/simple-understanding-of-mask-rcnn-134b5b330e95 (accessed on 5 October 2021).
- Ren, S.; He, K.; Girshick, R.; Sun, J. Faster R-CNN: Towards Real-Time Object Detection with Region Proposal Networks. Adv. Neural Inf. Process. Syst. 2015, 28, 91–99. [Google Scholar] [CrossRef] [PubMed] [Green Version]
- Girshick, R.; Donahue, J.; Darrell, T.; Malik, J. Region-Based Convolutional Networks for Accurate Object Detection and Segmentation. IEEE Trans. Pattern Anal. Mach. Intell. 2016, 38, 142–158. [Google Scholar] [CrossRef] [PubMed]

| Zone | Equation | Mesoclimate | Equation | City | Equation |
|---|---|---|---|---|---|
| BS | W = 0.8 L + 0.17 | BSks | W = 0.73 L + 2.4 | Mashhad | W = 0.7 L + 3.67 |
| Shiraz | W = −0.04 L − 13.9 | ||||
| Tehran | W = 1.17L − 4 | ||||
| BShs | W = 0.85 L − 2.8 | Dezful | W = −0.1 L + 8.26 | ||
| Shushtar | W = 0.99 L − 5.49 |
| Climate Divisions | Bsh | Bsk | Bwh | Bwh |
|---|---|---|---|---|
| Shiraz | Abarkooh | Bushehr | Birjand | |
| Esfehan | Semnan | Meybod | ||
| Kong | Yazd |
| City | Scale of Pixels in Meters | Northern Angle in Degrees |
|---|---|---|
| Abarkooh | 0.075 | −4.76 |
| Birjand | 0.083 | −1.35 |
| Bushehr | 0.099 | +30.39 |
| Esfehan | 0.058 | −31.40 |
| Kong | 0.045 | +35.23 |
| Meybod | 0.074 | −68.90 |
| Semnan | 0.051 | +26.03 |
| Shiraz | 0.087 | −36.45 |
| Yazd | 0.071 | −34.60 |
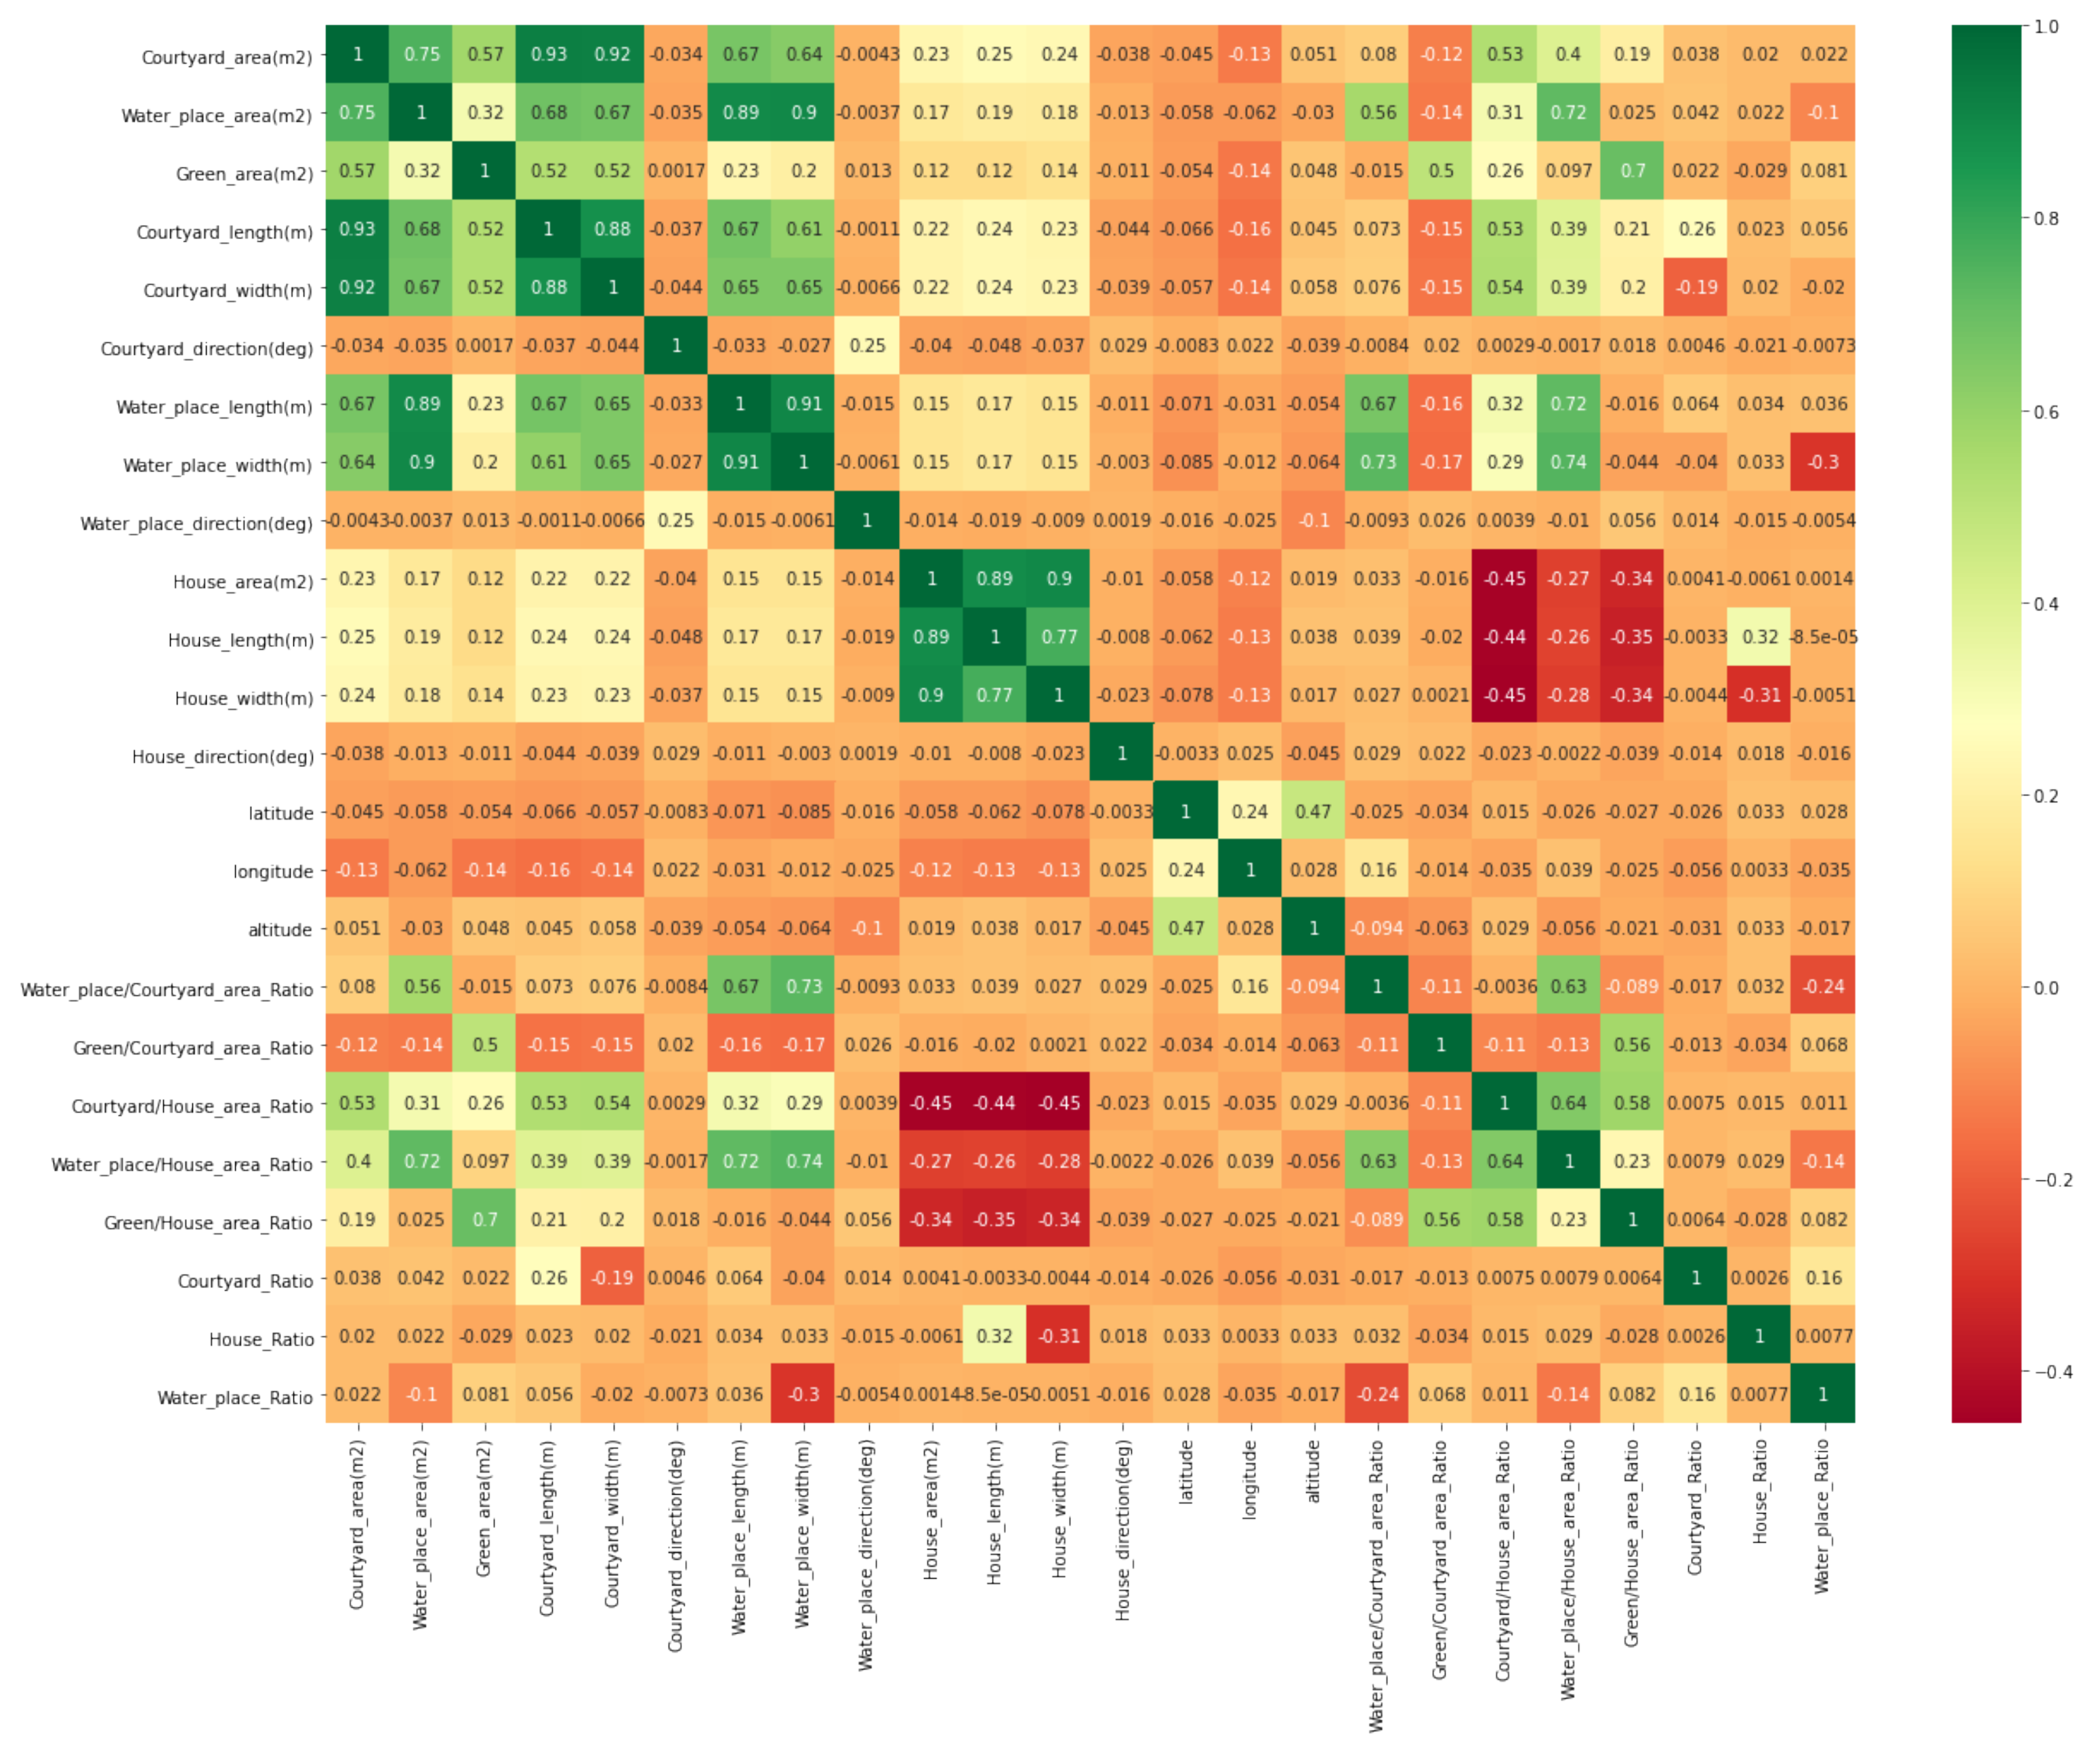
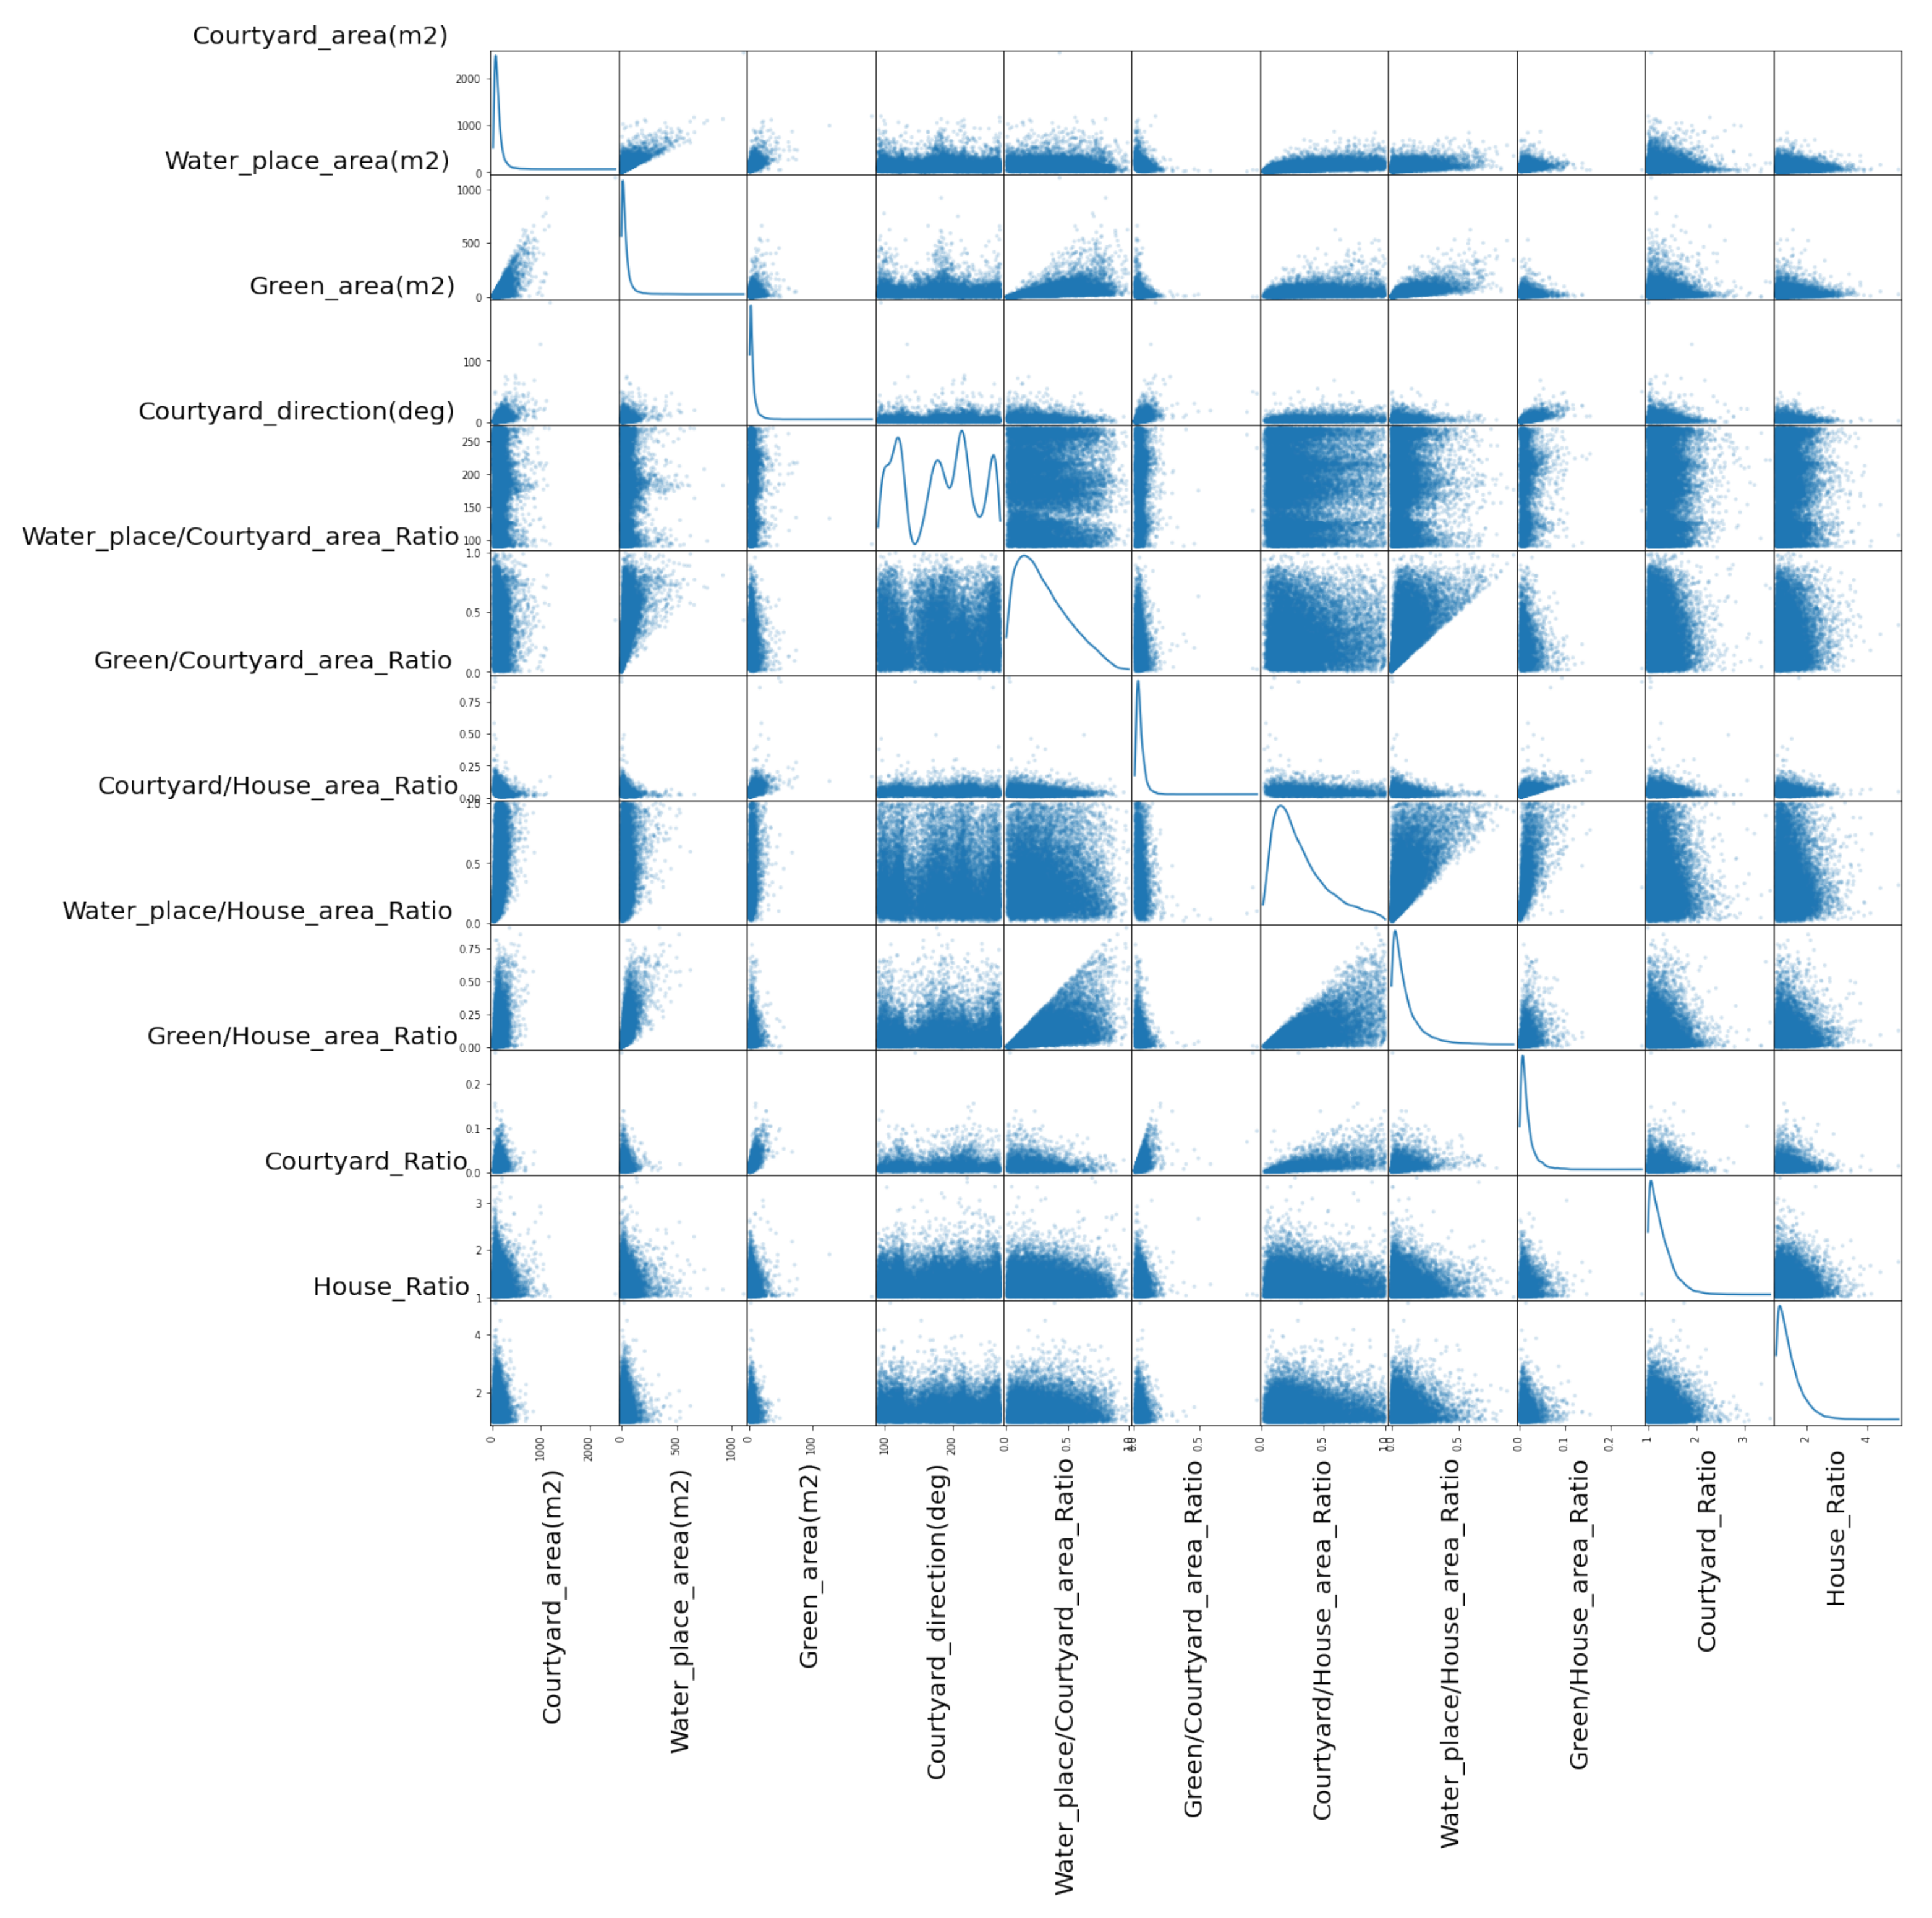
| Geometric (22 Features) | Climatic (54 Features) |
|---|---|
| Courtyard_area (m2), Water_place_area (m2), Green_area (m2), Courtyard_length (m), Courtyard_width (m), Courtyard_direction (deg), Water_place_length (m), Water_place_width (m), Water_place_direction (deg), House_area (m2), House_length (m), House_width (m), House_direction (deg), City, Water_place/Courtyard_area_Ratio, Green/Courtyard_area_Ratio, Courtyard/House_area_Ratio, Water_place/House_area_Ratio, Green/House_area_Ratio, Courtyard_Ratio, House_Ratio, Water_place_Ratio | climate_divisions, latitude, longitude, altitude, temp_air_mean, temp_air_min, temp_air_50%, temp_air_max, temp_dew_mean, temp_dew_min, temp_dew_50%, temp_dew_max, relative_humidity_mean, relative_humidity_min, relative_humidity_50%, relative_humidity_max, atmospheric_pressure_mean, atmospheric_pressure_min, atmospheric_pressure_50%, atmospheric_pressure_max, etr_mean, etr_min, etr_50%, etr_max, ghi_infrared_mean, ghi_infrared_min, ghi_infrared_50%, ghi_infrared_max, dni_mean, dni_min, dni_50%, dni_max, dhi_mean, dhi_min, dhi_50%, dhi_max, global_hor_illum_mean, global_hor_illum_min, global_hor_illum_50%, global_hor_illum_max, diffuse_horizontal_illum_mean, diffuse_horizontal_illum_min, diffuse_horizontal_illum_50%, diffuse_horizontal_illum_max, wind_direction_mean, wind_direction_50%, wind_speed_mean, wind_speed_min, wind_speed_50%, wind_speed_max, precipitable_water_mean, precipitable_water_min, precipitable_water_50%, precipitable_water_max, |
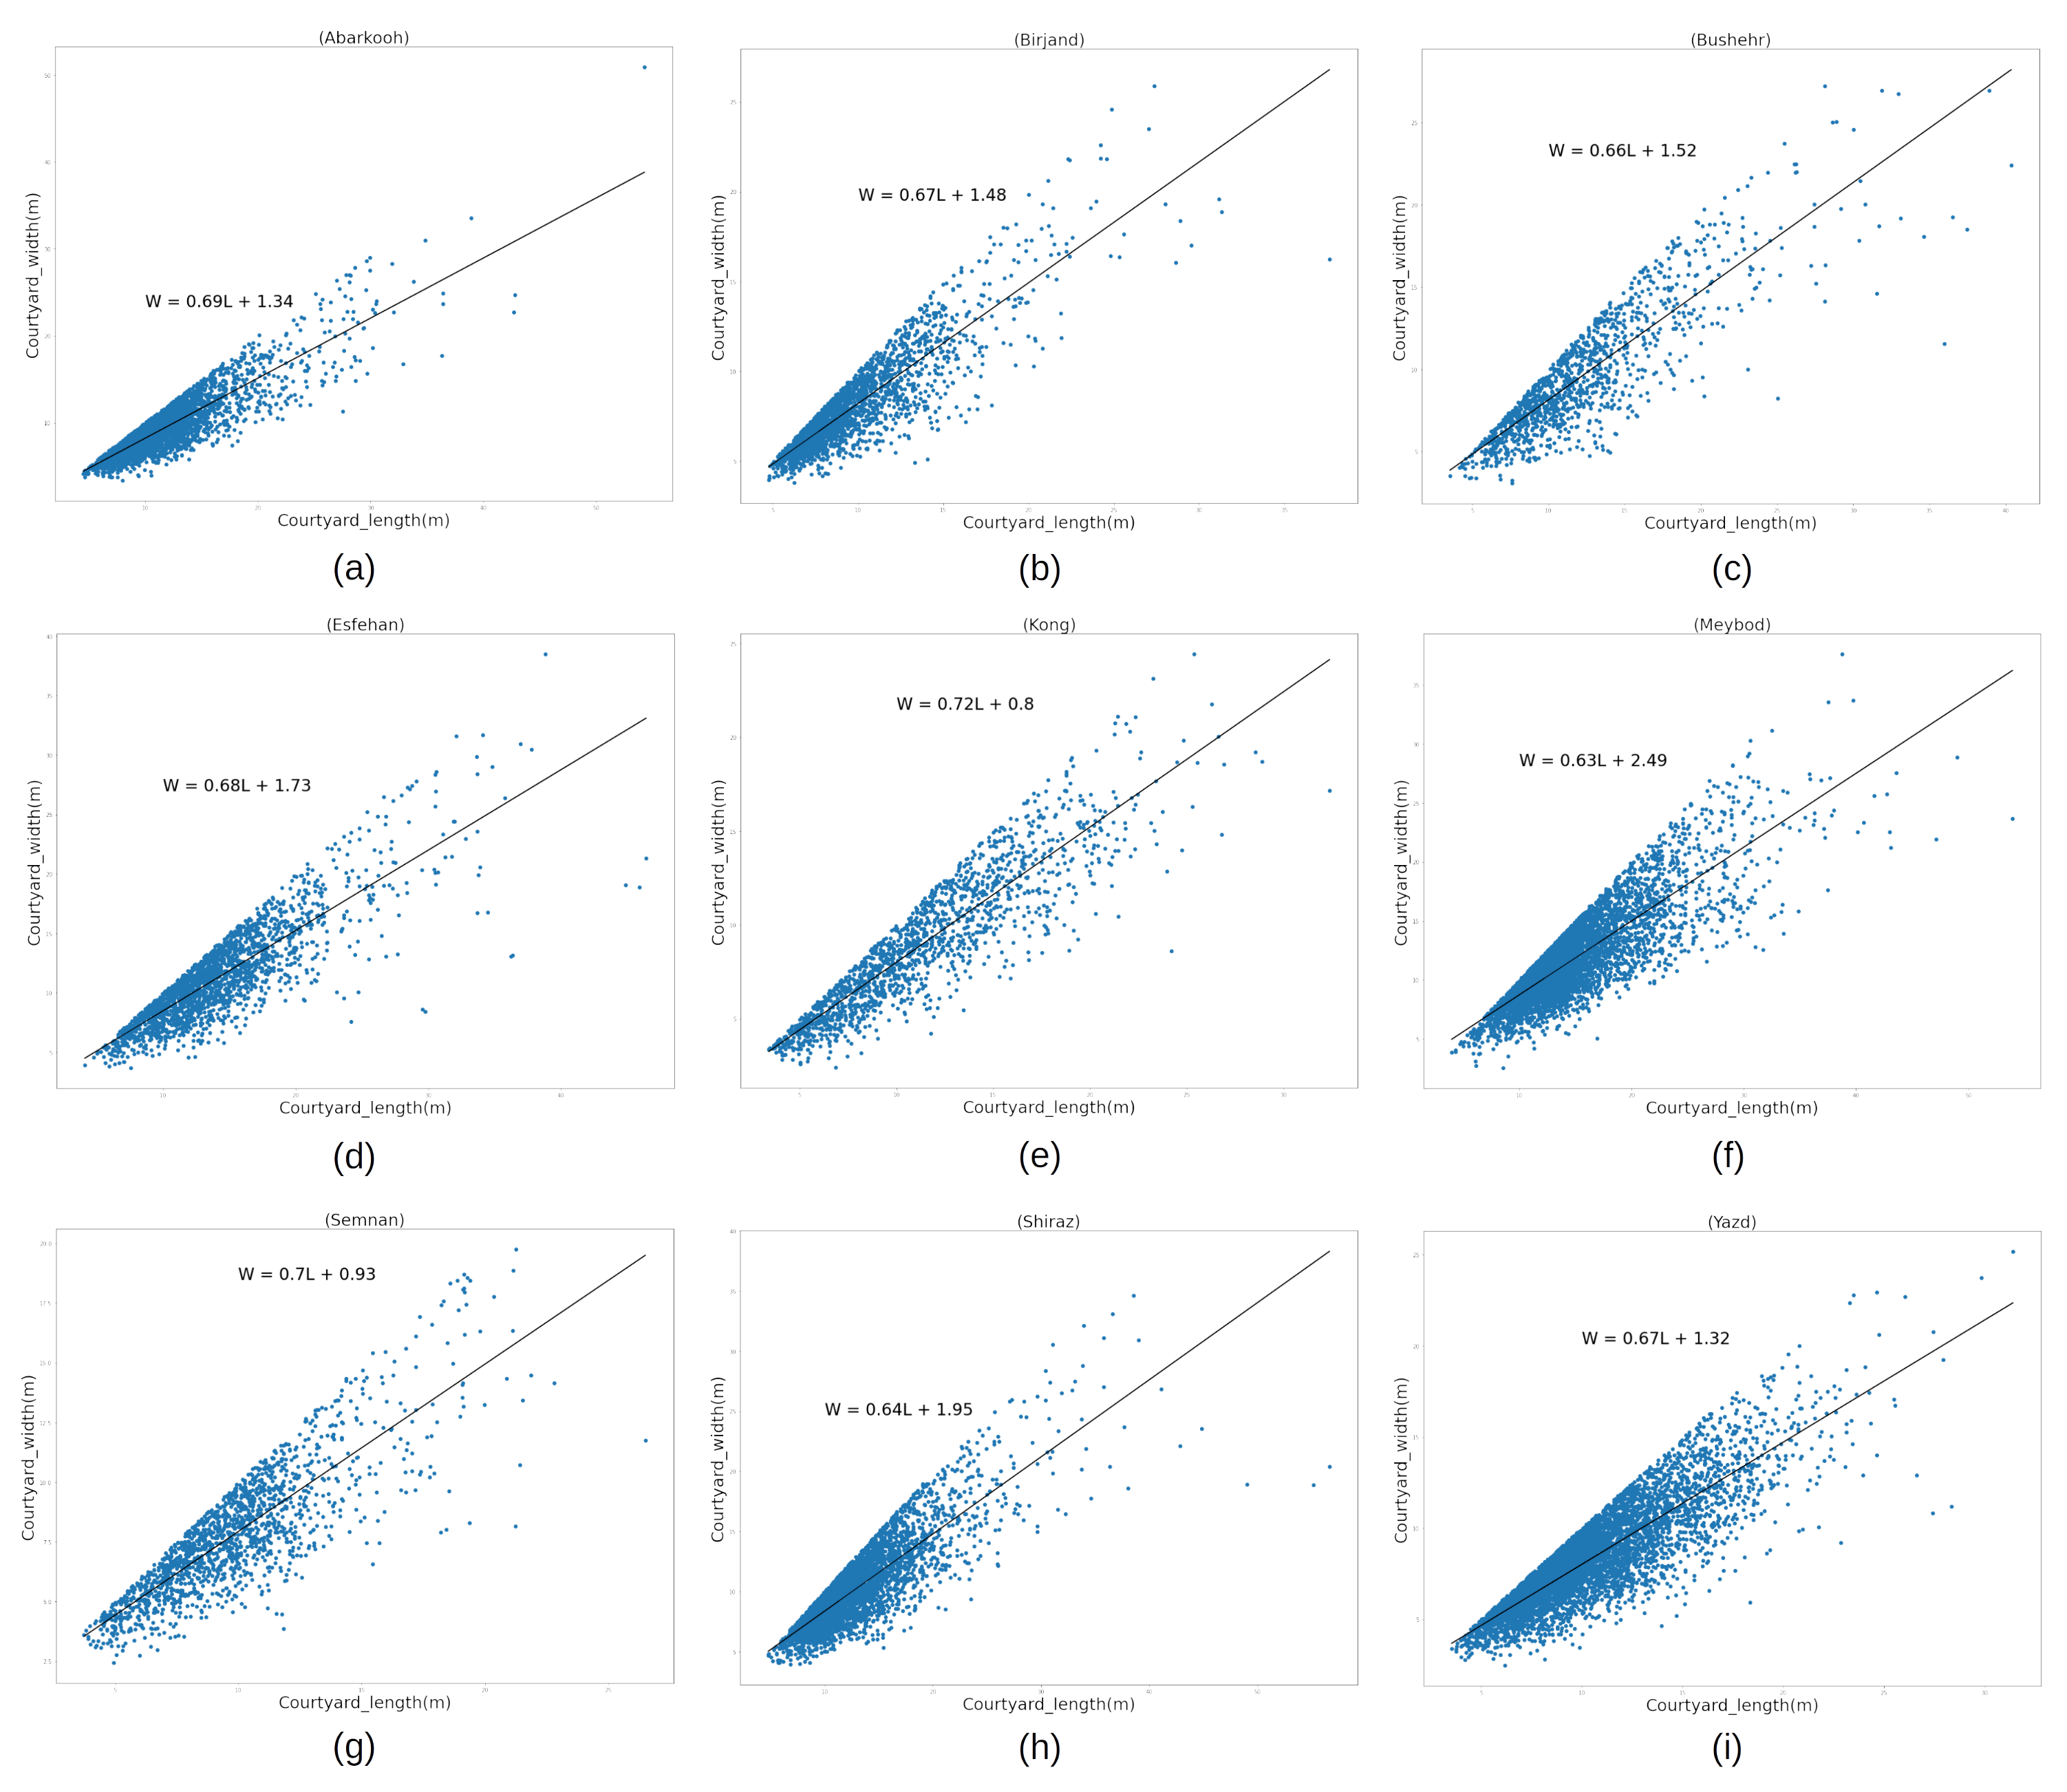
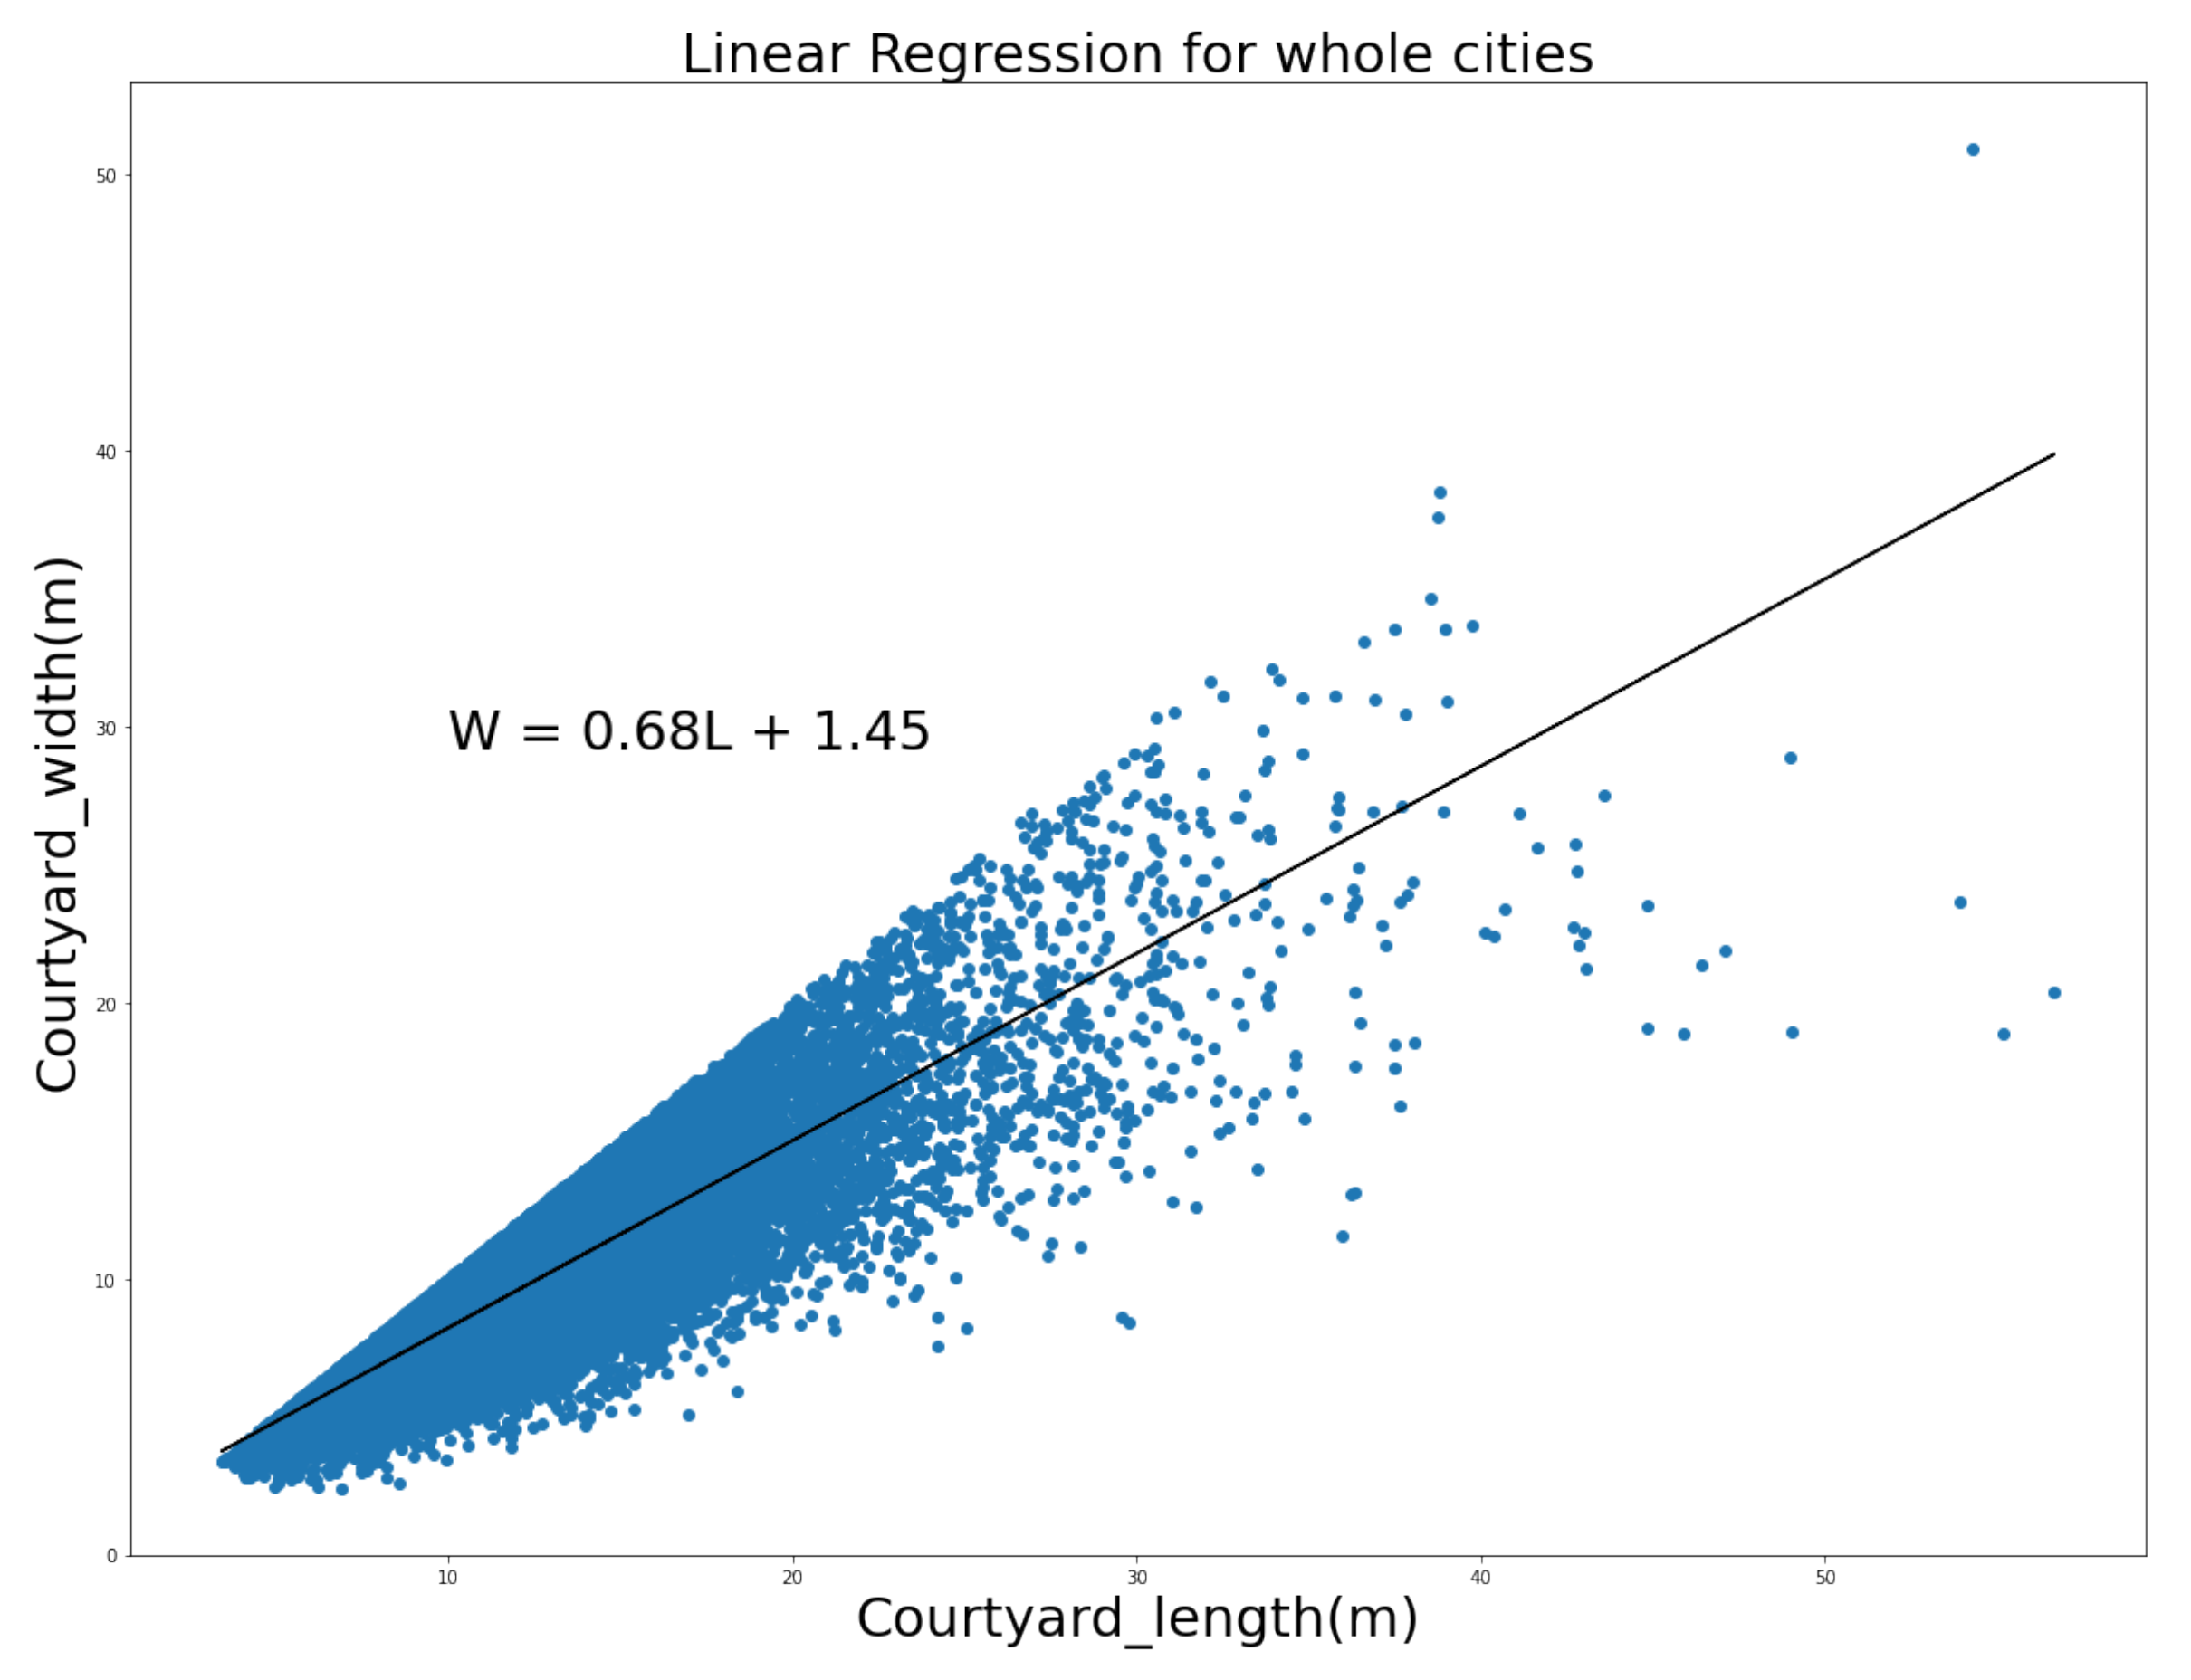
| Dataset (Figure 16) | Climate Zones | Cities (Figure 17) | |||
|---|---|---|---|---|---|
| Dataset | W = 0.68L + 1.45 | BSh | (a)W = 0.64L + 1.95 | Shiraz | (H)W = 0.64L + 1.95 |
| BSk | (b)W = 0.69L + 1.45 | Abarkooh | (a)W = 0.69L + 1.34 | ||
| Esfehan | (d)W = 0.68L + 1.73 | ||||
| BWh | (c)W = 0.7L + 1.04 | Bushehr | (c)W = 0.66L + 1.52 | ||
| Semnan | (g)W = 0.7L + 0.93 | ||||
| Kong | (e)W = 0.72L + 0.8 | ||||
| BWk | (d)W = 0.67L + 1.53 | Meybod | (f)W = 0.63L + 2.49 | ||
| Birjand | (b)W = 0.67L + 1.48 | ||||
| Yazd | (i)W = 0.67L + 1.32 | ||||
Publisher’s Note: MDPI stays neutral with regard to jurisdictional claims in published maps and institutional affiliations. |
© 2021 by the authors. Licensee MDPI, Basel, Switzerland. This article is an open access article distributed under the terms and conditions of the Creative Commons Attribution (CC BY) license (https://creativecommons.org/licenses/by/4.0/).
Share and Cite
Yazdi, H.; Vukorep, I.; Banach, M.; Moazen, S.; Nadolny, A.; Starke, R.; Bazazzadeh, H. Central Courtyard Feature Extraction in Remote Sensing Aerial Images Using Deep Learning: A Case-Study of Iran. Remote Sens. 2021, 13, 4843. https://doi.org/10.3390/rs13234843
Yazdi H, Vukorep I, Banach M, Moazen S, Nadolny A, Starke R, Bazazzadeh H. Central Courtyard Feature Extraction in Remote Sensing Aerial Images Using Deep Learning: A Case-Study of Iran. Remote Sensing. 2021; 13(23):4843. https://doi.org/10.3390/rs13234843
Chicago/Turabian StyleYazdi, Hadi, Ilija Vukorep, Marzena Banach, Sajad Moazen, Adam Nadolny, Rolf Starke, and Hassan Bazazzadeh. 2021. "Central Courtyard Feature Extraction in Remote Sensing Aerial Images Using Deep Learning: A Case-Study of Iran" Remote Sensing 13, no. 23: 4843. https://doi.org/10.3390/rs13234843