Article

Arctic Tundra Land Cover Classification on the Beaufort Coast Using the Kennaugh Element Framework on Dual-Polarimetric TerraSAR-X Imagery

1
Department of Physical Geography, Stockholm University, 10691 Stockholm, Sweden
2
b.geos, 2100 Korneuburg, Austria
3
German Aerospace Center (DLR), German Remote Sensing Data Center (DFD), 82234 Wessling, Germany
4
Centre for Microbiology and Environmental Systems Science, Division of Terrestrial Ecosystem Research, University of Vienna, 1030 Wien, Austria
5
National Research Council, Institute of Polar Science (ISP-CNR), 30172 Venezia, Italy
6
Department of Environmental Sciences, Informatics and Statistics, University Ca’ Foscari of Venice, 30172 Venezia, Italy
7
Bolin Centre for Climate Research, Stockholm University, 10691 Stockholm, Sweden
*
Author to whom correspondence should be addressed.
Remote Sens. 2021, 13(23), 4780; https://doi.org/10.3390/rs13234780
Submission received: 5 October 2021 / Revised: 1 November 2021 / Accepted: 18 November 2021 / Published: 25 November 2021

Abstract

:
Arctic tundra landscapes are highly complex and are rapidly changing due to the warming climate. Datasets that document the spatial and temporal variability of the landscape are needed to monitor the rapid changes. Synthetic Aperture Radar (SAR) imagery is specifically suitable for monitoring the Arctic, as SAR, unlike optical remote sensing, can provide time series regardless of weather and illumination conditions. This study examines the potential of seasonal backscatter mechanisms in Arctic tundra environments for improving land cover classification purposes by using a time series of HH/HV TerraSAR-X (TSX) imagery. A Random Forest (RF) classification was applied on multi-temporal Sigma Nought intensity and multi-temporal Kennaugh matrix element data. The backscatter analysis revealed clear differences in the polarimetric response of water, soil, and vegetation, while backscatter signal variations within different vegetation classes were more nuanced. The RF models showed that land cover classes could be distinguished with 92.4% accuracy for the Kennaugh element data, compared to 57.7% accuracy for the Sigma Nought intensity data. Texture predictors, while improving the classification accuracy on the one hand, degraded the spatial resolution of the land cover product. The Kennaugh elements derived from TSX winter acquisitions were most important for the RF model, followed by the Kennaugh elements derived from summer and autumn acquisitions. The results of this study demonstrate that multi-temporal Kennaugh elements derived from dual-polarized X-band imagery are a powerful tool for Arctic tundra land cover mapping.

Graphical Abstract

1. Introduction

1.1. The Impact of Climate Change on Arctic Tundra Landscapes

The climate in the Arctic is warming at a rate more than double the magnitude of the global mean [1], which is expected to have major impacts on both local and global scale [2]. Due to the warming climate, permafrost soils thaw, and some of the stored soil organic carbon is expected to be mobilized [3]. The mineralization rates of the soil organic matter pool and associated carbon fluxes are dynamic and complex processes depending on local climate, vegetation, and soil parameters of the heterogeneous tundra landscape [3,4]. In addition, permafrost thaw enhanced by milder winters with thicker and longer snow cover causes the degradation of distinctive permafrost landforms such as tundra polygons [5,6,7]. Climate change also causes shifts in Arctic vegetation, changing both the distribution ranges of species and the composition of vegetation communities [8,9]. This affects both the relative distribution of land cover types and the dynamics of the physical processes occurring in the Arctic tundra landscape. Altogether, the Arctic tundra is a highly complex landscape with changing physical processes being interconnected by various feedback mechanisms. Up-to-date datasets, comprising the temporal and spatial variability of key parameters, such as satellite derived land cover [4,10,11] and landforms [12], that drive these physical processes, are scarce but crucial to monitor rapid changes in the Arctic tundra [10,13,14]. In this context, the value of Synthetic Aperture Radar (SAR) data has gained recent attention [11,14,15,16,17,18,19].

1.2. State of the Art for Arctic Tundra Landscape Monitoring with Synthetic Aperture Radar Data

In situ observations of land cover types for the Arctic tundra landscape are sparse due to logistical challenges and high costs [20]. Such in situ observations have been used to train and validate land cover products based on optical remote sensing at both regional and local scale [4,8,10,21]. However, optical images in Arctic regions are limited due to extensive cloud cover and polar nights [10]. SAR functions independently of weather and illumination conditions and can overcome these limitations of optical remote sensing systems [22,23]. In addition, SAR backscatter depends on vegetation structure, water content and underlying soil surface properties and thereby adds unique information complementary to optical remote sensing methods, e.g., [23].
The suitability of SAR to monitor surface features in the (sub)-Arctic tundra is demonstrated by a range of studies. The study by Ullmann et al. [14] showed that shorter X- and C-band wavelengths are more sensitive to tundra land cover and surface properties than the longer L-band wavelength. The sensitivity of X- and C-band data to vegetation parameters such as %-cover [6], height [6,24], and phytomass [25] have been investigated and positively assessed. In addition, ground properties such as Active Layer Depth (ALD) [26] and soil moisture [27,28,29] have been studied using X-band and C-band data, respectively. Moreover, the study by Stettner et al. [5] proposes a method for snow melt monitoring in tundra using X-band data. The TerraSAR-X (TSX) and TanDEM-X (TDX) satellites, acquiring at X-band, and the RADARSAT-1 (R1) and -2 (R2) satellites, acquiring at C-band, are most often used to generate SAR-based high spatial resolution land cover maps for local study sites in the (sub)-Arctic. Dense time series of single-polarized (single-pol) TSX HH backscatter intensity and coherence data have been successfully used to evaluate seasonal changes in tundra landscapes in the Lena River delta, Russia, [16] and to map the permafrost landscape in northern Quebec, Canada [19].
The backscatter mechanisms for land cover types are best characterized by using polarimetric SAR (PolSAR) data. PolSAR exploits the wave polarization behavior of the incident and backscattered wave to explain the scattering of a target [30]. The scattering of natural earth targets can be categorized into three different types: (i) surface, (ii) double-bounce, and (iii) volume scattering. To differentiate between land cover types and to describe the polarimetric response of Arctic tundra landscapes, multiple polarimetric decomposition methods have been applied to PolSAR data: the Freeman–Durden decomposition [31] applied by [15,17], the Cloude–Pottier decomposition [32] by [11,14,17,33] and the Yamaguchi decomposition [34] by [11,14,17]. For these decomposition methods quad-polarized (quad-pol) data are necessary, while most SAR sensors acquire images in single- or dual-polarization (dual-pol) mode across the Arctic [35].
Dual-pol PolSAR data are a promising alternative to quad-pol data for monitoring purposes. The HH/VV channel combination is preferred over HH/HV or VV/VH to characterize wetland environments, because water–vegetation interactions create a strong double-bounce signal [15,18,35]. By contrast, the study by Ullmann et al. [23] found that in the Mackenzie Delta the volume scatter component from vegetation aided the land cover classification. This is in accordance with the findings from Duguay et al. [6], who reported that HV data became more important in winter when snow-ground and snow-vegetation interactions were more apparent. Hence, HH/HV data seem better suited for monitoring mixed and shrub-dominated tundra environments than HH/VV data. Only a small number of methods exist that can decompose dual-pol PolSAR data. Ullmann et al. [14] found that for both X- and C-band SAR, the two-component decomposition [23] features of dual-pol HH/VV data were correlated to the three-component Yamaguchi decomposition [23,34] features of quad-pol data. This correlation decreased when volume scattering contributed more to the scene [23]. In addition, the Kennaugh Element Framework (KEF) is able to decompose dual-pol PolSAR data [36]. For the tundra environment in the Mackenzie Delta, dual-pol HH/VV Kennaugh elements can be substituted for the quad-pol Kennaugh elements [23]. Nevertheless, further investigations covering additional sites across the Arctic are necessary to clarify the utility of the dual-pol Kennaugh elements for land cover mapping.

1.3. The Kennaugh Element Framework as a Potential Tool to Monitor the Artic Tundra Landscape Scatter Mechanisms

The KEF introduced by Schmitt et al. [36] is a mathematical framework for analyzing PolSAR data. The framework is unique as it can be applied on single-, dual- and quad-pol data for sensors with any frequency and spatial resolution. In addition, it is a framework that works well for multi-temporal analysis. This method is especially useful for the dual-pol HH/HV TSX time series employed in this study, as most other dual-pol decomposition methods are designed for specific PolSAR sensors [23,36]. Moreover, the framework uses the multi-scale multi-looking method, which provides improved radiometric stability while preserving the geometric resolution [36].
Previous studies used KEF as a tool for land cover classification [37,38]. Moser et al. [37] applied KEF on an X-band SAR HH/VV-polarized time series of the Lac Bam wetland in Africa and showed the possibilities of this method for land cover change detection. These authors found that a multi-temporal approach improved the classification accuracy and that K 0 and K 3 elements were most important for separating flooded from non-flooded vegetation. Open water was accurately classified by using solely intensity data ( K 0 ). Schmitt and Brisco [38] studied the temporal changes of the Gagetown wetland in New Brunswick, Canada, for each Kennaugh element separately [38]. In this way, they could link the temporal variation in flood extent to either changes in backscatter intensity or polarimetric behavior. Even though KEF is a solid method to decompose PolSAR data, relatively little attention has been given to the response of the Kennaugh elements in context to Arctic tundra landscapes.
The full Kennaugh matrix derived from C-band SAR is studied most in the Arctic [14,15,17], followed by the Kennaugh matrix derived from X-band SAR HH/VV [14,15,18,39] and only the study by Ullmann et al. [14] employed the Kennaugh matrix derived from X-band SAR HH/HV data. The Kennaugh elements were preferred over other polarimetric features for class separability [14] and classification [17]. Permafrost landscape features across three study sites in the Arctic were mapped using a simple threshold classification method based on the probability density functions of the K 0 , K 3 , and K 4 elements derived from X-band HH/VV data [18]. Furthermore, the study by [39] illustrated the potential of the K 0 element from C-band SAR VV/VH in combination with the K 0 element from X-band SAR HH/VV for separating between tundra and different wetland types. To our knowledge, the temporal behavior of the Kennaugh elements has not yet been investigated for Arctic tundra land cover types. Moreover, the KEF was not employed on X-band HH/HV data to map polygonal tundra grounds specifically, which could be of an advantage due to the sensitivity of X-band HV data to tundra land cover classes [23].

1.4. Aim and Objectives

This study investigates the seasonal backscatter mechanisms that characterize the Arctic tundra of the Canadian Beaufort Coast area, with the aim of improving medium-to-high resolution Arctic tundra land cover mapping. We combined field observations with a high-resolution optical image and a time series of dual-pol HH/HV X-band SAR data. The objectives of our study are two-fold: (i) analyzing a time series of Sigma Nought and Kennaugh element values for differences and similarities between land cover types, and (ii) testing the feasibility of PolSAR derived predictor variables for tundra land cover classification using a Random Forest (RF) classifier. For the Komakuk Beach study site, two medium spatial resolution land cover products are available. A product based upon Landsat-8 data with a resolution of 30m [40] and a product based upon Sentinel-1 (S1) and -2 (S2) data with a resolution of 20m [41]. However, higher-resolution land cover products are necessary for up scaling soil properties and for monitoring local processes, such as the degradation of polygon mires [42]. This study presents a high-resolution ( 5 m) land cover classification method based on a time series of dual-pol TSX data.

2. Materials

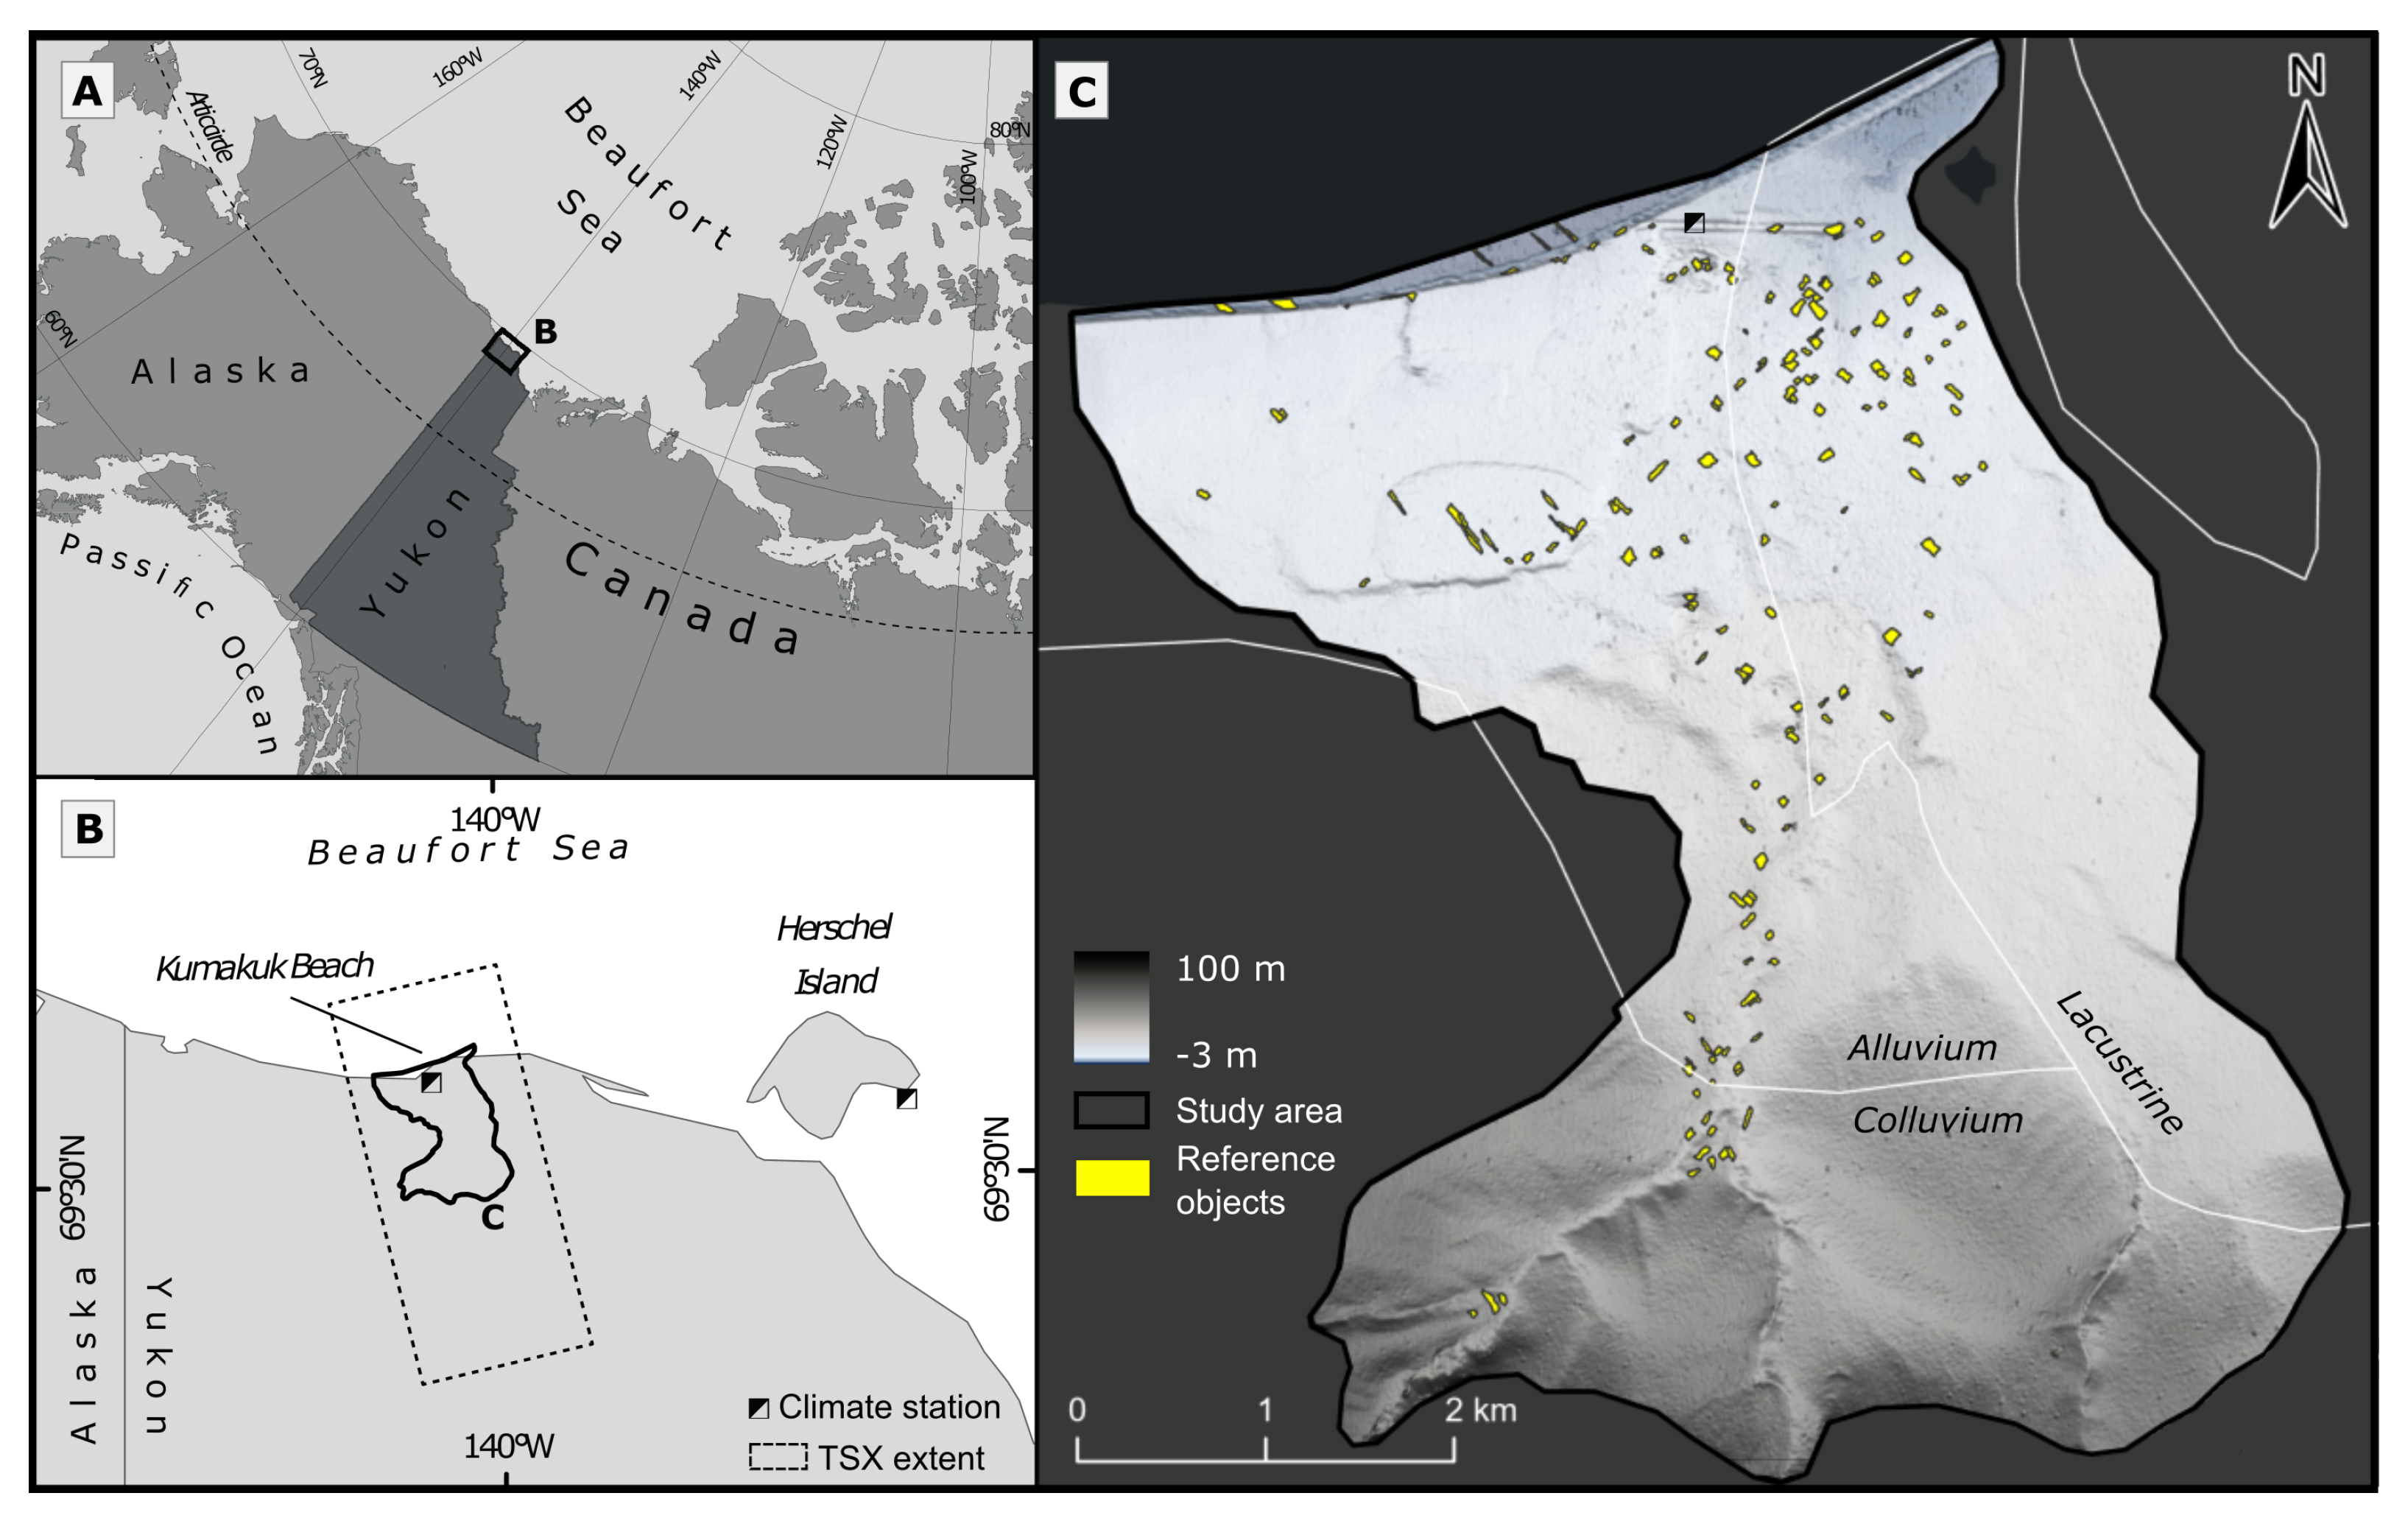
2.1. Area Description

The Komakuk Beach study area is located on the coastal plain of the Beaufort Sea in the Yukon Territory, Canada (Figure 1 and Table 1). The area covers 27 km 2 and lies within the Ivvavik National Park, which is part of the Inuvialuit Settlement Region [43]. In the period 1995–2015, the mean annual air temperature at the Komakuk Beach climate station ranged between −8 and −12 °C [44]. The climate is classified as Polar Tundra or Cold by the Köppen–Geiger Classification [45]. The topography of Komakuk Beach is mostly flat with some higher elevation toward the foothills of the British Mountains. The Quaternary deposits consist of colluvium deposits on the hill slopes and alluvium and lacustrine deposits on the coastal plain [46]. The study site is situated within the continuous permafrost domain [47], and the periglacial geomorphology is characterized by ice-wedge polygons delineated by troughs overlying massive below ground ice-wedges. This results in a typical microrelief pattern consisting of rims and low- and high-center polygons. The circumarctic vegetation map (CAVM) classifies Komakuk Beach to the bioclimate subzone E, which includes the densest vegetation cover of the Arctic and consists predominantly of tundra species [8,48]. The ice-wedge polygons are dominated by dwarf shrubs, graminoids, forbs, lichen, and moss. Taller shrubs are found around rivers and creeks [8].

2.2. Remote Sensing Data
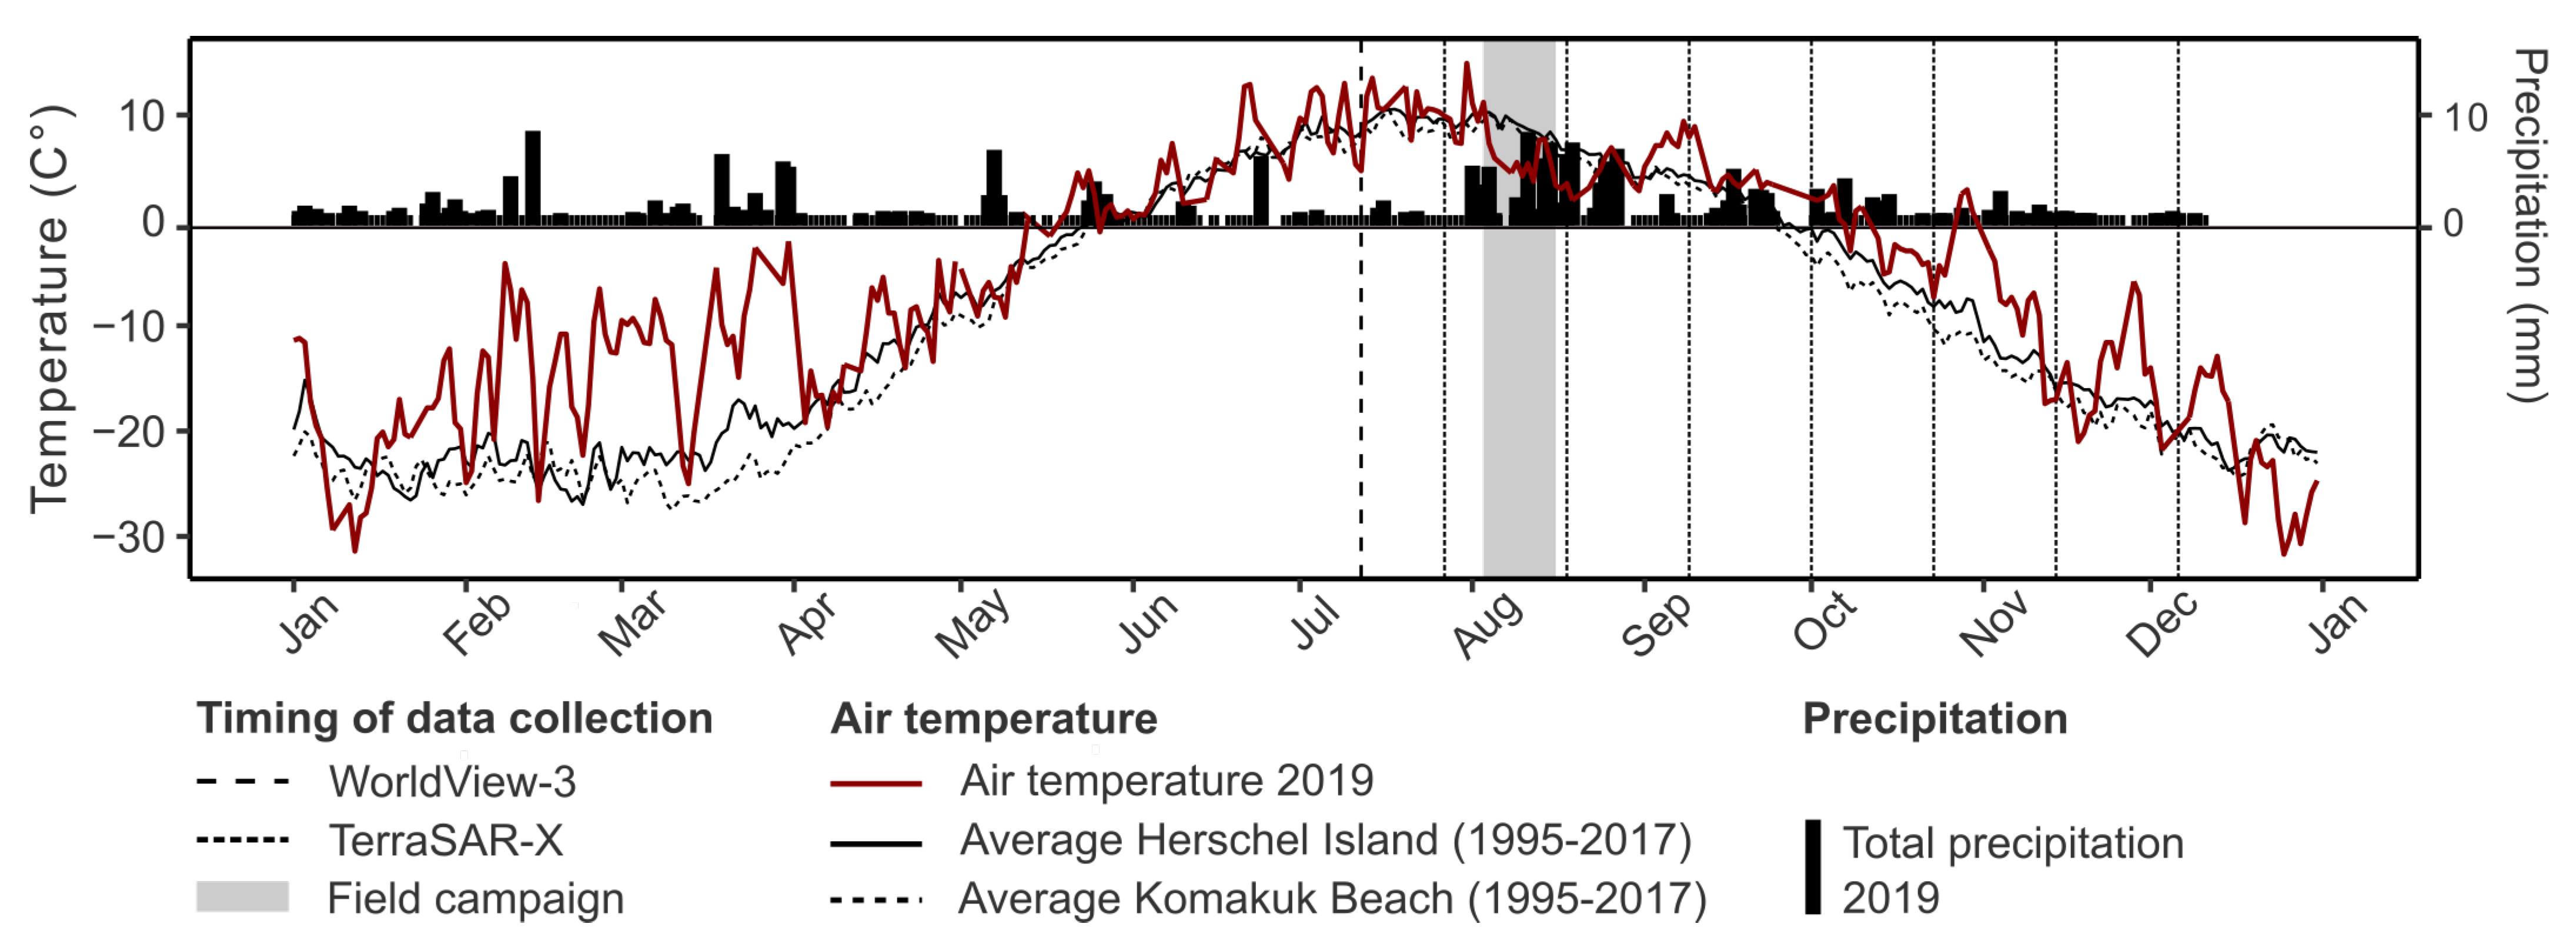
A SAR dataset was acquired spanning a period from July to December 2019, hence covering the peak-level of vegetation growth, the senescence stage, and the snow-covered period (Table 1). We specifically selected this period, as the studies by Duguay et al. [11] and Wang et al. [19] point out, that the environmental conditions from a non-frozen to a frozen state result in unique temporal backscatter trends for tundra land cover classes. The time series consists of seven X-band dual-pol (HH/HV) StripMap (SM) scenes ordered from the TSX and TDX platforms operated by the German Aerospace Center (DLR). The sensor settings were chosen to provide optimal polarimetric data for Arctic tundra land cover types. The X-band wavelength (3.1 cm) potentially interacts with low tundra and wetland vegetation [14] and is sensitive to soil moisture and surface roughness of barren and low vegetated areas [35]. The SM mode provides a relatively high resolution while enabling dual polarization [52]. HH/HV polarization was chosen as quad-pol data were not available for the year of the field campaign (2019) and the incidence angle was set to a high angle ( θ = 41.6°) to increase the relative importance of volume scattering [6,53]. The settings were the same for each acquisition date to enable stacking and comparison of the images. A Digital Surface Model (DSM) of the area was created by merging two ArcticDEM product tiles, version 3.0 Pan-Arctic Release 7 [49]. The absolute vertical and horizontal accuracy is approximately 4m without using uniform Ground Control Points (GCP). Co-registration of the ArcticDEM to laser altimetry data from the ICESat satellite improved the accuracy (Table 1). The ArcticDEM DSM should be sufficient to perform terrain corrections on the SAR imagery because the topography of study area is largely flat, the vegetation consists mostly of low vegetation and the DSM does not contain data gaps. A cloud-free high-resolution (1.24 m) multi-spectral image was acquired by the Worldview-3 (WV-3) satellite on 12 July 2019, approximately three weeks before the field campaign (Table 1) [50]. Optical images with no cloud cover are sparse in the Arctic; therefore, it is hard to exactly match field campaigns and image acquisitions [21]. However, both the WV-3 image acquisition and the field campaign took place during the peak-level of vegetation growth which is crucial for upscaling the field plots to reference objects. The predicted horizontal accuracy without using GCP’s is smaller than 3.5 m [54]. In addition, three cloud-free Sentinel-2 multi-spectral images from the European Union’s Copernicus program were visually interpreted for snow cover conditions on 2 October, 20 October, and 24 October 2019.

2.3. Climate Data

The Komakuk Beach climate station (69°35 41.3 N, 140°10 39.5 W) was not operating during the field campaign and satellite acquisition in 2019; therefore, climate data from the Herschel Island climate station (69°34 12.0 N, −138°51 36.0 W) were acquired. This climate station is located approximately 50 km to the East of Komakuk Beach (Figure 1). Figure 2 shows the mean daily temperature for 2019, the total daily precipitation for 2019, the average daily mean temperature (1995–2017) for both climate stations and covers the periods of satellite acquisition and field work. August was significantly more moist than the other months, while July and the beginning of September were relatively dry. The temperature dropped below freezing in October, and the first snow cover was observed on the 20 October Sentinel-2 acquisition (Figure S1, see supplementary data). The wind was strong during the 17 July, 18 August, and 6 December TSX acquisitions, with speeds up to 46 km/h. By contrast, the wind was very calm during the 9 September acquisition (8 km/h) (Table S1, Figure S2) [44]. The climate data are used to group the TSX images into the following periods: peak-level vegetation (27 July and 18 August); senescence (9 September and 1 October); and snow cover (23 October, 14 November, and 6 December).

2.4. In Situ and Reference Data
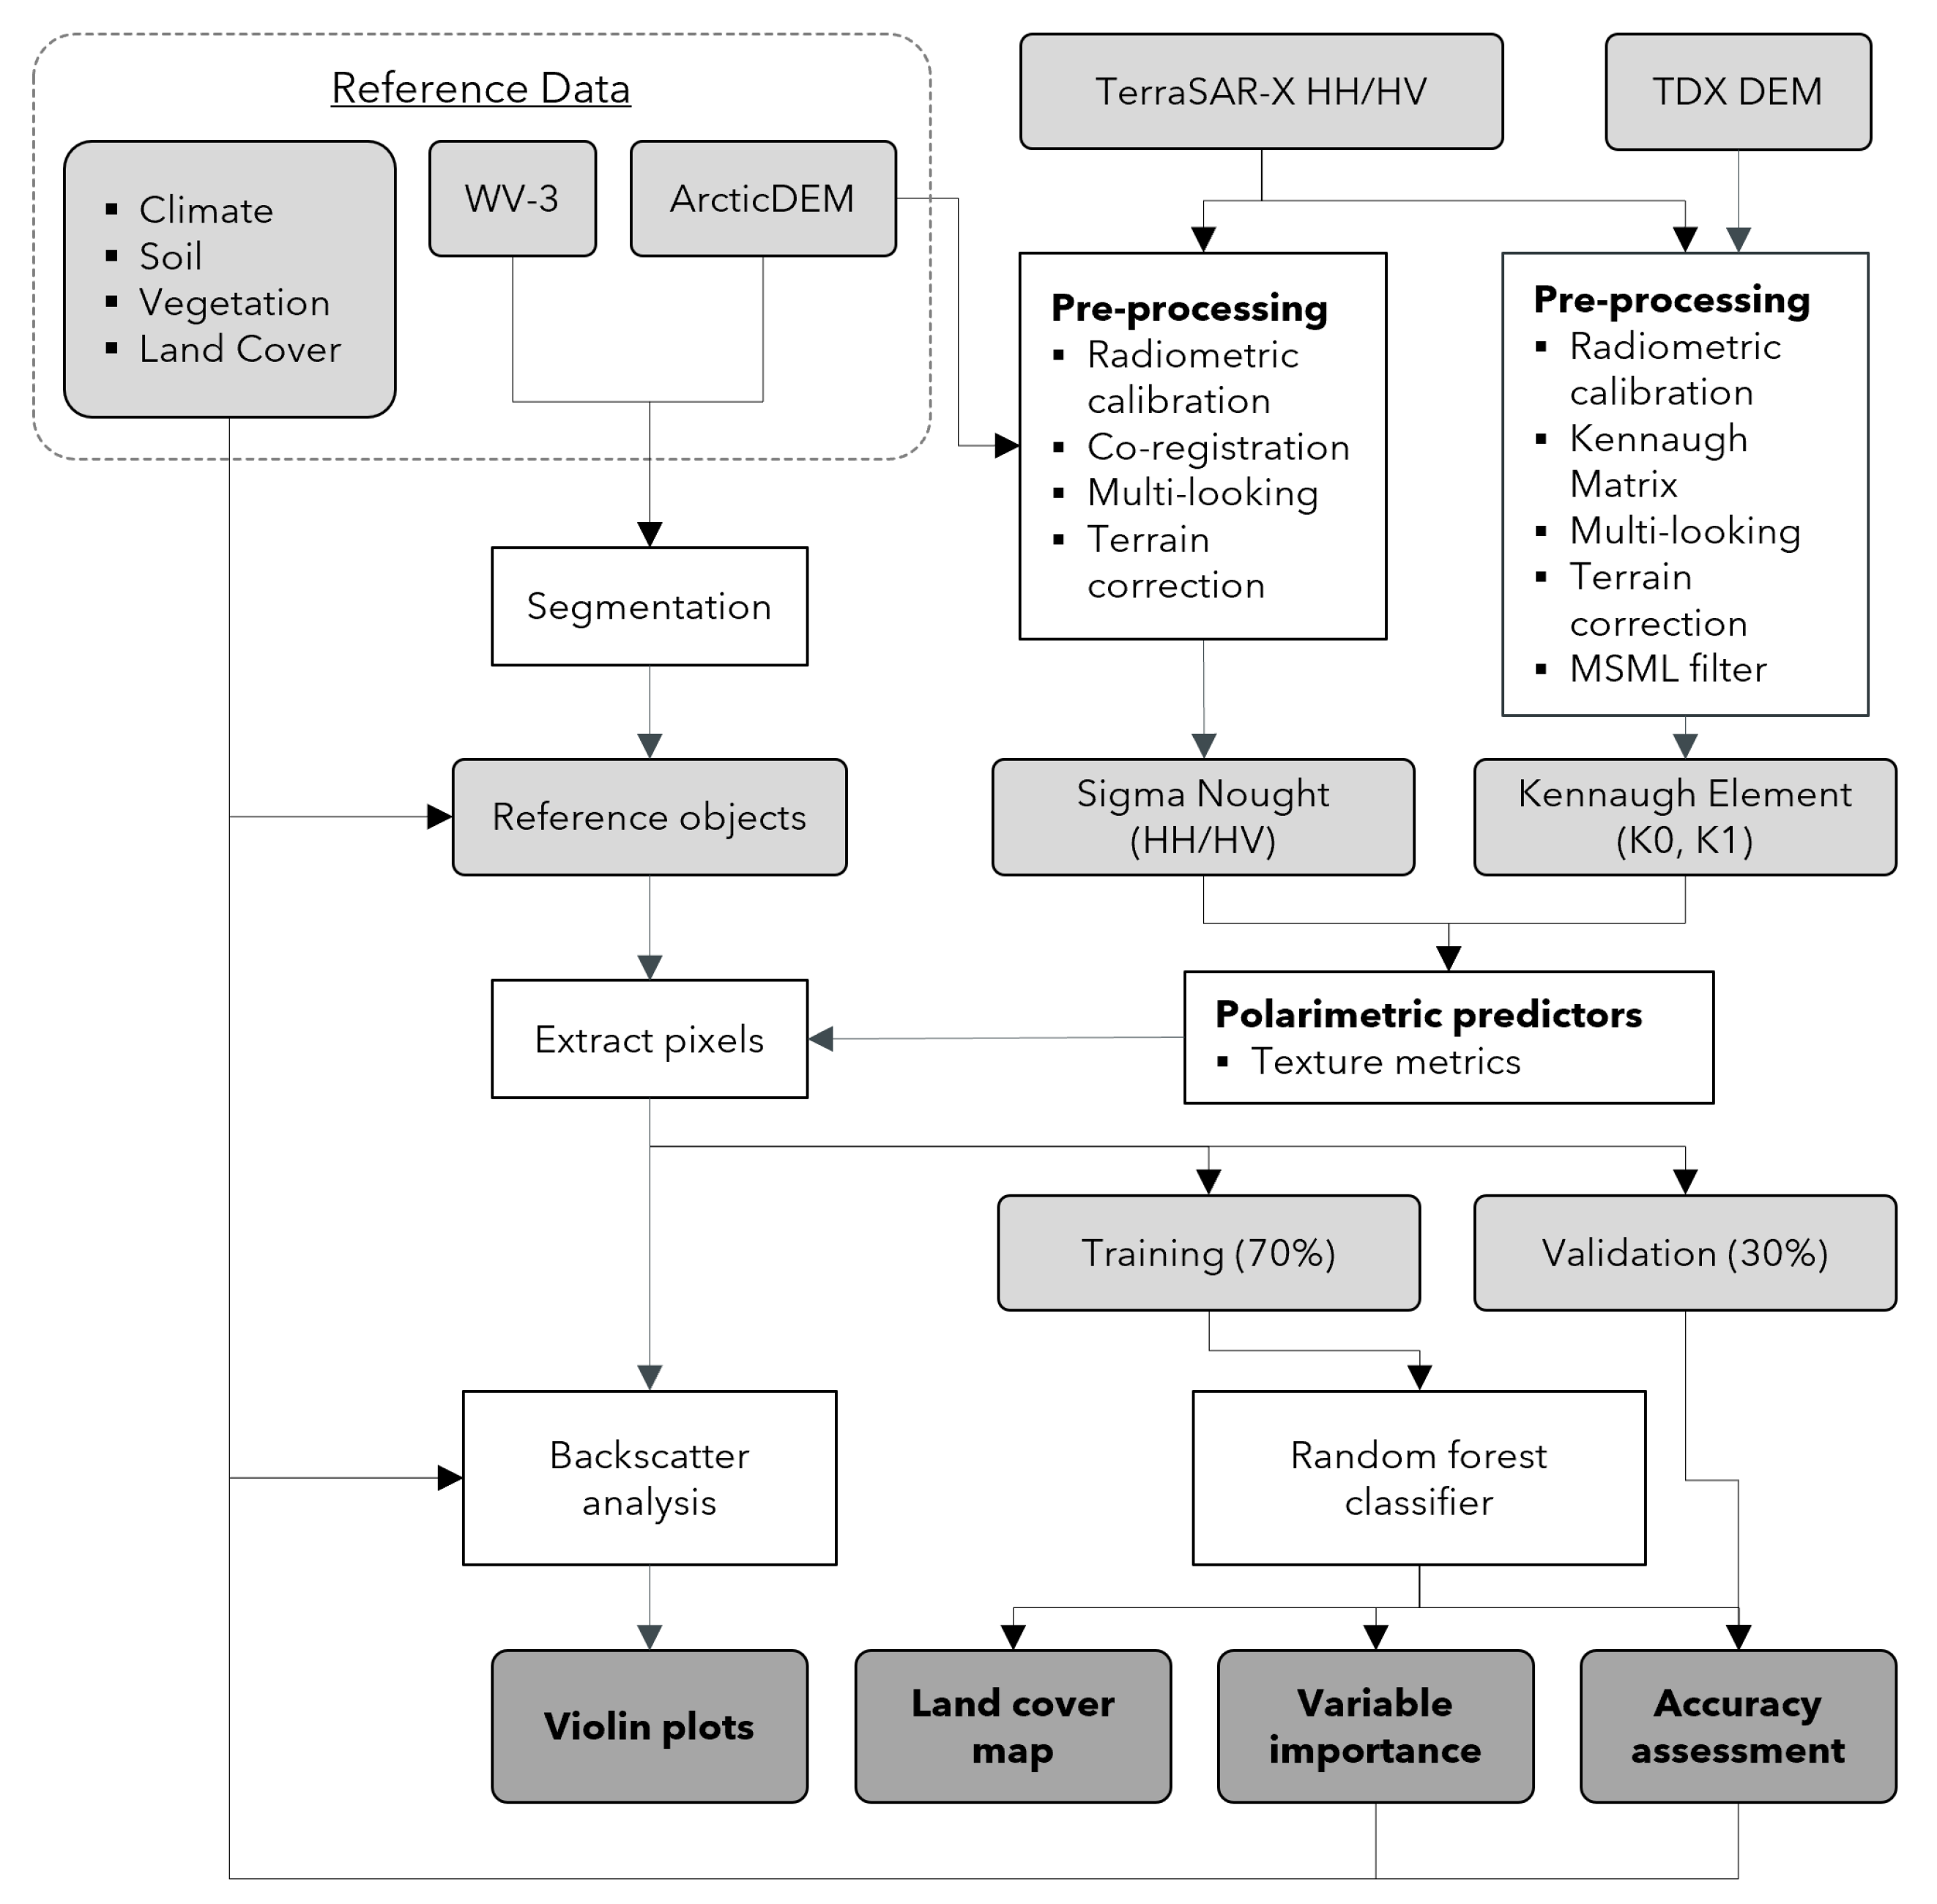
During the field campaign, 105 circular plots (5 m radius) were sampled (Table 1). In situ measurements of soil and vegetation parameters were collected for 47 circular plots (5 m radius) using a stratified random sampling approach. The geological units alluvial fan, lacustrine, and colluvium were used as strata with 34, 8, and 5 sampling points, respectively [46]. Lower sampling numbers were obtained for the units lacustrine and colluvium due to the inaccessibility of the landscape and lower spatial coverage of those classes. In each plot, the land cover type was described, and the center GPS coordinate was documented. Soil samples were taken at the plot center down to one meter with depth increments of 10 cm. For each soil sampling site, the ALD was measured and soil horizons were classified from a soil pit following the USDA Soil Taxonomy system [55]. The volumetric moisture content (VMC) [42] was calculated, and statistical analyses were performed using the AQP library in R statistical software version 3.6.3 [56,57]. The field protocol by Räsänen et al. [21] was used to collect vegetation data. We measured the mean vegetation height and estimated %-cover for the Plant Functional Types (PFT): Salix sp., Betula nana, evergreen shrubs, deciduous shrubs, forbs, graminoids, and mosses. The remaining 58 field plots were randomly collected and contained solely a land cover description and a GPS coordinate. In addition to the field plots, 38 ground truth points for water, exposed soil, and anthropogenic structures were identified from the WV-3 image. The minimum distance between all sampling points was 150 m to ensure a spatially balanced dataset.

3. Methods

The workflow in Figure 3 was followed to achieve the objectives of this study. First, the SAR imagery was processed to Sigma Nought intensity and Kennaugh element values (Section 3.1). Second, the field plots were scaled to objects by segmentation of the WV-3 image and the ArcticDEM (Section 3.2). Third, the SAR pixel values within these objects were extracted as reference data, and a backscatter analysis was performed. Fourth, four classifications schemes were tested to classify land cover using a RF classifier (Section 3.3).

3.1. Pre-Processing of Polarimetric SAR Data

The time series of TSX scenes were obtained as Single Look Slant Range Complex (SSC) data products. The SSC data encompassed both amplitude and phase information which were stored as complex numbers and were corrected for gain variations of the instrument, the elevation antenna pattern, and range spread loss. Furthermore, additional noise by the antenna was estimated in Noise Equivalent Beta Nought (NEBN) values and documented in the metadata [58]. Two PolSAR processing chains were applied to the SSC data: (i) the traditional SAR workflow for retrieval of Sigma Nought intensity values and (ii) the Kennaugh Element Framework (KEF) [36] for retrieval of the Kennaugh elements. The resulting Sigma Nought and the Kennaugh Element data stacks were converted to logarithmic scaling and projected in the WGS 1984 UTM Zone 7N coordinate system with a pixel spacing of 5 m. Hereafter, we refer to the two datasets as Sigma Nought (SN) and Kennaugh Element (KE) data.

3.1.1. Processing Steps of the Traditional SAR Workflow

The traditional SAR workflow was completed in SNAP 8.0.0 [59] and included the following processing steps: First, the SSC data were radiometrically calibrated to Sigma Nought ( σ 0 ) values by calculating the Digital Numbers (DN) and by correcting the data for the calibration constant, the processing scaling factor ( k s ) , the local incidence angle ( θ l o c ) , and the NEBN [58]. Then, the calibrated data were co-registered with a SSC pixel accuracy of 0.05 RMS. This process included collocating the images based on their orbital data, cross-correlating the master and slave images, and warping the slave images using a first-order polynomial warp with a cubic convolution resampling method. Next, multi-looking (2 looks in both range and azimuth) was applied to obtain a square ground range resolution of approximately 5 m. Last, the data were terrain corrected and geocoded to the WGS 1984 datum using Range Doppler equations together with the ArcticDEM [49]. The pixel spacing after terrain correction was 5 m with a pixel location error of approximately 2.3 m [51]. Note that in order to preserve the spatial resolution, no speckle filter step was included in the traditional SAR workflow and that the radiometric performance of TSX StripMap HH/HV is limited by the noise floor with a NESZ value of −19 dB for both channels [51].

3.1.2. Processing Steps of the Kennaugh Element Framework

The KEF included the following processing steps: First, the NEBN was estimated, and the SSC data were converted to radar brightness ( β 0 ) and subsequently calibrated to Sigma Nought ( σ 0 ) values [58]. Then, K 0 and K 1 were calculated from the Kennaugh Matrix (Equation (1)). Multi-looking (2.4 and 2.17 looks in range and azimuth) was applied to the data resulting in a square ground resolution of approximately 5 m. Next, the data were terrain-corrected using Range Doppler equations and the TanDEM-X DEM with a WGS 1984 datum. The pixel spacing after terrain correction was 5 m with a pixel location error of approximately 2.3 m [51]. After that, the Multi-Scale Multi-Looking (MSML) method was applied. In the MSML method, the local number of looks is adapted to the image content with higher look numbers for homogeneous areas (e.g., water) and lower look numbers for heterogeneous areas (e.g., rock). The optimal look number for each individual pixel is determined by the image pyramid which is created by the help of a novel perturbation-based noise model that combines both additive and multiplicative noise contributions and automatically adapts to the sensor and imaging mode characteristics via the delivered metadata [36]. This method is uniquely compared to other speckle filters as it removes speckle and thereby increases the signal-to-noise ratio (SNR) without reducing the spatial resolution, which is an advantage for landscapes which exhibit high spatial heterogeneity. Finally, the scenes were co-registered with a pixel accuracy of 0.05 RMS. A first-order polynomial warp and a cubic convolution resampling method were used for this process. It is important to note that the noise floor of the HH and HV channels also influences the Kennaugh elements. Especially, K 1 is influenced by noise from the HV channel for acquisitions where HV < NESZ.

3.1.3. Theoretical Background of the Kennaugh Element Framework

The Kennaugh Matrix, K, can be used to define both coherent and incoherent scattering by relating the Stokes vector of the incident g ̲ E ̲ I and backscattered g ̲ E ̲ R wave to each other [60]. For a monostatic system in a Backscatter Alignment (BSA) framework, the Kennaugh Matrix is symmetrical and consists of ten real independent Kennaugh elements. The normalized Kennaugh matrix, k, is derived by dividing the Kennaugh Matrix by K 0 and the elements range between −1 and +1 (Equation (1)). The Kennaugh elements can be defined in either linear, logarithmic, or normalized scaling, which allows for a comparison with other decomposition methods [36].
K = K 0 K 4 K 5 K 6 K 4 K 1 K 9 K 8 K 5 K 9 K 2 K 7 K 6 K 8 K 7 K 3 = K 0 1 k 4 k 5 k 6 k 4 k 1 k 9 k 8 k 5 k 9 k 2 k 7 k 6 k 8 K 7 k 3 = K 0 · [ k ]
The KEF decomposes the Kennaugh Matrix into Kennaugh elements to be able to differentiate between scattering mechanisms of targets. With a quad-pol SAR system, all ten Kennaugh elements can be derived. For dual or single-pol SAR systems, the total intensity, K 0 , can always be derived, but the number of other polarimetric elements depends upon the available polarimetric channels. For the HH/HV SAR system used in this study, the definition of the Kennaugh Matrix is [36]:
K H H / H V = K 0 0 K 5 0 0 K 1 0 K 8 K 5 0 0 0 0 K 8 0 0
with K 0 describing the total intensity (Equation (3)) and K 1 describing the difference between co- and cross-pol intensity (Equation (4)). K 5 and K 8 solely hold information for deterministic, non-natural targets. Additionally, the polarimetric phase is generally not calibrated for cross-polarized images. The K 5 and K 8 use this phase information which causes both elements to be influenced by noise. For this reason, we decided against using these Kennaugh elements in our study [36].
K 0 = S H H 2 + S H V 2
K 1 = S H H 2 S H V 2

3.2. Preparation of the Reference Dataset

3.2.1. Pre-Processing of the Optical Data

The pre-processing of the WV-3 image was performed in ENVI version 5.5.2 [61]. The image was radiometrically calibrated and atmospherically corrected to surface reflectance values using the Fast Line-of-sight Atmospheric Analysis of Hypercubes (FLAASH) software. The effect of adjacency was corrected by using a point-spread function for spatial averaging [62], and the geometric resolution of the WV-3 image was increased to 0.31 m by using the Gram–Schmidt (GS) pan-sharpening algorithm (PATENT No 6, 011, 875.) The GS algorithm was chosen as the study by Belfiore et al. [63] shows that the GS algorithm is most efficient without reducing the radiometric resolution. Band 8, NIR-2, was excluded from the pan-sharpening process as the spectral response of this band is not covered by the panchromatic band [63]. After pan-sharpening, the data were georeferenced using the GPS ground control points with a submeter horizontal accuracy. Finally, the Normalized Difference Vegetation Index (NDVI) [64] was calculated by using the pan-sharpened Red and NIR-1 bands.

3.2.2. Image Segmentation

Image segmentation was performed in the software eCognition Developer 9.4.0 using the multi-resolution segmentation algorithm [65]. The multi-resolution segmentation algorithm is a bottom-up approach which merges a pixel with the best-fitting neighboring pixel based on common spatial and spectral characteristics. This process continues to merge objects into larger neighboring objects until the conditions set by the user are met [65]. The segmentation scheme for Komakuk Beach was based upon the NIR-1, the Green, the NDVI, and the DEM layer. The DEM layer was weighted half compared to the other layers. The shape and compactness parameters were both kept constant at a value of 0.1 to base the segmentation process solely on spectral characteristics and to obtain natural object forms [66,67]. In addition, the scheme used two rounds of the multi-resolution segmentation algorithm. In the two rounds, all parameters were kept constant, except for the scale parameter. The first round had a scale parameter of 20 and the second a scale parameter of 30. The scale parameter sets the maximum heterogeneity criterion and thus determines the size of the image objects [19,66]. A larger-scale parameter allows more heterogeneity and results in larger image objects. The optimal size of an object should be as large as possible but should delineate the different types of land cover. The resulting image object size ranged from 314 to 4766 m 2 . The image objects that intersected with the field plots were selected as reference objects (Table 2). The SN and KE pixel values within these objects were extracted, and subsequently, a backscatter analysis was performed by plotting the statistical distribution of these values in violin plots.

3.3. Classification

3.3.1. Land Cover Classification System

The Land Cover Classification (LCC) system developed for the Komakuk Beach study area consists of nine classes, which represent typical environments for tundra landscapes along the Arctic coastal plain of the Beaufort Coast (Table 2). This LCC system is based upon the wetland classification system of the Ramsar Convention [68] and the Canadian Wetland Classification System (CWCS) (Table S2) [69]. The classes were selected to account for the temporal and spatial differences of the vegetation structure, the dielectric properties of the ground, and the TSX sensor properties. A different SAR signature is expected for fens and low- and high-center polygons due to differences in dielectric properties and surface roughness. High-center polygons have a convex shape with better drained moisture conditions than concave low-center polygons and sloping fens [7]. In addition, low-center polygons and fens are similar in vegetation type and structure, but the typical polygonal microrelief structure, which might influence the SAR backscatter, is absent for fens [7]. The shrubs class is composed of more dense and taller vegetation than the other classes. Hence, a stronger volume scattering component is expected for shrubs compared to the other classes [35]. In addition, X-band SAR is sensitive to snow grains [6,19,53]. Therefore, different snow distribution patterns for vegetation classes in winter might improve class separation. Furthermore, the temporal SAR signature for the classes sea and fresh water should be different due to variations in environmental factors (e.g., sea currents, wind conditions, and ice formation) [53].

3.3.2. Preparation of the Predictor Variables

The predictor variables were derived from the TSX time series and consisted of: HH and HV Sigma Nought intensities; the Cross-polarized Ratio (cR); the Kennaugh Matrix elements K 0 and K 1 ; and the Gray Level Co-occurrence Matrix (GLCM) texture measures (Table 3). The cross-polarized ratio can be used to determine the relative increase or decrease in the HV-channel and is an indicator for volume scattering. Texture metrics characterize image texture or transitions between graytone levels and thereby help to identify targets of interest [70]. However, note that the texture metrics degrade the spatial resolution. The metrics were calculated using the GLCM with a 7 × 7 moving window. The cross-polarized ratio and the texture values were extracted from the reference objects and added to the reference dataset. The multi-temporal classification schemes SN C1 and KE C1 were executed to evaluate the feasibility of the SN and KE data for land cover classification. In addition, the added value of texture predictors was tested by scheme SN C2 and KE C2 (Table 4).

3.3.3. Random Forest Classifier

A Random Forest (RF) classifier, optimized for each specific classification scheme, was used to classify land cover (Table 4). A RF [71] builds numerous decision trees, with each tree consisting of a randomly selected sub-sample, the out-of-bag (OOB) sample. A random subset of input predictor variables is selected, and the best predictor variable is chosen to split the data into homogenous sub-classes. The process continues until the tree is fully grown [71]. The number of trees in the forest is set by the parameter, ntree, and the number of input predictors to select the best split variable is mtry. The OOB error rate is the prediction error of the OOB- sample of the data. The importance of predictor variables is given in Mean Decrease Accuracy (MDA) and Mean Decrease Gini (MDG). In this study, we use the MDA to rank the predictor variables. The MDA is a measure of prediction strength for each variable. The rate of accuracy decrease, as the predictor variable values are randomly removed from the tree, is averaged over the total trees in the forest. RF is a good classification method for spatially variable data, such as polarimetric SAR, since it is a non-parametric method which is robust for noise and outliers [71]. Furthermore, overfitting is reduced due to the random selection of OOB samples [71].
The land cover classification was performed using the RandomForest [72], caret [73], and varSelRF [74] libraries in R statistical software version 3.6.3 [57]. For each classification scheme, the optimal model was selected by detecting the best tuning parameters and selecting the most favourable set of predictors. First, the reference dataset was split into training (70%) and validation (30%) data using a stratified random sampling approach based on the land cover class. Then, a baseline RF model was developed from the training data, using the default values for the parameters mtry and ntree. The mtry default value is the square root of the number of predictors, and the ntree default value is 500 trees [71]. The next step involved tuning these model parameters using a 10-fold cross-validation for evaluation. A 10-fold cross-validation randomly splits the training dataset into 10 groups, where each group is set aside as validation data and the remaining groups are used to train the model. The highest accuracy value was used to select the optimal value for mtry. The optimal number of trees was selected when the OOB RMSE stabilized. After tuning, two predictor variable sets were tested: set one used all predictors as input data (RF1) and set two used the optimal set of predictors selected by the varSelRF package (RF2). The optimal RF model for each classification scheme was selected by evaluating the overall accuracy (OA), the model complexity, and the computational efficiency. Finally, the selected optimal model was used to classify the Komakuk Beach study area. The classification schemes were compared by analyzing the confusion matrices, the variable importance plots and the land cover maps. Olofsson et al. [75] recommended to report User’s Accuracy (UA), Producer’s Accuracy (PA), and Overall Accuracy (OA). The UA and PA can help to describe similarities and differences in polarimetric response for the land cover types, and the variable importance plots can indicate which predictors are most important for land cover mapping.

4. Results

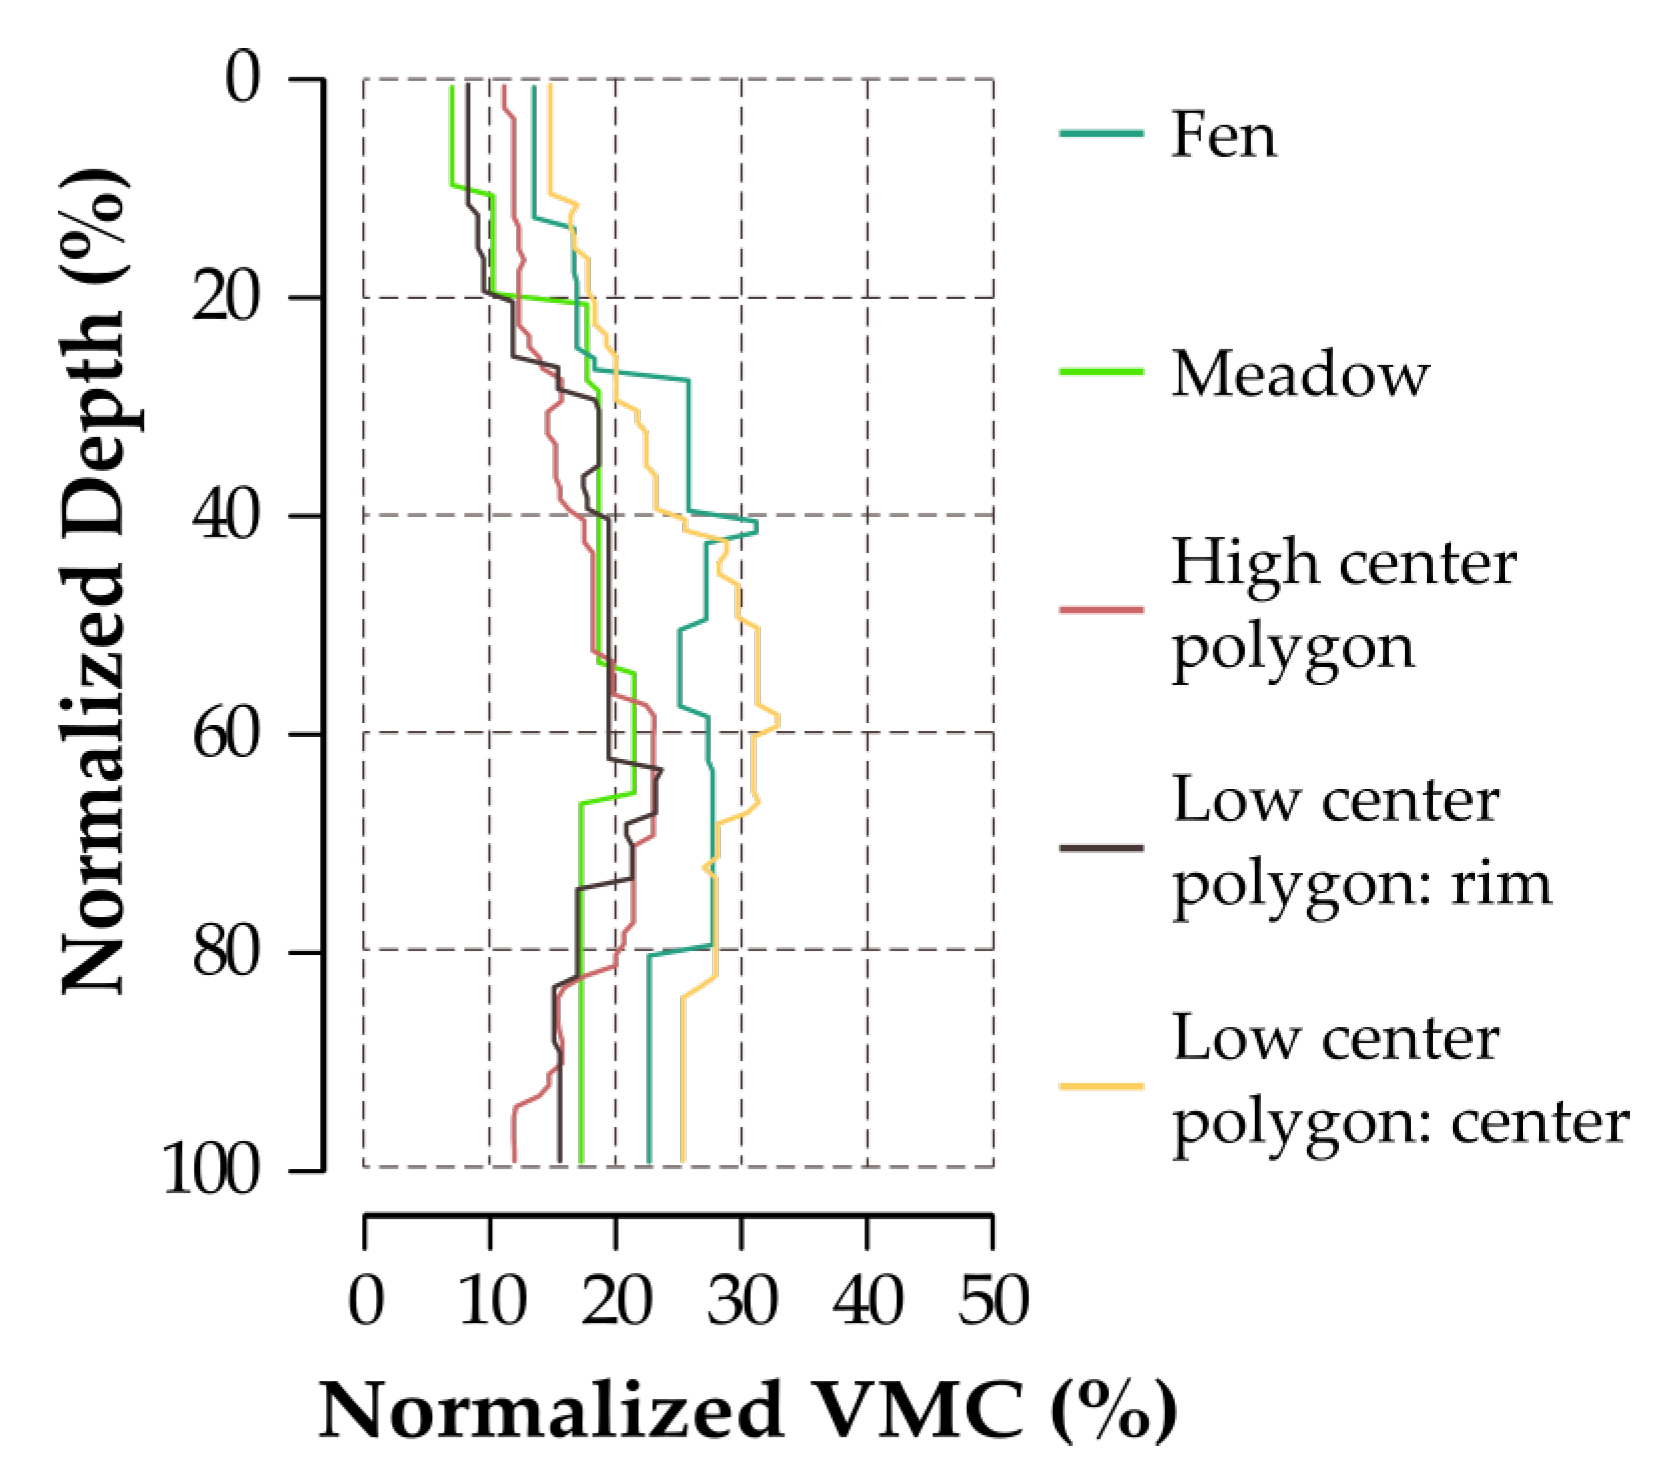
4.1. Characterization of Land Cover Classes by In Situ Observations

The field-based investigation showed that land cover types are characterized by differences in soil type, soil moisture, vegetation structure, and PFT assemblages. In addition, the in situ data, collected in August, exemplified the influence of the microtopography on soil moisture conditions, vegetation structure, and species distribution. Elevated areas, such as high-center polygon centers and low-center polygon rims, had a relative low mean VMC (Figure 4). These elevated areas were covered with dwarf shrubs and other low vegetation forms (Table 5) consisting of Betula nana, Salix sp., evergreen shrubs, lichens, and mosses. While depressions, such as low-center polygon centers and fens, had a relatively high mean VMC (Figure 4) with vegetation characterized by graminoids, Salix sp., and mosses. Riverbanks meadows exhibit well-drained mineral soils (Figure S3), which explains the low VMC (Figure 4). Medium-to-tall Salix sp. shrubs occurred predominantly along creeks, streams, and no soil samples were available for these locations. The active layer depth of the study area ranged from 20 to 52 cm, with a mean value of 36 ± 7 cm (Figure S3). The soil temperature varied at the soil surface from 4.0 to 7.6 °C and decreased to almost 0 °C at the permafrost table.

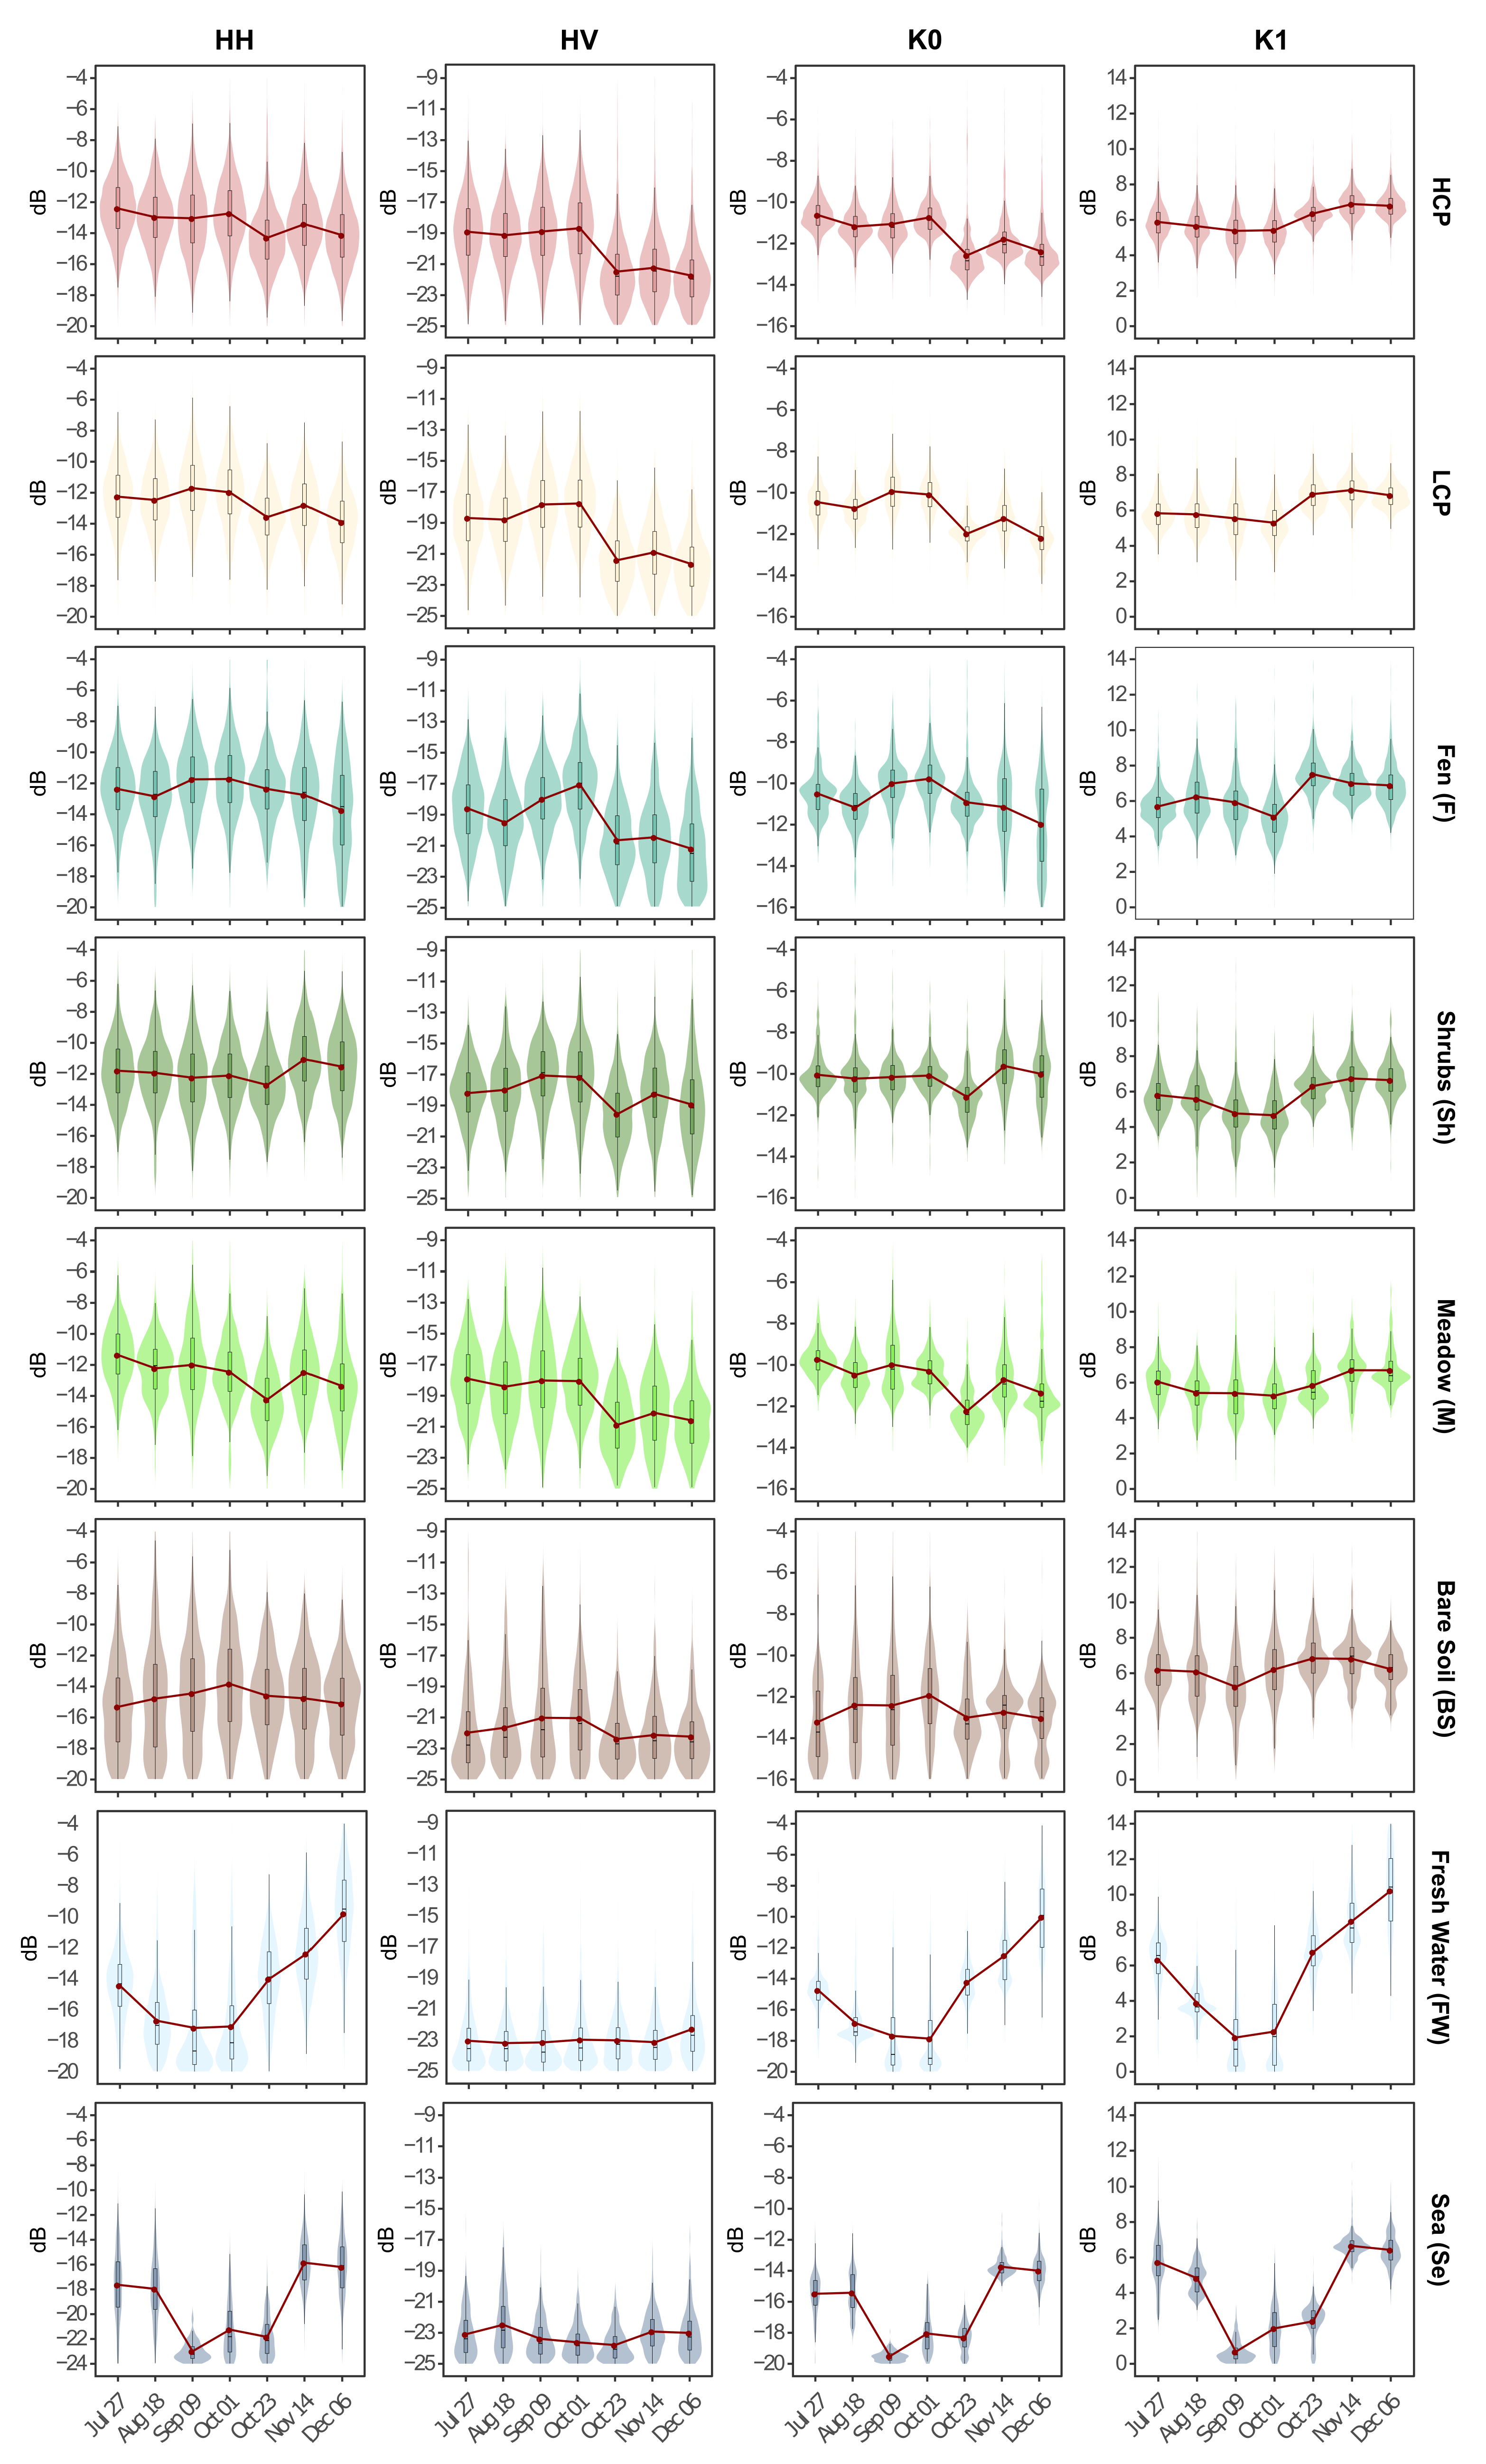
4.2. Temporal Analysis of Backscatter Statistics

In order to characterize the land cover classes and to analyze the seasonal development of X-band SAR backscatter, the statistical distribution of the Sigma Nought intensity and the Kennaugh element values for the TSX time series were visualized in violin plots (Figure 5). The Sigma Nought intensity values displayed a larger interquartile range than the Kennaugh element values. Water, soil, and vegetation classes were characterized by clear temporal differences in intensity and polarimetric information, while differences within the vegetation classes were more nuanced. All vegetation classes showed a drop (of approximately 3 dB) in HV backscatter on 23 October. The classes low-center polygon, fen and shrubs showed an increase in HV (mean up until −17 dB) from peak-level vegetation to senescence stage, while the HV values (mean around from −18 to −19 dB) remained stable for meadow and high-center polygon. Additionally, higher precipitation values were reported for 18 August which could explain the lower K 0 values observed on this date for the classes low-center polygon, fen, and meadow (Figure 2). Furthermore, the class shrubs showed a remarkably higher HH backscatter signal in winter than in summer. This is in contrast with the results from Bartsch et al. [24] where a drop in HH backscatter is described over land. The violin plots displayed less seasonal variability and lower backscatter values for the class bare soil than the vegetation classes. Fresh water and sea returned a low K 0 (mean < −15 dB) signal in summer, which steadily increased in winter (mean > −14 dB). However, the increase in the K 0 signal occurred at an earlier acquisition date for fresh water compared to sea. Moreover, the low backscatter values in summer for both fresh water and sea varied between the different acquisition times.

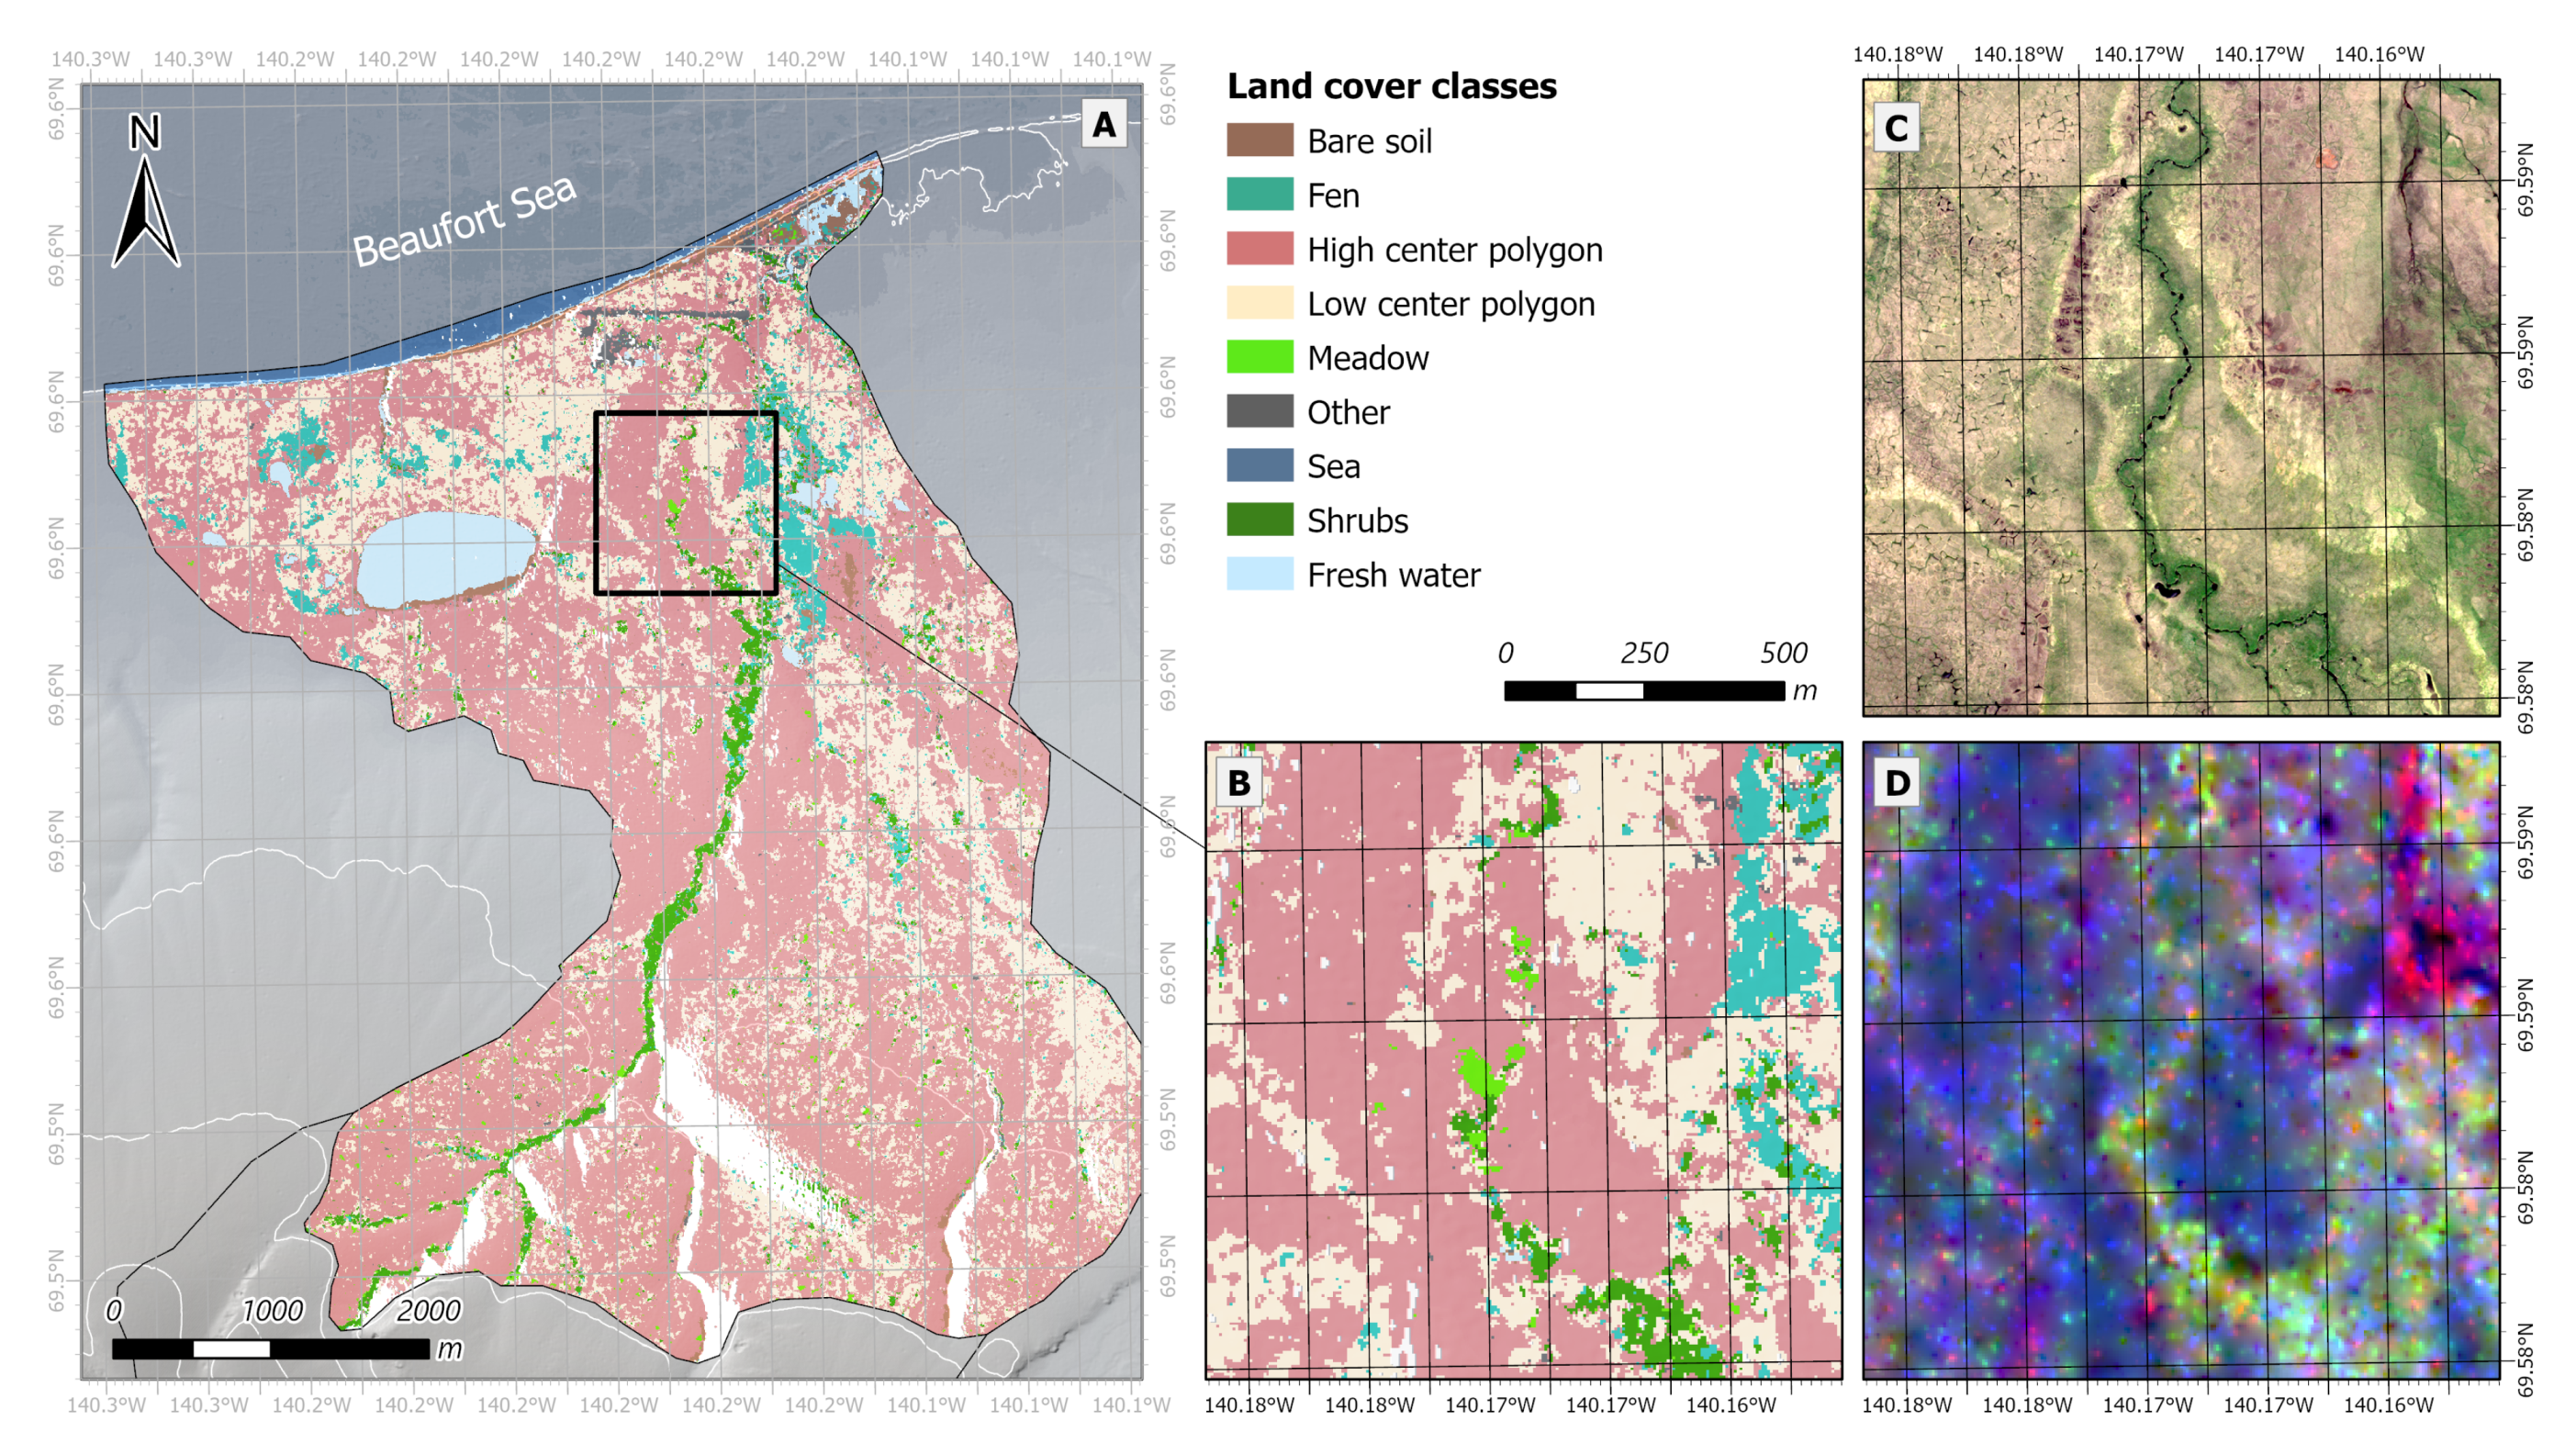
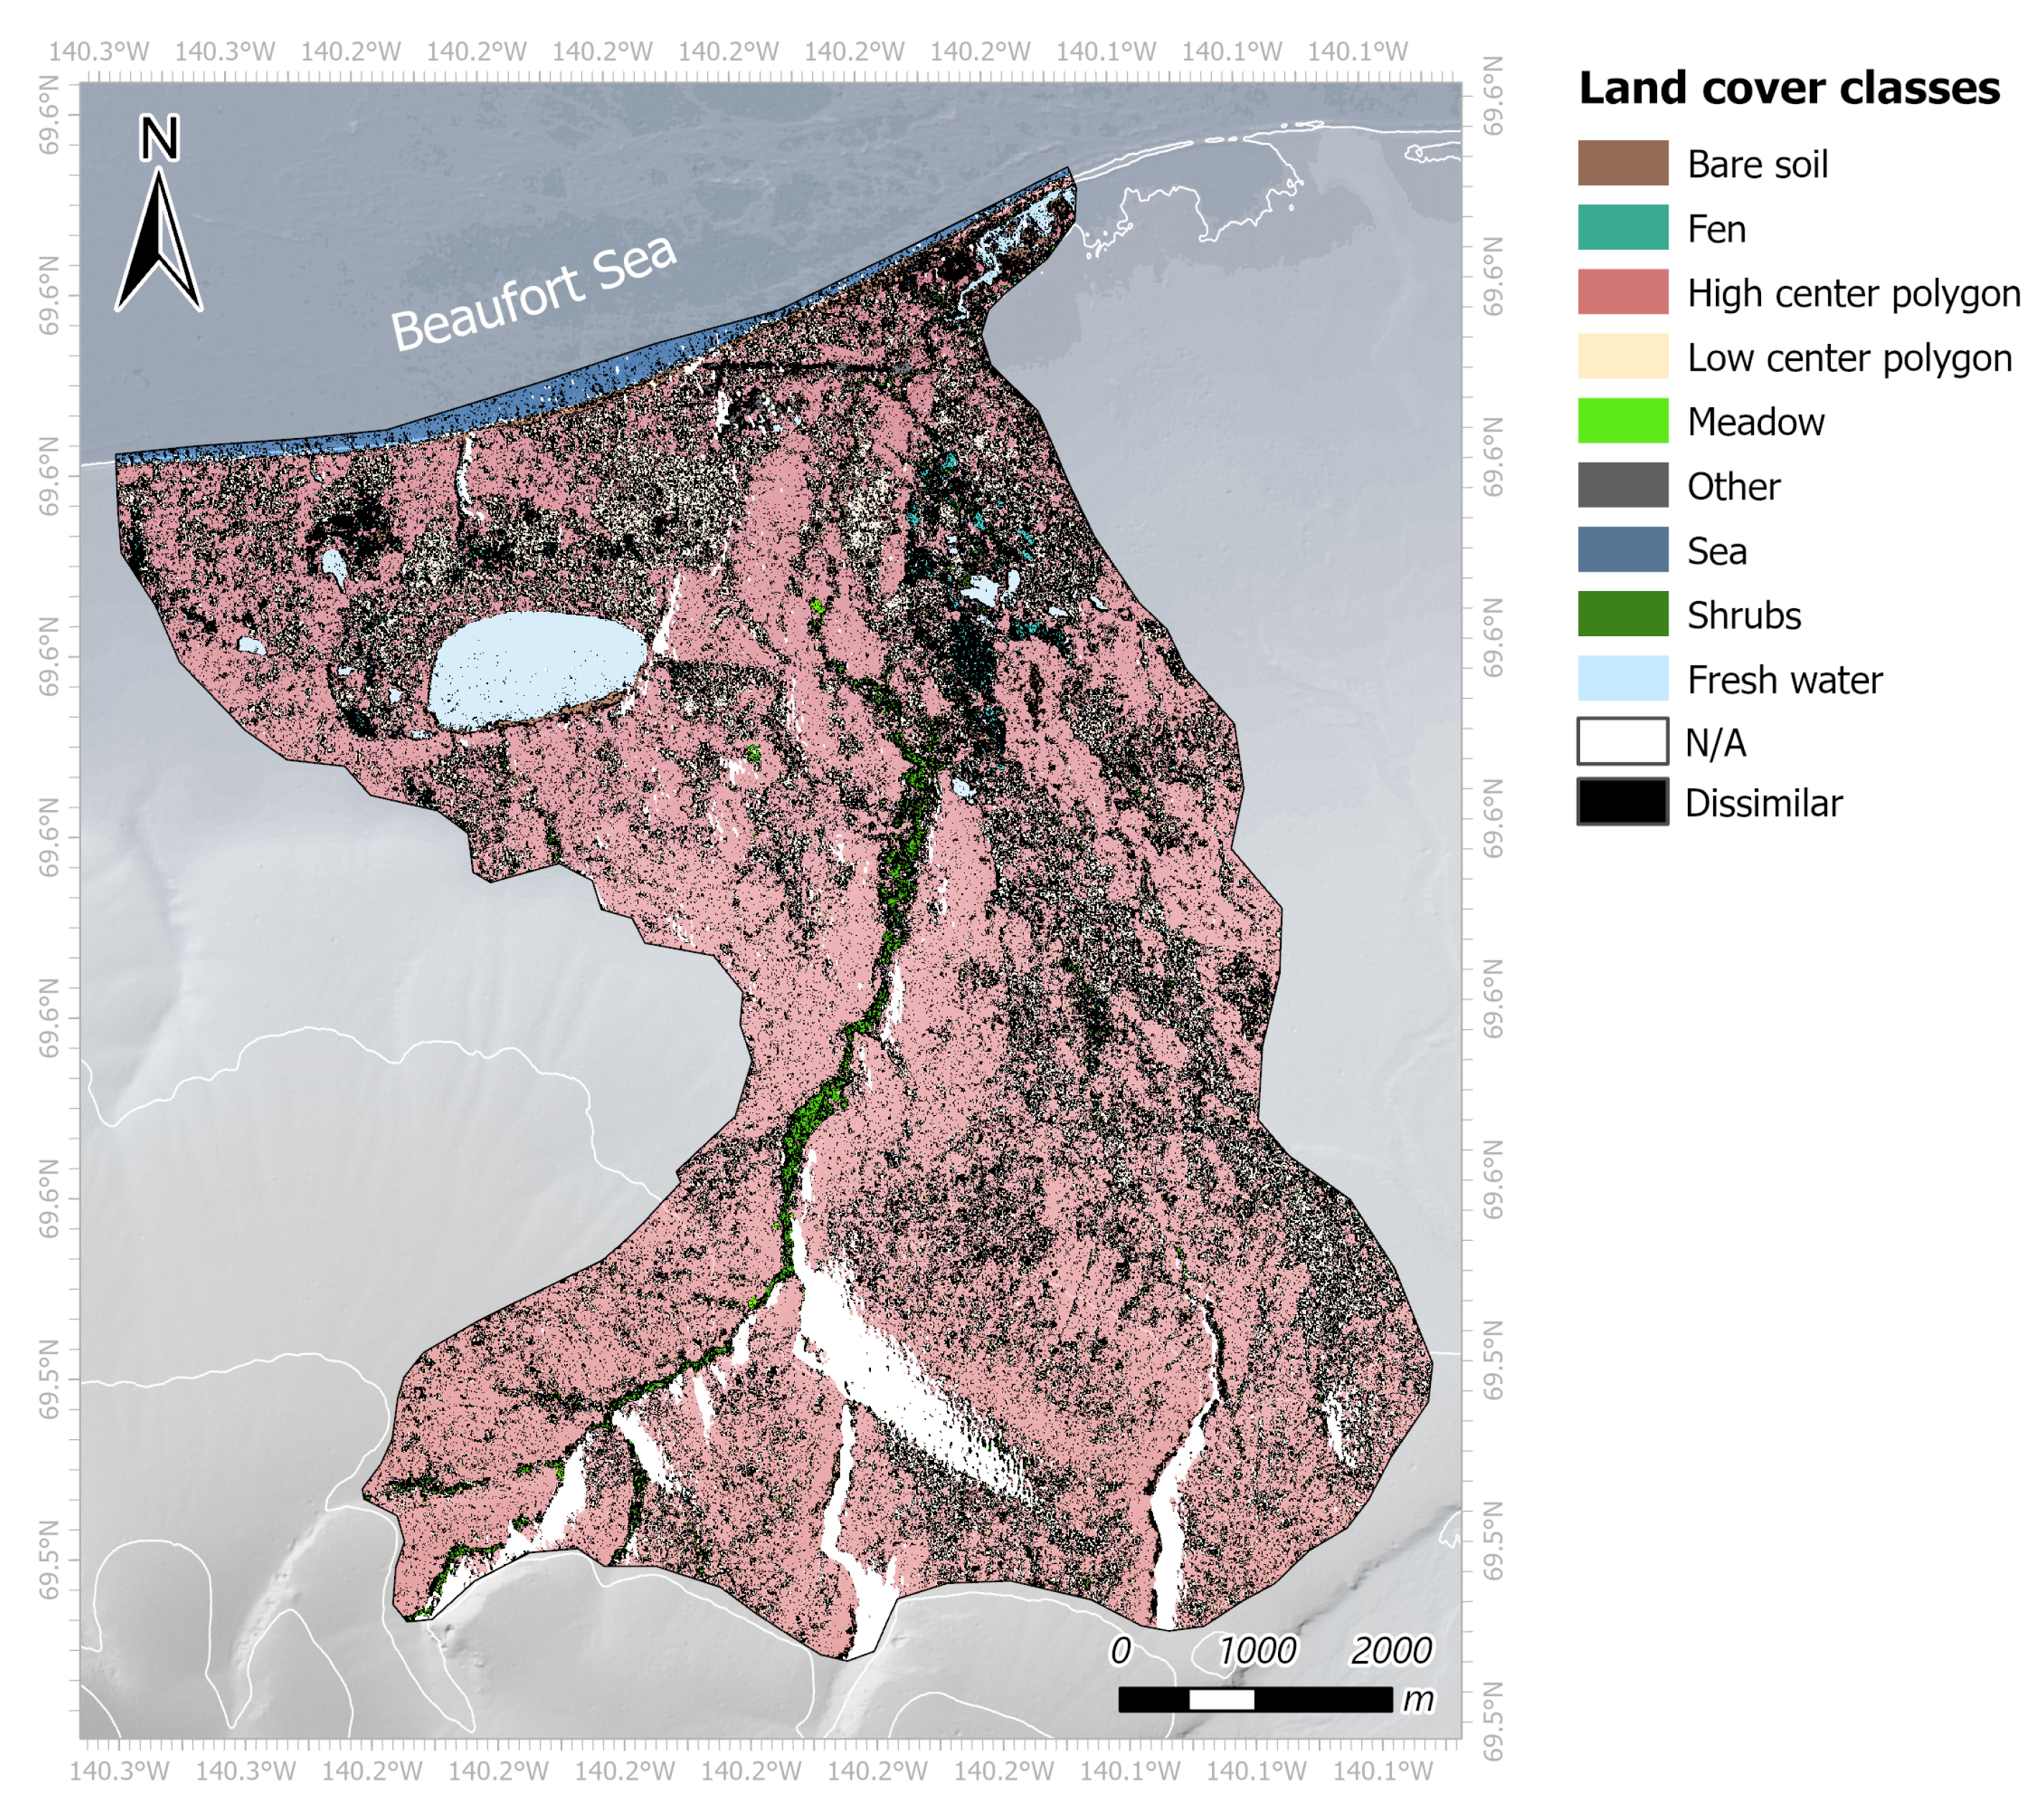
4.3. Multi-Temporal Land Cover Classification

The optimal RF model for each multi-temporal classification scheme was selected based on the model performance of the two predictor variable sets, RF1 and RF2 (Table 6). The OOB RMSE tended to stabilize for 200 trees. Model overfitting was not considered a problem for the optimal selected models (OAtrain-OAval < 1%), and generally, RF2 models reduced model complexity and thus computation time. Table 7 reports the accuracy values of the selected RF models for the SN and KE classification schemes based on the external validation set. The classification results achieved with the SN C1 scheme were poor, especially with the UA and PA values for the vegetation classes being low (Table 7). Significantly better classification results were achieved with the KE C1 scheme (OA increases by 34.7%). The use of texture predictors increased the accuracy for both the SN and KE schemes. The spatial resolution, however, decreased significantly. The best balance between high accuracy and high spatial resolution was obtained with classification scheme KE C1. This model separated the water classes well from the other classes (UA > 98.9%, PA > 97.1%). More confusion, however, occurred between the vegetation classes (Table 8). High-center polygon, characterized by sparse and low vegetation, is the best performing vegetation class (UA 91.2%, PA 95.9%). The classes meadow and shrubs exhibited the lowest accuracy values mainly due to confusion between the two classes and with the class high-center polygon. The main reason for this is that these land cover classes represented narrow bands along rivers and stream, and they make up a very small percentage of the study area (Table 2). Both high- and low-center polygon showed more commission errors than omission errors. These two classes were included wrongly in the other vegetation classes and the bare soil class, which means that high- and low-center polygons are slightly over-represented in the classification map (Figure 6).
The KE C1 land cover map illustrates the general patterns of vegetation, bare ground, and water observed from the WV-3 image well. Shrubs and meadow appeared mostly along the rivers, high-center polygons dominated on the hill slopes and the coastal plain displayed an alternating pattern of fens and low- and high-center polygons. However, the land cover map shows low-center polygons on the hill slope, which disagrees with the visual interpretation of the WV-3 image and the knowledge from the field. This error can be explained by the low number of field plots in the colluvial geological unit due to the difficulties in accessing this area in the field.

5. Discussion

5.1. Comparison between the Sigma Nought and the Kennaugh Element Classification

The suitability of the traditional SAR workflow and the Kennaugh Element Framework for multi-temporal land cover mapping is examined by comparing the SN C1 and KE C1 classification schemes (Figure 7). Disagreements (black pixels: 36% of total pixel count) between scheme SN C1 and KE C1 mostly occurred at transition zones and areas with a higher spatial heterogeneity, while good agreement is seen for homogeneous areas. This can be linked to the reduced accuracy of SN C1 relative to KE C1 (Table 7). Classes that are spatially homogeneous, such as fresh water, sea, and high-center polygons, show high PA and UA values (>80%) for both classification schemes, except for the low UA value of high-center polygon of SN C1 (51%). The classes meadow and shrubs, which are typically located at transition zones from, e.g., wetland polygon to riverine floodplain environments, have higher PA in the KE C1 scheme. This is also true for the classes fen and low-center polygon, which are characterised by more fragmented distributions in the landscape. Thus, the applicability of scheme SN C1 for land cover mapping is limited to homogeneous classes, while the KE C1 can map homogeneous areas, heterogeneous areas, and transition zones. Previous studies reported similar results with improved tundra land cover class separability and mapping performance when using Kennaugh element features compared to other polarimetric features [14,38]. The KEF may be a more suitable SAR processing chain than the traditional SAR workflow because the KEF uses the MSML filter which increases the radiometric stability of the Kennaugh elements without sacrificing the spatial resolution. Accordingly, the Kennaugh elements are spatially more stable than the Sigma Nought intensity parameters (Figure 5). The texture measures likewise improved the spatial stability of the Sigma Nought intensity parameters and as a result improved the classification accuracy (Table 7). For this reason, texture predictors could be an alternative input for the RF classifier, although the spatial resolution is reduced and small-scale heterogeneous classes are precluded from image classification.

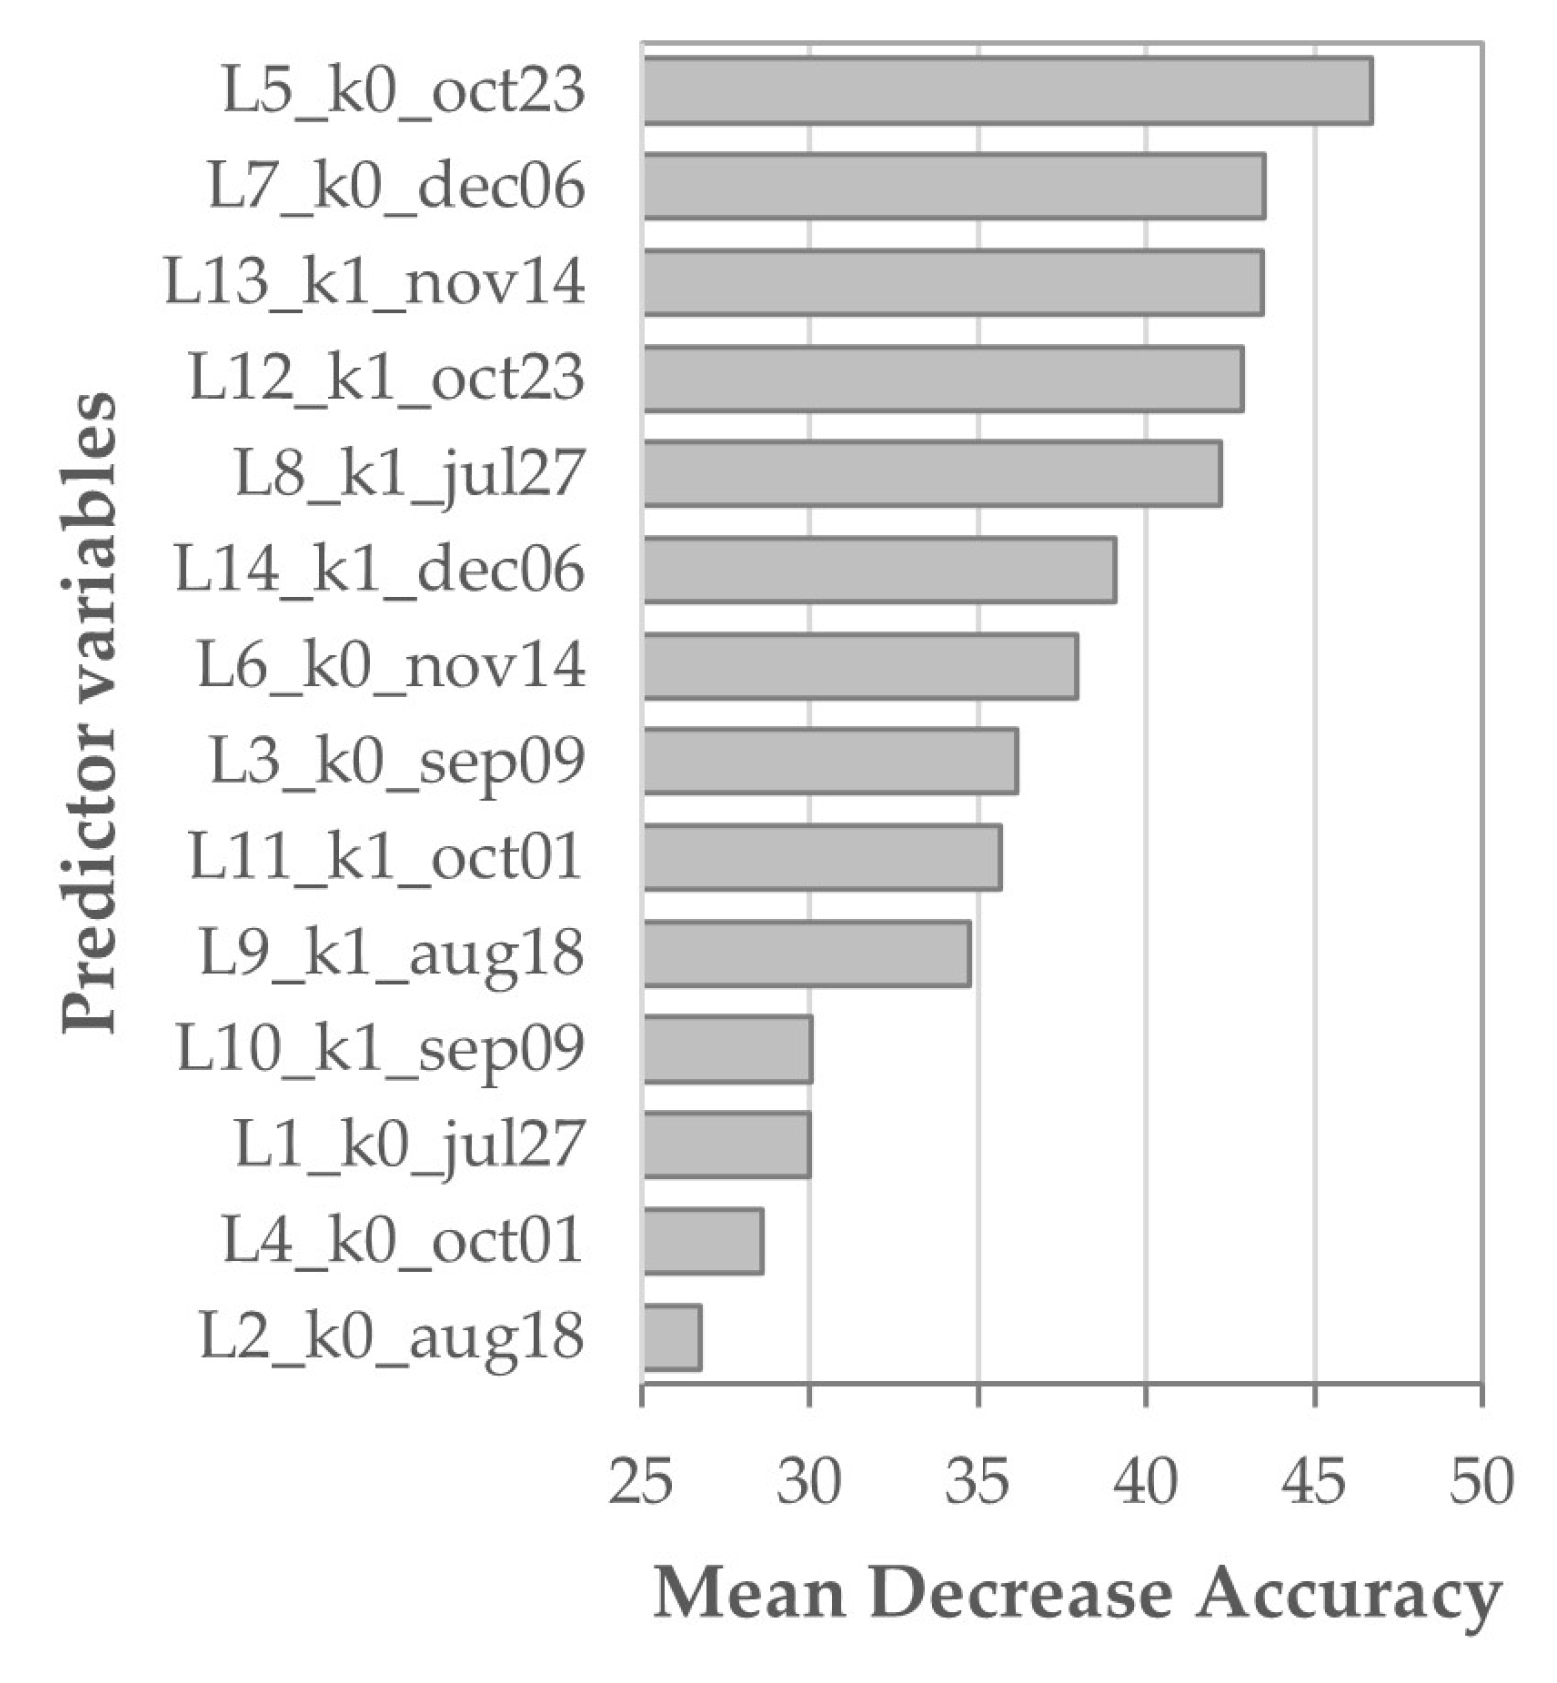
5.2. Variable Importance of the Random Forest Classifier

The RF classifier uses the MDA to rank the predictor variables based on the prediction strength. Figure 8 reports the MDA of the best classification result: KE C1 and Table S3 reports the predictor ranking for each individual class. The Kennaugh matrix element K 0 derived from the 23 October acquisition was most important for image classification. This image is the first acquisition with snow cover and a daily mean temperature below 0 °C (Figure 2). Snow cover (23 October, 14 November, and 6 December) acquisitions ranked higher than peak-level vegetation (27 July and 18 August) and senescence (9 September and 1 October) acquisitions. Furthermore, the five most important predictors included acquisitions from all three periods. This agrees with the findings that multi-temporal classification is preferable for Arctic tundra land cover types [11,19]. Furthermore, the total intensity information ( K 0 ) is most important for the RF classifier, which was also found in the study by Mahdianpari et al. [17]. The K 0 parameter can be mostly associated with surface scattering as the sensitivity of X-band SAR and C-band SAR to volume scattering in permafrost environments is low [17]. The K 0 parameter, which is more influenced by the HV signal, also ranks high especially for the classes sea, water, bare soil and meadow (Table S3). The K 1 parameter likely aids the RF classifier by separating land from water due to specular reflection. Furthermore, the drop in parameter K 1 on 23 October is larger for vegetation classes that are more sensitive to volume scattering on 1 October (e.g., low-center polygon, fen, shrubs), and is smaller for classes that are less sensitive to volume scattering on 1 October (e.g., meadow and high-center polygon). The difference in structure for the vegetation classes and the different temporal response of K 1 for those classes might explain the relative high ranking of K 1 on 21 October.

5.3. Seasonal Backscatter Mechanisms at X-Band for Arctic Tundra Landscapes with Respect to Previous Findings

The classification accuracy (Table 7) and the variable importance (Figure 8 and Figure 9) are linked to spatial and temporal trends in backscatter statistics (Figure 5) in order to explain the seasonal backscatter mechanisms that characterize the Arctic tundra environment at X-band SAR and to identify which backscatter signal variations in the Kennaugh matrix are important for class separation in the RF classifier.
The temporal development of the polarimetric parameters illustrates that the HH and HV channels are positively correlated to K 0 (total intensity) and inversely correlated to K 1 (polarization difference) (Figure 5) [36]. The classes fresh water and sea displayed clear seasonal trends driven by surface scatter mechanisms. Low intensity values from July to October indicate specular scattering from the water surface. From 23 October and 14 November onward, a steady intensity increase was observed for fresh water and sea, respectively. The air temperature dropped below zero degrees in the middle of October and the 20 October Sentinel-2 acquisition displayed frozen lake surfaces and a snow-covered landscape (Figure 2 and Figure S2). Hence, the increasing intensity values can be connected to lake-ice and sea-ice formation, which creates a high dielectric contrast between the ice-water boundary and subsequently increases the total intensity [11,19]. The different timing of ice-formation likely enabled the separation of fresh water from sea (Figure 9). This relates well to the high PA and UA values for those classes (Table 7) and explains the importance of the 23 October acquisition (Figure 8). Intensity variations in the summer can be linked to the effect of wind on the water surface roughness [14,53]. Strong wind speeds on 17 July and 18 August increased the surface roughness and thus the total intensity, while calm weather conditions on 9 September and 1 October resulted in specular reflection (Table S1, Figure S2). In general, the vegetation classes displayed a similar seasonal trend for intensity values: high values during peak-level vegetation and senescence; a steep decrease on 23 October; and low values in winter. The HV intensity values were close to the noise floor (−19 dB) in summer and dropped below the noise floor in winter. The scattering was likely dominated by direct surface scattering from the ground or snow layer, while volume scattering from vegetation and snow played a minor role. The bare soil class displayed lower mean backscatter values and less temporal variability than the vegetation classes. The higher intensity values for vegetation can be explained by a higher surface roughness increasing the surface scatter component and vegetation interactions in summer increasing the volume scatter component [53]. A similar drop in intensity was observed for bare soil on 23 October. The vegetation and soil were likely frozen and covered by snow at the end of October. The frozen conditions decrease the dielectric constant [6,53] and explain the reduced total backscatter. These distinct differences in the temporal development of the intensity parameters for the soil, water, and vegetation classes aid the separability of the RF classifier.
The vegetation classes displayed overlapping value ranges, yet subtle temporal variations between the classes were detected which likely enabled the class separation (Figure 5 and Figure 9). High-center polygon was the best performing vegetation class and was easily classified (Table 7). Figure 5 shows lower intensity values for high-center polygon in relation to the other vegetation classes, which can be mostly explained by the lower vegetation height (Table 5) [19,24,26] and the relative dry soil moisture conditions (Figure 4) [26,53]. Additionally, the class high-center polygon covers a relative large area and is spatially more homogeneous. This likely creates a more distinct SAR signal, which helps the RF classifier to distinguish high-center polygon from other vegetation classes. The classes low-center polygon and fen were unique compared to the other vegetation classes as they showed an intensity increase throughout 9 September and 1 October (Figure 5), which coincides with a relatively dry period (Figure 2). Both low-center polygon and fens are characterized by a water table near or above the soil surface and some occurrences of small open-water surfaces. For low-center polygons, open water surfaces are especially prevalent in the earlier half of the growing season after snow melt. The intensity increase in both the HH and HV channel could be explained by a drop of the water table in the later part of the season. As a result, the volume scatter component increases from a denser vegetation structure above the water surface and the surface scatter component increases from direct interaction with the soil surface. The 9 September acquisition was important for low-center polygon and fens and likely helped the separation between those classes and other vegetation classes. Furthermore, the interquartile range for the class fens was large especially during the winter months. This could be a reason for the misclassifications with the classes low- and high-center polygon. Shrubs are best characterized by the relatively high HV backscatter in summer, which can be associated with volume scattering from the shrub branches, and the relatively high HH backscatter in winter (Figure 5). The dielectric contrast on the snow–vegetation boundary is lower than on the air–vegetation boundary [6,53], which suggests that the snow layer reduces the sensitivity of X-band SAR to volume scattering from the vegetation layer in winter, increasing the contrast between HH and HV. Furthermore, wind transports snow from elevated areas to depressions [19] and areas with taller shrubs [6]. Snow has an insulating effect on the soil underneath, and the dielectric contrast for snow–soil surfaces is higher for thicker snow layers, increasing the HH backscatter [6]. This implies that the increased HH values for shrubs, and in a lesser degree for the class fens, indicate a thicker snow pack in those areas. However, care must be taken when interpreting the backscatter values as no in situ data are available for soil, vegetation, and snow parameters during the periods of vegetation senescence and snow cover. The classes meadow and shrubs display an overlapping value range (Figure 5) and report the lowest UA values (Table 7). The low accuracy can be explained by the following: meadow and shrubs are mostly located side by side in narrow stream valleys and errors might be introduced in the processing step of upscaling the field plots to reference objects. Further, the classes distributed in narrow bands in the landscape can likely not be accurately delineated with a 5 m spatial resolution TSX image product and are more prone to geolocation errors than large-scale classes. The classification accuracy could be improved by higher-resolution image products or a synergistic use of SAR with optical or elevation data or both [77].
The processes described above strongly indicate that surface scattering is the main driver of the observed backscatter at Komakuk Beach. Double-bounce scattering could also be a substantial part of the observed backscatter especially for wetland areas such as the classes low-center polygon and fen [14,19]. Quad-pol or dual-pol HH/VV imagery would be necessary to increase our understanding of the double-bounce component [14]. Volume scattering likely played a minor role as a consequence of the low SNR of the HV channel.

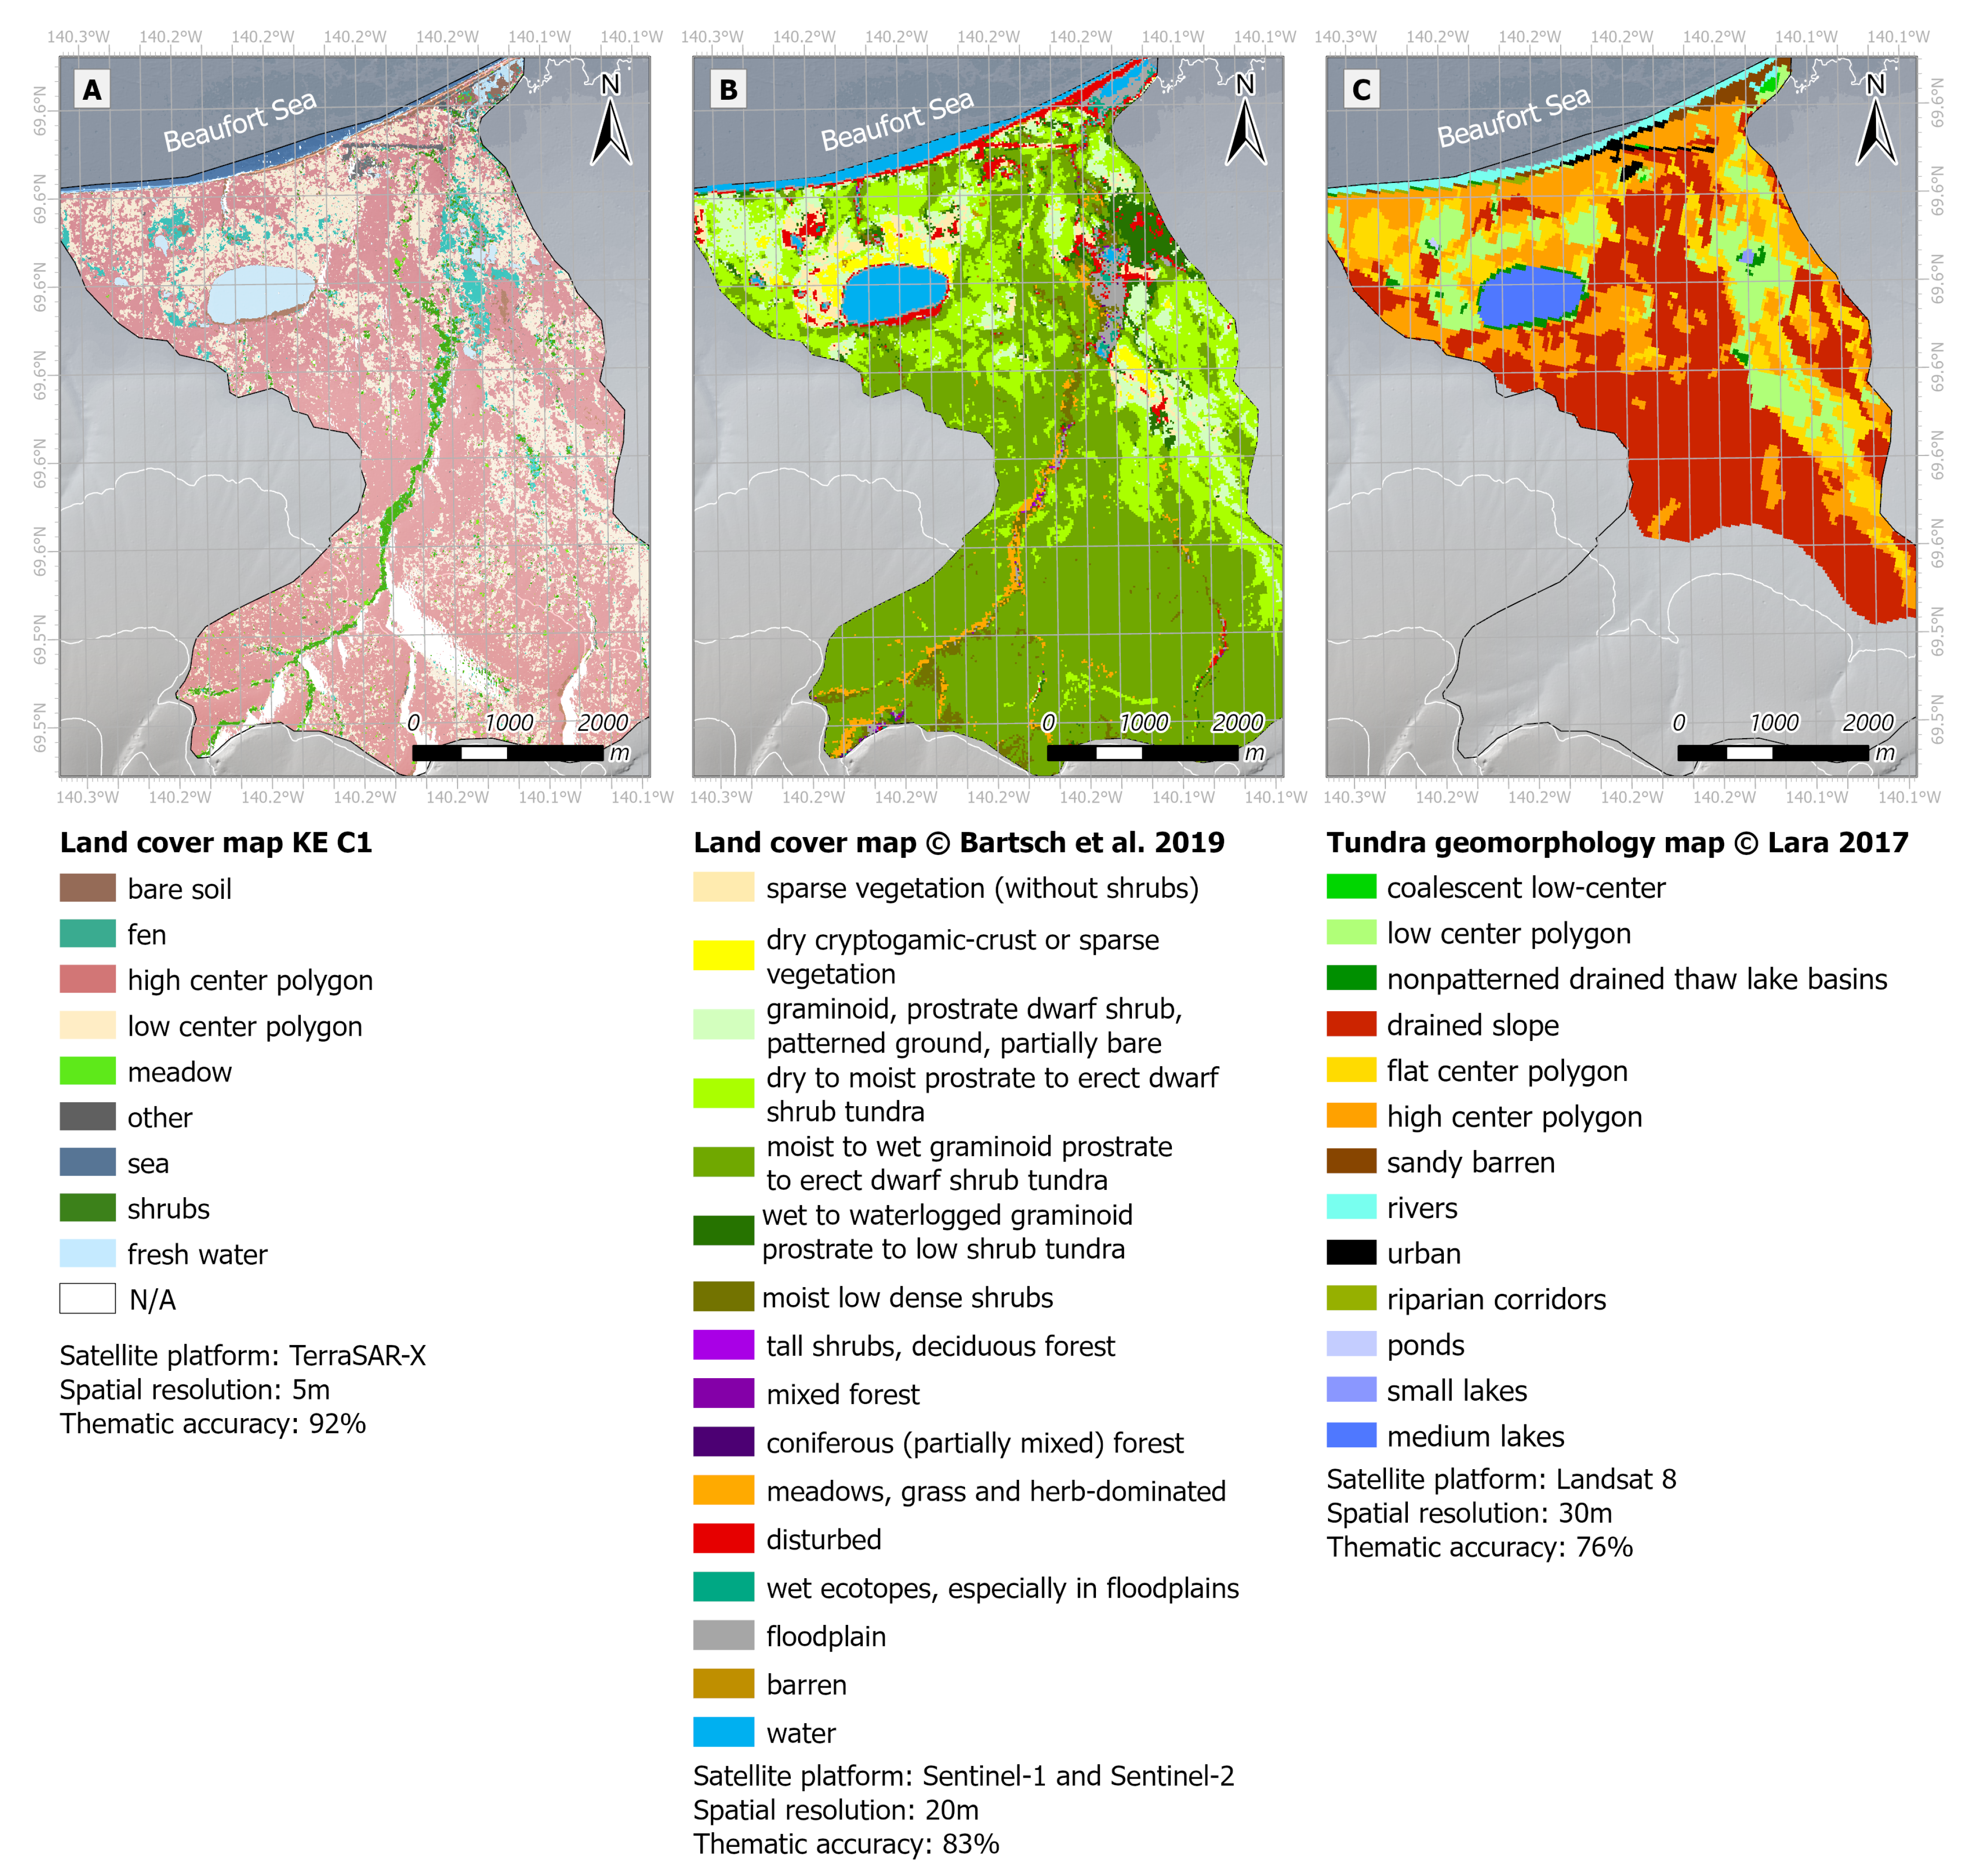
5.4. Comparison between the Kennaugh Element Classification and Other Arctic Tundra Land Cover Studies

The classification accuracy of the KE C1 classification (OA = 92.4%) is comparable with other local studies in the Canadian (sub-)Arctic, which use polarimetric SAR for land cover mapping. The study by Wang et al. [19] used a combination of multi-temporal coherence and HH Sigma Nought predictor variables to perform an object-based classification for a permafrost landscape on the eastern shore of the Hudson Bay. They achieved an OA of 79.3% for classifying six different land cover types. Highest PA and UA were achieved for thermokarst ponds (PA = 94.4%; UA = 94.4%), while most confusion occurred within the vegetation classes (PA = 68.7–82.2%; UA = 60.6–85.2%).
In the same study area, the eastern shore of the Hudson Bay, Duguay et al. [11] mapped land cover using the coherency matrix of quad-pol C-band Radarsat-2 data. A Support Vector Machine classification of an October and an April image provided the best results (OA = 90.1%), and six different vegetation classes could be separated. In the Kitikmeot Region, Canada, a fusion of summer quad-pol C-band Radarsat-2 and DEM data was used for mapping shoreline land cover classes [77]. A wide range of SAR predictor variables were used, including backscatter intensity, co- and cross-pol ratios, and different decomposition variables, as input for a RF classifier. They reported an OA of 80% with best results for the class water (PA = 85%, UA = 94%) and lower accuracy for wetland (PA = 80%, UA = 83%) and tundra (PA = 80%, UA = 77%). The Kennaugh matrix was applied to dual-pol HH/VV TSX data for land cover mapping of three permafrost landscape study sites across the pan-Arctic [18]. Open water could be correctly classified under still wind conditions (OA = 84%). However, the classification accuracy for bare surfaces varied between the study sites, most likely due to the lack of high-resolution and up-to-date validation data. Tundra vegetation was accurately classified (OA = 76%), but the land cover map did not distinguish between different vegetation types. All in all, there are two main tundra land cover class separation issues pointed out in the literature: (i) higher accuracy for homogeneous classes (e.g. water) and (ii) more confusion within the vegetation classes.
This agrees with the results of our study. Notably, the KE C1 classification in this study illustrated improved separability of tundra vegetation classes compared to other (sub)-Arctic tundra classification studies, including the ability to distinguish between high- and low-center polygons. This particular improvement can be linked to the use of the KEF which highlights spatial differences between distinct land cover classes prevalent in the heterogeneous tundra landscape due to: (i) the separation between intensity information ( K 0 ) and the polarimetric information ( K 1 ) and (ii) the MLMS method which does not reduce the geometric resolution in heterogeneous areas. Additionally, the multi-temporal approach of KE C1 exploits the temporal changes in the Kennaugh elements of the vegetation, soil, and water classes and thereby increases class separability. Figure 10A displays the land cover product of this study based on a multi-temporal X-band HH/HV SAR data (KE C1), together with Figure 10B, a land cover product based on a fusion of optical and C-band VV SAR data [41] and, Figure 10C a geomorphology map based on solely optical data [40]. Each of the three maps displays the lake, polygonal patterns, and a comparatively wet area located in the northeast of the study site, which is characterized by a rather specific plant community. However, please note that it is difficult to compare exact land cover classes to other pieces of work within this areas as, the land cover map by Bartsch et al. [41] distinguishes more vegetation classes than the KE C1 map within this area, and the map by Lara [40] includes geomorphology classes which cannot be directly related to the land cover classes found in the KE C1 map (e.g., drained slope). It is worth mentioning that the provided KE C1 land cover product reports a higher classification accuracy than other maps in the study area. This achievement can be explained by the increased spatial resolution of the TSX satellite and the multi-temporal classification approach which provides additional and very valuable seasonal information for the respective classes. Thus, the SAR-based method in our study is able to demonstrate the advantage of implementing timeseries data which are not available for optical imagery in the Arctic.

6. Conclusions

This study investigates the seasonal backscatter mechanisms for Arctic tundra landscapes using a dual-polarimetric HH/HV TSX time series. In particular, we addressed the potential of the Kennaugh Element Framework to classify and monitor tundra land cover types. The results from the backscatter analysis and the Random Forest classifiers illustrate that the Kennaugh matrix elements K 0 and K 1 differentiated well between tundra land cover types and classified land cover with an overall accuracy of 92.4%, whereas HH and HV Sigma Nought intensities could not distinguish between vegetation classes and the classification results were poor (OA = 57.7%). This difference in classification performance can be explained by the improved radiometric stability of the Kennaugh elements in comparison to the Sigma Nought intensities. The Kennaugh classification results are not only comparable in terms of accuracy to other local PolSAR studies in the Canadian Arctic [11,18,19,77] but are also improved in terms of spatial resolution compared to two existing land cover products in the area, which use Sentinel-1 and -2 data [41] and Landsat-8 data [40]. The typical polygonal tundra land forms could be accurately classified, while most classification problems occurred in the narrow stream valleys for the classes meadow and shrubs. These classes are more prone to errors in upscaling of in situ observations and inaccurate geolocation. It would likely be possible to improve the classification accuracy and mapping results by using higher resolution image products or a synergistic use of remote sensing data, but this lies outside the scope of this study. The five most important predictors for the Random Forest classifier included acquisitions from the summer as well as from the autumn and the winter seasons. In consistence with the findings from, Wang et al. [19] and Duguay et al. [11], a multi-temporal classification approach is preferable for Arctic tundra land cover types. Furthermore, the K 0 predictors ranked higher than the K 1 predictors, suggesting that surface scattering is the main driver for backscatter mechanisms on the Beaufort Coast. Volume scattering likely played a minor role because the Signal-to-Noise ratio for HV was low. Additional quad-pol or dual-pol HH/VV imagery would be necessary to understand the double-bounce mechanisms that prevail in wetland classes [14,22]. Moreover, the class separation in the Random Forest classifier results from spatio-temporal differences in the backscatter signal of the land cover classes. These differences were likely caused by the following processes: (i) the different timing of ice-formation for fresh water lakes compared to the Beaufort Sea, (ii) the temporal variability of the water table for wetland classes, (iii) frozen vegetation and soil conditions, and (iv) wind and snow deposition dynamics. To fully comprehend the seasonal backscatter mechanisms at X-band for tundra land cover types future work should include simultaneous in situ measurements of soil, vegetation, and snow parameters for the full satellite acquisition time-span as well as additional HH/VV X-band data. Overall, the findings in our study add to the current understanding of X-band polarimetric SAR for Arctic tundra landscapes by showing the possibilities of regular monitoring of tundra landscapes using dual-pol HH/HV SAR data and by demonstrating the potential of the Kennaugh Element Framework for tundra land cover classification.

Supplementary Materials

The following are available online at https://www.mdpi.com/article/10.3390/rs13234780/s1, Figure S1: Snow cover data, Figure S2: Wind speed data, Figure S3: Soil horizon and soil volumetric moisture content data, Table S1: Climate data, Table S2: Comparison of the land cover classification of this study with the Ramsar Convention [73] and the Canadian Wetland Classification System (CWCSS) [74], Table S3: Predictor ranking for the individual land cover classes.

Author Contributions

Conceptualization, W.A., A.B., and G.H.; methodology, W.A., A.B. and G.H.; software, W.A.; validation, W.A.; formal analysis, W.A.; investigation, W.A.; resources, G.H.; data curation, W.A., A.R. and A.W.; writing—original draft preparation, W.A.; writing—review and editing, A.B., A.R., A.W., L.D., R.L., V.S.M., J.W. and G.H.; visualization, W.A.; supervision, A.B. and G.H.; project administration, A.B. and G.H.; funding acquisition, A.B. and G.H. All authors have read and agreed to the published version of the manuscript.

Funding

The authors acknowledge financial support by the Swedish Research Council (2018-04516) and the European Union Horizon 2020 research and innovation project Nunataryuk (773421).

Institutional Review Board Statement

Not applicable.

Informed Consent Statement

Not applicable.

Data Availability Statement

The KE C1 Land Cover Product (raster data) produced in this study is openly available in PANGAEA at doi:10.1594/PANGAEA.937687 (accessed on 15 November 2021), reference number [76].

Acknowledgments

TerraSAR-X data were made available by DLR through PI agreement 3645. DEMs provided by the Polar Geospatial Center under NSFOPP awards 1043681, 1559691, and 1542736. Geospatial support for this work provided by the Polar Geospatial Center under NSF-OPP awards 1043681 and 1559691. Maps throughout this article were created using ArcGIS® software by Esri (Redlands, CA, USA). Many thanks to Ian Brown (Stockholm University) for his feedback and comments on an earlier version of this manuscript.

Conflicts of Interest

The authors declare no conflict of interest.

Abbreviations

The following abbreviations are used in this manuscript:
ALDActive Layer Depth
CRCross-polarized Ratio
CWCSCanadian Wetland Classification System
KEKennaugh Element
KEFKennaugh Element Framework
LCCLand Cover Classification
MDAMean Decrease Accuracy
MSMLMulti-Looking Multi-Scale
NEBNNoise Equivalent Beta Nought
NESZNoise Equivalent Sigma Nought
OAOverall Accuracy
OOBOut-Of-Bag
PAProducer’s Accuracy
PFTPlant Functional Types
PolSARPolarimetric SAR
RFRandom Forest
SARSynthetic Aperture Radar
SNRSignal-to-Noise Ratio
TDXTanDEM-X
TSXTerraSAR-X
UAUser’s Accuracy
VMCVolumetric Moisture Content
WV-3Worldview-3

References

  1. Surface Air Temperature. Available online: https://www.arctic.noaa.gov/Report-Card/Report-Card-2018/ArtMID/7878/ArticleID/783/Surface-Air-Temperature (accessed on 2 May 2020).
  2. Core Writing Team; IPCC; Pachauri, B.K.; Meyer, L.A. (Eds.) Climate Change 2014: Synthesis Report. Contribution of Working Groups I, II and III to the Fifth Assessment Report of the Intergovernmental Panel on Climate Change, 1st ed.; Cambridge University Press: Geneva, Switzerland, 2014; p. 151. [Google Scholar]
  3. Schuur, E.A.G.; McGuire, A.D.; Schädel, C.; Grosse, G.; Harden, J.W.; Hayes, D.J.; Hugelius, G.; Koven, C.D.; Kuhry, P.; Lawrence, D.M.; et al. Climate change and the permafrost carbon feedback. Nature 2015, 520, 171–179. [Google Scholar] [CrossRef] [PubMed]
  4. Hugelius, G. Spatial upscaling using thematic maps: An analysis of uncertainties in permafrost soil carbon estimates: Errors in estimates of soil carbon. Glob. Biogeochem. Cycles 2012, 26. [Google Scholar] [CrossRef]
  5. Stettner, S.; Lantuit, H.; Heim, B.; Eppler, J.; Roth, A.; Bartsch, A.; Rabus, B. TerraSAR-X time series fill a gap in spaceborne snowmelt monitoring of small Arctic catchments a case study on Qikiqtaruk (Herschel Island), Canada. Remote Sens. 2018, 10, 1155. [Google Scholar] [CrossRef] [Green Version]
  6. Duguay, Y.; Bernier, M.; Lévesque, E.; Tremblay, B. Potential of C and X band SAR for shrub growth monitoring in sub-Arctic environments. Remote Sens. 2015, 7, 9410–9430. [Google Scholar] [CrossRef] [Green Version]
  7. Minayeva, T.; Sirin, A.; Kershaw, P.; Bragg, O. Arctic Peatlands. In The Wetland Book; Finlayson, C.M., Milton, G.R., Prentice, R.C., Davidson, N.C., Eds.; Springer: Dordrecht, The Netherlands, 2016; pp. 1–15. [Google Scholar] [CrossRef]
  8. Lara, M.J.; Nitze, I.; Grosse, G.; Martin, P.; McGuire, A.D. Reduced arctic tundra productivity linked with landform and climate change interactions. Sci. Rep. 2018, 8, 2345. [Google Scholar] [CrossRef] [PubMed]
  9. Myers-Smith, I.H.; Kerby, J.T.; Phoenix, G.K.; Bjerke, J.W.; Epstein, H.E.; Assmann, J.J.; John, C.; Andreu-Hayles, L.; Angers-Blondin, S.; Beck, P.S.A.; et al. Complexity revealed in the greening of the Arctic. Nat. Clim. Chang. 2020, 10, 106–117. [Google Scholar] [CrossRef] [Green Version]
  10. Bartsch, A.; Widhalm, B.; Kuhry, P.; Hugelius, G.; Palmtag, J.; Siewert, M.B. Can C-band synthetic aperture radar be used to estimate soil organic carbon storage in tundra? Biogeosciences 2016, 13, 5453–5470. [Google Scholar] [CrossRef] [Green Version]
  11. Duguay, Y.; Bernier, M.; Lévesque, E.; Domine, F. Land cover classification in SubArctic regions using fully polarimetric RADARSAT-2 data. Remote Sens. 2016, 8, 697. [Google Scholar] [CrossRef] [Green Version]
  12. Lara, M.J.; Nitze, I.; Grosse, G.; McGuire, A.D. Tundra landform and vegetation productivity trend maps for the Arctic Coastal Plain of northern Alaska. Sci. Data 2018, 5, 180058. [Google Scholar] [CrossRef]
  13. Stettner, S.; Beamish, A.; Bartsch, A.; Heim, B.; Grosse, G.; Roth, A.; Lantuit, H. Monitoring inter- and intra-seasonal dynamics of rapidly degrading ice-rich permafrost riverbanks in the Lena Delta with TerraSAR-X time series. Remote Sens. 2017, 10, 51. [Google Scholar] [CrossRef] [Green Version]
  14. Ullmann, T.; Banks, S.N.; Schmitt, A.; Jagdhuber, T. Scattering Characteristics of X-, C- and L-Band PolSAR Data Examined for the Tundra Environment of the Tuktoyaktuk Peninsula, Canada. Appl. Sci. 2017, 7, 595. [Google Scholar] [CrossRef] [Green Version]
  15. Banks, S.; Ullmann, T.; Roth, A.; Schmitt, A.; Dech, S.; King, D. Classification of Arctic Coastal land covers with polarimetric SAR data. In Proceedings of the 2013 IEEE Radar Conference (RadarCon13), Ottawa, ON, Canada, 29 April–3 May 2013; IEEE: New York, NY, USA, 2013; pp. 1–6. [Google Scholar] [CrossRef]
  16. Antonova, S.; Kääb, A.; Heim, B.; Langer, M.; Boike, J. Spatio-temporal variability of X-band radar backscatter and coherence over the Lena River Delta, Siberia. Remote Sens. Environ. 2016, 182, 169–191. [Google Scholar] [CrossRef]
  17. Mahdianpari, M.; Salehi, B.; Mohammadimanesh, F.; Motagh, M. Random forest wetland classification using ALOS-2 L-band, RADARSAT-2 C-band, and TerraSAR-X imagery. ISPRS J. Photogramm. Remote Sens. 2017, 130, 13–31. [Google Scholar] [CrossRef]
  18. Widhalm, B.; Bartsch, A.; Roth, A.; Leibman, M. Classification of Tundra Regions with Polarimetric Terrasar-X Data. In Proceedings of the 2018 IEEE International Geoscience and Remote Sensing Symposium, Valencia, Spain, 22–27 July 2018; IEEE: New York, NY, USA, 2018; pp. 8551–8554. [Google Scholar] [CrossRef]
  19. Wang, L.; Marzahn, P.; Bernier, M.; Ludwig, R. Mapping permafrost landscape features using object-based image classification of multi-temporal SAR images. ISPRS J. Photogramm. Remote Sens. 2018, 141, 10–29. [Google Scholar] [CrossRef]
  20. Schimel, D.; Pavlick, R.; Fisher, J.B.; Asner, G.P.; Saatchi, S.; Townsend, P.; Miller, C.; Frankenberg, C.; Hibbard, K.; Cox, P. Observing terrestrial ecosystems and the carbon cycle from space. Glob. Chang. Biol. 2015, 21, 1762–1776. [Google Scholar] [CrossRef]
  21. Räsänen, A.; Juutinen, S.; Aurela, M.; Virtanen, T. Predicting aboveground biomass in Arctic landscapes using very high spatial resolution satellite imagery and field sampling. Int. J. Remote Sens. 2019, 40, 1175–1199. [Google Scholar] [CrossRef] [Green Version]
  22. Reiche, J.; Lucas, R.; Mitchell, A.L.; Verbesselt, J.; Hoekman, D.H.; Haarpaintner, J.; Kellndorfer, J.M.; Rosenqvist, A.; Lehmann, E.A.; Woodcock, C.E.; et al. Combining satellite data for better tropical forest monitoring. Nat. Clim. Chang. 2016, 6, 120–122. [Google Scholar] [CrossRef]
  23. Ullmann, T.; Schmitt, A.; Jagdhuber, T. Two Component Decomposition of Dual Polarimetric HH/VV SAR Data: Case Study for the Tundra Environment of the Mackenzie Delta Region, Canada. Remote Sens. 2016, 8, 1027. [Google Scholar] [CrossRef] [Green Version]
  24. Bartsch, A.; Widhalm, B.; Leibman, M.; Ermokhina, K.; Kumpula, T.; Skarin, A.; Wilcox, E.J.; Jones, B.M.; Frost, G.V.; Höfler, A.; et al. Feasibility of tundra vegetation height retrieval from Sentinel-1 and Sentinel-2 data. Remote Sens. Environ. 2020, 237, 111515. [Google Scholar] [CrossRef]
  25. Collingwood, A.; Treitz, P.; Charbonneau, F.; Atkinson, D. Artificial Neural Network Modeling of High Arctic Phytomass Using Synthetic Aperture Radar and Multispectral Data. Remote Sens. 2014, 6, 2134–2153. [Google Scholar] [CrossRef] [Green Version]
  26. Widhalm, B.; Bartsch, A.; Leibman, M.; Khomutov, A. Active-layer thickness estimation from X-band SAR backscatter intensity. Cryosphere 2017, 11, 483–496. [Google Scholar] [CrossRef] [Green Version]
  27. Collingwood, A.; Charbonneau, R.; Shang, C.; Treitz, P. Spatiotemporal Variability of Arctic Soil Moisture Detected from High-Resolution RADARSAT-2 SAR Data. Adv. Meteorol. 2018, 2018, 1–17. [Google Scholar] [CrossRef]
  28. Högström, E.; Heim, B.; Bartsch, A.; Bergstedt, H.; Pointner, G. Evaluation of a MetOp ASCAT-Derived Surface Soil Moisture Product in Tundra Environments. J. Geophys. Res. Earth Surf. 2018, 123, 3190–3205. [Google Scholar] [CrossRef] [PubMed]
  29. Zwieback, S.; Bosch, D.D.; Cosh, M.H.; Starks, P.J.; Berg, A. Vegetation–soil moisture coupling metrics from dual-polarization microwave radiometry using regularization. Remote Sens. Environ. 2019, 231, 111257. [Google Scholar] [CrossRef]
  30. Cloude, S. Polarisation: Applications in Remote Sensing, 1st ed.; Oxford University Press: Oxford, NY, USA, 2010; p. 453. [Google Scholar]
  31. Freeman, A.; Durden, S. A three-component scattering model for polarimetric SAR data. IEEE Trans. Geosci. Remote Sens. 1998, 36, 963–973. [Google Scholar] [CrossRef] [Green Version]
  32. Cloude, R.; Pottier, E. A review of target decomposition theores in radar polarimetry. IEEE Trans. Geosci. Remote Sens. 1996, 34, 498–518. [Google Scholar] [CrossRef]
  33. Banks, S.N.; King, D.J.; Merzouki, A.; Duffe, J. Characterizing Scattering Behaviour and Assessing Potential for Classification of Arctic Shore and Near-Shore Land Covers with Fine Quad-Pol RADARSAT-2 Data. Can. J. Remote Sens. 2014, 40, 291–314. [Google Scholar] [CrossRef]
  34. Yamaguchi, Y.; Moriyama, T.; Ishido, M.; Yamada, H. Four-component scattering model for polarimetric SAR image decomposition. IEEE Trans. Geosci. Remote Sens. 2005, 43, 1699–1706. [Google Scholar] [CrossRef]
  35. Wohlfart, C.; Winkler, K.; Wendleder, A.; Roth, A. TerraSAR-X and Wetlands: A Review. Remote Sens. 2018, 10, 916. [Google Scholar] [CrossRef] [Green Version]
  36. Schmitt, A.; Wendleder, A.; Hinz, S. The Kennaugh element framework for multi-scale, multi-polarized, multi-temporal and multi-frequency SAR image preparation. ISPRS J. Photogramm. Remote Sens. 2015, 102, 122–139. [Google Scholar] [CrossRef] [Green Version]
  37. Moser, L.; Schmitt, A.; Wendleder, A.; Roth, A. Monitoring of the Lac Bam Wetland Extent Using Dual-Polarized X-Band SAR Data. Remote Sens. 2016, 8, 302. [Google Scholar] [CrossRef] [Green Version]
  38. Schmitt, A.; Brisco, B. Wetland Monitoring Using the Curvelet-Based Change Detection Method on Polarimetric SAR Imagery. Water 2013, 5, 1036–1051. [Google Scholar] [CrossRef]
  39. Bartsch, A.; Pointner, G.; Bergstedt, H.; Widhalm, B.; Wendleder, A.; Roth, A. Utility of Polarizations Available from Sentinel-1 for Tundra Mapping. In Proceedings of the 2021 IEEE International Geoscience and Remote Sensing Symposium, Brussels, Belgium, 11–16 July 2021; IEEE: New York, NY, USA, 2021; p. 4. [Google Scholar]
  40. Lara, M.J. SNAP Data Portal, 2017. [Dataset]. Available online: http://ckan.snap.uaf.edu/dataset/alaskan-arctic-coastal-plain-polygonal-tundra-geomorphology-map/ (accessed on 20 February 2020).
  41. Bartsch, A.; Widhalm, B.; Pointner, G.; Ermokhina, K.; Leibman, M.; Heim, B. Landcover Derived from Sentinel-1 and Sentinel-2 Satellite data (2015–2018) for subarctic and Arctic Environments. Zentralanstalt für Meteorologie und Geodynamik, Wien. PANGAEA 2019. [Google Scholar] [CrossRef]
  42. Siewert, M.B.; Hugelius, G.; Heim, B.; Faucherre, S. Landscape controls and vertical variability of soil organic carbon storage in permafrost-affected soils of the Lena River Delta. CATENA 2016, 147, 725–741. [Google Scholar] [CrossRef]
  43. Inuvialuit Regional Corporation. Inuvialuit Land Administration: Inuvialuit Settlement Region. Available online: https://www.irc.inuvialuit.com/inuvialuit-land-administration (accessed on 26 May 2020).
  44. Environment and Climate Change Canada. Historical Data: Climate Station Komakuk Beach. 2020. [Dataset]. Available online: https://climate.weather.gc.ca/ (accessed on 20 February 2020).
  45. Beck, H.E.; Zimmermann, N.E.; McVicar, T.R.; Vergopolan, N.; Berg, A.; Wood, E.F. Present and future Köppen-Geiger climate classification maps at 1-km resolution. Sci. Data 2018, 5, 180214. Available online: http://www.gloh2o.org/koppen/ (accessed on 20 February 2020). [CrossRef] [PubMed] [Green Version]
  46. Rampton, V.N. Quarternary Geology, Yukon Coastal Plain Yukon Territory-Northwest Territories. Geological Survey of Canada (GSC) MAP 1503A 1:250,000 Scale. 1982. [Dataset]. Available online: http://data.geology.gov.yk.ca/Compilation/20#InfoTab (accessed on 15 July 2019).
  47. Overduin, P.; Obu, J. Permafrost in the Northern Hemisphere. 2019. [Dataset]. Available online: https://news.grida.no/new-map-shows-extent-of-permafrost-in-northern-hemisphere (accessed on 8 May 2020).
  48. CAVM TEAM. Circumpolar Arctic Vegetation Map. (1:7,500,000 scale), Conservation of Arctic Flora and Fauna (CAFF) Map No. 1.0 U.S. Fish and Wildlife Service, Anchorage, Alaska. 2003. [Dataset]. Available online: http://www.arcticatlas.org/maps/themes/cp/ (accessed on 20 February 2020).
  49. Porter, C.; Morin, P.; Howat, I.; Noh, M.J.; Bates, B.; Peterman, K.; Keesey, S.; Schlenk, M.; Gardiner, J.; Tomko, K.; et al. ArcticDEM, 2018. Harvard Dataverse, V1. [Dataset]. Available online: https://www.pgc.umn.edu/data/arcticdem/ (accessed on 3 October 2019).
  50. Digital Globe, I. WorldView-3 Image, 2019. [Dataset]. Available online: http://www.digitalglobe.com (accessed on 12 July 2019).
  51. German Aerospace Center. TerraSAR-X Ground Segment Basic Product Specification Document; German Aerospace Center: Bonn, Germany, 2013; In: TX-GS-DD-3302. [Google Scholar]
  52. Airbus. TerraSAR-X Image Product Guide: Basic and Enhanced Radar Satellite Imagery; Airbus: Bonn, Germany, 2015; In: OP00xxxxxxxxxx. [Google Scholar]
  53. Ulaby, F.; Long, D. Microwave Radar and Radiometric Remote Sensing, 1st ed.; University of Michigan Press: Michigan, MI, USA, 2014; p. 984. [Google Scholar] [CrossRef]
  54. Digital Globe, I. Tools & Resources. Available online: http://www.digitalglobe.com/resources#resource-table-section (accessed on 8 May 2020).
  55. Schoeneberger, P.J.; Wysocki, D.A.; Benham, E.C. Soil Survey Staff. In Field Book for Describing and Sampling Soils, Version 3.0.; Natural Resources Conservation Service, National Soil Survey Center: Lincoln, NE, USA, 2012. [Google Scholar]
  56. Beaudette, D.; Roudier, P.; Brown, A. aqp: Algorithms for Quantitative Pedology, 2020. R package Version 1.19; Available online: https://cran.r-project.org/package=aqp (accessed on 1 February 2020).
  57. R Core Team, R. R: A Language and Environment for Statistical Computing [Computer Software]. R Foundation for Statistical Computing v3.6.3. 2015. Available online: https://www.R-project.org/ (accessed on 1 February 2020).
  58. Airbus. Radiometric Calibration of TerraSAR-X Data: Beta Naught and Sigma Naught Coefficient Calculation; Airbus: Bonn, Germany, 2014; In: TSXX-ITD-TN-0049. [Google Scholar]
  59. SNAP. SNAP—ESA Sentinel Application Platform (Version 8.0.0), 2019 [Computer Software]. Available online: http://step.esa.int (accessed on 1 November 2019).
  60. Lee, J.S.; Pottier, E. Polarimetric Radar Imaging: From Basics to Applications, 1st ed.; Optical Science and Engineering; CRC Press: Boca Raton, MA, USA, 2009; Volume 143, p. 389. [Google Scholar] [CrossRef]
  61. Exelis Visual Information Solutions. ENVI—Exelis Visual Information Solutions (Version 5.2.2) [Computer Software]. Boulder, Colorado. 2010. Available online: https://www.l3harrisgeospatial.com/Software-Technology/ENVI (accessed on 15 January 2020).
  62. Exelis Visual Information Solutions. FLAASH © Background. Boulder, Colorado: Exelis Visual Information Solutions. Available online: https://www.l3harrisgeospatial.com/docs/backgroundflaash.html (accessed on 15 January 2020).
  63. Belfiore, O.R.; Meneghini, C.; Parente, C.; Santamaria, R. Application Of Different Pan-Sharpening Methods On WorldView-3 Images. ARPN J. Eng. Appl. Sci. 2016, 11, 7. [Google Scholar]
  64. Rouse, J.W.J.; Haas, R.H.; Schell, J.A.; Deering, D.W. Monitoring vegetation systems in the Great Plains with ERTS. Proc. Third Earth Resour. Technol.-Satell.- Symp. 1973, 1, 309–317. [Google Scholar]
  65. Baatz, M.; Schäpe, A. Multiresolution segmentation—An optimization approach for high quality multi-scale image segmentation. In Angewandte Geographische Informationsverarbeitung XII; Wichmann Verlag: Karlsruhe, Germany, 2000; pp. 12–23. [Google Scholar]
  66. Benz, U.C.; Hofmann, P.; Willhauck, G.; Lingenfelder, I.; Heynen, M. Multi-resolution, object-oriented fuzzy analysis of remote sensing data for GIS-ready information. ISPRS J. Photogramm. Remote Sens. 2004, 58, 239–258. [Google Scholar] [CrossRef]
  67. van Iersel, W.; Straatsma, M.; Middelkoop, H.; Addink, E. Multitemporal Classification of River Floodplain Vegetation Using Time Series of UAV Images. Remote Sens. 2018, 10, 1144. [Google Scholar] [CrossRef] [Green Version]
  68. Ramsar Convention Secretariat. Wetland inventory: A Ramsar framework for wetland inventory and ecological character description. In Ramsar Handbooks for the Wise Use of Wetlands, 4th ed.; Ramsar Convention Secretariat: Gland, Switzerland, 2010; Volume 15, p. 79. [Google Scholar]
  69. Canada Committee on Ecological (Biophysical) Land Classification and the National Wetlands Working Group. The Canadian Wetland Classification System, 2nd ed.; Wetlands Research Branch, University of Waterloo: Waterloo, ON, USA, 1997; p. 68, OCLC: 43464321. [Google Scholar]
  70. Haralick, R.M.; Shanmugam, K.; Dinstein, I. Textural Features for Image Classification. IEEE Trans. Syst. Man Cybern. 1973, SMC-3, 610–621. [Google Scholar] [CrossRef] [Green Version]
  71. Breiman, L. Random Forests. Mach. Learn. 2001, 45, 5–32. [Google Scholar] [CrossRef] [Green Version]
  72. Breiman, L.; Cutler, A.; Liaw, A.; Wiener, M. randomForest: Breiman and Cutler’s Random Forests for Classification and Regression, R Package Version 4.6-14; 2018. Available online: https://cran.r-project.org/package=randomForest (accessed on 1 February 2020).
  73. Kuhn, M. Caret: Classification and Regression Training. 2020. R package version 6.0-85. Available online: https://cran.r-project.org/package=caret (accessed on 1 February 2020).
  74. Diaz-Uriarte, R. varSelRF: Variable Selection Using Random Forests. 2017. R Package Version 0.7-8. Available online: https://cran.r-project.org/package=varSelRF (accessed on 1 February 2020).
  75. Olofsson, P.; Foody, G.M.; Herold, M.; Stehman, S.V.; Woodcock, C.E.; Wulder, M.A. Good practices for estimating area and assessing accuracy of land change. Remote Sens. Environ. 2014, 148, 42–57. [Google Scholar] [CrossRef]
  76. A’Campo, W.; Bartsch, A.; Roth, A.; Wendleder, A.; Durstewitz, L.; Lodi, R.; Martin, V.S.; Wagner, J.; Hugelius, G. Raster land cover product derived from TerraSAR-X imagery for the Komakuk Beach study site on the Beaufort Coast, Canada. PANGAEA 2021. [Google Scholar] [CrossRef]
  77. Banks, S.; Millard, K.; Behnamian, A.; White, L.; Ullmann, T.; Charbonneau, F.; Chen, Z.; Wang, H.; Pasher, J.; Duffe, J. Contributions of Actual and Simulated Satellite SAR Data for Substrate Type Differentiation and Shoreline Mapping in the Canadian Arctic. Remote Sens. 2017, 9, 1206. [Google Scholar] [CrossRef] [Green Version]
Figure 1. (A) Overview of Northwestern Canada. (B) Beaufort Coast Area, with TerraSAR-X (TSX) extent and climate stations. (C) Komakuk Beach study area with the reference objects, boundaries of deposits (white line), and terrain. DEM(s) courtesy of the Polar Geospatial Center [49].
Remotesensing 13 04780 g001
Figure 2. The mean daily air temperature (red line) and total daily precipitation (black bars) for 2019. The average daily air temperature for the period 1995 till 2017 (Herschel Island station, black line; Komakuk Beach station, gray line).
Remotesensing 13 04780 g002
Figure 3. Workflow of Methods. The grey objects represent input and output data. The white squares represent the processing steps. MSML = Multi-looking multi-scale.
Remotesensing 13 04780 g003
Figure 4. The mean Volumetric Moisture Content (VMC) for each land cover class normalized by the Active Layer Depth (ALD). The y-axis presents the normalized depth relative to the ALD (Figure S3).
Remotesensing 13 04780 g004
Figure 5. Violin plots for each TerraSAR-X acquisition date of the HH and HV Sigma Nought intensity values and the K 0 and K 1 Kennaugh element values grouped by land cover class. The box plots display minimum, lower quartile, median, upper quartile, and maximum. The red line connects the mean value for each acquisition date. The recorded periods are: peak-level vegetation (27 July and 18 August); senescence (9 September and 1 October); and snow cover (23 October, 14 November, and 6 December).
Remotesensing 13 04780 g005
Figure 6. (A) Land cover map of the Komakuk Beach study area based on the multi-temporal classification scheme KE C1 (Table 4) [76]. DEM(s) courtesy of the Polar Geospatial Center [49]. (B) Subset of the KE C1 land cover map. (C) The subset with a WorldView-3 optical image. Imagery [2019] Digital Globe ©, Maxar Technologies, Westminster, CO, USA [50]. (D) The subset with a RGB-image of the best predictors derived from the TerraSAR-X timeseries with R = L5_k0_oct23, G = L7_k0_dec06, and B = L13_k1_nov14.
Remotesensing 13 04780 g006
Figure 7. The difference map of the Sigma Nought, SN C1, and the Kennaugh element, KE C1, and classification schemes (Table 4). Black pixels indicate disagreement (36%) and class color-coded pixels indicate agreement (64%). DEM(s) courtesy of the Polar Geospatial Center [49].
Remotesensing 13 04780 g007
Figure 8. Variable importance plot of the Random Forest classifier with the predictor variables from the Kennaugh element, KE C1, and classification scheme ranked by Mean Decrease Accuracy (MDA). See Table 4 for the layer naming convention of the predictor variables and Table S3 for the predictor ranking for the individual land cover classes.
Remotesensing 13 04780 g008
Figure 9. Scatter plot displaying the mean value of the reference objects for the land cover classes: bare soil (BS), fen (F), high-center polygon (HCP), low-center polygon (LCP), meadow (M), sea (Se), shrubs (Sh), and fresh water (FW). The x-y-z axes represent the highest-ranked predictors for the Kennaugh element classification scheme KE C1 (Figure 8). For interpretation of the 3D plot, the reader is referred to the web version of this article.
Remotesensing 13 04780 g009
Figure 10. Comparison of land cover products available for the Komakuk Beach study area. (A) Land cover map of this study based on the multi-temporal Kennaugh element classification scheme, KE C1. (B) Land cover map [41]. (C) Tundra geomorphology map [40]. DEM(s) courtesy of the Polar Geospatial Center [49].
Remotesensing 13 04780 g010
Table 1. Data sources and specifications. ArcticDEM = Arctic Digital Elevation Model [49], WV-3 = WorldView-3 [50], TSX = TerraSAR-X [51], GCP = Ground Control Point, μ = mean, x ˜ = median, δ x = ground range resolution, δ y = azimuth resolution.
Field CampaignDateLocationDatasetsPlot Count
Komakuk Beach3–24 August 2019Top: 69°36 19.22 NSoil47
Bottom: 69°32 11.59 NVegetation47
Left: 140°15 54.26 WLandcover105
Right: 140°5 33.68 W
ProductTileSpatial ResolutionRegistrationCount of GCP’s μ vertical
residual
x ˜ vertical
residual
ArcticDEM42_182 mICEsat998−0.001 m−0.062 m
43_18 10180 m−0.018 m
TanDEM-X DEM 10 m
SensorAcquisition DateSpatial ResolutionImage Bands
WV-312 July 20191.31 mCoastal: 400–450 nmRed: 630–690 nm
Blue: 450–510 nmRed Edge: 705–745 nm
Green: 510–580 nmNIR-1: 770–895 nm
Yellow: 585–625 nmNIR-2: 860–1040 nm
0.33 mPanchromatic: 450–800 nm
SensorAcquisition DateSpatial Resolution
δ x × δ y
ModeIncidence
Angle ( θ )
PolarizationNESZ
TSX27 July 20192.1 m × 2.3 mStripmap41.6 HH/HV−19 dB
TSX18 August 20192.1 m × 2.3 mStripmap41.5 HH/HV−19 dB
TSX9 September 20192.1 m × 2.3 mStripmap41.6 HH/HV−19 dB
TSX20 October 20192.1 m × 2.3 mStripmap41.6 HH/HV−19 dB
TSX14 November 20192.1 m × 2.3 mStripmap41.6 HH/HV−19 dB
TSX6 December 20192.1 m × 2.3 mStripmap41.6 HH/HV−19 dB
Table 2. Land cover class description including reference object size and training and validation pixel count.
ClassClass DescriptionReference ObjectsPixel Count
CountArea (m2)TrainingValidationTotal
High-center polygonHCPWetland polygon bog (often >40 cm surface peat) dominated by lichen and shrubs. Average shrub height < 20 cm61108,552302412954319
Low-center polygonLCPWetland polygon fen (often >40 cm surface peat) dominated by graminoids3959,15216617112372
FenFWetland stream fen or sloping fen (often >40 cm surface peat) dominated by graminoids1119,296537230767
MeadowMRiverine floodplain dominated by graminoids with mineral soils58790245104349
ShrubsShRiverine floodplain dominated by woody shrubs with mineral soils. Average shrub height >40 cm1214,113398170568
Bare soilBSExposed soil along the coast, lakes, and streams1415,625445190635
Fresh waterFWFreshwater lakes, ponds, and streams1939,99511164771593
SeaSSea water814,586411176587
OtherOAnthropogenic structures1015,003423181604
Total 179295,1148260353411,794
Table 3. Polarimetric and texture predictor variables.
NameDescriptionSymbolSource
HHSigma Nought intensity of the HH channelHHn/a
HVSigma Nought intensity of the HV channelHVn/a
cRCross-polarised ratio of the HH and HV channels.cR[53]
K 0 Kennaugh Matrix element, total intensity K 0 [36]
K 1 Kennaugh Matrix element, difference between co- and cross-pol intensity K 1 [36]
MeanLocal mean of the co-occurrence matrixM[70]
VarianceLocal variance of the co-occurrence matrixV[70]
HomogeneityLocal homogeneity of the co-occurrence matrixH[70]
ContrastLocal contrast of the co-occurrence matrixCon[70]
DissimilarityLocal dissimilarity of the co-occurrence matrixD[70]
EntropyLocal entropy of the co-occurrence matrixE[70]
Second MomentLocal angular second moment of the co-occurrence matrixScM[70]
CorrelationLocal correlation of the co-occurrence matrixCor[70]
Table 4. The Random Forest classification schemes with the layer naming convention for the predictor variables and the total number of predictors. The term %date% stands for the TerraSAR-X acquisitions: jul27, aug18, sep09, oct01, oct23, nov14, dec06.
Classification Schemes and Layer Naming Convention
NameDescriptionLayer Naming ConventionPredictors
SN C1Sigma Nought (SN)HH_%date%21
classification schemeHV_%date%
cR_%date%
SN C2Sigma Nought (SN)
classification scheme
using texture predictors
HH_%date%_MHV_%date%_McR_%date%_M168
HH_%date%_VHV_%date%_VcR_%date%_V
HH_%date%_HHV_%date%_HcR_%date%_H
HH_%date%_ConHV_%date%_ConcR_%date%_Con
HH_%date%_DHV_%date%_DcR_%date%_D
HH_%date%_EHV_%date%_EcR_%date%_E
HH_%date%_ScMHV_%date%_ScMcR_%date%_ScM
HH_%date%_CorHV_%date%_CorcR_%date%_Cor
KE C1Kennaugh Element (KE)k0_%date%14
classification schemek1_%date%
KE C2Kennaugh Element (KE)
classification scheme
using texture predictors
k0_%date%_Mk1_%date%_M 112
k0_%date%_Vk1_%date%_V
k0_%date%_Hk1_%date%_H
k0_%date%_Conk1_%date%_Con
k0_%date%_Dk1_%date%_D
k0_%date%_Ek1_%date%_E
k0_%date%_ScMk1_%date%_ScM
k0_%date%_Cork1_%date%_Cor
Table 5. Vegetation height in centimeters grouped by land cover class. Vegetation height classes are: dwarf (0–10 cm), low (10–40 cm), medium (40–200 cm), and tall (>200 cm).
Land Cover ClassMin (cm)Max (cm)Mean (cm)SD (cm)Height Class
Fen1736277low
High-center polygon62094dwarf/low
Low-center polygon829175low
Meadow1223176low
Shrubs40230n/an/amedium/tall
Table 6. Random Forest (RF) model performance for the multi-temporal classification schemes (Table 4). OOB error = Out-of-the-Bag error, OA = Overall Accuracy, train = training data, val = validation data.
Sigma NoughtKennaugh Element
SchemeSN C1SN C2KE C1KE C2
Model performance
Optimal modelRF2_SNC1RF2_SNC2RF1_KEC1RF2_C6
ntrain8235823582608260
Predictors171071458
mtry39213
ntree200200200200
OOB error (%)41.62.77.60.7
OAtrain (%)58.697.392.299.2
Time (min)1.15.10.82.8
External validation
nval3523352335343534
OAval57.797.692.499.3
OAtrain − OAval0.9−0.3−0.2−0.2
Table 7. The User Accuracy (UA) and the Producer Accuracy (PA) for each land cover class and classification scheme (Table 4).
Sigma NoughtKennaugh Element
SN C1SN C2KE C1KE C2
UA (%)PA (%)UA (%)PA (%)UA (%)PA (%)UA (%)PA (%)
Bare soil79.837.499.596.895.782.699.0100.0
Fen78.37.810095.794.284.8100.099.6
High center polygon51.287.395.699.591.295.999.699.3
Low center polygon43.831.297.696.186.791.898.999.7
Meadow0010088.610077.910099.0
Other75.912.410098.994.992.3100.0100.0
Sea84.883.310098.998.999.4100.099.4
Shrubs56.413.198.191.789.877.697.197.1
Fresh water87.785.399.299.499.197.199.899.6
OA (%)57.797.692.499.3
Table 8. Confusion matrix for the multitemporal classification scheme KE C1 (Table 4). OA = Overall Accuracy, PA = Producer’s Accuracy, and UA = Users’s Accuracy.
Ref.BSFHCPLCPMOSeShFWTotalUA (%)
Pred.
Bare soil1570100100516495.7
Fen1195530201020794.2
High-center polygon19131242551250133136291.2
Low-center polygon3184565353022475386.7
Meadow000081000081100.0
Other8100016700017694.9
Sea0000001750217798.9
Shrubs1320630132014789.8
Fresh water1000001246346799.1
total19023012957111041811761704773534OA (%)
PA (%)82.684.895.991.877.992.399.477.697.1 92.4
Publisher’s Note: MDPI stays neutral with regard to jurisdictional claims in published maps and institutional affiliations.

