
Classification of Typical Tree Species in Laser Point Cloud Based on Deep Learning


1
Chinese Academy of Surveying and Mapping, Beijing 100830, China
2
Faculty of Geomatics, Lanzhou Jiaotong University, Lanzhou 730070, China
3
National and Local Joint Engineering Research Center for the Application of Geographical Situation Monitoring Technology, Lanzhou 730070, China
4
Gansu Provincial Engineering Laboratory of Geographical Situation Monitoring, Lanzhou 730070, China
*
Author to whom correspondence should be addressed.
Remote Sens. 2021, 13(23), 4750; https://doi.org/10.3390/rs13234750
Submission received: 5 October 2021
/
Revised: 9 November 2021
/
Accepted: 20 November 2021
/
Published: 23 November 2021
(This article belongs to the Section Forest Remote Sensing)
Abstract
:We propose the Point Cloud Tree Species Classification Network (PCTSCN) to overcome challenges in classifying tree species from laser data with deep learning methods. The network is mainly composed of two parts: a sampling component in the early stage and a feature extraction component in the later stage. We used geometric sampling to extract regions with local features from the tree contours since these tend to be species-specific. Then we used an improved Farthest Point Sampling method to extract the features from a global perspective. We input the intensity of the tree point cloud as a dimensional feature and spatial information into the neural network and mapped it to higher dimensions for feature extraction. We used the data obtained by Terrestrial Laser Scanning (TLS) and Unmanned Aerial Vehicle Laser Scanning (UAVLS) to conduct tree species classification experiments of white birch and larch. The experimental results showed that in both the TLS and UAVLS datasets, the input tree point cloud density and the highest feature dimensionality of the mapping had an impact on the classification accuracy of the tree species. When the single tree sample obtained by TLS consisted of 1024 points and the highest dimension of the network mapping was 512, the classification accuracy of the trained model reached 96%. For the individual tree samples obtained by UAVLS, which consisted of 2048 points and had the highest dimension of the network mapping of 1024, the classification accuracy of the trained model reached 92%. TLS data tree species classification accuracy of PCTSCN was improved by 2–9% compared with other models using the same point density, amount of data and highest feature dimension. The classification accuracy of tree species obtained by UAVLS was up to 8% higher. We propose PCTSCN to provide a new strategy for the intelligent classification of forest tree species.
1. Introduction
Accurate classification of tree species is essential for forest resource management and ecological conservation [1,2,3]. Remote sensing technologies are widely used in forest surveys because they allow to rapidly gather large-scale observations in a timely and periodical manner [4,5,6]. Light Detection and Ranging (LiDAR) is an active remote sensing technology with the ability to quickly and accurately extract three-dimensional feature information. In addition, LiDAR permits all-weather operations compared with optical remote sensing satellites and is less affected by the external environment. LiDAR has also powerful low-altitude detection advantages [7,8]. Therefore, LiDAR greatly enhances forest resources investigations.
In recent years, with the continuous improvement of computer hardware performance, massive data calculations and complex neural network model training have evolved from theoretical designs to applications. The winners of the 2012 ImageNet competition gained an unmatched advantage using AlexNet, promoting the boom of deep learning models in the field of image recognition [9]. Compared with two-dimensional image data, point cloud data obtained by LiDAR add information in the vertical dimension. This greatly challenges feature extraction and training of point cloud data deep learning models [10,11]. Currently, many scholars are engaged in deep learning research of point clouds, and their research methods can be divided into three categories: (1) Research on deep learning models based on multi-views, which mainly convert a point cloud into two-dimensional images with multiple perspectives through projection and identify them through deep learning models that achieve ideal results [12,13,14]; (2) Deep learning model research based on voxel data, which mainly converts point cloud into 3D voxel data and then, using a convolutional neural network, extract the 3D features [15,16,17]; (3) Deep learning model research based on the point cloud, which mainly uses point cloud data for end-to-end extraction of feature attributes and model training [18,19,20].
The rapid development of 3D point cloud deep learning technology helped advance the research into point cloud forest tree species classification. Seidel et al. [21] used deep learning methods to predict tree species from point cloud data acquired by a 3D laser scanner. The approach converts the three-dimensional point cloud data of each tree into a two-dimensional image using a convolutional neural network to classify the image and then completes the tree species classification. The experimental results showed that the classification accuracy of ash, oak, and pine trees was improved by 6%, 13%, 14%, and 24%, respectively. Hamid et al. [22] classified conifer/deciduous airborne point cloud data based on deep learning methods. They converted LiDAR data into digital surface models and 2D views and used deep convolutional neural networks for classification. Experimental results showed that the cross-validation classification accuracy of conifers and deciduous trees were 92.1 ± 4.7% and 87.2 ± 2.2%, respectively; the classification accuracy of understory trees was 69.0 ± 9.8% for conifers and 92.1 ± 1.4% for deciduous trees. Mizoguchi et al. [23] used a convolutional neural network to identify the tree species of a single tree in Terrestrial Laser Scanning (TLS) data. This method converted the point cloud data into a depth map and extracted features through the convolutional neural network to complete tree species recognition. The experimental results showed that the overall accuracy of the classification reached 89.3%. The point cloud data of the tree were converted into two-dimensional image data, and deep learning image classification was used to complete the classification of tree species. However, in the process of converting point cloud data into image data, the feature information was lost, and the feature of the point data was destroyed.
Guan et al. [24] classified tree species based on deep learning applied to point cloud data obtained by a mobile LiDAR. The method converted the point cloud into voxel data to extract a single tree and used the waveform to build the tree structure. They used deep learning technology to train the advanced feature extraction of the tree waveform. The overall accuracy reached 86.1%, and the kappa coefficient was 0.8, which improved the classification accuracy of tree species. Zou et al. [25] classified tree species based on deep learning methods for TLS data of complex forests applying the voxelization of the extracted single tree data and extracting the hierarchical features of the voxel data. Finally, they used the deep learning model to complete the tree species classification. Experimental results showed that the average classification accuracies on the two data sets were 93.1% and 95.6%, which were better than for other algorithms. After converting the point cloud data into voxel data, applying deep learning to classify the voxel data into tree species produced excellent results. However, the process of converting point cloud data into voxel data was complicated, and there was a local feature loss. Because the voxel data structure was complex, feature extraction and model training were inefficient.
Liu et al. [26] used Unmanned Aerial Vehicle Laser Scanning (UAVLS) and TLS data to classify tree species based on 3D deep learning. The method proposed the LayerNet model network, which divides multiple overlapping layers to obtain the local 3D structure characteristics of trees. At the same time, LayerNet aggregated the characteristics of each layer to obtain the global characteristics and classified the tree species by convolution. The test results showed that LayerNet could accurately classify 3D data directly, with a classification accuracy of up to 92.5%. Briechle et al. [27] used PointNet++ to directly classify airborne point cloud data. Experiments showed that the accuracy was 90% for coniferous trees and 81% for deciduous trees. Xi et al. [28] used deep learning and machine learning algorithms to classify the tree species data of TLS. They researched 13 machine learning and deep learning classification methods of nine tree species. The experimental results showed that the classification accuracy of deep learning was 5% higher than that of machine learning. The classification of PointNet++ was the best. This research conducted end-to-end deep learning model training on point cloud data. The approach did not require the conversion of point clouds into voxels or 2D images, avoiding the loss of features and local information and improving computational efficiency. However, they did not make use of the attribute information of the point cloud data, so the neural network could not extract more features during model training.
To overcome the problems in the above research, we propose using the Point Cloud Tree Species Classification Network (PCTSCN) to classify tree species with high precision for natural resource forest monitoring. Our network includes three main steps. First, the point cloud data of a single tree are down-sampled through geometric sampling to retain more local features. Then, we use the improved Farthest Point Sampling method to further extract the global feature points of every single tree. The sub-sample single tree point cloud was taken as the training sample. Finally, the neural network is used to extract the characteristics of the spatial and reflection intensity information of the training samples for model training. The model obtained through PCTSCN training not only considers the local features of tree point cloud data but also integrates the global features. The PCTSCN increases attribute information and information dimensions of each point, avoiding the limitations of the other research approaches.
2. Materials
2.1. Study Area
The growth structure and shape profiles of trees of the same species in natural and planted forests are highly variable. To improve the robustness of the model, the same tree species of white birch and larch were selected in both study areas (natural forest and artificial forest). The study areas were the Saihanba forest area (117°23′50.4204″E, 42°22′0.4044″N) in Chengde City and the Laohugou forest area (115°28′0.3144″E, 40°59′13.4016″N) in Zhangjiakou City, Hebei Province, China (Figure 1). The Saihanba forest area is an artificially planted forest area with a uniform tree growth structure and uniform spacing between trees. The main tree species in the forest area include larch and white birch. In the Saihanba forest area, we collected data for a total tree area of about 4200 square meters. We collected point cloud data of about 600 trees in total. The Laohugou forest area is a natural growth forest area with a complex environment. The growth structure of the trees and the distance between them are not uniform. The different types of trees are randomly distributed. The main tree species are white birch and larch. The sample plot area of the forest area we collected is about 10,000 square meters. According to our rough statistics, we collected about 1000 single trees, including about 700 white birch trees and 300 larch trees. The location and environment of each experimental plot are shown in Figure 1.
2.2. Data Collection
To verify the reliability of the method proposed in this paper, we collected TLS and UAVLS data of two forest plots. We carried out tree species identification research on the point cloud data obtained by these two platforms.
2.2.1. TLS Data
The external environment and tree growth conditions of the two plots are different, so we used two types of TLS for data collection. The trees in the Saihanba forest area had a uniform growth structure and a flat terrain, which was convenient for using an instrument stand, so we used the Riegl VZ-1000 with a faster scanning speed. For the entire Saihanba forest area, we collected a total of four small sample plots. A total of 20 stations were erected, and the average distance between each station was 20.5 m. The schematic diagram of the station of each plot is shown in Figure 2. The Riegl VZ-1000 instrument scan parameters settings are shown in Table 1. The Laohugou forest area is complex with a non-uniform tree growth structure. Here we used the Faro F350 instrument with a higher scanning point density (up to 976,000 points per second). In addition, the Faro F350 is easier to carry than the Riegl VZ-1000, making it more suitable for collecting data in forest areas with complex environments. In the Laohugou forest area, we erected a total of 38 stations. The average distance between each station was 17.6 m. The schematic diagram of the erection station is shown in Figure 2. The Faro F350 instrument parameters settings are shown in Table 1.
2.2.2. UAVLS Data
In this paper, we collected UAVLS data with the Beijing SureStar R-Fans-16 LiDAR. We designed the flying height of the drone to be 80 m so that it was not affected by the height of the trees. The strip width was 200 m, which ensured completeness of data acquisition. The flying speed was designed to be 3 m/s based on the efficiency of data acquisition and data quality. The settings of other parameters are shown in Table 2.
2.3. Data Preprocessing
We eliminated the noise points from the acquired original TLS and UAVLS point cloud data. Then, we filtered the ground points and normalized the point cloud data. Finally, the processed data were divided into individual trees to prepare the training and test data set samples. The point cloud data processing workflow is shown in Figure 3.
2.3.1. Noise Removal
Outliers generated during data acquisition were distributed in various regions of the point cloud data. Some of these outliers were caused by the instrument itself and the external environment. They are collectively called noise points. These noise points can cause errors in the data and need to be removed. The amount of point cloud data obtained by TLS was large, and the noise points were evenly distributed. Statistical filtering algorithms with higher point cloud filtering speed were used to remove noise [29]. The amount of point cloud data obtained by UAVLS was relatively small, so the gradient filter algorithm was used to remove noise points [30]. The original point cloud data are shown in Figure 4a, and the data after noise removal are shown in Figure 4b.
2.3.2. Ground Point Separation
For both TLS and UAVLS, weeds and ground points are also scanned when obtaining point cloud data. These point cloud data are collectively referred to as ground points. Because ground points cause data redundancy, they need to be separated. The separated ground points can be used to prepare the point cloud data for normalization and single tree segmentation. Because there were weeds and bushes in the surveyed woodland, the boundary between ground points and non-ground points was very blurred, and it was very difficult to set the parameters of the ground filtering algorithm. Therefore, for this study, we chose the ground point filter (Cloth Simulation Filter, CSF) algorithm with a simple parameter setting [31]. The idea of this algorithm is to use a cloth that falls under gravity to obtain a physical representation of the terrain. Compared with other methods, CFS has fewer parameters and a fast separation speed. The ground point separation is shown in Figure 4c.
2.3.3. Point Cloud Normalization
The normalization of point cloud data can eliminate the influence of topographical fluctuations on single tree segmentation. The normalized data can also lay the foundation for forest parameter extraction. We used the triangulated irregular network (TIN) to construct a digital elevation model (DEM) of the separated ground points [32]. The DEM elevation was subtracted from each point in the point cloud data at the corresponding horizontal position. We used this method to complete the normalization of the point cloud data. The normalization of point cloud data is shown in Figure 4d.
2.3.4. Single Tree Segmentation
Single tree segmentation of point cloud data is the most important and difficult step in this research. Single tree segmentation is also the basis of all point cloud data research. Single tree segmentation directly determines whether the outline information of a tree is complete. Current research on single tree segmentation is mainly divided into two categories. The first category includes the single tree segmentation based on the canopy height model (CHM) [33,34,35]. The main idea is to generate a DEM based on ground points and then generate a digital surface model (DSM) based on the overall point cloud data. The CHM can be generated by subtracting the DEM from the DSM. The last step is to use image segmentation technology and region growing technology to segment single trees from point cloud data. The second category is based on the single tree segmentation of a 3D point cloud. The main idea is to perform single tree segmentation on 3D point cloud data through point clustering [36,37,38]. To ensure that the number of single tree samples to be divided is enough and that the segmentation effect of a single tree point cloud is complete, we used both methods that come with the LiDAR360 software to automatically perform single tree segmentation. We compared the effect of these two methods on the segmentation of each tree from the point cloud data and selected the complete tree of segmentation as the sample. The point cloud data after the single tree segmentation are shown in Figure 5. For some trees that are difficult to segment, such where the branches on the canopy of two adjacent trees intersect each other, which is difficult to distinguish even by human eyes (see Figure 6). The point cloud data of some trees were either over-segmented or under-segmented after segmentation. For the point cloud data of these trees, we used human–computer interactive operations to manually edit and segment them.
3. Method
The PCTSCN proposed in this paper can directly classify tree species from point cloud data. We sampled the single tree point cloud twice in different ways to retain more local and global features. We added an attribute dimension to the neural network to extract reflection intensity information. In this way, the neural network could extract more features to improve the classification accuracy of the tree species. To verify the feasibility of the method, we classified the tree point cloud data obtained by TLS and UAVLS separately. First, PCTSCN performed geometric sampling processing on the point cloud data of single trees. Compared with uniform sampling, geometric sampling preserves more local information features. Second, PCTSCN performed the improved farthest point sampling for the point cloud data of the tree processed in the previous step. In contrast to the farthest point sampling method, the improved farthest point sampling method sampled from the whole tree. The method completed the sub-sampling according to the set sampling conditions and retained the required number of feature points of the single tree. Third, we used the neural network in PCTSCN to complete the extraction of high-dimensionality features. PCTSCN added a reflection intensity information dimension when the initial feature matrix was input so that it contained more feature information. Fourth, PCTSCN conducted model training on TLS and UAVLS data with different sampling point densities and the highest feature dimension. Fifth, we used the softmax function to output the classification results in PCTSCN to complete the classification of the tree species. The workflow of PCTSCN is shown in Figure 7.
3.1. Geometric Sampling
Because white birch and larch trees have different shapes and structures, we should retain more features after sampling the point cloud data. Compared to Liu et al. [26] and PointNet’s uniform sampling method, PCTSCN used a geometric sampling method to down-sample the point cloud data of larch and white birch. The local features of a single tree point cloud were more obvious where the location curvature had a large change. In the geometric sampling method, more points are extracted from the individual tree point cloud in places with large curvature changes. The specific steps of geometric sampling in PCTSCN are as follows:
- (1)
- Calculation of the K-nearest neighborhood of each point in the point cloud data of each single tree sample. Because the point data volume of each point cloud sample after the single tree segmentation was inconsistent, the threshold of the neighborhood range could be set according to the data volume of each single tree point cloud.
- (2)
- Extraction of the curvature of the area. Assuming that the surface approximated the point cloud data in the neighborhood of the point, the curvature of this point can be expressed by the curvature of the surface of the area.
- (3)
- Using discrete points to fit the surface, we used the standard least squares surface fitting method:,, are the points in the neighborhood, and denotes the residual squared.The approximate equation parameters of the curved surface were obtained by solving, and the average curvature was obtained by a curve of the curved surface.
- (4)
- Identification of the range of the curvature threshold. The points with a curvature greater than the threshold were saved; otherwise, they were discarded. In this way, the geometric characteristics of the tree point cloud were preserved.
Whether it was the data obtained by TLS or UAVLS, after processing by the geometric sampling method, the contour structure was retained (Figure 8). The local characteristics of each tree were also preserved.
3.2. Improved Farthest Point Sampling
The Farthest Point Sampling is the method of down-sampling point cloud data found commonly in the literature [18]. The main idea of the algorithm is to sample M points (M < N) from N points. We constructed two datasets: A and B. A represented the set formed by the selected points, and B represented the set formed by the unselected points. At each iteration, we selected a point from set B with the largest distance to a point in set A. The specific process is as follows:
- (1)
- Randomly select a point in set B and put it into set A.
- (2)
- Calculate the distance from a point in set A to each point in set B, select the corresponding point with the largest distance and save it in set A.
- (3)
- Randomly select a point from set B, and calculate the distance between this point and two points in set A. Finding the closest point is the closest distance from a random point in set B to set A.
- (4)
- Calculate the distance from each point in set B to set A, and find the point with the largest corresponding distance, which is the third point.
- (5)
- Repeat steps 3 and 4 until the number of points required by set A is selected.
The Farthest Point Sampling method provides uniform sampling in the extraction of local feature points. However, it suffers from the problem of an uncertain initial point and an uncertain sampling result.
The down-sampling of tree point cloud data needed to save its overall outline was able to highlight the structural and morphological characteristics of each tree, which was convenient for the neural network to extract and integrate its high-dimensional features. To better preserve the global features of the sampled data, we improved the Farthest Point Sampling method as follows:
- (1)
- The single tree data processed by the geometric sampling method in the previous step constituted set C, and the total number of points was to N. The point H closest to the center was extracted and stored in set D, and then the number of points in set C became N-1.
- (2)
- C was expressed as (), where the k value range was from 1 to N-1. The points corresponding to the maximum and minimum values in the x, y, and z directions were extracted. These points were stored in set D. The number of points in set D became 7 and C became N-7.
- (3)
- These distances were calculated from each point in the set C to each point in the set D. The distance of the same point in the corresponding set C would be subtracted in pairs to find the absolute value. The absolute value was accumulated and summed to obtain the point in set C with the smallest sum, and finally, the point was stored in set D.
- (4)
- Step 3 was repeated, and one every m point was collected until the number of points in set D reached the requirement of the number of sampling points:
Figure 9 shows the processing of the data of TLS through the improved Farthest Point Sampling method, where 512, 1024, 2048, 4096, and 8192 points were reserved, respectively. Although the overall contour information of the tree gradually became blurred as the number of points decreased, when the number of points was 512, obvious contours and local features could still be retained. Because the density of the data obtained by UAVLS was relatively sparse, we used the improved farthest point sampling method to sample UAVLS data and retain 512, 1024, and 2048 points, respectively. The sampling effect is shown in Figure 10.
3.3. Network Model Construction
For deep learning model training based on the end-to-end tree species classification of point cloud data, most studies only considered the structural information of a point cloud. However, the attribute information between the point cloud data could be used to distinguish the tree species. The intensity information differed depending on the tree species. Therefore, we proposed the PCTSCN that combined the intensity information of the point cloud as a new feature with its own structure information. The dimension of each input point was changed from three-dimensional to four-dimensional.
The point cloud data of each tree were an unordered collection of vectors, and the order of the points did not affect the tree shape. The disorder of the point cloud data would make it impossible to directly train the point cloud. We expanded the amount of data through various arrangements of point cloud collections. To reduce the loss of geometric point information, a multi-layer perceptron (MLP) was used to extract high-dimensional point features. A symmetric function was used to aggregate the information of each point. The principle of the symmetric function is:
where h stands for high-dimensional mapping, g stands for symmetric function, and γ stands for MLP integration information. The tree point cloud presents a geometric transformation invariance. After a tree point cloud object is rotated by an angle, it still represents the object, but its coordinates change. The T-Net network was introduced to realize the prediction of the affine change matrix, and this change was directly applied to the input point coordinates. The T-Net network structure consisted of point feature extraction, maximum pooling, and fully connected layers. This small neural network generated transformation parameters based on the input data, and the input data were multiplied by the transformation matrix to achieve rotation invariance.
The specific implementation of PCTSCN is shown in Figure 11. After geometric sampling and improved farthest point sampling, the data obtained by TLS retained 512, 1024, 2048, 4096, and 8192 points, respectively. The data obtained by UAVLS retained 512, 1024, and 2048 points, respectively. The reason for the inconsistency in the number of sampling points for the two data storage has been explained in Section 3.2. Each individual tree point cloud retained the intensity information. The dimension of each point was four-dimensional (x, y, z, i), where i represented the reflection intensity. The point cloud of each tree constituted an feature matrix. The individual tree point cloud N obtained by TLS was expressed as 512, 1024, 2048, 4096, and 8192. The N for UAVLS data was expressed as 512, 1024, and 2048. Multiplying the feature matrix formed by each tree point cloud with the matrix generated by the T-Net network produced an alignment matrix. After processing by MLP, each feature point was mapped to a 64-dimensional space. At this time, the PCTSCN used T-Net to generate a matrix again. The next step was to multiply matrix with the mapping matrix to obtain an alignment matrix. The feature points were mapped to N dimensions through MLP again to obtain an feature matrix. The global feature was obtained through the maximum pooling operation, and an global feature matrix was generated. Finally, after another MLP, the softmax function was used to obtain the classification categories of larch and white birch to complete the tree species classification.
4. Results
4.1. Experimental Data Set Production and Environment Construction
The source of the experimental data in this article was described in Section 2. Every tree we collected was measured on the spot. For the data obtained by both TLS and UAVLS, 450 white birch trees and 450 larch trees were selected to form a training dataset sample, a validation dataset sample, and a test dataset. The specific attributes and division ratios of various data samples are shown in Table 3 and Table 4.
4.2. Experimental Result
Our experiment mainly analyzed the impact of sampling point density and the highest feature dimension of the mapping on the performance of PCTSCN. This paper used accuracy, precision, recall, and Kappa coefficient to evaluate the performance of each model.
where TP is the prediction of positive samples as positive, FP is the prediction of negative samples as positive, FN is the prediction of positive samples as negative, TN is the prediction of negative samples as negative, and pe is the sum of the product of the actual sample size and the predicted sample size divided by the square of the total number of samples.
4.2.1. The Impact of Sampling Point Density on PCTSCN Accuracy
The point density of the sample point cloud played an important role in the training of the model. We used the PCTSCN to sample the data obtained by TLS five times, and the data obtained by UAVLS were sampled three times. We conducted model training based on different point densities. The highest dimension of each model mapping was 1024 dimensions.
As can be seen from Table 5, the number of sample points reserved for the individual tree point cloud obtained by the TLS was 512 points and 1024 points, and the models had the same classification results for the tree species of the respective test samples. The accuracy and kappa coefficient of the two trained models were 94% and 0.887, respectively. The precision of larch was 3.5% higher than that of white birch. The model accuracy and kappa coefficient decreased when the number of point densities increased. The accuracy of TLS data dropped by 5% when 2048 points were retained. The accuracy of the model and the kappa coefficient increased when the number of sampling points (greater than 2048 points) continued to increase. However, the increasing trend of model accuracy was not prominent compared with before. It was even lower than the model accuracy when the number of sampling points was 512 points and 1024 points.
For the single tree point cloud data obtained by UAVLS, when the sample point density was 512 points, the trained model accuracy and kappa coefficient were 87% and 0.77, respectively. As the density of sample points increases, the precision, recall, kappa coefficient, and accuracy of the model’s classification of larch and white birch increase. Various accuracy evaluation indicators reached the maximum when the density of sample points was 2048 points. The classification accuracy of tree species was 92%, and the kappa coefficient was 0.852. The accuracy increased by an average of 3% compared to other models. Compared to the model accuracy with the TLS data training, the average model accuracy with the UAVLS data was 2.3% lower.
The computation time of each model is shown in Table 5. As the density of the sample points increased, the number of basic parameters in each single tree point cloud sample was larger. The time required for sampling processing and neural network extraction of single tree point cloud features also increased.
4.2.2. Impact of Mapping the Highest Feature Dimension on PCTSCN Accuracy
Mapping to different highest feature dimensions affected the classification accuracy of the model. With the neural network, we mapped the single tree point cloud data obtained by TLS and UAVLS to the 512, 1024, and 2048 dimensions when the number of sampling points remained the same at 1024.
The classification accuracy of the model trained by the tree point cloud data obtained by TLS decreases with the increase in the highest dimension of mapping in the network (Table 6). With the increase in the highest dimension of mapping in the network, the classification accuracy of the model trained by the tree point cloud data obtained by UAVLS first increased and then decreased. The data obtained by TLS were mapped in the neural network with the highest dimension of 512 dimensions, the classification accuracy of tree species was 96%, and the kappa coefficient was 0.923. These accuracy evaluation indicators were better than other models. Compared to TLS data, the accuracy of UAVLS data mapped to 512 dimensions was lower than 7%. The kappa coefficient of UAVLS data was 0.121 lower than that of TLS. When the highest dimension of the map in the network was 1024 dimensions, compared with 512 dimensions, the classification accuracy of TLS data was reduced by 2%, and the classification accuracy of UAVLS data was increased by 2%. When the data were mapped to 2048 dimensions, the classification accuracy of the model for tree species was 91%, and the kappa coefficient was 0.835. The classification accuracy of the model for UAVLS data tree species was 90%, and the kappa coefficient was 0.818. Compared with the highest dimension of 1024 dimensions, both the TLS and UAVLS data had low tree species classification accuracy evaluation indicators. To summarize the above-mentioned experimental analysis of TLS data, the classification accuracy of tree species decreases with the increase in the highest dimension of the mapping. The tree species classification accuracy of UAVLS data first increases and then decreases with the increase in the highest dimension of the mapping.
Since the highest feature dimension mapped by each model was different, the calculation time of each model was also different. With the continuous improvement of the feature dimension, the number of parameters of the model also continued to increase, which led to the continuous increase in the calculation time of the model (Table 6). When the data obtained by TLS were mapped to a maximum dimension of 2048 dimensions in model training, the model calculation time was 2.8 h. The model training time with tree point cloud data obtained by UAVLS was 2.5 h.
4.2.3. Comparison with Other Deep Learning Models
To verify the reliability of our proposed PCSCN for tree species classification, we compared the accuracy of tree species classification with other deep learning models such as PointNet, PointNet++, VoxNet, and ResNet101. The samples directly trained by the two models of PointNet and PointNet++ were 3D point cloud data. Therefore, we processed the data of the training set to train these two models. Single tree point clouds were converted to voxels (size: ) and images (size: ) for VoxNet and ResNet101 training, respectively. Each model required the same amount of data for training samples (320), verification samples (80), and test samples (50). All models were trained for 100 epochs. The learning rate and batch size of all models were set to 0.001 and 64.
The classification results of each model for white birch and larch are shown in Table 7. The PCTSCN proposed in this paper for the point cloud obtained by TLS had a recognition precision of 95.8% for larch and 92.3% for white birch. The classification accuracy of the two trees was 94%, and the kappa coefficient was 0.887. The kappa coefficient and classification accuracy were higher than for other deep learning models. Compared with PointNet, our model tree species classification accuracy was higher than 5%. This also further showed that the geometric sampling method and the improved farthest sampling method were better than the uniform sampling method at preserving the tree point cloud feature points. After the reflection intensity information was added, the features extracted by the model were more abundant. Compared with PointNet++, the tree species classification accuracy of our proposed method was increased by 2%, and the kappa coefficient was increased by 0.035. This showed that PCTSCN was more suitable for tree species classification. PointNet++ had a higher recognition precision for larch, which was related to the sampling method in the early stage of its neural network. Because the outline of larch is more typical, the advantage of PointNet++ lay in its early sampling method, which could retain more characteristic information for network extraction. ResNet101 has a powerful and complex neural network with many layers. Therefore, ResNet101 performs well in all models, and the recognition precision of larch can be as high as 95.7%. The classification accuracy of tree species also reaches 92%, with a kappa coefficient of 0.852. Although the classification accuracy of ResNet101 tree species was high, the single tree samples used for model training need to be converted data type. For misclassified samples, several types of deep learning models had the same samples. These samples all had a similar appearance and structure to other tree species. ResNet101 classified tree species from the image projected by the point cloud and did not use the attribute characteristics of the individual tree point cloud. Only relying on the contour features to classify tree species, so classification errors would occur. In addition, the point cloud data conversion process had the problem of data information loss, which was also an important factor that affected the classification of tree species. After these conversions, the computation time of the computer was increased, and the characteristics of the data conversion process were lost. The classification accuracy of VoxNet tree species was low compared with other deep learning models. There were two main reasons. First, VoxNet was more concise compared with other neural network models. VoxNet was inferior to other models in feature extraction capabilities, resulting in less rich feature information. Additionally, the training samples of VoxNet were 3D voxel data. The point cloud feature information was severely lost during the conversion process and resulted in making the network unable to extract more features. The same tree species have different growth periods (sapling trees and mature trees), and differences in structural characteristics will also identify the same tree as different tree species [21].
The average classification accuracy of the model trained on the data obtained by UAVLS was 4.4% lower than that of the model trained with TLS data. The UAVLS obtained point cloud data from top to bottom, and the data obtained by the UAVLS were mainly the upper part of the tree. There were occlusions between the trees, so the outline scan of each tree was far less detailed than the TLS. We propose the PCTSCN to fully extract the structural features and attribute features of a tree point cloud for tree species classification. Compared with other deep learning models, PCTSCN is more suitable for forest tree species classification.
5. Discussion
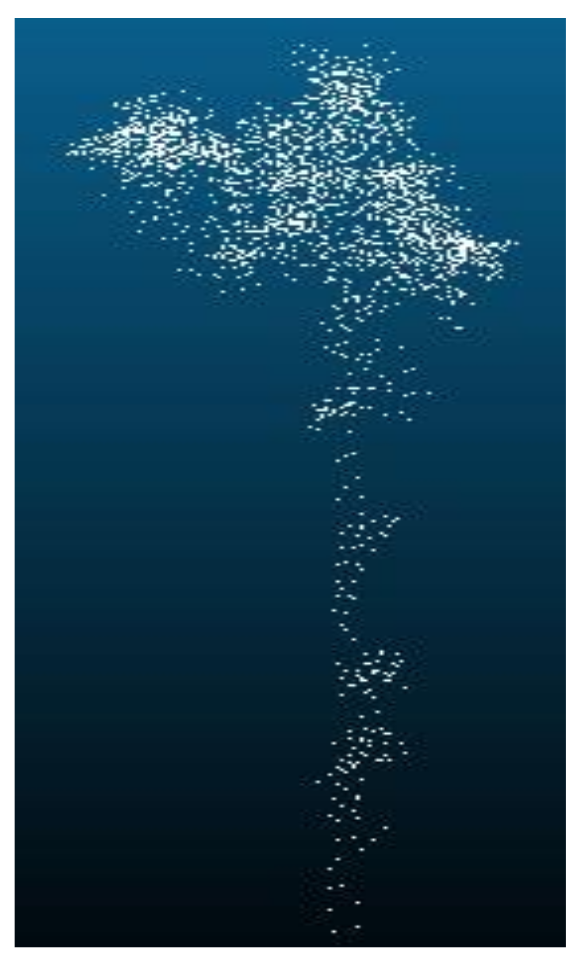
The point density had a greater accuracy impact on the tree species classification model. For the data obtained by TLS, when the point density was 512 points and 1024 points, the classification accuracy of the model tree species was higher than for other models trained with higher point density. Because the point density was too large, the extracted information was redundant, resulting in low model classification accuracy. The point density was too large to increase the number of parameters, resulting in slow model training convergence, which, in turn, affected the test accuracy of the model. The sample point density of the training model was 512 points and 1024 points, and the classification accuracy of the model tree species that were trained was the same. The misclassified samples of the two models were also the same. The misclassified samples of other models included their misclassified samples. In addition to the problems of the model, classification errors occurred when tree species of different species had similar structural characteristics (e.g., Figure 12a, showing larches recognized as white birches, and Figure 12b, with white birches mistaken for larches). For the data obtained by UAVLS, the classification accuracy of the model tree species continued to improve with the increase in the point density. As shown in Figure 13, the point cloud data at the bottom of the tree could not be obtained by UAVLS due to the occlusion between trees, so the overall contour information of the single tree was missing. Similar appearance features and structures between different tree species could also cause classification errors. Due to the large difference in point density, the time required for each model training varies greatly. As the density of points increases with the model, training time continues to increase, which was due to the obvious increase in the amount of parameter calculation in the neural network.
We mapped the various highest feature dimensions in the network of the individual tree point cloud training sample data acquired by two LiDAR instruments. For the TLS data, the highest accuracy was obtained when the highest feature of the mapping was 512-dimensional. The classification accuracy of the model decreased with increasing dimensionality. The reason for our analysis was that the information feature structure of single tree data obtained by TLS was complete. Higher dimensionality caused more redundant information, which resulted in the overfitting of the training model. In addition, the number of model parameters increased with increasing the highest dimensionality. When the training epochs were the same, it was difficult for the high-dimensional model to converge. For the data obtained by UAVLS, the accuracy of the tree species classification model fluctuated with mapping the highest feature dimension in the neural network increases. The reason was that the structural information of single tree data obtained by UAVLS was insufficient. When the highest dimension was low, the characteristics of different tree species could not be fully extracted. When mapping, the highest dimension was 2048 dimensions, the model classification accuracy decreased. This was because the dimensionality was high, and the extracted feature information was redundant. Another reason was that the increase in the number of parameters was difficult for the model to converge. Therefore, appropriately increasing the feature extraction dimension can improve the model classification accuracy.
In the experimental analysis, we found that seasonal changes had a great impact on the overall outline of broad-leaved forest trees. After the deciduous period of the white birch tree, the branches and leaves of the tree fell off. The appearance and structure of trees in this period were significantly different from those in the growth period [39,40]. Larch is a conifer, and its branches and leaves are hardly affected by seasonality [41,42]. At present, some scholars used the method of branch and leaf separation to extract branches and stems following two types of approaches. The first type is to extract branches and trunks based on different reflection intensity information and point density of branches and leaves [43,44]. The information extracted by this method was incomplete. The second category is to label the branch and leaf points and use deep learning or machine learning to extract the branches. This type of method requires a lot of work to label samples in the early stage [28,45,46]. We recommend extracting some single trees separated from branches and leaves from broad-leaved forests and merging them with the complete single trees as training samples. The completeness of the single tree division directly determines the outline of the tree. In forest areas with complex terrain and environment, the UAVLS data were restricted, resulting in sparse point density. It was difficult to ensure that the individual tree after the split was absolutely complete. The sparsity of data affects the classification accuracy of the tree species [26]. In addition, the parameter settings in the model affect the accuracy of the model, such as the learning rate and batch size [47]. The loss function does not drop or oscillate widely when the learning rate is large. The loss gradient drops slowly when the learning rate is small, which makes the model unable to converge [48,49]. The batch size should be set according to the total amount of data. When the batch size is small, the model has difficulty converging. If the total amount of data is small, all samples could be used as a batch size [50,51].
6. Conclusions
This paper proposed PCTSCN based on deep learning, which solved the problem that 3D tree point cloud data were difficult to directly train as a sample to obtain a deep learning model. This method could directly train point cloud data samples to derive the model. PCTSCN did not need to convert the point cloud data into other types of data and avoided the problem of feature loss in the data conversion process. Firstly, PCTSCN performed geometric sampling processing on the data to extract local feature points and then used the improved farthest point sampling method for sub-sampling to retain the global features. Secondly, PCTSCN used neural networks to extract spatial feature information and reflection intensity information from the training samples processed in the previous step. Finally, PCTSCN mapped the extracted spatial features and attribute features to a high-dimensional space and then performed feature extraction to train the tree species classification model to complete the tree species identification. To verify the applicability of the method proposed in this paper, PCTSCN was used to classify the tree species of data obtained by both TLS and UAVLS. In the same experimental environment, the accuracy of the tree species classification model trained with the data obtained by TLS was higher than that of the model trained with the data obtained by UAVLS. The classification accuracy of PCTSCN tree species reached up to 96%, and the kappa coefficient was 0.923. After adding the intensity information to the features extracted by the neural network, PCTSCN improved the classification accuracy of tree species by 2–6% compared with other 3D deep learning models. The PCTSCN proposed in this paper provides a new method for tree species classification of forest LiDAR data. In the future, we will extend this research to the classification of multiple tree species from point cloud data.
Author Contributions
Conceptualization, Y.C. and J.C.; methodology, J.C.; software, J.C.; validation, J.C.; formal analysis, Y.C.; investigation, J.C and Z.L.; resources, Z.L.; data curation, J.C.; writing—original draft preparation, J.C.; writing—review and editing, J.C. and Y.C; visualization, J.C.; supervision, J.C.; project administration, Z.L. and Y.C.; funding acquisition, Z.L. and Y.C. All authors have read and agreed to the published version of the manuscript.
Funding
This research was funded by the National Natural Science Foundation of China (41730107); the National Key Research and Development Program of China (2018YFB0504504); the Funded Project of Fundamental Scientific Research Business Expenses of the Chinese Academy of Surveying and Mapping (AR2104; AR2001; AR1920); and LZJTU EP (grant no. 201806).
Acknowledgments
The authors would like to thank Beijing Normal University and North China Electric Power University for providing research data.
Conflicts of Interest
The authors declare no conflict of interest.
References
- Dalponte, M.; Bruzzone, L.; Gianelle, D. Tree species classification in the Southern Alps based on the fusion of very high geometrical resolution multispectral/hyperspectral images and LiDAR data. Remote Sens. Environ. 2012, 123, 258–270. [Google Scholar] [CrossRef]
- Plourde, L.C.; Ollinger, S.V.; Smith, M.L.; Martin, M.E. Estimating species abundance in a northern temperate forest using spectral mixture analysis. Photogramm. Eng. Remote Sens. 2007, 73, 829–840. [Google Scholar] [CrossRef] [Green Version]
- Heinzel, J.; Koch, B. Investigating multiple data sources for tree species classification in temperate forest and use for single tree delineation. Int. J. Appl. Earth Obs. Geoinf. 2012, 18, 101–110. [Google Scholar] [CrossRef]
- Asner, G.P.; Martin, R.E. Airborne spectranomics: Mapping canopy chemical and taxonomic diversity in tropical forests. Front. Ecol. Environ. 2009, 7, 269–276. [Google Scholar] [CrossRef] [Green Version]
- Brosofske, K.D.; Froese, R.E.; Falkowski, M.J.; Banskota, A. A review of methods for mapping and prediction of inventory attributes for operational forest management. Forest Sci. 2014, 60, 733–756. [Google Scholar] [CrossRef]
- Schimel, D.S.; Asner, G.P.; Moorcroft, P. Observing changing ecological diversity in the Anthropocene. Front. Ecol. Environ. 2013, 11, 129–137. [Google Scholar] [CrossRef] [Green Version]
- Cao, L.; Coops, N.C.; Innes, J.L.; Dai, J.; Ruan, H.; She, G. Tree species classification in subtropical forests using small-footprint full-waveform LiDAR data. Int. J. Appl. Earth Obs. Geoinf. 2016, 49, 39–51. [Google Scholar] [CrossRef]
- Kukkonen, M.; Maltamo, M.; Korhonen, L.; Packalen, P. Multispectral airborne LiDAR data in the prediction of boreal tree species composition. IEEE Trans. Geosci. Remote Sens. 2019, 57, 3462–3471. [Google Scholar] [CrossRef]
- Krizhevsky, A.; Sutskever, I.; Hinton, G.E. Imagenet classification with deep convolutional neural networks. Adv. Neural Inf. Process. Syst. 2012, 25, 1097–1105. Available online: https://proceedings.neurips.cc/paper/2012/file/c399862d3b9d6b76c8436e924a68c45b-Paper.pdf (accessed on 30 July 2020). [CrossRef]
- Zhang, J.; Lin, X. Advances in fusion of optical imagery and LiDAR point cloud applied to photogrammetry and remote sensing. Int. J. Image Data Fusion 2017, 8, 1–31. [Google Scholar] [CrossRef]
- Pajić, V.; Govedarica, M.; Amović, M. Model of point cloud data management system in big data paradigm. ISPRS Int. J. Geo-Inf. 2018, 7, 265. [Google Scholar] [CrossRef] [Green Version]
- Su, H.; Maji, S.; Kalogerakis, E.; Learned-Miller, E. Multi-view convolutional neural networks for 3d shape recognition. In Proceedings of the IEEE International Conference on Computer Vision, Santiago, Chile, 7–13 December 2015; pp. 945–953. Available online: https://www.cv-foundation.org/openaccess/content_iccv_2015/html/Su_Multi-View_Convolutional_Neural_ICCV_2015_paper.html (accessed on 20 August 2020).
- Feng, Y.; Zhang, Z.; Zhao, X.; Ji, R.; Gao, Y. Gvcnn: Group-view convolutional neural networks for 3d shape recognition. In Proceedings of the IEEE Conference on Computer Vision and Pattern Recognition, Salt Lake City, UT, USA, 18–23 June 2018; pp. 264–272. Available online: https://openaccess.thecvf.com/content_cvpr_2018/html/Feng_GVCNN_Group-View_Convolutional_CVPR_2018_paper.html (accessed on 16 September 2020).
- Yu, T.; Meng, J.; Yuan, J. Multi-view harmonized bilinear network for 3d object recognition. In Proceedings of the IEEE Conference on Computer Vision and Pattern Recognition, Salt Lake City, UT, USA, 18–23 June 2018; pp. 186–194. Available online: https://openaccess.thecvf.com/content_cvpr_2018/html/Yu_Multi-View_Harmonized_Bilinear_CVPR_2018_paper.html (accessed on 28 September 2020).
- Wang, L.; Huang, Y.; Shan, J.; He, L. MSNet: Multi-scale convolutional network for point cloud classification. Remote Sens. 2018, 10, 612. [Google Scholar] [CrossRef] [Green Version]
- Maturana, D.; Scherer, S. Voxnet: A 3d convolutional neural network for real-time object recognition. In Proceedings of the 2015 IEEE/RSJ International Conference on Intelligent Robots and Systems (IROS), Hamburg, Germany, 28 September–2 October 2015; pp. 922–928. [Google Scholar] [CrossRef]
- Wu, Z.; Song, S.; Khosla, A.; Yu, F.; Zhang, L.; Tang, X.; Xiao, J. 3d shapenets: A deep representation for volumetric shapes. In Proceedings of the IEEE Conference on Computer Vision and Pattern Recognition, Boston, MA, USA, 7–12 June 2015; pp. 1912–1920. Available online: https://www.cv-foundation.org/openaccess/content_cvpr_2015/html/Wu_3D_ShapeNets_A_2015_CVPR_paper.html (accessed on 27 August 2020).
- Qi, C.R.; Yi, L.; Su, H.; Guibas, L.J. Pointnet++: Deep hierarchical feature learning on point sets in a metric space. arXiv 2017, arXiv:1706.02413. [Google Scholar]
- Jiang, M.; Wu, Y.; Zhao, T.; Zhao, Z.; Lu, C. Pointsift: A sift-like network module for 3d point cloud semantic segmentation. arXiv 2018, arXiv:1807.00652. [Google Scholar]
- Li, Y.; Bu, R.; Sun, M.; Wu, W.; Di, X.; Chen, B. Pointcnn: Convolution on x-transformed points. Adv. Neural Inf. Process. Syst. 2018, 31, 820–830. Available online: https://proceedings.neurips.cc/paper/2018/file/f5f8590cd58a54e94377e6ae2eded4d9-Paper.pdf (accessed on 3 August 2020).
- Seidel, D.; Annighöfer, P.; Thielman, A.; Seifert, Q.E.; Thauer, J.H.; Glatthorn, J.; Ehbrecht, M.; Kneib, T.; Ammer, C. Predicting Tree Species from 3D Laser Scanning Point Clouds Using Deep Learning. Front. Plant Sci. 2021, 12, 141. [Google Scholar] [CrossRef] [PubMed]
- Hamraz, H.; Jacobs, N.B.; Contreras, M.A.; Clark, C.H. Deep learning for conifer/deciduous classification of airborne LiDAR 3D point clouds representing individual trees. ISPRS J. Photogramm. 2019, 158, 219–230. [Google Scholar] [CrossRef] [Green Version]
- Mizoguchi, T.; Ishii, A.; Nakamura, H.; Inoue, T.; Takamatsu, H. Lidar-based individual tree species classification using convolutional neural network. In Proceedings of the SPIE Conference on Videometrics, Range Imaging, and Applications XIV, Munich, Germany, 25–29 June 2017; Volume 10332, p. 103320O. [Google Scholar] [CrossRef]
- Guan, H.; Yu, Y.; Ji, Z.; Li, J.; Zhang, Q. Deep learning-based tree classification using mobile LiDAR data. Remote Sens. Lett. 2015, 6, 864–873. [Google Scholar] [CrossRef]
- Zou, X.; Cheng, M.; Wang, C.; Xia, Y.; Li, J. Tree classification in complex forest point clouds based on deep learning. IEEE Geosci. Remote Sens. Lett. 2017, 14, 2360–2364. [Google Scholar] [CrossRef]
- Liu, M.; Han, Z.; Chen, Y.; Liu, Z.; Han, Y. Tree Species Classification of LiDAR Data based on 3D Deep Learning. Measurement 2021, 109301. [Google Scholar] [CrossRef]
- Briechle, S.; Krzystek, P.; Vosselman, G. Semantic Labeling of Als Point Clouds for Tree Species Mapping Using the Deep Neural Network Pointnet++. Int. Arch. Photogramm. Remote Sens. Spat. Inf. Sci. 2019. [Google Scholar] [CrossRef] [Green Version]
- Xi, Z.; Hopkinson, C.; Rood, S.B.; Peddle, D.R. See the forest and the trees: Effective machine and deep learning algorithms for wood filtering and tree species classification from terrestrial laser scanning. ISPRS J. Photogramm. 2020, 168, 1–16. [Google Scholar] [CrossRef]
- Rusu, R.B.; Cousins, S. 3d is here: Point cloud library (pcl). In Proceedings of the 2011 IEEE International Conference on Robotics and Automation, Shanghai, China, 9–13 May 2011; pp. 1–4. [Google Scholar] [CrossRef] [Green Version]
- Girardeau-Montaut, D. Cloudcompare-open source project. OpenSource Project. 2011. Available online: http://www.cloudcompare.org/ (accessed on 26 September 2020).
- Zhang, W.; Qi, J.; Wan, P.; Wang, H.; Xie, D.; Wang, X.; Yan, G. An Easy-to-Use Airborne LiDAR Data Filtering Method Based on Cloth Simulation. Remote Sens. 2016, 8, 501. [Google Scholar] [CrossRef]
- Axelsson, P. DEM generation from laser scanner data using adaptive TIN models. Int. Arch. Photogramm. Remote Sens. 2000, 33, 110–117. [Google Scholar]
- Xiao, W.; Zaforemska, A.; Smigaj, M.; Wang, Y.; Gaulton, R. Mean shift segmentation assessment for individual forest tree delineation from airborne lidar data. Remote Sens. 2019, 11, 1263. [Google Scholar] [CrossRef] [Green Version]
- Picos, J.; Bastos, G.; Míguez, D.; Alonso, L.; Armesto, J. Individual tree detection in a eucalyptus plantation using unmanned aerial vehicle (UAV)-LiDAR. Remote Sens. 2020, 12, 885. [Google Scholar] [CrossRef] [Green Version]
- Mu, Y.; Zhou, G.; Wang, H. Canopy LIDAR Point Cloud Data K-Means Clustering Watershed Segmentation Method. ISPRS Ann. Photogramm. Remote Sens. Spat. Inf. Sci. 2020, 6, 67–73. [Google Scholar] [CrossRef]
- Yan, W.; Guan, H.; Cao, L.; Yu, Y.; Gao, S.; Lu, J. An automated hierarchical approach for three-dimensional segmentation of single trees using UAV LiDAR data. Remote Sens. 2018, 10, 1999. [Google Scholar] [CrossRef] [Green Version]
- Li, W.; Guo, Q.; Jakubowski, M.K.; Kelly, M. A new method for segmenting individual trees from the lidar point cloud. Photogramm. Eng. Remote Sens. 2012, 78, 75–84. [Google Scholar] [CrossRef] [Green Version]
- Burt, A.; Disney, M.; Calders, K. Extracting individual trees from lidar point clouds using treeseg. Methods Ecol. Evol. 2019, 10, 438–445. [Google Scholar] [CrossRef] [Green Version]
- Zyryanova, O.A.; Terazawa, M.; Koike, T.; Zyryanov, V.I. White birch trees as resource species of Russia: Their distribution, ecophysiological features, multiple utilizations. Eurasian J. For. Res. 2010, 13, 25–40. Available online: https://eprints.lib.hokudai.ac.jp/dspace/handle/2115/43853 (accessed on 2 June 2021).
- Miller, R.O.; Bloese, P.D.; Hanover, J.W.; Haack, R.A. Paper birch and European white birch vary in growth and resistance to bronze birch borer. J. Am. Soc. Hortic. Sci. 1991, 116, 580–584. [Google Scholar] [CrossRef]
- Montpellier, E.E.; Soulé, P.T.; Knapp, P.A.; Shelly, J.S. Divergent growth rates of alpine larch trees (Larix lyallii Parl.) in response to microenvironmental variability. Arct. Antarct. Alp. Res. 2018, 50, e1415626. [Google Scholar] [CrossRef] [Green Version]
- Tei, S.; Sugimoto, A.; Yonenobu, H.; Ohta, T.; Maximov, T.C. Growth and physiological responses of larch trees to climate changes deduced from tree-ring widths and δ13C at two forest sites in eastern Siberia. Polar Sci. 2014, 8, 183–195. [Google Scholar] [CrossRef] [Green Version]
- Hackenberg, J.; Wassenberg, M.; Spiecker, H.; Sun, D. Non destructive method for biomass prediction combining TLS derived tree volume and wood density. Forests 2015, 6, 1274–1300. [Google Scholar] [CrossRef]
- Ferrara, R.; Virdis, S.G.P.; Ventura, A.; Ghisu, T.; Duce, P.; Pellizzaro, G. An automated approach for wood-leaf separation from terrestrial LIDAR point clouds using the density based clustering algorithm DBSCAN. Agric. For. Meteorol. 2018, 262, 434–444. [Google Scholar] [CrossRef]
- Xi, Z.; Hopkinson, C.; Chasmer, L. Filtering stems and branches from terrestrial laser scanning point clouds using deep 3-D fully convolutional networks. Remote Sens. 2018, 10, 1215. [Google Scholar] [CrossRef] [Green Version]
- Zhu, X.; Skidmore, A.K.; Darvishzadeh, R.; Niemann, K.O.; Liu, J.; Shi, Y.; Wang, T. Foliar and woody materials discriminated using terrestrial LiDAR in a mixed natural forest. Int. J. Appl. Earth Obs. Geoinf. 2018, 64, 43–50. [Google Scholar] [CrossRef]
- Smith, L.N. A disciplined approach to neural network hyper-parameters: Part 1—Learning rate, batch size, momentum, and weight decay. arXiv 2018, arXiv:1803.09820. [Google Scholar]
- Li, Z.; Arora, S. An exponential learning rate schedule for deep learning. arXiv 2019, arXiv:1910.07454. [Google Scholar]
- Chandra, B.; Sharma, R.K. Deep learning with adaptive learning rate using laplacian score. Expert Syst. Appl. 2016, 63, 1–7. [Google Scholar] [CrossRef]
- Smith, S.L.; Kindermans, P.J.; Ying, C.; Le, Q.V. Don’t decay the learning rate, increase the batch size. arXiv 2017, arXiv:1711.00489. [Google Scholar]
- He, F.; Liu, T.; Tao, D. Control batch size and learning rate to generalize well: Theoretical and empirical evidence. Adv. Neural Inf. Process. Syst. 2019, 32, 1143–1152. Available online: https://proceedings.neurips.cc/paper/2019/hash/dc6a70712a252123c40d2adba6a11d84-Abstract.html (accessed on 3 June 2021).
Figure 1.
The location map of the study area.
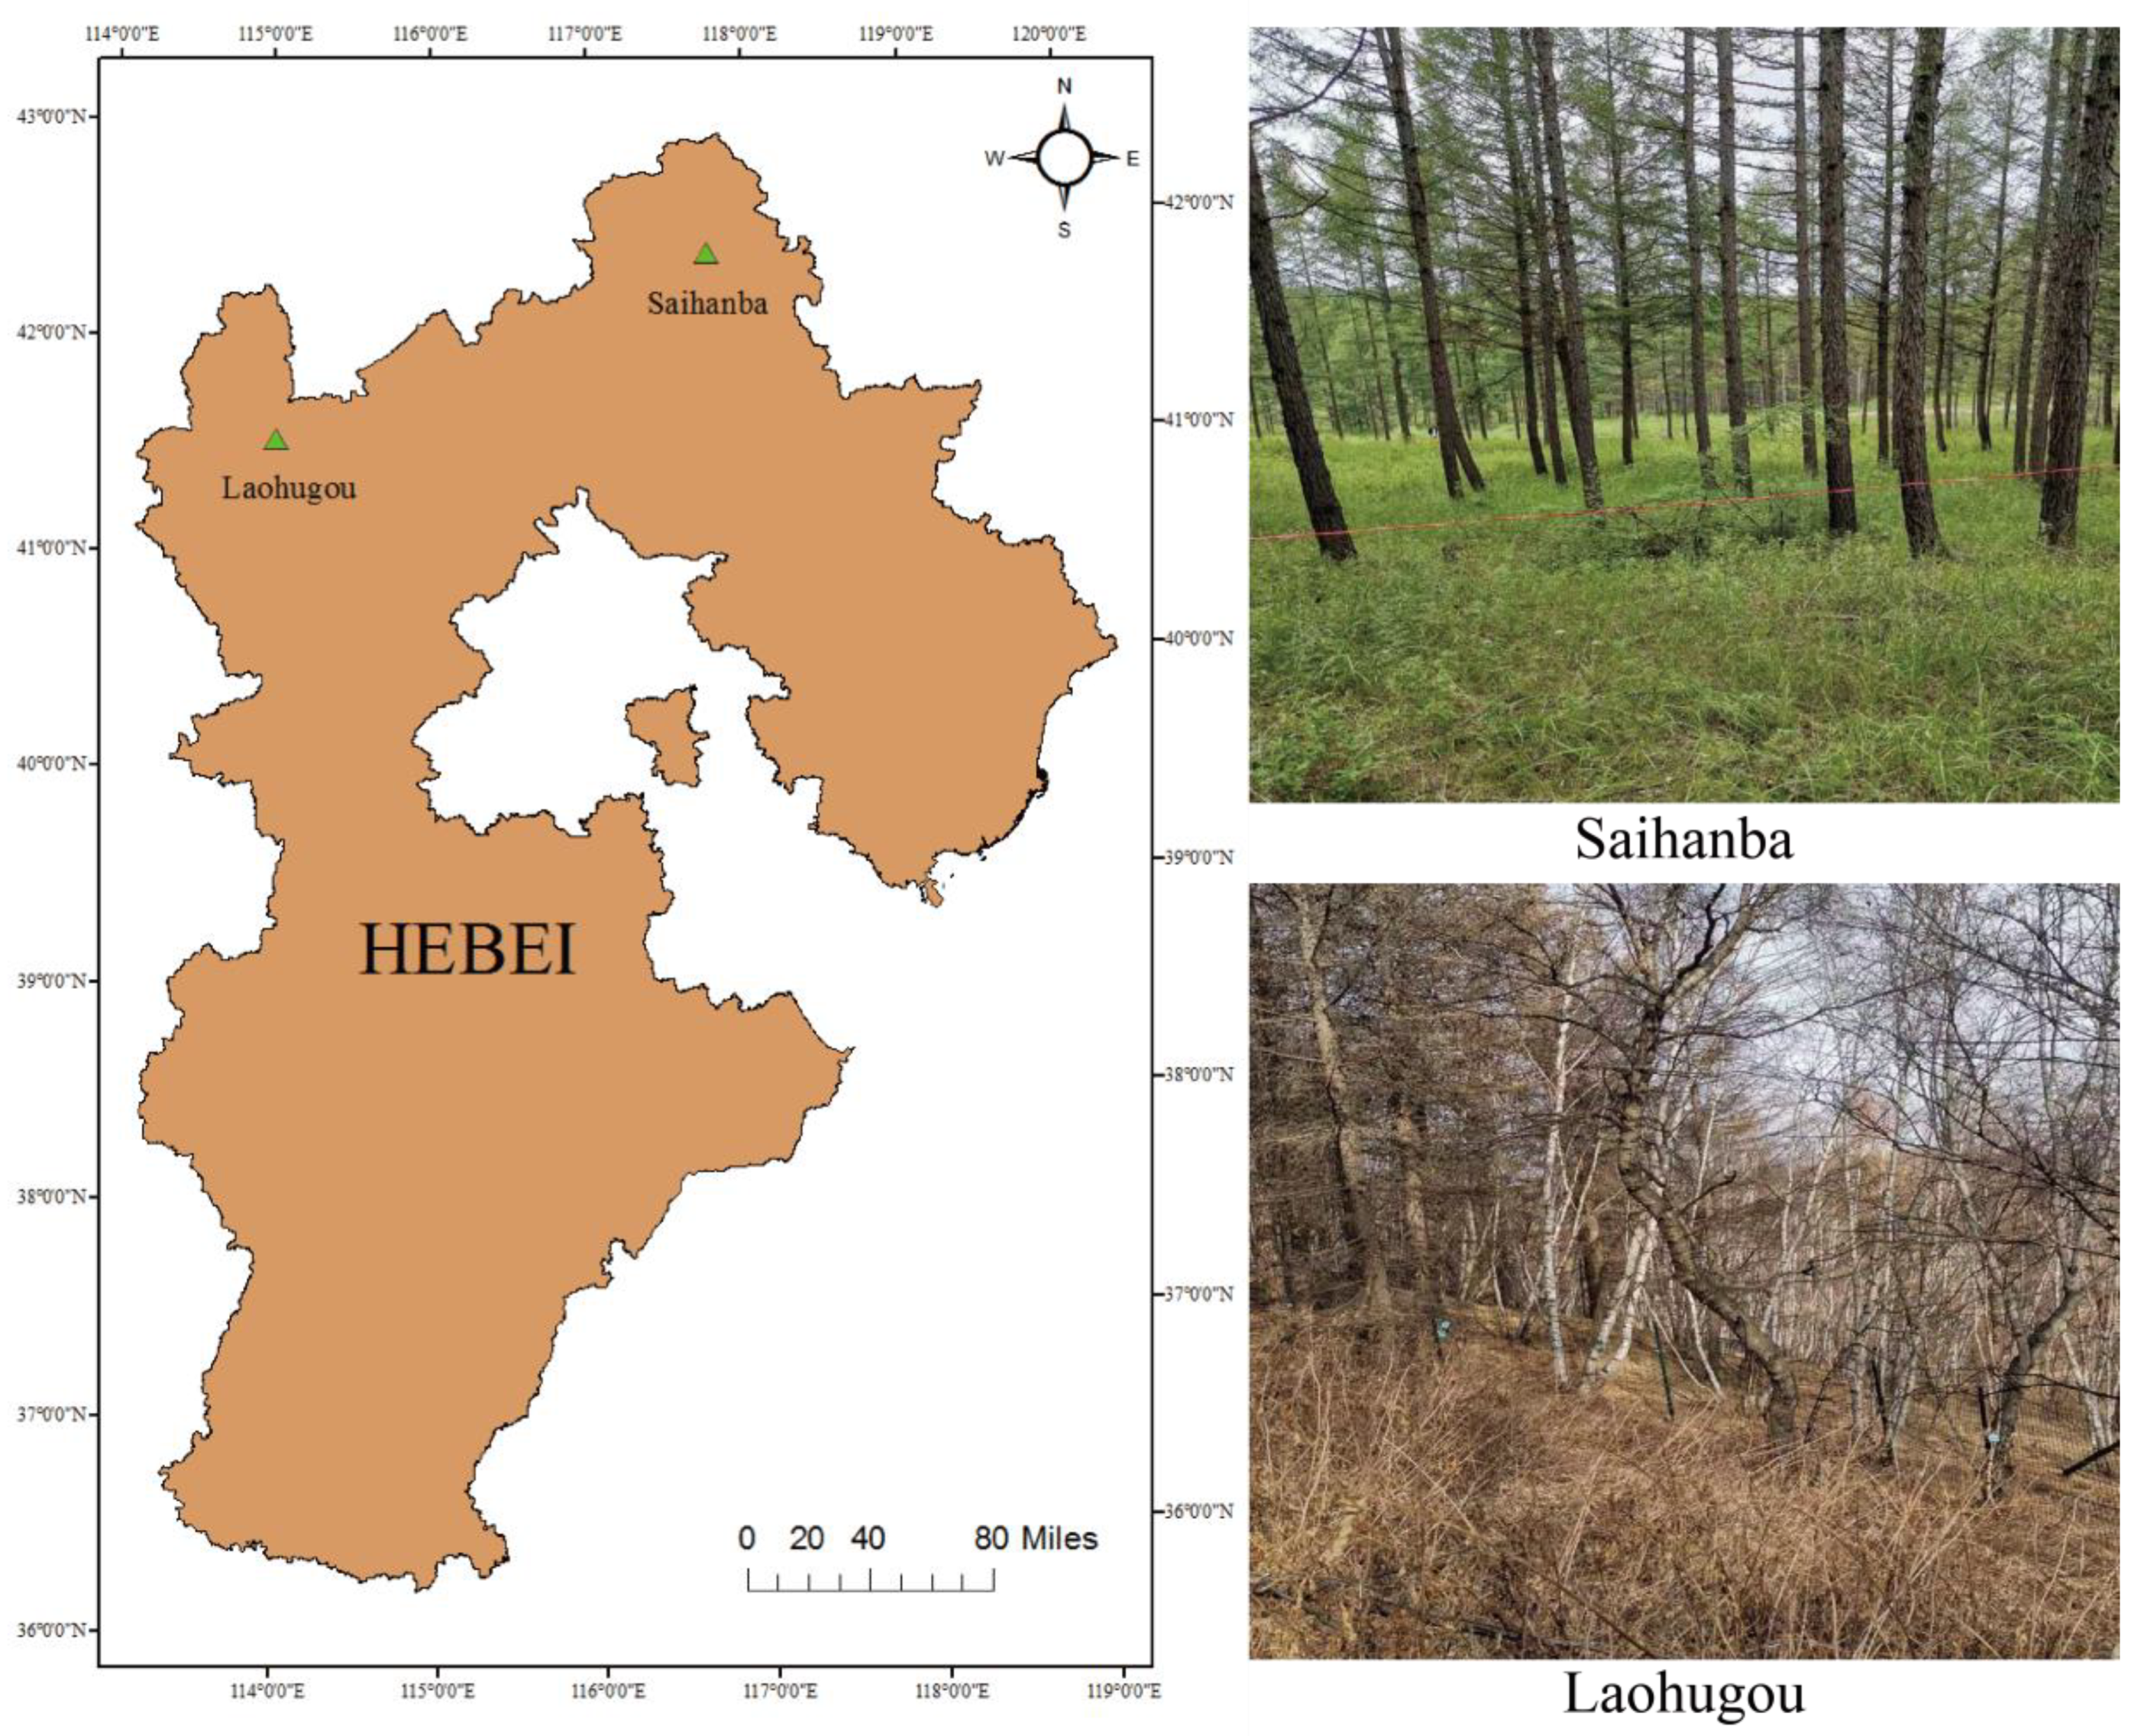
Figure 2.
Distribution of scan stations: (a) the Saihanba forest area; (b) the Laohugou forest area.
Figure 2.
Distribution of scan stations: (a) the Saihanba forest area; (b) the Laohugou forest area.
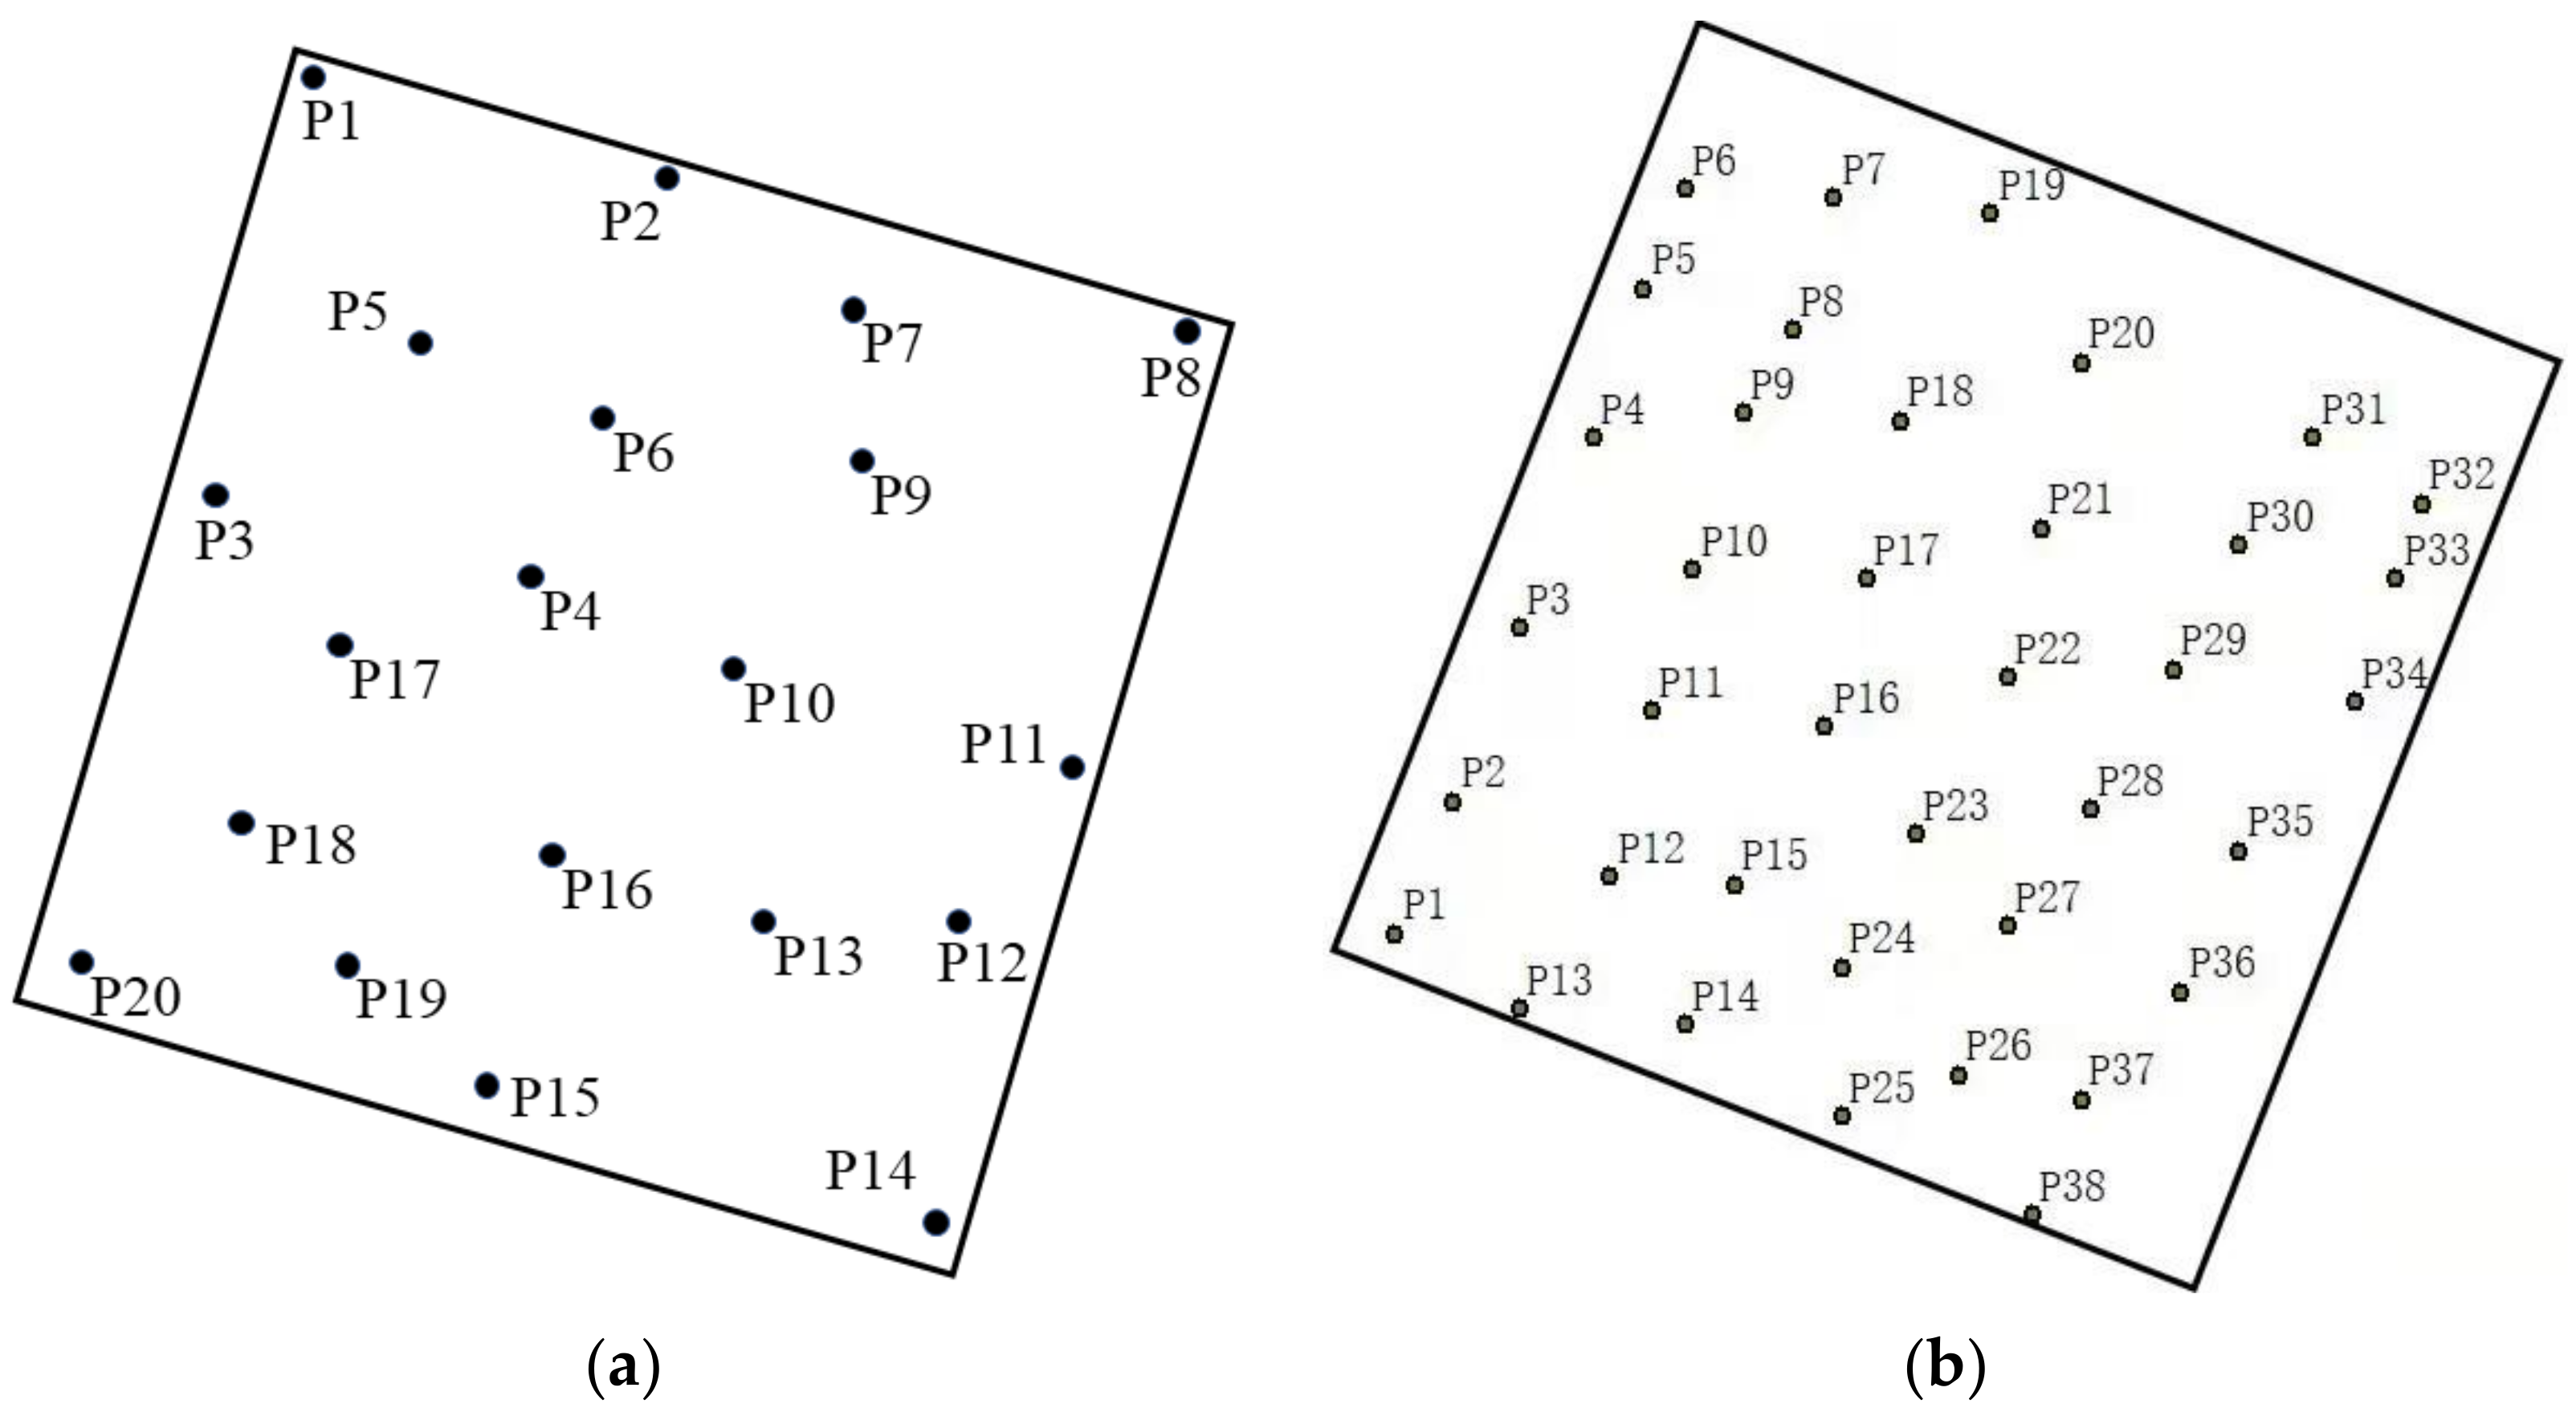
Figure 3.
Point cloud data processing flow chart.
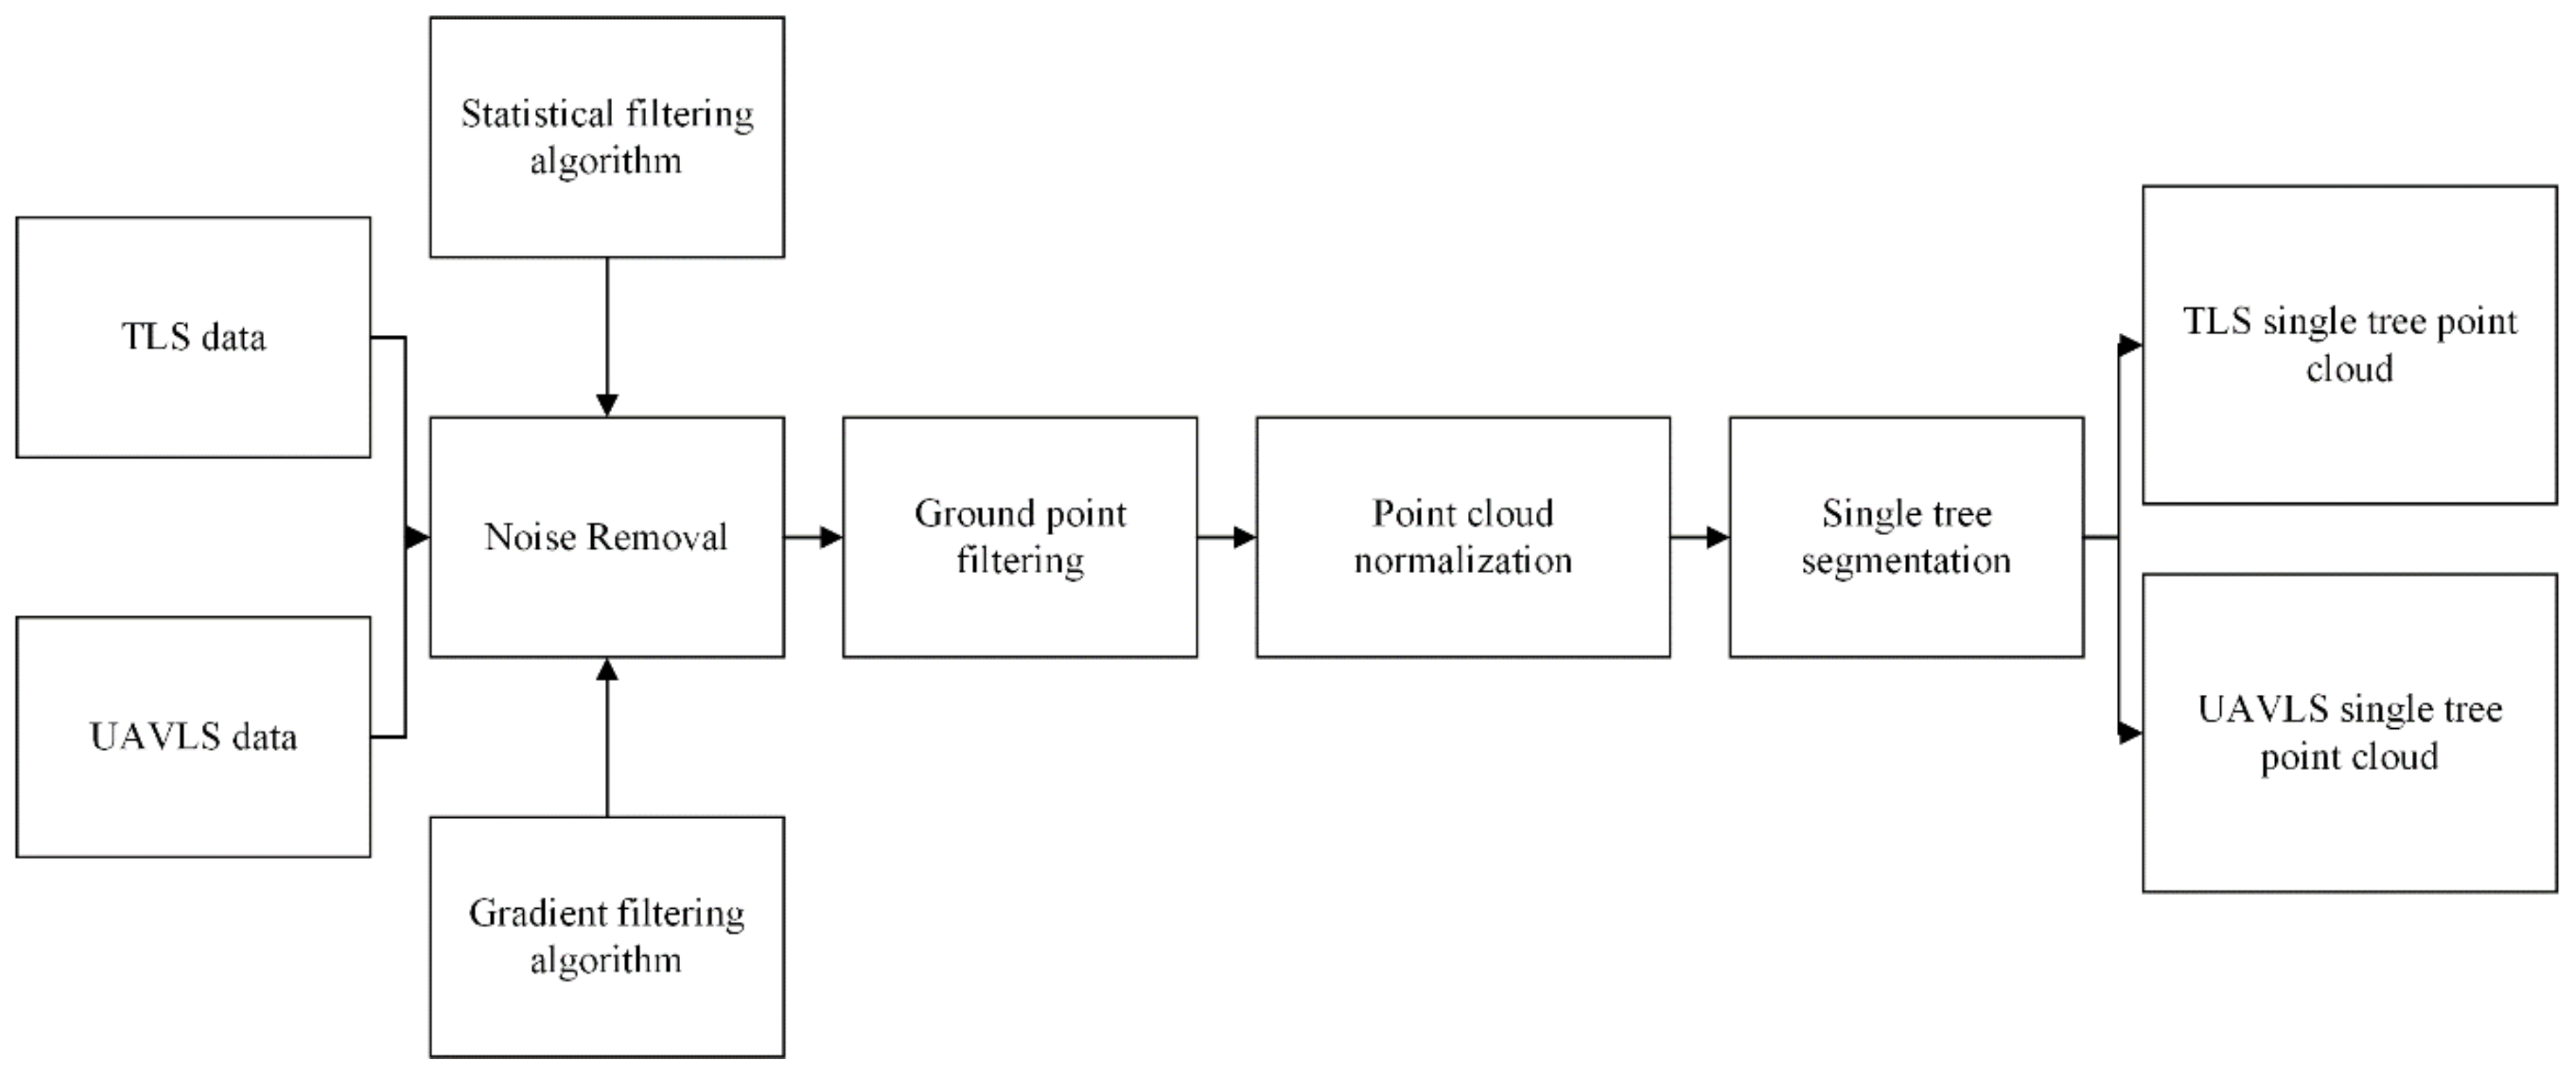
Figure 4.
(a) Point cloud original data; (b) Data after removing noise points; (c) Ground point separation; (d) After normalization of point cloud data.
Figure 4.
(a) Point cloud original data; (b) Data after removing noise points; (c) Ground point separation; (d) After normalization of point cloud data.
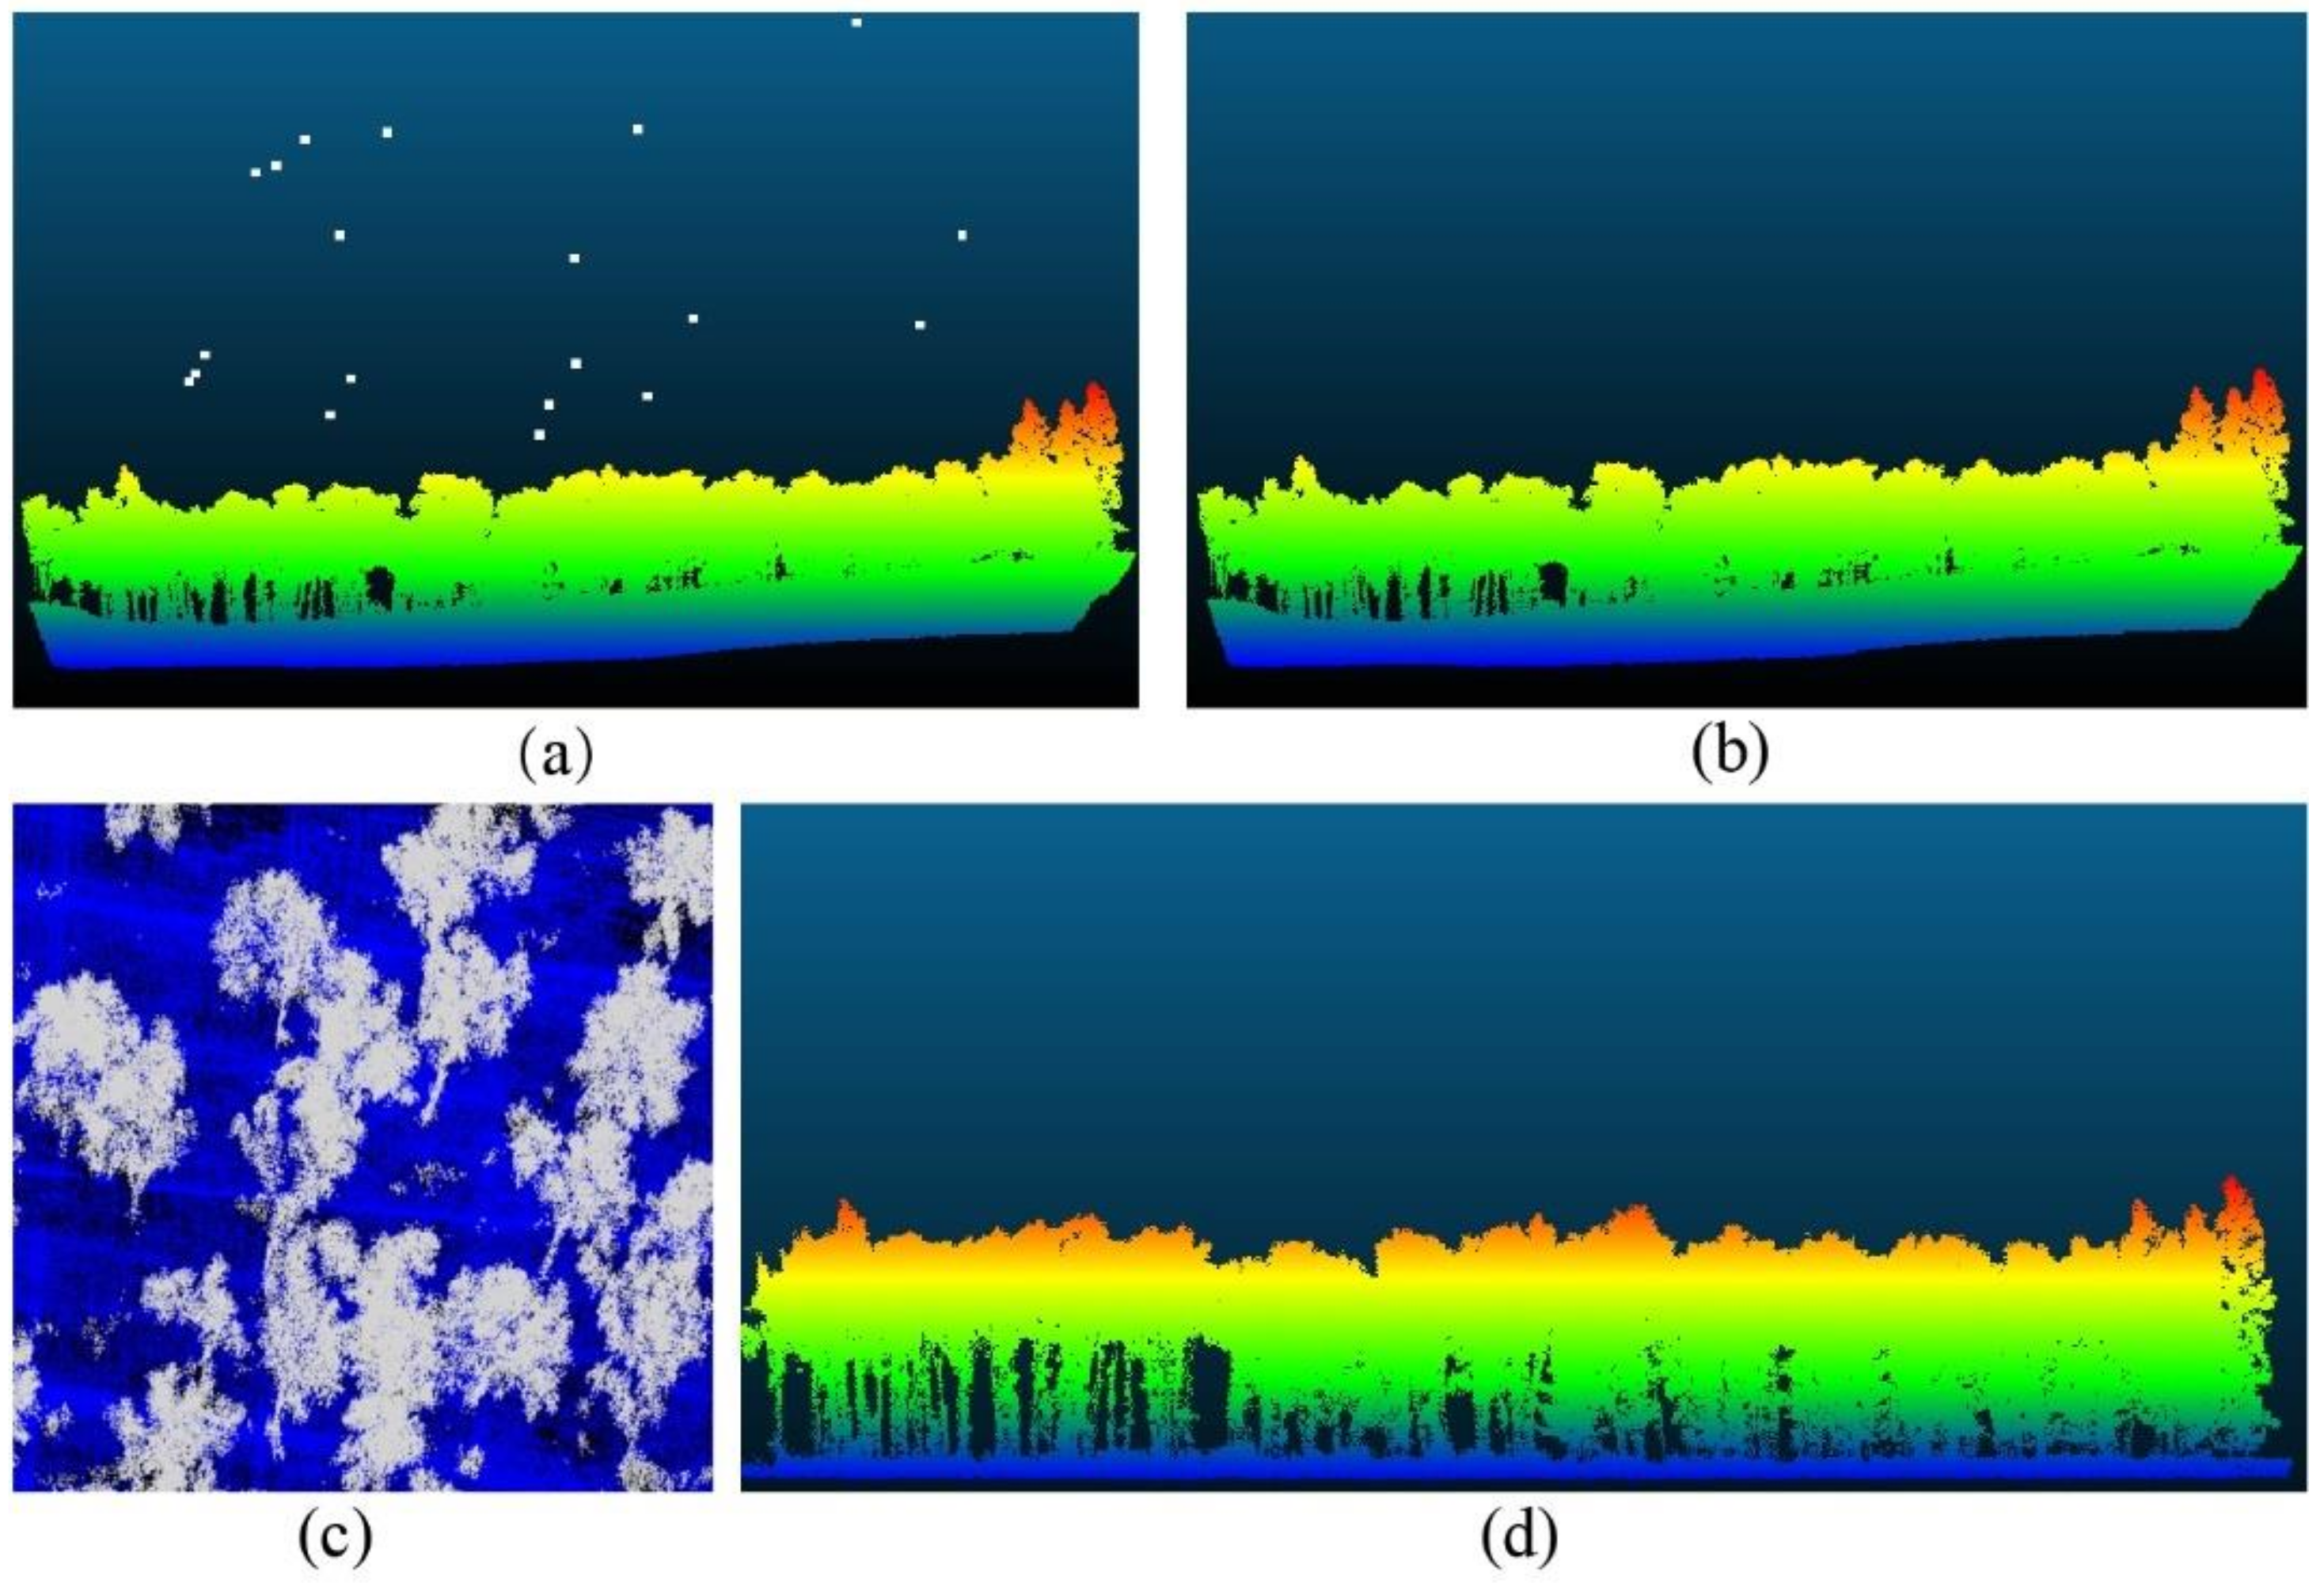
Figure 5.
Schematic diagram of single tree segmentation.
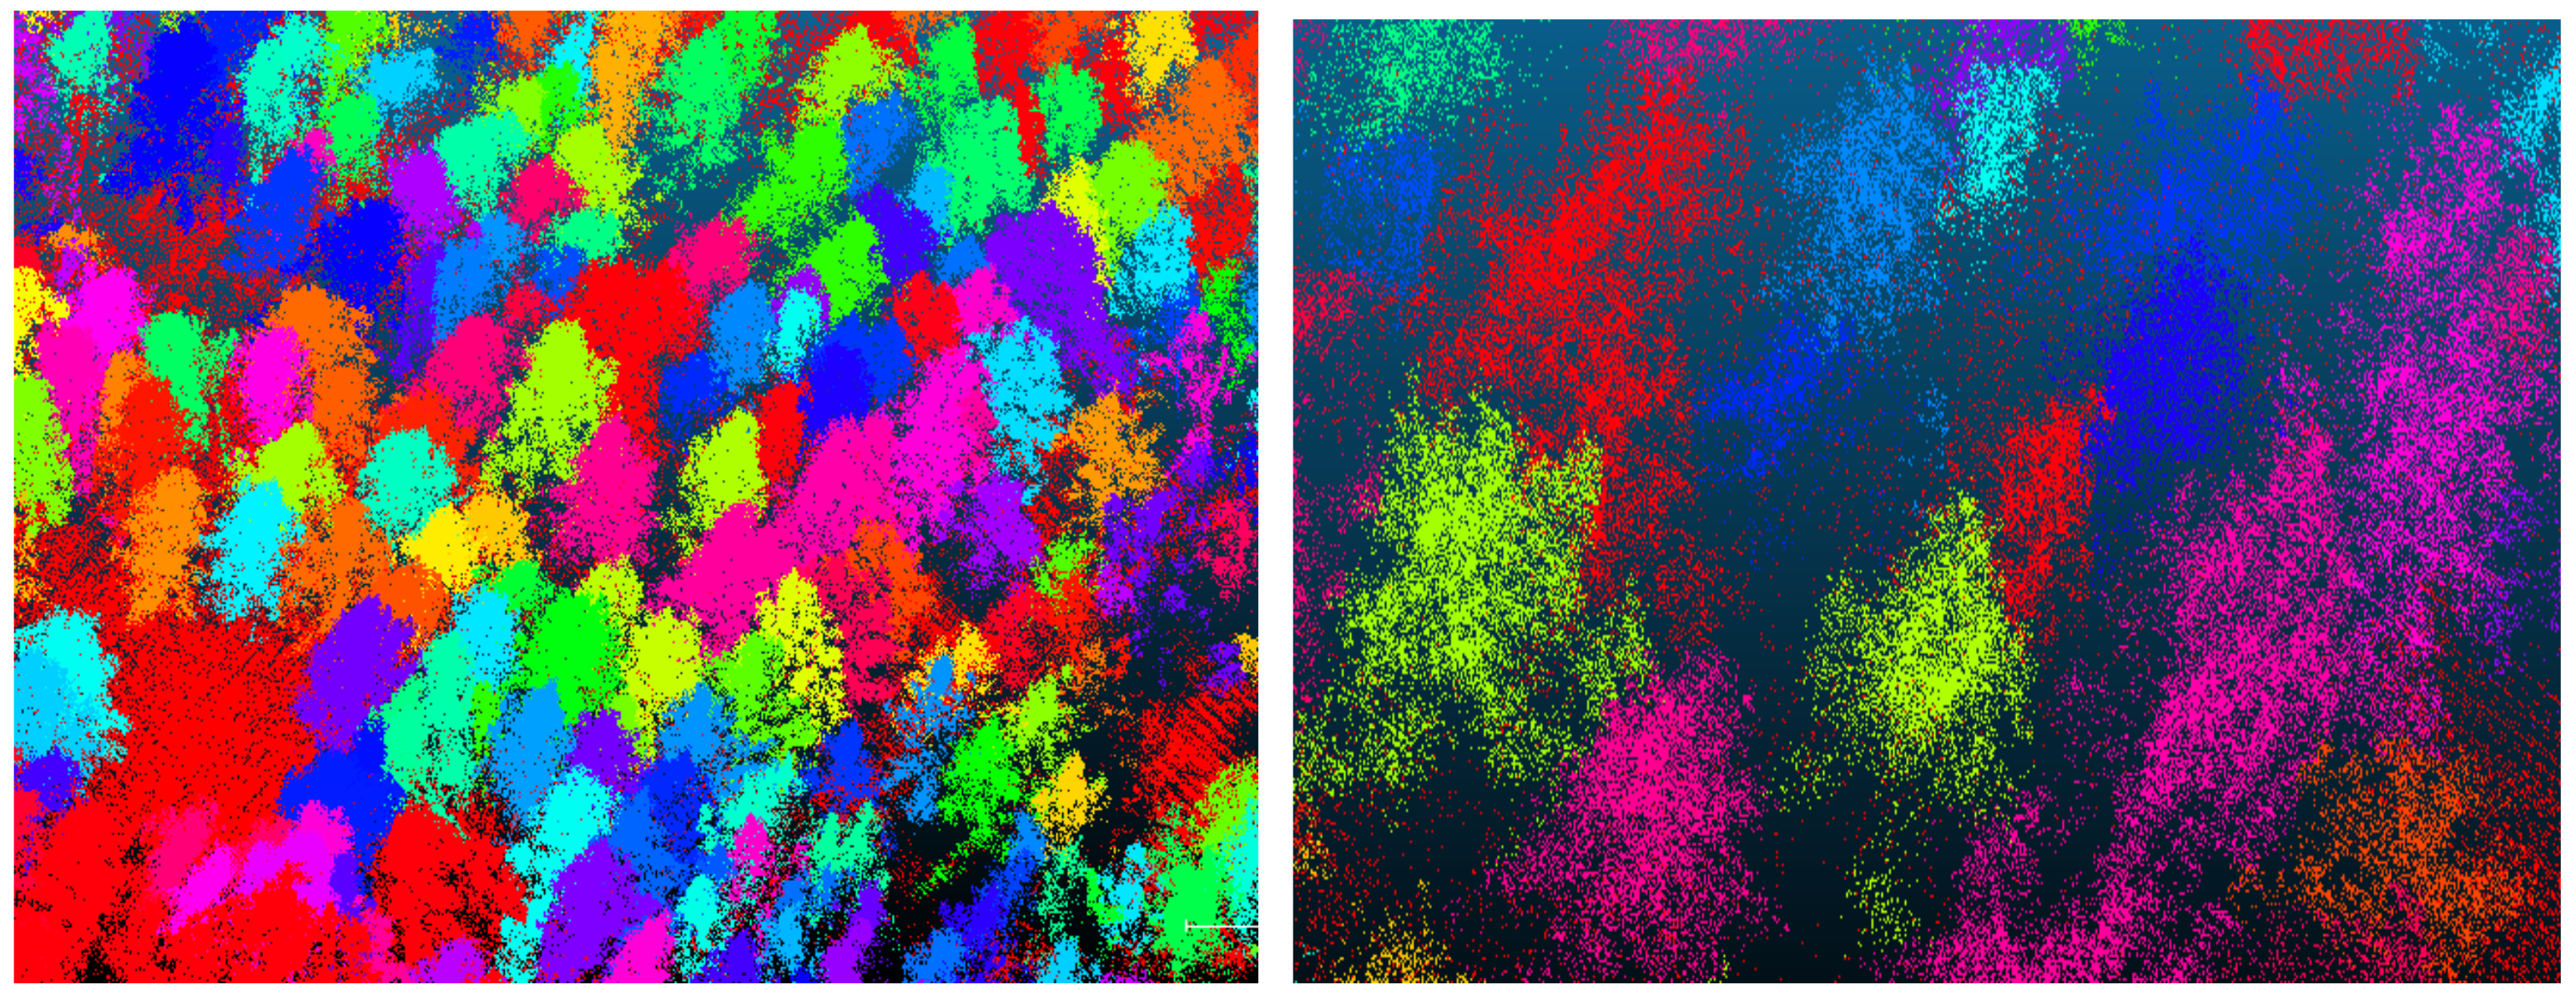
Figure 6.
Trees crossing each other.
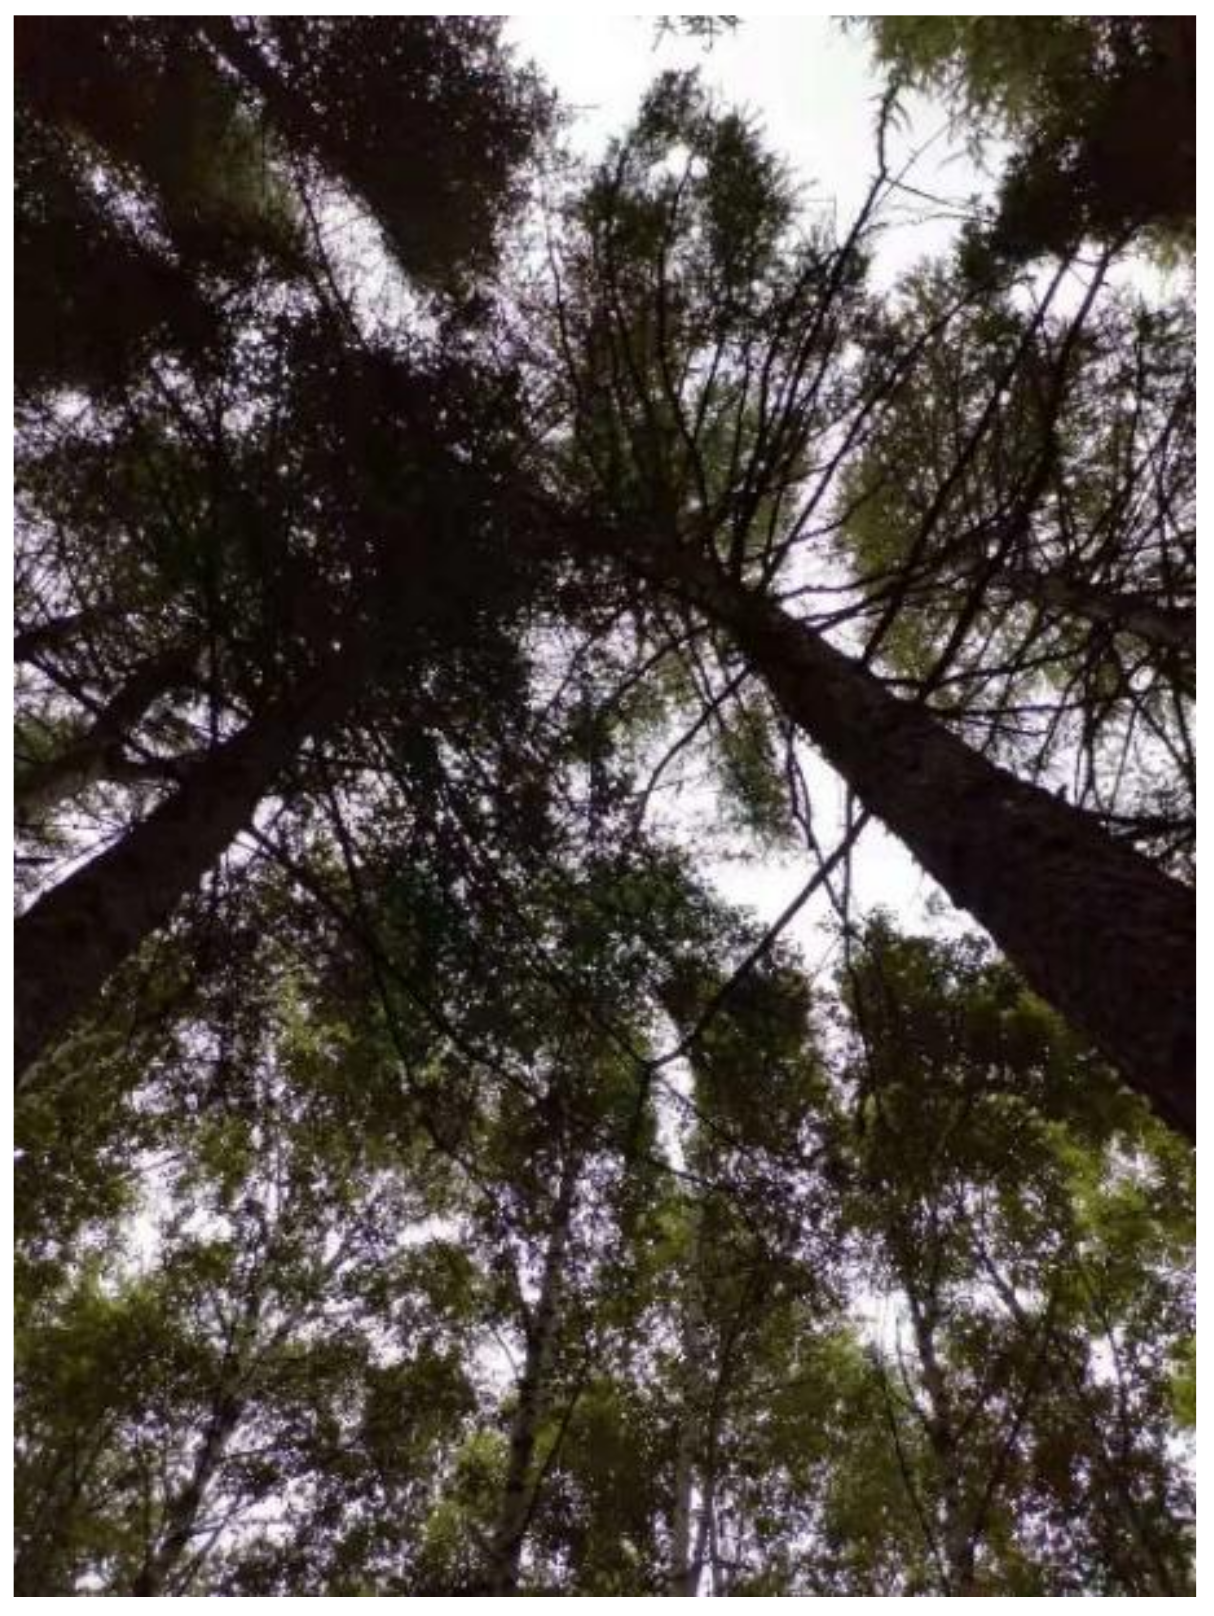
Figure 7.
Point Cloud Tree Species Classification Network (PCTSCN) tree species classification flowchart.
Figure 7.
Point Cloud Tree Species Classification Network (PCTSCN) tree species classification flowchart.
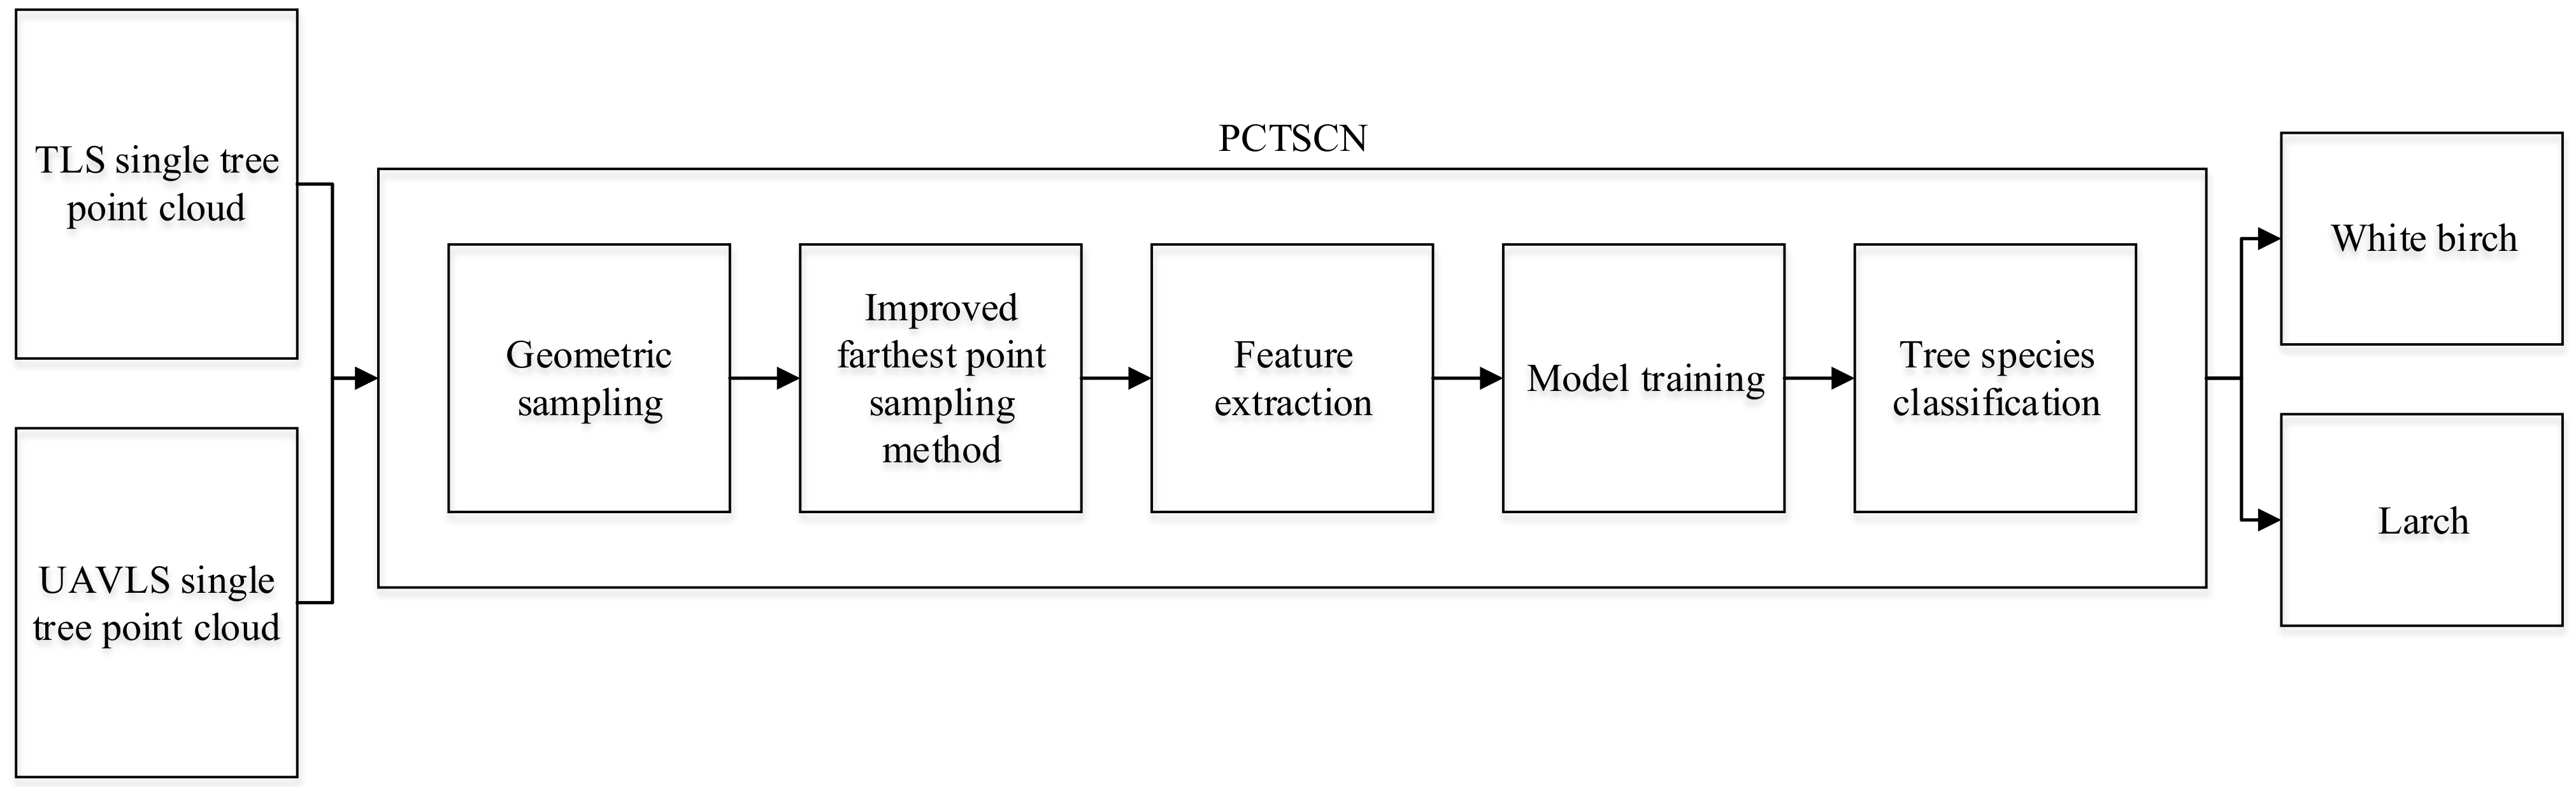
Figure 8.
Tree point cloud data processed by geometric sampling.
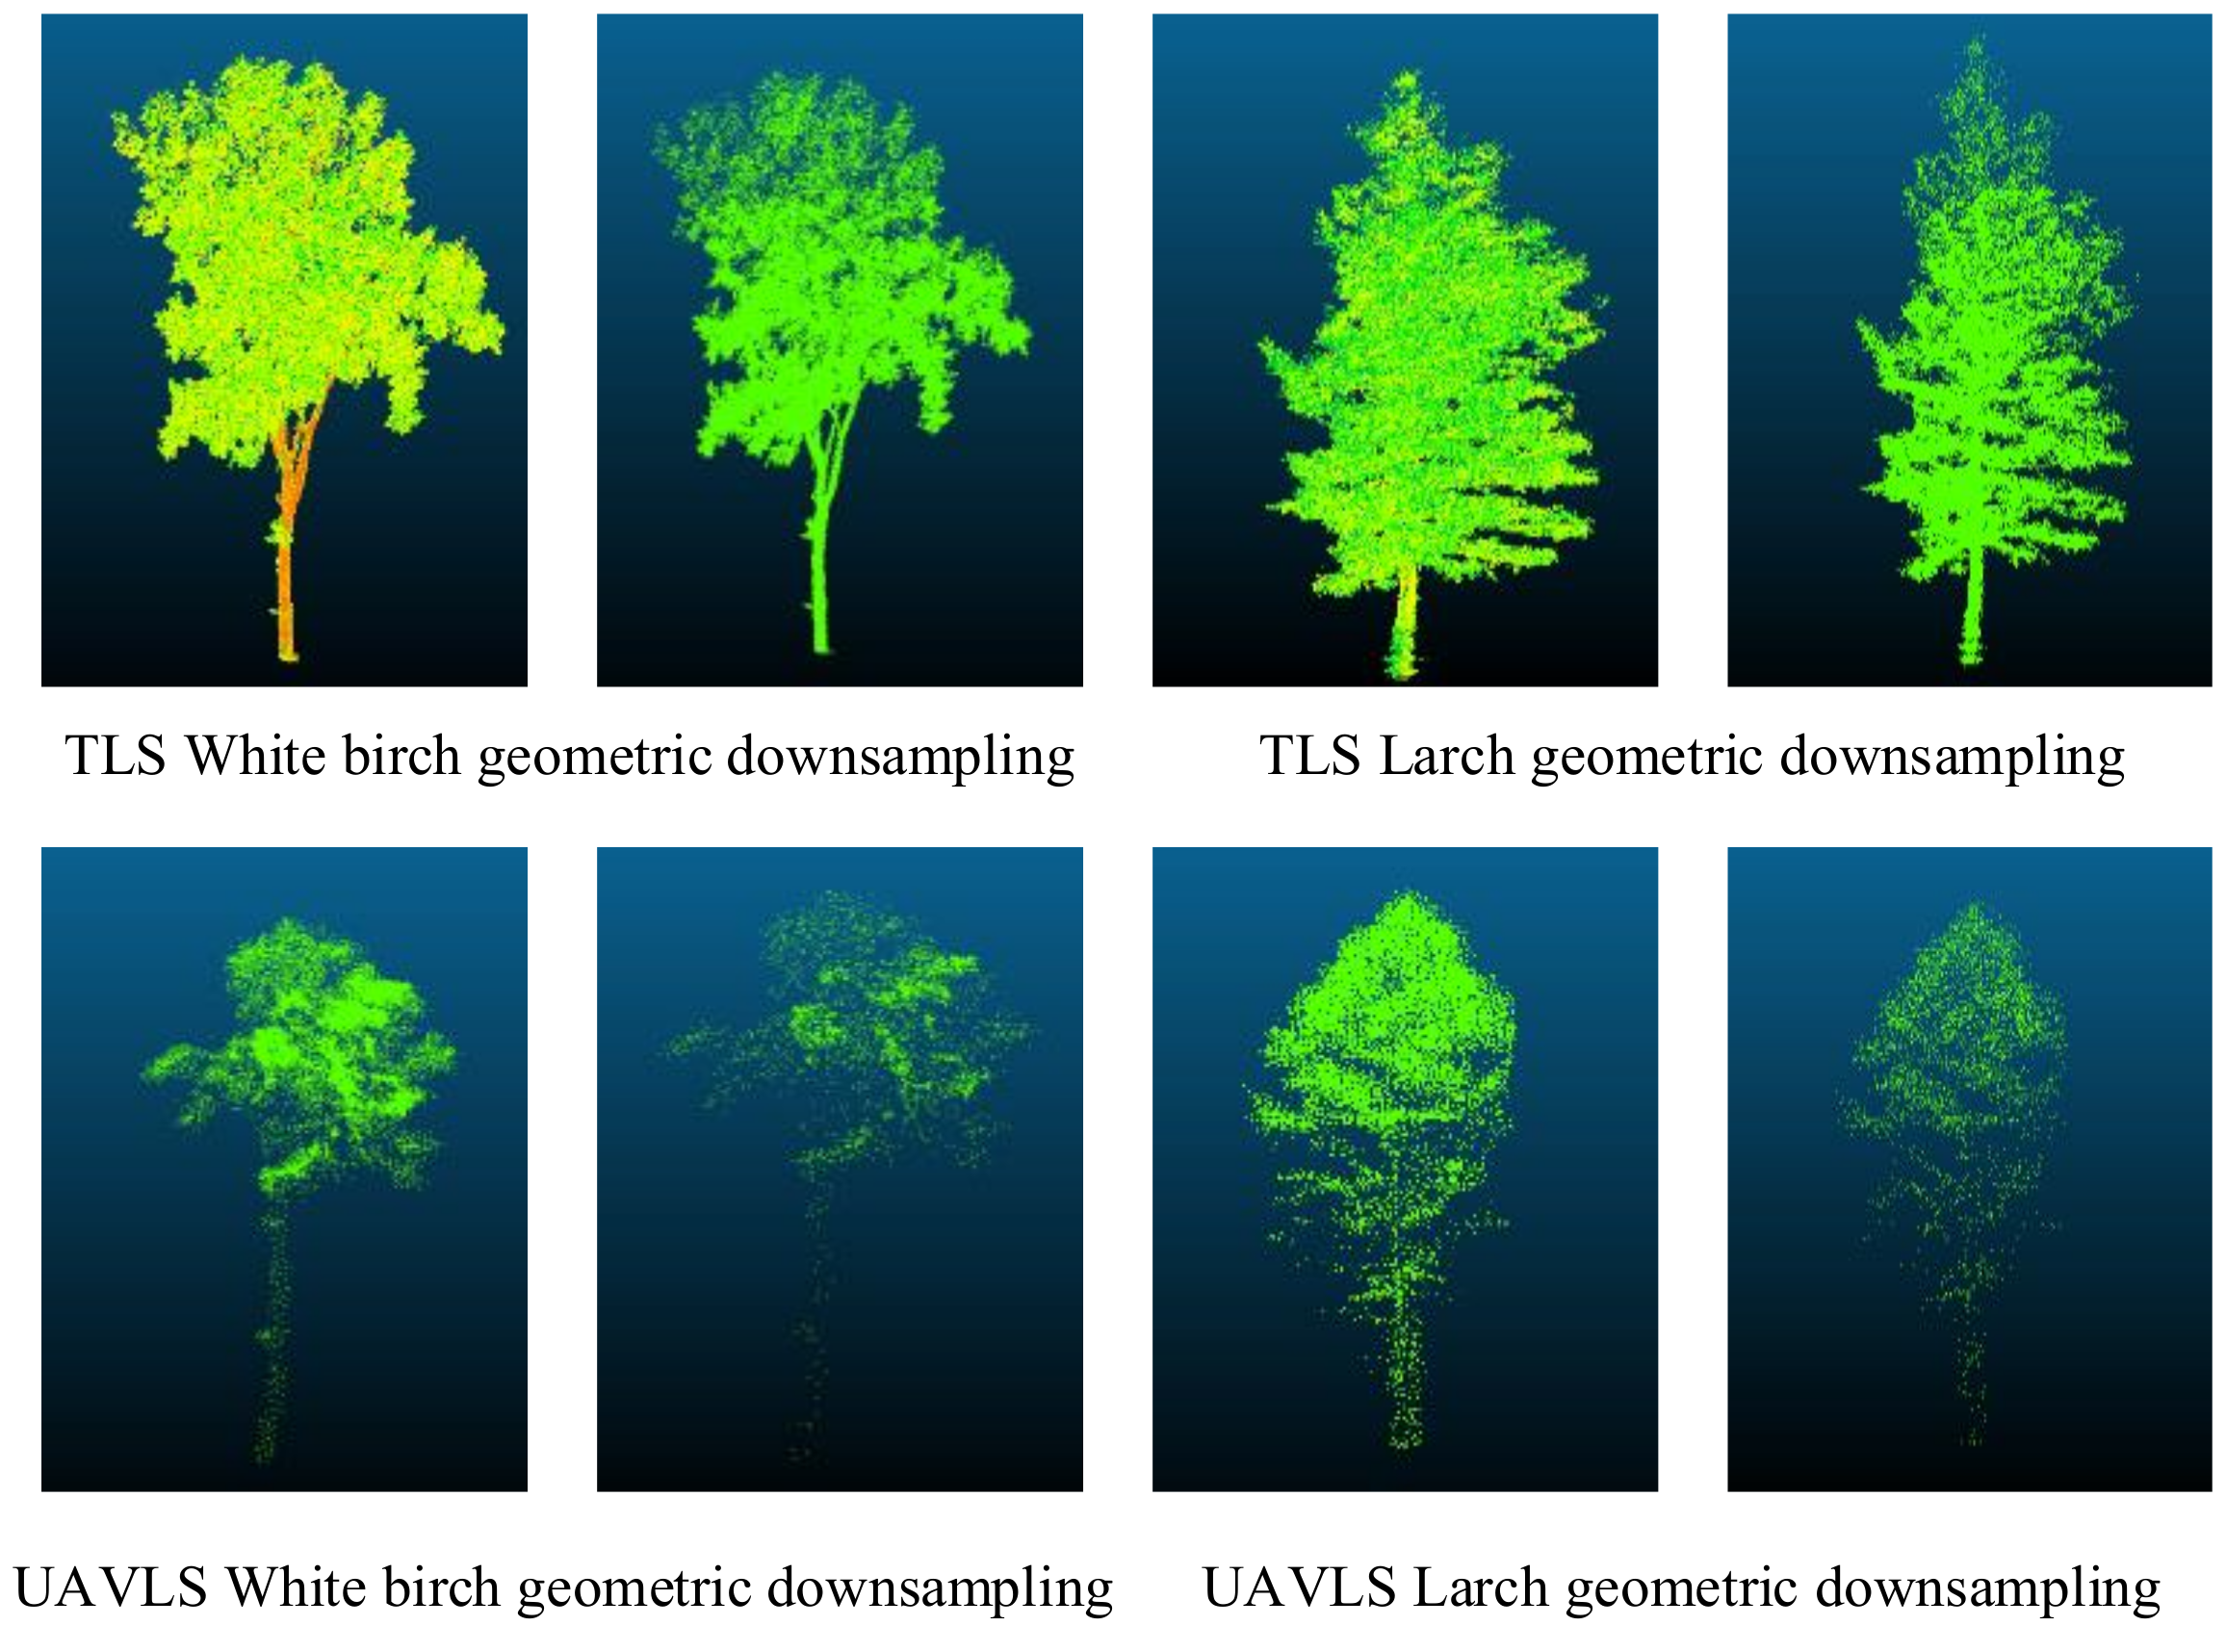
Figure 9.
The sampling effect of the improved farthest point sampling method on Terrestrial Laser Scanning (TLS) data.
Figure 9.
The sampling effect of the improved farthest point sampling method on Terrestrial Laser Scanning (TLS) data.
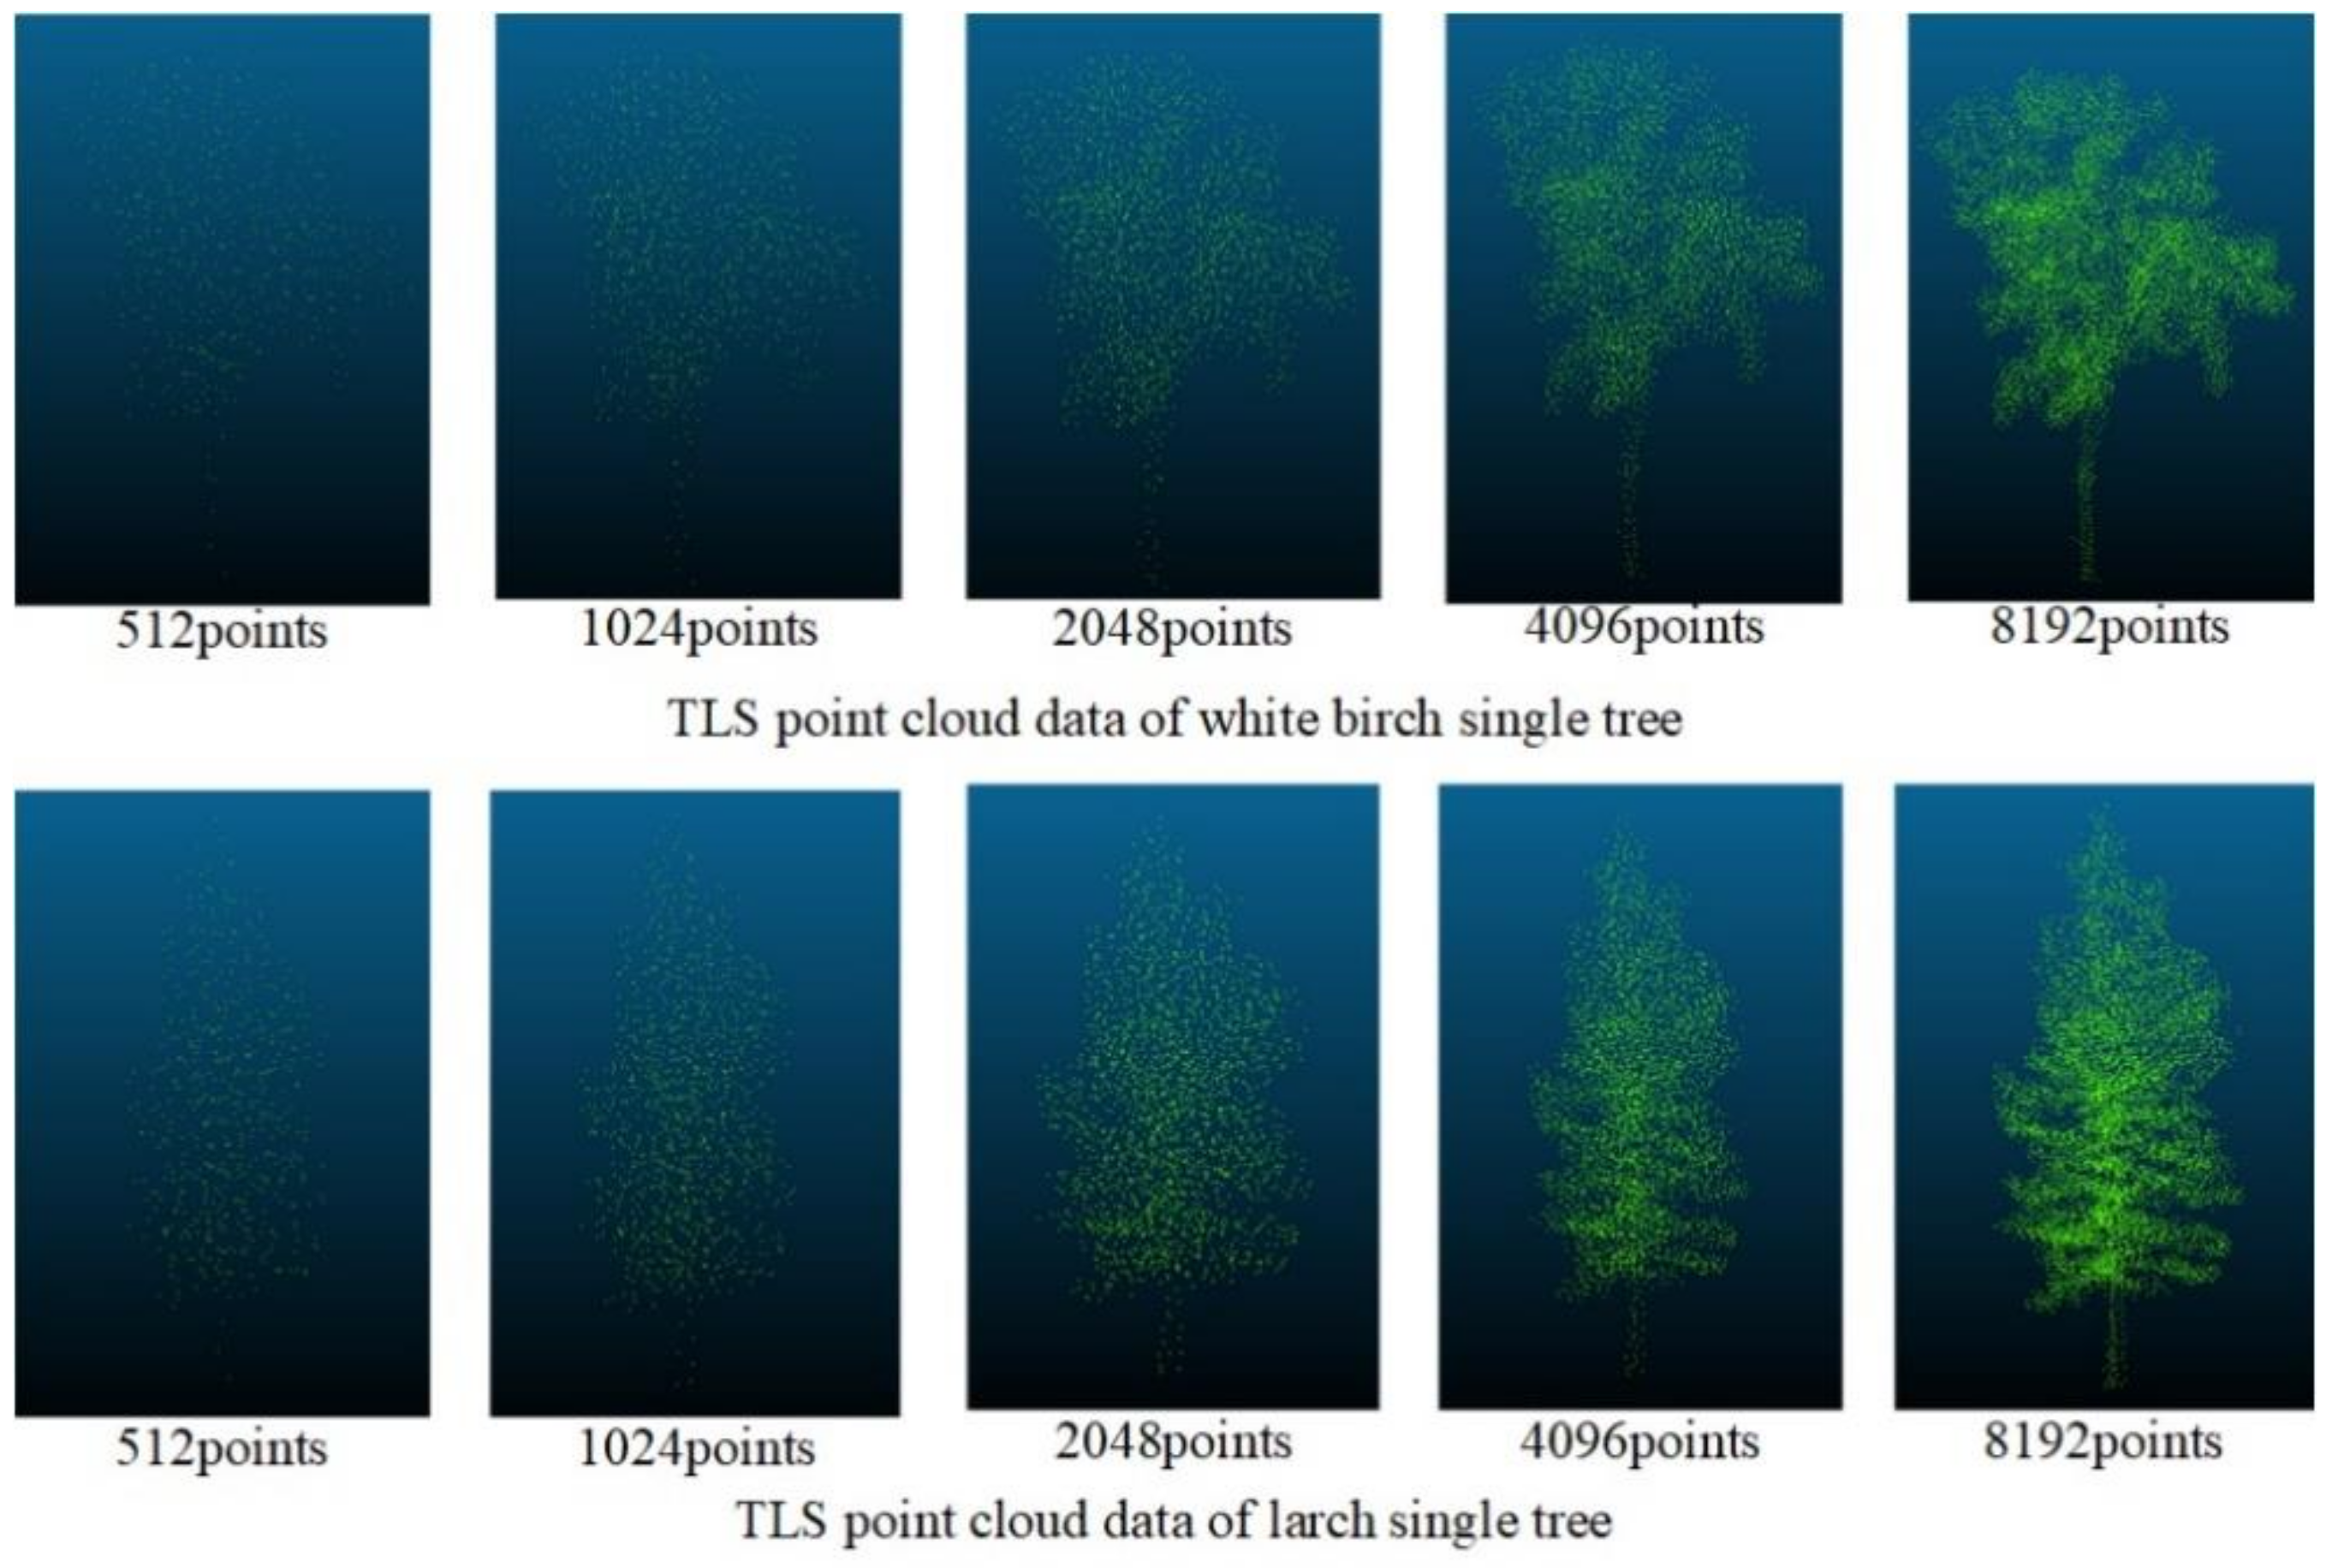
Figure 10.
The sampling effect of the improved farthest point sampling method on Unmanned Aerial Vehicle Laser Scanning (UAVLS) data.
Figure 10.
The sampling effect of the improved farthest point sampling method on Unmanned Aerial Vehicle Laser Scanning (UAVLS) data.
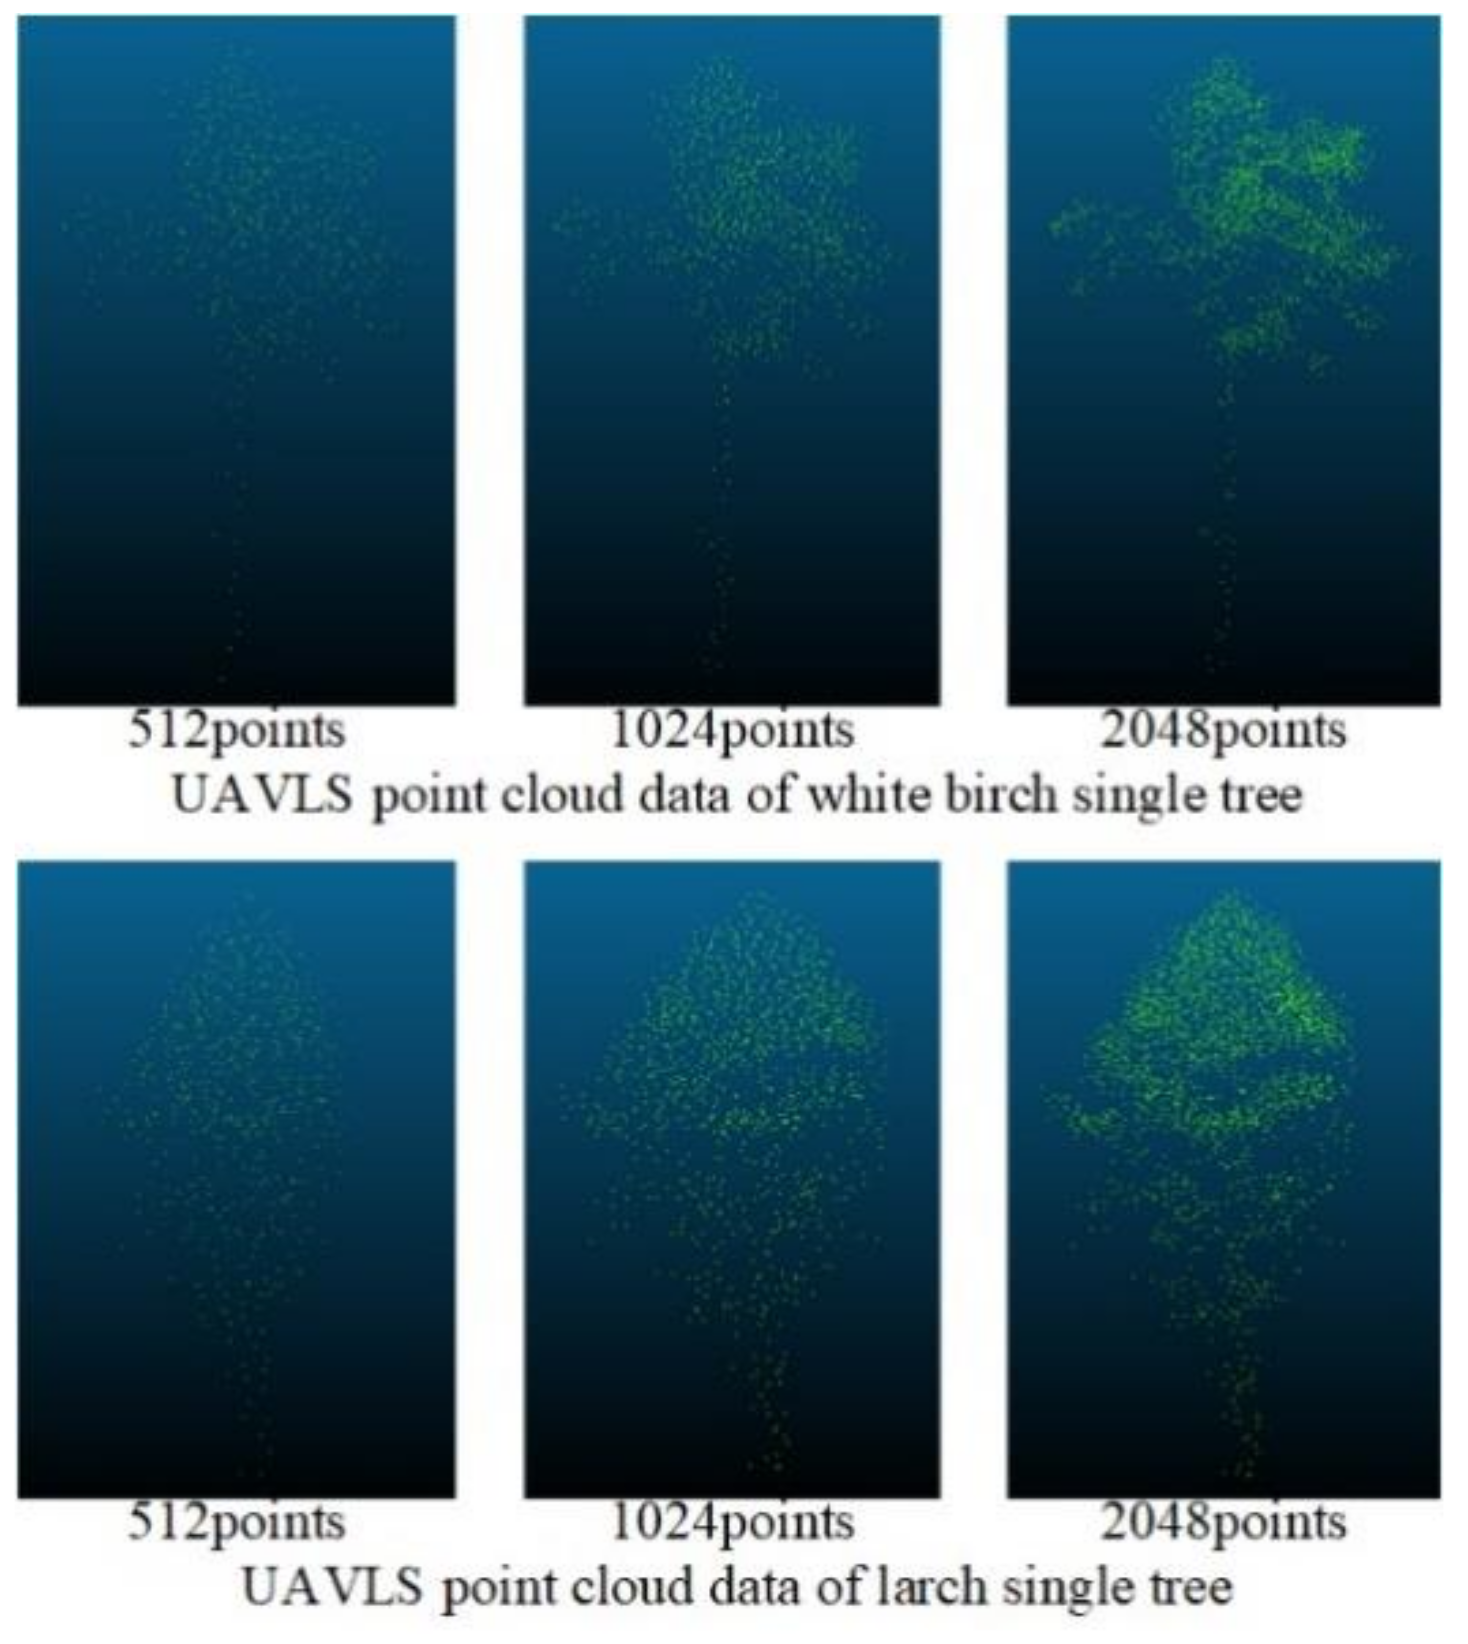
Figure 11.
Schematic diagram of network model.
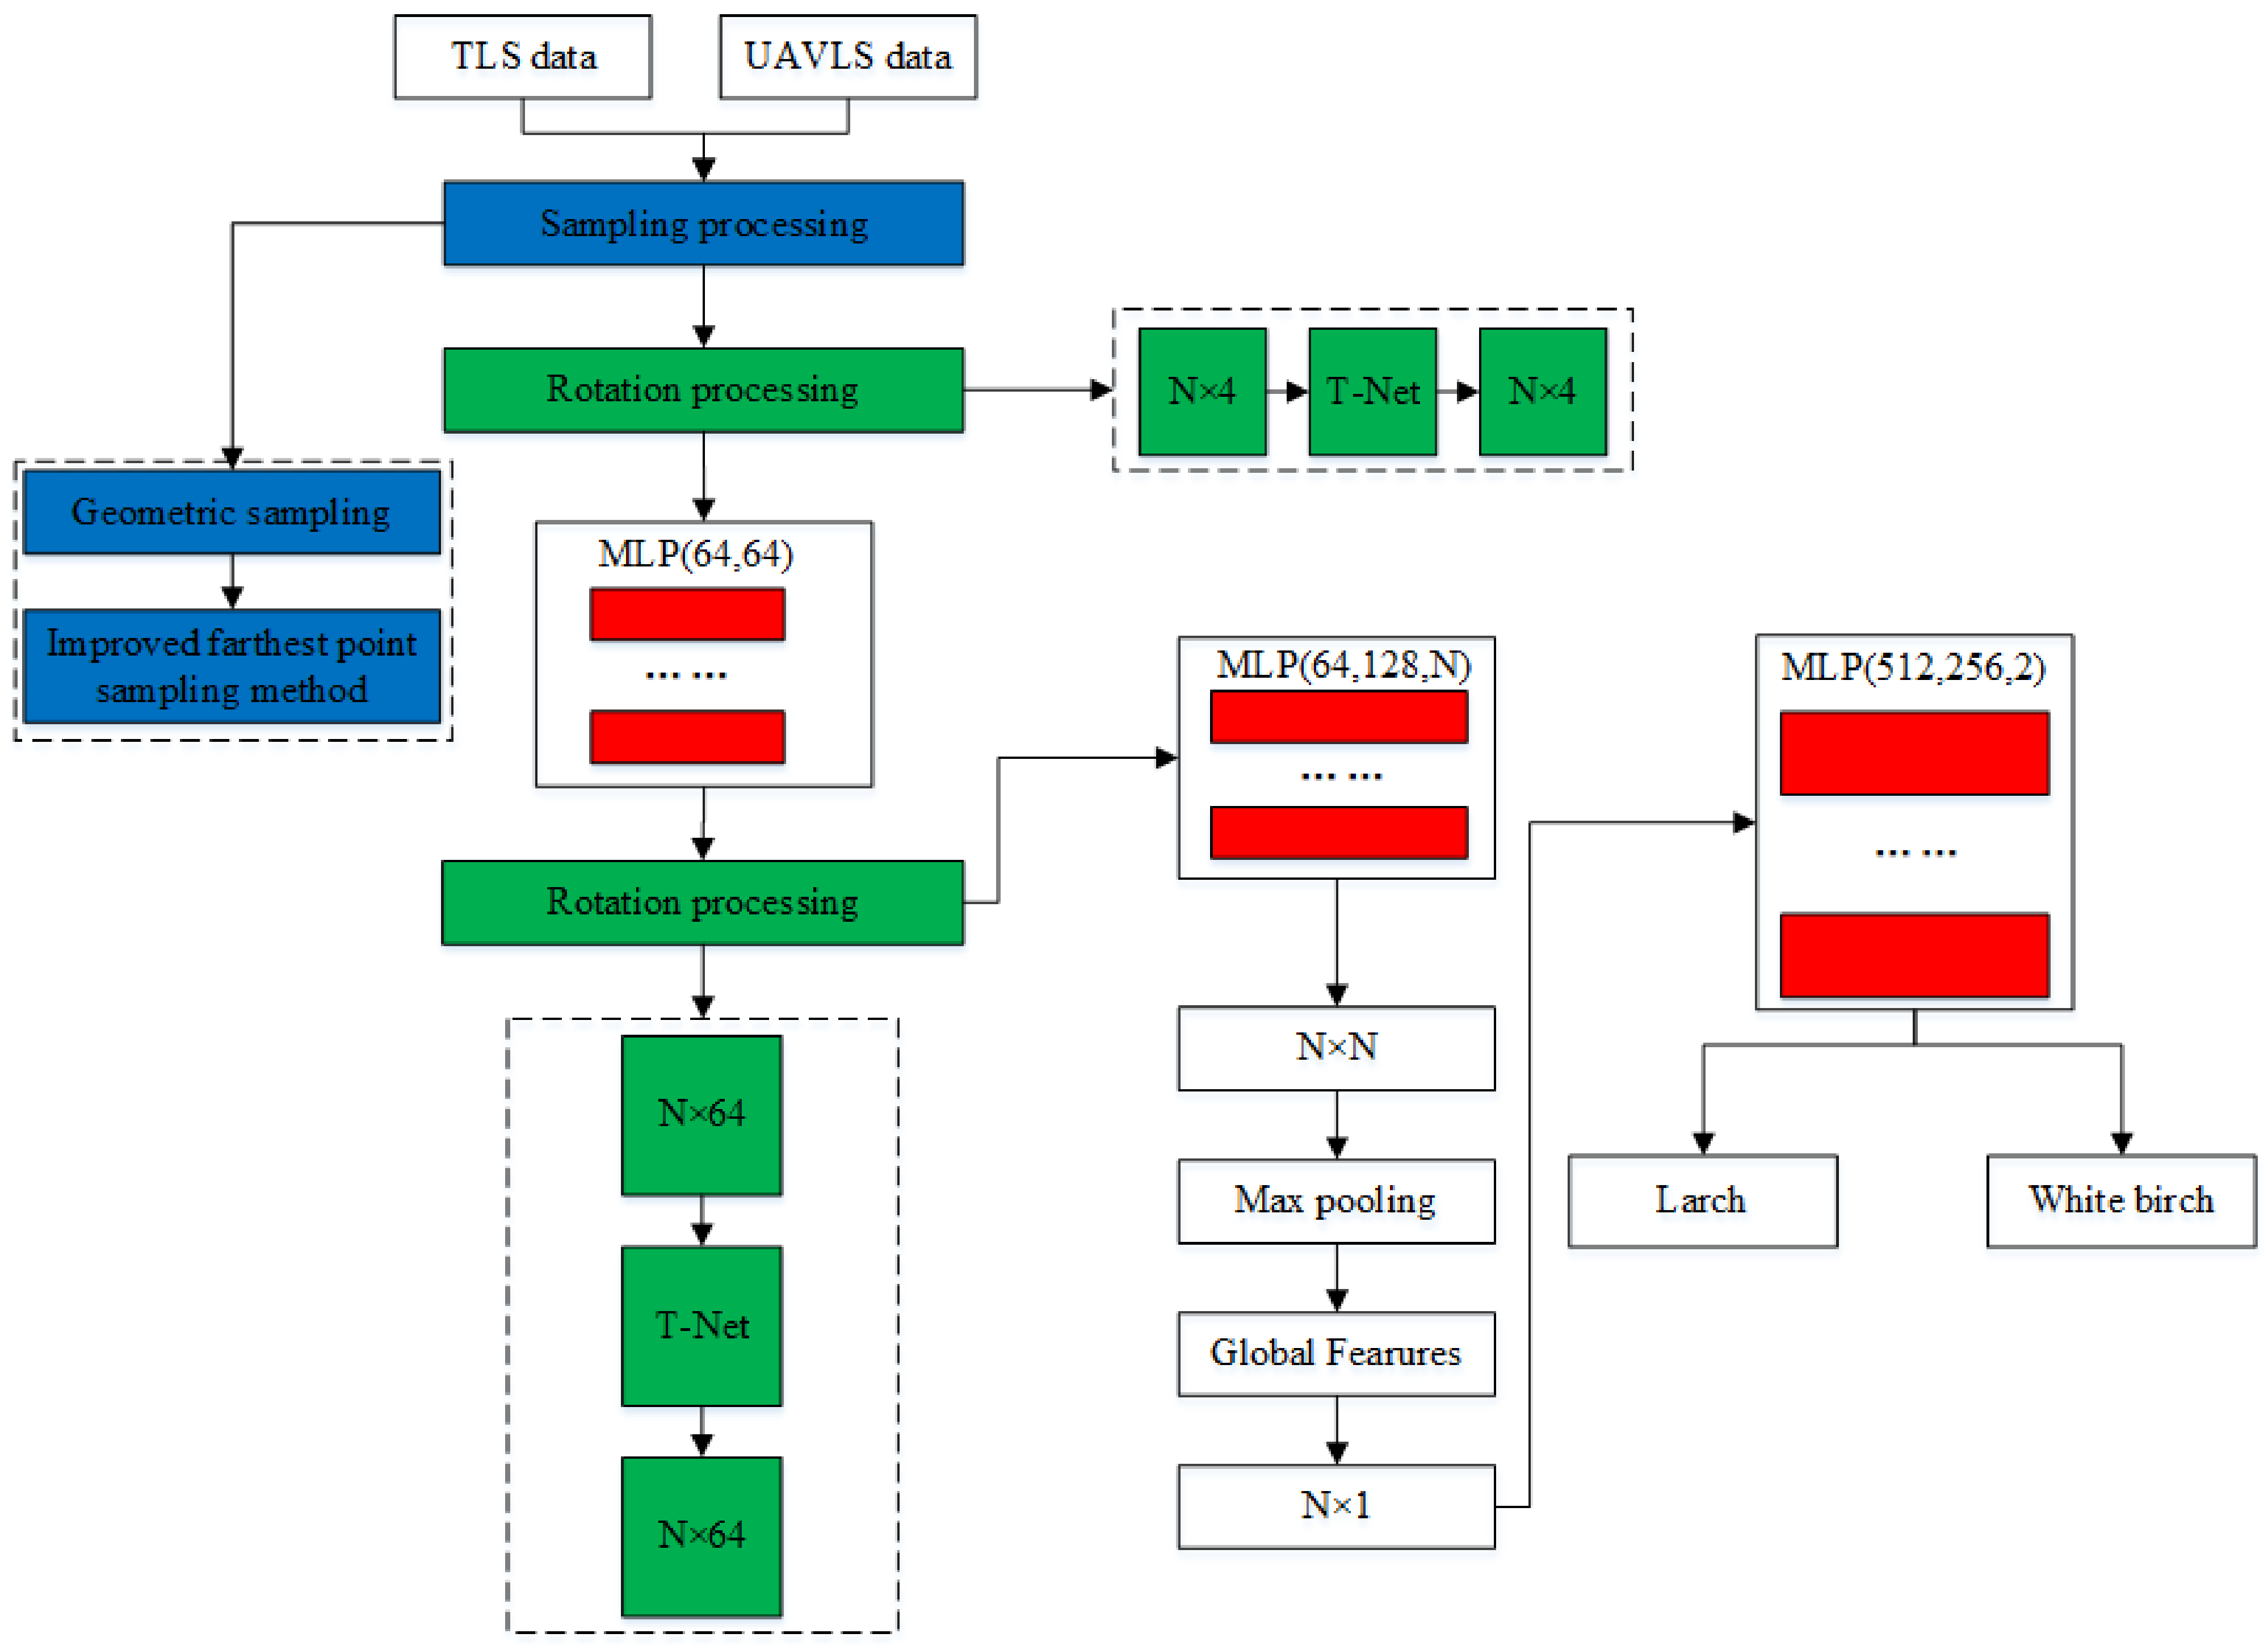
Figure 12.
Misclassification of tree species: (a) Larch was mistaken for white birch; (b) White birch was mistaken for larch.
Figure 12.
Misclassification of tree species: (a) Larch was mistaken for white birch; (b) White birch was mistaken for larch.
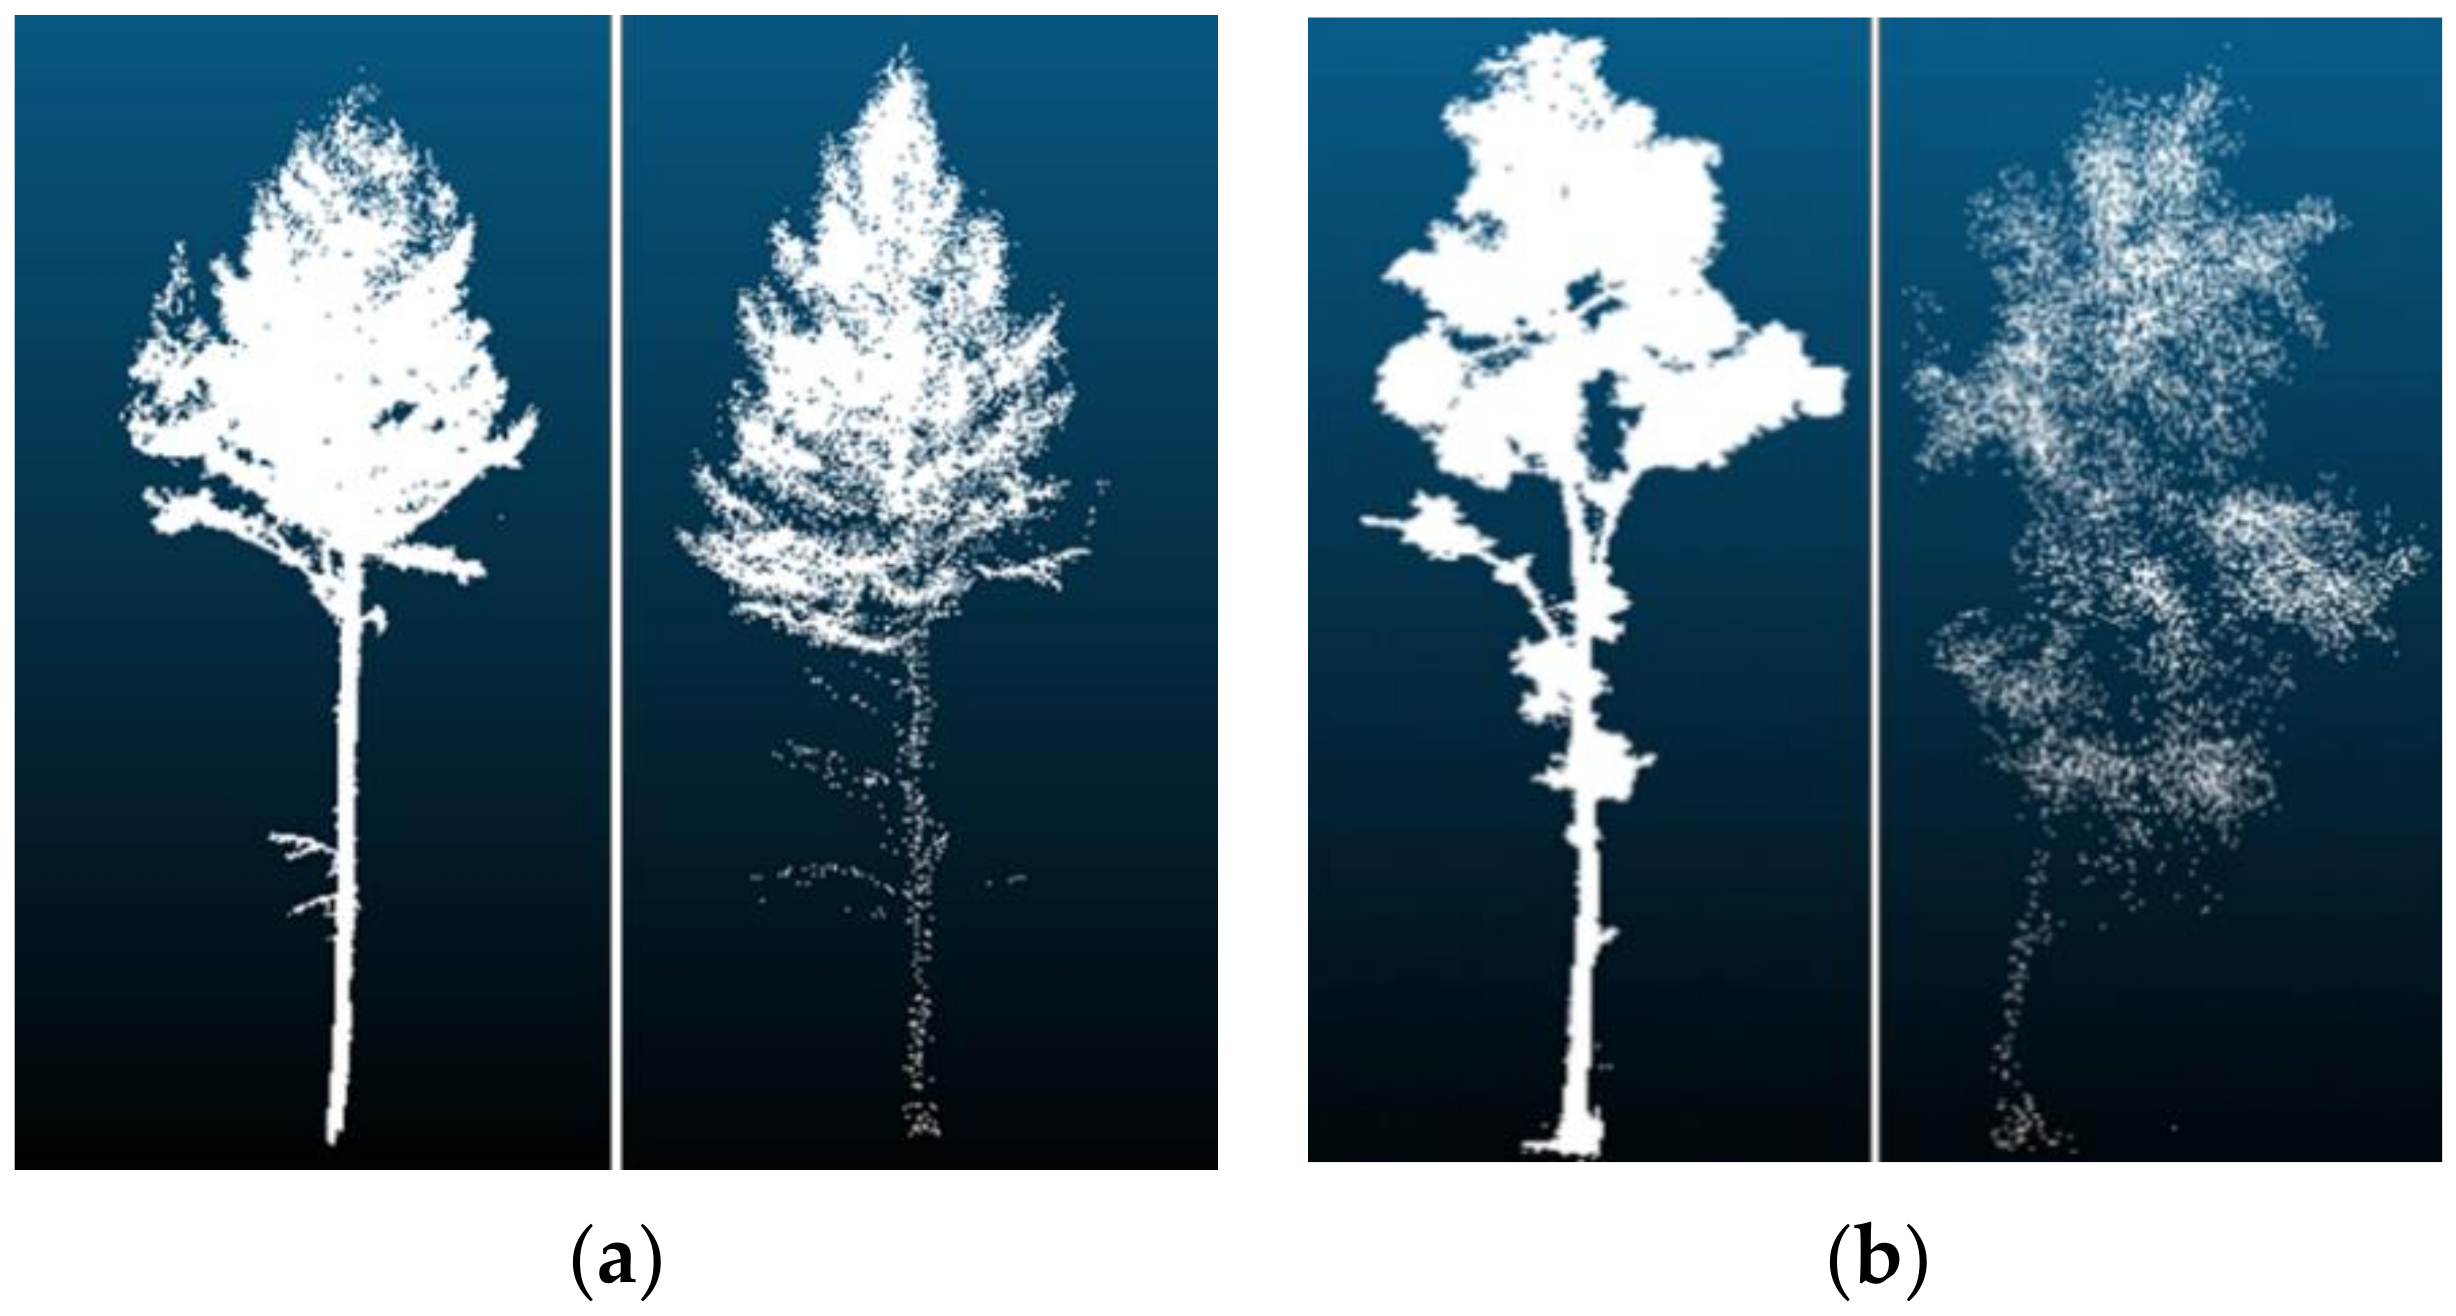
Figure 13.
The UAVLS data of the individual tree are missing.

Table 1.
Instrument parameters setting.
| Parameters | Riegl VZ-1000 | Faro F350 |
|---|---|---|
| Measurement speed | 300,000 points/s | 976,000 points/s |
| Horizontal angle | 0–360° | 0–360° |
| Vertical angle | 30–130° | 30–130° |
| Maximum measurement distance | 450 m | 350 m |
| Laser wavelength | 1550 nm | 1550 nm |
| Average scanning time per station | 1′23″ | 3′50″ |
| Point density | 48,596 points/m2 | 147,905 points/m2 |
Table 2.
Unmanned Aerial Vehicle Laser Scanning (UAVLS) parameters settings.
| Instrument Parameters | Beijing SureStar R-Fans-16 LiDAR |
|---|---|
| Flight strip width | 200 m |
| Flying height | 80 m |
| Flying speed | 3 m/s |
| Laser wavelength | 1550 nm |
| Maximum pulse frequency | 500 kHz |
| Angle measurement resolution | 0.002° |
| Maximum measuring distance | 200 m |
| Point density | 270 points/m2 |
Table 3.
Single tree sample attributes.
| Tree Species | Data Set Category | Number of Samples |
|---|---|---|
| Larch | Training data set | 320 |
| Validation data set | 80 | |
| Test data set | 50 | |
| White birch | Training data set | 320 |
| Validation data set | 80 | |
| Test data set | 50 |
Table 4.
Single tree point cloud data attributes.
| LiDAR Category | Single Tree Sample (Points) |
|---|---|
| TLS | 512 |
| 1024 | |
| 2048 | |
| 4096 | |
| 8192 | |
| UAVLS | 512 |
| 1024 | |
| 2048 |
Table 5.
Accuracy evaluation coefficient and calculation time of each model.
| Model | Larch Precision (%) | Larch Recall (%) | White Birch Precision (%) | White Birch Recall (%) | Accuracy (%) | Kappa | Time (h) |
|---|---|---|---|---|---|---|---|
| TLS-512 | 95.8 | 92 | 92.3 | 96 | 94 | 0.887 | 0.25 |
| TLS-1024 | 95.8 | 92 | 92.3 | 96 | 94 | 0.887 | 0.6 |
| TLS-2048 | 91.5 | 86 | 86.8 | 92 | 89 | 0.801 | 1.3 |
| TLS-4096 | 86.3 | 88 | 87.8 | 86 | 91 | 0.841 | 2.8 |
| TLS-8192 | 91.7 | 88 | 88.5 | 92 | 90 | 0.818 | 5 |
| UAVLS-512 | 84.9 | 90 | 89.4 | 84 | 87 | 0.77 | 0.2 |
| UAVLS-1024 | 95.6 | 86 | 87.3 | 96 | 91 | 0.835 | 0.5 |
| UAVLS-2048 | 90.4 | 94 | 93.8 | 90 | 92 | 0.852 | 1.2 |
Table 6.
Accuracy evaluation coefficient and calculation time of each model.
| Model | Larch Precision (%) | Larch Recall (%) | White Birch Precision (%) | White Birch Recall (%) | Accuracy | Kappa | Time (h) |
|---|---|---|---|---|---|---|---|
| TLS-512D | 97.9 | 94 | 94.2 | 98 | 96 | 0.923 | 0.2 |
| TLS-1024D | 95.8 | 92 | 92.3 | 96 | 94 | 0.888 | 0.6 |
| TLS-2048D | 93.6 | 88 | 88.7 | 94 | 91 | 0.835 | 2.8 |
| UAVLS-512D | 88.2 | 90 | 89.8 | 88 | 89 | 0.802 | 0.2 |
| UAVLS-1024D | 95.6 | 86 | 87.3 | 96 | 91 | 0.835 | 0.6 |
| UAVLS-2048D | 95.5 | 84 | 85.7 | 96 | 90 | 0.818 | 2.5 |
Table 7.
Classification performance of various deep learning model tree species.
| Lidar | Model | Larch Precision (%) | White Birch Precision (%) | Accuracy (%) | Kappa | Time (h) |
|---|---|---|---|---|---|---|
| TLS | PCTSCN | 95.8 | 92.3 | 94 | 0.887 | 0.6 |
| PointNet | 93.3 | 85.5 | 89 | 0.802 | 0.5 | |
| PointNet++ | 97.7 | 87.5 | 92 | 0.852 | 1 | |
| VoxNet | 90.7 | 80.7 | 85 | 0.739 | 1.3 | |
| ResNet101 | 95.7 | 88.9 | 92 | 0.852 | 0.8 | |
| UAVLS | PCTSCN | 88.2 | 89.8 | 89 | 0.802 | 0.6 |
| PointNet | 82.4 | 83.7 | 83 | 0.709 | 0.5 | |
| PointNet++ | 85.5 | 93.3 | 89 | 0.802 | 1 | |
| VoxNet | 79.2 | 83 | 81 | 0.681 | 1.2 | |
| ResNet101 | 83.9 | 93.2 | 88 | 0.786 | 0.7 |
Publisher’s Note: MDPI stays neutral with regard to jurisdictional claims in published maps and institutional affiliations. |
© 2021 by the authors. Licensee MDPI, Basel, Switzerland. This article is an open access article distributed under the terms and conditions of the Creative Commons Attribution (CC BY) license (https://creativecommons.org/licenses/by/4.0/).
Share and Cite
MDPI and ACS Style
Chen, J.; Chen, Y.; Liu, Z. Classification of Typical Tree Species in Laser Point Cloud Based on Deep Learning. Remote Sens. 2021, 13, 4750. https://doi.org/10.3390/rs13234750
AMA Style
Chen J, Chen Y, Liu Z. Classification of Typical Tree Species in Laser Point Cloud Based on Deep Learning. Remote Sensing. 2021; 13(23):4750. https://doi.org/10.3390/rs13234750
Chicago/Turabian StyleChen, Jianchang, Yiming Chen, and Zhengjun Liu. 2021. "Classification of Typical Tree Species in Laser Point Cloud Based on Deep Learning" Remote Sensing 13, no. 23: 4750. https://doi.org/10.3390/rs13234750
Note that from the first issue of 2016, this journal uses article numbers instead of page numbers. See further details here.