Article

Air Photo Interpretation for Spatial Analysis of Heritage Agrarian Structures in Mediterranean Settings as Sea-Breezes Proxy-Data. Application to the Island of Mallorca

by
Gabriel Alomar-Garau
* and
Miquel Grimalt-Gelabert
Climatology, Hydrology, Natural Hazards and Territory Research Group, Department of Geography, University of the Balearic Islands, 07122 Palma, Spain
*
Author to whom correspondence should be addressed.
Remote Sens. 2021, 13(22), 4652; https://doi.org/10.3390/rs13224652
Submission received: 15 October 2021 / Revised: 12 November 2021 / Accepted: 16 November 2021 / Published: 18 November 2021

Abstract

:
Historical aerial photographs are valuable sources of climate information. In the present article, a reconstruction of the sea-breezes in Mallorca is described, based on wind-direction interpretation of threshing floors captured by the aerial photographs in 1956–1957 by the United States Army Map Service. These pre-industrial agricultural structures constitute a novel ethnographic proxy of cartographic wind direction at each site. The overall analysis of these directions has made it possible to recreate and model the spatial arrangement of the breezes in Mallorca, and to compare this recreation with that of the existing theoretical-experimental breeze models. The result is a relatively good fit between both recreations, which demonstrates the accuracy of the proposed method. This can be extrapolated to many other aerial-photographed Mediterranean regions prior to full mechanisation of the field.

Graphical Abstract

1. Introduction

Interest in the indirect measurement of climate elements stems from the need to characterise the climatic regimes of eras and regions of which there are no instrumental meteorological records. This has been the mission of paleoclimatology and historical climatology, well-established disciplines with a long scientific track record [1]. These disciplines have not taken equal interest in each of the elements of climate, and wind is a variable to which little attention has been paid compared to temperature or precipitation, much more considered in a context of global warming such as the current one, in which what is at stake is secular variations in temperature [2,3,4] and precipitation, and their relationship with droughts or historical flooding [5,6,7,8,9,10].
Meanwhile, the reconstruction of climatic regimes without the use of modern instrumental meteorological records is achieved by means of different types of data source, which Glaser [11] classifies in three main groups: descriptive weather information, historical instrument readings, and climate proxy data. Climate proxy data provide a type of information that replaces instrumental observations of the climate of a place and enable the behavioural patterns of certain climate variables to be reconstructed. The suitability and effectiveness of the use of these proxy data is not without controversy [12], and there exists a broad range of methods to be applied in order to extract the desired climate information from these data.
In the case of the present paper, we present a non-instrumental reconstruction method of the spatial arrangement of the breeze regime, based on the use of a novel ethnographic proxy: threshing floors in which the tasks of collecting grains of wheat and other cereals were carried out. The method is applied to the island of Mallorca, in the Western Mediterranean, a territory where agriculture was scarcely mechanized in the middle of the 20th century. The use of threshing floors as a climate proxy is completely original in the field of climatology applied to the pre-instrumental era, despite the use of ethnography applied to climate knowledge not being new; while so-called ethnoclimatology is generally limited to the qualitative data value conferred to information on a climate variable provided by human informers. For instance, Nkuba et al. [13] conducted research on the biotic and abiotic indicators used by shepherds and farmers to predict the onset and cessation of rains in the region of Rwenzori (Uganda). Meanwhile, Orlove et al. [14] examined the observations that farmers in the Andean regions of South America made regarding changes in the apparent brightness of stars in the Pleiades, as an indirect method for seasonal rainfall forecasting.
The aim of our article is to report the test performed with a novel proxy to determine, in the absence of instrumental wind records, the spatial arrangement of the breezes in a well-known region. One of the advantages of this proxy is that it can be tested all over the world where mass threshing of cereals was carried out in threshing floors, and where this activity might have been recorded and determined by an aerial photograph. Aerial photography has long been used to analyse landscapes [15], and we have used it to identify and analyze some heritage features of the old Mallorcan agricultural landscape, for climatic purposes.
Three factors make Mallorca a good case study. First of all, this island constitutes an ideal geographic setting for a typical breeze system to operate in, favoured by the subtropical anticyclonic situation that is dominant in summer. Secondly, because Mallorca preserves a rich heritage of pre-industrial agricultural constructions (windmills and threshing floors) the functioning of which depended directly on wind action. Thirdly, because the Mallorcan territory was photographed aerially in its entirety between 1956 and 1957, when many of these constructions were still operational. This means that we have aerial photographs of the time that enable these ancient constructions to be georeferenced with a view to modelling the summer wind regime in the island.
In the regions in which subsistence farming economies have persisted, wind transcends the atmospheric realm to reveal itself as a source of energy that has been well harnessed to enable human work in the world of agriculture, both as a driving force to move the millstones of the ancient windmills [16,17], and to winnow the harvest in threshing floors [18]. Both infrastructures were tailored to the prevailing wind regimes, in such a way that the analysis of their spatial location and topographic setting reveal the wind power potential of the region. In the case of threshing floors, visual inspection of their morphology on a map enables useful information to be deduced regarding wind direction at each site. Certainly, morphological analyses of some elements of nature used as climate indicators of local winds is not new. For instance, tree inclination has been used to determine decadal variations in wind direction and intensity in places [19,20,21,22,23]. Beach-dune systems or snow drift can also be interpreted in aeolian terms, since the wind regime is one of the factors involved in their dynamics.
In our case, morphological analysis of ancient threshing floors enabled us to obtain an ‘anemographic’ record of the direction of the sea breezes in Mallorca, which can be checked against instrumental records and numerical models of the sea-breeze regime in the island. We define the ‘anemograph’ of a threshing floor as the graphic trace left by windblown dust and chaff downwind of the threshing floor, which is captured and graphically recorded on an aerial or satellite image. Deciphering the climate signal of breezes through photo-interpretation techniques is a complex task, for which we have afforded aerial photographs a new function, in that graphic documents may be used for climatological purposes.

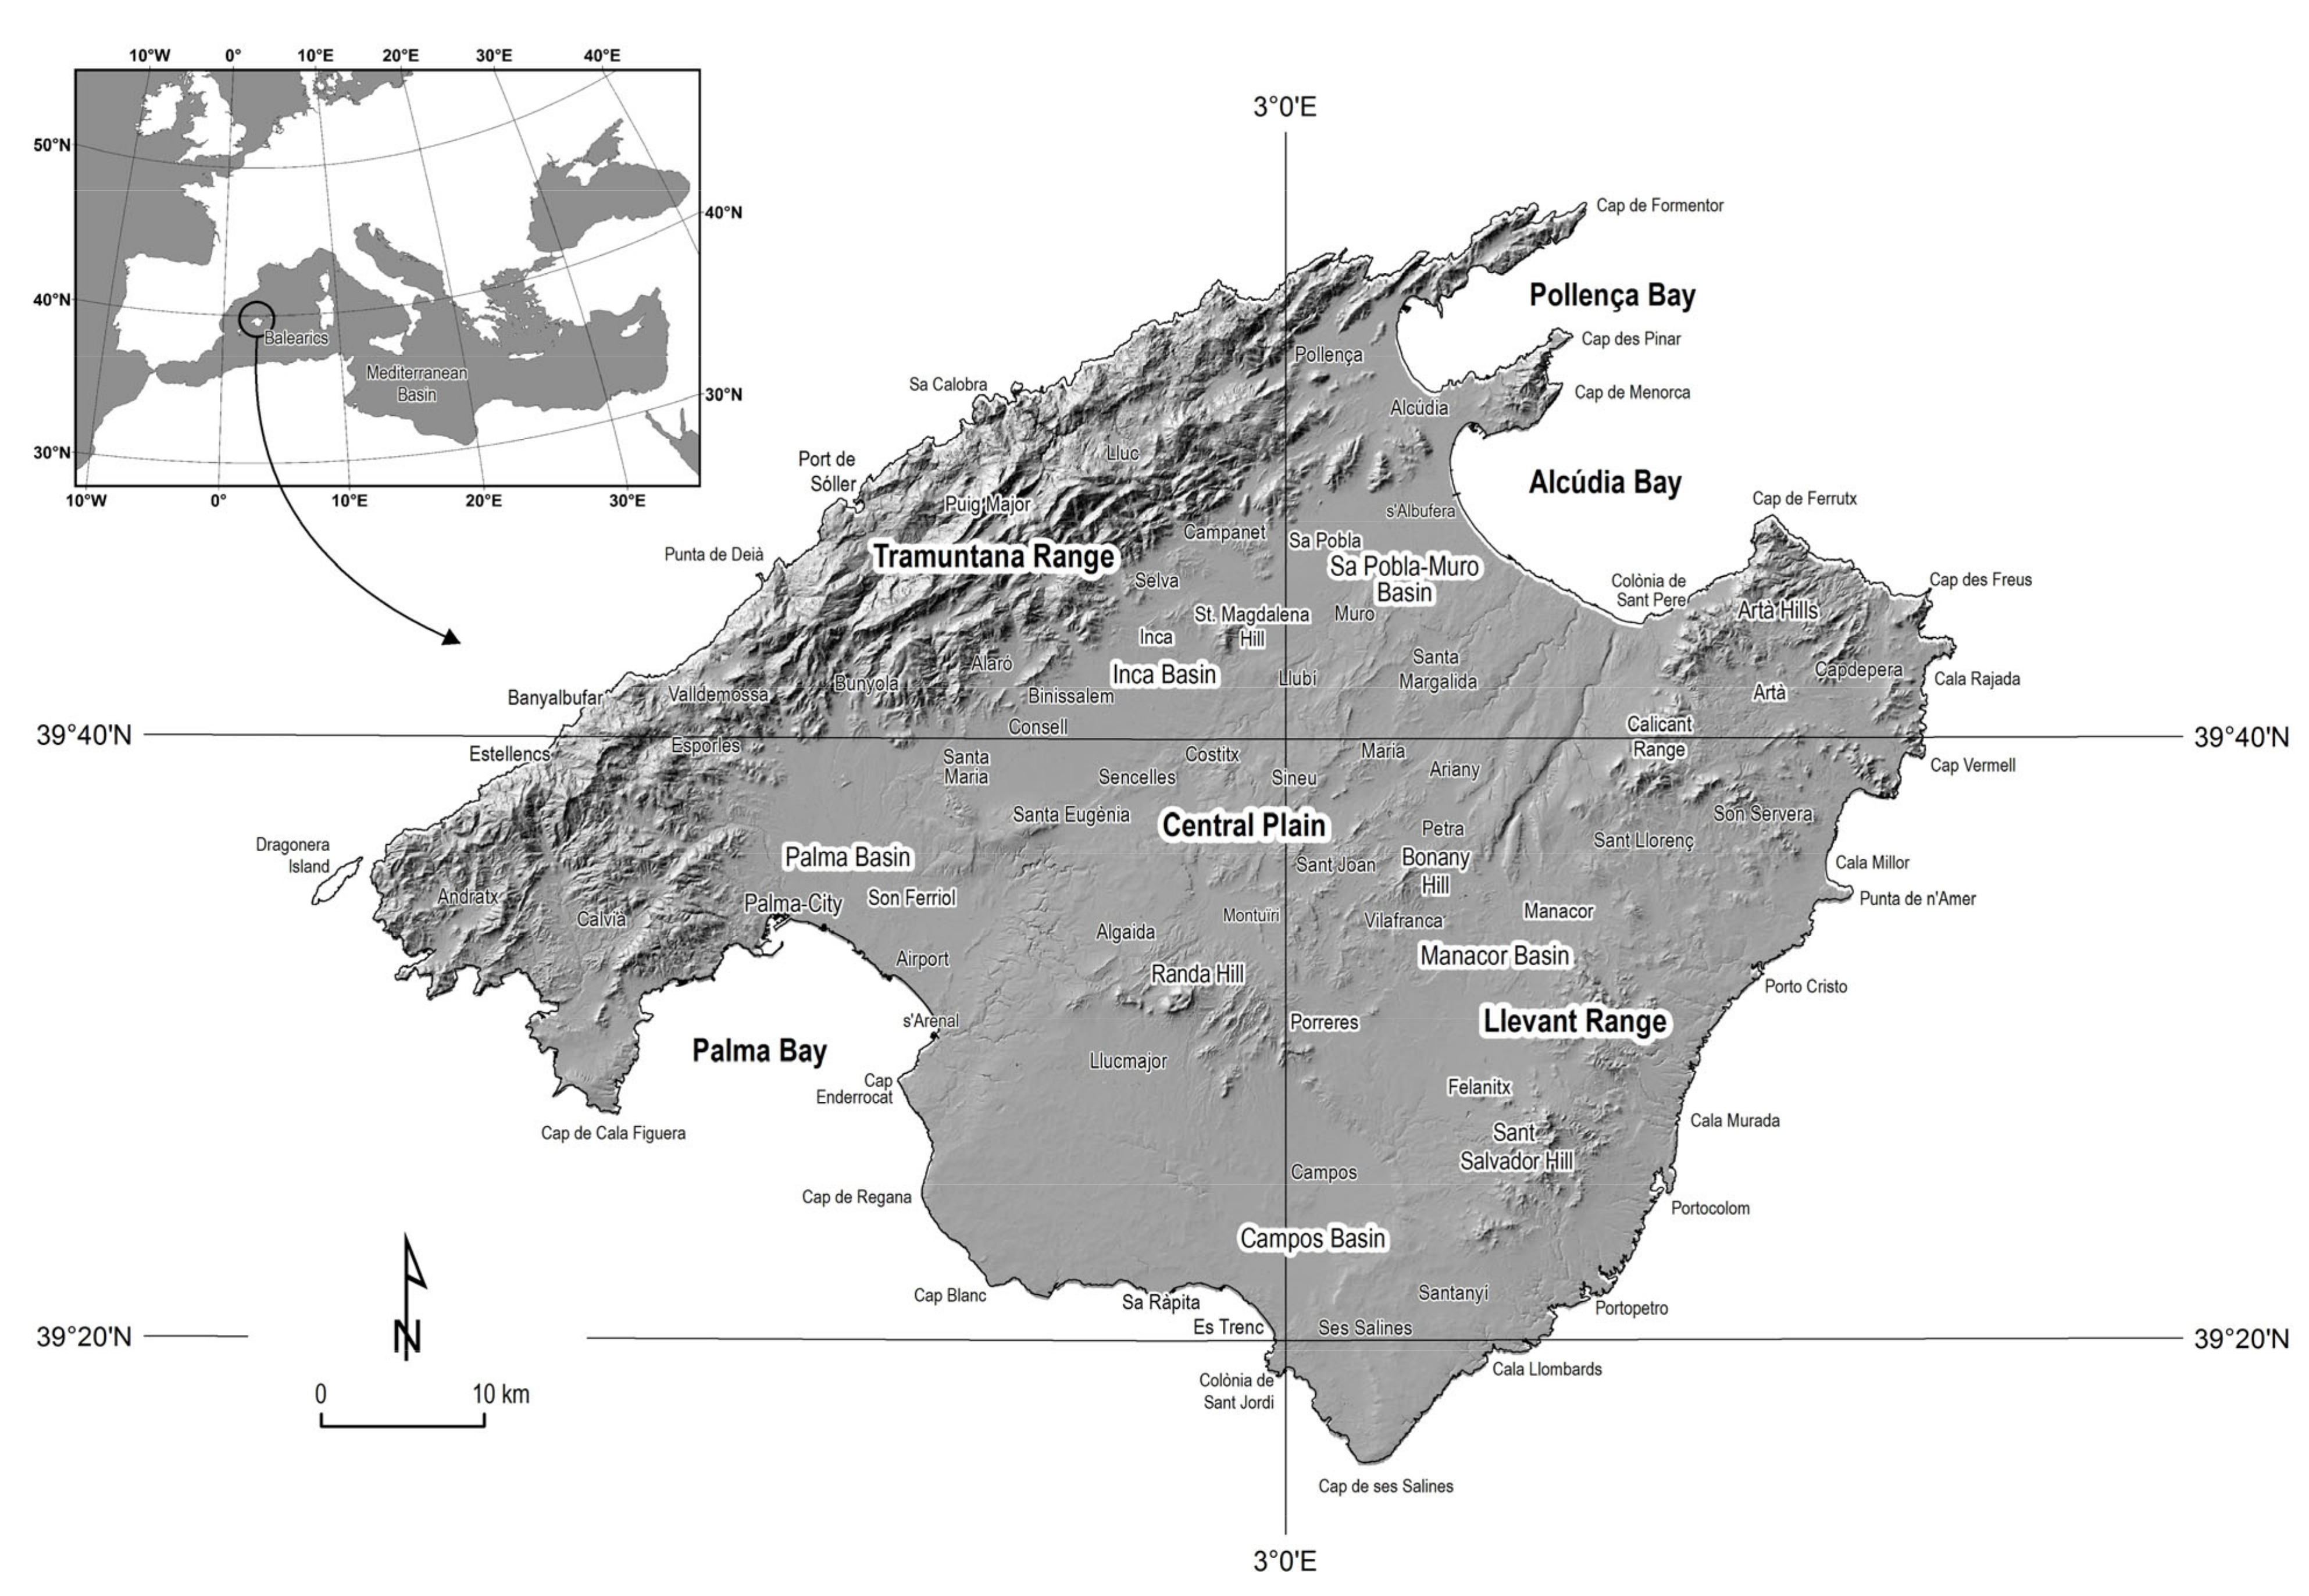
2. Study Area. Sea-Breeze System in Mallorca
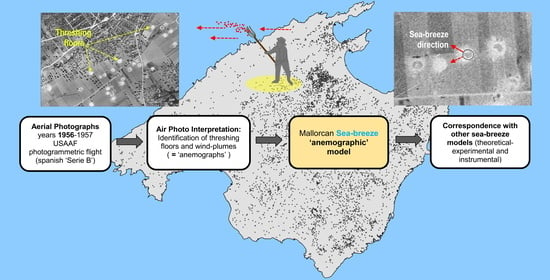
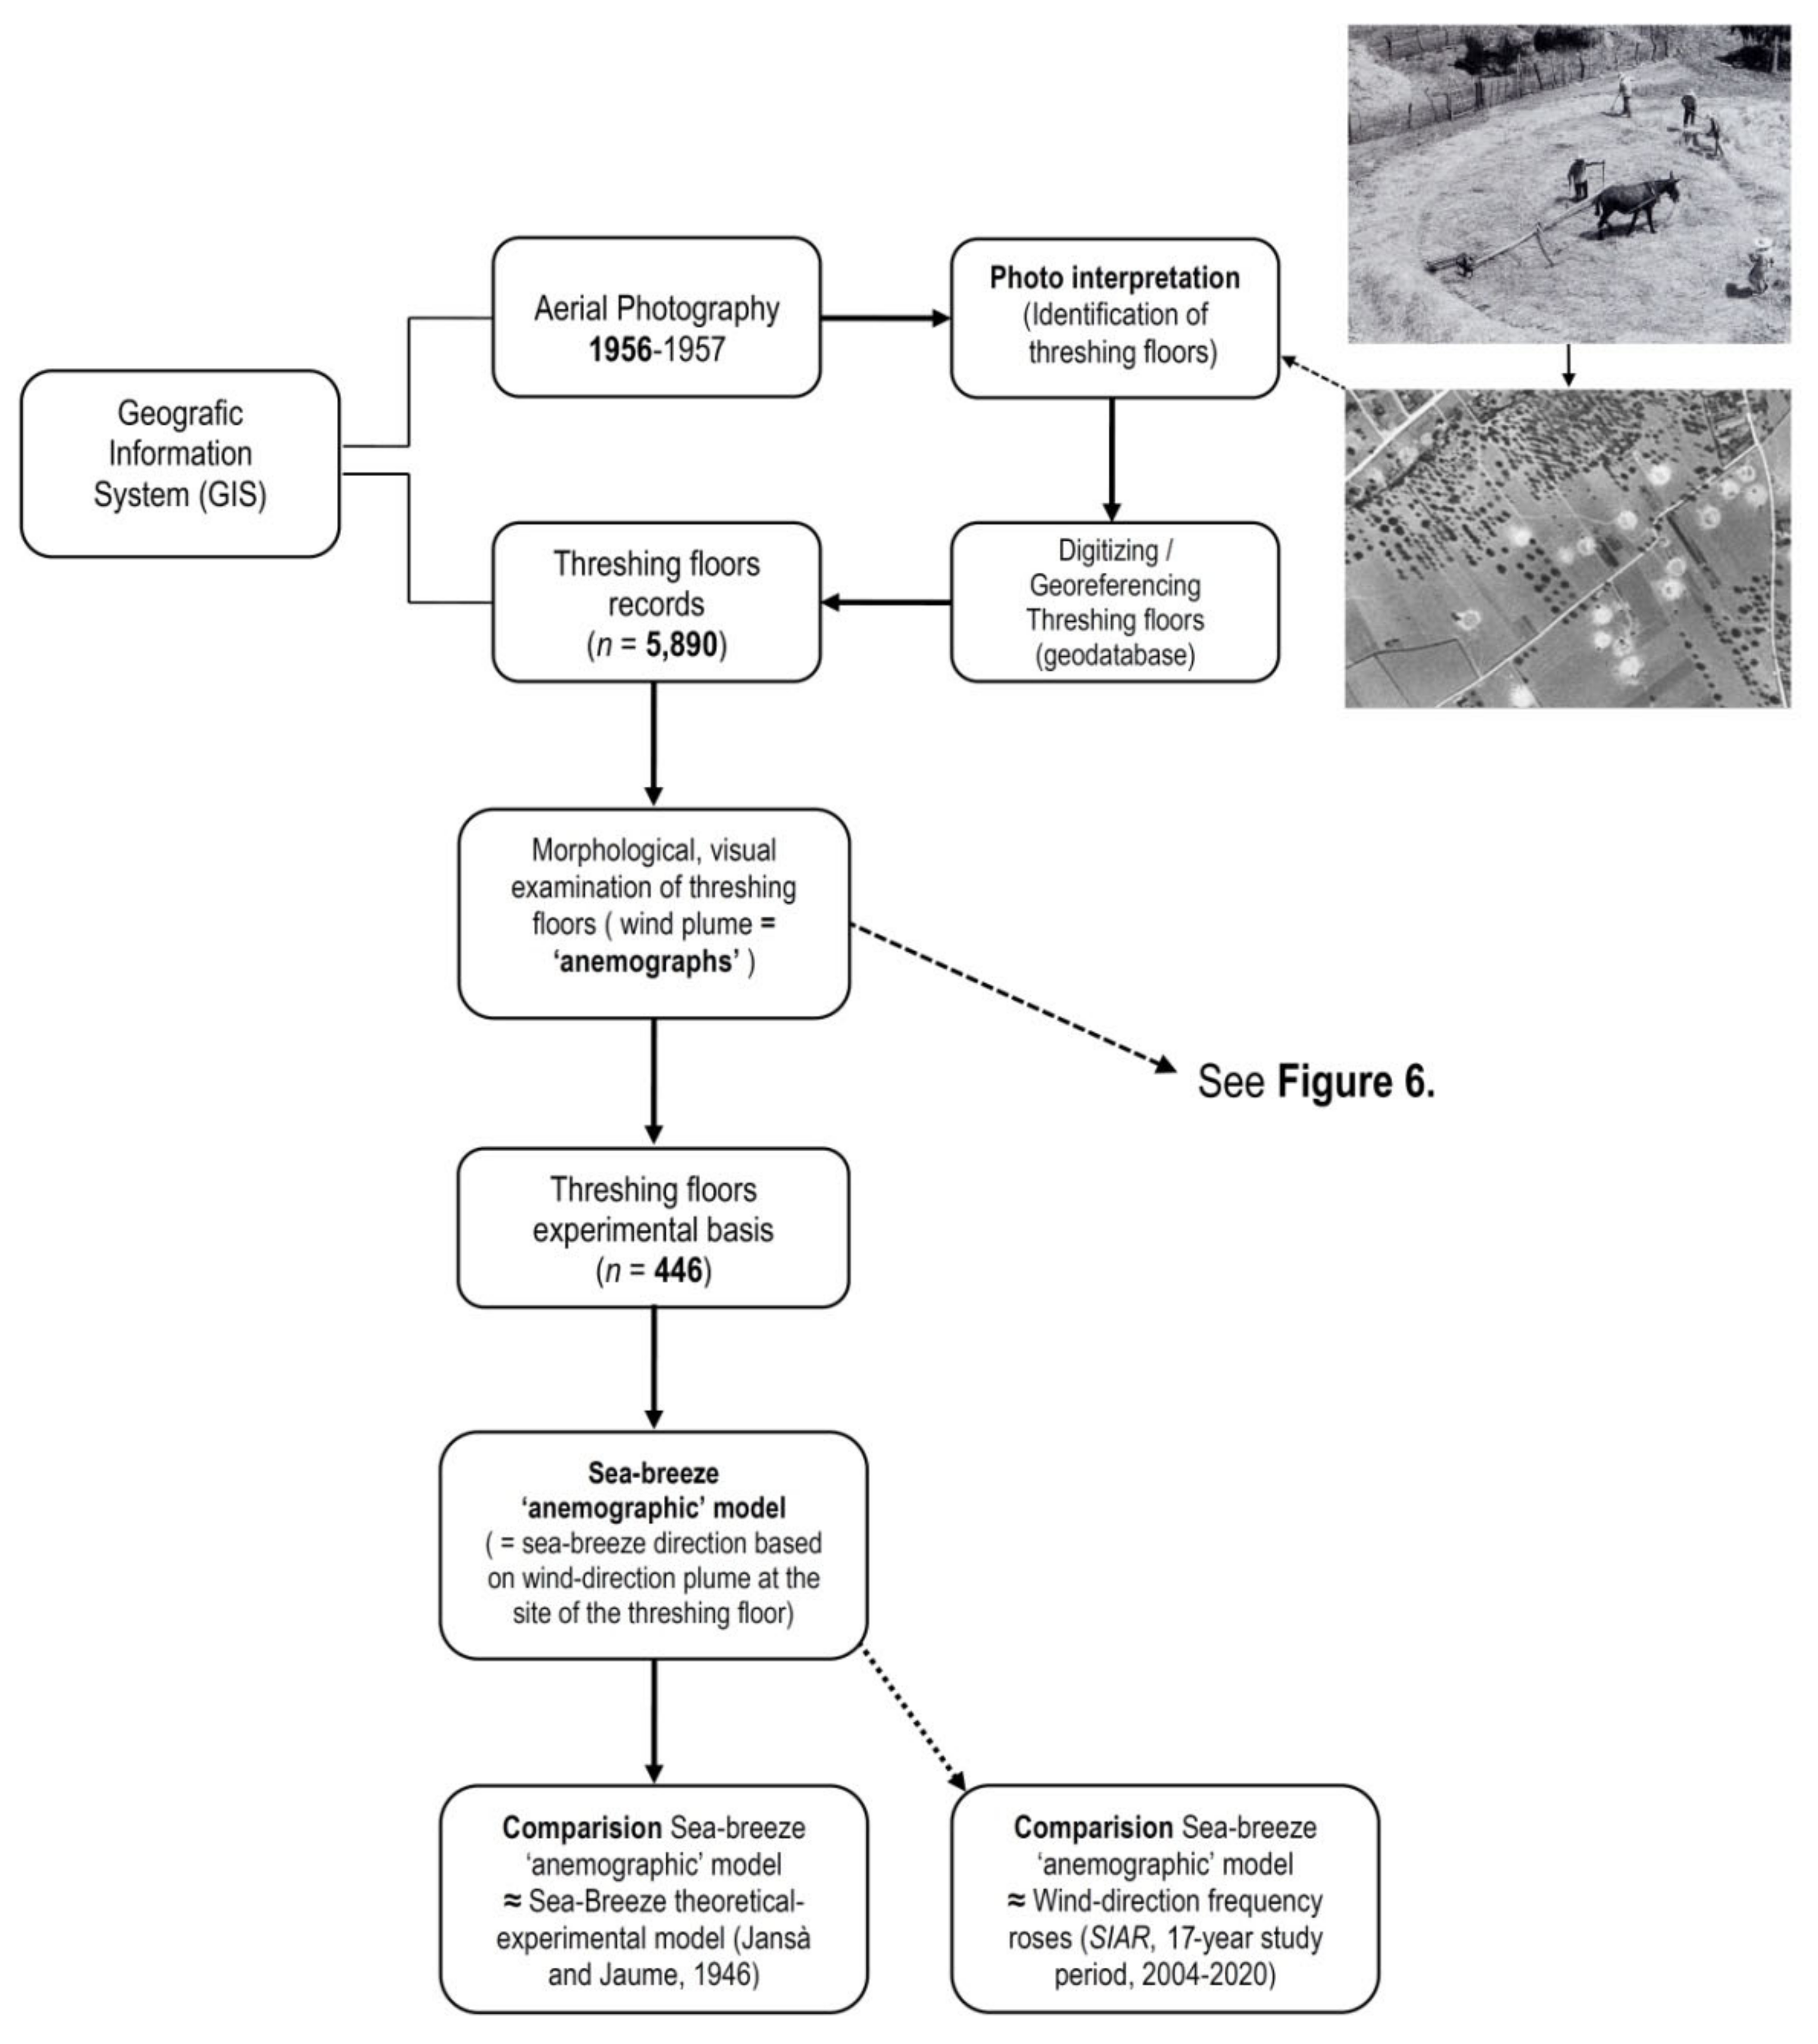
The island of Mallorca is located in a central area of the Western Mediterranean (39° North latitude and 2° East longitude) and is the largest in the Balearic archipelago. It covers an area of 3620 km2 and has a coastline of 676 km. It has two mountain ranges running parallel to to the north-western and south-eastern sides of the island, separated by two subsiding basins that make up the bays of Palma and Alcúdia, located in the south-west and north, respectively (Figure 1). Hence, there are three main large units or morphological regions, corresponding to three administrative regions: First, the Serra de Tramuntana, a mountain range to the west, with abrupt topography, around 90 km long and 15 km wide on average, with a mean height of around 800 m, reaching 1445 m at the puig Major. Second, the Llevant mountain range, in the east of the island parallel to the coast, which is an uneven alignment of mountains not reaching 600 m in height, and totalling around 46 km long by 10 km wide. Third, an extensive central plain, made up of open valleys and small, gentle reliefs connecting the two large bays.
Sea-breezes arise in most places on Earth where there is a land–sea boundary [24]. It is a circulation of air caused by unequal warming of two adjacent surfaces, one sea and the other land, inducing a difference in pressure that leads the colder sea air to move from the coast towards the warmer inland area. The resulting breeze fronts normally develop during the morning and can continue for hours until after dusk. Due to its size and latitudinal location, the island of Mallorca constitutes an ideal space for the establishment of a typical regime of sea-breezes under favorable atmospheric conditions in the Western Mediterranean in summer [25,26,27]. These winds have had and still have great geographical, social and economic significance in Mallorca [28]. They regulate temperatures in the warm season providing relative thermal comfort, and gives origin to a significant summer storm activity over the central areas of the island [29,30]. They condition the practice of sports such as windsurfing, kitesurfing and all types of sailboats in certain coastal spots, because of their wind aptitude for sailing.
Due to their regularity and intensity, sea breezes have also been used as a source of wind energy used in agricultural structures of notable heritage value such as flour windmills and windpumps, as well as for threshing. Although nearly all are derelict or in disrepair, windmills are visually striking in many places of the island [31,32]. As many as 818 old flour windmills [33] and 2445 windpumps have been inventoried, the latter almost all (92.3%) located in the three main areas of intensive agriculture: the plain or basin of Palma in the south, the plain of Sa Pobla-Muro in the north and the plain of Campos in the south.
As a result of its physical insularity, in Mallorca the sea-breezes operate opposite and simultaneously on the different coasts, and penetrate inland, coupled to the terrain, towards inland areas where they typically converge [34,35]. Statistically speaking, breezy days increase from spring onwards and are practically daily in summer, although they can appear in autumn and even in winter, albeit then their frequency and intensity decrease greatly [28,34,36]. The general, theoretical scheme of the spatial behaviour of the sea-breezes in Mallorca considers the island as a square in the inside of which three main sea-breeze flows penetrate and converge from three different coastal origins. This theoretical scheme was empirically demonstrated for the first time by Jansá and Jaume [34] in a pioneering study summarised in Simpson’s benchmark book [37], Sea Breeze and Local Wind.
In this study, the sea-breeze system is represented by a series of maps, qualitative in nature [34], the most outstanding of which is the one of the breeze airflows operating in the island space as a whole (Figure 2). In the absence of a network of anemometric stations, this map was drawn up from the oral information provided by farmers and fishermen on the island, who answered a specifically designed survey with questions regarding the time the breeze appeared, its most frequent direction, and its duration [38]. The map shows a horizontal circulation of sea air blowing landwards from the sea, following the theoretical scheme of perpendicularity to the coasts. The undercurrent of the breeze is dragged along completely coupled to the terrain, and is subject to the constraints of the relief even in the case of minor topographic features. Depending on the orientation of the coasts, the winds converge radially over the island, clockwise: north-east in the bays of Pollença and Alcúdia, south-east in the Llevant coast, and south and south-west between the cape of Ses Salines and the islet of Dragonera. On the northwestern coast of the island, the Serra de Tramuntana mountain range acts as an orographic screen that prevents any effective development of the breeze.
The aforementioned study not only constitutes the inaugural research describing the fundamental physical and spatial features of the sea-breeze system in Mallorca, but also all subsequent research studies refer back to it. The model has been noted by numerical simulations such as those tested by Ramis et al. [39], and Ramis and Romero [40]. Sea-breeze determinations are of such magnitude in Mallorca that the phenomenon has become patent in the Catalan dialect spoken in the island, through the popular use of a proper noun describing it: the word embat—an exemplary case of eolonymy, i.e., the proper name given to winds local to specific regions.

3. Methodology

The non-instrumental reconstruction of the sea-breeze regime in Mallorca using the ethnographic proxy of threshing floors was performed through a method of work consisting of three main successive phases. Firstly, data gathering by the georeferencing of the threshing floors based on an aerial orthophotograph from 1956, using simple photointerpretation techniques, and their integration in a Geographic Information System (GIS). All the spatial data treatment was undertaken in ArcGIS 10.x with the use of the ESRI File Geodatabase. ArcGIS was also used to design and display the result maps. Secondly, the morphological examination of the threshing floors selected in order to determine wind direction at the place where they were located. Thirdly, the preparation of a wind map based on the above analysis, and its subsequent comparison with the canonical model established by Jansá and Jaume [34]. The flow diagram of these three phases is shown in Figure 3.

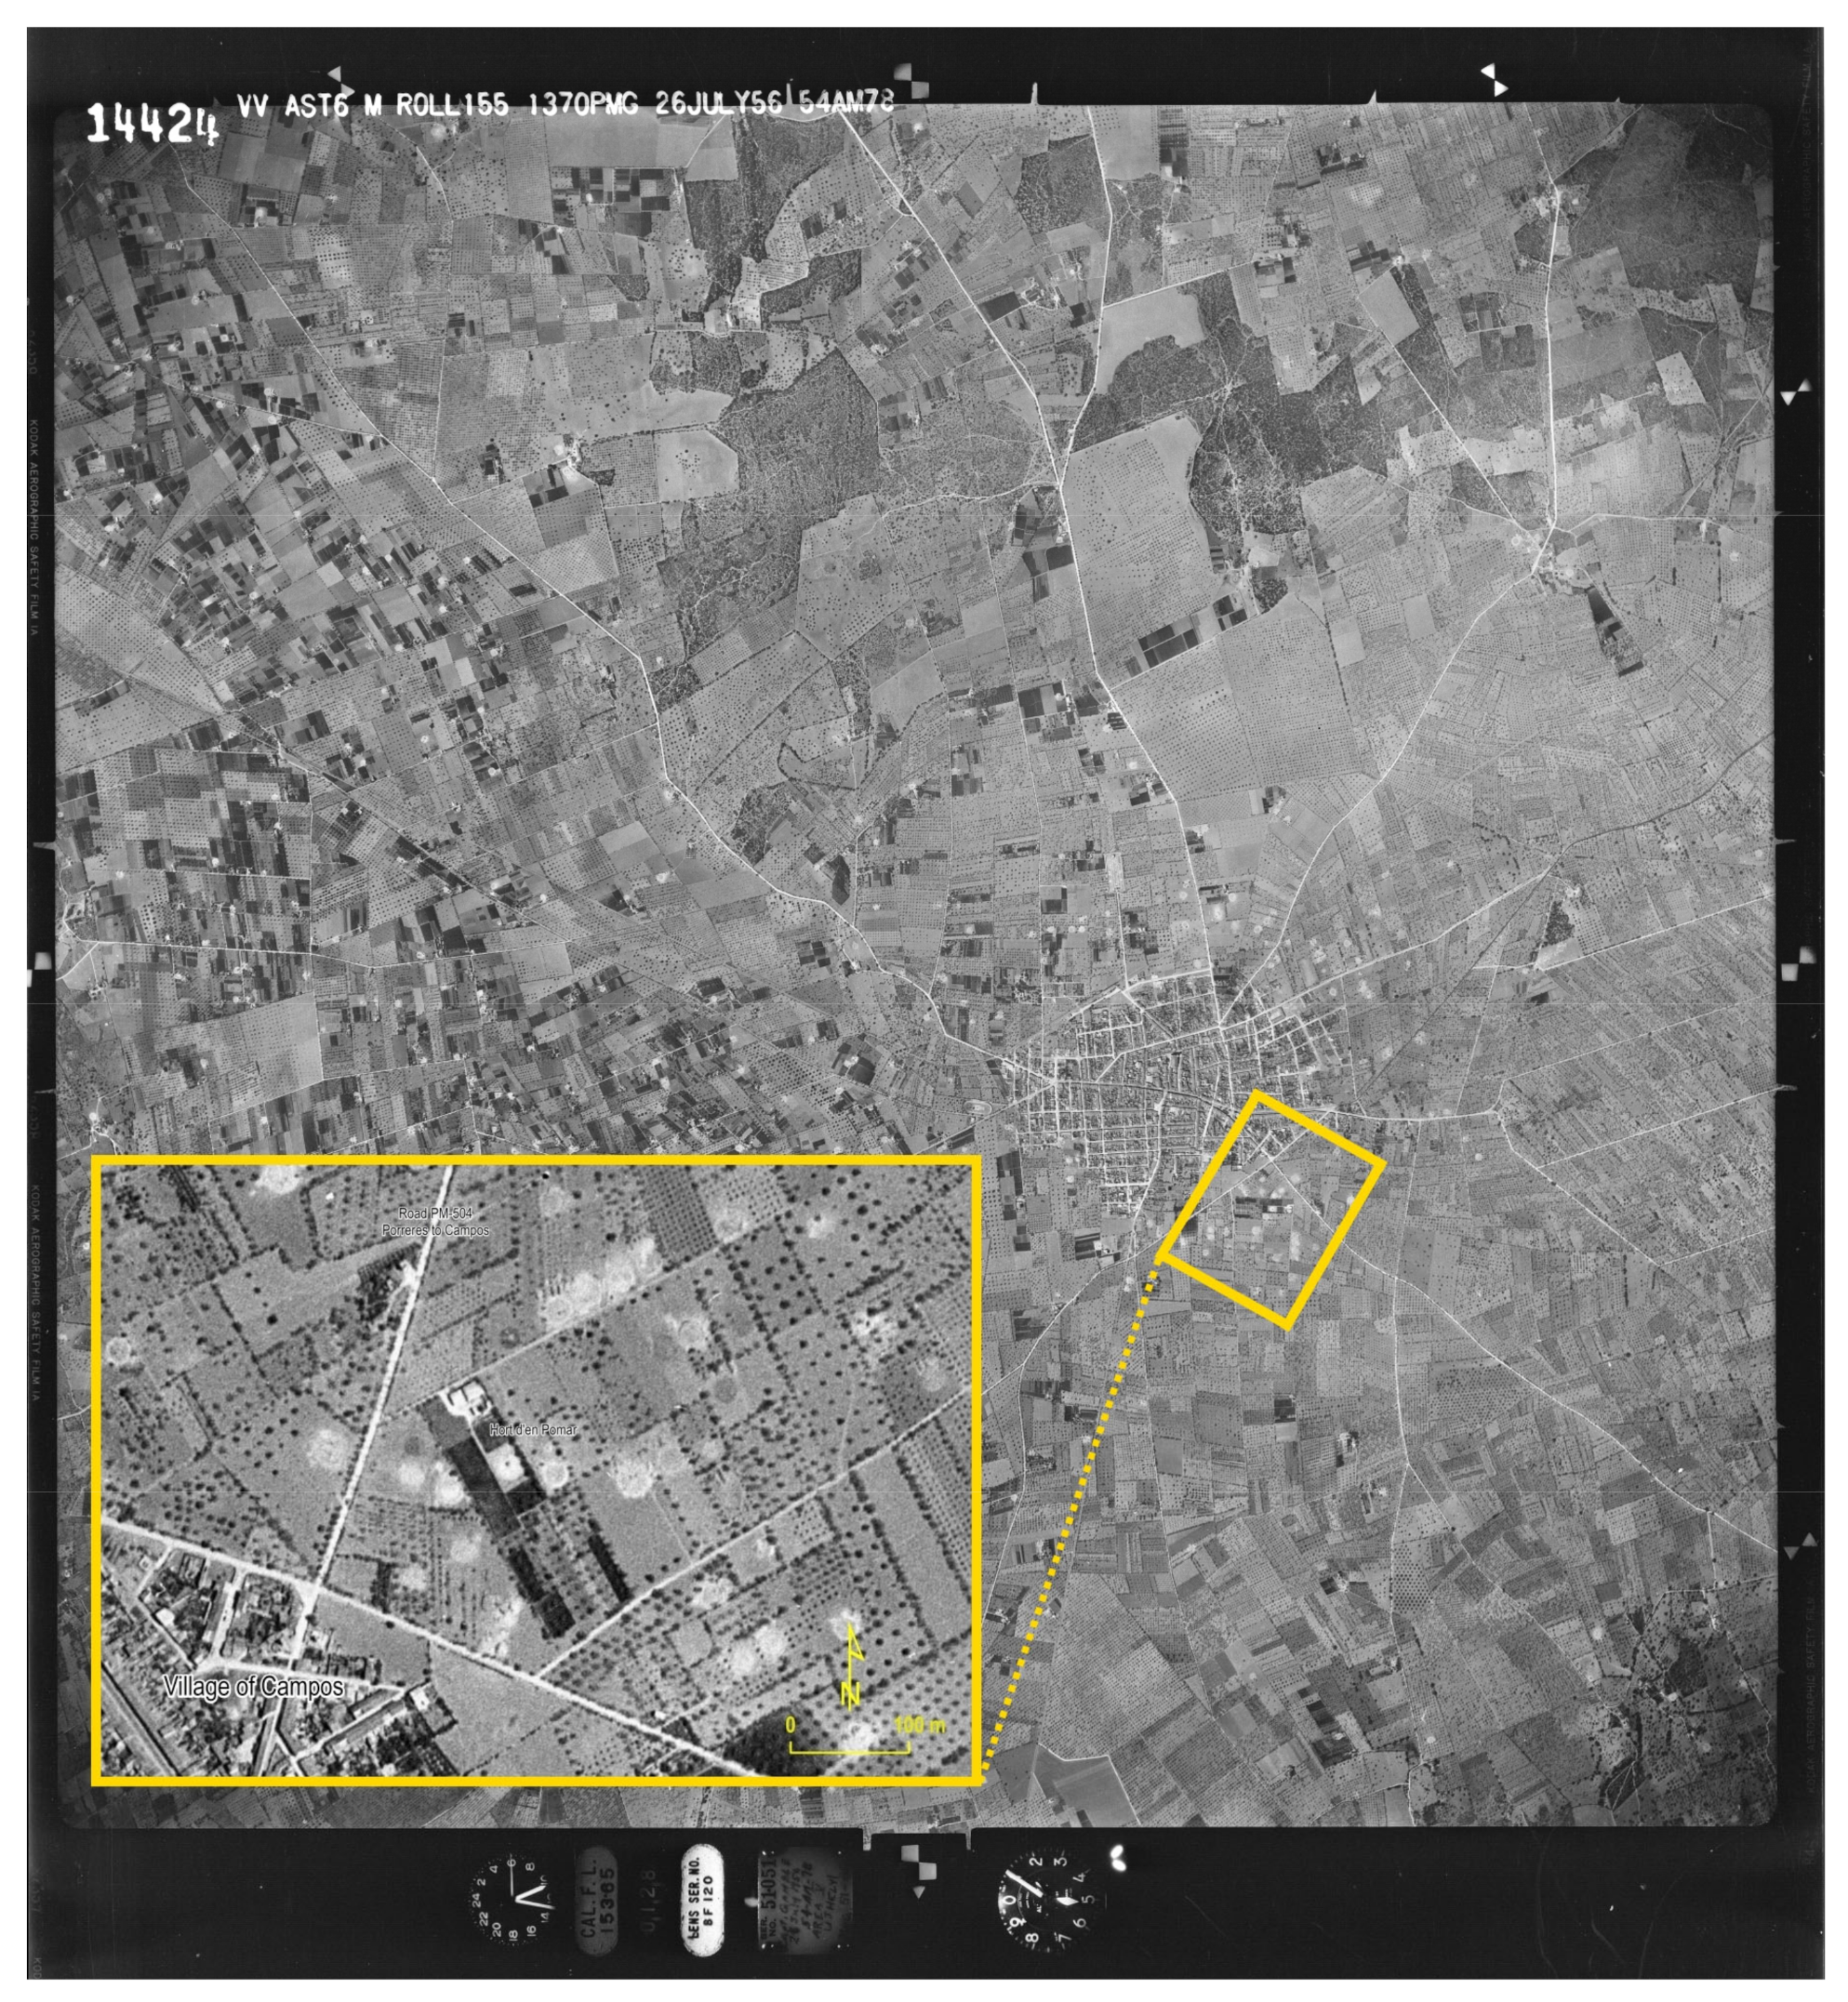
3.1. Aerial Photograph from 1956: Photointerpretation for Climatological Purposes

The American Society of Photogrammetry defines imagery interpretation as the act of examining photographic images for the purpose of identifying objects and judging their significance [41]. Aerial images reproduce the geographic and economic reality of a territory with relative accuracy. Between March 1956 and September 1957, the United States Army Map Service, with the collaboration of the United States Army Air Force (USAAF), designed and carried out a photogrammetric flight of the Spanish territory—including the Canary Islands and the Spanish lands in North Africa. This flight, known in Spain as “Serie B” or “American flight” [42,43], was preceded by other Anglo-American flights of the same characteristics carried out in Western Europe between 1945 and 1946—Project Casey Jones or, in Spain, “Serie A”. The 1956–1957 flight was digitised by the Centro Geográfico del Ejército (Spanish Army Geographic Centre) (CEGET) and is available for consultation in the Spanish Digital Photo Library of the Centro Nacional de Información Geográfica (National Centre for Geographic Information). The aerial photographs have been photogrammetrically restored and transformed into a complete digital orthophotograph of Spanish territory with a spatial resolution of 50 cm per pixel. “Serie B” was the first complete photogrammetric coverage of the Spanish territory, both peninsular and insular, with stereoscopic overlay. Before 2010 the public consultation of this flight was through paper reproductions of the original photograms. Since 9 February 2010, a continuous digital image has been available, created from 586 black and white images in .tiff format. Figure 4 shows photogram number 14,424 corresponding to the aerial flight of 26 July 1956, with the corresponding marginal information of the altimeter, clock, lens serial number (BF 120), focal length and film type (Kodak Aerographic Safety Film IA).
Because of the period in which they were taken, these photos provide a visual approximation of the historical-geographical reality of the mid-20th century, when in many regions of the world the transformations brought about by changes in the tertiary sector of the economy was barely beginning. In territories such as Mallorca, the secular predominance of the primary sector lasted until the first half of the last century, in such a way that the aerial photographs of those years depict a whole era and series of agricultural activities that have now disappeared. In order to maintain the constants of agricultural production, specifically the production of cereals, it was necessary to couple and synchronise the human organisation of agricultural work with the climatic conditions of the place—rain, temperature, wind. This is why people who have lived in rural areas possess empirical knowledge of the weather, as well as of the geographical and topographical characteristics of their place of work and habitat.
In the case of windmills and threshing floors, both features made up a fundamental part of the cereal production process, and both constitute significant entities of the former island agricultural space that are capable of being interpreted in terms of climate and, particularly, with regard to wind. For the purposes of this study, the aerial photographs of 1956 and 1957 were used to locate and georeference the threshing floors in Mallorca and, with these, reconstruct the spatial arrangement of the sea-breezes in the island.
The precise dates of the stills examined are the following: 23, 24, 25, 26, and 29 July, and 14 September (the latter consulted only as a supplement and exceptionally). These dates are ideal for the visual location of the threshing floors, as, with the one-off exception of September, these dates are ideal for the visual location of the threshing floors, as, with the one-off exception of September, during the second half of July threshing and winnowing was at a very advanced stage. In the traditional agricultural calendar of Mallorca, 25 July (the feast day of St. James) was considered the key date from which farmers should finish threshing to start harvesting almonds. Usually the threshing began around 29 June. This means that on the days indicated the threshing floors were fully operational, with the resulting plume of dust and chaff generated during the four weeks of threshing, deposited at the side of the threshing floors. These circumstances enabled their identification and correct georeferencing. In the aerial photographs examined, the threshing floors can be distinguished because they have the appearance of a small, white circle, which contrasts with their immediate surroundings (Figure 4). In order to ensure the discretisation of these threshing floors and their subsequent morphological characterisation, the photographs were visualised at scales between 1:500 and 1:2.500.

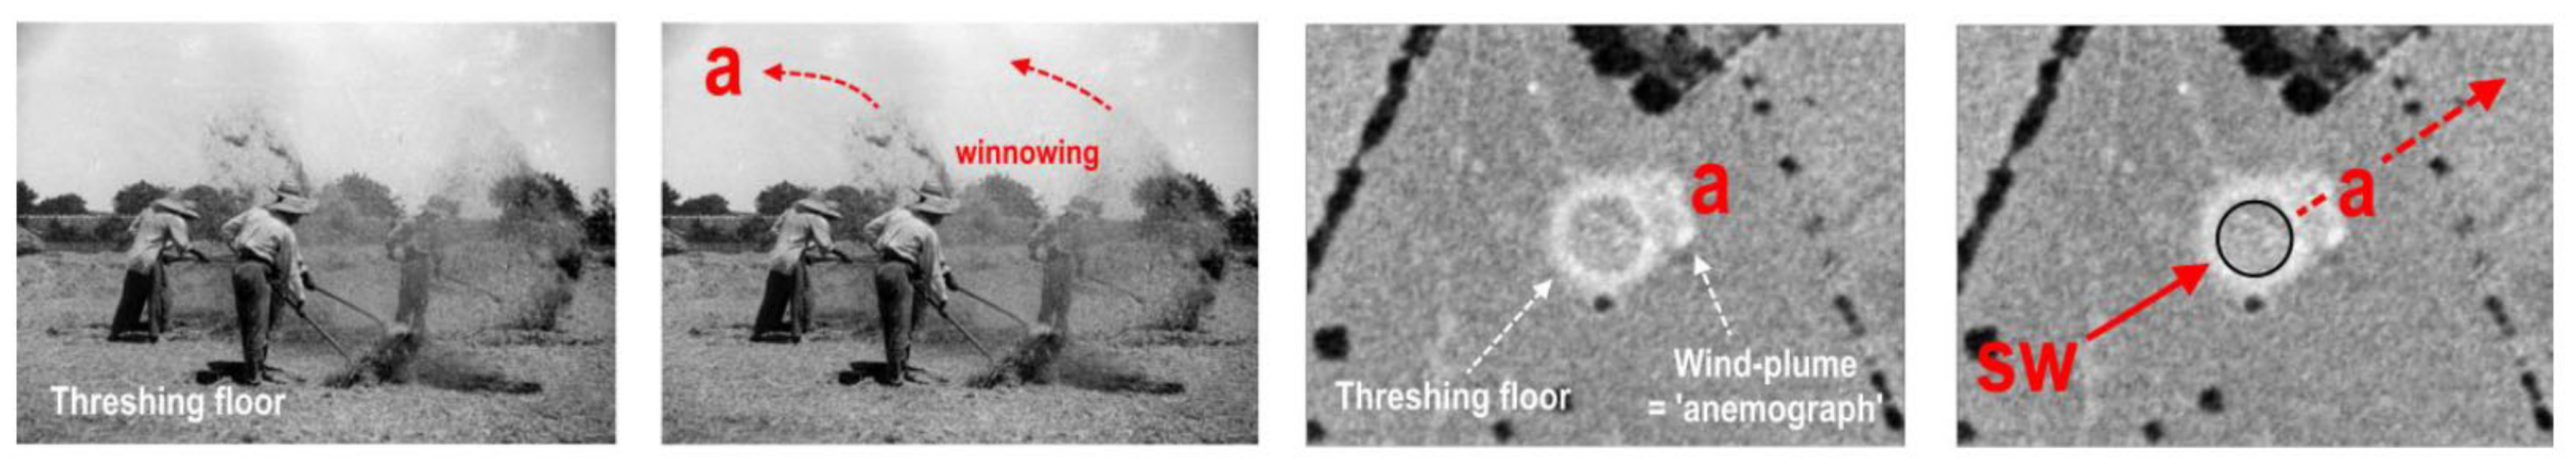
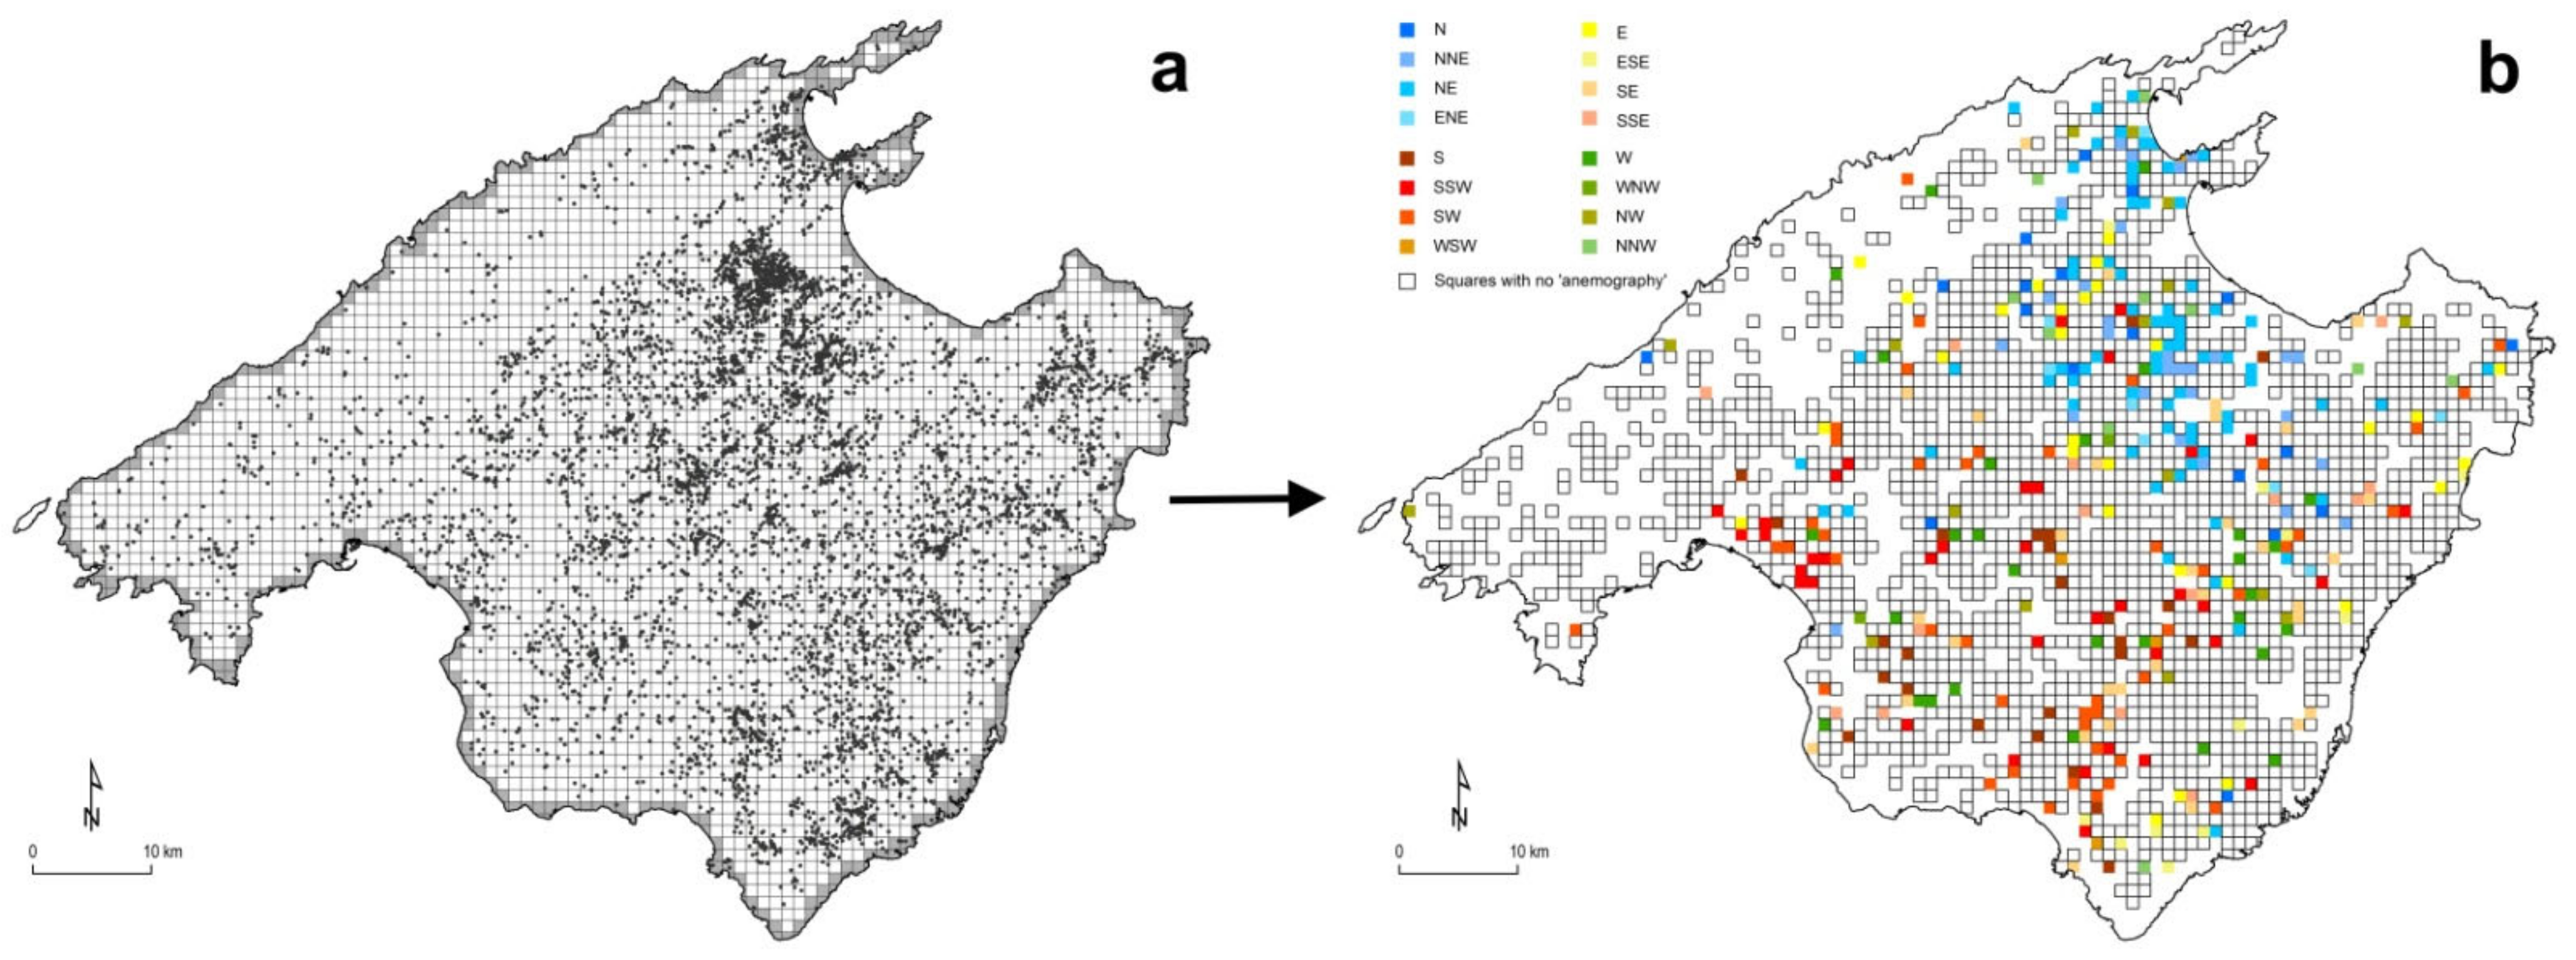
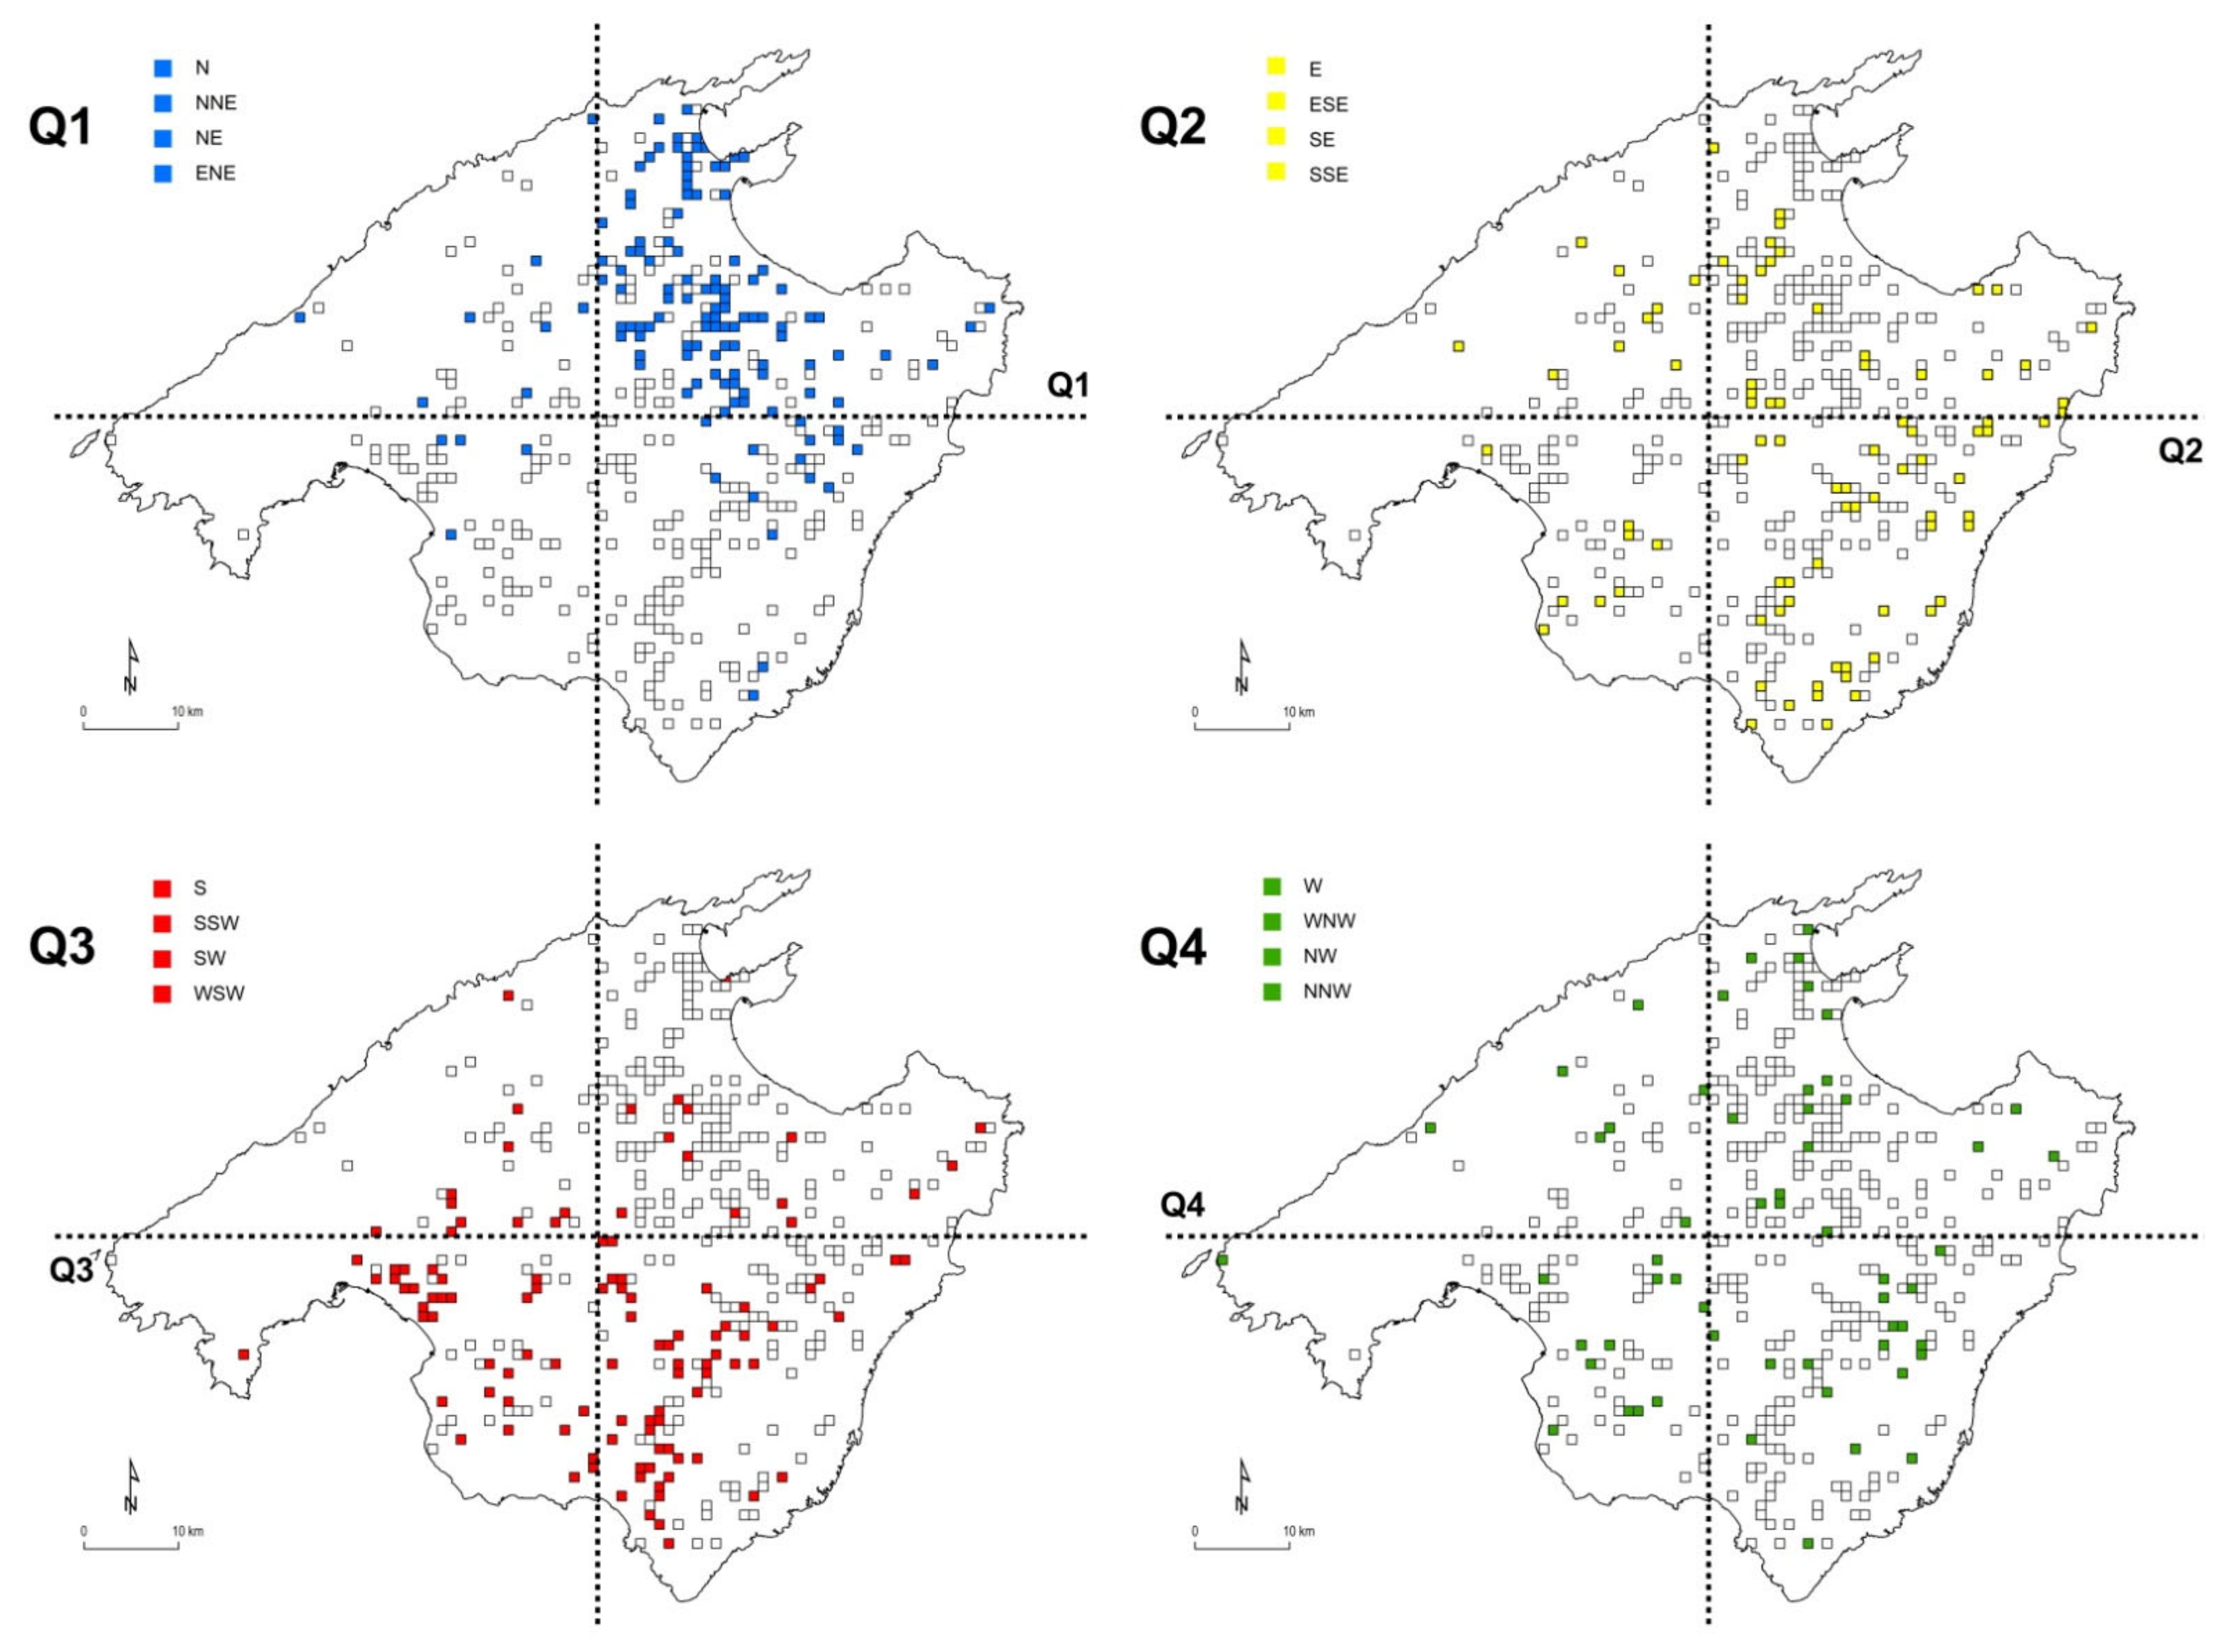
3.2. Threshing Floors as a Sea-Breeze Proxy

In Mallorca and in general throughout the Mediterranean region, wind has played a decisive role in the agricultural activities devoted to the harvesting of wheat and other cereal grains, and their subsequent processing [44]. To this end, the Mallorcan countryside became populated by two types of constructions specifically devoted to cereals: windmills and threshing floors. The main factor related to their location and territorial distribution is the quantity and quality of the wind resources available. This resource is provided, basically, by sea-breezes in such a way that their frequency and regularity have been well exploited historically to move millstones and to separate the grain from the chaff in threshing floors.
Threshing floors are small outdoor spaces, flat and circular, around 20 m in diameter, where the operation of threshing the ears of corn was carried out along with their subsequent winnowing—the operation whereby the threshed straw is separated from the grain. This operation involves throwing the mixture of chaff and grain into the air so that the wind can blow away the lighter chaff, while the grains, heavier, fall and are gathered inside the threshing floor (Figure 5).
Wind is a determining factor because it enables the grain to be separated form the chaff effectively. Thus, threshing floors are always located in a topographically well-ventilated spot to maximize their performance and aid human work. This wind requirement was guaranteed towards mid-day, because of the almost constant presence of the summer breezes in the place; hence, for carrying out agricultural tasks, farmers relied on the seasonal precision of the Mediterranean climate (hot, stable weather in summer) and, of course, the diurnal rhythm of the breezes. It should also be taken into account that summer is the time of the year in which, in Mallorca, sea breezes develop best, since a large number of hours of sunshine coincide with situations of low or no atmospheric pressure gradient on a synoptic scale, in which there are therefore no general winds that could disturb the activation of the breeze system. June, July and August record an average of 973 h of sunshine per year, according to the normal climatological values provided by the State Meteorological Agency, AEMET.
To verify the climatic suitability of July 1956 for the formation of breezes, surface atmospheric circulation over the western Mediterranean area during that month and that year was analyzed using the Jenkinson and Collison automatic method of weather type classification [46,47,48]. The results indicate that the atmospheric circulation conditions were totally favorable to the formation of sea breezes on 24 days (77.4% of the days), while only 7 (22.6%) had advective situations that could have inhibited breezes. The most favorable conditions are the undetermined conditions (without baric gradient), which accounted for 51.6% of the days, in addition to the anticyclone or focused cyclonic situations, which accounted for 25.8% of the days.
For the determination of threshing floors as wind proxies, attention must be paid to the morphological examination of each circle and their geometric eccentricity. This visual eccentricity is caused by the relative position occupied on one side of the threshing floor by the plume of dust and chaff that forms when the farmer, with the help of the wind, separates the grain from the chaff, which falls downwind, leaving a characteristic plume on that side. Observed in the aerial photograph, the position of this plume in relation to the 16 cardinal points of typical wind rose constitutes a trace or fossil record of the prevailing wind direction at the site of the threshing floor on the days or weeks of threshing prior to the date on which the aerial photograph was taken. Due to the physical nature of this wind trace, we gave this record the name of “anemograph”. Through this formula, threshing floors turn out to be the ethnographic equivalent of an anemograph.
The method of visual identification of a threshing floor and the subsequent deduction of the direction of the prevailing wind in the place through its anemograph is illustrated in the sequence of images in Figure 6. In turn, the set of images in Figure 7 shows the 16 possible anemographs of a threshing floor, corresponding to one of the 16 cardinal points separated by sexagesimal angles of 22.5°: N, NNE, NE, ENE, E, ESE, SE, SSE, S, SSW, SW, WSW, W, WNW, NW, and NNW. With the different anemographs added to and integrated in a single map, the result is a historical reconstruction of the spatial arrangement of the summer wind in the island as a whole, and, by extension, of the underlying sea-breeze regime. Figure 8 shows two examples of threshing floors located on the outskirts of two rural villages (Sant Llorenç and Ariany) and their corresponding anemographic mark indicating the predominant direction of the sea breeze at the location of the threshing floor.
This methodology can only be used optimally if there has been no significant rainfall during the threshing period, since rain has the effect of washing away the dust and straw plume deposited off to one side of the threshing floor, preventing its use as an indicator of the prevailing wind direction. Climate records of the 75 official pluviometric observatories operating in 1956 have been analyzed, showing that July of that year was practically dry in terms of rainfall, with the specific exception of 22, 24 and 27 July. On the 22 July there was a storm that affected sectors of the western half of the island and the south, while on 24 and 27 July there were two episodes of low rainfall, which affected only two observatories. Consequently, the areas where rainfall presumably affected the quality of the anomographs (if we consider as such the areas where it rained more than 10 mm) are territorially very small.
To verify whether this hypothesis was fulfilled, the wind directions indicated at each of the 466 threshing floors (anemographic model) were compared to the theoretical-experimental model of the sea-breezes established by Jansá and Jaume [34] (Figure 2), as well as the wind direction frequency roses corresponding to five automatic weather stations, located at some point in the four quadrants considered. These wind frequency roses were drawn up with the wind direction data from the agro-climatic stations of the Sistema de Información Agroclimática para el Regadío (Agro-climatic Information System for Irrigation, SIAR), implemented by the Ministry of Agriculture, Fisheries and Food of the Government of Spain. The wind roses correspond to the mean frequencies of the daytime wind direction from five stations in Mallorca: IB02-Inca, IB03-Manacor, IB04-Son Ferriol, IB05-Felanitx and IB06-Sa Pobla. In all these roses, a marked diurnal wind cycle can be observed, many of which have an axial symmetry, with a generally southwest-northeast axis, which can be interpreted as a cause of the effects of the day/night alternation that coincides in a typical land-sea and sea-land coastal breeze regime.
By rotating the wind frequency rose so that the direction from which the wind is blowing becomes the direction to which the wind is blowing, and by overlaying the rotated rose on a threshing floor (Figure 9), allows us to confirm the coincidence between the wind direction recorded by an automatic weather station and the direction of the wind-plume over the threshing floor. This shows that we can indeed use threshing floors as an indicator of prevailing wind direction, i.e., as a wind-proxy (sea breeze), and ultimately shows the accuracy of our method.

4. Results and Analysis

The method proposed first obtained a set of georeferenced data of the ancient threshing floors in Mallorca in vector format. This set of data is made up of 5890 units, representing an average density of 1.63 threshing floors/km2. Their distribution throughout the island space is shown in the map in Figure 10, which uses as the basemap the same mosaic of aerial photographs from 1956–1957 employed for the georeferencing. To enable subsequent analysis, the threshing floors were placed on a grid dividing the island into squares of 1000 × 1000 m, in which each square indicates the location of at least one threshing floor (Figure 11a). Then, for each circle, it was checked whether or not the expected eccentricity existed, caused by the plume of dust and chaff downwind of the threshing floor. This verification made it possible to isolate the units in which this plume can effectively be observed, therefore making it possible to determine the direction of the breeze at each site. There are 446 threshing floors that meet these conditions (7.6% of the total). Figure 11b shows this experimental basis of threshing floors finally used as sea-breeze proxy, and the resulting ‘anemographic’ wind-directions recorded for each threshing floor.
Although there is a limited number of threshing floors suitable for deducing the direction of the breeze at each site, their territorial distribution is sufficiently uniform so as to enable the reconstruction of the spatial arrangement of the summer breezes in the island as a whole. This suitability refers to two aspects: on the one hand, to the quality of the radiometric contrast of the circles identified as threshing floors in the aerial photographs examined; and, on the other hand, to the homogeneity of their geographic distribution. It must be taken into account that the anemographic trace of the threshing floors considered has a fossil nature, whose only support is the aerial photograph. In this sense, their study is synchronic because it examines the state of the threshing floors at the time when they were photographed from the air, without taking into account the action of time. This means that, in our study, the cartographic representations of the direction of the sea-breezes must be interpreted in a climatological and statistical, but not a dynamic, sense. Although these maps represent the real state on a specific day, they point towards a representation of the average sea-breeze direction states.
The cartographic representation of the anemographic model shows the spatial distribution of the wind direction at each of the 446 georeferenced sites and, with this, the spatial arrangement of the daytime breezes in the island. According to the model obtained, the breezes blow simultaneously from the different coasts, thereby adopting a multidirectional nature. These different directions are reflected in the 16 distinct colours of the squares representing the location of a threshing floor (Figure 11b). All the colours of the wind rose are represented, but their spatial distribution is unequal.
The wind directions indirectly indicated by the threshing floors do not provide useful climatic information if they are not related to their geographical causes and compared to the real direction of the breeze at each site. In order to do this, the study area was divided into four wind quadrants, whose centre was located in the centroid of the irregular polygon making up the island (Figure 12). Subsequently, an analysis was performed of the relationship of concordance between the ‘anemographic’ directions indicated by the threshing floors and the quadrant Q in which these threshing floors are located. The starting hypothesis was that the ‘anemographic’ direction adopted by the breeze at each threshing floor must coincide with the theoretical direction adopted by the breeze in each quadrant. This hypothesis has been tested and its results are discussed in the following sections.

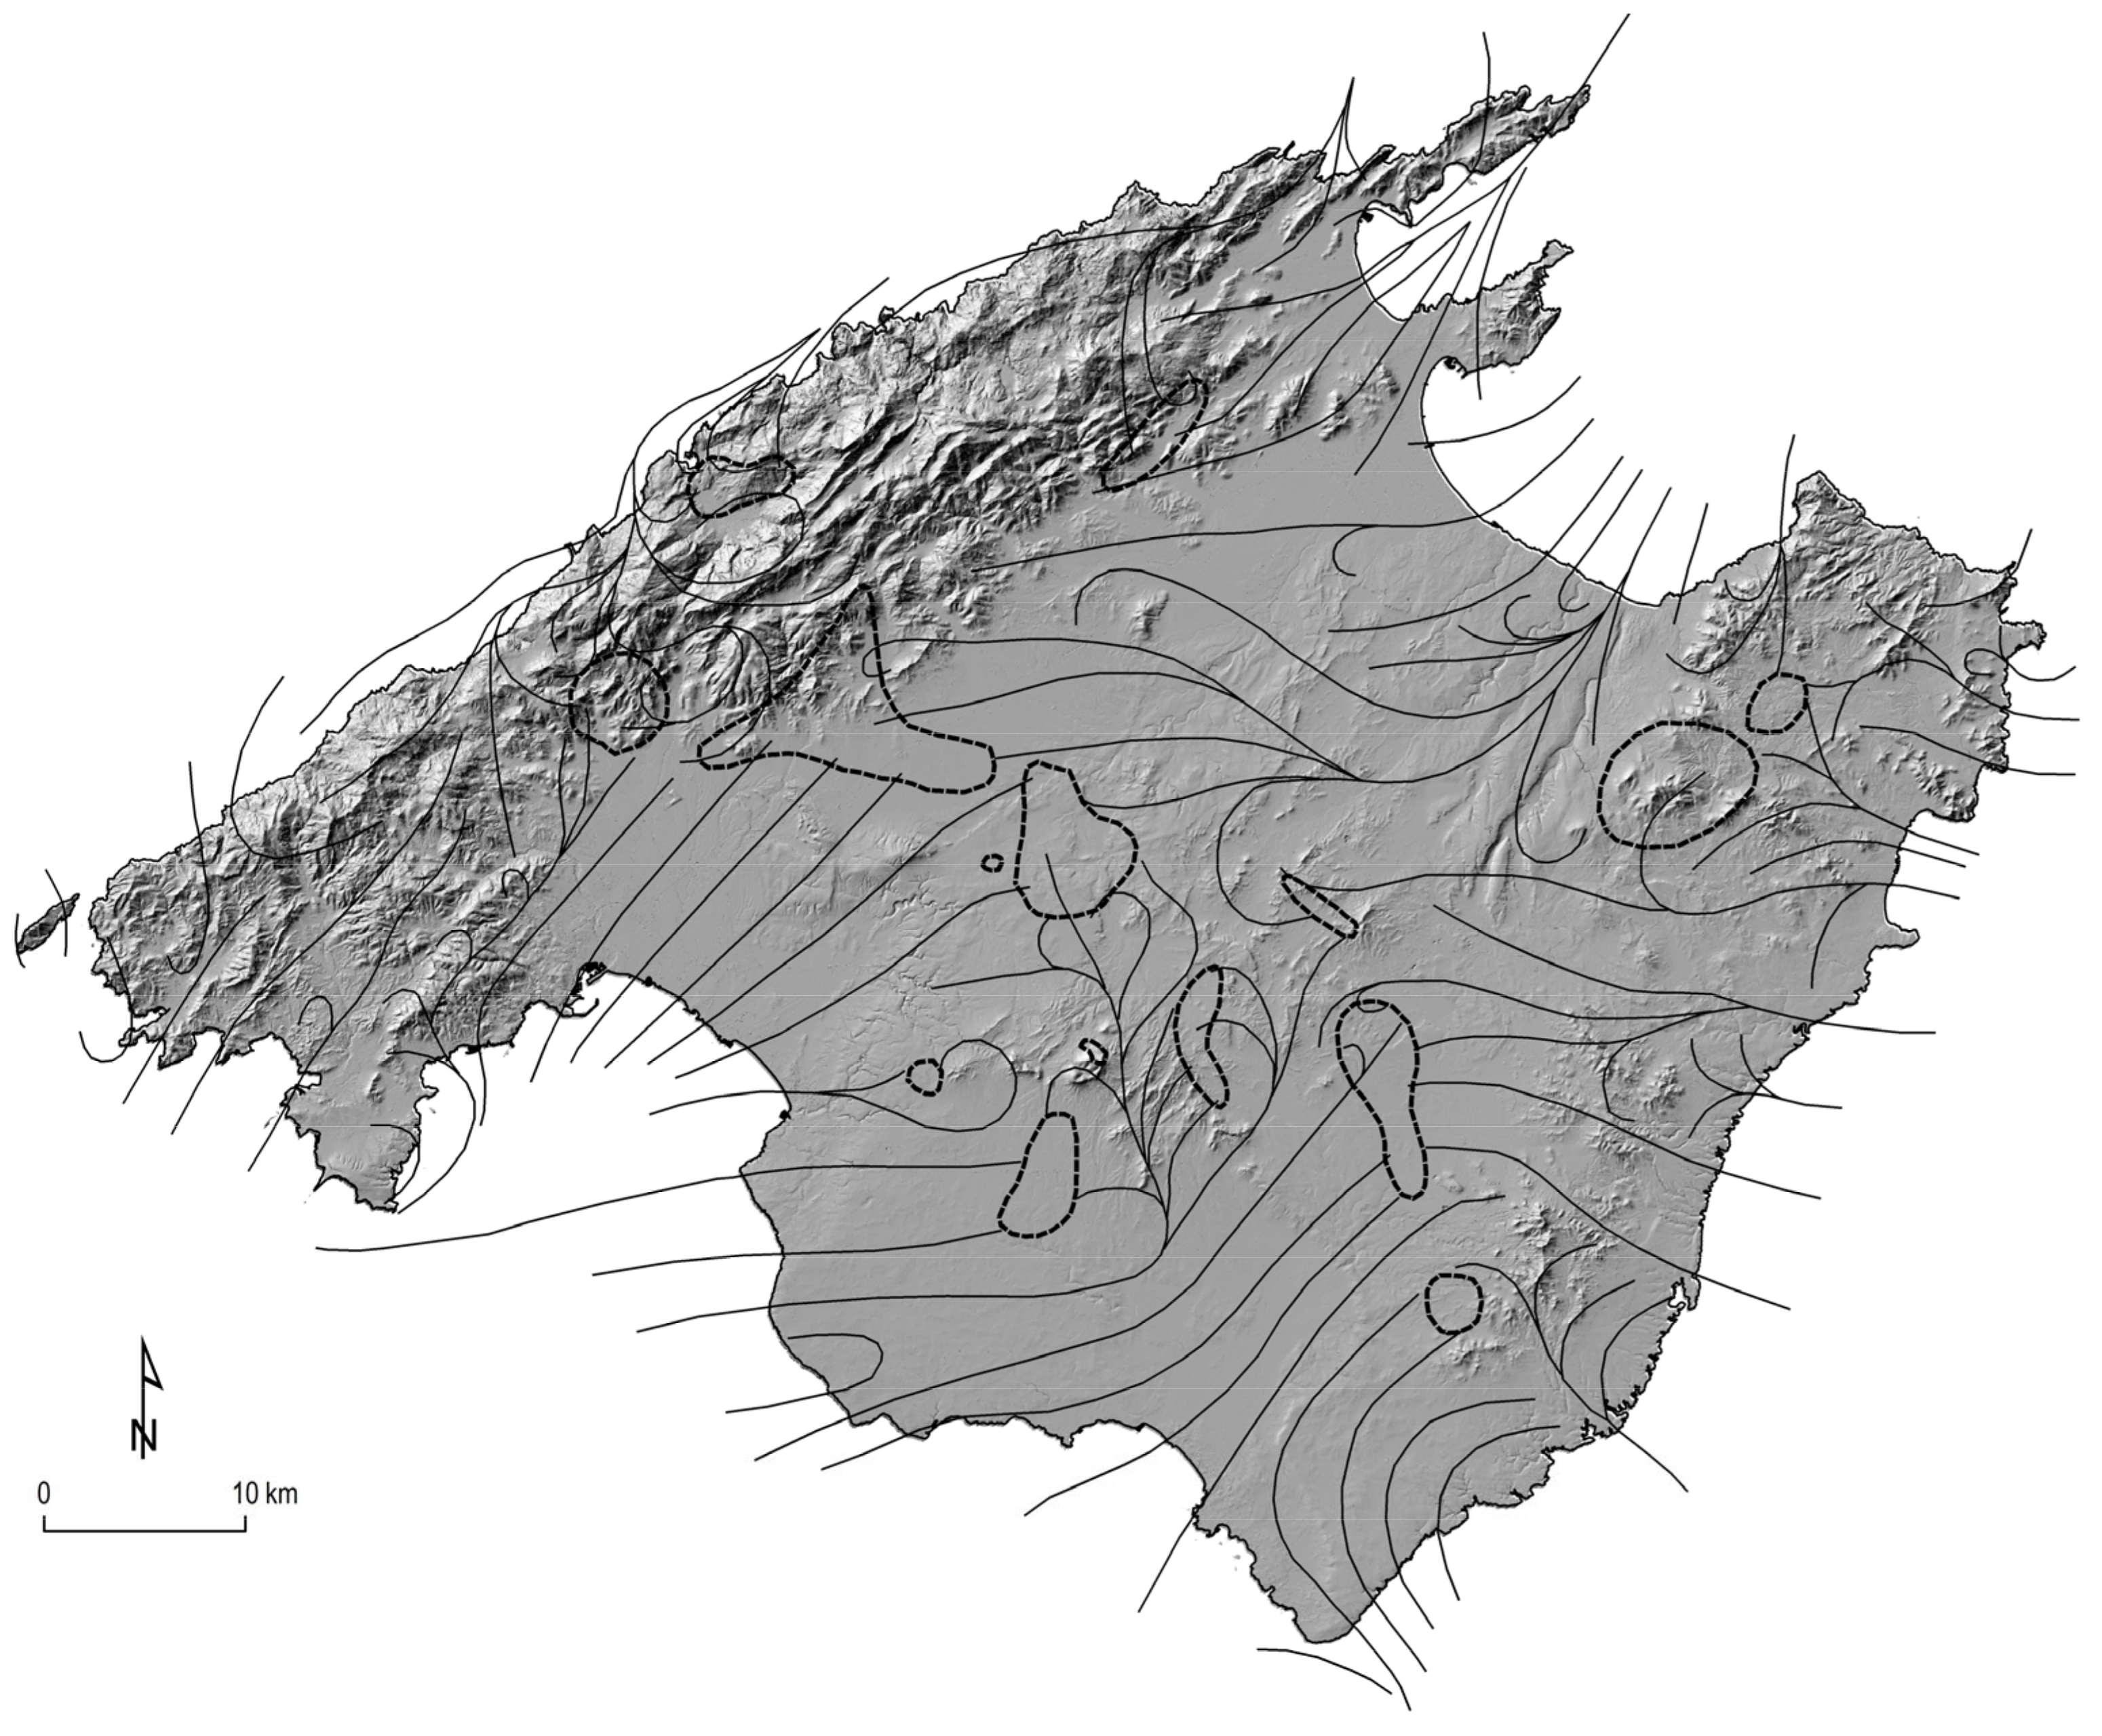
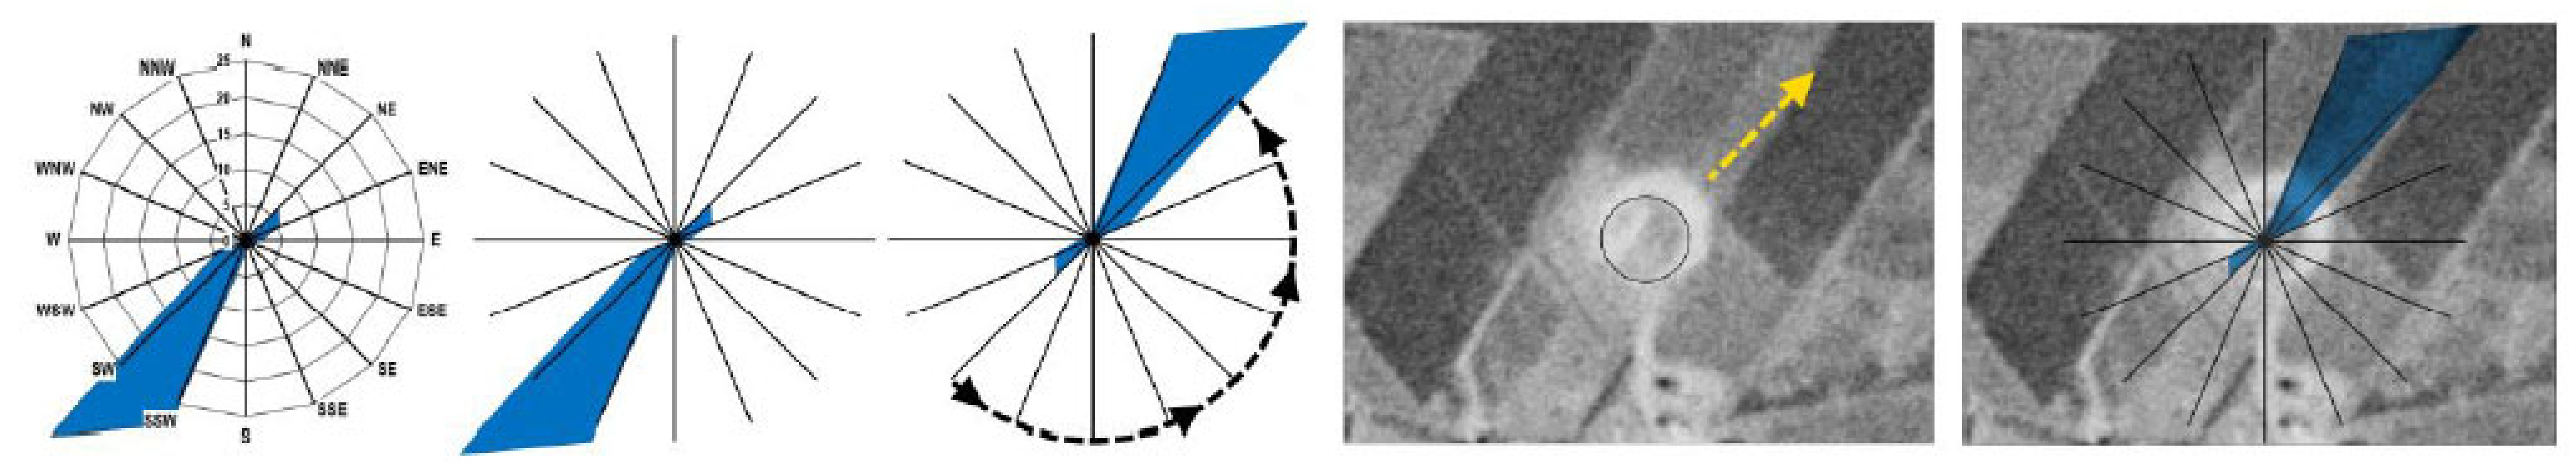
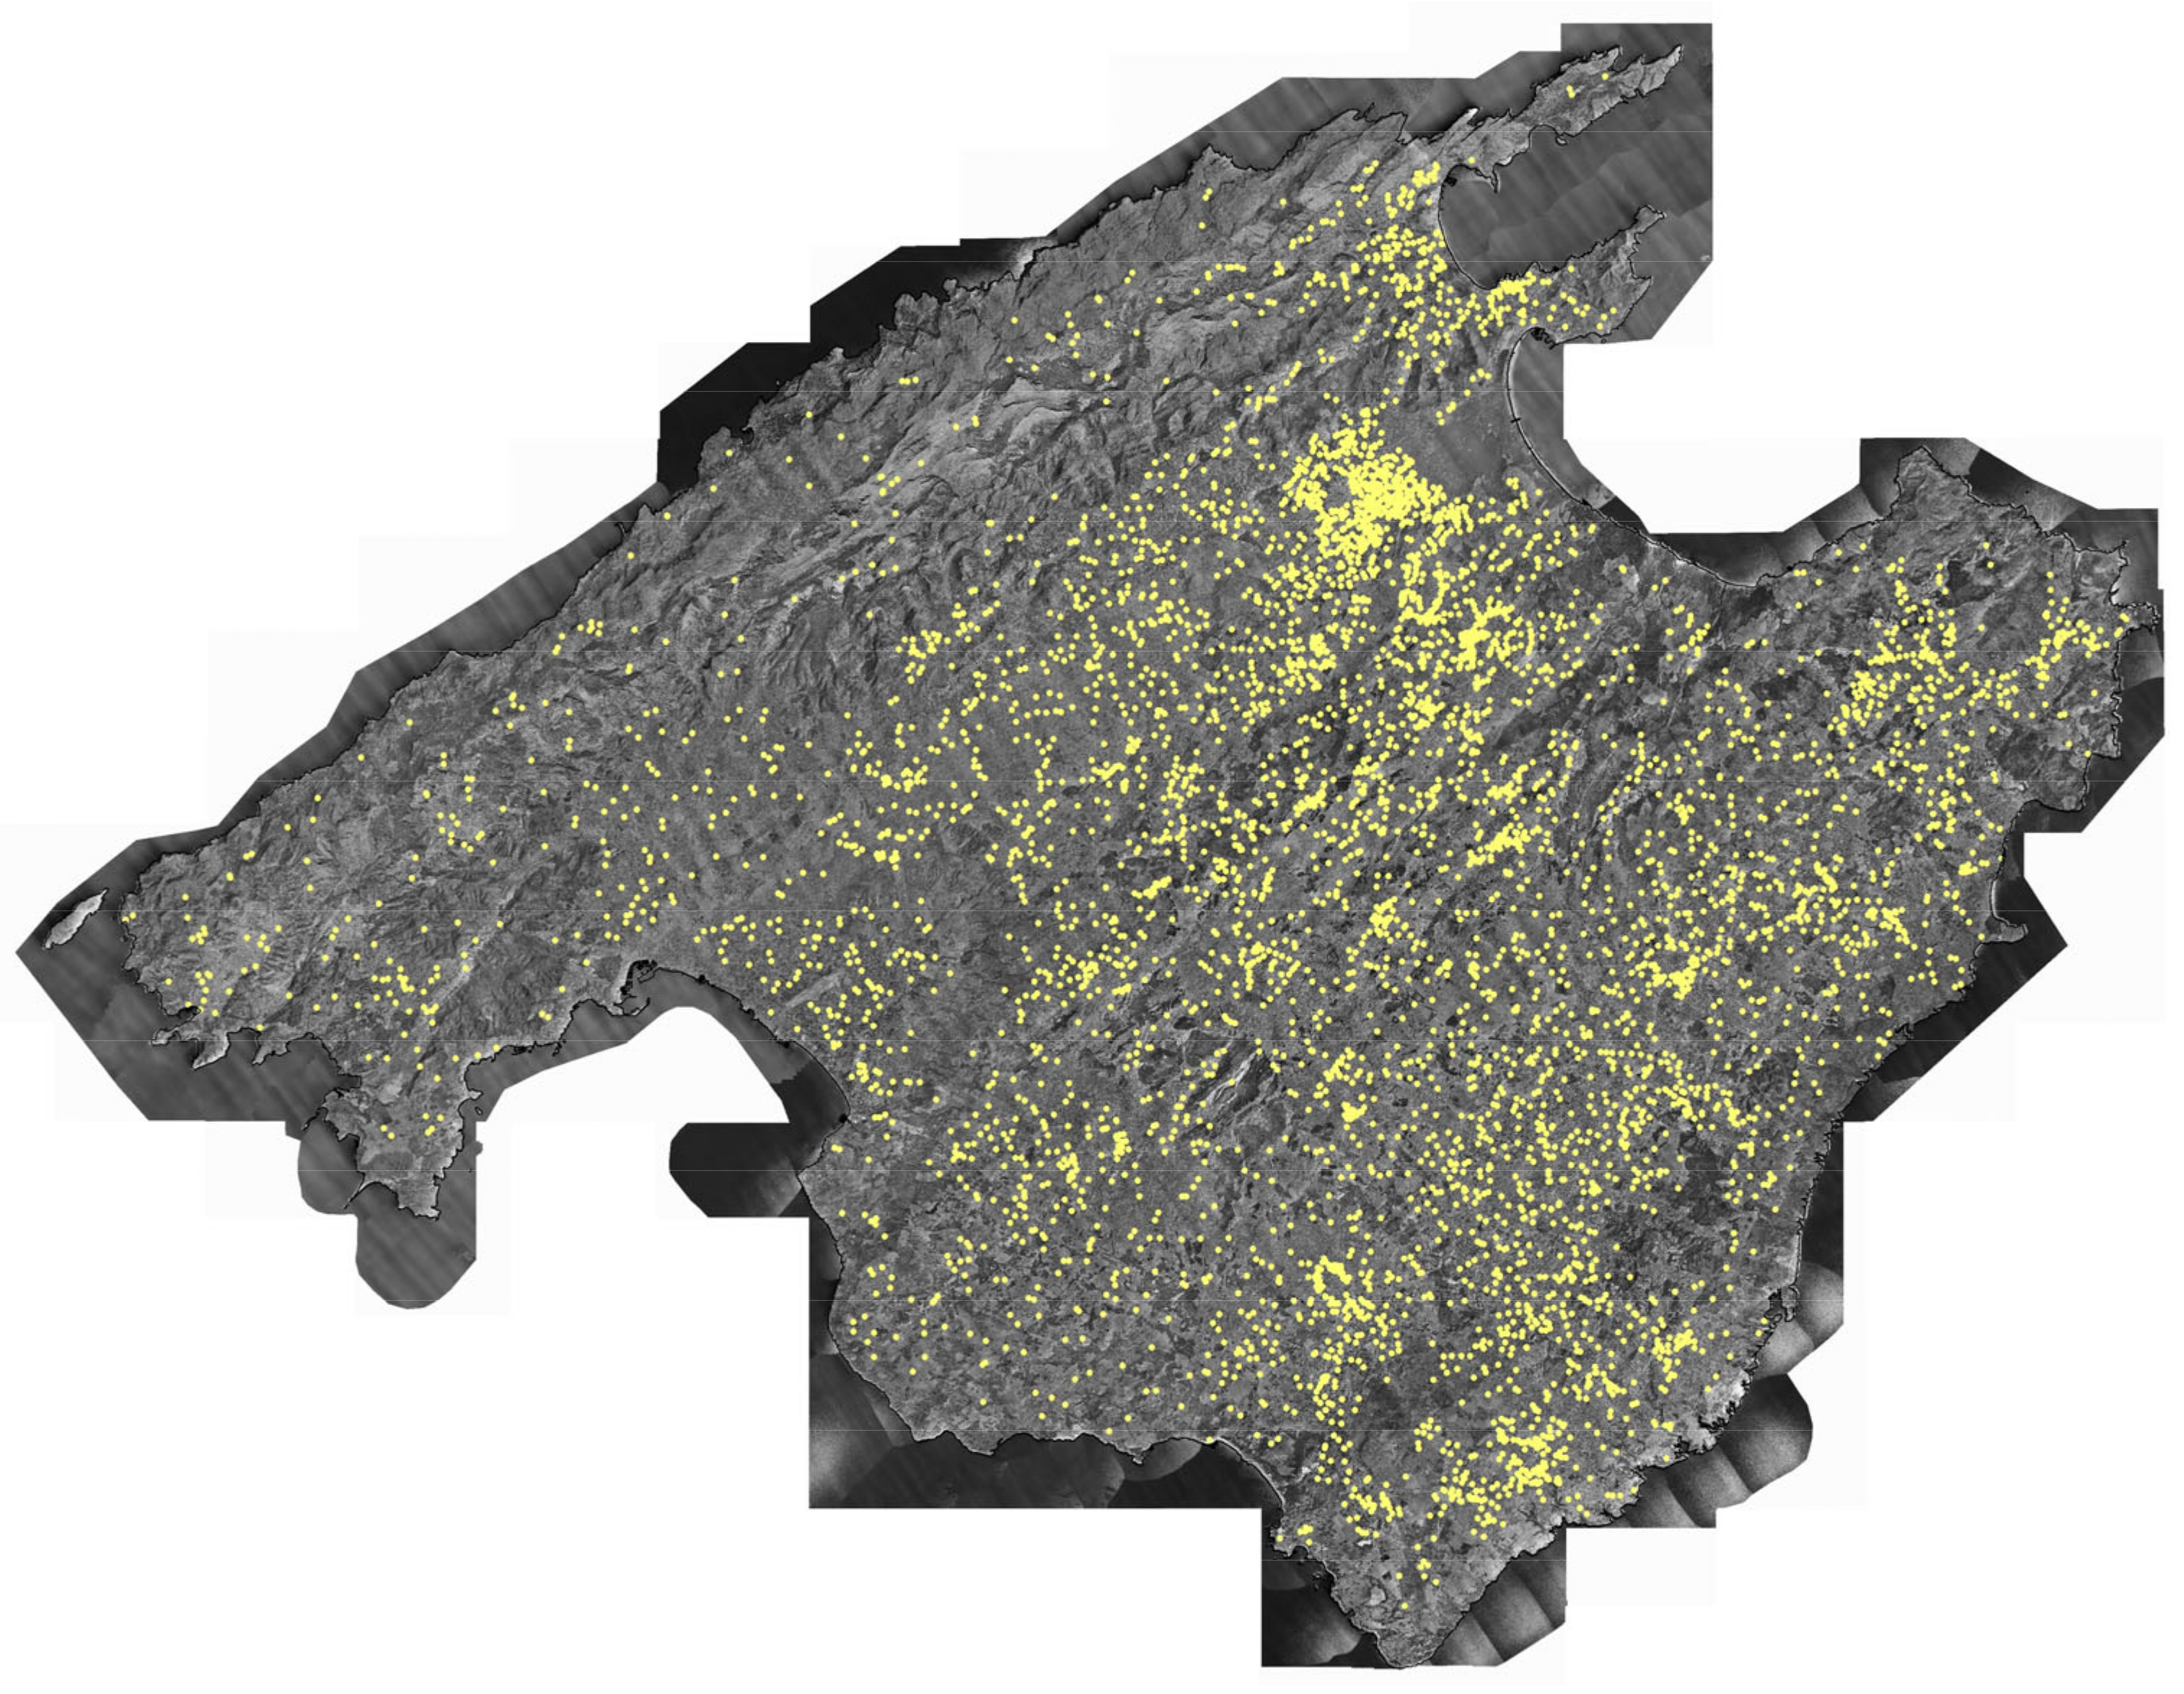
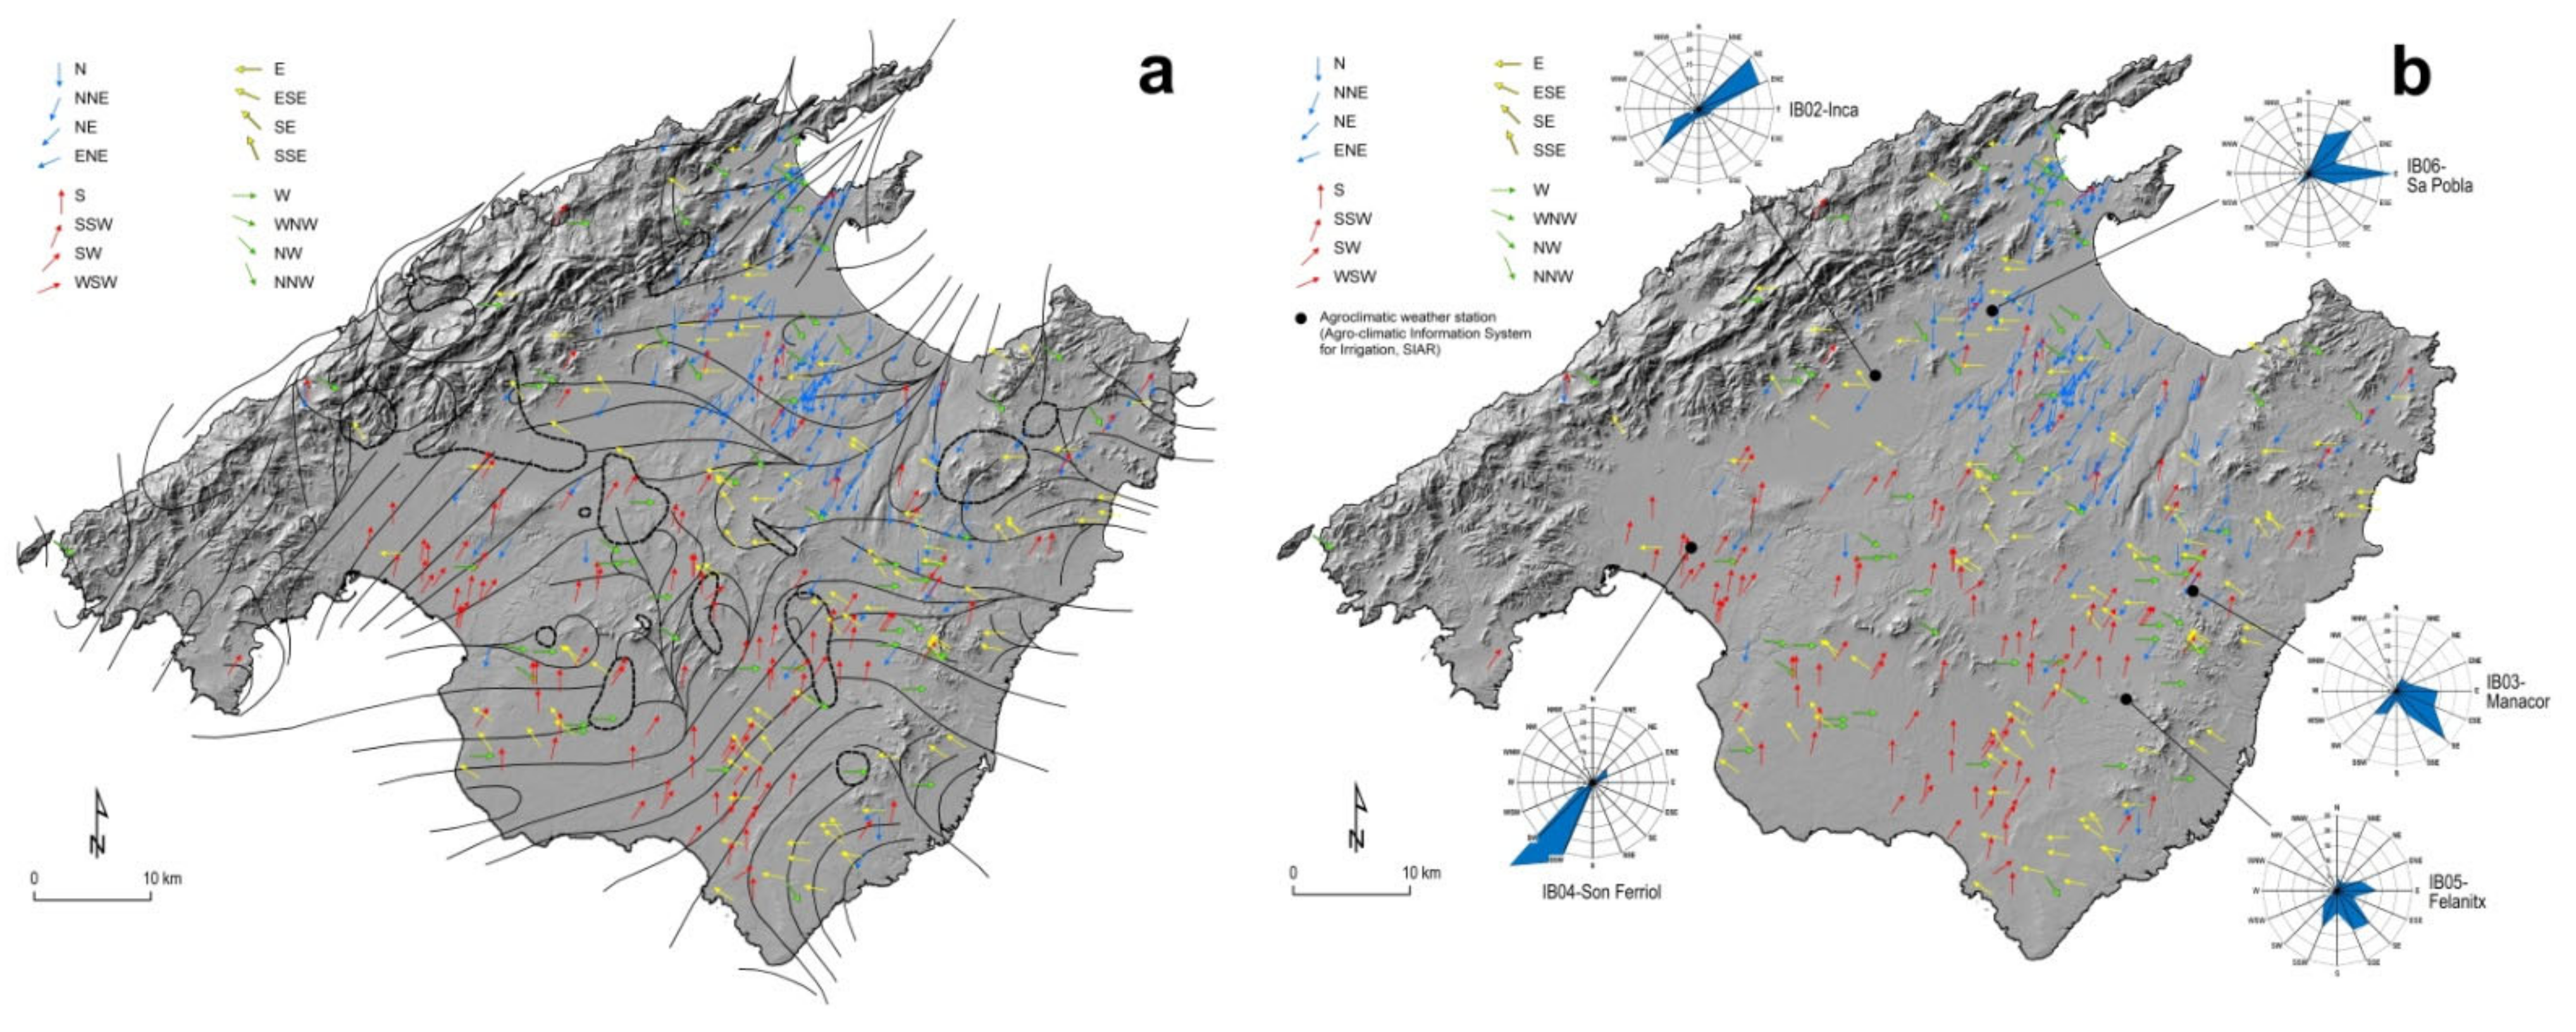
4.1. Spatial Modelling of Observed Wind

The distribution of sea-breeze directions resulting from the anemographs that we have collected shows certain patterns of interest. In the anemographic raster and vector model obtained (Figure 13a,b), the island seems to be divided into at least two main breeze regimes, corresponding respectively to the areas to the north and south of the island. The separation between both regimes takes place on an imaginary boundary located in the central area of the island, which indicates a convergence of the breezes formed simultaneously on the opposite coasts. Thus, the north-eastern half of the island is under the aerological dominance of the daytime breeze system established in the bays of Alcúdia and Pollença, where the breeze normally blows from the north-east. Some anemographs appear here with NW or NNW directions, which in the northern part of Mallorca are not from the sea, whereby they contradict the theoretical outline of the breeze directions in this part of the island. The cause of these anomalies can be found in the influence of the hillside, valley, or mountain-plain winds, and also in the effects of horizontal wind turbulence produced downwind of certain physical obstacles that are not necessarily orographic. Sometimes, the threshing floors are grouped in clusters located in the surroundings of urban centers (Figure 8), as well as in very parceled areas or in the vicinity of rural roads and highways. The dust plumes in these clusters are usually found oriented in the same direction, which confirms the correctness of our method as a climatic indicator of local sea breeze direction.
On the opposite side of the island, our model shows the southern and south-eastern half is affected mainly by sea-breezes in the third quadrant, formed in the geographic framework of the bay of Palma, or in the southern coastal sectors of Sa Ràpita and Es Trenc. In the model, this means that the sea breezes in the third quadrant do not only operate in the south-western area of Mallorca, but that they penetrate decisively towards the interior of the island and reach the central and eastern area.

4.2. Comparison between Proxy Data Sets and Empirical Observations

The general spatial patterns of sea breezes detected by the anemographic model can be better explained when related to the island’s breeze regime characterised by Jansá and Jaume in 1946 [34], and later on by many other simulations. Their model has been used as a fundamental element of comparison because it shows a high level of spatial definition of daytime breezes. In addition, its experimental basis was mainly human (oral information provided by farmers and fishermen) and not instrumental, so it can be better equated to the ethnographic-based model obtained by us. The main concordance of the anemographic model with the theoretical-experimental model (Figure 14a) and with the wind roses (Figure 14b) is that found in the anemographs located in the first quadrant—N, NNE, NE, and ENE: blue shades. Table 1 shows the absolute frequencies of the anemographs of the threshing floors located in each of the four wind quadrants into which the island has been divided (Q1, Q2, Q3 and Q4). According to it, 74 of the 91 threshing floors (81.3%) whose wind plumes indicate a NE direction are found in this quadrant, the same one in which the two large northern bays of Alcúdia and Pollença are inscribed, in which the winds blow predominantly from the NE, forming very stable breeze systems. This indicates that the wind directions of the threshing floors located in the first quadrant coincide in general with the wind directions adopted by the daytime breezes in this sector of the island.
Meanwhile, as attested by the theoretical-experimental model and the wind frequency roses, the southern sector of Mallorca is under the control of the breezes formed in the coastal sectors in the south of the island, especially in the bay of Palma, typically adopting a SW, SSW, S, and WSW component. The wind directions of the threshing floors located in quadrants 3 and 2 coincide substantially with the prevailing breeze directions in these two sectors of the island, above all in the case of the threshing floors closest to the bay of Palma and the bay of Sa Rápita and Es Trenc. Hence, 63.5% of the 63 threshing floors located in quadrant 3 exhibit anemographic marks from the SW, SSW, S, and WSW, coinciding with the prevailing wind directions inside the quadrant. The 144 threshing floors in total located in the second quadrant also exhibit a large number of anemographs from the SW, SSW, and S (38.2%), directions typical of this sector, although breezes from the E and SE are also frequent here, perpendicular to the eastern coasts of the island in which this second quadrant is also inscribed. Furthermore, the anemographic model tested suggests that not only do the sea winds in the third quadrant operate effectively in the south of Mallorca, but that they also penetrate decisively inland, reaching central areas in the island, a circumstance that is also reflected in the theoretical-experimental model of comparison, and in the wind roses.
It must be said that throughout the southern region of the island, the anemographs of some threshing floors show an unnatural direction of the place—i.e., NE. This may correspond, presumably, to the indeterminate influence of the surrounding reliefs, or to the close presence of physical obstacles of an anthropogenic nature, without ruling out the action of stable winds of a synoptic nature operating at the time when the grain was being winnowed in these threshing floors. Either way, the eastern component in the southern sector of the island is also reasonable, if it is taken into account that an easterly air regime is established in the western Mediterranean in the summer season, which occasionally combines with the breezes from the east coast, reinforcing them.
In the same inland areas of breeze convergence indicated by the theoretical-experimental model, the anemographic model proposed shows wind directions of a different sign, which fits reasonably well with the hypothesis of disorganisation of the wind in the areas where the sea air converges, bringing about an interruption of the wind and, straight away, the formation of dynamically vertical or horizontally turbulent wind eddies.
As for the eastern area of Mallorca, the anemographic model is shown to be somewhat less accurate. The theoretical-experimental model of Jansá and Jaume [34] establishes a relatively well-defined E and SE component of breezes for this sector. According to the anemographic model tested, 34.0% of the threshing floors located in this sector reveal E, ESE, SE, and SSE anemographs, but in the remaining percentage, there is a relatively high number of SW, SSW, NW, and NE anemographs, which means that the breeze system is regionally less organised in the east of the island. It could be said that the threshing floors with E, ESE, SE, and SSE directions (22.4% of the total of 446) are better distributed throughout the island as a whole. However, the threshing floors with N, NNE, NE, and ENE directions are mainly located within their own geographical context, which is none other than the north-eastern region of the island.
As far as the central part of Mallorca is concerned, the separation between the northern and southern air regimes is verified in the anemographic model, as the anemographs with the N component prevail in the northern half of the island, whereas those with the S component prevail throughout the southern half. The separation of these two wind systems of opposing directions proves the existence of an area of convergence of breezes such as that described in the theoretical-experimental model of reference. This area of convergence is located approximately along the NW-SE diagonal that can be traced between the Raiguer region and the Llevant region. In other sectors of the interior of Mallorca, secondary breeze convergence areas are formed, whose whirling wind is well reflected by the anemographs of the threshing floors; as occurs, for instance, in the case of the convergence area between the towns of Vilafranca and Porreres. Lastly, the experimental basis of the threshing floors has significant gaps in the mountainous region of the Serra de Tramuntana and in the south-western sector of the island (Calvià and Andratx), which prevents its overall comparison with the theoretical-experimental model of the sea-breezes in Mallorca.

5. Discussion and Conclusions

The island of Mallorca provides an interesting example of a well-documented, close interaction between man and climate. In the case of the present study, a novel method of working was tested in order to recreate and model the wind scenario of a region at a time when no instrumental or meteorological data were available. The method was applied to the island of Mallorca and was based on the inspection of aerial photographs from 1956 to geolocate and map the ancient threshing floors where the ears of wheat used to be threshed and winnowed in summer. Downwind of some of these morphologically circular threshing floors, the remains of the dust and chaff thrown by farmers during winnowing can be seen. These remains constitute a physical and graphic mark of the wind direction in the place where the threshing floor is located; hence, by analysing these threshing floors it is possible to draw a map of wind directions on an island scale. This map reconstructs the spatial arrangement of the sea breezes in the island.
Faced with the shortage of instrumental weather stations and their unequal territorial distribution, the use of threshing floors as an indirect source of wind data represents a substantial advantage, as their number is equivalent to 446 ethnographic anemometers. Something similar was done by Jansá and Jaume [34] to describe the current theoretical-experimental model of the breeze system in Mallorca, the final mapping of which was carried out based on oral information reported by local farmers and fishermen. The quality and validity of the map of breeze lines made by these authors was decisive in comparing it to the wind model tested in our study.
The result of this comparison is a visual correspondence between both models, since in both models the islands seems, largely, to be divided into at least two main wind regimes, one northern and another southern, whose confluence boundary is to be found in the central area of the island. Both models also show possible wind disturbance effects produced by the wind localisms caused either by orographic obstacles, or by the horizontal turbulence of the wind produced downwind of certain physical obstacles.
The use of aerial photographs as a documentary source for reconstructing or describing climate scenarios from the past is not a new practice, but the wind proxy that we used is. Inspection of threshing floors for climatological purposes opens up a new way of working on historical climatology or indirect climatology [49]. This is especially useful for clarifying wind regionalities when it is not possible to determine them by means of anemometric data that are not very widely distributed throughout the territory. In the case of our study, we turned the information derived from the identification and analysis of heritage infrastructures located in the Mediterranean agricultural area (threshing floors) into an ethnographic proxy that is useful in climatology, and into one more of those “so-far-unused proxies that may become precious bits to be added to the puzzle of climate reconstruction provided that rules can be developed on how to interpret them. These rules have to be jointly developed by both the social and the physical scientists involved” [50] (p. 240).
Moreover, in the line pursued by the aerial archaeology [51,52,53], historical aerial photography from 1956 has also proved to be very effective for the search for specific ethnographic marks on previously detected sites, for the appraisal of the heritage and ethnographical potential of wide areas, for the updating of inventories of ethnographical sites, and ultimately for the periodic assessment of historic landscapes.
In the present case, we established the methodological rules of interpretation of threshing floors in climate-wind terms; rules that are valid for all the regions in the world where circular threshing floors can be found and where, at the same time, there are aerial photographs that coincide chronologically with the presence of cereal-based subsistence farming practices. The countries bordering the Mediterranean basin meet these conditions, especially Spain, Italy, and Greece, which have cartographic resources such as those required for a climatological study of these characteristics.

Author Contributions

Conceptualization, M.G.-G. and G.A.-G.; methodology, G.A.-G. and M.G.-G.; formal analysis, G.A.-G.; investigation, G.A.-G. and M.G.-G.; data curation, G.A.-G. and M.G.-G.; writing—original draft preparation, G.A.-G.; writing—review and editing, G.A.-G. and M.G.-G.; All authors have read and agreed to the published version of the manuscript.

Funding

This research received no external funding.

Institutional Review Board Statement

Not applicable.

Data Availability Statement

Wind instrumental data was provided by the Sistema de Información Agroclimática para el Regadío (SIAR), from their website at http://www.siar.es (accessed on 31 August 2021).

Acknowledgments

The authors sincerely thank anonymous reviewers for provided helpful comments on earlier drafts of the manuscript.

Conflicts of Interest

The authors declare no conflict of interest.

References

  1. Brázdil, R.; Pfister, C.; Wanner, H.; Luterbacher, J. Historical Climatology in Europe–The State of the Art. Clim. Chang. 2005, 70, 363–430. [Google Scholar] [CrossRef]
  2. Mearns, L.O.; Rosenzweig, C.; Goldberg, R. Mean and variance change in climate scenarios: Methods, agricultural applications, and measures of uncertainty. Clim. Chang. 1997, 35, 367–396. [Google Scholar] [CrossRef]
  3. McGuffie, K.; Henderson-Seller, A.; Holbrook, N.; Kothavala, Z.; Balachova, O.; Hoekstra, J. Assessing simulations of daily temperature and precipitation variability with global climate models for present and enhanced greenhouse climates. Int. J. Climatol. 1999, 19, 1–26. [Google Scholar] [CrossRef] [Green Version]
  4. Glaser, R.; Riemann, D.A. Thousand-year record of temperature variations for Germany and Central Europe based on documentary data. J. Quat. Sci. 2009, 24, 437–449. [Google Scholar] [CrossRef]
  5. Pfister, C. Monthly temperature and precipitation patterns in Central Europe from 1525 to the present. A methodology for quantifying man-made evidence on weather and climate. In Climate Since A.D. 1500; Bradley, R.S., Jones, P.D., Eds.; Routledge: London, UK, 1992; pp. 118–142. [Google Scholar]
  6. Martín-Vide, J.; Barriendos, M. The use of rogation ceremony records in climatic reconstruction: A case study from Catalonia (Spain). Clim. Chang. 1995, 30, 201–221. [Google Scholar] [CrossRef]
  7. Rodrigo, F.S.; Esteban-Parra, M.J.; Pozo-Vazquez, D.; Castro-Diez, Y. A 500-year precipitation record in Southern Spain. Int. J. Climatol. 1999, 19, 1233–1253. [Google Scholar] [CrossRef]
  8. Ge, Q.-S.; Zheng, J.Y.; Hao, Z.X.; Zhang, P.Y.; Wang, W.C. Reconstruction of historical climate in China–High-resolution precipitation data from Qing dynasty archives. Bull. Am. Meteorol. Soc. 2005, 86, 671–680. [Google Scholar] [CrossRef] [Green Version]
  9. Domínguez-Castro, F.; García-Herrera, R.; Ribera, P.; Barriendos, M. A shift in the spatial pattern of Iberian droughts during the 17th century. Clim. Past 2010, 6, 553–563. [Google Scholar] [CrossRef] [Green Version]
  10. Hannaford, M.J.; Jones, J.M.; Bigg, G.R. Early-nineteenthcentury southern African precipitation reconstructions from ships’ logbooks. Holocene 2005, 25, 379–390. [Google Scholar] [CrossRef] [Green Version]
  11. Glaser, R. Data and Methods of Climatological Evaluation in Historical Climatology. Hist. Soc. Res. 1996, 21, 56–88. [Google Scholar]
  12. Ingram, M.J.; Underhill, D.J.; Farmer, G. The use of documentary sources for the study of past climates. In Climate and History. Studies in Past Climates and Their Impact on Man; Wigley, T.M.L., Ingram, M.J., Farmer, G., Eds.; Cambridge University Press: Cambridge, UK, 1981; pp. 180–213. [Google Scholar]
  13. Nkuba, M.R.; Chanda, R.; Mmopelwa, G.; Mangheni, M.N.; Lesolle, D.; Kato, E. Indigenous Knowledge Systems and Indicators of Rain: Evidence from Rwenzori Region, Western Uganda. Weather Clim. Soc. 2020, 12, 213–234. [Google Scholar] [CrossRef]
  14. Orlove, B.C.; Chiang, J.C.H.; Cane, M.A. Forecasting Andean rainfall and crop yield from the influence of El Niño on Pleiades visibility. Nature 2000, 403, 68–71. [Google Scholar] [CrossRef]
  15. Bewley, R.H. Aerial survey for archaeology. Photogramm. Rec. 2003, 18, 273–292. [Google Scholar] [CrossRef] [Green Version]
  16. Wade, N. Windmills: The resurrection of an ancient energy technology. Science 1974, 184, 1055–1058. [Google Scholar] [CrossRef]
  17. Rossi, C.; Russo, F.; Savino, S. Windmills: Ancestors of the wind power generation. Front. Mech. Eng. 2017, 12, 389–396. [Google Scholar] [CrossRef]
  18. Halstead, P. Two Oxen Ahead: Pre-Mechanized Farming in the Mediterranean; Wiley-Blackwell: Haboken, NJ, USA, 2014. [Google Scholar]
  19. Putnam, P.C. Power from the Wind; Van Nostrand-Reinhold: Princeton, NJ, USA, 1948; 223p. [Google Scholar]
  20. Yoshino, M. Studies on wind-shapes trees. Their classification, distribution and significance as a climatic indicator. Climatol. Notes 1973, 12, 1–52. [Google Scholar]
  21. Wade, J.E.; Wendell-Hewson, E. Trees as a Local Climatic Wind Indicator. J. Appl. Meteor. 1979, 18, 1182–1187. [Google Scholar]
  22. Hennessey, J.P. A Critique of ‘Trees as a Local Climatic Wind Indicator’. J. Appl. Meteorol. 1980, 19, 1020–1023. Available online: https://www.jstor.org/stable/26179483 (accessed on 19 October 2021). [CrossRef] [Green Version]
  23. Gross, G. A numerical study of the air flow within and around a single tree. Bound. Layer Meteorol. 1987, 40, 311–327. [Google Scholar] [CrossRef]
  24. Miller, S.T.K.; Keim, B.D.; Talbot, R.W.; Mao, H. Sea Breeze: Structure, Forecasting, and Impacts. Rev. Geophys. 2003, 41, 1011. [Google Scholar] [CrossRef] [Green Version]
  25. Jansà, A. El clima de las Baleares. Mediterraneidad e insularidad. Treb. De Geogr. 1980, 39, 39–43. [Google Scholar]
  26. Katsoulis, B.D.; Makrogiannis, T.J.; Goutsidou, Y.A. Monthly Anticyclonicity in Southern Europe and the Mediterranean Region. Theor. Appl. Climatol. 1998, 59, 51–59. [Google Scholar] [CrossRef]
  27. Martín-Vide, J.; Olcina-Cantos, J. Climas y Tiempos de España; Alianza Editorial: Madrid, Spain, 2001. [Google Scholar]
  28. Alomar-Garau, G. Las brisas marinas y su significación geográfica. El caso de Mallorca. Sémata Cienc. Sociais E Humanid. 2013, 25, 7–28. [Google Scholar]
  29. Tomàs-Burguera, M.; Grimalt-Gelabert, M. Actividad tormentosa, marítima, litoral y microcontinental en ámbitos insulares. Un análisis geográfico aplicado a Mallorca. Boletín De La Asoc. De Geógrafos Españoles 2014, 66, 145–162. [Google Scholar] [CrossRef]
  30. Alomar-Garau, G.; Grimalt-Gelabert, M. Precipitaciones de verano y régimen de brisas en Mallorca (Summer rainfalls and breeze regime in Mallorca). In Clima, Sociedad y Medio Ambiente; Cuadrat, J.M., Saz, M.A., Vicente, S.M., Lanjeri, S., de Luis, M., González-Hidalgo, J.C., Eds.; Asociación Española de Climatología: Zaragoza, Spain, 2006; pp. 1–11. [Google Scholar]
  31. Buswell, R.J. Mallorca: The Making of the Landscape; Dundin Academic Press: Edinburgh, Scotland, 2013. [Google Scholar]
  32. Doolittle, W.E. Stacking Rocks to Transport Water: Folk Aqueduct Bridges of Mallorca and Spanish Colonial California. Sustainability 2020, 12, 5257. [Google Scholar] [CrossRef]
  33. Cursach, M.F. Análisi sobre la protecció del patrimoni molinológic a Mallorca, present i futur. In IV International Molinology Conference; Consell Insular de Mallorca: Mallorca, Spain, 2005; pp. 389–408. [Google Scholar]
  34. Jansá, J.M.; Jaume, E. The sea-breeze regime in the Mallorca Island (in spanish). Rev. De Geofísica 1946, 19, 304–328. [Google Scholar]
  35. Azorin-Molina, C.; Connell, B.H.; Baena-Calatrava, R. Sea-Breeze Convergence Zones from AVHRR over the Iberian Mediterranean Area and the Isle of Mallorca, Spain. J. Appl. Meteorol. Climatol. 2009, 48, 2069–2085. [Google Scholar] [CrossRef]
  36. González, J.; Guijarro, J.A.; Jansà, A. Caracterización de la brisa en Mallorca. In I Asamblea Hispano-Portuguesa de Geodesia y Geofísica. IX Asamblea Española de Geodesia y Geofísica; Aguadulce: Almería, Spain, 1998. [Google Scholar]
  37. Simpson, J.E. Sea Breeze and Local Winds; Cambridge University Press: Cambdridge, UK, 1994. [Google Scholar]
  38. Miró-Granada, J.; Josep, M. Jansà Guardiola. Notas biográficas. Territoris 1998, 1, 17–45. [Google Scholar]
  39. Ramis, C.; Jansà, A.; Alonso, S. Sea breeze in Mallorca. A numerical study. J. Meteorol. Atmos. Phys. 1990, 42, 249–258. [Google Scholar] [CrossRef]
  40. Ramis, C.; Romero, R. A first numerical simulation of the development and structure of the sea breeze on the Island of Mallorca. Ann. Geophys. 1995, 13, 981–994. [Google Scholar] [CrossRef]
  41. Colwell, R.N. History and place of photographic interpretation. In Manual of Photographic Interpretation, 2nd ed.; Philipson, W.R., Ed.; American Society for Photogrammetry and Remote Sensing: Bethesda, MD, USA, 1997; pp. 33–48. [Google Scholar]
  42. Urteaga, L.; Nadal, F.; Muro, J.I. Los mapas de España del Army Map Service, 1941–1953. Eria 2000, 51, 31–43. [Google Scholar]
  43. Pérez, A.J.; Bascón, M.F.; Charro, M.C. Photogrammetric Usage of 1956–57 USAF Aerial Photography of Spain. Photogramm. Rec. 2014, 29, 108–124. [Google Scholar] [CrossRef]
  44. Toussaint-Samat, M. A History of Food; Wiley-Blackwell: Oxford, UK, 2009. [Google Scholar]
  45. Govern Balear. Solcs i Ones. Butlletí Informatiu de la Conselleria d’Agricultura i Pesca, 17; Govern Balear: Palma, Spain, 1995. [Google Scholar]
  46. Jenkinson, A.F.; Collison, F.P. An initial climatology of Gales Wales over the North Sea. In Synoptic Climatology Branch Memorandum; Meteorological Office, Braknell: London, UK, 1977. [Google Scholar]
  47. Grimalt-Gelabert, M.; Tomàs, M.; Alomar-Garau, G.; Martin-Vide, J.; Moreno-García, M.C. Determination of the Jenkinson and Collison’s weather types for the western Mediterranean basin over the 1948–2009 period. Temporal analysis. Atmósfera 2013, 26, 75–94. [Google Scholar] [CrossRef] [Green Version]
  48. Grimalt-Gelabert, M.; Alomar-Garau, G.; Martin-Vide, J. Synoptic Causes of Torrential Rainfall in the Balearic Islands (1941–2010). Atmosphere 2021, 12, 1035. [Google Scholar] [CrossRef]
  49. Yazawa, T. Climatic characteristics indicated by some landscapes: Methods in indirect climatology. Geogr. Helv. 1971, 26, 34–36. [Google Scholar] [CrossRef] [Green Version]
  50. Diemberger, H.; Hastrup, K.; Schaffer, S.; Kennel, C.F.; Sneath, D.; Bravo, M.; Graf, H.-F.; Hobbs, J.; Davis, J.; Nodari, M.L.; et al. Communicating Climate Knowledge. Proxies, Processes, Politics. Curr. Anthropol. 2012, 53, 226–244. [Google Scholar] [CrossRef]
  51. Wiseman, J.; El-Baz, F. (Eds.) Remote sensing in archaeology. In Interdisciplinary Contributions to Archaeology; Springer: New York, NY, USA, 2007; ISBN 9780387444536. [Google Scholar]
  52. Parcak, S.H. Satellite Remote Sensing for Archaeology; Routledge: New York, NY, USA, 2009; ISBN 9780415448772. [Google Scholar]
  53. Tapete, D. Remote Sensing and Geosciences for Archaeology. Geosciences 2018, 8, 41. [Google Scholar] [CrossRef] [Green Version]
Figure 1. Geographical framework of the isle of Mallorca.
Remotesensing 13 04652 g001
Figure 2. Wind (sea-breeze) current lines around the isle of Mallorca (continuous line) and convergence areas (closed dashed lines). Own redrafting based on data from Jansá and Jaume [34], drawn using a digital elevation model (DEM).
Remotesensing 13 04652 g002
Figure 3. Schematic process flow diagram to identify threshing floors using 1956 aerial photography, use them as a wind indicator and compare the results with the sea-breeze model of Jansá and Jaume [34], and wind-direction frequency roses for five stations (instrumental data), using a Geographic Information System (GIS).
Remotesensing 13 04652 g003
Figure 4. Photogram 14,424 of the flight on 26 July 1956. The village of Campos, in the south of Mallorca, is shown in the central-eastern part of the photograph, facing south-west. Campos is seen to be surrounded by an agricultural matrix. In the box, small, white circles are identified, indicating the location of threshing floors, which are very numerous on the peripheral fringe of this village.
Remotesensing 13 04652 g004
Figure 5. (a) Threshing inside a Mallorcan threshing floor. The circular direction in which the threshing is carried out is adapted to the circular plan of the threshing floor. Photo: Solcs i Ones [45]; (b) winnowing inside the threshing floor. Photo: Ferran Moragues-Manzano.
Remotesensing 13 04652 g005
Figure 6. From left to right, methodological procedure to deduce the wind direction around the threshing floor. Point ‘a’ sets out the movement of the dust and straw and its buildup downwind of the threshing floor, forming a ‘wind-plume’. The third image gives the morphological key to know the prevailing wind direction, as a function of the resultant wind-plume, and its corresponding ‘anemograph’.
Remotesensing 13 04652 g006
Figure 7. Morphological 2D aspect of 16 different threshing floors captured by the 1956 aerial photography, and their respective 16 anemographic marks corresponding to the predominant wind direction at the site. Work scale: 1/500.
Remotesensing 13 04652 g007
Figure 8. Examples of morphological aspect of threshing floors observed from the air and in two dimensions, according to the prevailing wind direction in the place, and its resultant ‘anemograph’; (a) south of the village of Sant Llorenç, situated in the oriental side of the island; (b) south of the village of Ariany, situated in the central plain.
Remotesensing 13 04652 g008
Figure 9. Example of the match between the direction frequency rose of the IB04-Son Ferriol station (Bay of Palma, prevailing wind from SW-SSW at 13 UTC) and a threshing floor whose wind-plume (sea breeze) is also from SSW.
Remotesensing 13 04652 g009
Figure 10. Spatial distribution of threshing floors (yellow dots, n = 5890) around de island of Mallorca, for the year 1956, on an aerial photographs mosaic of this year.
Remotesensing 13 04652 g010
Figure 11. (a) Distribution of threshing floors (black dots, n = 5890) on a chequered mesh with a resolution of 1000 × 1000 m; (b) Squares containing threshing floors and resulting wind-direction assigned to each threshing floor (experimental basis, n = 446).
Remotesensing 13 04652 g011
Figure 12. ‘Anemographic’ sea-breeze directions (colored pixels) recorded for each threshing floor, separated into the usual four wind quadrants (Q).
Remotesensing 13 04652 g012
Figure 13. ‘Anemographic’ sea-breeze direction model based on the experimental threshing floors, on a digital elevation model (DEM). On the left (a), raster model: colored pixels indicate the proxy-wind-direction (and quadrant Q) at each site; On the right (b), vector model: colored arrows indicate the proxy-wind-direction (and quadrant Q) at each site.
Remotesensing 13 04652 g013
Figure 14. On the left (a), comparison of the ‘anemographic’ model with Chart I (Current lines) and Chart II (Convergence zones) of the sea-breeze regime in Mallorca [34]; On the right (b), comparison of the ‘anemographic’ model with the relative frequency distribution (%) of the wind direction (polar bar chart) at the time of theoretical maximum sea-breeze intensity (13 UTC), for five meteorological stations of the Sistema de Información Agroclimática para el Regadío (SIAR), Spain (17-year study period, 2004–2020).
Remotesensing 13 04652 g014
Table 1. Frequencies of the anemographs (wind-direction) of the threshing floors. The second column (Q) indicates wind quadrant assigned to each direction. The four last columns indicate the absolute number of threshing floors located in each of the four quadrants (Q1, Q2, Q3 and Q4).
Direction of
Anemograph
QNumber of Threshing Floors%Q1Q2Q3Q4
N1224.916312
NNE1388.534211
NE19120.4741025
ENE1112.58300
E2347.619915
ESE2122.721000
SE2347.681952
SSE2204.521143
S3276.121492
SSW3398.7717132
SW35412.1824148
WSW351.12300
W4296.521494
WNW420.41010
NW4184.09432
NNW4102.28101
Publisher’s Note: MDPI stays neutral with regard to jurisdictional claims in published maps and institutional affiliations.

