
Phytoplankton Genera Structure Revealed from the Multispectral Vertical Diffuse Attenuation Coefficient
by
 , , and
Cleber Nunes Kraus
1,* ,
,
Daniel Andrade Maciel
1,
Marie Paule Bonnet
2 and
Evlyn Márcia Leão de Moraes Novo
1 1
Remote Sensing Division, National Institute for Space Research (INPE), São José dos Campos 12227-010, Brazil
2
Espace_DEV, IRD, University of Montpellier, 34093 Montpellier, France
*
Author to whom correspondence should be addressed.
Remote Sens. 2021, 13(20), 4114; https://doi.org/10.3390/rs13204114
Submission received: 27 August 2021
/
Revised: 1 October 2021
/
Accepted: 6 October 2021
/
Published: 14 October 2021
(This article belongs to the Special Issue Remote Sensing in the Amazon Biome)
Abstract
:The composition of phytoplankton and the concentration of pigments in their cells make their absorption and specific absorption coefficients key parameters for bio-optical modeling. This study investigated whether the multispectral vertical diffuse attenuation coefficient of downward irradiance (Kd) gradients could be a good framework for accessing phytoplankton genera. In situ measurements of remote sensing reflectance (Rrs), obtained in an Amazon Floodplain Lake (Lago Grande do Curuai), were used to invert Kd, focusing on Sentinel-3/Ocean and Land Color Instrument (OLCI) sensor bands. After that, an analysis based on the organization of three-way tables (STATICO) was applied to evaluate the relationships between phytoplankton genera and Kd at different OLCI bands. Our results indicate that phytoplankton genera are organized according to their ability to use light intensity and different spectral ranges of visible light (400 to 700 nm). As the light availability changes seasonally, the structure of phytoplankton changes as well. Some genera, such as Microcystis, are adapted to low light intensity at 550–650 nm, therefore high values of Kd in this range would indicate the dominance of Microcysts. Other genera, such as Aulacoseira, are highly adapted to harvesting blue-green light with higher intensity and probably grow in lakes with lower concentrations of colored dissolved organic matter that highly absorbs blue light (405–498). These findings are an important step to describing phytoplankton communities using orbital data in tropical freshwater floodplains. Furthermore, this approach can be used with biodiversity indexes to access phytoplankton diversity in these environments.
1. Introduction
It is now well established that phytoplankton growth is controlled by temperature and both nutrient and light availability; phytoplankton are able to adjust their intracellular composition, especially pigment composition (chlorophyll-a, ancillary pigments) to acclimatize to their environmental conditions [1,2,3,4,5,6]. Moreover, nutrient and light conditions also control phytoplankton assemblages, favoring the emergence and eventual dominance of one species or group of species over another [7].
While the color of the water (and thus the available light beneath the surface) of the oceans is essentially controlled by chlorophyll and possibly other phytoplankton pigments, the color of inland waters is also influenced by many other components (the Optically Active Constituents (OACs)), such as detritus, suspended particulate matter (SPM), and chromophoric dissolved organic matter (CDOM). The OACs vary widely and independently from each other, making freshwater optically complex environments [8,9]. The OAC concentration modifies the underwater light field, regulating the water transparency and impacting aquatic organisms such as fishes [10] and phytoplankton [11,12,13].
There is currently an effort to understand how phytoplankton composition and environmental conditions can affect light absorption and determine specific absorption coefficients [14,15,16,17]. Experimental studies emphasize that changes in both phytoplankton cell size and pigment composition can affect the magnitude and spectral shape of those coefficients [18,19,20]. The variability of the phytoplankton specific absorption can be attributed mainly to phytoplankton physiological processes such as pigment composition [15,21], which varies among species, and affects the absorption by the photosynthetic pigments [22,23,24].
The phytoplankton absorption spectra are determined by the composition and concentration of pigments in their cells, which makes their absorption and specific absorption coefficients key parameters for bio-optical modeling [16,17,25,26,27]. The range of absorption of these pigments is restricted to the edges of the visible spectrum (~400–700 nm), and the most conspicuous pigment is the chlorophyll-a (Chl-a) that absorbs in the range of ~420, 630–720 nm (Figure 1). However, the Chl-a is almost always accompanied by other pigments to broaden the absorption of the photosynthetically active radiation, such as the chlorophylls b and c (Chl-b, Chl-c). The Chl-b absorbs in the range of ~460, 630–680 nm, and the Chl-c at ~400, 500–620 nm, both reducing the absorption gaps left by Chl-a in the spectral region between 500 and 600 nm [28], and in the blue spectral region between 400 and 440 nm [29]. Although they occur in smaller concentrations than the chlorophylls, there are many other pigments in the phytoplankton called accessory pigments (Figure 1), which can further reduce the absorption gap at specific wavelengths of the visible spectrum [28,30,31]. The phytoplankton pigment composition responds to its taxonomic composition, which is an important physiological response parameter because the relative pigment concentrations are affected by environmental factors such as light availability [32,33,34,35].
In community ecology, the thresholds of a specific environmental factor of the habitat which impacts species or taxonomic groups as a functional group can be interpreted as a niche. A niche is an abstract n-dimensional space occupied by species or the functional role of a pool of species, also called fundamental niche [36,37]. However, the complexity of environmental and spatial factors interacting for the composition of phytoplankton organisms, makes it difficult to obtain information about realized niches occupied by phytoplankton species using field experiments due to the multidimensionality and overlap of the influencing factors [38,39]. However, unraveling phytoplankton niches is of great importance, as they describe preferential conditions and can be used as predictive tools to estimate phytoplankton biodiversity, since different niches must have different species. Currently, ecologists have sought to organize the taxonomic groups into functional groups by assembling species with similar functions in the aquatic ecosystem. The functional groups are a framework that potentially simplifies the complexity of the real ecosystems [40,41]. Furthermore, each functional association reflects the simultaneous responses of the individual species to environmental variations in an ecosystem [42]. Thus, the phytoplankton plays a fundamental role in aquatic ecosystems once the community composition reproduces its ecological function [3,43,44].
Similarly, satellite-based sensors can record the visible reflectance spectra that inform on the absorption, scattering, and fluorescence signatures of functional phytoplankton groups [45,46]. These measurements can be used to estimate the biodiversity, including the distribution, abundance, and traits of groups of species populations, and are used to evaluate habitat fragmentation [47,48]. Moreover, the multispectral vertical diffuse attenuation coefficient of downward irradiance (Kd) relates to light penetration and light availability in aquatic systems [49,50]. Hence, as an estimator of light availability across the water column, Kd is also an indicator of OAC type and concentration, connecting hydrological optics and biology [51,52]. Thus, the Kd can be an important tool for understanding biological and physical processes within the water column, including the phytoplankton photosynthesis in the euphotic zone [53,54].
Therefore, this study evaluated how the light availability impacts the structure of the phytoplankton community in a tropical floodplain lake system. We investigated whether multispectral Kd gradients are a good framework to access phytoplankton genera in the Curuai lake. To achieve this, in situ remote sensing reflectance (Rrs) was used to semi-analytically invert Kd, focusing on Sentinel-3/Ocean and Land Color Instrument (OLCI) sensor bands. These data were used to assess how the available light in the visible spectra impacts the composition of the phytoplankton community and whether different wavelengths are a determinant factor to structure in situ phytoplankton genera.
2. Materials and Methods
2.1. Study Area
The study was carried out in the Curuai floodplain lake system (Figure 2), located downstream of the right margin of the Amazon River, opposite Óbidos city, and extending eastward 60 km from Santarém, in the Pará state, Brazil. The Curuai is a large floodplain system composed of several temporally interconnected lakes and drains several small basins which extend over 1500 km2 as a whole. The lake’s system is linked by several channels with the mainstem, but only the easternmost channel remains permanently connected [55]. The Curuai system is seasonally flooded by water from the Amazon mainstream and the local drainage basin, seepage and local precipitation. The large seasonal water level amplitude combined with very flat relief causes there to be great variation in flood extent between low- and high-water periods. The river water, rich in inorganic suspended material and nutrients [56,57,58], contrasts with the water quality from the other sources, poor in nutrients and rich in organic matter [55,59].
2.2. Biological Data
We collected samples during two hydrological periods in 2013; rising waters (RW) and flushing waters (FW), which occurred in March and September, respectively. Whenever possible, we collected at the same points in both periods, but due to water level variation, it was not possible to repeat all points in the two sampled periods. Thus, 23 stations were collected in the RW and 36 stations in the FW period. At each station, its respective geographic coordinates were recorded using an GPS receiver (Figure 2). The water samples were collected at sub-surface level (approximately 20 cm); one sample at each station. The quantitative samples for phytoplankton taxonomy determination were collected and stored in amber vials and fixed with acetic Lugol solution. Phytoplankton were counted following the Utermöhl method [60], at 400× magnification. The counting was carried out randomly until 100 individuals were obtained (cells, colonies, or filaments) of the most frequent species, maintaining the error rate at less than 20%, with a confidence coefficient of 95% [61]. The adopted system for classifying phytoplankton followed Guiry and Guiry [62]. The algal biovolume was calculated by multiplying the abundance of each species by the mean cell volume [63], based on the measurement of at least 30 individuals and was expressed in mm3.L−1. We used the genera level classification and excluded all taxa that did not occur in at least 3 sample units.
2.3. Remote Sensing Reflectance Measurements
At each of the sample stations, radiometric measurements were collected to compute the remote sensing reflectance (Rrs) in the range of 400–1000 nm. In the March field campaign, the HandHeld ASD FieldSpec 2 was used, whereas in September, three intercalibrated TriOS RAMSES sensors were used. At each station, the following measurements were taken: (i) the downwelling irradiance above the water surface (Es); (ii) the total water-leaving radiance (Lt), and (iii) the sky radiance (Lsky). As the HandHeld2 only measures radiance, the downwelling irradiance above water surface was estimated by measuring the radiance of a Spectralon Lambertian plaque and integrating it in all directions by multiplying by π. The spectralon pane was positioned approximately 20 cm from the radiometer, and the measurements were taken in 45°. For the measurements of Lt, the radiometer was positioned at approximately 45° in relation to the water surface and 135° in relation to the sun. For measuring Lsky, the radiometer was positioned at approximately 45° in relation to the nadir, and 135° in relation to the sun. The measurements were taken approximately 2 meters above the water surface to avoid shadow and vessel reflection. Readers should note that the HandHeld2 radiometer was manually operated by an experienced researcher, and the inclination of each measurements is approximated. For TriOS-RAMSES, a fixed support with the specific inclinations was used. Despite the difference in the sensors, both sensors were used for the same dataset in recent works in Brazilian waters and provided good results [64,65]. From this framework, Rrs was calculated using Equation (1):
where is the air–water interface reflectance with values taken from Mobley [50], based on sensor geometry settings and wind speed. Considering the measurements using HandHeld2, 10 measurements of each radiometric quantity were taken. For the TriOS RAMSES data, measurements were continuously taken every 10 s, for approximately 20 min. Visual inspection is performed to remove anomalous and outlier spectra (e.g., those with variations higher than 10% of median values). After outlier and anomalous spectra removal, median Rrs spectra were calculated for each field station. More information about these methods can be obtained in Maciel et al. [66].
2.4. Kd Calculation Based Rrs Measurements
The Kd calculation was performed using the semi-analytical approach (SAA) proposed by Maciel et al. [67]. This method was based on the original algorithm from Lee et al. [68]. First, the absorption (a(λ)) and backscattering (bb(λ)) coefficients were obtained using an inversion method based on Rrs data. For this inversion process, a Quasi-Analytical Algorithm (QAA) was employed. The QAA was reparametrized considering in situ data for Amazon Floodplain Lakes. Although the algorithm from Maciel et al. [67] was developed considering the Sentinel-2/MSI sensor, in this study we used bands similar to those of Sentinel-3/OLCI (Table 1). A detailed explanation of this inversion method is given in Maciel et al. [67]. After retrieving the absorption and backscattering coefficients, Kd(λ) is calculated using Equation (2).
The parameters and m0–3 are spectrally constant and do not vary with water properties, obtained in Lee et al. [68], is the solar zenith angle (in degrees), and is the pure water backscattering coefficient [69]. Finally, Kd was simulated for Sentinel-3/OLCI bands. To achieve this, the spectral response function of this sensor was used (https://sentinel.esa.int/web/sentinel/technical-guides/sentinel-3-olci/olci-instrument/spectral-response-function-data, accessed on 1 October 2021). We selected 10 OLCI bands with wavelengths in which different phytoplankton pigments can absorb radiation. The Kd calculation using the semi-analytical approach Kd was simulated for Sentinel-3/OLCI bands (Table 1).
2.5. Statistical Analysis
Before the phytoplankton data were used for statistical analyses, data were log-chord-transformed [70]. This technique combines the log transformation that makes the species distribution more symmetric, reducing effects of bias caused by very abundant species, whereas the chord transformation produces a double-zero asymmetrical coefficient [70]. In coefficients that have the double-zero asymmetry, the dissimilarity does not change with the addition of double-zeros at two sites. Still, it decreases when double-X are added, where X is any value other than zero. For more details, see [70].
We performed an analysis based on the organization of three-way tables using STATICO to evaluate the relationships between two series of tables: one table of a series of phytoplankton genera, and one table of a series of Kd at different OLCI bands. STATICO combines two methods: Co-inertia Analysis [71] and Partial Triadic Analysis [72]. First, the Co-inertia Analysis computes the cross-covariances between the two data tables. Then, these cross-covariances are analyzed to give the Co-inertia axes. Finally, the Partial Triadic Analysis (PTA) can be used to analyze the series of cross tables [71].
PTA consists of three steps, namely Interstructure, Compromise and Intrastructure. First, the Interstructure computes weights that are used to build a linear combination of the series of tables, called the “Compromise”. Here, we had Kd variables and phytoplankton Compromise. Then, the Compromise was analyzed using Principal Component Analysis (PCA) and finally, the results were projected in the Intrastructure graph. For more details, consult [72,73]. This method provides information about the stability or the diversity of the structures of all the tables of the series. These analyses were implemented using the R packages “ade4” [72].
3. Results
3.1. Phytoplankton and Multispectral Vertical Diffuse Attenuation Coefficient of Downward Irradiance
After the taxonomy analysis for both RW and FW was carried out, the results indicate that the phytoplankton community in the Curuai lake was composed of 97 genera (Supplementary Material Table S1), corroborating the high biodiversity reported for Amazon floodplain lakes [74,75]. Cyanophyceae was the class with the highest biovolume, followed by Bacillariophyceae, Cryptophyceae, and Chlorophyceae. Together, they represent more than 61% of the total biovolume of the phytoplankton community (Supplementary Materials Table S1). The most representative genus of the Cyanophycea community was Dolichospermum, with 16% of the total biovolume. Genus Aulacoseira represented the Bacillariophyceae with 10% of total biovolume. The genus Cryptomonas, with 6% of total biovolume, was the most representative of the Cryptophyceae and the genus Volvox, with 5% of the total biovolume, representative of Chlorophyceae. The genus Perdidinium (Dinophyceae) with the 8% of total biovolume, was the fourth most abundant genus. However, the Dinophycea was the least abundant group.
3.2. Biovolume of Phytoplankton Genera and Kd Relationships
In the STATICO graphs (Figure 3, Figure 4 and Figure 5), the greater the length of the arrows (or in case of points, the distance from the center), the higher the stability of the relationship. The first two axes represented, respectively, 29.3% and 0.05% of the total variability. The first axis (x-axis) describes a visible light availability, while the second axis (y-axis), describes a light spectra. Indeed, although all phytoplanktonic organisms use mainly chlorophylls to take advantage of the available light, the results show that certain genera may be better adapted to different spectra of this same resource. The interstructure graph of STATICO analysis, based on Kd and biovolume of the 97 phytoplankton genera, appeared to be strong in both RW and FW, as shown by the long arrows (Figure 3). In addition, the phytoplankton community in RW seems to be more influenced by green-red bands of light spectra (bands 6 to 10 in Figure 4), whereas in the FW, the phytoplankton community seems to be more influenced by green-blue bands of light spectra (bands 1 to 5 in Figure 4).
In the Intrastructure graphs (Figure 4 and Figure 5), the first axis was dominant. It accounted for 98% of the explained variance in contrast with the second axis which accounted for 1.8% of the explained variance. For the Kd (Figure 4), the first axis (x-axis) describes light availability, with low light (high Kd) correlated on the left side and high values of light availability (low Kd) correlated on the right side of the graph. The second axis (y-axis) describes a light spectra gradient, with the blue band (~400 nm) on the bottom to red bands (~700 nm) on the top of the graph (Figure 4). Thus, the phytoplankton were distributed according to their ability to use light intensity (bright to dark) and different visible light spectra (400 to 700 nm). Moreover, the wavelengths related to bands 6–10 were stronger (longer arrows) than bands 1–5 (shorter arrows). This means that species that use green-red wavelengths in the range of 600 to 700 nm have a competitive advantage to being established in these environments.
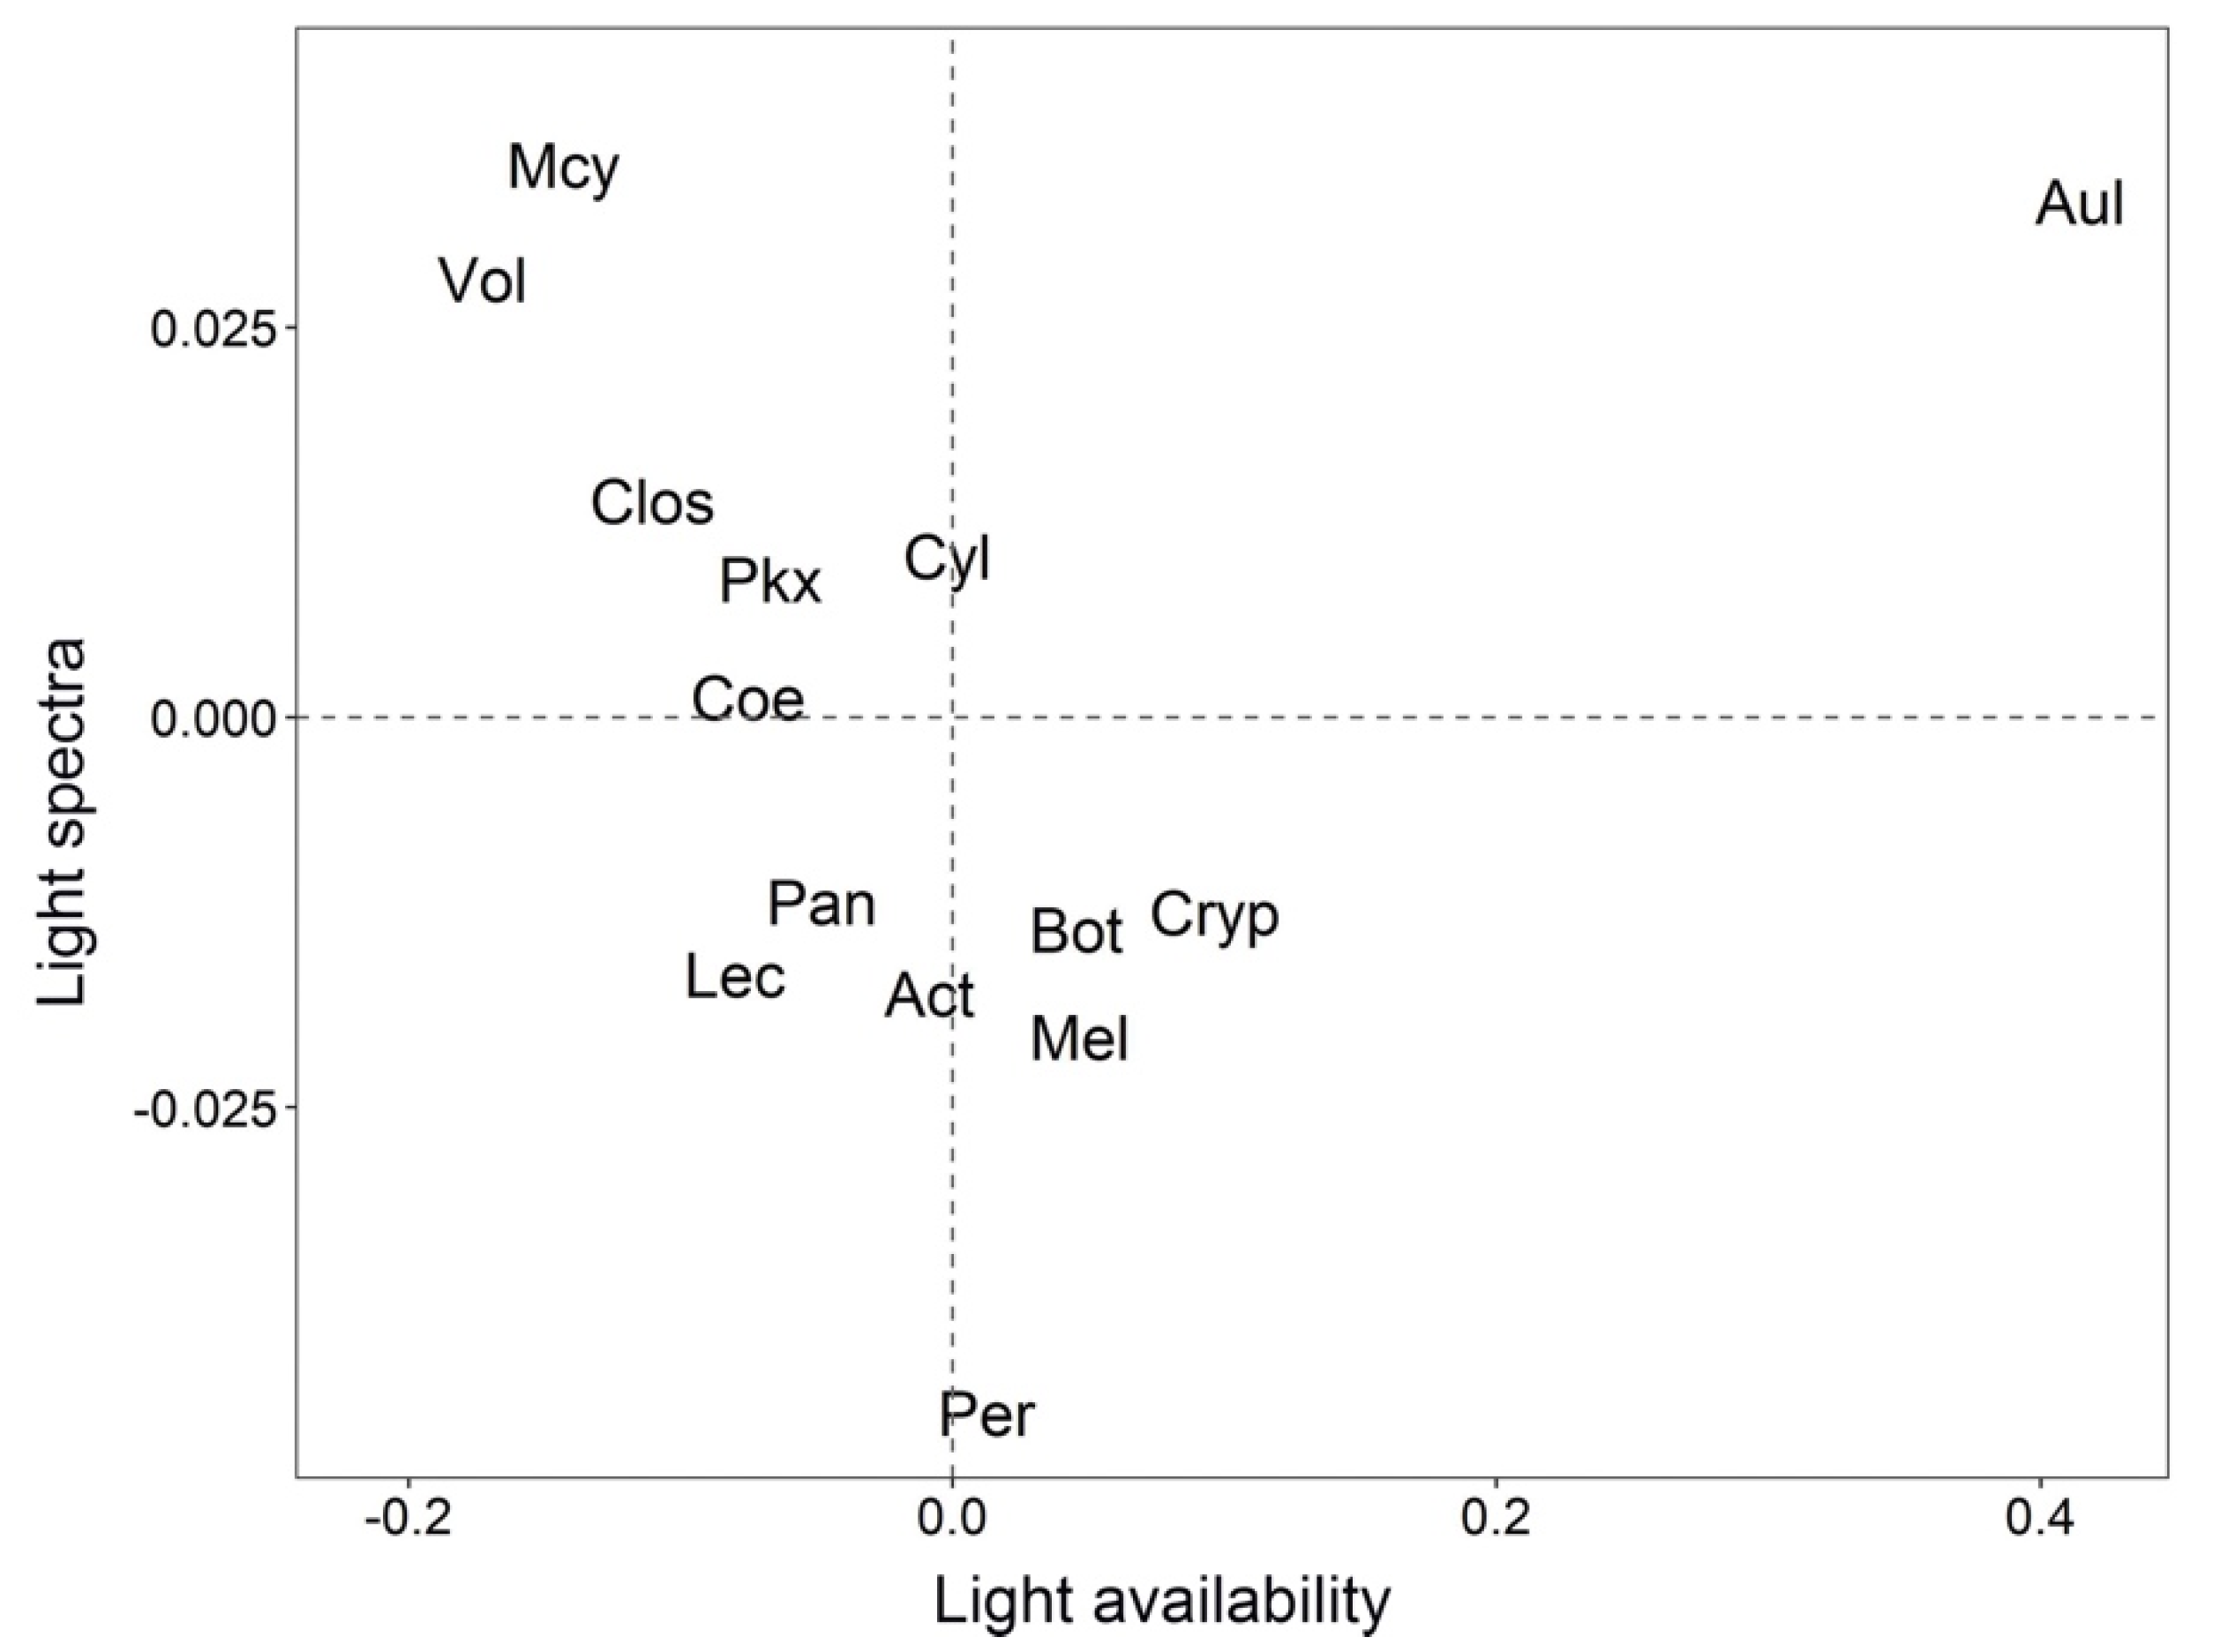
The Intrastructure graph (Figure 5) plots the principal phytoplankton genera that demonstrated a more stable relationship between the availability of light (x axis) and specific wavelengths of light (y axis). So that the figure would not be unreadable with all the genera, only those furthest from the central point were plotted on the graph (Table 2 and Figure 5).
As shown in Figure 5, the genera Microcystis (Mcy) and Vol are more related to the Kd increase (less light availability) in the B-08 (673 nm) and B-9 (681 nm) bands. In contrast, the genus Peridinium (Per), is related to the intermediate light condition and at the B-01 (412 nm) (Figure 5). On the other hand, the genus Aulacoseira (Aul) is on the opposite side of the Mcy bands (Figure 5), indicating that this genus is better adapted to lower values of Kd (higher light availability) in these spectral bands. A similar process happens with the genus Cryptomonas (Cry), which lies on the opposing side to the blue-green bands (Figure 5), indicating that they are best adapted to environments characterized by intermediate Kd values in those spectral bands.
4. Discussion
Amazon lakes, such as the Curuai Lake can have a basin with different water sources [70,71], which promotes an optically complex environment with different optical water types [65]. In this study, we explored the relationship between the underwater light field and phytoplankton taxonomy. As is well-known, the Amazon lakes present a pattern of cyanobacterial dominance in the phytoplankton community [74,75], and also it is not uncommon for lakes on the Amazon floodplain to have high turbidity [76], and a high eutrophic (nutrient-rich) state [77], especially during the rising and flushing periods.
Freshwater cyanobacteria, such as the Mcy, have pigments belonging to the phycobiliproteins family, occurring only in cyanobacteria, red algae, cryptophytes, and glaucophytes [78]. The principal phycobiliprotein in freshwater cyanobacteria is the phycocyanin, which allows absorption and transfer of light energy to chlorophyll using the available wavelengths of light (in the 550–650 nm range), absorbing energy where Chl is not a very efficient absorber [78,79]. The Mcy is the most strongly related to increases in Kd, demonstrating that these organisms tend to adopt a low light-adapted strategy and may be associated with their preference for high nutrient conditions [15,80,81]. The high biomass forms colonies and blooms on the water surface and also may create self-shading [82]. Therefore, the Mcy have a buoyancy ability that allows this species to maintain colonies in favorable light and nutrients conditions [83]. Indeed, the preference for low light availability may explain, at least partly, the vertical migration of Mcy during the day and their presence at the sub-surface early in the morning, as reported in previous studies [84,85].
On the other hand, the genus Cryptomonas (Cry) is related to intermediate values of Kd, indicating a moderate light-adapted strategy, and in the opposite side of the Mcy bands (B07–B09). The Cry have the phycobiliprotein pigments properties homologous to phycobiliproteins found in red algae and cyanobacteria. The presence of red algae phycobiliproteins in Cry called phycoerythrin allow them to efficiently absorb solar radiation in the range of 450–570 nm.
The Aulacoseira genus (Aul) is related to decreases in Kd in the blue-green bands, on the opposite side of B01–B03, demonstrating that these organisms have a high–light–adapted strategy at these spectra. The Aul is generally composed of species adapted to shallow lakes with clear water and tolerate eutrophic environments [86]. Aul belong to the group of diatoms, which have both Chl-c and carotenoids as pigments. The carotenoids are usually red, orange, or yellow pigments, including the brown pigment fucoxanthin that absorbs light in the wavelength range of 410 to 550 nm. Both pigments improve Aul efficiency light-harvesting in blue-green bands and, along with to other physiological and physical characteristics, this makes them best adapted to these environments.
In a recent study, Matthews et al. [20] demonstrated how a hyperspectral inversion algorithm can be used to differentiate between cyanobacteria and algal blooms in inland waters. However, apart from that carried out by Matthews et. al., the majority of studies in inland waters ignored aspects such as the natural variability of Optically Active Constituents (OACs), and others factors which are considered important diagnostic drivers of the resulting remote sensing reflectance. The variability in OAC concentration modifies the light attenuation, an factor in Amazon floodplain waters that is essential to better understanding the biogeochemical processes which are not fully explained due to the complexity of land–water interactions [11,67]. We have demonstrated that the Diffuse Attenuation Coefficient (Kd) can be used as a proxy to identify not only cyanobacteria, but other genera related to light resources for the phytoplankton community in the Curuai Lake, Pará, Brazil. Our results have shown a way to overcome the challenge of using orbital data as a tool to identify the genera of phytoplankton in optically complex freshwater environments. Despite the limited number of samples and uncertainties in the analytically inverting in situ Rrs into Kd, the STATICO analysis allowed us to probe the relationships between phytoplankton genera and the multispectral Kd simulated to visible OLCI bands. The next steps of this study are to apply this approach to a new dataset and to compare the results with Kd retrieved from OLCI images collected simultaneously with the in situ biological data. It would also be interesting and very enlightening to add the biological diversity indices to the analysis and use data from an entire hydrological cycle, with data collection carried out at different times in the cycle. However, organizing data collection campaigns of this size in the Amazon region is a challenge in itself, due to several factors, mainly financial, since the cost of each of these campaigns tends to be high.
5. Conclusions
To the extent of our knowledge, this is the first attempt to use the STATICO method to unravel the relationship between the phytoplankton community and spectral light availability in the visible domain expressed by multispectral Kd. Our methodology is an important step in accessing the genera of phytoplankton communities in tropical freshwater floodplains using orbital data. For instance, spectral Kd could be used together with one of the several biodiversity indexes, such as the beta diversity index. These findings reinforce previous results obtained in Amazon Lakes and elsewhere, demonstrating that light could be a structural factor for the phytoplankton community [75,76], and showing that the multispectral measurements of Kd have the potential to become an efficient optical proxy of the phytoplankton diversity of floodplain lakes. Still, there is a long way to go before satellite Kd measurements can be used unequivocally as a proxy for phytoplankton biodiversity but these preliminary results are promising.
Supplementary Materials
The following are available online at https://www.mdpi.com/article/10.3390/rs13204114/s1, Table S1: Phytoplankton taxonomy.
Author Contributions
Conceptualization, C.N.K. and E.M.L.d.M.N. methodology, C.N.K. and D.A.M.; formal analysis, C.N.K.; investigation, C.N.K., D.A.M., E.M.L.d.M.N. and M.P.B.; data curation, C.N.K. and D.A.M.; writing—original draft preparation, C.N.K.; writing—review and editing, D.A.M., E.M.L.d.M.N. and M.P.B.; supervision, E.M.L.d.M.N.; project administration, M.P.B.; funding acquisition, M.P.B. All authors have read and agreed to the published version of the manuscript.
Funding
This research is funded through the 2017–2018 Belmont Forum and BiodivERsA joint call for research proposals, under the BiodivScen ERA-Net COFUND programme, and with the funding organizations French National Research Agency (ANR), São Paulo Research Foundation (FAPESP-Grant 2019/15984-2 and 2018/12083-1), National Science Foundation (NSF), the Research Council of Norway and the German Federal Ministry of Education and Research (BMBF). The study was also funded by the SABERES “Sustaining Amazon floodplain biodiversity and fisheries under climate change” funded by the BNP Paribas fundation within its call Climate & Biodiversity Initiative 2019. This study was financed in part by the Coordenação de Aperfeiçoamento de Pessoal de Nível Superior, Brasil (CAPES), Finance Code 001. Data were collected in the framework of the Clim-FABIAM: “Climate changes and Floodplain lake biodiversity in the Amazon Basin: how to cope and help the ecological and economic sustainability” project funded by the French Fundation for Biodiversity research (FRB) Modelling and Scenarios of Biodiversity 2011 call.
Conflicts of Interest
The authors declare no conflict of interest.
References
- Rastogi, R.P.; Madamwar, D.; Incharoensakdi, A. Bloom dynamics of cyanobacteria and their toxins: Environmental health impacts and mitigation strategies. Front. Microbiol. 2015, 6, 1254. [Google Scholar] [CrossRef] [PubMed] [Green Version]
- Vicentin, A.M.; Rodrigues, E.H.C.; Moschini-Carlos, V.; Pompêo, M.L.M. Is it possible to evaluate the ecological status of a reservoir using the phytoplankton community? Acta Limnol. Bras. 2018, 30, 1–15. [Google Scholar] [CrossRef] [Green Version]
- Joa, S.J.C.; Lopes, P.M.; Bozelli, R.L.; Huszar, V.L.M.M.; Cardoso, S.J.; Nabout, J.C.; Farjalla, V.F.; Lopes, P.M.; Bozelli, R.L.; Huszar, V.L.M.M.; et al. Environmental factors driving phytoplankton taxonomic and functional diversity in Amazonian floodplain lakes. Hydrobiologia 2017, 802, 115–130. [Google Scholar] [CrossRef]
- Mellard, J.P.; Yoshiyama, K.; Litchman, E.; Klausmeier, C.A. The vertical distribution of phytoplankton in stratified water columns. J. Theor. Biol. 2011, 269, 16–30. [Google Scholar] [CrossRef] [PubMed]
- Xiao, M.; Willis, A.; Burford, M.A. Differences in cyanobacterial strain responses to light and temperature reflect species plasticity. Harmful Algae 2017, 62, 84–93. [Google Scholar] [CrossRef] [PubMed] [Green Version]
- Geider, R.J.; Maclntyre, H.L.; Kana, T.M. A dynamic regulatory model of phytoplanktonic acclimation to light, nutrients, and temperature. Limnol. Oceanogr. 1998, 43, 679–694. [Google Scholar] [CrossRef]
- Reynolds, C.S. What factors influence the species composition of phytoplankton in lakes of different trophic status? In Phytoplankton and Trophic Gradients; Springer: Dordrecht, The Netherlands, 1998; Volumes 369–370, pp. 11–26. [Google Scholar]
- Ma, J.; Song, K.; Wen, Z.; Zhao, Y.; Shang, Y.; Fang, C.; Du, J. Spatial distribution of diffuse attenuation of photosynthetic active radiation and its main regulating factors in Inland Waters of Northeast China. Remote Sens. 2016, 8, 964. [Google Scholar] [CrossRef] [Green Version]
- Vadakke-Chanat, S.; Shanmugam, P. Modeling the contributions of phytoplankton and non-algal particles to spectral scattering properties in near-shore and lagoon waters. Cont. Shelf Res. 2017, 135, 35–46. [Google Scholar] [CrossRef]
- Chapman, P.M.; Hayward, A.; Faithful, J. Total Suspended Solids Effects on Freshwater Lake Biota Other than Fish. Bull. Environ. Contam. Toxicol. 2017, 99, 423–427. [Google Scholar] [CrossRef]
- Kraus, C.N.; Bonnet, M.P.; Nogueira, I.d.S.; Lobo, M.T.M.P.S.; Marques, D.d.M.; Garnier, J.; Vieira, L.C.G. Unraveling flooding dynamics and nutrients’ controls upon phytoplankton functional dynamics in Amazonian floodplain lakes. Water 2019, 11, 154. [Google Scholar] [CrossRef] [Green Version]
- Behrenfeld, M.J.; Falkowski, P.G. A consumer’s guide to phytoplankton primary productivity models. Limnol. Oceanogr. 1997, 42, 1479–1491. [Google Scholar] [CrossRef] [Green Version]
- Lisi, P.J.; Hein, C.L. Eutrophication drives divergent water clarity responses to decadal variation in lake level. Limnol. Oceanogr. 2019, 64, S49–S59. [Google Scholar] [CrossRef] [Green Version]
- Bernardo, N.; Alcântara, E.; Watanabe, F.; Rodrigues, T.; do Carmo, A.; Gomes, A.C.C.; Andrade, C. Light Absorption Budget in a Reservoir Cascade System with Widely Differing Optical Properties. Water 2019, 11, 229. [Google Scholar] [CrossRef] [Green Version]
- Le, C.; Li, Y.; Zha, Y.; Sun, D. Specific absorption coefficient and the phytoplankton package effect in Lake Taihu, China. Hydrobiologia 2009, 619, 27–37. [Google Scholar] [CrossRef]
- Zhang, Y.; Yin, Y.; Wang, M.; Liu, X. Effect of phytoplankton community composition and cell size on absorption properties in eutrophic shallow lakes: Field and experimental evidence. Opt. Express 2012, 20, 11882. [Google Scholar] [CrossRef]
- Paavel, B.; Kangro, K.; Arst, H.; Reinart, A.; Kutser, T.; Nõges, T. Parameterization of chlorophyll-specific phytoplankton absorption coefficients for productive lake waters. J. Limnol. 2016, 75, 423–438. [Google Scholar] [CrossRef] [Green Version]
- Chase, A.P.; Kramer, S.J.; Haëntjens, N.; Boss, E.S.; Karp-Boss, L.; Edmondson, M.; Graff, J.R. Evaluation of diagnostic pigments to estimate phytoplankton size classes. Limnol. Oceanogr. Methods 2020, 18, 570–584. [Google Scholar] [CrossRef] [PubMed]
- Arteaga, L.A.; Boss, E.; Behrenfeld, M.J.; Westberry, T.K.; Sarmiento, J.L. Seasonal modulation of phytoplankton biomass in the Southern Ocean. Nat. Commun. 2020, 11, 5364. [Google Scholar] [CrossRef] [PubMed]
- Matthews, M.W.; Bernard, S.; Evers-King, H.; Robertson Lain, L. Distinguishing cyanobacteria from algae in optically complex inland waters using a hyperspectral radiative transfer inversion algorithm. Remote Sens. Environ. 2020, 248, 111981. [Google Scholar] [CrossRef]
- Ryabov, A.B.; Rudolf, L.; Blasius, B. Vertical distribution and composition of phytoplankton under the influence of an upper mixed layer. J. Theor. Biol. 2010, 263, 120–133. [Google Scholar] [CrossRef] [PubMed] [Green Version]
- Bricaud, A.; Babin, M.; Morel, A.; Claustre, H. Variability in the chlorophyll-specific absorption coefficients of natural phytoplankton: Analysis and parameterization. J. Geophys. Res. 1995, 100, 13321. [Google Scholar] [CrossRef]
- Serive, B.; Nicolau, E.; Bérard, J.B.; Kaas, R.; Pasquet, V.; Picot, L.; Cadoret, J.P. Community Analysis of Pigment Patterns from 37 Microalgae Strains Reveals New Carotenoids and Porphyrins Characteristic of Distinct Strains and Taxonomic Groups. PLoS ONE 2017, 12, e0171872. [Google Scholar] [CrossRef]
- Uitz, J.; Huot, Y.; Bruyant, F.; Babin, M.; Claustre, H. Relating phytoplankton photophysiological properties to community structure on large scales. Limnol. Oceanogr. 2008, 53, 614–630. [Google Scholar] [CrossRef] [Green Version]
- Lawrenz, E.; Smith, E.M.; Richardson, T.L. Spectral Irradiance, Phytoplankton Community Composition and Primary Productivity in a Salt Marsh Estuary, North Inlet, South Carolina, USA. Estuaries Coasts 2013, 36, 347–364. [Google Scholar] [CrossRef]
- Meler, J.; Ostrowska, M.; Ficek, D.; Zdun, A. Light absorption by phytoplankton in the southern Baltic and Pomeranian lakes: Mathematical expressions for remote sensing applications. Oceanologia 2017, 59, 195–212. [Google Scholar] [CrossRef]
- Wilhelm, C.; Becker, A.; Toepel, J.; Vieler, A.; Rautenberger, R. Photophysiology and primary production of phytoplankton in freshwater. Physiol. Plant. 2004, 120, 347–357. [Google Scholar] [CrossRef]
- Grimm, B.; Porra, R.J.; Scheer, H. Chlorophylls and Bacteriochlorophylls; Grimm, B., Porra, R.J., Rüdiger, W., Scheer, H., Eds.; Advances in Photosynthesis and Respiration; Springer: Dordrecht, The Netherlands, 2006; Volume 25, ISBN 978-1-4020-4515-8. [Google Scholar]
- Zapata, M.; Garrido, J.L.; Jeffrey, S.W. Chlorophyll c Pigments: Current Status. In Chlorophylls and Bacteriochlorophylls; Springer: Dordrecht, The Netherlands, 2007; pp. 39–53. [Google Scholar] [CrossRef]
- Chase, A.P.; Boss, E.; Cetinić, I.; Slade, W. Estimation of Phytoplankton Accessory Pigments From Hyperspectral Reflectance Spectra: Toward a Global Algorithm. J. Geophys. Res. Ocean. 2017, 122, 9725–9743. [Google Scholar] [CrossRef]
- Bricaud, A. Natural variability of phytoplanktonic absorption in oceanic waters: Influence of the size structure of algal populations. J. Geophys. Res. 2004, 109, C11010. [Google Scholar] [CrossRef]
- Jeffrey, S.W.; Wright, S.W.; Zapata, M. Microalgal classes and their signature pigments. In Phytoplankton Pigments; Roy, S., Llewellyn, C., Egeland, E.S., Johnsen, G., Eds.; Cambridge University Press: Cambridge, UK, 2012; pp. 3–77. ISBN 9780511732263. [Google Scholar]
- Mackey, M.; Mackey, D.; Higgins, H.; Wright, S. CHEMTAX—A program for estimating class abundances from chemical markers:application to HPLC measurements of phytoplankton. Mar. Ecol. Prog. Ser. 1996, 144, 265–283. [Google Scholar] [CrossRef] [Green Version]
- Hmimina, G.; Hulot, F.D.; Humbert, J.F.; Quiblier, C.; Tambosco, K.; Lemaire, B.J.; Vinçon-Leite, B.; Audebert, L.; Soudani, K. Linking phytoplankton pigment composition and optical properties: A framework for developing remote-sensing metrics for monitoring cyanobacteria. Water Res. 2019, 148, 504–514. [Google Scholar] [CrossRef] [Green Version]
- Heath, M.R.; Richardson, K.; Kirboe, T. Optical assessment of phytoplankton nutrient depletion. J. Plankton Res. 1990, 12, 381–396. [Google Scholar] [CrossRef]
- Soberón, J. Commentary on Ditch, Stitch and Pitch: The niche is here to stay. J. Biogeogr. 2014, 41, 414–417. [Google Scholar] [CrossRef] [Green Version]
- Grüner, N.; Gebühr, C.; Boersma, M.; Feudel, U.; Wiltshire, K.H.; Freund, J.A. Reconstructing the realized niche of phytoplankton species from environmental data: Fitness versus abundance approach. Limnol. Oceanogr. Methods 2011, 9, 432–442. [Google Scholar] [CrossRef]
- da Silva, M.N.; Granzotti, R.V.; de Carvalho, P.; Rodrigues, L.C.; Bini, L.M. Niche measures and growth rate do not predict interspecific variation in spatial synchrony of phytoplankton. Limnology 2020. [Google Scholar] [CrossRef]
- Karasiewicz, S.; Breton, E.; Lefebvre, A.; Hernández Fariñas, T.; Lefebvre, S. Realized niche analysis of phytoplankton communities involving HAB: Phaeocystis spp. as a case study. Harmful Algae 2018, 72, 1–13. [Google Scholar] [CrossRef] [PubMed] [Green Version]
- Petchey, O.L.; Gaston, K.J. Functional diversity: Back to basics and looking forward. Ecol. Lett. 2006, 9, 741–758. [Google Scholar] [CrossRef]
- Villéger, S.; Mason, N.W.H.; Mouillot, D. New multidimensional functional diversity indices for a multifaceted framework in functional ecology. Ecology 2008, 89, 2290–2301. [Google Scholar] [CrossRef] [PubMed] [Green Version]
- Reynolds, C.S.; Huszar, V.; Kruk, C.; Naselli-Flores, L.; Melo, S. Towards a functional classification of the freshwater phytoplankton. J. Plankton Res. 2002, 24, 417–428. [Google Scholar] [CrossRef]
- Ptacnik, R.; Andersen, T.; Brettum, P.; Lepistö, L.; Willén, E. Regional species pools control community saturation in lake phytoplankton. Proc. R. Soc. B Biol. Sci. 2010, 277, 3755–3764. [Google Scholar] [CrossRef] [Green Version]
- Salmaso, N.; Naselli-Flores, L.; Padisák, J. Functional classifications and their application in phytoplankton ecology. Freshw. Biol. 2015, 60, 603–619. [Google Scholar] [CrossRef] [Green Version]
- Nair, A.; Sathyendranath, S.; Platt, T.; Morales, J.; Stuart, V.; Forget, M.-H.; Devred, E.; Bouman, H. Remote sensing of phytoplankton functional types. Remote Sens. Environ. 2008, 112, 3366–3375. [Google Scholar] [CrossRef]
- Uitz, J.; Stramski, D.; Reynolds, R.A.; Dubranna, J. Assessing phytoplankton community composition from hyperspectral measurements of phytoplankton absorption coefficient and remote-sensing reflectance in open-ocean environments. Remote Sens. Environ. 2015, 171, 58–74. [Google Scholar] [CrossRef]
- Muller-Karger, F.E.; Hestir, E.; Ade, C.; Turpie, K.; Roberts, D.A.; Siegel, D.; Miller, R.J.; Humm, D.; Izenberg, N.; Keller, M.; et al. Satellite sensor requirements for monitoring essential biodiversity variables of coastal ecosystems. Ecol. Appl. 2018, 28, 749–760. [Google Scholar] [CrossRef] [PubMed]
- Pahlevan, N.; Smith, B.; Binding, C.; Gurlin, D.; Li, L.; Bresciani, M.; Giardino, C. Hyperspectral retrievals of phytoplankton absorption and chlorophyll-a in inland and nearshore coastal waters. Remote Sens. Environ. 2021, 253, 112200. [Google Scholar] [CrossRef]
- Wang, M.; Son, S.; Harding, L.W. Retrieval of diffuse attenuation coefficient in the Chesapeake Bay and turbid ocean regions for satellite ocean color applications. J. Geophys. Res. 2009, 114, C10011. [Google Scholar] [CrossRef]
- Mobley, C.D. Polarized reflectance and transmittance properties of windblown sea surfaces. Appl. Opt. 2015, 54, 4828. [Google Scholar] [CrossRef] [PubMed]
- Mishra, D.R.; Narumalani, S.; Rundquist, D.; Lawson, M. Characterizing the vertical diffuse attenuation coefficient for downwelling irradiance in coastal waters: Implications for water penetration by high resolution satellite data. ISPRS J. Photogramm. Remote Sens. 2005, 60, 48–64. [Google Scholar] [CrossRef]
- Smith, R.C.; Baker, K.S. Optical classification of natural waters 1. Limnol. Oceanogr. 1978, 23, 260–267. [Google Scholar] [CrossRef]
- Sathyendranath, S.; Platt, T.; Caverhill, C.M.; Warnock, R.E.; Lewis, M.R. Remote sensing of oceanic primary production: Computations using a spectral model. Deep Sea Res. Part A. Oceanogr. Res. Pap. 1989, 36, 431–453. [Google Scholar] [CrossRef]
- Bergamino, N.; Horion, S.; Stenuite, S.; Cornet, Y.; Loiselle, S.; Plisnier, P.-D.; Descy, J.-P. Spatio-temporal dynamics of phytoplankton and primary production in Lake Tanganyika using a MODIS based bio-optical time series. Remote Sens. Environ. 2010, 114, 772–780. [Google Scholar] [CrossRef]
- Bonnet, M.P.; Barroux, G.; Martinez, J.M.; Seyler, F.; Moreira-Turcq, P.; Cochonneau, G.; Melack, J.M.; Boaventura, G.; Maurice-Bourgoin, L.; León, J.G.; et al. Floodplain hydrology in an Amazon floodplain lake (Lago Grande de Curuaí). J. Hydrol. 2008, 349, 18–30. [Google Scholar] [CrossRef] [Green Version]
- Moquet, J.-S.; Crave, A.; Viers, J.; Seyler, P.; Armijos, E.; Bourrel, L.; Chavarri, E.; Lagane, C.; Laraque, A.; Casimiro, W.S.L.; et al. Chemical weathering and atmospheric/soil CO2 uptake in the Andean and Foreland Amazon basins. Chem. Geol. 2011, 287, 1–26. [Google Scholar] [CrossRef]
- Lapo, K.E.; Hinkelman, L.M.; Raleigh, M.S.; Lundquist, J.D. Impact of errors in the downwelling irradiances on simulations of snow water equivalent, snow surface temperature, and the snow energy balance. Water Resour. Res. 2015, 51, 1649–1670. [Google Scholar] [CrossRef]
- Sioli, H. (Ed.) Monographiae Biologicae; Monographi; Springer: Dordrecht, The Netherlands, 1984; Volume 56, ISBN 978-94-009-6544-7. [Google Scholar]
- Bonnet, M.P.; Garnier, J.; Barroux, G.; Boaventura, G.R.; Seyler, P. Biogeochemical functioning of Amazonian floodplains: The case of Lago Grande de Curua. In Riparian Zones: Characteristics, Management Practices and Ecological Impacts; Pokrovsky, O.S., Viers, J., Eds.; Nova Science Publishers: Hauppauge, NY, USA, 2016; pp. 77–98. ISBN 9781634846363. [Google Scholar]
- Utermöhl, H. Zur vervollkommnung der quantitativen phytoplankton-methodik. Mitt. Int. Ver. Theor. Angew. Limnol. 1958, 9, 1–38. [Google Scholar] [CrossRef]
- Lund, J.W.G.; Kipling, C.; Le Cren, E.D. The inverted microscope method of estimating algal numbers and the statistical basis of estimations by counting. Hydrobiologia 1958, 11, 143–170. [Google Scholar] [CrossRef]
- Guiry, M.D.; Guiry, G.M. AlgaeBase. World-Wide Electronic Publication. 2018. Available online: http//www.algaebase.org (accessed on 1 October 2021).
- Hillebrand, H.; Dürselen, C.D.; Kirschtel, D.; Pollingher, U.; Zohary, T. Biovolume calculation for pelagic and benthic microalgae. J. Phycol. 1999, 35, 403–424. [Google Scholar] [CrossRef]
- da Silva, E.F.F.; Novo, E.; Lobo, F.; Barbosa, C.; Tressmann, C.; Noernberg, M.A.; Rotta, L.H.d.S. A machine learning approach for monitoring Brazilian optical water types using Sentinel-2 MSI. Remote Sens. Appl. Soc. Environ. 2021, 23, 100577. [Google Scholar]
- da Silva, E.F.F.; Novo, E.M.L.d.M.; Lobo, F.; Barbosa, C.; Noernberg, M.A.; Rotta, L.H.d.S.; Cairo, C.T.; Maciel, D.A.; Flores Júnior, R. Optical water types found in Brazilian waters. Limnology 2020. [Google Scholar] [CrossRef]
- Maciel, D.; Novo, E.; Sander de Carvalho, L.; Barbosa, C.; Flores Júnior, R.; de Lucia Lobo, F. Retrieving Total and Inorganic Suspended Sediments in Amazon Floodplain Lakes: A Multisensor Approach. Remote Sens. 2019, 11, 1744. [Google Scholar] [CrossRef] [Green Version]
- Maciel, D.A.; Barbosa, C.C.F.; Novo, E.M.L.d.M.; Cherukuru, N.; Martins, V.S.; Flores Júnior, R.; Jorge, D.S.; Sander de Carvalho, L.A.; Carlos, F.M. Mapping of diffuse attenuation coefficient in optically complex waters of amazon floodplain lakes. ISPRS J. Photogramm. Remote Sens. 2020, 170, 72–87. [Google Scholar] [CrossRef]
- Lee, Z.-P.; Hu, C.; Shang, S.; Du, K.; Lewis, M.; Arnone, R.; Brewin, R. Penetration of UV-visible solar radiation in the global oceans: Insights from ocean color remote sensing. J. Geophys. Res. Ocean. 2013, 118, 4241–4255. [Google Scholar] [CrossRef] [Green Version]
- Zhang, X.; Hu, L. Estimating scattering of pure water from density fluctuation of the refractive index. Opt. Express 2009, 17, 3485–3489. [Google Scholar] [CrossRef]
- Legendre, P.; Borcard, D. Box–Cox-chord transformations for community composition data prior to beta diversity analysis. Ecography 2018, 41, 1820–1824. [Google Scholar] [CrossRef] [Green Version]
- Dray, S.; Chessel, D.; Thioulouse, J. Co-inertia analysis and the linking of ecological data tables. Ecology 2003, 84, 3078–3089. [Google Scholar] [CrossRef] [Green Version]
- Thioulouse, J. Simultaneous analysis of a sequence of paired ecological tables: A comparison of several methods. Ann. Appl. Stat. 2011, 5, 2300–2325. [Google Scholar] [CrossRef] [Green Version]
- Slimani, N.; Guilbert, E.; El Ayni, F.; Jrad, A.; Boumaiza, M.; Thioulouse, J. The use of STATICO and COSTATIS, two exploratory three-ways analysis methods: An application to the ecology of aquatic heteroptera in the Medjerda watershed (Tunisia). Environ. Ecol. Stat. 2017, 24, 269–295. [Google Scholar] [CrossRef]
- Kraus, C.N.; Bonnet, M.-P.; Miranda, C.A.; de Souza Nogueira, I.; Garnier, J.; Vieira, L.C.G. Interannual hydrological variations and ecological phytoplankton patterns in Amazonian floodplain lakes. Hydrobiologia 2019, 830, 135–149. [Google Scholar] [CrossRef] [Green Version]
- Lobo, M.T.M.P.S.; de Souza Nogueira, I.; Fabris Sgarbi, L.; Nunes Kraus, C.; de Oliveira Bomfim, E.; Garnier, J.; da Motta Marques, D.; Bonnet, M.-P. Morphology-based functional groups as the best tool to characterize shallow lake-dwelling phytoplankton on an Amazonian floodplain. Ecol. Indic. 2018, 95, 579–588. [Google Scholar] [CrossRef]
- Alcântara, E.; Novo, E.; Stech, J.; Lorenzzetti, J.; Barbosa, C.; Assireu, A.; Souza, A. A contribution to understanding the turbidity behaviour in an Amazon floodplain. Hydrol. Earth Syst. Sci. 2010, 14, 351–364. [Google Scholar] [CrossRef] [Green Version]
- Affonso, A.; Barbosa, C.; Novo, E. Water quality changes in floodplain lakes due to the Amazon River flood pulse: Lago Grande de Curuaí (Pará). Braz. J. Biol. 2011, 71, 601–610. [Google Scholar] [CrossRef] [Green Version]
- Kannaujiya, V.K.; Sundaram, S.; Sinha, R.P. Evolution of Phycobiliproteins. In Phycobiliproteins: Recent Developments and Future Applications; Springer: Berlin/Heidelberg, Germany, 2017. [Google Scholar]
- MacColl, R.; Guard-Friar, D. Phycobiliproteins; CRC Press: Boca Raton, FL, USA, 2018; ISBN 135107556X. [Google Scholar]
- Wang, G.; Lee, Z.; Mouw, C. Multi-spectral remote sensing of phytoplankton pigment absorption properties in cyanobacteria bloom waters: A regional example in the Western Basin of Lake Erie. Remote Sens. 2017, 9, 1309. [Google Scholar] [CrossRef] [Green Version]
- Yang, B.; Jiang, Y.J.; He, W.; Liu, W.X.; Kong, X.Z.; Jørgensen, S.E.; Xu, F.L. The tempo-spatial variations of phytoplankton diversities and their correlation with trophic state levels in a large eutrophic Chinese lake. Ecol. Indic. 2016, 66, 153–162. [Google Scholar] [CrossRef] [Green Version]
- Paerl, H.W.; Otten, T.G. Harmful Cyanobacterial Blooms: Causes, Consequences, and Controls. Microb. Ecol. 2013, 65, 995–1010. [Google Scholar] [CrossRef] [PubMed]
- Reynolds, C.S.; Walsby, A.E. Water blooms. Biol. Rev. Camb. Philos. Soc. 1975, 50, 437–481. [Google Scholar] [CrossRef]
- Hunter, P.D.; Tyler, A.N.; Willby, N.J.; Gilvear, D.J. The spatial dynamics of vertical migration by Microcystis aeruginosa in a eutrophic shallow lake: A case study using high spatial resolution time-series airborne remote sensing. Limnol. Oceanogr. 2008, 53, 2391–2406. [Google Scholar] [CrossRef]
- Visser, P.M.; Passarge, J.; Mur, L.R. Modelling vertical migration of the cyanobacterium Microcystis. Hydrobiologia 1997, 349, 99–109. [Google Scholar] [CrossRef]
- O’Farrell, I.; Tell, G.; Podlejski, A. Morphological variability of Aulacoseira granulata (Ehr.) Simonsen (Bacillariophyceae) in the Lower Paraná River (Argentina). Limnology 2001, 2, 65–71. [Google Scholar] [CrossRef]
Figure 1.
Weight-specific (or pigment-specific) in vitro absorption spectra of various pigments, adapted from Bricaud, 2004, and Sentinel-3/Ocean and Land Color Instrument (OLCI) sensor bands used (B01 to B10).
Figure 1.
Weight-specific (or pigment-specific) in vitro absorption spectra of various pigments, adapted from Bricaud, 2004, and Sentinel-3/Ocean and Land Color Instrument (OLCI) sensor bands used (B01 to B10).
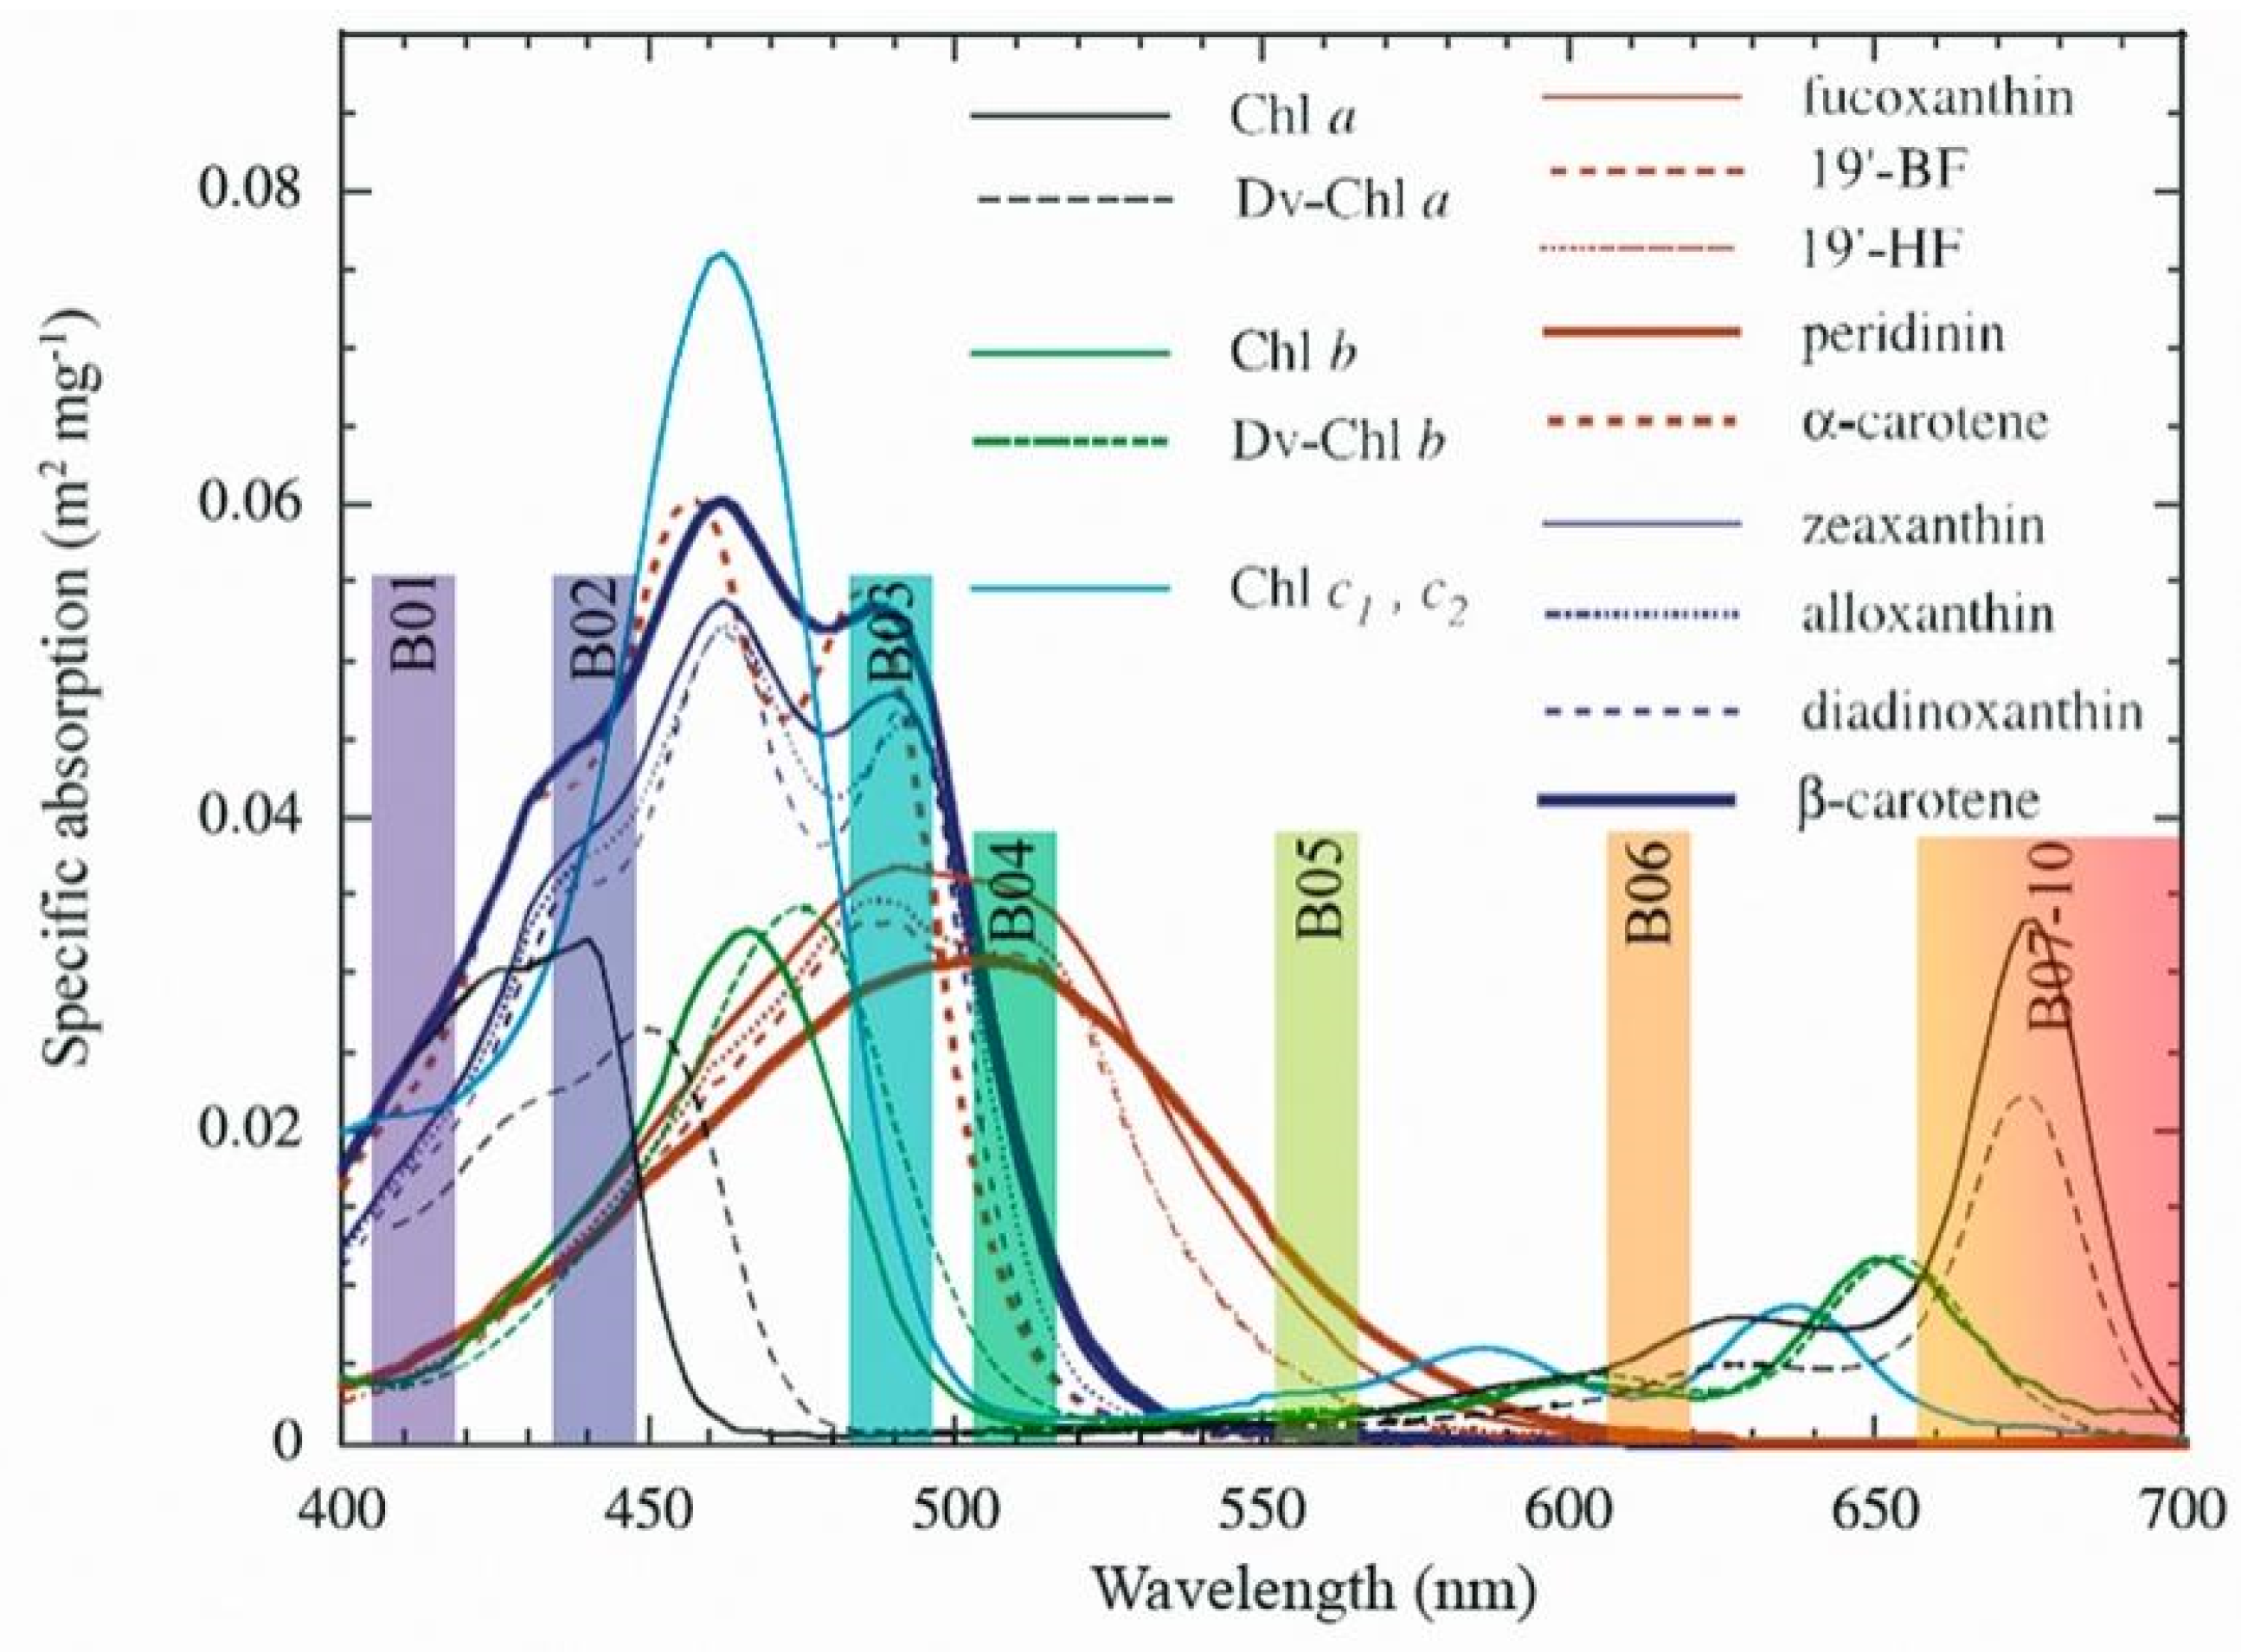
Figure 2.
Study Area of the Curuai floodplain lake system.
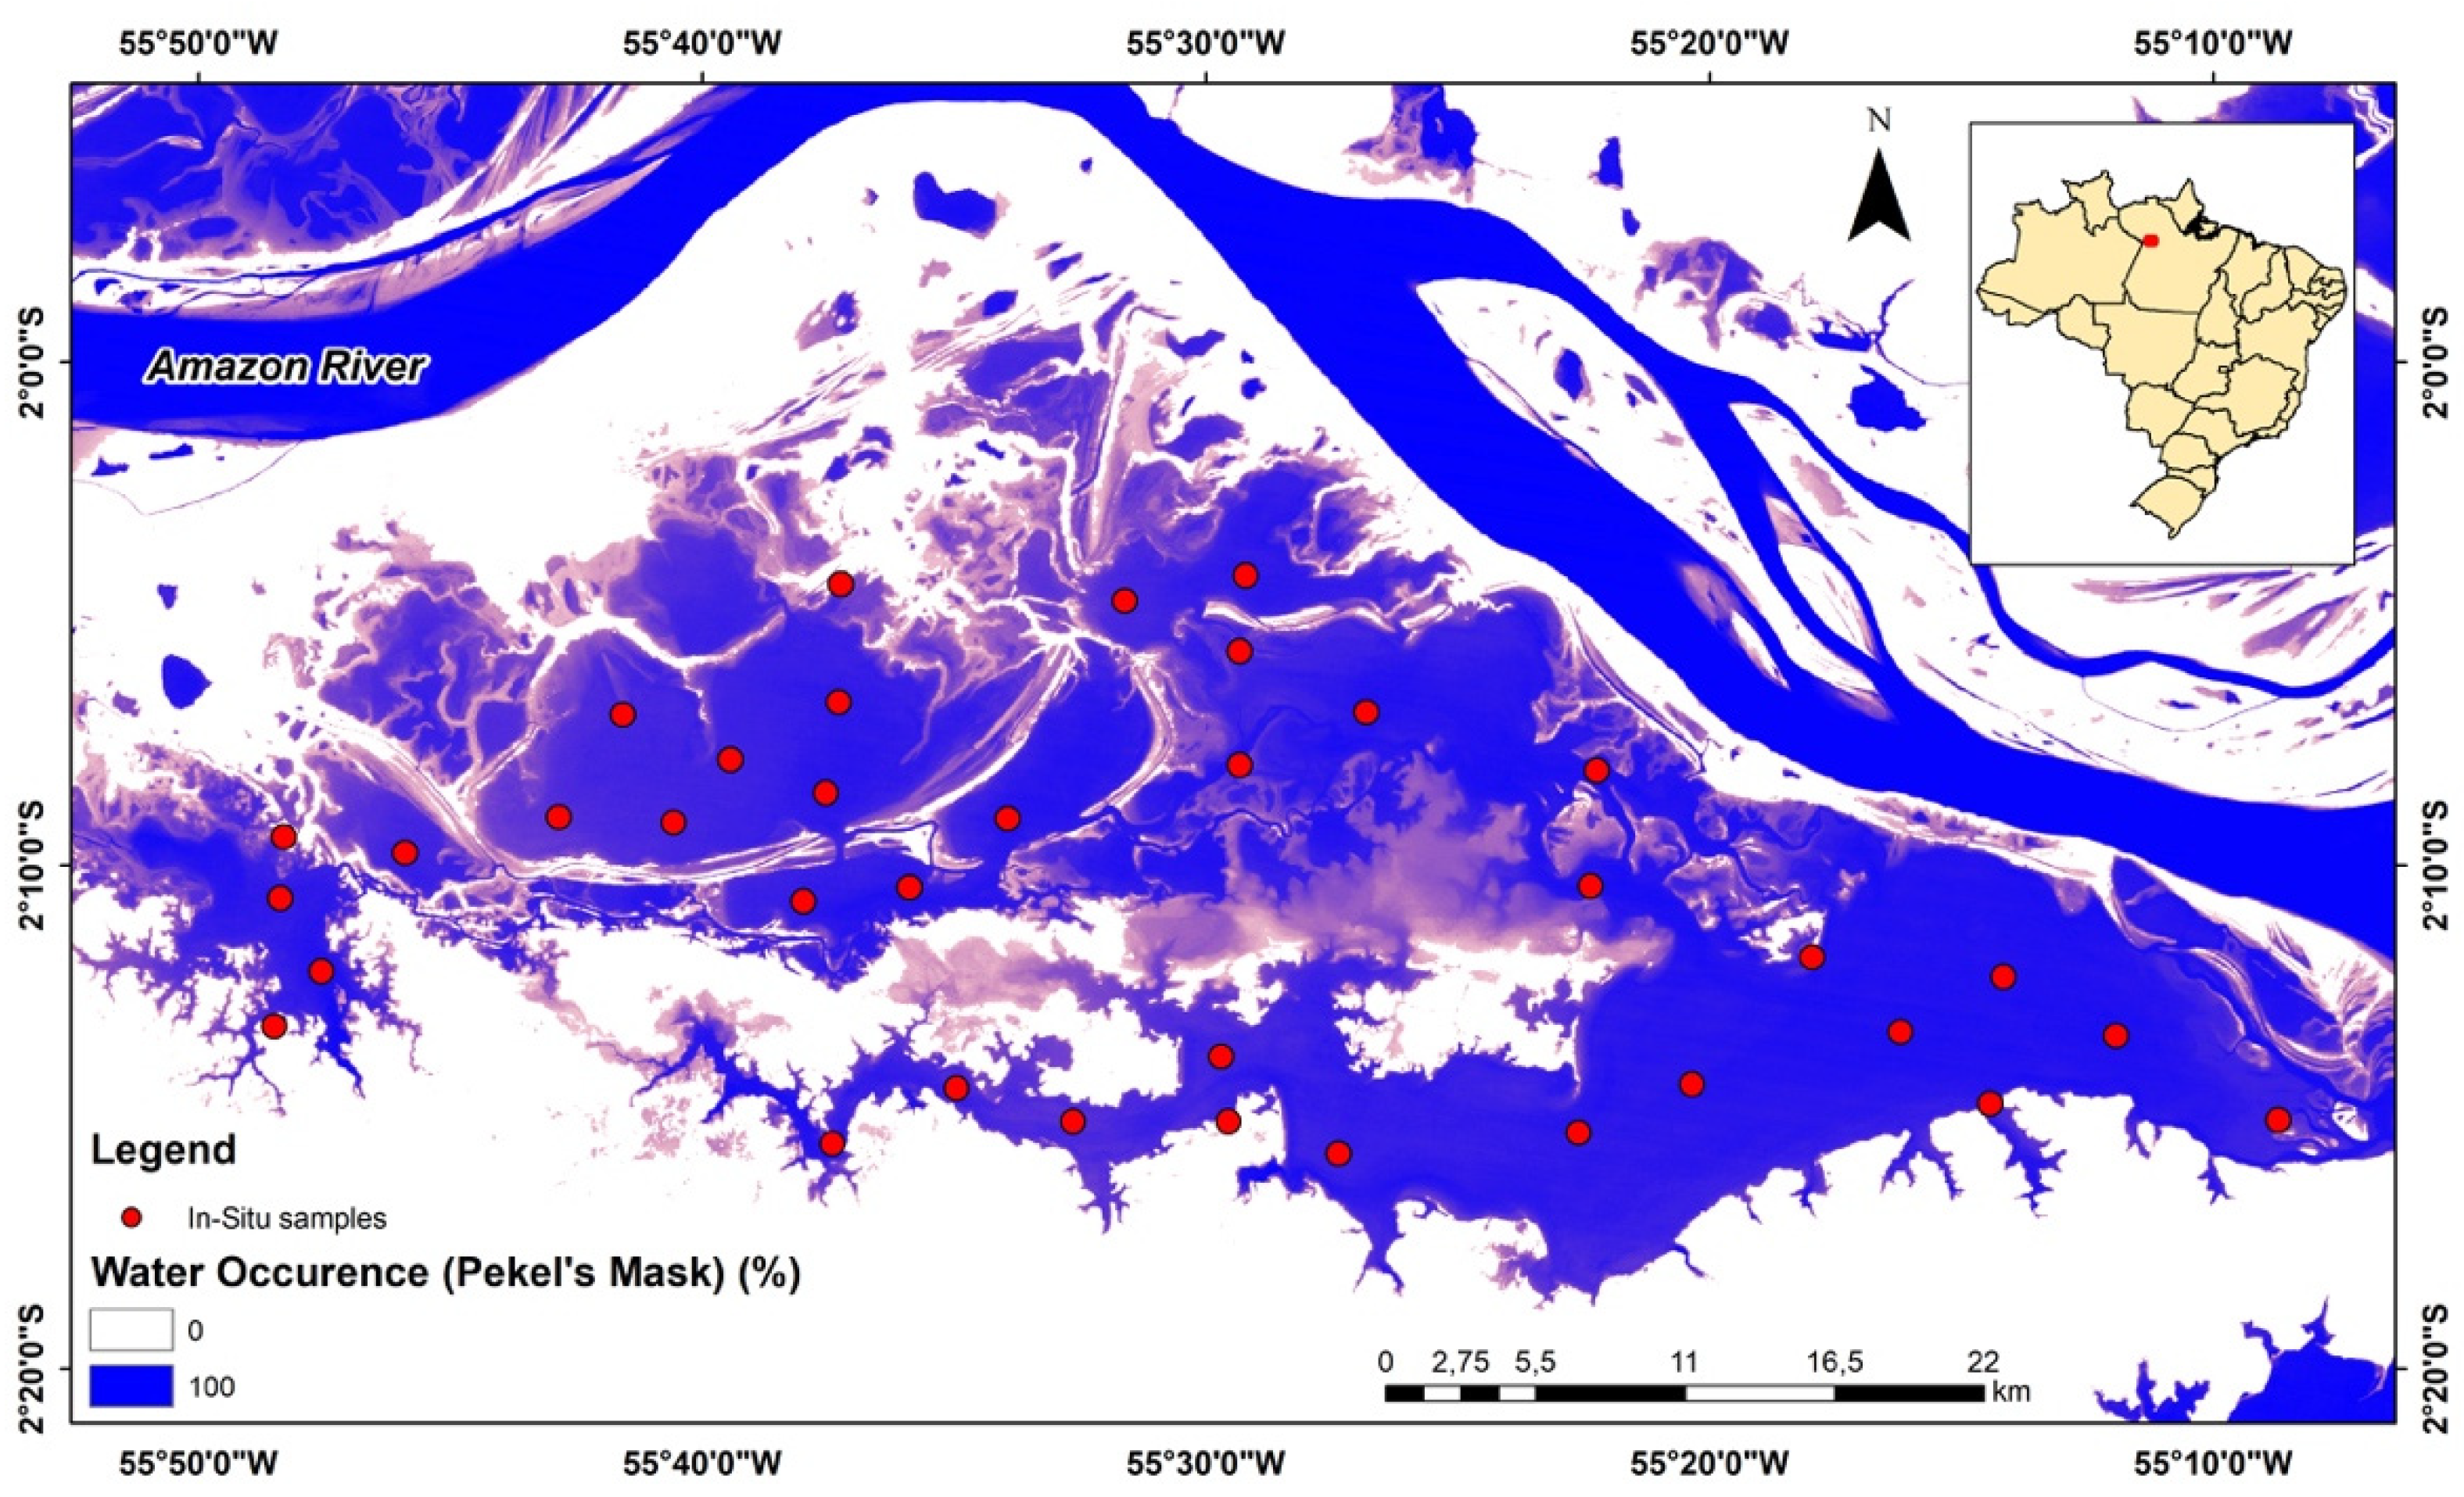
Figure 3.
Interstructure graph of STATICO analysis. This graph shows the importance of each sampling date in the compromise. The long arrows indicate a strong relation between Kd and the biovolume of the 97 phytoplankton genera, in both, RW and FW periods.
Figure 3.
Interstructure graph of STATICO analysis. This graph shows the importance of each sampling date in the compromise. The long arrows indicate a strong relation between Kd and the biovolume of the 97 phytoplankton genera, in both, RW and FW periods.
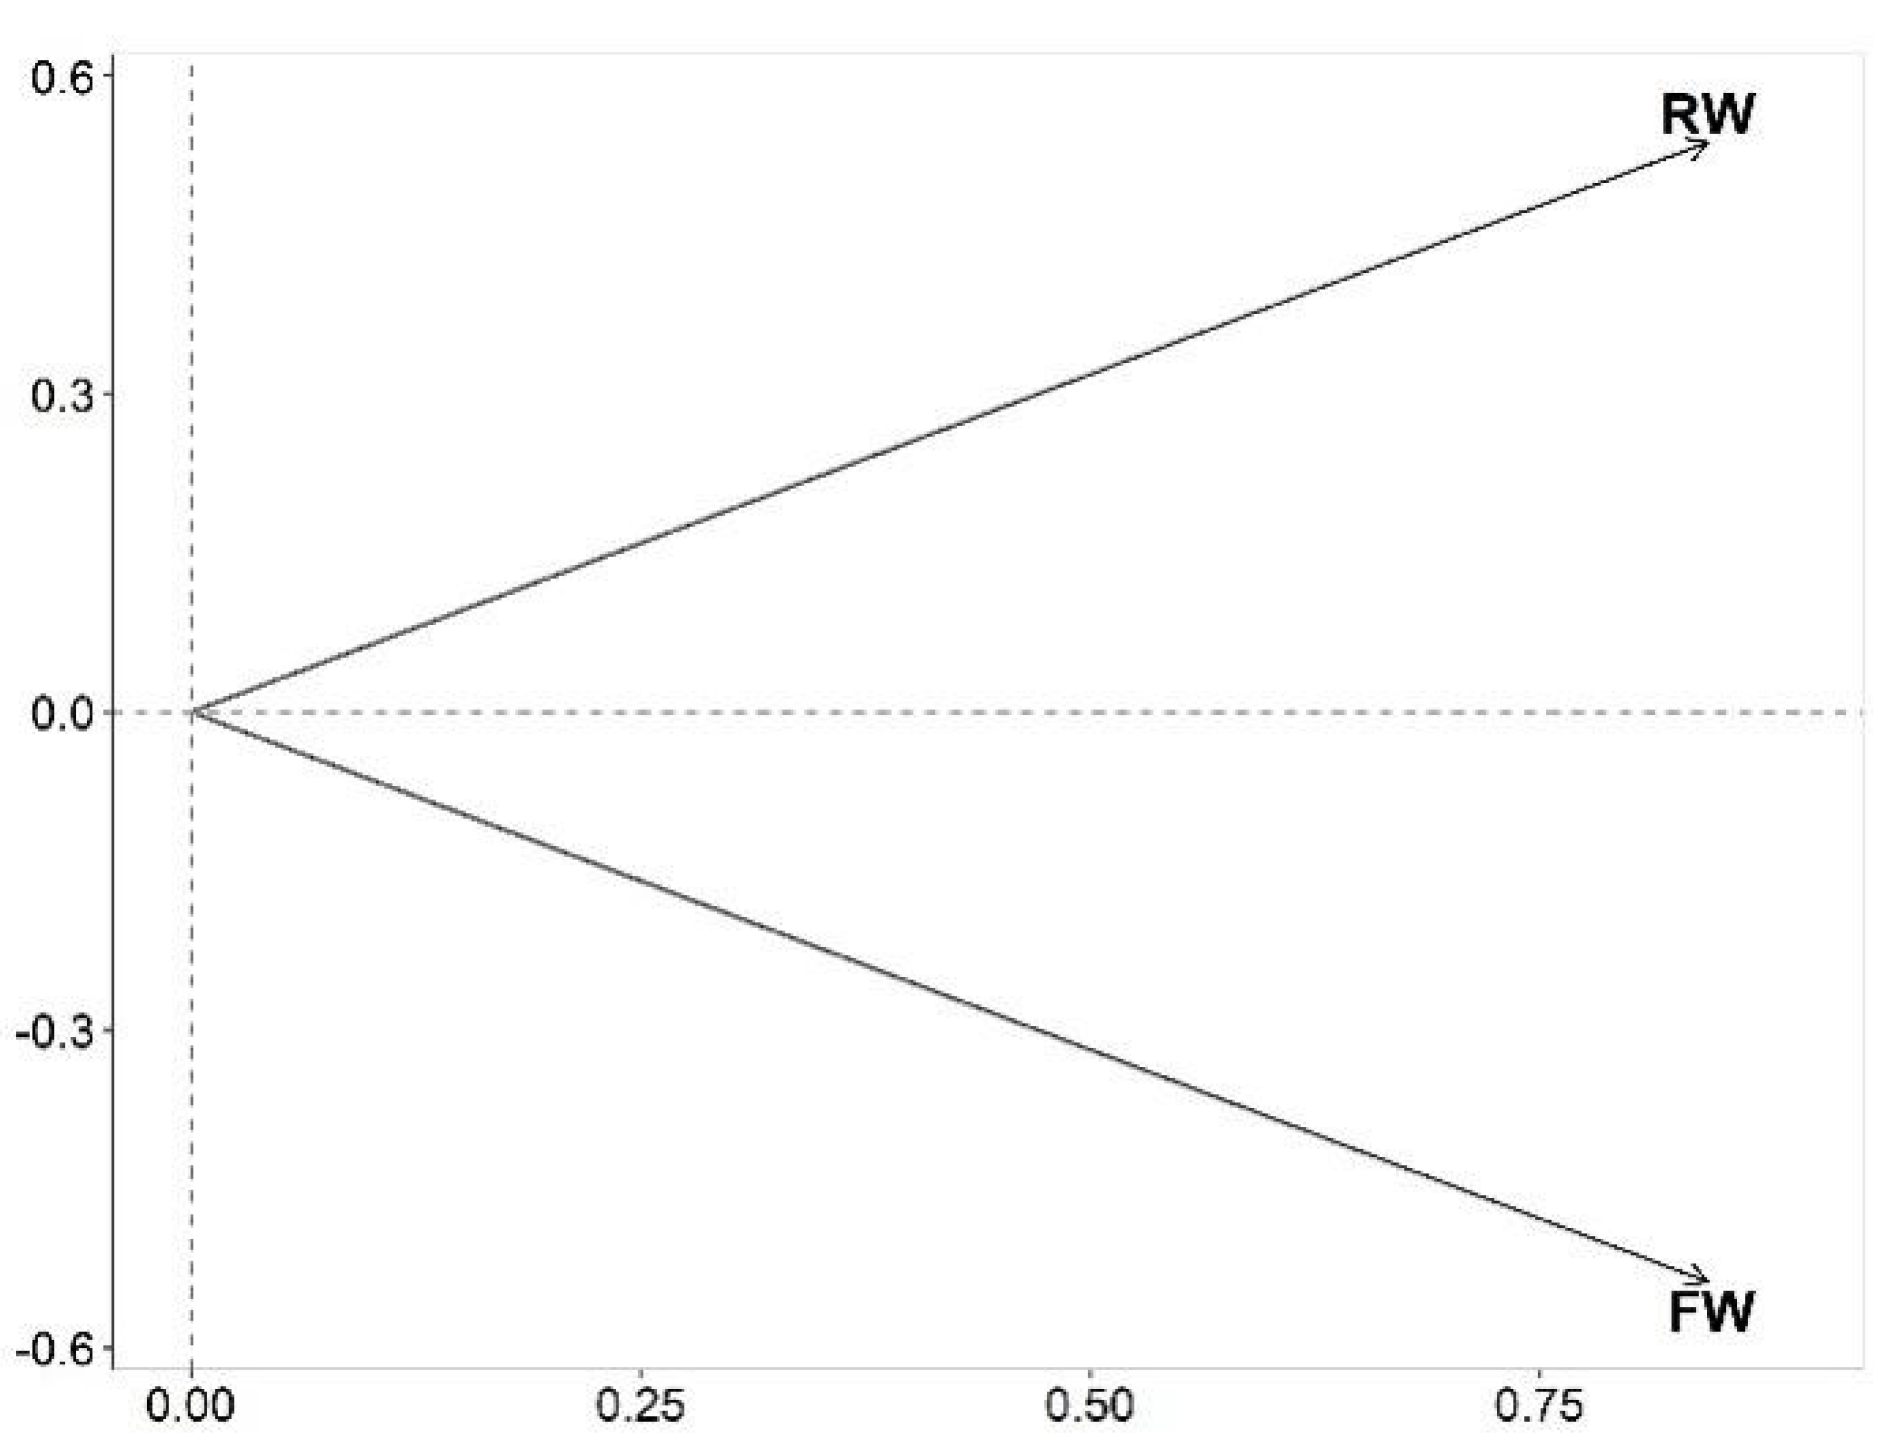
Figure 4.
Kd variables Intrastructure graph. The light availability axis is related to Kd, with low light (high Kd) on the left and high values (low Kd) on the right. The light spectrum axis is related to the different wavelengths (400 nm to 700 nm).The greater length of the arrows related to wavelength bands 6–10 compared to those related to bands 1–5 indicates that species using green-red wavelengths in the 600–700 nm range have a competitive advantage to being establish in these environments.

Figure 5.
Principal Phytoplankton genera plotted in a Intrastructure graph. The light availability axis is related to Kd, with low light (high Kd) on the left and high values (low Kd) on the right. The light spectrum axis is related to the different wavelengths (400 to 700 nm).
Figure 5.
Principal Phytoplankton genera plotted in a Intrastructure graph. The light availability axis is related to Kd, with low light (high Kd) on the left and high values (low Kd) on the right. The light spectrum axis is related to the different wavelengths (400 to 700 nm).

Table 1.
Summary of Sentinel3 OLCI bands used. Central wavelength (CW), band width (BW).
| Bands | CW (nm) | BW (nm) |
|---|---|---|
| B-01 | 412 | 405–419 |
| B-02 | 442 | 435–449 |
| B-03 | 490 | 483–498 |
| B-04 | 510 | 503–518 |
| B-05 | 560 | 552–567 |
| B-06 | 620 | 613–626 |
| B-07 | 665 | 658–672 |
| B-08 | 673 | 668–680 |
| B-09 | 681 | 675–687 |
| B-10 | 708 | 701–716 |
Table 2.
List of the codes and class of phytoplankton species genera that stood out in the compromise factor map (see Figure 5).
Table 2.
List of the codes and class of phytoplankton species genera that stood out in the compromise factor map (see Figure 5).
| Code | Genera | Class |
|---|---|---|
| Act | Actinastrum | Trebouxiophyceae |
| Aul | Aulacoseira | Bacilariophyceae |
| Bot | Botryococcus | Trebouxiophyceae |
| Clos | Closterium | Conjugatophyceae |
| Coe | Coelastrum | Chlorophyceae |
| Cryp | Cryptomonas | Cryptophyceae |
| Cyl | Cylindrospermopsis | Cyanophyceae |
| Lec | Lepocinclis | Euglenophyceae |
| Mel | Melosira | Coscinodiscophyceae |
| Mcy | Microcystis | Cyanophyceae |
| Pan | Pandorina | Chlorophyceae |
| Per | Peridinium | Dinophyceae |
| Pkx | Planktothrix | Cyanophyceae |
| Vol | Volvox | Chlorophyceae |
Publisher’s Note: MDPI stays neutral with regard to jurisdictional claims in published maps and institutional affiliations. |
© 2021 by the authors. Licensee MDPI, Basel, Switzerland. This article is an open access article distributed under the terms and conditions of the Creative Commons Attribution (CC BY) license (https://creativecommons.org/licenses/by/4.0/).
Share and Cite
MDPI and ACS Style
Kraus, C.N.; Maciel, D.A.; Bonnet, M.P.; Novo, E.M.L.d.M. Phytoplankton Genera Structure Revealed from the Multispectral Vertical Diffuse Attenuation Coefficient. Remote Sens. 2021, 13, 4114. https://doi.org/10.3390/rs13204114
AMA Style
Kraus CN, Maciel DA, Bonnet MP, Novo EMLdM. Phytoplankton Genera Structure Revealed from the Multispectral Vertical Diffuse Attenuation Coefficient. Remote Sensing. 2021; 13(20):4114. https://doi.org/10.3390/rs13204114
Chicago/Turabian StyleKraus, Cleber Nunes, Daniel Andrade Maciel, Marie Paule Bonnet, and Evlyn Márcia Leão de Moraes Novo. 2021. "Phytoplankton Genera Structure Revealed from the Multispectral Vertical Diffuse Attenuation Coefficient" Remote Sensing 13, no. 20: 4114. https://doi.org/10.3390/rs13204114
Note that from the first issue of 2016, this journal uses article numbers instead of page numbers. See further details here.