Article

Proximal Gamma-Ray Spectroscopy: An Effective Tool to Discern Rain from Irrigation

by
Andrea Serafini
1,2,3,*,
Matteo Albéri
1,3,4,
Michele Amoretti
5,6,
Stefano Anconelli
7,
Enrico Bucchi
7,
Stefano Caselli
5,6,
Enrico Chiarelli
1,3,
Luca Cicala
8,
Tommaso Colonna
9,
Mario De Cesare
8,10,11,
Salvatore Gentile
7,
Enrico Guastaldi
9,
Tommaso Letterio
7,
Andrea Maino
1,2,3,
Fabio Mantovani
1,2,3,
Michele Montuschi
1,2,3,
Gabriele Penzotti
5,6,
Kassandra Giulia Cristina Raptis
1,3,
Filippo Semenza
1,
Domenico Solimando
7 and
Virginia Strati
1,2,3
add Show full author list remove Hide full author list
1
Department of Physics and Earth Sciences, University of Ferrara, 44122 Ferrara, Italy
2
INFN, Ferrara Section, 44122 Ferrara, Italy
3
Laboratorio Terra&AcquaTech, 44121 Ferrara, Italy
4
INFN, Legnaro National Laboratories, 35020 Padua, Italy
5
Department of Engineering and Architecture, University of Parma, 43124 Parma, Italy
6
Center for Energy and Environment—CIDEA, University of Parma, 43124 Parma, Italy
7
Consorzio Bonifica CER, 40137 Bologna, Italy
8
Italian Aerospace Research Centre CIRA, Capua, 81043 Caserta, Italy
9
GeoExplorer Impresa Sociale S.r.l., 52100 Arezzo, Italy
10
Department of Mathematics and Physics, University of Campania “Luigi Vanvitelli”, 81100 Caserta, Italy
11
INFN, Napoli Section, Complesso Universitario di Monte S. Angelo, 80126 Napoli, Italy
*
Author to whom correspondence should be addressed.
Remote Sens. 2021, 13(20), 4103; https://doi.org/10.3390/rs13204103
Submission received: 31 August 2021 / Revised: 29 September 2021 / Accepted: 8 October 2021 / Published: 13 October 2021

Abstract

:
Proximal gamma-ray spectroscopy is a consolidated technology for a continuous and real-time tracing of soil water content at field scale. New developments have shown that this method can also act as an unbiased tool for remotely distinguishing rainwater from irrigation without any meteorological support information. Given a single detector, the simultaneous observation in a gamma spectrum of a transient increase in the 214Pb signal, coupled with a decrease in the 40K signal, acts as an effective proxy for rainfall. A decrease in both 214Pb and 40K signals is, instead, a reliable fingerprint for irrigation. We successfully proved this rationale in two data-taking campaigns performed on an agricultural test field with different crop types (tomato and maize). The soil moisture levels were assessed via the 40K gamma signal on the basis of a one-time setup calibration. The validation against a set of gravimetric measurements showed excellent results on both bare and vegetated soil conditions. Simultaneously, the observed rain-induced increase in the 214Pb signal permitted to identify accurately the rain and irrigation events occurred in the 8852 h of data taking.

Graphical Abstract

1. Introduction

Due to continuing human population growth and the consequent increasing demand for available water, the management of water resources has become a pressing issue for governments and international organizations. Irrigated agriculture accounts for more than 70% of global water withdrawals [1]. Improvement of farming practices is therefore imperative to ensure availability and sustainable management of water in the future, one of the goals of the 2030 Agenda for Sustainable Development [2].
A concrete solution for an adequate irrigation schedule is the use of a decision support system based on novel technologies for a non-invasive and smart monitoring of soil water content (SWC) [3,4]. The knowledge of the actual SWC represents a strategic element allowing users to manage and use the right amount of water at the right time, leading to an optimal irrigation performance. In a global scenario, a crucial step towards the reduction of water wastage and the increase of water security is the awareness of irrigated lands and of the amount of irrigation water that is really distributed in the soil [5,6].
In this context, the SWC assumes a great importance since it offers double information: how much water is necessary for a growing crop and how much water enters the soil after an irrigation or rainfall event. To exploit these potentialities, it appears evident that knowing which of these two events caused the water precipitation in the soil is mandatory. A unique equipment that measures the field scale SWC and simultaneously distinguishes irrigation and rain events could be the keystone to face these challenges. Proximal gamma-ray spectroscopy (PGRS) offers the most effective tool to reach these desiderata, recording the gamma signal coming from 40K and 214Pb decays to study the evolution of SWC in time and discriminating between rain- and irrigation-induced variations, respectively.
In this paper, we present the results of a two-stage PGRS experiment performed on an agricultural test field in Emilia-Romagna (Italy). In addition to the results obtained for a tomato crop in [7,8], the new dataset of SWC estimated on the basis of gamma data acquired on a maize crop is presented and validated. The PGRS is a novel method that is successfully applied on two different crops adopting a single calibration. For the first time, applying the model developed in [9], the 214Pb data acquired for both stages of the experiment are used for discriminating rain and irrigation, providing original and reliable results.

2. Background

The only direct method available for measuring the SWC is currently the gravimetric technique [10], a disruptive and time-consuming procedure requiring operator intervention. Conversely, indirect techniques consist of in situ non-disruptive measurements at a punctual scale (~dm2) or non-invasive remote sensing (RS) methods covering larger areas (up to ~km2). PGRS [7,11] is, together with cosmic-ray neutron sensing (CRNS) [12,13,14], a field scale non-invasive technique that fills the aforementioned scale gap. CRNS is based on the measurement of cosmic-ray neutrons that scatter on hydrogen atoms in the ground. These atoms mainly come from the water in the soil, so the CRNS technique can infer the SWC level by studying the scattered neutron flux. Based on the observation of cosmic-ray products, this technique suffers from uncertainties tied to the estimation of the unscattered flux. PGRS is sensitive to the gamma radiation produced by the nuclear decays of 40K and of radionuclides belonging to 232Th and 238U chains, which are naturally present in the soil. The SWC is measured in real time on the basis of the temporal variations of the gamma signal produced by the decays of the 40K that is naturally and homogeneously (in space and time) distributed in cultivated soils. Since water distributed in the terrain shields the terrestrial gamma flux, an inverse relation between SWC and gamma signal measured by a spectrometric station can be clearly observed and used for a quantitative estimation of SWC [7].
The knowledge of irrigated lands cannot rely on the available datasets since most of the existing comprehensive maps of irrigation water are based only on statistical surveys or can identify just the areas equipped for irrigation, rather than the truly irrigated areas [15]. These maps are not global and are not up-to-date, since illegal pumping is not included; there are self-reporting relevant biases; and temporal/spatial coverage is not homogenous [16,17]. Some vegetation indexes, based on optical and visible RS techniques, are tentatively used as proxies for irrigation monitoring, since irrigated and non-irrigated lands show different spectral responses [18,19]. Sometimes these methods fail because climate conditions, natural vegetation regimes, and agricultural practices are often unpredictable variables. Recent attempts to integrate these approaches seem to give promising results [20], although temporal and spatial heterogeneity of the information remains a persistent Achilles’s heel.
In recent years, an alternative approach for global irrigation monitoring has been developed. Diverse algorithms, one of which is SM2RAIN [21], are based on the inversion of the soil–water balance equation to derive the amount of irrigation water, once the rainfall water fraction is identified and subtracted from the total amount of water. PGRS comes into play here: a single detector can retrieve the SWC from the 40K gamma signal and simultaneously act as an effective proxy for rainfall occurrences. Indeed, PGRS is sensitive to the 214Pb gamma emitter, a radon progeny concentrated in rain droplets [22,23]. A transient increase in the 214Pb gamma signal, coupled with a decrease in the 40K signal, can hence be used as an effective proxy for rain events [9]. Irrigation is, instead, characterized by a decrease in both 214Pb and 40K gamma signals.

3. Materials and Methods

3.1. Rationale

PGRS is a method particularly sensitive to the SWC, since, at typical gamma photon energies (~MeV), the mass attenuation coefficient of water is slightly higher than those of typical minerals commonly present in the soil [24]. As a result, small increments in the SWC can be indirectly estimated by measuring the attenuation in the gamma signal coming from the soil. The detection of the 40K gamma signal photopeak (1.46 MeV) is convenient in agricultural lands, which are generally rich in this radioisotope. The relation between the 40K photopeak net count rate C K t (in cps) and the soil water content w γ t in kg/kg, measured at time t, can be expressed by an inverse proportionality:
w γ t = C K C a l C K t Λ Ω + w g C a l Ω ,
where C K C a l = 11.7 ± 0.2 (cps) and w g C a l = 0.163 ± 0.008 (kg/kg) are the 40K net count rate and the gravimetric soil moisture level at calibration time (18 September 2017), respectively [25]. These parameters are site- and detector-dependent and need to be properly measured for an accurate estimation of w γ . The adimensional coefficient Ω = 0.899 represents the ratio between the mass attenuation coefficient of the solid portion of the soil and the one of water, calculated according to the elemental composition of the soil of the experimental site [25]. In the absence of a detailed mineralogical analysis, a Ω = 0.903   ±   0.011 mean value can be employed [25]. The w γ t was converted in volumetric soil water content (SWCγ) in m3/m3 by multiplying it by 1.345 , namely the ratio between soil bulk density (Table 1) and water density ( 1000   kg / m 3 ).
The adimensional parameter Λ represents the time-dependent count rate attenuation function that accounts for the biomass water content (BWC), which is an attenuation factor of the gamma signal due to the presence of vegetation. Differently from other vegetation indexes, the BWC refers to the amount of water contained in the entire plant (stems, leaves, and fruits). The effect of the BWC on the CK is nontrivial and, in principle, it is indistinguishable from that generated by an increase in the SWCγ. The BWC can be modeled as a layer of some mm of water covering the ground. The presence of a 1.0 mm water layer leads to an overestimation of ~10% for the SWCγ value (see Figure 7b of [26]): this attenuation needs to be studied and accounted for in order to avoid systematic errors. The quantification of the gamma signal attenuation as a function of the modeled water layer thickness was studied through Monte Carlo simulations [26]. Since the temporal evolution of BWC is tightly related to crop’s growth stage, we estimated the overall BWC on the base of gravimetric measurements on stems, leaves, and fruits samples collected at four and six different stages of tomato and maize maturity, respectively. Modeling the evolution of the entire organism by means of a Gompertz sigmoid function [27], we calculated the time-dependent correction to be applied to the measured gamma signal.
The calibration of the PGRS station was performed only once in 2017 and successfully used for both 2017 and 2020 data-taking campaigns. The value of w g C a l in Equation (1) was obtained from the measurements of 16 sampling points distributed within 15 m from the PGRS station (Figure 4 of [26]), which is the area where ~85% of the signal received by the station originates. For each sampling position, three samples were collected in the depth intervals of 0–10 cm, 10–20 cm, and 20–30 cm for a total number of 48 samples. After drying the samples at 105 °C for about 24 h and inferring their gravimetric water content, the vertical weighted mean for each of the 16 sampling points was obtained by assigning to each depth interval a weight based on its contribution to the gamma signal (calculated according to Equation (3) of [25]). Finally, the value w g C a l was calculated as the mean of the 16 sampling points, with the uncertainty given by their standard deviation, which is of the order of 5%.
As estimated in [26], the uncertainty on w γ (Equation (1)) is dominated by that of w g C a l , rather than by the statistical error of C K t (<1%). Hence, the absolute uncertainty on w γ is a constant value equal to 0.017 (kg/kg), corresponding to a 0.023 (m3/m3) uncertainty on the estimated volumetric SWCγ values. Since the abundance of 40K in the ground remains constant in time, due to the inverse relation between the CK signal and w γ expressed by Equation (1), a sudden decrease observed by the PGRS station in CK(t) is related to a SWC increase.
To distinguish between irrigation and rainfall, we focused on the photopeak of 214Pb (352 keV), a radon progeny belonging to 238U decay chain. Because of the high volatility of 222Rn, this gaseous radioisotope easily exhales from the ground and enters the atmosphere. When 222Rn decays inside a cloud, raindrops capture the aerosol clusters formed by its daughters (218Po and then 214Pb). During a rainfall, the additional 214Pb nuclei fallen to the ground cause a sudden increase in the 214Pb count rate ( C P b ) over the environmental background (Figure 1). A weak rainfall rate of 5 mm/h causes a C P b jump from a typical environmental background of ~ 1.0 cps to a value of   ~ 2.2 cps [9]. This increase in C P b is proportional to the square root of the rain rate R (mm/h), as expressed by the empirically observed relationship:
Δ C P b = A Δ T · R 0.50 ± 0.03 ,
where Δ T = 0.25   h is the temporal bin and the parameter A = 2.15 ± 0.15 (cps mm−0.50 h−0.50) is detector dependent [9].
The responses of gamma spectra in the 100–2800 keV energy range changes according to different weather conditions (Figure 1). In the case of a rain event (Figure 1c), a decrease in the 40K photopeak is coupled with an increase in the 214Pb gamma signal (Figure 1d). During irrigation (Figure 1e), the gamma spectrum (Figure 1f) does not depict this contrasting behavior, showing a common decrease between the 40K and 214Pb photopeaks. Due to the different responses of the 40K and 214Pb photopeaks to rainfall and irrigation, it is therefore possible to distinguish between these two events.

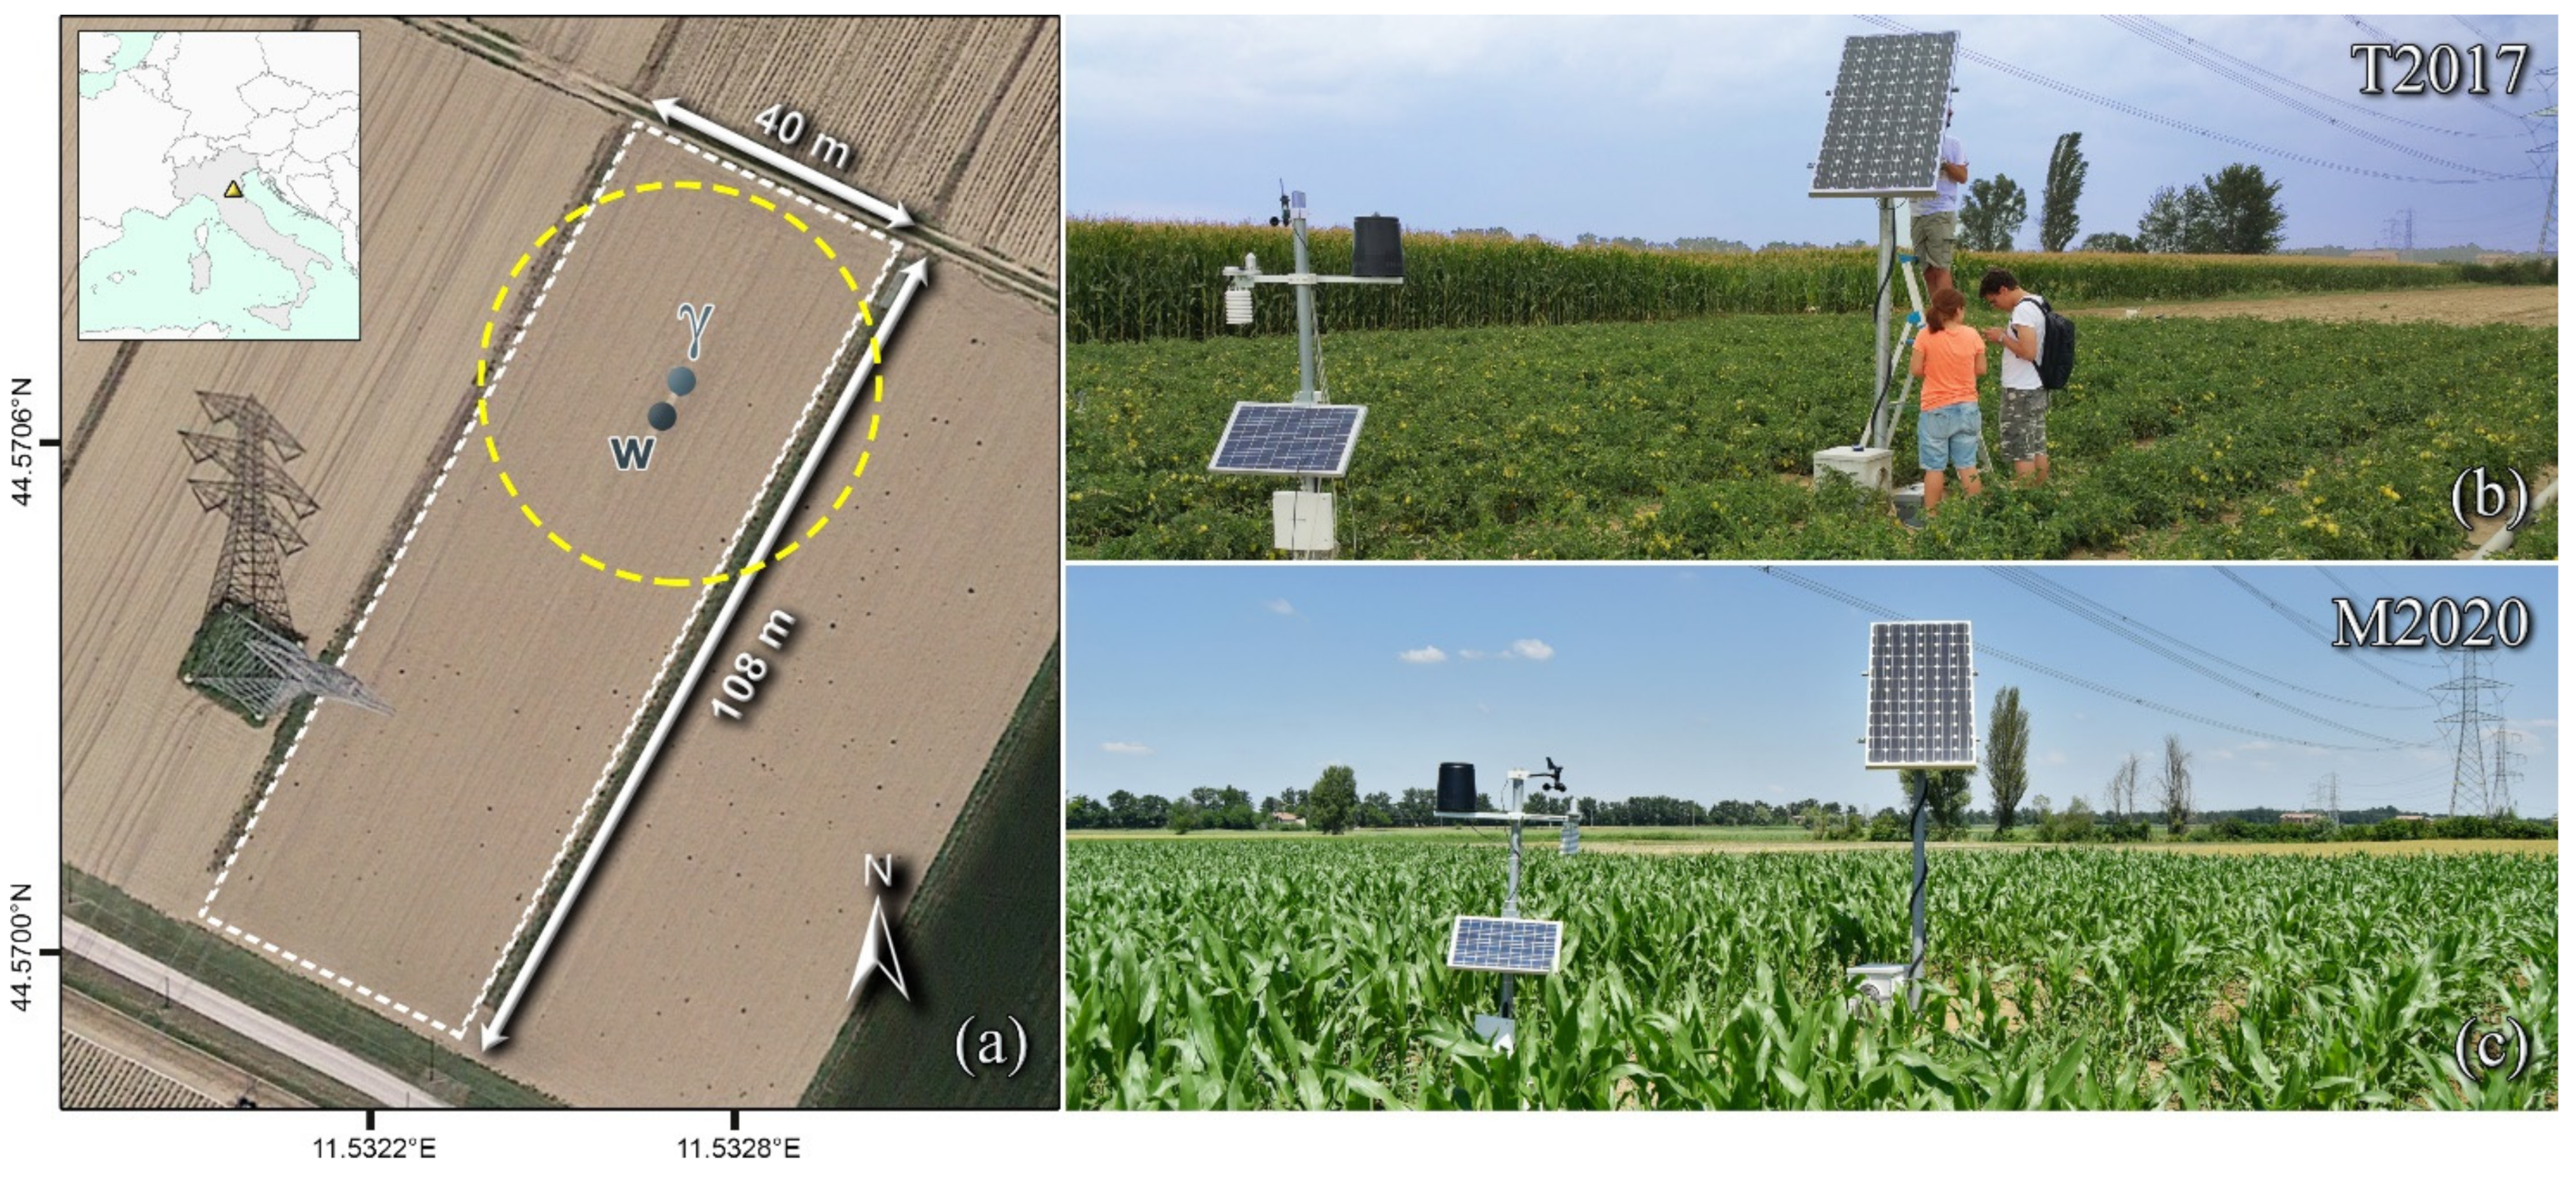
3.2. Experimental Site

Data were acquired during two different growing seasons: the first data-taking campaign was conducted in the period 4 April—2 November 2017, while the second was carried out in the period 5 March—31 August 2020. During the first campaign (hereafter referenced as T2017), the site was dedicated to a tomato crop, while in the second (M2020) maize was grown on the field. Both data takings refer to the agricultural test field of Acqua Campus, a research center of the Emiliano-Romagnolo Canal (CER) irrigation district in the Emilia-Romagna region of Italy (44.57° N, 11.53° E, 16 m above sea level) (Figure 2). The study area is classified, according to the Köppen–Geiger classification [28], in the “Cfa” group, which is characterized by a temperate climate without dry seasons and with hot summers, with a mean temperature of 14.0 °C and mean annual precipitation of about 700 mm. Table 1 lists the main physical and hydraulic parameters of the soil, characterized by a loamy texture and a 1.26% organic matter content [7].
Irrigation water was applied with a fixed sprinkler system in T2017 and with a hose reel irrigator in M2020, following the irrigation schedule supplied by the irrigation advisory service IRRINET [29,30,31]. The employed surface water was drawn from CER, a derivation of the Po river.
The reliability of the PGRS station is proven by its high duty cycle (i.e., the ratio of effective hours of data taking over the total number of hours), which is above 90% for both T2017 and M2020 (Table 2). The major sources of station downtime were not related to the reliability of the detector, but were, rather, due to the extraordinary maintenance required after extreme weather conditions.

3.3. Experimental Setup

The experimental setup included a PGRS station and an agro-meteorological station (MeteoSense 2.0, Netsens) (Figure 2), both equipped with internet connection and powered by solar panels.
The PGRS station consisted of an external steel box welded on top of a 2.25 m pole and enclosing a 1 L sodium iodide (NaI(Tl)) gamma-ray spectrometer: the entire station was designed and built specifically for the experiment [25]. The height of the pole was studied to adapt the field of view (FOV) of the PGRS station to the field size. As a result, 95% of the detected gamma signal was produced by a disk that had a radius of approximately 25 m (Figure 2 of [25]), covering, therefore, the entire field width.
The NaI(Tl) crystal was coupled with a photo-multiplier tube base and the output was then processed by a digital multi-channel analyzer (MCA, CAEN γstream) that had 2048 acquisition channels. The MCA was paired with a small integrated computer that ran the software required for managing the acquisition parameters, such as the start time, the spectral gain, and the operating voltage. Additional software was developed and implemented to make the data taking continuous and to remotely inspect the data acquired in real time.
The gamma-ray spectrometer was able to detect the photon radiation produced by the decay of naturally occurring radionuclides (40K, 238U, and 232Th decay chains) in the soil. The statistical uncertainty on C K t , measured in cps, for a gamma spectrum with a temporal length of one hour is typically lower than 1%. The continuously acquired radiometric data was, then, sent every hour to a dedicated server through a 3G internet connection, where an energy calibration was performed. As a result, 15 min and 1 h acquisition time spectra were obtained. From the hourly produced spectra, the server inferred the net count rate in the main 40K, 214Pb, 214Bi (238U), and 208Tl (232Th) photopeak energy windows [32] and, from their processing, it was able to obtain the volumetric SWC (expressed in m3/m3; see Section 3.1). The 15 min spectra were, instead, used for the 214Pb analysis, with the aim of identifying rain events. All processed data were made available to be queried through a Web API together with the site coordinates and the sensor validity area. The PGRS could thus be easily integrated with any decision support system.

4. Results and Discussions

4.1. SWC Estimation

The PGRS station was able to continuously measure the SWCγ with hourly resolution during the T2017 and M2020 measurement campaigns. The time evolution of the SWCγ values recorded during the two data-taking periods (Figure 3) highlighted the ability of the PGRS technique to reliably follow the phases of dampening and subsequent drying following rain and irrigation events, both in bare and vegetated soil. The sensor response to water precipitation was immediate: the SWCγ increased as soon as water fell on the ground and decreased with a week-long timescale immediately after water stopped precipitating. The highest value attained by the measured SWCγ during both periods (0.46 m3/m3) never exceeded the 0.48 m3/m3 saturation value estimated for the soil, which is consistent with the soil hydraulic and physical properties (Table 1). The minimum recorded value of 0.09 m3/m3 matched the θ W P (Table 1) exactly and was immediately followed by an irrigation.
A validation campaign performed via gravimetric sampling under different soil moisture and crop conditions was conducted to test the reliability of the adopted PGRS technique and of the BWC correction (Table 3). In T2017, for each of the 4 sets of gravimetric measurements, 48 samples were collected using a soil-auger and the average SWCg was calculated adopting the same procedure used for the calibration of the PGRS station (Section 3.1). During M2020, the validation campaign was extended to 7 sets of gravimetric measurements in which the SWCg was measured on a single bulk sample of the first 40 cm of soil. The obtained 11 SWCg validation measurements were then compared to the SWCγ estimated by the PGRS station in the same dates for both bare soil and vegetated periods (Table 3 and Figure 4).
A single calibration carried out on bare soil (Section 3.1) permitted the PGRS station to perform unbiased measurements of the SWCγ during both data-taking campaigns. The estimated SWCγ and SWCg exhibited an excellent agreement for both T2017 and M2020: all measurements proved to be compatible at 1σ level (Table 3). The accuracy of the PGRS station appears even more appreciable from the correlation plot between SWCγ and SWCg (Figure 4). The best fit line linking SWCg measurements to SWCγ exhibits a slope and an intercept compatible at less than 1σ level to 1 and 0, respectively. The accuracy of the method extends to both bare soil and tomato–maize covered soil, confirming that, once the BWC is properly modeled, the crop type does not affect SWCγ estimations through PGRS.

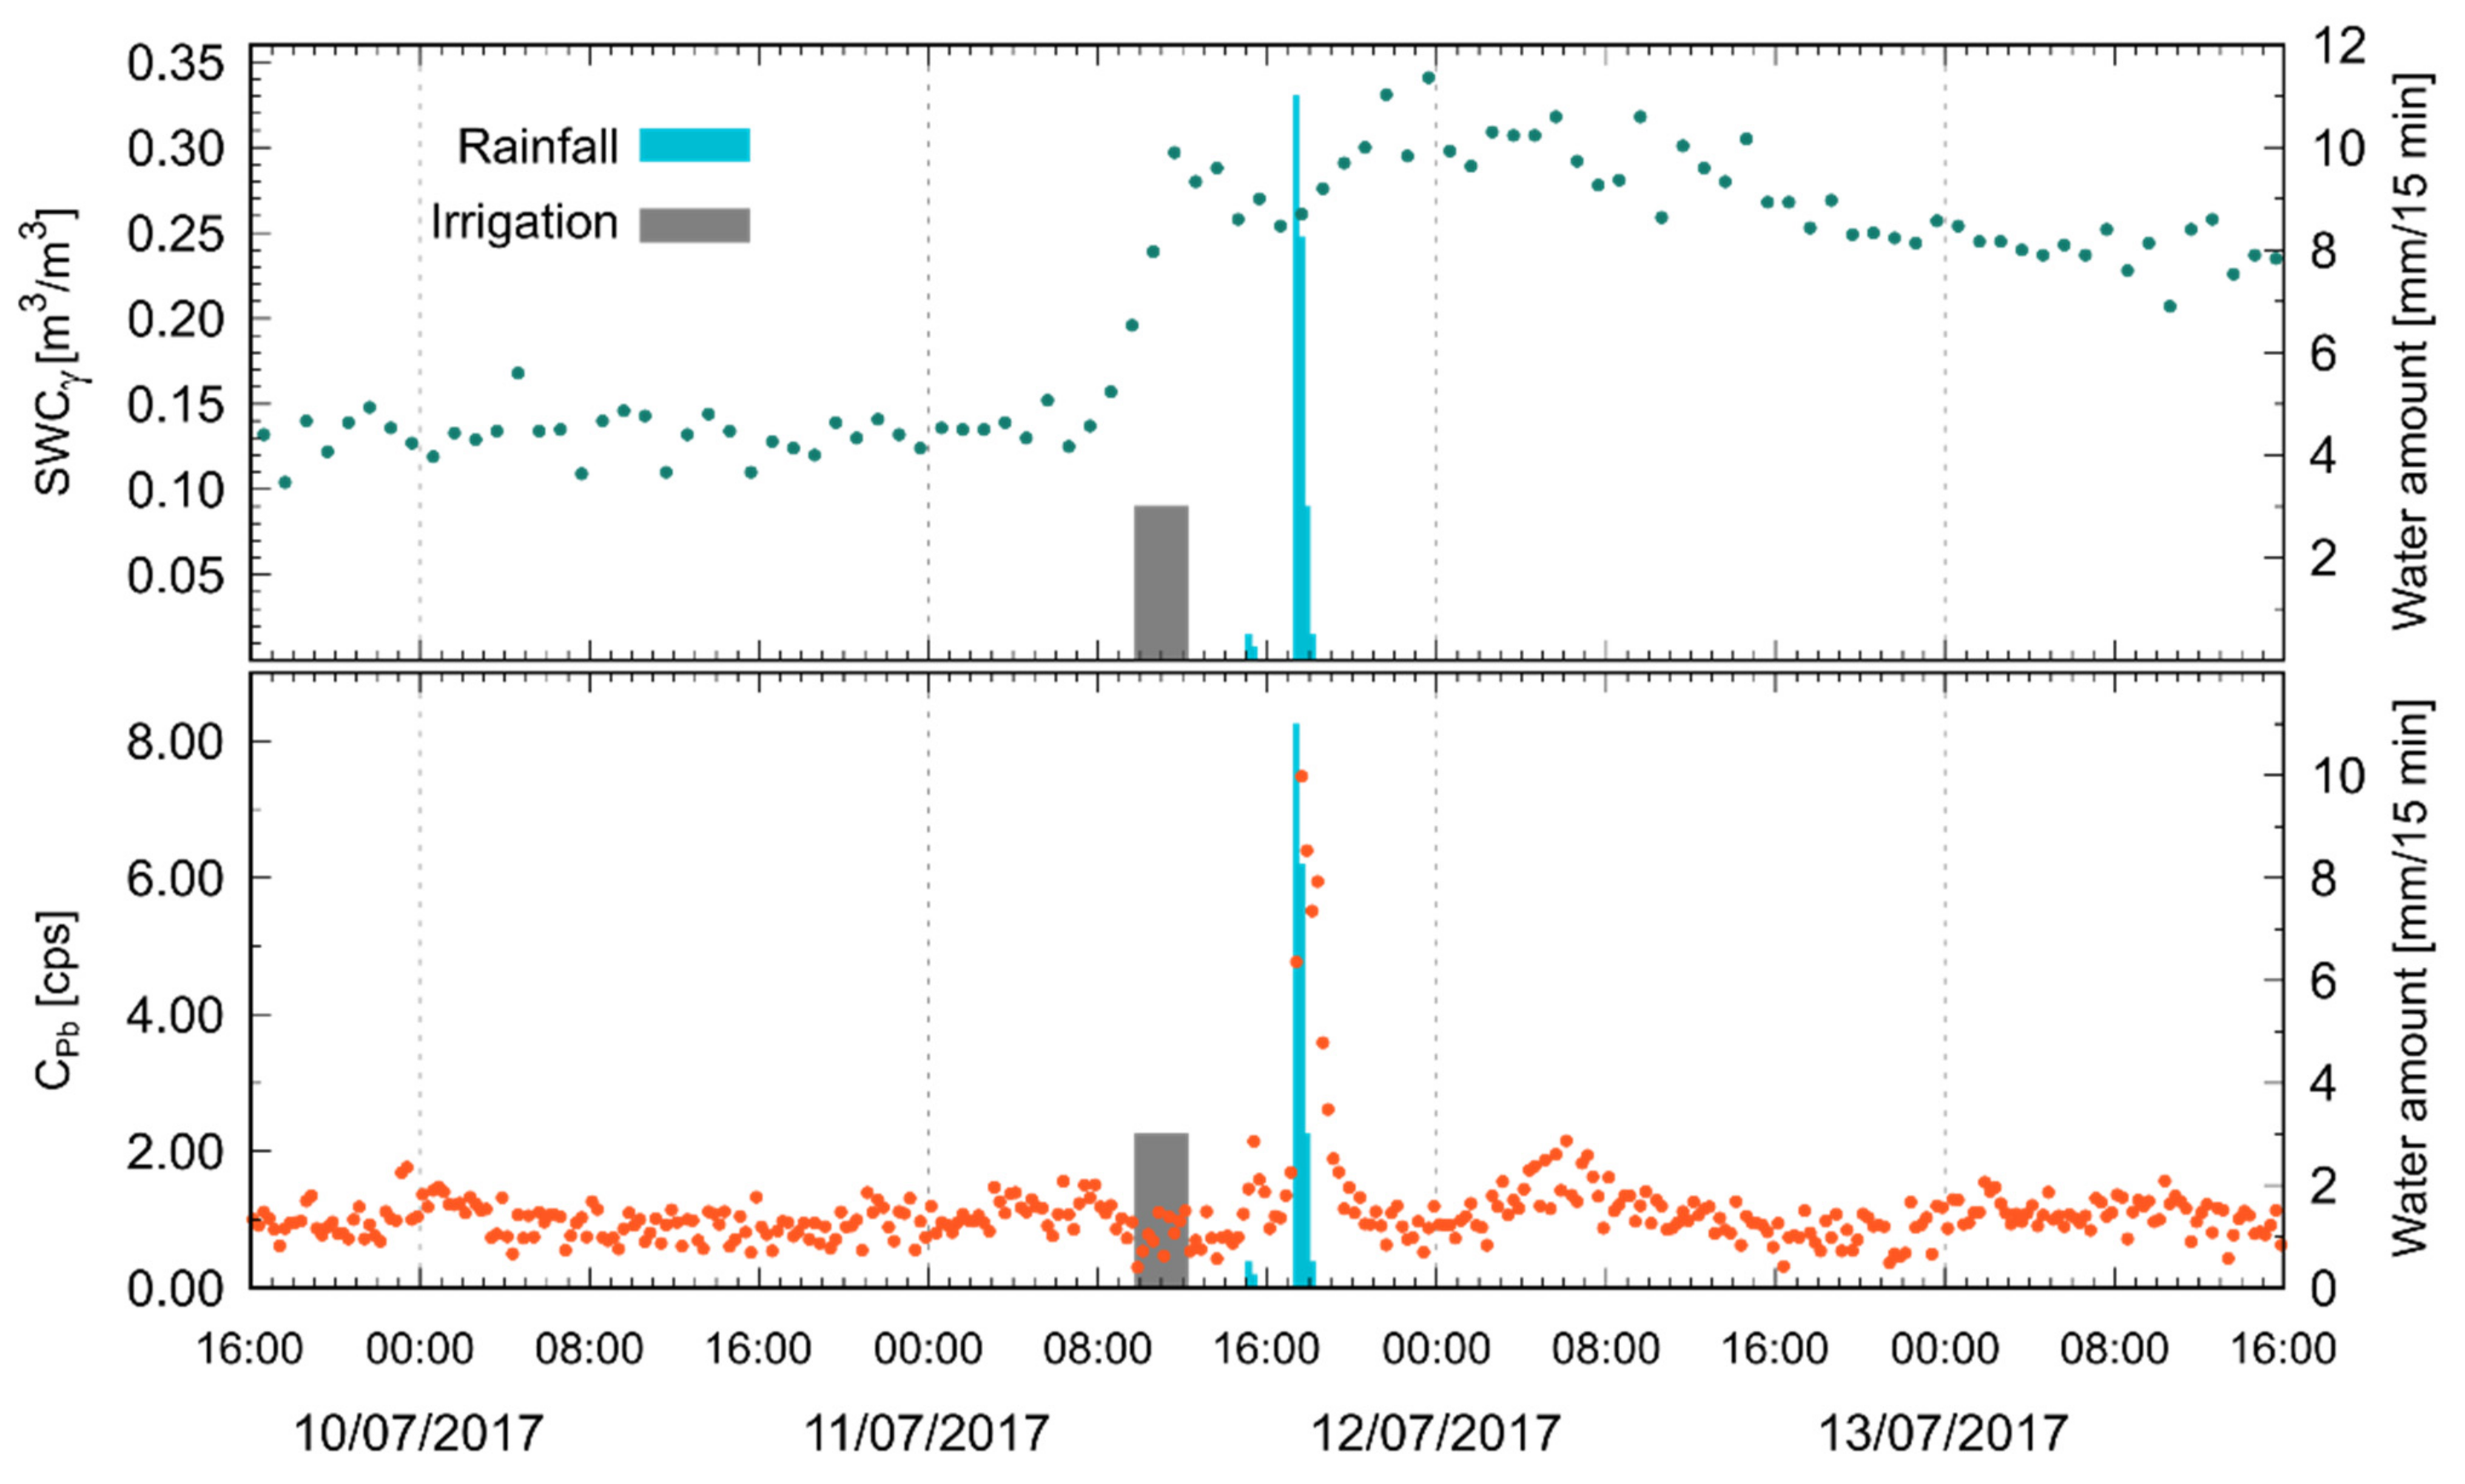
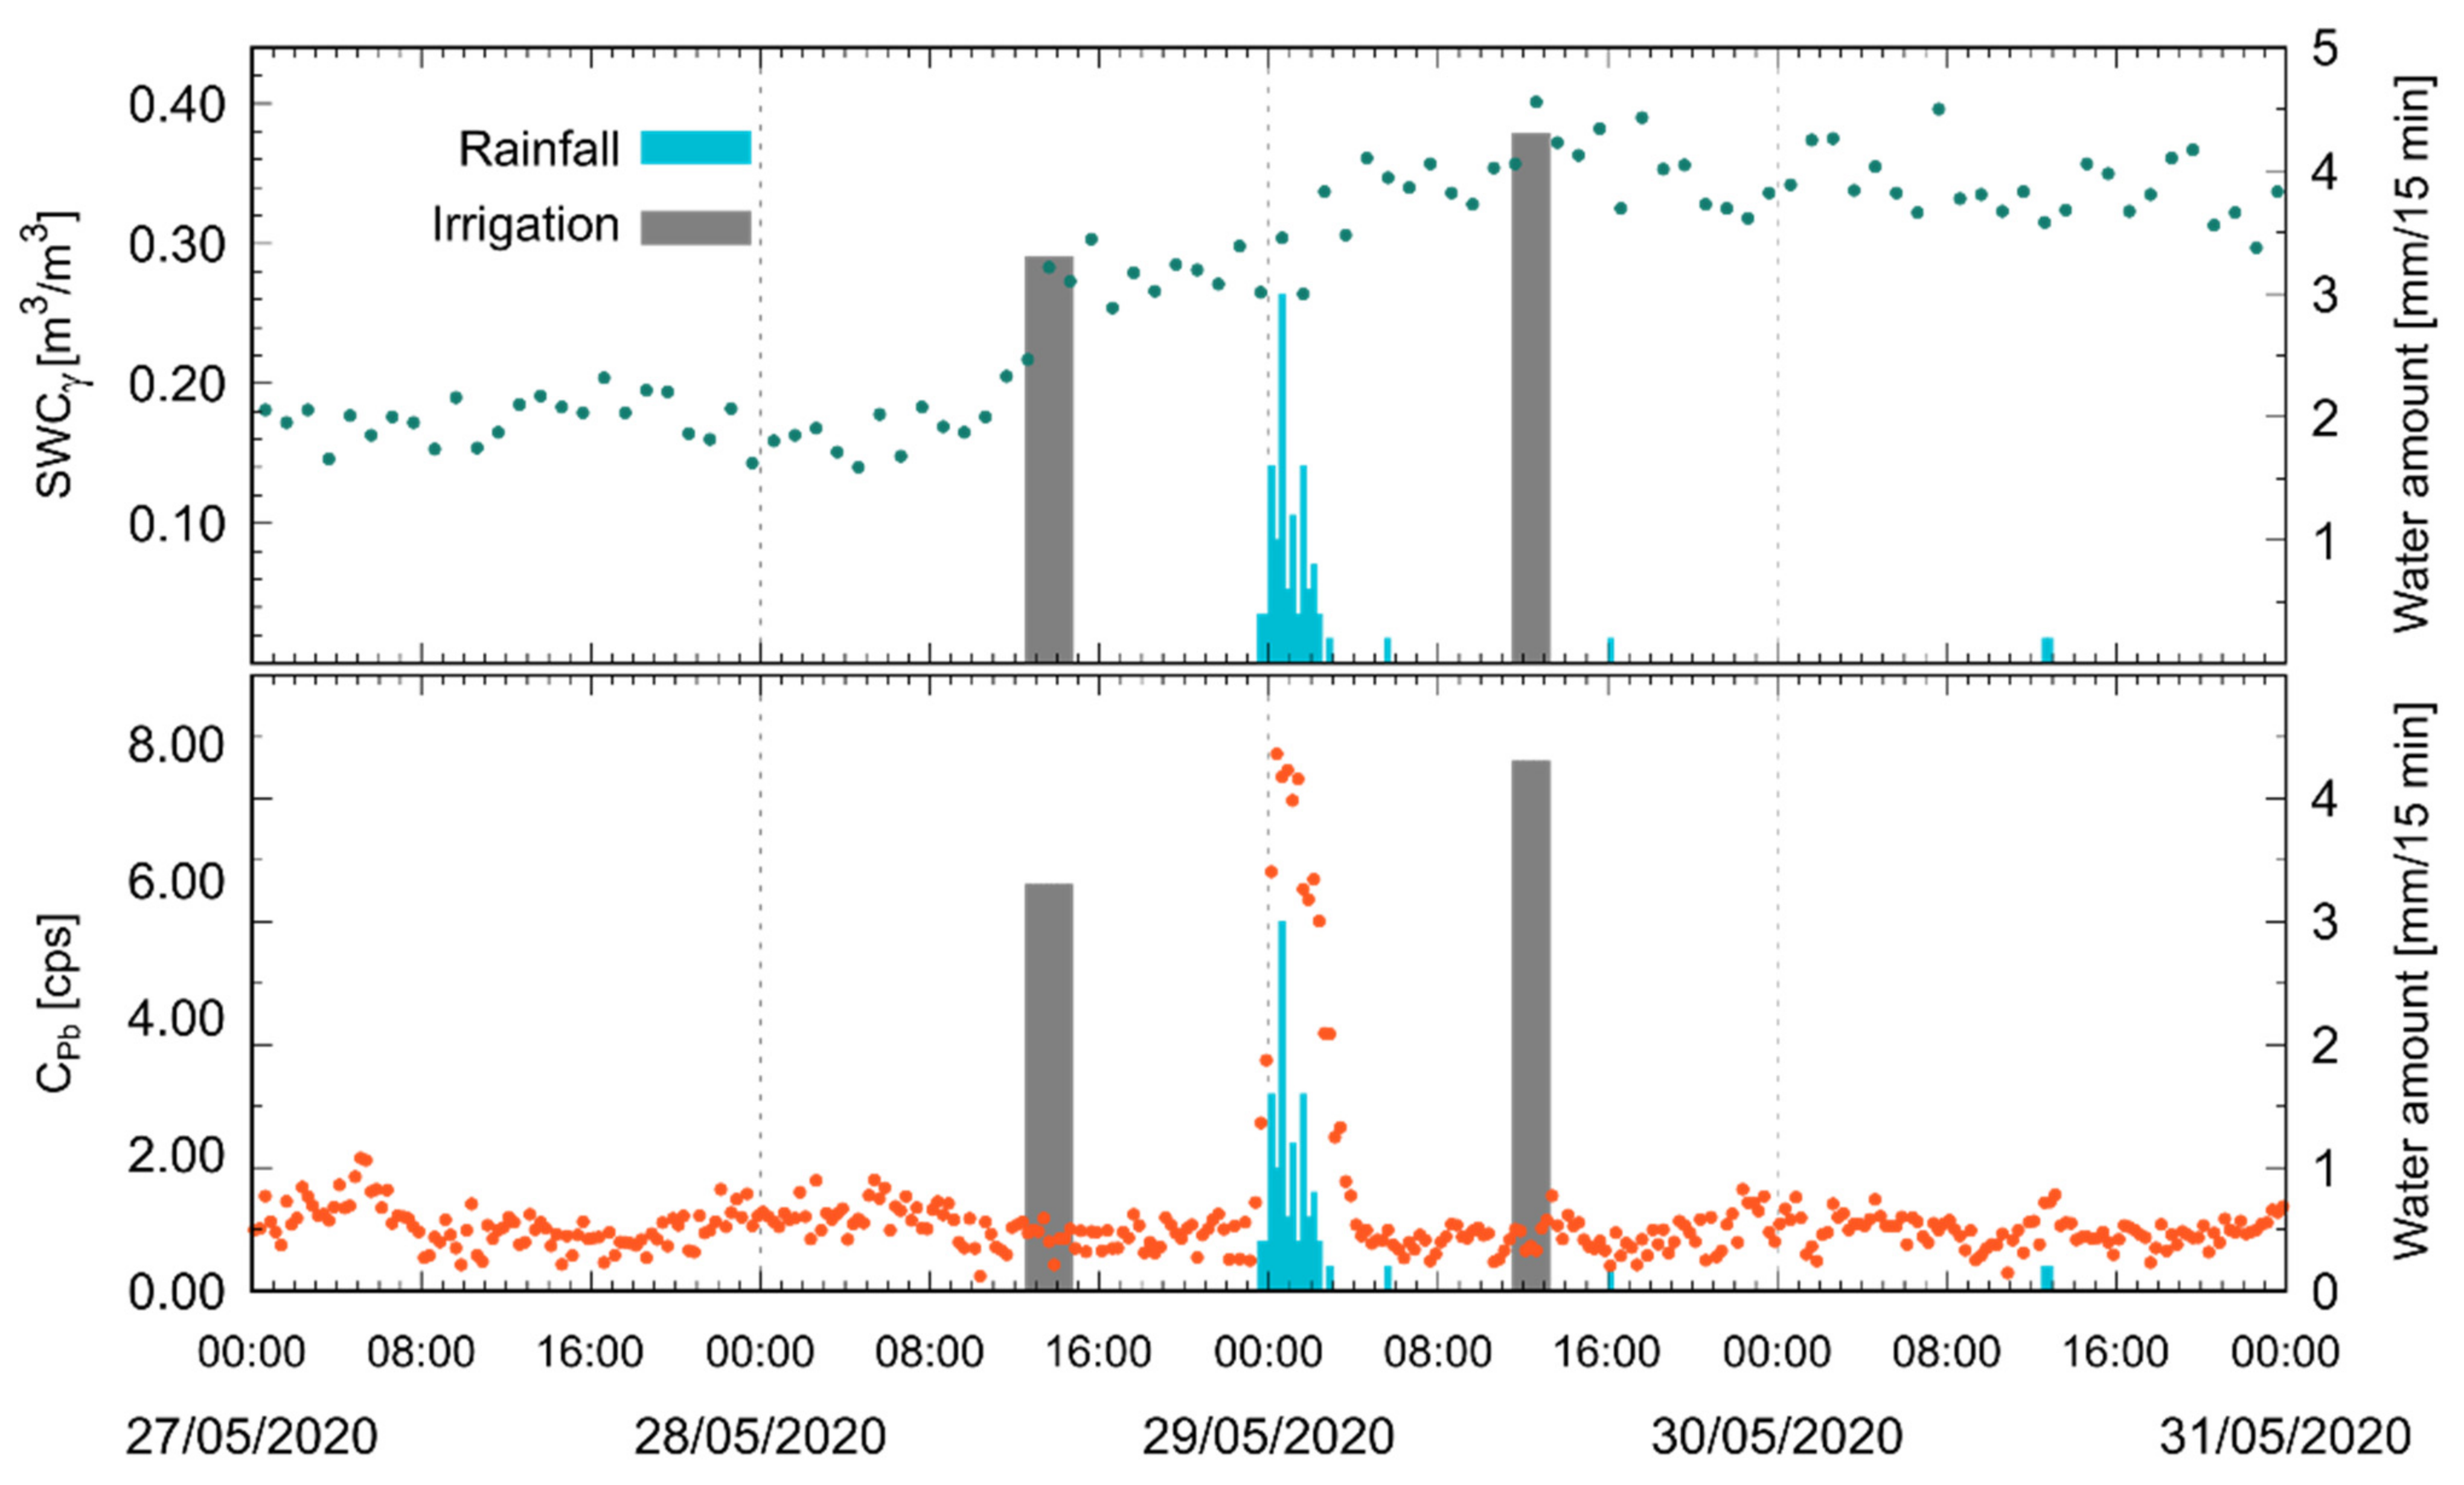
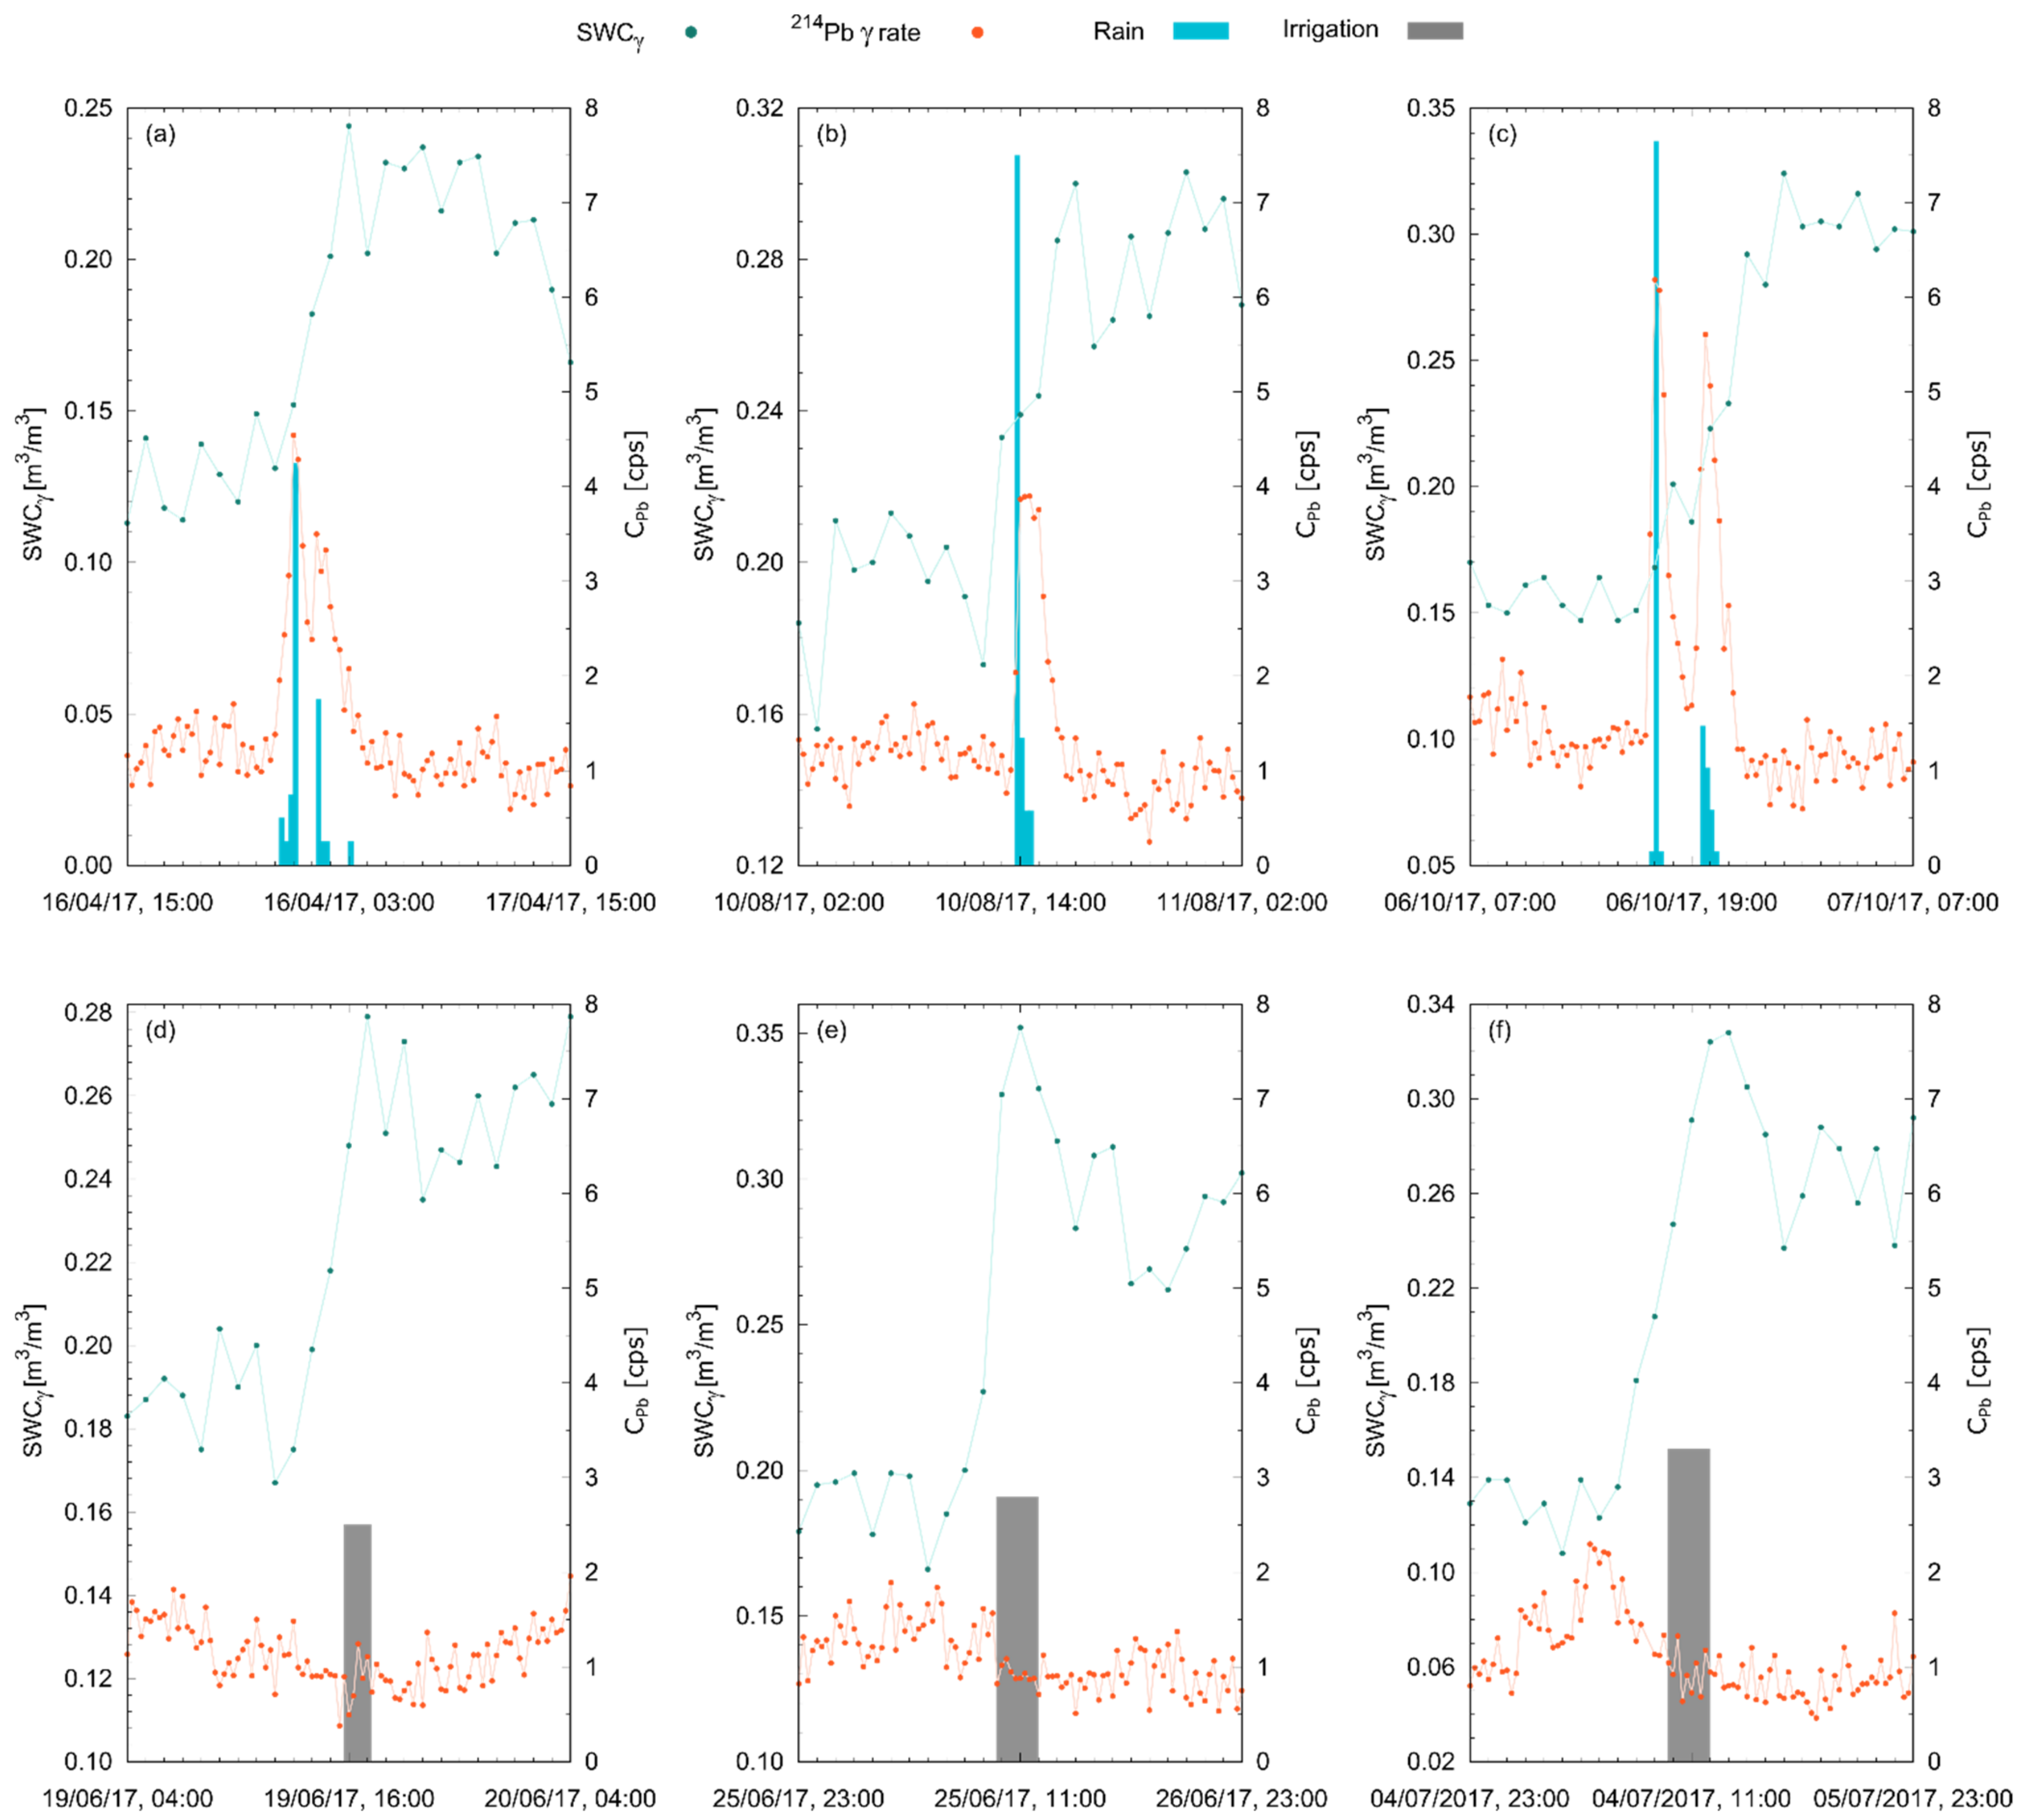
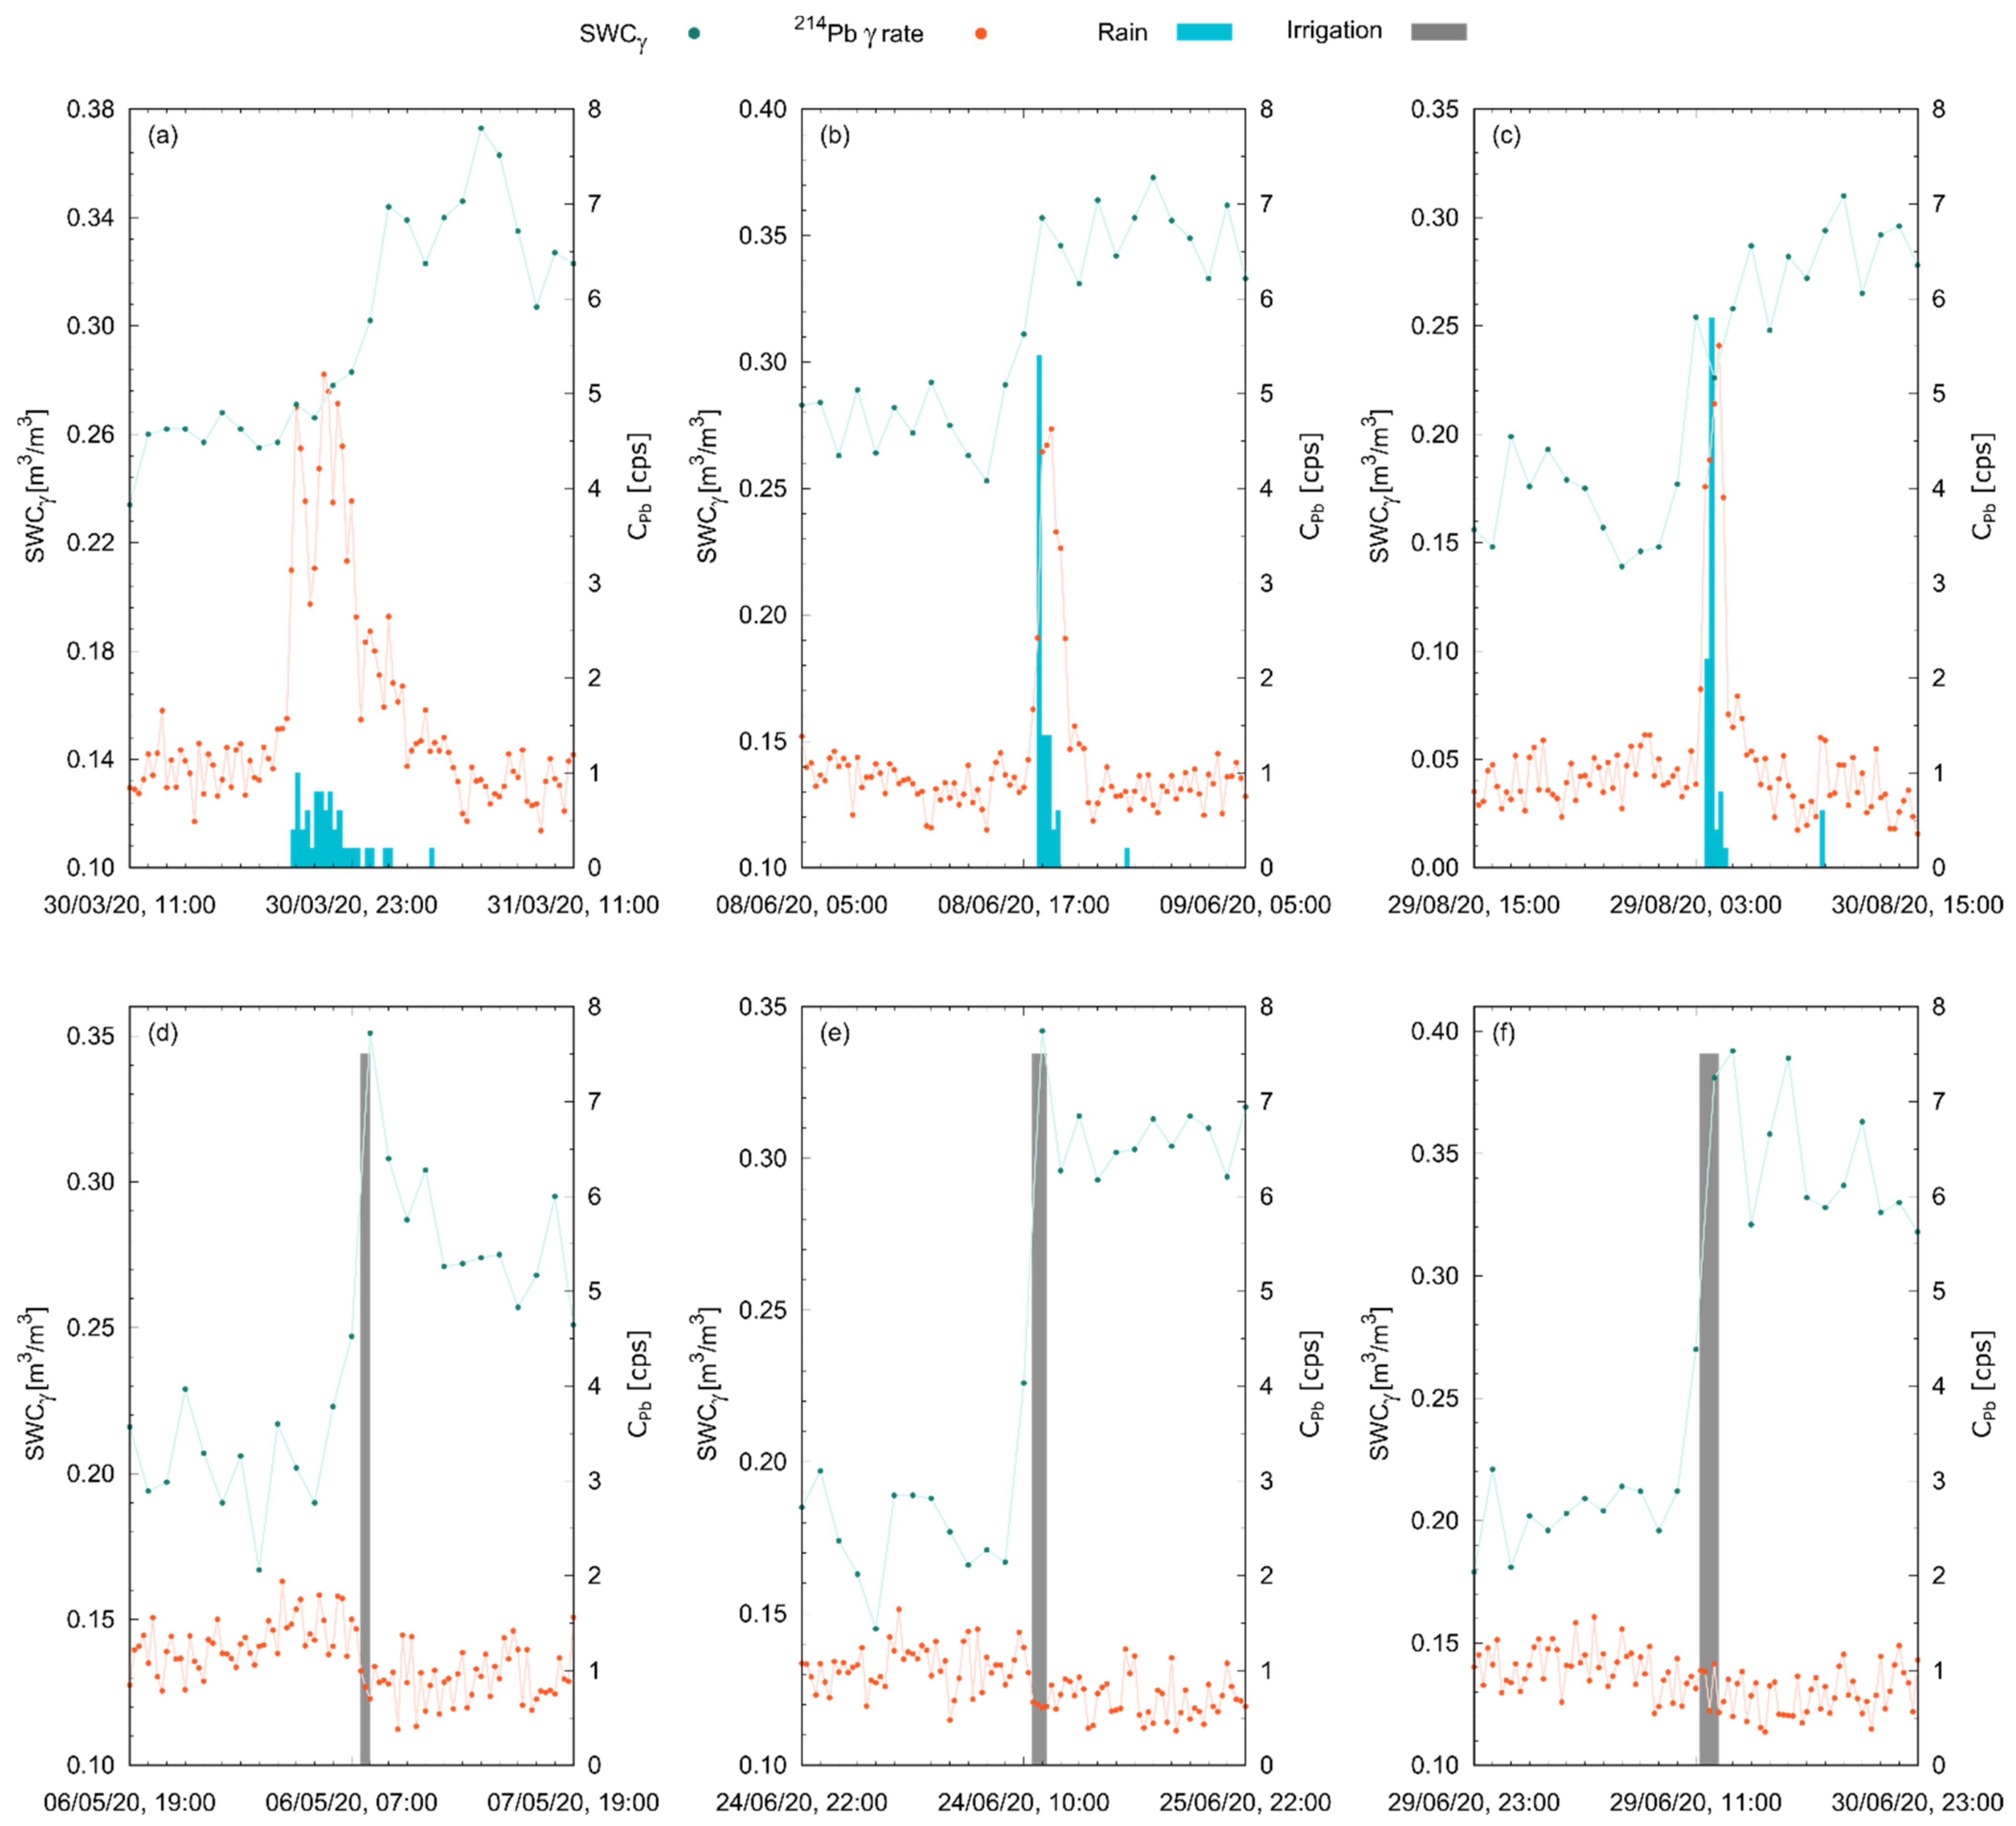
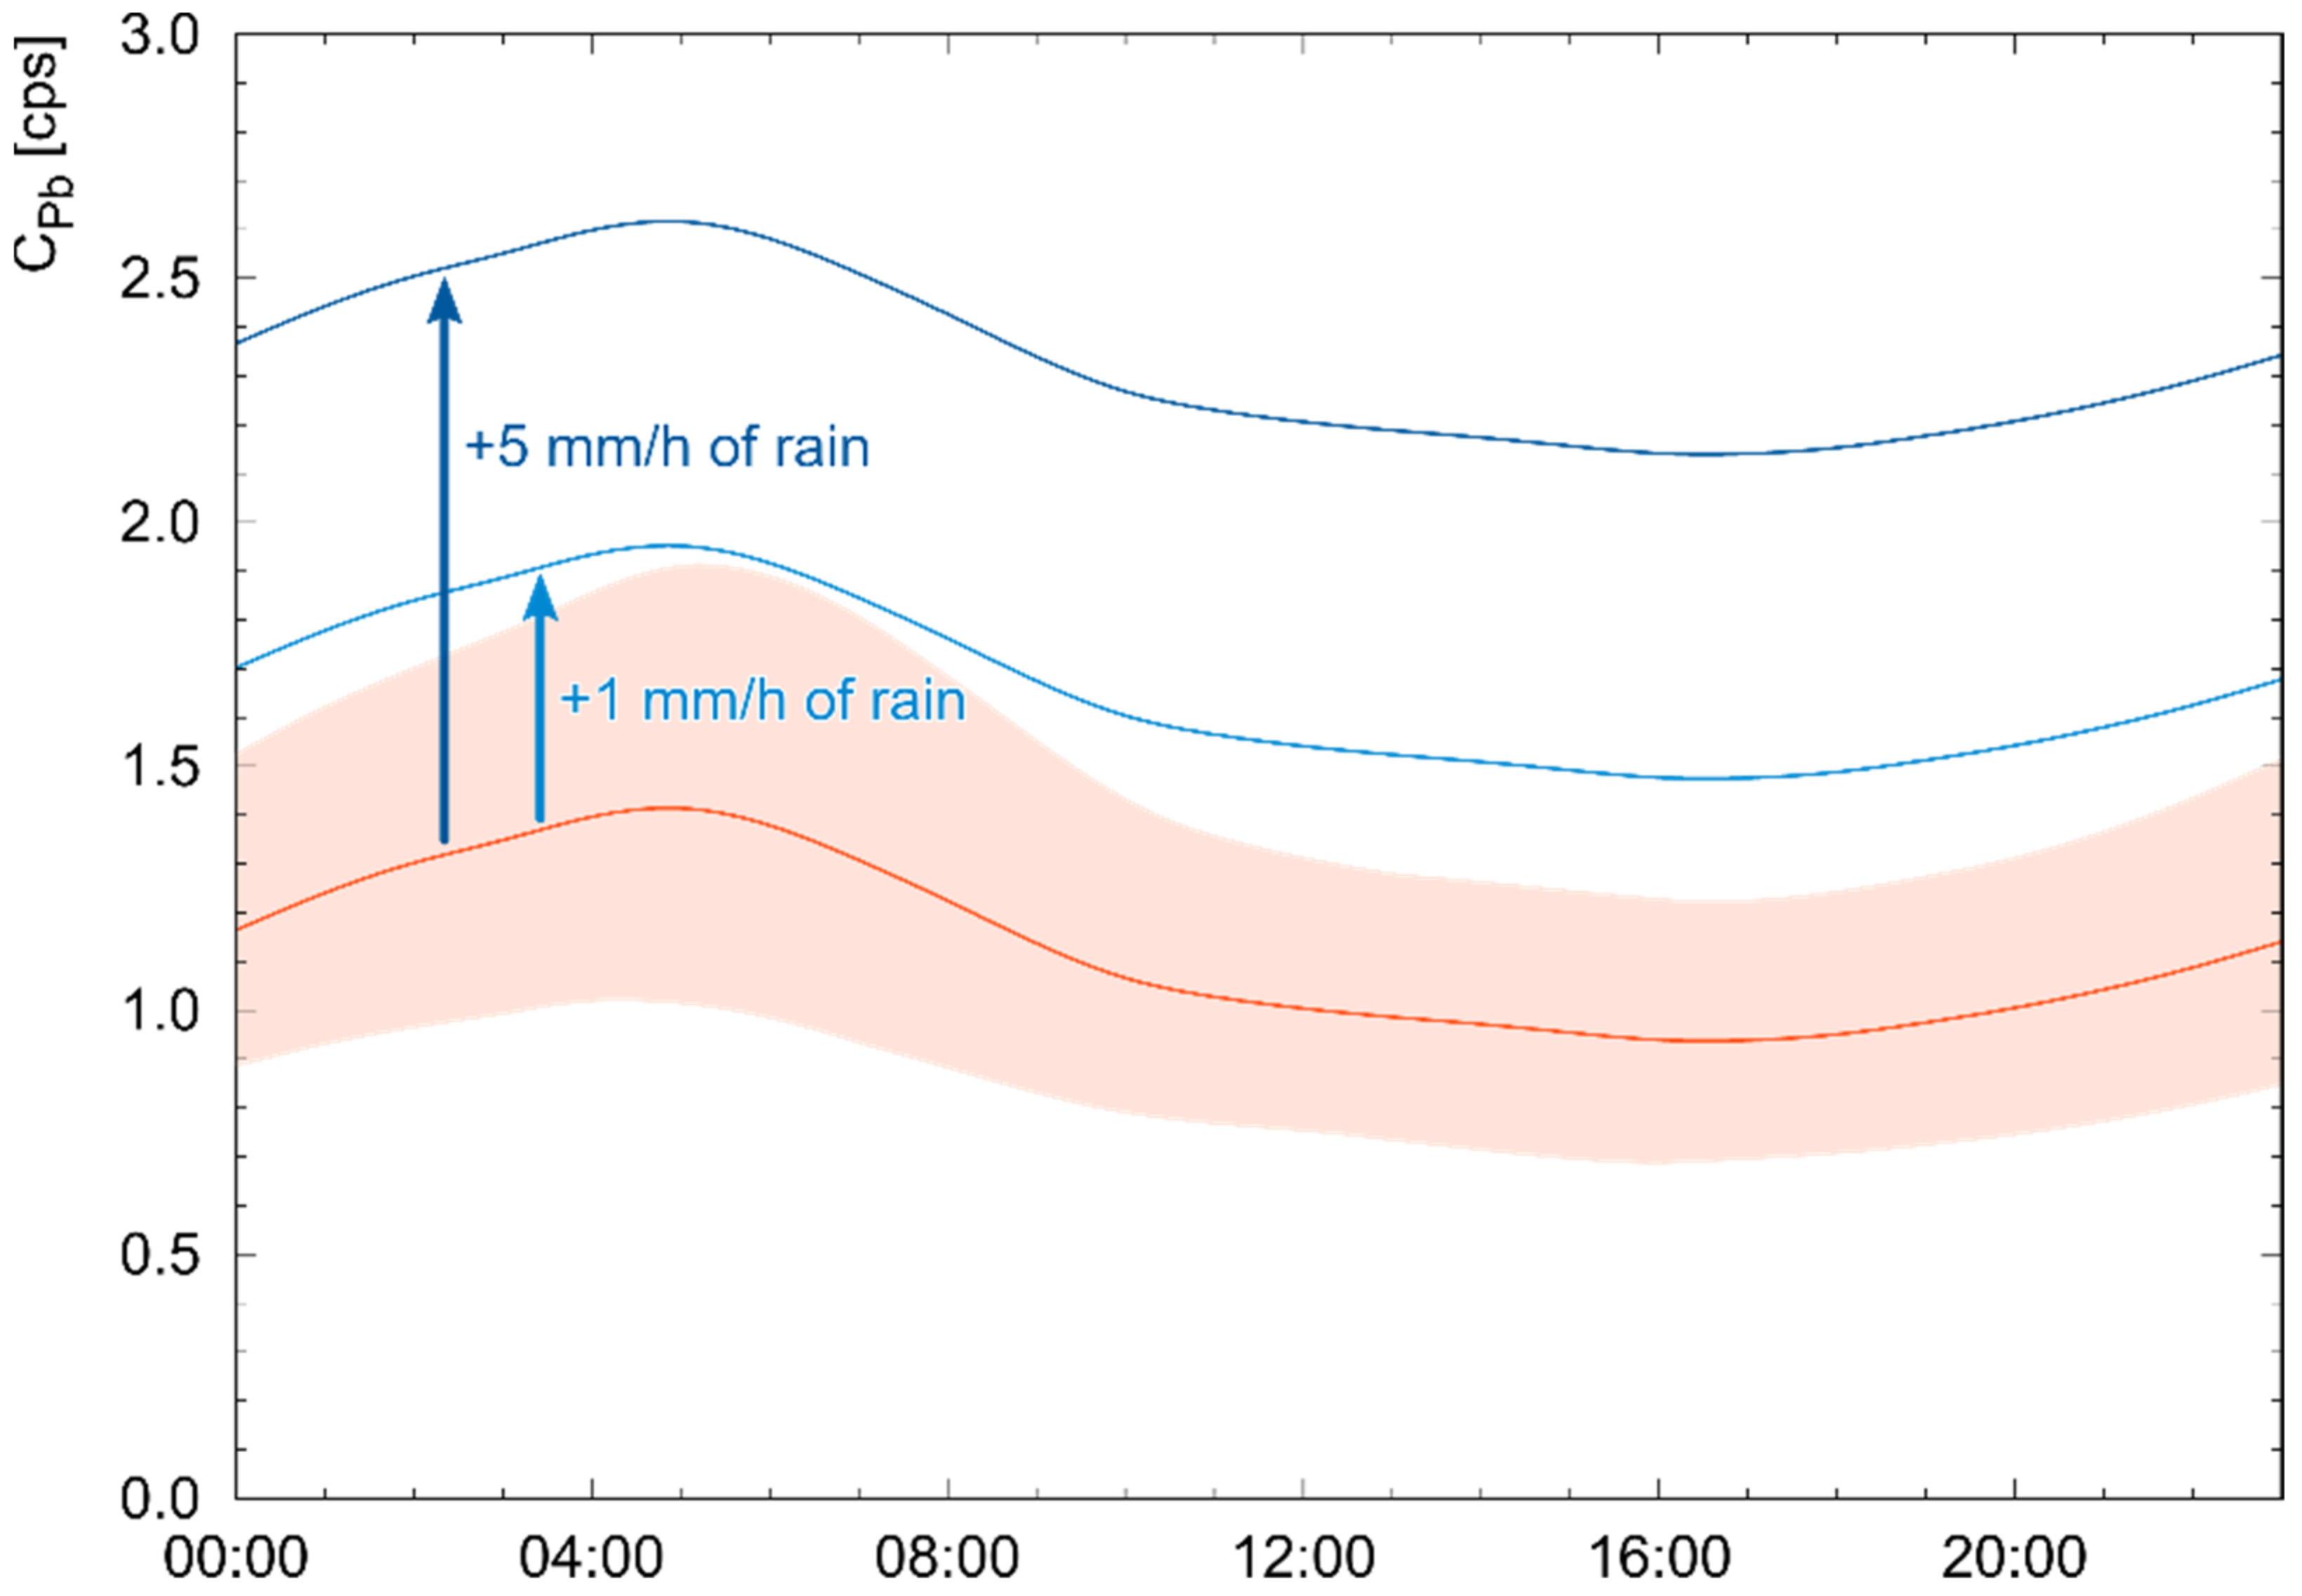
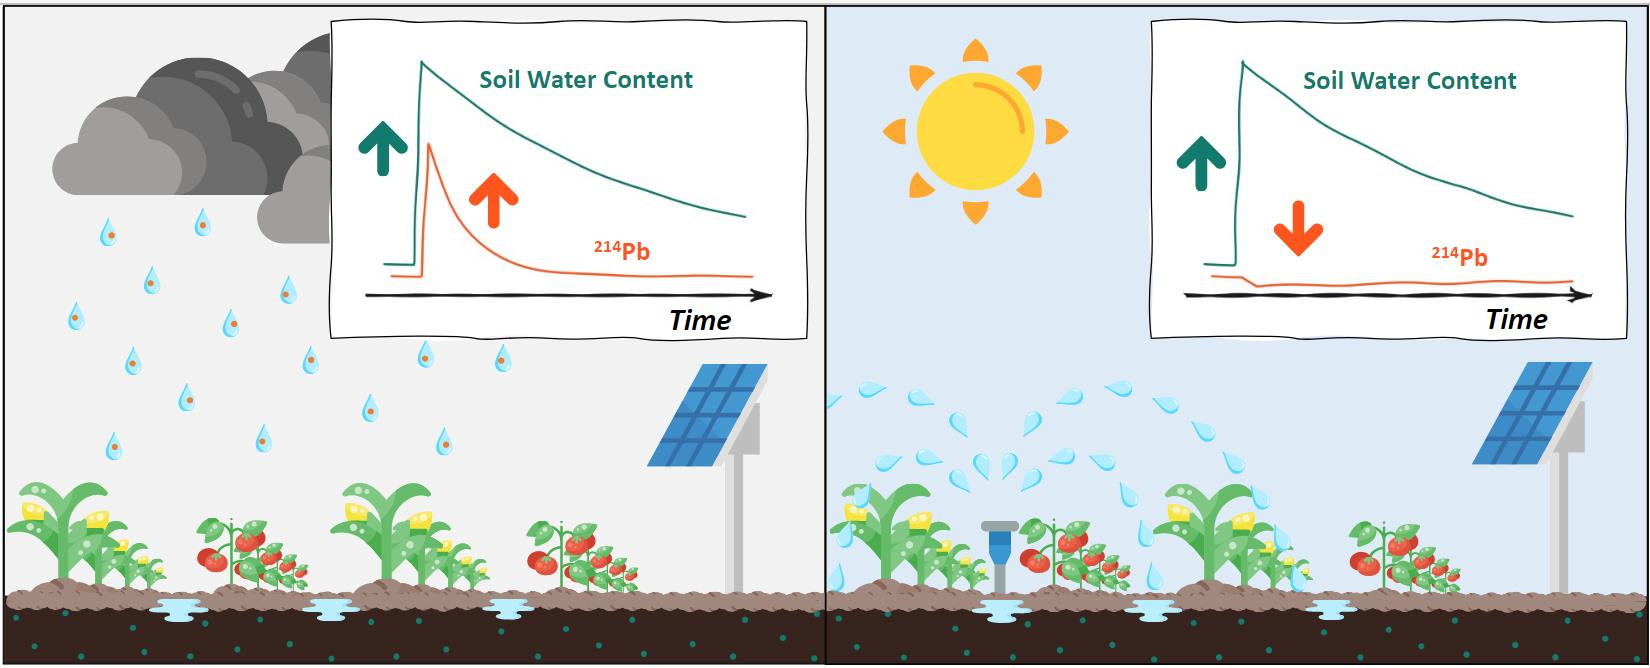
4.2. Irrigation and Rain Discrimination

The PGRS station offers the ability to independently understand the trigger of water precipitation. In particular, the observation of the time series of C P b enables an unambiguous identification of irrigation and rain events. This ability appears evident from two significant episodes during T2017 (Figure 5) and M2020 (Figure 6), when irrigation and rain happened shortly after each other. Whilst the estimated SWCγ increased, correspondingly, during both irrigation and rainfall, the measured C P b   decreased during the former and drastically increased in the latter case. These increases in C P b , amounting to more than 6 cps, appear clearly distinguishable from both the typical statistical fluctuations in the 214Pb window (~0.2 cps) and the variability ascribed to well-known day–night oscillations (~0.3 cps) related to atmospheric radon [33,34,35].
Both the estimations of SWCγ and of the rain-induced enhancement of C P b   come from two complementary uses of the same technique, although the time variation of these quantities is related to completely distinct processes characterized by different timescales. After each precipitation, the increase in SWCγ was followed by a week-long decrease caused by the drying of the soil. These very slow variations do not require high temporal resolutions: a 1 h sampling represents an optimal compromise between low statistical errors and a good temporal sampling. The increase of C P b due to the rainwater precipitation of additional 214Pb atoms to the ground exponentially decreases following a 26.8 min half-life. A 15 min resolution thus allows for a proper characterization of both the C P b variation due to the rain event and of the exponential decrease due to 214Pb decay.
The above illustrated behavior was regularly found during all precipitations recorded during the two data-taking periods (Figure 7 and Figure 8, and Table 4). Regardless of the origin of the precipitated water, the observed SWCγ increased for both rain and irrigation events, with a growth (typically of ~0.10 m3/m3 in response to ~10 mm of precipitated water) clearly distinguishable from the detected systematic uncertainties ( 0.023 m3/m3).
As soon as rainfall started, C P b   immediately increased (Figure 7a–c and Figure 8a–c), reaching peak values even five times larger than values obtained before rainfall. This increase was proportional to the square root of the rain rate R (Equation (2)) and could not be mistaken for statistical fluctuations, typically of the order of ~0.2 cps [9]. This appeared particularly evident from the positive variation of the average C P b value recorded before and after rains (Table 4), which proved an effective smoking gun for rainfalls. Furthermore, during irrigation events (Figure 7d–f and Figure 8d–f) water precipitation was not followed by any transient increase in C P b ; the additional water layer precipitated to the soil surface shielded part of the gamma radiation coming from the ground, leading to a negative variation in the average C P b values recorded before and after irrigation.
In the absence of precipitation or irrigation water, C P b   statistically fluctuated around the typical background of ~1 cps (Figure 7 and Figure 8). However, the background in the 214Pb energy region is not constant in time: it follows a diurnal and seasonal variation caused by the oscillation of its progenitor 222Rn content in the atmosphere. This phenomenon is tightly bound to factors affecting 222Rn mobility, mainly pressure and temperature, and causes a 1-day period oscillation cycle in the observed C P b (Figure 9). The non-stop measurement of C P b during the 268 sunny days occurred in T2017, and M2020 allowed a high-statistics characterization of these oscillations. On average, the C P b variability exhibited in each hour of the day during the entire data taking (i.e., the width of the 1σ band of Figure 9) was 0.33 cps.
Diurnal C P b oscillations did not have any effect on our ability to identify rain events. Firstly, the discrimination of rains and irrigations is based on the relative increase of C P b over the background, so the increase remains visible regardless of the before-rain C P b value. Secondly, these oscillations occur with a period of 24 h, which is much longer than the timescales of rain-induced C P b variations. Finally, the observed variability of 0.33 cps (obtained in the worst-case scenario by aggregating all data) is lower than rain-induced variations: the C P b increase due to a rain rate of 1 mm/h is 0.5 cps, while for a rain rate of 5 mm/h is 1.2 cps (Equation (2)). This means that it is still possible to identify a 1 mm/h rain from the background at 1σ, and a 5 mm/h rain at 3σ level.

5. Conclusions

This study proves the reliability of PGRS as a mature technique for proximal remote sensing applied to precision agriculture. The capability to distinguish rainwater from irrigation without any meteorological support information, paired with the effectiveness in estimating the SWC, makes the PGRS station a consolidated non-invasive technology in supplying crucial information for scheduling irrigations and managing resources with a view to reduce water wastage. In particular, we demonstrated that:
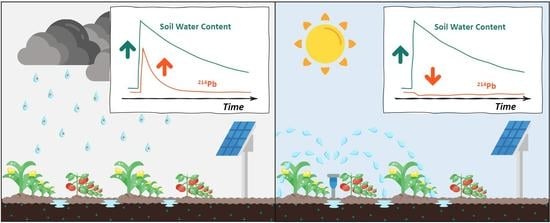
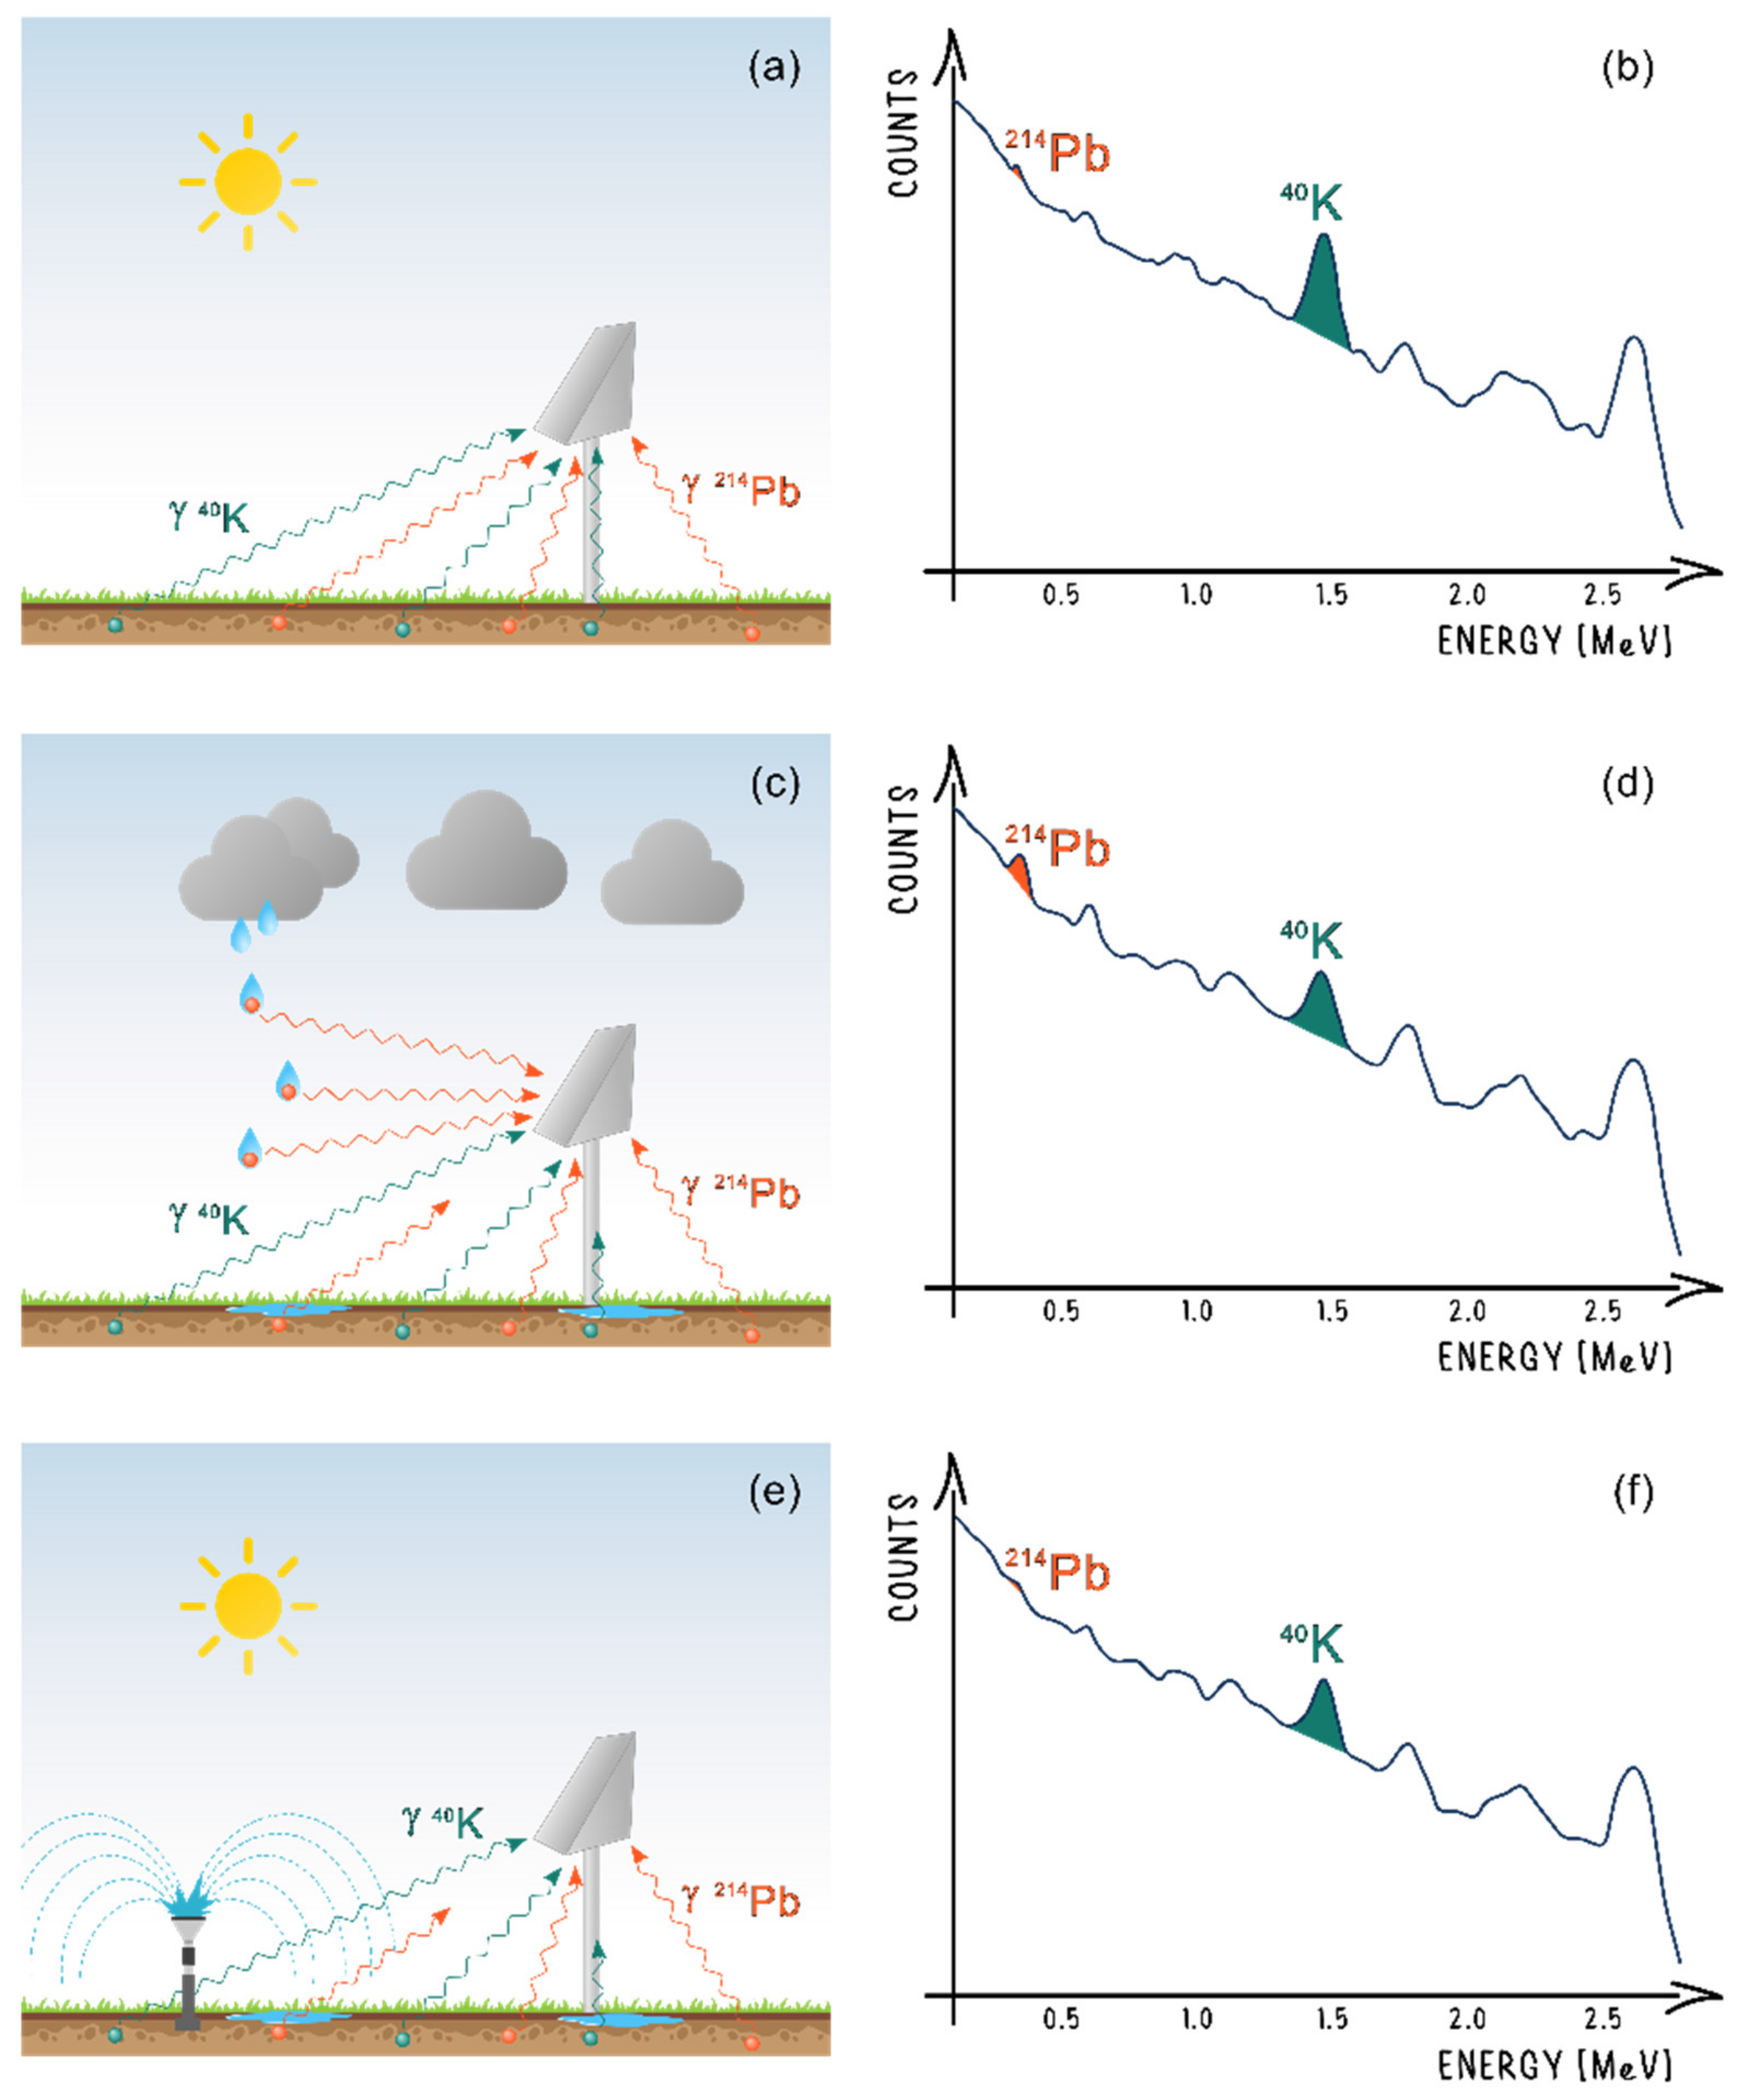
  • The simultaneous observation in a gamma spectrum of a transient increase in the 214Pb signal, coupled with a decrease in the 40K signal, is an effective proxy for rainfall, while a decrease in both 214Pb and 40K signals is a reliable fingerprint for irrigation;
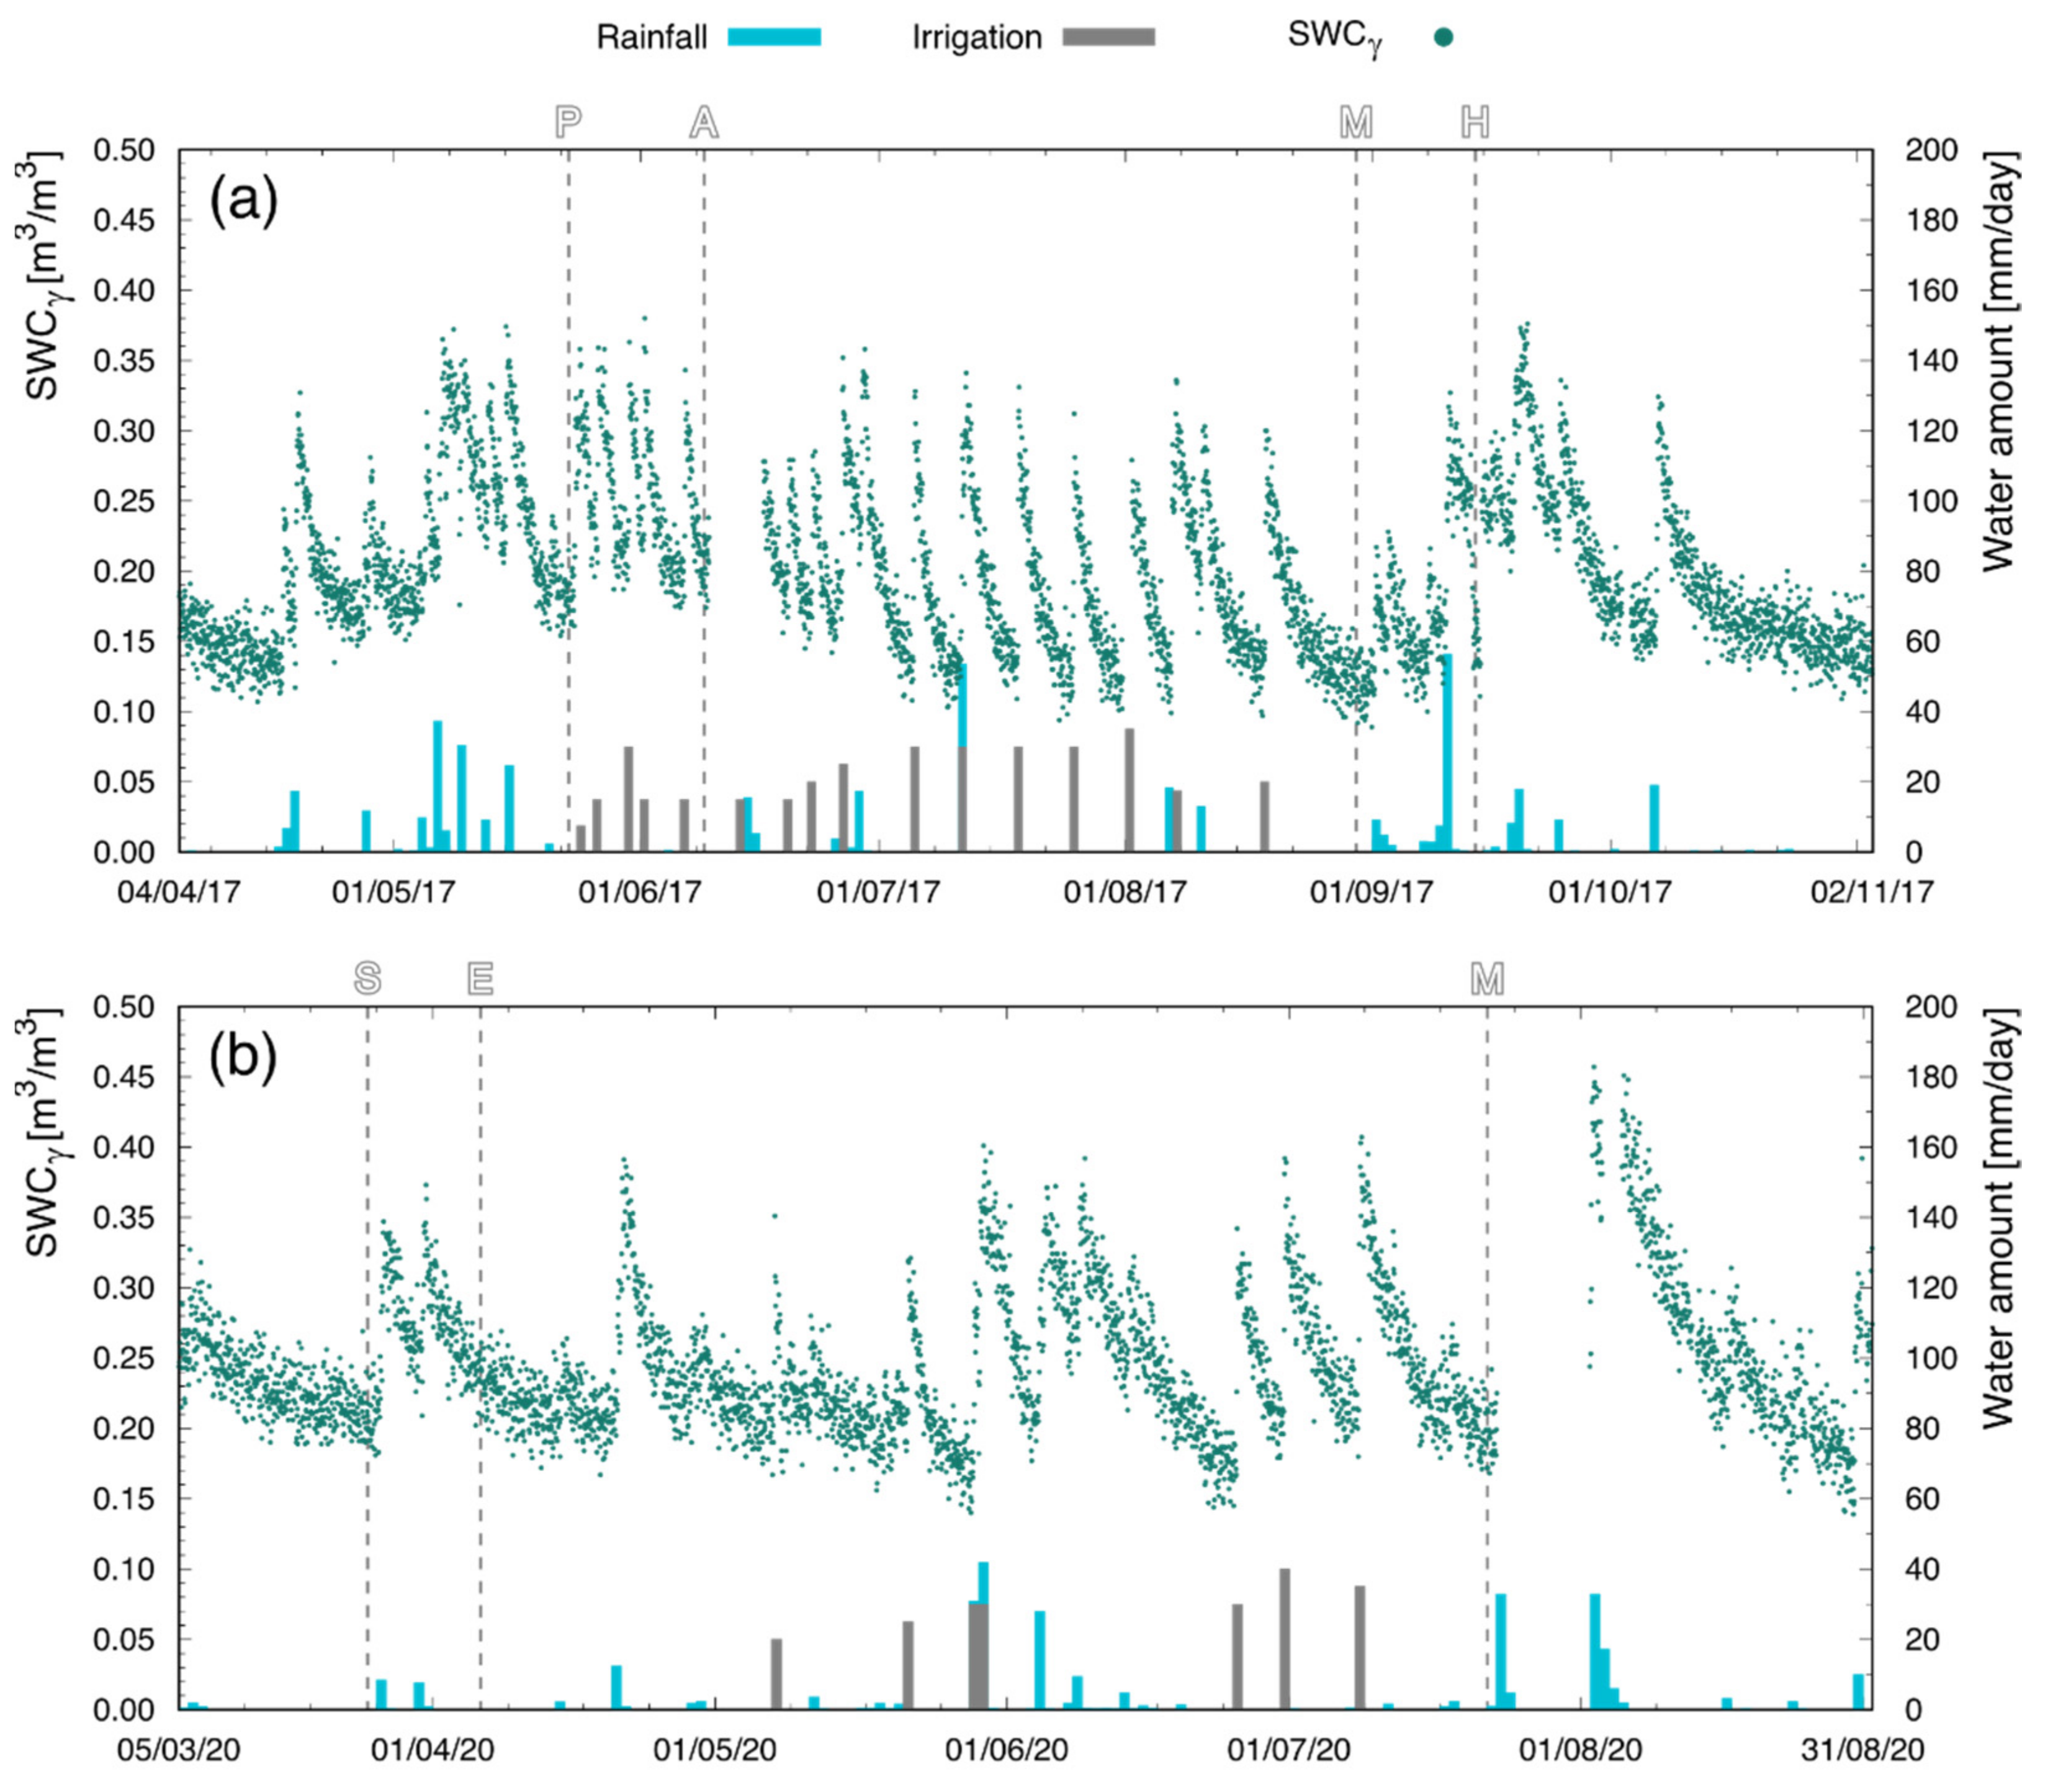
  • During a total of 102 rainy days and 23 irrigated days, we were able to discern rain and irrigation without observing any false positive or false negative. Even low rain rates (~1 mm/h) were distinguishable from the gamma background at 1σ level. The rain-induced increase in the 214Pb signal was clearly discernible from both environmental (diurnal oscillations) and statistical fluctuations;
  • After a single calibration, the PGRS station successfully measured, in real time, the SWC at a field scale level for both tomato (T2017 campaign) and maize (M2020 campaign) crops for a total of ~9000 h. Due to the remote-controlled data taking, the PGRS station required on-site maintenance interventions only on a few occasions due to extraordinary weather events.;
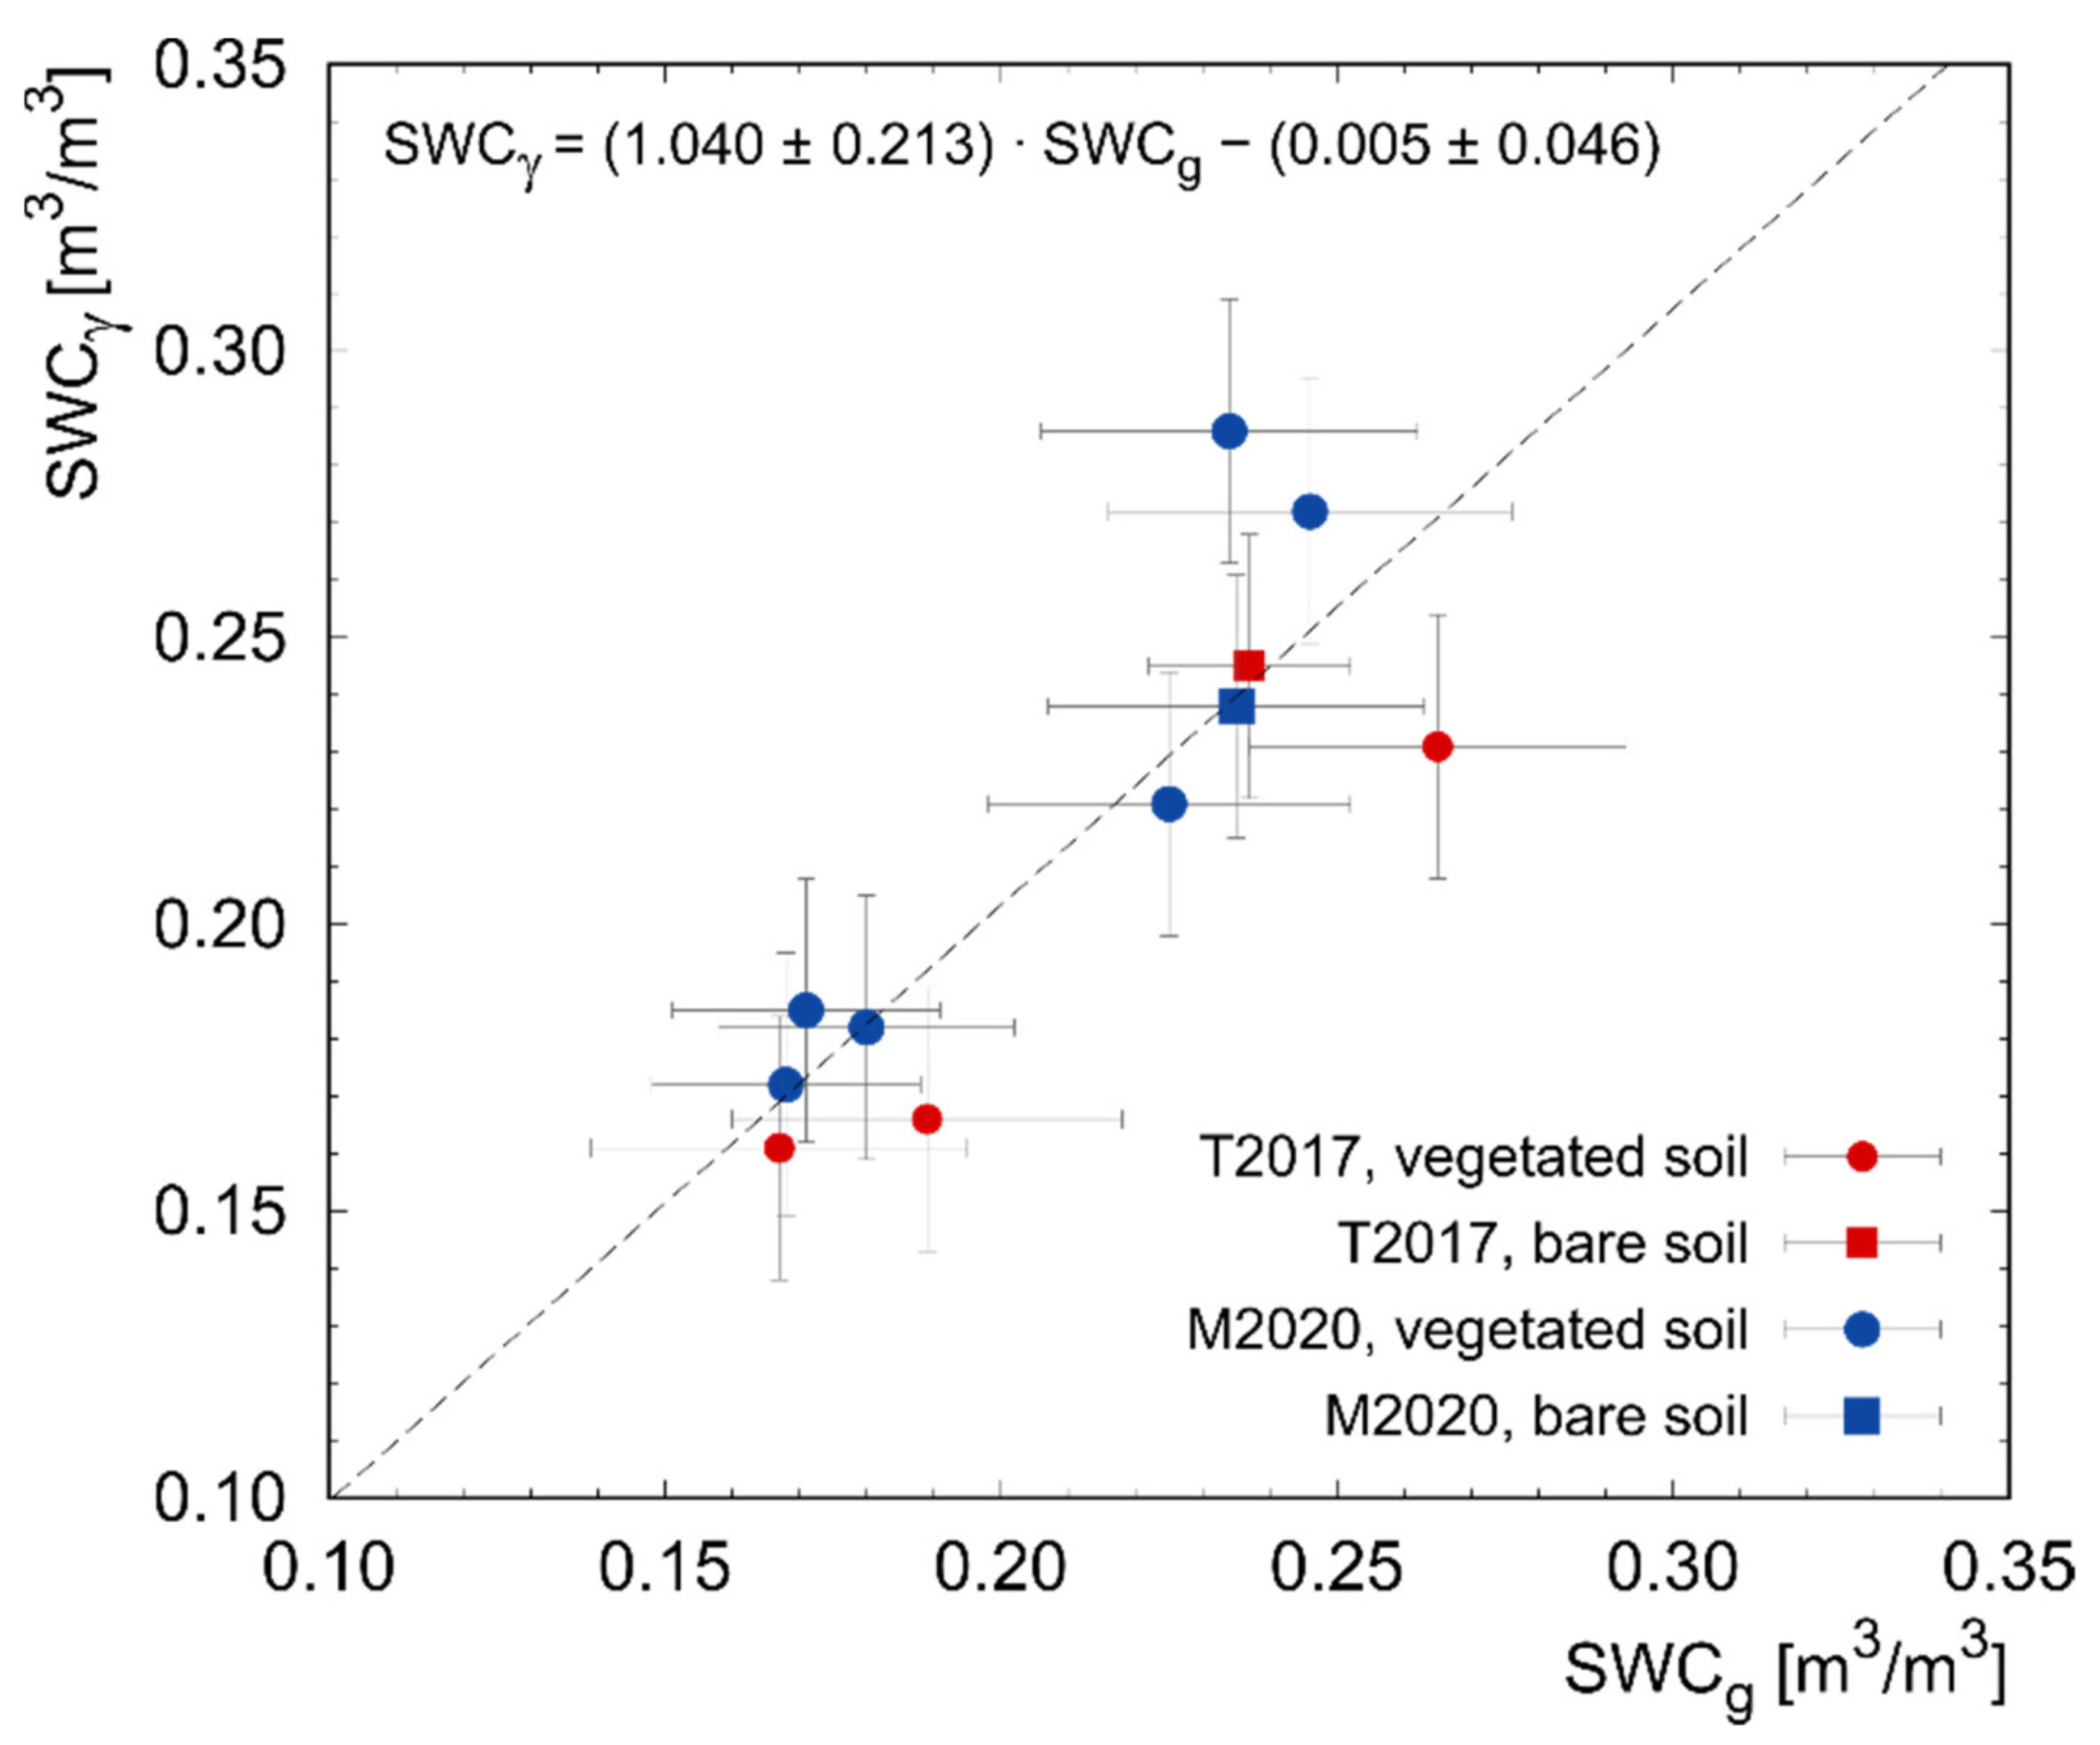
  • The accuracy of the PGRS technique was demonstrated through the validation of measurements by comparing SWCγ and SWCg estimates. The results from the two methods proved compatible within 1σ, and the regression line exhibited a slope and an intercept compatible at 1σ level with 1 and 0, respectively. The accuracy extended through bare and vegetated soil conditions, and through different crops (tomato and maize), showing the effectiveness of the correction adopted for the shielding effect of the BWC.
In future research, PGRS stations could be implemented as supporting tools in view of satellite data (e.g., SMAP, SMOS, ASCAT) calibration for quantifying the SWC over large areas, bridging the gap between proximal and remote fields of view. The footprint (field scale) and the high sensitivity of the PGRS make it an essential tool for extracting quantitative information from satellite microwave and reflectance information. Indeed, if on the one hand, new satellite measurements provide an unprecedented free source of information in terms of spatial-temporal resolutions, on the other hand, an effective ground truth of soil moisture products retrieved from satellites is mandatory.

Author Contributions

Conceptualization, A.S., F.M. and V.S.; methodology, A.S., M.A. (Matteo Albéri), F.M. and V.S.; software, A.S., M.A. (Michele Amoretti), E.C. and G.P.; validation, L.C., M.D.C., S.G., T.L., F.M., D.S. and V.S.; formal analysis, A.S., M.A.(Matteo Albéri), E.C., M.M. and K.G.C.R.; investigation, M.A. (Matteo Albéri), M.A. (Michele Amoretti), E.B., T.L., G.P., F.S. and D.S.; resources, M.A. (Matteo Albéri), M.A. (Michele Amoretti), S.A., E.B., T.C., S.G., E.G., T.L., M.M., G.P. and D.S.; data curation, M.A. (Michele Amoretti), E.C., S.G., T.L., K.G.C.R. and D.S.; writing—original draft preparation, A.S., A.M., F.M. and V.S.; writing—review and editing, A.S., M.A. (Matteo Albéri), S.A., S.C., E.C., T.C., E.G., A.M., M.M., K.G.C.R., F.S. and V.S.; visualization, A.S., A.M., M.M., K.G.C.R. and F.S.; supervision, A.S., F.M. and V.S.; project administration, S.A., S.C., F.M. and V.S.; funding acquisition, S.A., S.C., L.C., M.D.C., T.C., E.G., F.M. and V.S. All authors have read and agreed to the published version of the manuscript.

Funding

This work was partially funded by the National Institute of Nuclear Physics (INFN) through the ITALian RADioactivity project (ITALRAD). The authors would like to acknowledge the support of (i) Project “Protocolli Operativi Scalabili per l’agricoltura di precisione—POSITIVE”- CUP: D41F18000080009; (ii) Project “Monitoraggio degli sversamenti illegali attraverso l’impiego sinergico di tecnologie avanzate—C4E”—CUP: B46C18000750005; (iii) FAR 2019-2020 of the University of Ferrara; and (iv) GEOexplorer Impresa Sociale S.r.l.

Institutional Review Board Statement

Not applicable.

Informed Consent Statement

Not applicable.

Data Availability Statement

The data presented in this study are available on request from the corresponding author.

Acknowledgments

The authors thank Gabriele Baroni, Luca Brocca, Barbara Fabbri, Giovanni Fiorentini, Vincenzo Guidi, Paolo Mannini, and Martina Natali for fruitful discussions, and Stefano Chiozzi, Monia Barca, Paola Fabbri, and Claudia La Mela for their support.

Conflicts of Interest

The authors declare no conflict of interest.

Nomenclature

AbbreviationDescription
BWCBiomass Water Content, i.e., amount of water (in mm) contained in vegetation
CRNSCosmic-Ray Neutron Sensing, a method of measuring the SWC through the detection
of low-energy neutrons
FOVField of View, i.e., the effective range from which the instrument can receive a signal
PGRSProximal Gamma-Ray Spectroscopy, a technique of measuring the SWC through the
detection of gamma rays emitted by the decay process of radioactive elements
θ W P Wilting point, i.e., the minimum percentage of water content of the soil required by
the plant to not wilt
θ F C Field capacity, i.e., the maximum water-to-soil ratio that does not trigger water
drainage
θ S Saturation, i.e., maximum water capacity (in %) of the soil, including water interested
by draining
K S Hydraulic conductivity, a way of quantifying the ease for a fluid to move in the soil
SWCgVolumetric Soil Water Content estimated from gravimetric measurements
SWCγVolumetric Soil Water Content estimated from PGRS measurements
w g Gravimetric Soil Water Content estimated from gravimetric measurements
w γ Gravimetric Soil Water Content estimated from PGRS measurements
C K Gamma count rate produced from the 40K decay with photopeak at energy 1.46 MeV
C P b Gamma count rate produced from the 214Pb decay with photopeak at energy 295 keV
Ω Parameter determined by the ratio between the mass attenuation coefficients for the
solid component of the soil and its water
Λ Count rate attenuation function, which expresses the correction (due to the presence
of BWC) that must be accounted for during the SWC derivation
R Rain rate, i.e., the amount of water accumulated by rain on the ground in a unit of
time

References

  1. FAO. The State of Food and Agriculture 2020. Overcoming Water Challenges in Agriculture; FAO: Rome, Italy, 2020. [Google Scholar]
  2. United Nations. Transforming our world: The 2030 Agenda for Sustainable Development; United Nations: New York, NY, USA, 2015. [Google Scholar]
  3. Simionesei, L.; Ramos, T.B.; Palma, J.; Oliveira, A.R.; Neves, R. IrrigaSys: A web-based irrigation decision support system based on open source data and technology. Comput. Electron. Agric. 2020, 178, 105822. [Google Scholar] [CrossRef]
  4. Wang, W.; Cui, Y.; Luo, Y.; Li, Z.; Tan, J. Web-based decision support system for canal irrigation management. Comput. Electron. Agric. 2019, 161, 312–321. [Google Scholar] [CrossRef]
  5. Dari, J.; Quintana-Seguí, P.; Escorihuela, M.J.; Stefan, V.; Brocca, L.; Morbidelli, R. Detecting and mapping irrigated areas in a Mediterranean environment by using remote sensing soil moisture and a land surface model. J. Hydrol. 2021, 596, 126129. [Google Scholar] [CrossRef]
  6. Jalilvand, E.; Tajrishy, M.; Ghazi Zadeh Hashemi, S.A.; Brocca, L. Quantification of irrigation water using remote sensing of soil moisture in a semi-arid region. Remote Sens. Environ. 2019, 231, 111226. [Google Scholar] [CrossRef]
  7. Strati, V.; Albéri, M.; Anconelli, S.; Baldoncini, M.; Bittelli, M.; Bottardi, C.; Chiarelli, E.; Fabbri, B.; Guidi, V.; Raptis, K.; et al. Modelling Soil Water Content in a Tomato Field: Proximal Gamma Ray Spectroscopy and Soil–Crop System Models. Agriculture 2018, 8, 60. [Google Scholar] [CrossRef] [Green Version]
  8. Filippucci, P.; Tarpanelli, A.; Massari, C.; Serafini, A.; Strati, V.; Alberi, M.; Raptis, K.G.C.; Mantovani, F.; Brocca, L. Soil moisture as a potential variable for tracking and quantifying irrigation: A case study with proximal gamma-ray spectroscopy data. Adv. Water Resour. 2020, 136, 103502. [Google Scholar] [CrossRef]
  9. Bottardi, C.; Albéri, M.; Baldoncini, M.; Chiarelli, E.; Montuschi, M.; Raptis, K.G.C.; Serafini, A.; Strati, V.; Mantovani, F. Rain rate and radon daughters’ activity. Atmos. Environ. 2020, 238, 117728. [Google Scholar] [CrossRef]
  10. Toková, L.; Igaz, D.; Aydin, E. Measurement of Volumetric Water Content by Gravimetric and Time Domain Reflectometry Methods at Field Experiment with Biochar and N Fertilizer. Acta Hortic. Regiotect. 2019, 22, 61–64. [Google Scholar] [CrossRef] [Green Version]
  11. Pätzold, S.; Leenen, M.; Heggemann, T.W. Proximal Mobile Gamma Spectrometry as Tool for Precision Farming and Field Experimentation. Soil Syst. 2020, 4, 31. [Google Scholar] [CrossRef]
  12. Tan, X.; Zhang, L.; He, C.; Zhu, Y.; Han, Z.; Li, X. Applicability of cosmic-ray neutron sensor for measuring soil moisture at the agricultural-pastoral ecotone in northwest China. Sci. China Earth Sci. 2020, 63, 15. [Google Scholar] [CrossRef]
  13. Zhu, X.; Shao, M.a.; Zeng, C.; Jia, X.; Huang, L.; Zhang, Y.; Zhu, J. Application of cosmic-ray neutron sensing to monitor soil water content in an alpine meadow ecosystem on the northern Tibetan Plateau. J. Hydrol. 2016, 536, 247–254. [Google Scholar] [CrossRef]
  14. Andreasen, M.; Jensen, K.H.; Desilets, D.; Franz, T.E.; Zreda, M.; Bogena, H.R.; Looms, M.C.J.V.Z.J. Status and perspectives on the cosmic-ray neutron method for soil moisture estimation and other environmental science applications. Vadose Zone J. 2017, 16, 1–11. [Google Scholar] [CrossRef] [Green Version]
  15. Siebert, S.; Kummu, M.; Porkka, M.; Döll, P.; Ramankutty, N.; Scanlon, B.R. A global data set of the extent of irrigated land from 1900 to 2005. Hydrol. Earth Syst. Sci. 2015, 19, 1521–1545. [Google Scholar] [CrossRef] [Green Version]
  16. Deines, J.M.; Kendall, A.D.; Hyndman, D.W. Annual Irrigation Dynamics in the US. Northern High Plains Derived from Landsat Satellite Data. Geophys. Res. Lett. 2017, 44, 9350–9360. [Google Scholar] [CrossRef]
  17. Xie, Y.; Lark, T.J. Mapping annual irrigation from Landsat imagery and environmental variables across the conterminous United States. Remote Sens. Environ. 2021, 260, 112445. [Google Scholar] [CrossRef]
  18. Ozdogan, M.; Yang, Y.; Allez, G.; Cervantes, C. Remote Sensing of Irrigated Agriculture: Opportunities and Challenges. Remote Sens. 2010, 2, 2274–2304. [Google Scholar] [CrossRef] [Green Version]
  19. Karthikeyan, L.; Chawla, I.; Mishra, A.K. A review of remote sensing applications in agriculture for food security: Crop growth and yield, irrigation, and crop losses. J. Hydrol. 2020, 586, 124905. [Google Scholar] [CrossRef]
  20. Salmon, J.M.; Friedl, M.A.; Frolking, S.; Wisser, D.; Douglas, E.M. Global rain-fed, irrigated, and paddy croplands: A new high resolution map derived from remote sensing, crop inventories and climate data. Int. J. Appl. Earth Obs. Geoinf. 2015, 38, 321–334. [Google Scholar] [CrossRef]
  21. Brocca, L.; Tarpanelli, A.; Filippucci, P.; Dorigo, W.; Zaussinger, F.; Gruber, A.; Fernández-Prieto, D. How much water is used for irrigation? A new approach exploiting coarse resolution satellite soil moisture products. Int. J. Appl. Earth Obs. Geoinf. 2018, 73, 752–766. [Google Scholar] [CrossRef]
  22. Patiris, D.L.; Pensieri, S.; Tsabaris, C.; Bozzano, R.; Androulakaki, E.G.; Anagnostou, M.N.; Alexakis, S. Rainfall Investigation by Means of Marine In Situ Gamma-ray Spectrometry in Ligurian Sea, Mediterranean Sea, Italy. J. Mar. Sci. Eng. 2021, 9, 903. [Google Scholar] [CrossRef]
  23. Tsabaris, C.; Androulakaki, E.G.; Ballas, D.; Alexakis, S.; Perivoliotis, L.; Iona, A. Radioactivity Monitoring at North Aegean Sea Integrating In-Situ Sensor in an Ocean Observing Platform. J. Mar. Sci. Eng. 2021, 9, 77. [Google Scholar] [CrossRef]
  24. Grasty, R.L. Radon emanation and soil moisture effects on airborne gamma-ray measurements. Geophysics 1997, 62, 7. [Google Scholar] [CrossRef]
  25. Baldoncini, M.; Albéri, M.; Bottardi, C.; Chiarelli, E.; Raptis, K.G.C.; Strati, V.; Mantovani, F. Investigating the potentialities of Monte Carlo simulation for assessing soil water content via proximal gamma-ray spectroscopy. J. Environ. Radioact. 2018, 192, 105–116. [Google Scholar] [CrossRef] [PubMed] [Green Version]
  26. Baldoncini, M.; Albéri, M.; Bottardi, C.; Chiarelli, E.; Raptis, K.G.C.; Strati, V.; Mantovani, F. Biomass water content effect on soil moisture assessment via proximal gamma-ray spectroscopy. Geoderma 2019, 335, 69–77. [Google Scholar] [CrossRef] [Green Version]
  27. Meade, K.A.; Cooper, M.; Beavis, W.D. Modeling biomass accumulation in maize kernels. Field Crops Res. 2013, 151, 92–100. [Google Scholar] [CrossRef]
  28. Peel, M.C.; Finlayson, B.L.; McMahon, T.A. Updated world map of the Köppen-Geiger climate classification. Hydrol. Earth Syst. Sci. 2007, 11, 12. [Google Scholar] [CrossRef] [Green Version]
  29. Giannerini, G.; Genovesi, R. Irrinet: IT services for farm water management, a large scale implementation in Italy. In Proceedings of the EFITA 2011 Conference Proceedings, Prague, Czech Republic, 11–14 July 2011. [Google Scholar]
  30. Mannini, P.; Genovesi, R.; Letterio, T. IRRINET: Large Scale DSS Application for On-farm Irrigation Scheduling. Procedia Environ. Sci. 2013, 19, 823–829. [Google Scholar] [CrossRef] [Green Version]
  31. Munaretto, S.; Battilani, A. Irrigation water governance in practice: The case of the Canale Emiliano Romagnolo district, Italy. Water Policy 2014, 16, 578–594. [Google Scholar] [CrossRef]
  32. IAEA. Guidelines for Radioelement Mapping Using Gamma Ray Spectrometry Data; Nuclear Fuel Materials Section: Vienna, Austria, 2003. [Google Scholar]
  33. Wilkening, M. Radon in the Environment; Elsevier: Amsterdam, The Netherlands, 1990. [Google Scholar]
  34. Perrier, F.; Girault, F. Harmonic response of soil radon-222 flux and concentration induced by barometric oscillations. Geophys. J. Int. 2013, 195, 945–971. [Google Scholar] [CrossRef] [Green Version]
  35. Greenfield, M.; Domondon, A.; Okamoto, N.; Watanabe, I. Variation in γ-ray count rates as a monitor of precipitation rates, radon concentrations, and tectonic activity. J. Appl. Phys. 2002, 91, 1628–1633. [Google Scholar] [CrossRef]
  36. Serafini, A.; Albéri, M.; Chiarelli, E.; Montuschi, M.; Raptis, K.G.C.; Strati, V.; Mantovani, F. Discriminating irrigation and rainfall with proximal gamma-ray spectroscopy. In Proceedings of the 2020 IEEE International Workshop on Metrology for Agriculture and Forestry (MetroAgriFor), Trento, Italy, 4–6 November 2020; pp. 191–195. [Google Scholar]
Figure 1. Drawings of the conditions under which the gamma spectra are recorded by the PGRS station (a,c,e) and of their respective gamma spectra (b,d,f). When no precipitated water is present on the ground (a), we can see the corresponding spectrum with the photopeaks of 40K and 214Pb highlighted (b). During a rain event (c), a decrease in the 40K gamma signal and an increase in the 214Pb photopeak (d) are recorded. In the case of an irrigation (e), a decrease in both 40K and 214Pb gamma signals can be observed, due to the shielding effect of the water layer on the ground (f).
Remotesensing 13 04103 g001
Figure 2. (a) The agricultural test field at Acqua Campus (Emilia Romagna, Italy), together with the positions of the PGRS (γ) and agro-meteorological (w) stations (geographic reference system WGS 84). The yellow circle around the PGRS station represents the corresponding field of view (FOV) (radius ~25 m). (b) Picture of the two stations in 2017 (tomato crop). (c) Picture of the two stations in 2020 (maize crop).
Remotesensing 13 04103 g002
Figure 3. Time series of the volumetric SWCγ estimated by the PGRS in T2017 (a) and M2020 (b). Letters indicate the crop stages of planting (P), anthesis (A), maturity (M), and harvesting (H) for T2017, and sowing (S), emergence (E), and maturity (M) for M2020. Each green point represents the hourly SWCγ estimated through the analysis of the 40K signal. The bars represent the daily amount of precipitated water (in mm), where the contributions of rain and irrigation are reported in blue and gray, respectively. The data gaps from 9 to 16 June 2017 and from 23 to 30 July 2020 were caused by system shutdowns due to maintenance.
Remotesensing 13 04103 g003
Figure 4. Scatter plot between SWCg and SWCγ measurements. Red points refer to measurements performed during T2017, while the blue ones represent data points acquired in M2020. Measurements performed in bare soil conditions are reported in squares, while data points referred to vegetated soil are reported in circles. The black dashed line represents the best fit linear curve having slope and intercept parameters, respectively, equal to (1.040 ± 0.213) and (−0.005 ± 0.046) m3/m3.
Remotesensing 13 04103 g004
Figure 5. Temporal evolution of SWCγ and of C P b   from 09/07/2017 (16:00) to 13/07/2017 (16:00) together with the water amount of irrigation (gray bar) and rainfall (blue bars), modified after [36].
Remotesensing 13 04103 g005
Figure 6. Temporal evolution of SWCγ and of C P b from 27/05/2020 (00:00) to 31/05/2020 (00:00) together with the water amount of irrigation (gray bar) and rainfall (blue bars).
Remotesensing 13 04103 g006
Figure 7. Temporal evolution of SWCγ (in green) and C P b (in orange) during three rainfalls (ac) and three irrigation events (df) occurred in T2017, modified after [36]. The SWCγ (in green) is hourly estimated, while the C P b (in orange) and the water amount (in blue for rain and in gray for irrigated water) have a 15 min time resolution.
Remotesensing 13 04103 g007
Figure 8. Temporal evolution of SWCγ (in green) and C P b (in orange) during three rainfalls (ac) and three irrigation events (df) occurred in M2020. The SWCγ (in green) is hourly estimated, while the C P b (in orange) and the water amount (in blue for rain and in gray for irrigated water) have a 15 min time resolution.
Remotesensing 13 04103 g008
Figure 9. Diurnal oscillation of C P b as a function of the hour of the day. For each of the 268 sunny days of the two data takings, the 15 min resolution data have been grouped in 24, 1 h temporal bins according to the time of the day in which they were acquired. The orange line shows the median C P b recorded, while the band shows its 1σ interval. The blue lines show the expected C P b during a rainfall of 1 mm/h and 5 mm/h, corresponding to an increase over the background of 0.5 cps and 1.2 cps, respectively.
Remotesensing 13 04103 g009
Table 1. Physical and hydraulic parameters of the soil of the experimental site for the depth interval of 0-30 cm. Sand, silt, and clay percentage, as well as bulk density and organic matter, were determined from direct measurements. The soil classification is based on the United States Department of Agriculture method. The soil hydraulic properties, i.e., wilting point (θWP), field capacity (θFC), and saturated hydraulic conductivity (KS), are derived from [7].
ParameterValue
Sand [%]45
Silt [%]40
Clay [%]15
Soil textural class Loamy
Soil bulk density [kg/m3]1345
Organic matter [%]1.26
Wilting Point ( θ W P ) [m3/m3]0.09
Field Capacity ( θ F C ) [m3/m3]0.32
Saturation ( θ S ) [m3/m3]0.48
K S [cm/day]23
Table 2. Information of the T2017 and M2020 measurement campaigns, with the start and the end of the data taking, effective hours of acquisition, and effective hours/total hours ratios. The type of the crops and planting, sowing, and harvesting dates are reported together with plant density and the total precipitation and irrigation water amounts.
T2017M2020
Start data taking [DD/MM/YYYY]04/04/201705/03/2020
End data taking [DD/MM/YYYY]02/11/201731/08/2020
Effective hours of acquisition48713981
Effective hours/total hours [%]9592
Type of cropTomato (Solanum lycopersicum)Maize (Zea mays)
Plant density [plants/m2]3.57.4
Planting-sowing date [DD/MM/YYYY]23/05/201725/03/2020
Harvesting date [DD/MM/YYYY]14/09/201702/09/2020
Total rainwater [mm]404228
Total irrigation water [mm]350210
Table 3. Results of the T2017 and M2020 validation campaigns. For both bare and vegetated soil, the table reports the measured SWCg values together with the corresponding SWCγ values measured by the PGRS station in the same dates. The reported SWCɣ correspond to the average SWCγ recorded by the PGRS station during the entire period covering the gravimetric sampling. The uncertainty on SWCγ was set to the constant value of 0.023 m3/m3, as explained in Section 3.1. The SWCg uncertainties for T2017 samples were calculated according to the procedure used for the calibration of PGRS station (Section 3.1). For M2020 measurements, the relative uncertainty assumed for SWCg data was calculated by averaging the relative standard deviation exhibited by the T2017 validation campaign. The SWCg measurement of 18/09/2017 (in italics) has been used to calibrate SWCγ values according to Equation (1) and has not been considered for the validation of the PGRS technique.
Date of Sampling
[DD/MM/YYYY]
SWCg
[m3/m3]
SWCγ
[m3/m3]
Bare soilT201718/09/20170.219 ± 0.0110.219 ± 0.023
21/09/20170.237 ± 0.0150.245 ± 0.023
M202006/04/20200.235 ± 0.0280.238 ± 0.023
Vegetated soilT201724/07/20170.167 ± 0.0280.161 ± 0.023
26/07/20170.265 ± 0.0280.231 ± 0.023
28/07/20170.189 ± 0.0290.166 ± 0.023
M202008/05/20200.225 ± 0.0270.221 ± 0.023
28/05/20200.180 ± 0.0220.182 ± 0.023
08/06/20200.246 ± 0.0300.272 ± 0.023
22/06/20200.168 ± 0.0200.172 ± 0.023
22/07/20200.171 ± 0.0200.185 ± 0.023
11/08/20200.234 ± 0.0280.286 ± 0.023
Table 4. Relative variations (in percentage) of C P b and SWCγ before and after the rains and irrigation episodes shown in Figure 7 and Figure 8, together with their start date and time, duration, and total water precipitated. SWCγ variations are calculated by comparing the average values measured in the 4 h before rain/irrigation and in the 4 h after their end. C P b variations are calculated considering the 4 h before and the 4 h after rain/irrigation started.
EventStart Date and TimeDuration [h]Total Water [mm]ΔSWCγ [%] Δ C P b   [ % ]
Rain16/04/2017, 23:154.008.3+70+130
10/08/2017, 13:451.0013+36+103
06/10/2017, 16:453.7519+85+187
30/03/2020, 19:455.508.4+36+238
08/06/2020, 17:451.259.2+28+130
30/08/2020, 03:301.259.4+48+102
Irrigation19/06/2017, 15:451.5015+33−16
26/06/2017, 09:452.2525+59−33
05/07/2017, 09:452.2530+91−45
07/05/2020, 07:300.5020+45−41
25/06/2020, 10:300.7530+65−34
30/06/2020, 11:151.0040+64−19
Publisher’s Note: MDPI stays neutral with regard to jurisdictional claims in published maps and institutional affiliations.

