Characterizing the Development Pattern of a Colluvial Landslide Based on Long-Term Monitoring in the Three Gorges Reservoir


1
Faculty of Engineering, China University of Geosciences, Wuhan 430074, China
2
School of Environmental Studies, China University of Geosciences, Wuhan 430074, China
3
Three Gorges Research Center for Geohazards, Ministry of Education, China University of Geosciences, Wuhan 430074, China
4
Geohazard Prevention Center, Chongqing 404100, China
*
Author to whom correspondence should be addressed.
Remote Sens. 2021, 13(2), 224; https://doi.org/10.3390/rs13020224
Submission received: 10 November 2020
/
Revised: 1 January 2021
/
Accepted: 7 January 2021
/
Published: 11 January 2021
(This article belongs to the Special Issue Remote Sensing for Landslide Monitoring, Mapping and Modeling)
Abstract
:Since the impoundment of the Three Gorges Reservoir (TGR) in June 2003, the fluctuation of the reservoir water level coupled with rainfall has resulted in more than 2500 landslides in this region. Among these instability problems, most colluvial landslides exhibit slow-moving patterns and pose a significant threat to local people and channel navigation. Advanced monitoring techniques are therefore implemented to investigate landslide deformation and provide insights for the subsequent countermeasures. In this study, the development pattern of a large colluvial landslide, locally named the Ganjingzi landslide, is analyzed on the basis of long-term monitoring. To understand the kinematic characteristics of the landslide, an integrated analysis based on real-time and multi-source monitoring, including the global navigation satellite system (GNSS), crackmeters, inclinometers, and piezometers, was conducted. The results indicate that the Ganjingzi landslide exhibits a time-variable response to the reservoir water fluctuation and rainfall. According to the supplement of community-based monitoring, the evolution of the landslide consists of three stages, namely the stable stage before reservoir impoundment, the initial movement stage of retrogressive failure, and the shallow movement stage with stepwise acceleration. The latter two stages are sensitive to the drawdown of reservoir water level and rainfall infiltration, respectively. All of the monitoring approaches used in this study are significant for understanding the time-variable pattern of colluvial landslides and are essential for landslide mechanism analysis and early warning for risk mitigation.
1. Introduction
The operation of a reservoir around the world usually gives rise to geohazards, especially in terms of making the slopes along the reservoir banks more prone to landslides [1,2,3]. As the most crucial hydropower facility of the Yangtze River in China, the Three Gorges Reservoir (TGR) has greatly changed the geological environment in this region [4,5]. According to a previous study, more than 2500 landslides are caused by the fluctuation of reservoir water levels in the TGR area, and many of these are colluvial landslides [6,7,8]. Due to the loose geological composition, colluvial landslides are sensitive to reservoir water and rainfall. They usually develop in complex hydrological scenarios and exhibit slow movements over long durations [9,10,11]. These characteristics make the activity of the colluvial landslides hard to predict, therefore leaving considerable uncertainty regarding an early warning strategy [12].
Although colluvial landslides show evidence of deformation at low velocities, in situ monitoring is helpful in detecting their temporal evolution [13,14]. Some studies have shown that remotely sensed techniques also play an essential role in the observation of landslide deformation [15,16,17,18]. Capturing the relationship between the hydrological and kinematic responses of these slow-moving colluvial landslides is key to analyzing their development [19,20]. For instance, the movement patterns of some typical colluvial landslides are determined based on real-time and multi-source monitoring, including the global navigation satellite system (GNSS), optic fibers, inclinometers, crackmeters, and piezometers [21,22,23,24]. Although useful and relatively easy to apply, the established monitoring network cannot account for the whole evolution process of a landslide [25]. Moreover, the monitoring data collected in previous studies were mostly utilized to forecast the short development of the landslides [26,27]. For some slow-moving landslides in the TGR, it is not sufficient to analyze their development pattern only based on recorded time series data.
In recent literature, some authors have applied the correlation and sensitivity analysis methods to explain the triggering mechanism of landslides [28,29,30], while others have proposed kinematic models on the basis of movement identification to predict landslide risks [31,32]. However, few studies use integrated in situ data to uncover the time-variable patterns of slow-moving colluvial landslides in the TGR area. Particularly, there are no detailed discussions on the effects induced by climate change and reservoir operations. From a long-term perspective, the application of available monitoring methods lacks community-based support, which benefits the hypothesis of the antecedent deformation of these landslides [33]. In this regard, reconstructing the whole evolution process of the landslide behaviors under complex geological conditions remains a significant challenge.
For this paper, we studied the development pattern of a large colluvial landslide in the Wu Gorge of the TGR area. The Ganjingzi landslide was investigated in depth with geological surveys and deformation observation. The multi-source data, obtained by conducting real-time monitoring, were integrated to explore the triggering mechanism of the landslide. In order to implement the best risk reduction strategies, community-based monitoring was used as supplement to reconstruct the evolution process of the landslide. Based on the long-term monitoring results, the time-variable development pattern influenced by reservoir operation and rainfall at different times was observed and is discussed below.
2. Geological and Geomorphological Setting
2.1. Regional Background
The Ganjingzi landslide is located on the right bank of the Yangtze river in the Gongjiafang–Goddess peak section. This section extends 12.9 km in the NW–SE direction, characterized by narrow “V”-shaped valleys and high, steep mountains (Figure 1). The Hengshixi anticline in the NE–SW direction controls the morphology of bedrock in the study area and therefore exhibits a stratified or stratoid structure. The geological units mainly consist of sedimentary strata from the Silurian to Quaternary Holocene, including colluvial deposits, shale, and limestone (Figure 2). According to previous research, the study region experienced three major tectonic events, namely the Jinning orogeny before the Sinian period, the Yanshan orogeny in the Late Jurassic, and the Himalaya orogeny in the Neogene. After the Himalaya orogeny, the east Yangtze River began to capture the western part, and the Hengshixi anticline was incised by the nascent Yangtze River [34]. Since the intensive fluvial erosion was induced by the Yangtze River, a typical valley landform is formed in this region (Figure 3).
Due to tectonic activity and landcover changes, the steep-sided valley, especially the exposed colluvial and eluvium deposits of the Holocene (Q4col+el) on the south bank of the Yangtze River, are prone to landslides (Figure 2). According to a field survey carried out by the China Geological Survey in 2016, there are 13 unstable slopes along the Yangtze River (Figure 3). In this regard, geological hazards commonly occur, especially in the bank region of the study area, which is vulnerable to the state of the river and operation of the reservoir.
The study area has a subtropical monsoon climate with a humid summer and dry winter. The average annual temperature is 18.4 °C in the Wushan district. According to meteorological data from 1960 to 2018, the average annual rainfall is 1034.6 mm, the maximum monthly rainfall is 450.6 mm (September 1979), and the maximum daily rainfall is 167.8 mm (24 June 2016). Rainfall usually concentrates from June to September, accounting for nearly 69% of the year, and notably, more than 80% of the recorded landslides occurred in this period. Except for the precipitation, the Yangtze River as the hydrological factor cannot be neglected. Since the construction of the TGR in 2003, the water level dictated by reservoir operation has fluctuated periodically between 145 and 175 m a.s.l. [35]. Specifically, the water level maintains at 145 m a.s.l. from June to August in each hydrologic year for flood control, while it remains at 175 m a.s.l. from November to December for power generation. During the rest period, the reservoir water level fluctuates with scheduled velocities.
2.2. Landslide Features
The Ganjingzi landslide is a large colluvial landslide and could be classified as a rotational or compound debris slide in the future [36,37]. It covers a total area of 9.68 × 10⁴ m2 and has a volume of about 2.0 × 10⁶ m3. The landslide elevation increases from 135 to 395 m a.s.l. with an average width of 330 m (Figure 4), and the toe of the landslide is currently submerged into the TGR (Figure 5). The landslide has an average slope of 29°. The layout map shows that the main sliding direction of the Ganjingzi landslide is 351°, facing the Yangtze River. The main scarp of the landslide is visible at an elevation of about 395 m. The left boundary exhibits as a shallow gully, and the right one is delineated by the location of the lateral crack. At the lower part of the landslide, there is a severely active zone on the right flank with an approximate area of 1.70 × 10⁴ m2 and a volume of 2.0 × 10⁵ m3. More than 700 m3 of sliding mass of this active zone collapsed into the Yangtze River on 17 June 2015.
The geological strata and lithology of the landslide were evaluated by field investigation and drilling. As shown in Figure 5, the thickest part of the sliding mass is mainly in the middle, at 34.7 m, 33.6 m, and 29.3 m in B03, B09, and B17, respectively. According to the in situ observation, this covering layer is mainly composed of gravel soil and rock blocks from Quaternary colluvium, exhibiting a loose melange with soil and rock blocks mixed at an estimated ratio of 3:7. The slip zone is revealed by the boreholes, and the material is clay-like material from weathered rock (Figure 6). Besides this, two interlayers, with a thickness from 0.6 to 3.2 m, were found at the shallow part of the landslide. The main composition of these soft interlayers is tawny coarse sand. This ascertainment agrees well with the superficial deformation of the landslide, indicating the risk of shallow movement. The bedrock is composed of Silurian gray black limestone and caesious shale, inclining to the river with a dip direction of about 332° and a dip angle of about 27°.
3. Deformation Characteristics and Movement History
Some evidence of deformation is observed frequently on the ground surface of the landslide. As shown in Figure 7a, shear cracks (C1) and several tension cracks (C2–C6) constitute the boundary of the active zone at the lower part. As the longest crack in the active zone, C1 extends for 140 m and has a width of approximately 5 cm (Figure 7f). In the central part of the landslide, several collapses along the road (F04–F10) are observed after rainfall (Figure 7b). Due to the landslide movement, houses are damaged from both the interior and outside (Figure 7c). Adjacent to the houses, there are shear cracks (C7–C13) spread in the plowland (Figure 7d). It is notable that a large number of tension cracks (C14–C20) are parallel to the main scarp of the landslide at the upper part, leading to damage to the closed footpath. Moreover, trees on the ground surface tilt down to the slope, showing the same movement trend as the landslide (Figure 7g). As shown in Table 1 and Table 2, all the details of cracks and small collapses were recorded during the field investigation.
Figure 8 illustrates the time series for rainfall, fluctuations of reservoir water level, and the landslide process. According to historical records, the landslide began to move in August 2007 after the reservoir level of TGR was initially raised to 156 m a.s.l. At that time, three tension cracks at the lower part indicated the initiation of the landslide. After the reservoir level dropped to 145 m a.s.l. in May 2009, the main scarp, extending to 152.8 m long with vertical displacement from 1.5 to 2.2 m, was found at the uppermost part of the landslide (Figure 7h). Consequently, several farmhouses near this part were damaged. After years of reservoir operation, the walls of two residential buildings in the central part of the landslide cracked in April 2014, when the reservoir level declined (Figure 7c). The severely shallow failure of the active zone occurred on 17 June 2015 (F1 and F2), which was triggered by heavy rainfall of 101.5 mm in two days. In order to mitigate the risk of landslide failure, 69 people living within the landslide site were evacuated. Meanwhile, the Wu Gorge channel was shut down for 57 h to prevent potential landslide-triggered tsunamis. On 24 April 2016, daily rainfall in the study area reached 167.8 mm, resulting in a shallow slide along the elevation of 365 m on the right flank of the upper part.
4. Establishment of Landslide Long-Term Monitoring System
The identification and early warning of the Ganjingzi landslide from 2007–2015 were carried out through community-based monitoring (Figure 9). It is an economical and flexible measure that takes people as sensors and has been widely used in the TGR area, China [38,39]. Specifically, residents living in areas prone to hazards, such as the Gongjiafang–Goddess peak section, are employed and trained by the local government to make routine inspections and hazard reports. Once any suspected warning arises (i.e., crack extension, small collapse, etc.), the relative department immediately obtains the information from these residents.
In order to improve the accuracy and ensure the timeliness of landslide monitoring, an integrated real-time monitoring system was established in June 2015. The system has high spatial and temporal resolution and is capable of the acquisition of surface and subsurface displacements, the pressures of underground water, and rainfall. The location of the monitoring instruments is shown in Figure 10.
The absolute surface displacement is obtained by the GNSS monitoring network, which includes 11 receivers (G01–G11) within the landslide and a satellite positioning reference station (G12) on the stable bedrock away from the landslide. The receivers can detect the deformation of the landslide with respect to the reference point [40]. The accuracy of GNSS monitoring in horizontal and vertical directions is 2.5 mm ± 0.5 ppm and 5 mm ± 0.5 ppm, respectively. For the surface cracks, three extensometers (E01–E03) and 23 crackmeters (M1–M23) were installed to record their development. The accuracy of the extensometers is 0.4 mm, and that of the crackmeters is 0.1 mm. Two inclinometers (QX1 and QX2) were fixed in the boreholes at the elevations of 185 m and 315 m (B08 and B11), respectively. There are six sensors (accuracy is 0.03°) in each borehole to obtain the inclination angle of the casing tube, and the results are converted into the amount of displacement, reflecting the direction and magnitude of deformation inside the landslide body. According to the in situ observation, only three boreholes (B01, B07, and B14) at the lower part detect the underground water within the landslide. Therefore, vibrating wire piezometers (P1, P2, and P3) were installed at the downslope of the landslide from 175 m a.s.l. and 195 m a.s.l. The accuracy of the piezometer is 0.5 kPa. The daily reservoir water level of the Yangtze River is provided by the China Three Gorges Corporation. The rainfall data are acquired by the tipping-bucket rain gauge adjacent to the monitoring point G11 with an accuracy of 0.1 mm.
5. Monitoring Results
5.1. Surface Deformation
Surface deformation obtained by the GNSS network and crack measurements reveals the spatial variations and time evolution of the Ganjingzi landslide. The results of GNSS monitoring, including motion orientations and displacement magnitudes, are illustrated in Figure 10. It is obvious that the main direction of the sliding mass is towards the Yangtze River. As suggested by the magnitude arrows at the different parts of the landslide, the deformation of the upper part (G8 and G9) is largest compared to the central and lower parts (G1–G7). At the approximate elevations, the monitoring points on the right part move faster than those of the left part (G6 and G7). As of 7 March 2018, G8 (348 m a.s.l.) at the upslope recorded the largest displacement, with 1096.6 mm and −482.2 mm in the horizontal and vertical directions, respectively. Conversely, the minimum motion occurred at the toe, where G2 (191.5 m a.s.l.) showed values of 81.4 mm and −102.5 mm for the horizontal and vertical displacement, respectively. Interestingly, G11 (412.7 m a.s.l.) behind the main scarp also obtained the displacements of 214.4 mm and −58.5 mm in the horizontal and vertical directions, respectively, which may be due to the main scarp providing a space for the local motion.
The cumulative displacement curves acquired from GNSS receivers are shown in Figure 11. These curves give the surface movement in the past four years, on which basis the time evolution of the landslide can be analyzed. The horizontal displacements exhibit step-like characteristics over time, and they feature with accelerated motions in a short period. After these accelerations, the slow creep movements are maintained for a long time. In detail, the acceleration phases are normally from early May to late August each year. This period is just corresponding to seasonal rainfall and the drawdown of the reservoir water level. For the remaining eight months, the displacement rates gradually decrease with reservoir impoundment and less rainfall. Vertical displacements in the upper and central parts (G6–G9) also show accelerated deformations, which agree well with the horizontal curves. However, vertical displacements in the downslope (G1 to G4) alternately increase and decrease, indicating that the toe of the landslide is constantly bulging and subsiding. After the acceleration period of the landslide movement, the vertical displacements of the front part decrease.
The monitoring results of the significant cracks, including their orientation, initial width, annual deformation, and the annual rate of deformation, are shown in Table 3. Compared with the middle part (M12 and E2), the motions at the uppermost parts of the landslide (M20, M23, and E3) and the active zone (M8 and E1) are more obvious. The largest deformation monitored by M20 occurred at the crack C20, with a total displacement of 722.3 mm and an annual deformation rate of 240.8 mm/year from 2015 to 2017. Similar to the GNSS monitoring results, the cumulative displacement curves of these typical cracks also exhibit stair-stepping (Figure 12). Accelerated movement appears from May to August and then gradually slows down with the impoundment of the reservoir and less rainfall. It is notable that an episodic acceleration occurred in June 2016, which was induced by intensive daily rainfall of 178.4 mm on 24 June. After this event, the cracks developed with different magnitudes, and M20 observed the maximum daily displacement of 50.0 mm in the following 13 days.
5.2. Subsurface Deformation
Inclinometer monitoring was applied to determine the subsurface deformation and detect the slip zones of the landslide. Each fixed inclinometer could acquire shear displacement at 5 m intervals, and the displacement of the deepest sensor fixed in the stable bedrock is almost zero. Based on the data obtained from August 2015 to July 2016, the displacement profiles of inclinometers QX01 and QX02 are shown in Figure 13.
According to borehole detection, there are three potential slip zones within the landslide body (Figure 5). The deepest slip zone is between the Quaternary deposits and bedrock. Minor shear displacements concentrated in this slip zone are 10.4 mm (QX1) and 27.1 mm (QX2) obtained through interpolation calculation, indicating that the landslide undergoes a basal sliding (Figure 13). However, the shallow area shows a larger shear displacement, and the secondary slip zones revealed by both inclinometers also correspond to the position of the coarse sand interlayers. The shallow slip zone A in QX01 is at a depth between 12.8 m and 17.8 m. The maximum shear displacement is 55.5 mm at a depth of 12.8 m. In QX02, the slip zone B has a depth between 10.0 m and 15.0 m, indicating a maximum shear displacement of 98.1 mm at a depth of 10.0 m. The inverted deformation around 15 m deep in QX02 may be due to the inclinometer casing, which bucked into voids between the casing and ground.
5.3. Groundwater Level Change
The groundwater level regime was obtained by piezometers installed at the lower part of the landslide. As shown in Figure 14, the water pressures measured by three piezometers gave similar responses to reservoir water level fluctuation and precipitation. The groundwater table of the landslide is sensitive to the variation of the reservoir water level. Piezometric curves change synchronously with the reservoir water level as it exceeds a certain height. This height represents the lowest groundwater level at the observation point: 156.4 m a.s.l., 163.8 m a.s.l., and 169.5 m a.s.l. in P1, P2, and P3, respectively. When the reservoir water level is higher than the stated height, an uninterrupted water exchange occurs between the sliding mass and reservoir. Water infiltrates into the landslide accompanied by the uplifting of the reservoir water level and seepage out with its drawdown.
In addition to the fluctuation of the reservoir level, precipitation also influences the groundwater table. Piezometric levels observed from three monitoring points gave quick responses to the heavy rainfall. For example, the landslide suffered long-term rainfall during July in 2017, and the total amount of this precipitation in four days reached 171 mm. Correspondingly, groundwater tables in P1, P2, and P3 raised 0.68 m, 0.8 m, and 0.77 m, respectively (Figure 14a). Another short rainfall with an intensity of 120 mm on 18 June 2018 also lifted the groundwater level. The increased heights were 0.4 m, 0.75 m, and 0.58 m in P1, P2, and P3, respectively (Figure 14b). Moreover, the reservoir water level did not exceed the stated height of P1 in these two periods, which means that rainfall infiltration is the only reason raising the groundwater level of the landslide.
6. Impacts of the Reservoir and Rainfall on the Landslide Activity
The monitoring results indicate that the activity of the Ganjingzi landslide varies with time and is more significant from May to August. As shown in Figure 11 and Figure 12, the acceleration phases agree well with the decline of the reservoir water level and heavy rainfall. In order to assess the influencing intensity of these two external factors, hydrological data and the horizontal displacements from GNSS (G1, G3, G6, and G8) were analyzed systematically. The relationships between the displacement velocity and external hydrological events are illustrated in Figure 15.
Neglecting the differences in magnitude, the displacement rates from four monitoring points show the same variation trend. The impulse of the landslide movement appears in early May with the drawdown of the reservoir water level. In August, the motion velocity of the landslide slows down as the reservoir starts impoundment. This trend seems to correlate with periodic reservoir fluctuation. However, a detailed analysis of the monitoring data shows that the precipitation may have a more pronounced influence on landslide deformation. Usually, the accelerated displacement of the landslide is accompanied by heavy rainfall. For example, the landslide suffered a downpour with an intensity of 178.4 mm on 24 June 2016. In the following 13 days, all monitoring points gave significant responses with increasing displacements ranging from 16.1 mm to 342.0 mm, and the slope velocities reached the maximum value of the whole monitoring period. Moreover, the Ganjingzi landslide was more active from June to August in 2016 than in 2017 since the intensity of rainfall was higher in 2016. Table 4 lists the statistics of the landslide displacement and the corresponding external conditions. It can be seen that the movement caused by rainfall from June to August (C and F) accounted for 62.2% and 89.1% of the whole acceleration period (B and C in 2016 and E and F in 2017). In the meantime, the reservoir was at a low water level. In this regard, it is concluded that the precipitation can be considered as the main triggering factor of the accelerated deformation of the landslide.
Compared to rainfall, the decline of the reservoir water level has less of an effect on the landslide movement. The slope activity in the water level drawdown period is dominated by the drawdown velocity, which can be revealed by monitoring results from January to June. From January to April, the reservoir water level declines at an average drawdown velocity of 0.1 m/day. After the end of April, the reservoir operation has a faster drawdown velocity of 0.4 m/day until June, and the landslide displacement increases as a consequent. However, during these two phases with reservoir water drawdown (A/D and B/E in Table 4), the rainfall intensities are similar, and no extreme weather with daily rainfall exceeding 50 mm occurs. Therefore, the fast displacement of the landslide from May to June is dominated by the increasing drawdown of the reservoir water. As shown in Figure 16, a correlation analysis was conducted between normalized slope velocity and reservoir drawdown velocity. The Pearson correlation coefficients (R) are negative for points G1, G3, G6, and G8, and the values of significance (Sig.) are less than 0.002, which means the drawdown of the reservoir water level has a positive and statistical correlation with the landslide movement. In other words, the high slope velocity coincides with high drawdown velocity and vice versa.
7. Characterizing the Development Pattern of the Landslide
The previous section shows that the Ganjingzi landslide is mainly affected by heavy rainfall and experiences shallow deformation along secondary slip zones. Its deformation characteristics and responses to external factors are more similar to landslides in a high-altitude mountainous area or seasonal rainfall area rather than a colluvial landslide that is partially submerged in the reservoir [8,28,41]. However, the aforementioned analysis only offers evidence that the Ganjingzi landslide is sensitive to precipitation during the real-time monitoring period from 2015 to 2018. As a dynamic system with a complex topography and internal structures, the landslide undergoes an uninterrupted geological evolution, and the responses of landslide motion to various external environmental factors change over time. Based on the long-term monitoring results from different sources, the development pattern of the Ganjingzi landslide is outlined in Figure 17.
The Ganjingzi landslide experiences three development stages, namely the stable stage, the initial movement stage, and the shallow movement stage. Before the first impoundment of the TGR in June 2003, the water level of the Yangtze River was approximately 90 m a.s.l. and far below the landslide body. A field investigation performed by the Nanjiang hydrogeological team found no evidence of the deformation, meaning that this slope was relatively stable. In this stage, this area could be considered as a naturally deposited slope without a phreatic aquifer in the Wu Gorge. It was temporally stabilized by self-adjustment under the geological process and remained stable for a period without extreme geological conditions or human activities (Table 5 and Figure 17a).
Since the operation of the TGR, community-based monitoring has suggested that there was a series of evidence of damage that emerged from the bottom up of the landslide (Figure 8). On this basis, the landslide was regarded to enter the initial movement stage (Table 5). This kind of retrogressive failure was correlated with the large-scale rising and periodic fluctuations of the reservoir water level. First, the uplifting reservoir water level influenced the groundwater regime within the landslide body, and a phreatic aquifer was formed and expanded at the lower part of the sliding deposit (Figure 17b). The invasion and periodic fluctuation of reservoir water softened the sliding materials, especially reducing the shear resistance along the slip surface [42]. Second, groundwater seepage caused by the drawdown of the reservoir water level decreased landslide stability. When the reservoir level drops rapidly, the dissipation of pore water pressure in the landslide body is slower than the decrease of external hydrostatic pressure [18,43,44]. The transient seepage induced by this lagging effect creates seepage force along the sliding direction [45], which increased the slip force and further reduced slope stability. Therefore, the deformation in this stage mainly occurred with the decline of the reservoir water level (Figure 8). The relationship between the stability of the Ganjingzi landslide and the reservoir water level was similar to many other colluvial landslides in the TGR area [7,26,30,35,46]. Such as the Shuping and Baishuihe landslides [26,46], the GNSS data show that the accelerated deformation of these landslides is also related to the reservoir water drawdown. Third, the submerged toe area was eroded by the reservoir water, and thus the upper part of the landslide gradually lost its front resistance. The landslide continued to deform retrogressively, and the main scarp was finally generated (Figure 7h).
Accompanied by the periodic fluctuation of reservoir water level for over 10 years, the landslide gradually adapted to the hydrological changes brought by TGR and turned to the shallow movement stage. The appearance of the main scarp can be regarded as the beginning of the third stage. In this period, deformation mainly concentrated on the shallow sliding mass (Figure 13). GNSS monitoring suggests that precipitation is the dominant triggering factor of the landslide motion, causing accelerated deformation (Figure 15) and local failure (Figure 7b). Correspondingly, reservoir drawdown seems to have affected the activity of the landslide to a lesser degree compared to the previous stage. This phenomenon could be explained by two possible reasons. First, the variation of the groundwater has a significant effect on the submerged landslide body. Usually, fine particles of soil can be taken away by the water flow, and then the seepage paths form and gradually expand within the deposit mass [47,48]. As shown in Figure 17c, the permeability of the sliding materials at the toe of the landslide are enhanced by these visible channels [44]. Meanwhile, the adaptive capacity of the sliding mass for the changing of the reservoir water level is improved [20]. Therefore, in this stage, the groundwater table of the landslide changes synchronously with the reservoir water level (Figure 14), and the rapid drawdown of the reservoir water level can only give rise to a slight displacement acceleration. Second, it can be concluded that the cracks on the ground surface, which were generated by the retrogressive deformation of the landslide, also promoted the infiltration of rainfall. This extra rainwater is usually concentrated in the shallow layer and facilitates the infiltration of moisture into the deep layers (Figure 17c). With the coupled influence of gravity and precipitation, the unstable landslide induces the undrained compression and forms the excess pore water pressure [49,50], which is mainly responsible for the internal plastic deformation within the shallow sliding mass.
8. Conclusions
The Ganjingzi landslide, which is a typical colluvial landslide in the Wu gorge of the TGR area, was initiated by the reservoir impoundment and has exhibited slow-moving features for many years. For this paper, a comprehensive analysis of the landslide development pattern was carried out based on an integrated long-term monitoring system. Triggering factors in different development stages were proposed according to the 12-year evolution process to uncover its deformation mechanism.
Community-based monitoring indicates that the Ganjingzi landslide began to show slow movement in 2007. A series of cracks were observed first at the toe and then extended to the upper part. This phenomenon suggests that the landslide was characterized by retrogressive movement at the early period of its process. However, its response to the external environment varies with time. The motion of the upper part of the landslide is largest now, and some shallow activities occur frequently.
According to the real-time monitoring, the landslide activity is subject to the hydrological changes of the reservoir water level and rainfall. An inspection of the four-year GNSS dataset reveals that the landslide displacement has an annual short-term acceleration from May to August, and heavy rainfall is the main trigger of this activity. Compared to the precipitation, the influence of the reservoir water level is smaller, and only high-speed drawdown can give rise to the landslide motion.
On the basis of long-term monitoring observation, the landslide experiences three stages of development, namely the stable stage, the initial movement stage, and the shallow movement stage. Before the construction of the reservoir, the landslide was relatively stable. The impoundment of the TGR has greatly changed the process of the landslide and accelerated its motion. After years of evolution, the landslide no longer gives a rapid response to the changes in reservoir water level. Instead, it moves slowly and exhibits more shallow failure under the influence of heavy rainfall.
As shown in this study, the integration of the community-based and high-resolution monitoring extends the recording time of the landslide movement, and a comprehensive view of the development pattern of the landslide is also provided. The Ganjingzi landslide represents one of the newly occurring colluvial landslides in the TGR area, and therefore, the reproduction of its evolution process contributes to subsequent mitigation strategies.
Author Contributions
X.L. organized and analyzed the data and wrote the paper, K.Y. and L.G. supervised and reviewed the work, W.W. and J.D. reviewed and edited the manuscript, F.M. provided landslide data. All authors have read and agreed to the published version of the manuscript.
Funding
This research was funded by the National Natural Science Foundation of China, grant numbers 41572292, 41702304, and 41601563.
Institutional Review Board Statement
Not applicable for studies not involving humans or animals.
Informed Consent Statement
Not applicable for studies not involving humans.
Data Availability Statement
Restrictions apply to the availability of these data. Data were obtained from the Geohazard Prevention Center of Chongqing and are available from the authors with the permission of the Geohazard Prevention Center of Chongqing.
Acknowledgments
We wish to thank the Chongqing Administration of Land Resources and Housing and the Nanjiang Hydrogeological Team of Chongqing Geology Exploring Bureau for their assistance. We also thank the reviewers for their suggestions that improved the quality of this paper. Finally, we thank Xuan Kang for helping us with language polishing.
Conflicts of Interest
The authors declare no conflict of interest.
References
- Schuster, R.L. Reservoir-induced landslides. Bull. Eng. Geol. Environ. 1979, 20, 8–15. [Google Scholar] [CrossRef]
- Panizzo, A.; Girolamo, P.D.; Risio, M.D.; Maistri, A.; Petaccia, A. Great landslide events in Italian artificial reservoirs. Nat. Hazards Earth Syst. Sci. 2005, 5, 733–740. [Google Scholar] [CrossRef] [Green Version]
- Gutiérrez, F.; Linares, R.; Roqué, C.; Zarroca, M.; Carbonel, D.; Rosell, J.; Gutiérrez, M. Large landslides associated with a diapiric fold in Canelles Reservoir (Spanish Pyrenees): Detailed geological-geomorphological mapping, trenching and electrical resistivity imaging. Geomorphology 2015, 241, 224–242. [Google Scholar] [CrossRef]
- Tullos, D. Assessing the influence of environmental impact assessments on science and policy: An analysis of the Three Gorges Project. J. Environ. Manag. 2009, 90, 208–223. [Google Scholar] [CrossRef]
- Li, Y.; Wu, L.G.; Chen, X.Y.; Zhou, W.C. Impacts of Three Gorges Dam on Regional Circulation: A Numerical Simulation. J. Geophys. Res. Atmos. 2019, 124, 7813–7824. [Google Scholar] [CrossRef]
- Wang, F.W.; Zhang, Y.M.; Huo, Z.T.; Peng, X.M.; Wang, S.M.; Yamasaki, S. Mechanism for the rapid motion of the Qianjiangping landslide during reactivation by the first impoundment of the Three Gorges Dam reservoir, China. Landslides 2008, 5, 379–386. [Google Scholar] [CrossRef]
- Yin, Y.P.; Huang, B.L.; Wang, W.P.; Wei, Y.J.; Ma, X.H.; Ma, F.; Zhao, C.J. Reservoir-induced landslides and risk control in Three Gorges Project on Yangtze River, China. J. Rock Mech. Geotech. Eng. 2016, 8, 577–595. [Google Scholar] [CrossRef] [Green Version]
- Wu, Y.P.; Miao, F.S.; Li, L.W.; Xie, Y.H.; Chang, B. Time-varying reliability analysis of huangtupo riverside no.2 landslide in the three gorges reservoir based on water-soil coupling. Eng. Geol. 2017, 226, 267–276. [Google Scholar] [CrossRef]
- Asch van, T.W.J.; Malet, J.P.; Bogaard, T.A. The effect of groundwater fluctuations on the velocity pattern of slow-moving landslides. Nat. Hazards Earth Syst. Sci. 2009, 9, 739–749. [Google Scholar] [CrossRef] [Green Version]
- Miao, H.B.; Wang, G.H.; Yin, K.L.; Kamai, T.; Li, Y.Y. Mechanism of the slow-moving landslides in Jurassic red-strata in the Three Gorges Reservoir, China. Eng. Geol. 2014, 171, 59–69. [Google Scholar] [CrossRef] [Green Version]
- He, C.C.; Hu, X.L.; Tannant, D.D.; Tan, F.L.; Zhang, Y.M.; Zhang, H. Response of a landslide to reservoir impoundment in model tests. Eng. Geol. 2018, 247, 84–93. [Google Scholar] [CrossRef]
- Mansour, M.F.; Morgenstern, N.R.; Martin, C.D. Expected damage from displacement of slow-moving slides. Landslides 2011, 8, 117–131. [Google Scholar] [CrossRef]
- Angeli, M.G.; Pasuto, A.; Silvano, S. A critical review of landslide monitoring experiences. Eng. Geol. 2010, 55, 133–147. [Google Scholar] [CrossRef]
- Gullà, G.; Peduto, D.; Borrelli, L.; Antronico, L.; Fornaro, G. Geometric and kinematic characterization of landslides affecting urban areas: The Lungro case study (Calabria, Southern Italy). Landslides 2017, 14, 171–188. [Google Scholar] [CrossRef]
- Jaboyedoff, M.; Oppikofer, T.; Abellán, A.; Derron, M.; Loye, A.; Metzger, R.; Pedrazzini, A. Use of LIDAR in landslide investigations: A review. Nat. Hazards 2012, 61, 5–28. [Google Scholar] [CrossRef] [Green Version]
- Tofani, V.; Raspini, F.; Catani, F.; Casagli, N. Persistent Scatterer Interferometry (PSI) Technique for Landslide Characterization and Monitoring. Remote Sens. 2013, 5, 1045–1065. [Google Scholar] [CrossRef] [Green Version]
- Meng, Q.; Confuorto, P.; Peng, Y.; Raspini, F.; Bianchini, S.; Han, S.; Liu, H.; Casagli, N. Regional Recognition and Classification of Active Loess Landslides Using Two-Dimensional Deformation Derived from Sentinel-1 Interferometric Radar Data. Remote Sens. 2020, 12, 1541. [Google Scholar] [CrossRef]
- Zhou, C.; Cao, Y.; Yin, K.; Wang, Y.; Shi, X.; Catani, F.; Ahmed, B. Landslide Characterization Applying Sentinel-1 Images and InSAR Technique: The Muyubao Landslide in the Three Gorges Reservoir Area, China. Remote Sens. 2020, 12, 3385. [Google Scholar] [CrossRef]
- Massey, C.I.; Petley, D.N.; Mcsaveney, M.J. Patterns of movement in reactivated landslides. Eng. Geol. 2013, 159, 1–19. [Google Scholar] [CrossRef]
- Chen, M.L.; Lu, P.F.; Zhang, S.L.; Chen, X.Z.; Zhou, J.W. Time evolution and spatial accumulation of progressive failure for Xinhua slope in the Dagangshan reservoir, Southwest China. Landslides 2018, 15, 565–580. [Google Scholar] [CrossRef]
- Yin, Y.P.; Wang, H.D.; Gao, Y.L.; Li, X.C. Real-time monitoring and early warning of landslides at relocated Wushan Town, the Three Gorges Reservoir, China. Landslides 2010, 7, 339–349. [Google Scholar] [CrossRef]
- Huntley, D.; Bobrowsky, P.; Zhang, Q.; Sladen, W.; Bunce, C.; Edwards, T.; Hendry, M.; Martin, D.; Choi, E. Fiber optic Strain Monitoring and Evaluation of a slow-moving landslide near Ashcroft, British Columbia, Canada. In Landslide Science for a Safer Geoenvironment; Sassa, K., Canuti, P., Yin, Y.P., Eds.; Springer: Berlin/Heidelberg, Germany, 2014; pp. 415–421. [Google Scholar]
- Wang, J.E.; Su, A.J.; Xiang, W.; Yeh, H.; Xiong, C.; Zou, Z.X.; Zhong, C.; Liu, Q. New data and interpretations of the shallow and deep deformation of Huangtupo No. 1 riverside sliding mass during seasonal rainfall and water level fluctuation. Landslides 2016, 13, 795–804. [Google Scholar] [CrossRef]
- Caterina, D.M.; Fornaro, G.; Gioia, D.; Schiattarella, M.; Vassallo, R. In situ and satellite long-term monitoring of the Latronico landslide, Italy: Displacement evolution, damage to buildings, and effectiveness of remedial works. Eng. Geol. 2018, 245, 218–235. [Google Scholar] [CrossRef]
- Soldato, M.D.; Riquelme, A.; Bianchini, S.; Tomàs, R.; Martire, D.D.; Vita, P.D.; Moretti, S.; Calcaterra, D. Multisource data integration to investigate one century of evolution for the Agnone landslide (Molise, southern Italy). Landslides 2018, 15, 2113–2128. [Google Scholar] [CrossRef] [Green Version]
- Du, J.; Yin, K.L.; Lacasse, S. Displacement prediction in colluvial landslides, Three Gorges Reservoir, China. Landslides 2013, 10, 203–218. [Google Scholar] [CrossRef]
- Intrieri, E.; Carlà, T.; Gigli, G. Forecasting the time of failure of landslides at slope-scale: A literature review. Earth Sci. Rev. 2019, 193, 333–349. [Google Scholar] [CrossRef]
- Schulz, W.H.; Kean, J.W.; Wang, G.H. Landslide movement in southwest Colorado triggered by atmospheric tides. Nat. Geosci. 2009, 2, 863–866. [Google Scholar] [CrossRef]
- Ehrlich, M.; da Costa, D.P.; Silva, R.C. Behavior of a colluvial slope located in Southeastern Brazil. Landslides 2018, 15, 1595–1613. [Google Scholar] [CrossRef]
- Yao, W.M.; Li, C.D.; Zuo, Q.J.; Zhan, H.B.; Robert, E. Criss. Spatiotemporal deformation characteristics and triggering factors of Baijiabao landslide in Three Gorges Reservoir region, China. Geomorphology 2019, 343, 34–47. [Google Scholar] [CrossRef]
- Macfarlane, D.F. Observations and predictions of the behaviour of large, slow-moving landslides in schist, Clyde Dam reservoir, New Zealand. Eng. Geol. 2009, 109, 5–15. [Google Scholar] [CrossRef]
- Gu, D.M.; Huang, D.; Yang, W.D.; Zhu, J.L.; Fu, G.Y. Understanding the triggering mechanism and possible kinematic evolution of a reactivated landslide in the Three Gorges Reservoir. Landslides 2017, 14, 2073–2087. [Google Scholar] [CrossRef]
- Li, Z.H.; Cheng, G.X.; Cheng, W.M.; Mei, H.B. People as Sensors: Towards a Human–Machine Cooperation Approach in Monitoring Landslides in the Three Gorges Reservoir Region, China. In Cyber-Physical Systems: Architecture, Security and Application; Guo, S., Zeng, D., Eds.; Springer: Berlin/Heidelberg, Germany, 2019; pp. 43–45. [Google Scholar]
- Wang, P.; Zheng, H.; Chen, L.; Chen, J.; Xu, Y.; Wei, X.; Yao, X. Exhumation of the Huangling anticline in the Three Gorges region: Cenozoic sedimentary record from the western Jianghan Basin, China. Basin Res. 2014, 26, 505–522. [Google Scholar] [CrossRef]
- Tang, H.M.; Wasowski, J.; Juang, C.H. Geohazards in the Three Gorges Reservoir Area, China-Lessons learned from decades of research. Eng. Geol. 2019, 261, 105267. [Google Scholar] [CrossRef]
- Cruden, D.M.; Varnes, D.J. Landslide types and processes. In Landslides Investigation and Mitigation. Transportation Research Board, US National Research Council; Turner, A.K., Schuster, R.L., Eds.; Chapter 3; Special Report 247; TRB: Washington, DC, USA, 1996; pp. 36–75. [Google Scholar]
- Hungr, O.; Leroueil, S.; Picarelli, L. The Varnes classification of landslide types, an update. Landslides 2018, 11, 167–194. [Google Scholar] [CrossRef]
- Baudoin, M.; Henly-Shepard, S.; Fernando, N.; Sitati, A.; Zommers, Z. From Top-Down to “Community-Centric” Approaches to Early Warning Systems: Exploring Pathways to Improve Disaster Risk Reduction through Community Participation. Int. J. Disaster Risk Sci. 2016, 7, 163–174. [Google Scholar] [CrossRef] [Green Version]
- Liu, Y.; Yin, K.L.; Chen, L.X.; Wang, W.; Liu, Y.L. A community-based disaster risk reduction system in Wanzhou, China. Int. J. Disaster Risk Reduct. 2016, 19, 379–389. [Google Scholar] [CrossRef]
- Castagnetti, C.; Bertacchini, E.; Corsini, A.; Capra, A. Multi-sensors integrated system for landslide monitoring: Critical issues in system setup and data management. Eur. J. Remote Sens. 2017, 46, 104–124. [Google Scholar] [CrossRef]
- Iverson, M. Landslide triggering by rain infiltration. Water. Resour. Res. 2000, 36, 1897–1910. [Google Scholar] [CrossRef] [Green Version]
- Kang, X.; Xu, G.L.; Yu, Z.; Wang, S.; Wang, M.T. Experimental investigation of the interaction between water and shear-zone materials of a bedding landslide in the Three Gorges Reservoir Area, China. Bull. Eng. Geol. Environ. 2020, 79, 4079–4092. [Google Scholar] [CrossRef]
- Bansal, R.K.; Das, S.K. Response of an Unconfined Sloping Aquifer to Constant Recharge and Seepage from the Stream of Varying Water Level. Water Resour. Manag. 2011, 25, 893–911. [Google Scholar] [CrossRef]
- Okeke, C.U.; Wang, F.W. Critical hydraulic gradients for seepage-induced failure of landslide dams. Geoenviron. Disasters 2016, 3, 9. [Google Scholar] [CrossRef] [Green Version]
- Tang, M.G.; Xu, Q.; Yang, H.; Li, S.L.; Lqbal, J.; Fu, X.L.; Cheng, W.M. Activity law and hydraulics mechanism of landslides with different sliding surface and permeability in the Three Gorges Reservoir Area, China. Eng. Geol. 2019, 260, 105212. [Google Scholar] [CrossRef]
- Song, K.; Wang, F.W.; Yi, Q.L.; Lu, S.Q. Landslide deformation behavior influenced by water level fluctuations of the Three Gorges Reservoir (China). Eng. Geol. 2018, 247, 58–68. [Google Scholar] [CrossRef]
- Cancienne, R.M.; Fox, G.A.; Simon, A. Influence of seepage undercutting on the stability of root-reinforced streambanks. Earth Surf. Proc. Land 2008, 33, 1769–1786. [Google Scholar] [CrossRef]
- Skempton, A.W.; Brogan, J.M. Experiments on piping in sandy gravels. Geotechnique 1994, 44, 449–460. [Google Scholar] [CrossRef]
- Lollino, P.; Giordan, D.; Allasia, P. The Montaguto earthflow: A back-analysis of the process of landslide propagation. Eng. Geol. 2014, 170, 66–79. [Google Scholar] [CrossRef]
- Tien, P.V.; Sassa, K.; Takara, K.; Fukuoka, H.; Dang, K.; Shibasaki, T.; Ha, N.D.; Setiawan, H.; Loi, D.H. Formation process of two massive dams following rainfall-induced deep-seated rapid landslide failures in the Kii Peninsula of Japan. Landslides 2018, 15, 1–18. [Google Scholar] [CrossRef]
Figure 1.
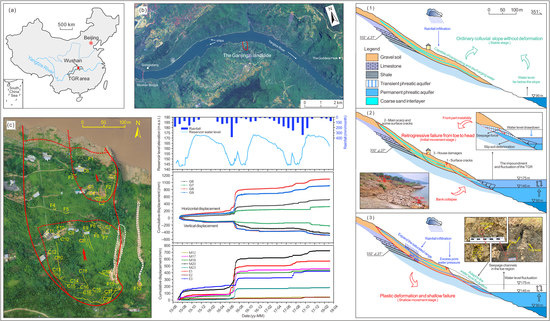
Location of the study area: (a) site location of the study area in China, (b) location of the Ganjingzi landslide, and (c) geomorphological characteristics of the Ganjingzi landslide.
Figure 1.
Location of the study area: (a) site location of the study area in China, (b) location of the Ganjingzi landslide, and (c) geomorphological characteristics of the Ganjingzi landslide.

Figure 2.
Tectonic background of the study area: (1) anticline, (2) syncline, (3) the Yangtze River, (4) cross section, (5) Middle Triassic strata, (6) Lower Triassic strata, (7) Lower Permian strata, (8) Upper Permian strata, and (9) Lower Silurian strata.
Figure 2.
Tectonic background of the study area: (1) anticline, (2) syncline, (3) the Yangtze River, (4) cross section, (5) Middle Triassic strata, (6) Lower Triassic strata, (7) Lower Permian strata, (8) Upper Permian strata, and (9) Lower Silurian strata.

Figure 3.
Geological hazards in the Gongjiafang-Goddess peak section of the Wu Gorge.

Figure 4.
Topographic map of the Ganjingzi landslide, with a contour interval in 10 m increments: (1) landslide boundary, (2) boundary of the active zone, (3) potential boundary of the shallow deformation, (4) sliding direction, (5) borehole, and (6) cross section.
Figure 4.
Topographic map of the Ganjingzi landslide, with a contour interval in 10 m increments: (1) landslide boundary, (2) boundary of the active zone, (3) potential boundary of the shallow deformation, (4) sliding direction, (5) borehole, and (6) cross section.

Figure 5.
Geological sections of the Ganjingzi landslide: (a–c) longitudinal geological section B-B’, C-C’, and D-D’. Please see the location of geological sections in Figure 4.
Figure 5.
Geological sections of the Ganjingzi landslide: (a–c) longitudinal geological section B-B’, C-C’, and D-D’. Please see the location of geological sections in Figure 4.

Figure 6.
Lithology of the borehole B11.

Figure 7.
Deformation characteristic of Ganjingzi landslide: (a) distribution of cracks and shallow failure, and (b–h) macroscopic deformation of Ganjingzi landslide.
Figure 7.
Deformation characteristic of Ganjingzi landslide: (a) distribution of cracks and shallow failure, and (b–h) macroscopic deformation of Ganjingzi landslide.

Figure 8.
Time series of reservoir impoundments, rainfall, and significant landslide movements.

Figure 9.
The framework of the community-based monitoring in the Three Gorges Reservoir (TGR) area.

Figure 10.
Layout of the real-time monitoring system. Arrows show the magnitudes and directions of the cumulative displacement obtained by global navigation satellite system (GNSS) receivers (data from 15 July 2015 to 7 March 2018).
Figure 10.
Layout of the real-time monitoring system. Arrows show the magnitudes and directions of the cumulative displacement obtained by global navigation satellite system (GNSS) receivers (data from 15 July 2015 to 7 March 2018).

Figure 11.
Cumulative displacements measured by GNSS monitoring, and the associated reservoir water level and rainfall.
Figure 11.
Cumulative displacements measured by GNSS monitoring, and the associated reservoir water level and rainfall.

Figure 12.
Displacement–time curves obtained from different instruments.

Figure 13.
Subsurface displacements measured by the inclinometers.

Figure 14.
Comparative diagram of the daily rainfall, reservoir level, and groundwater levels measured by piezometers: (a–b) detail drawings in July 2017 and June 2018.
Figure 14.
Comparative diagram of the daily rainfall, reservoir level, and groundwater levels measured by piezometers: (a–b) detail drawings in July 2017 and June 2018.

Figure 15.
Displacement rate of GNSS points and its relationship with reservoir water level and daily precipitation. A–F represent different time periods in 2016 and 2017. Please see the details in Table 4.
Figure 15.
Displacement rate of GNSS points and its relationship with reservoir water level and daily precipitation. A–F represent different time periods in 2016 and 2017. Please see the details in Table 4.

Figure 16.
Correlation between reservoir drawdown velocities and normalized horizontal velocities measured at the GNSS stations. The color of the triangles indicates the reservoir level. (Note: R is the Pearson correlation coefficient and Sig. is the significance; the value of Sig. less than 0.05 means significant correlation.)

Figure 17.
The evolution process of Ganjingzi landslide: (a) stable stage, (b) initial movement stage with retrogressive creep deformation, and (c) shallow movement stage with plastic deformation and shallow failure.
Figure 17.
The evolution process of Ganjingzi landslide: (a) stable stage, (b) initial movement stage with retrogressive creep deformation, and (c) shallow movement stage with plastic deformation and shallow failure.


Table 1.
Characteristics of cracks measured during the investigation on 21 July 2017.
| Number | Type | Trend (°) | Length (m) | Opening Width (cm) | Vertical Displacement (cm) |
|---|---|---|---|---|---|
| C1 | shear | 6.0 | 140.0 | 1.0–5.0 | 5.0–35.0 |
| C2 | tension | 89.0 | 50.0 | 10.0–20.0 | 15.0–20.0 |
| C3 | tension | 85.0 | 50.0 | 5.0–8.0 | 10.0–15.0 |
| C4 | tension | 341.0 | 25.0 | 1.0–10.0 | 5.0–8.0 |
| C5 | tension | 194.0 | 30.0 | 10.0–20.0 | 15.0–20.0 |
| C6 | shear | 338.0 | 16.0 | 1.0–3.0 | 1.0 |
| C7 | shear | 345.0 | 35.0 | 10.0–20.0 | 1.0 |
| C8 | shear | 352.0 | 55.0 | 3.0–5.0 | 2.0 |
| C9 | shear | 325.0 | 8.0 | 15.0–20.0 | 1.0 |
| C10 | shear | 320.0 | 120.0 | 5.0–60.0 | 10.0–60.0 |
| C11 | shear | 320.0 | 12.0 | 1.0–2.0 | 0.5 |
| C12 | shear | 322.0 | 10.0 | 0.5–1.0 | 0.5 |
| C13 | shear | 329.0 | 22. 0 | 20.0–30.0 | 35.0 |
| C14 | tension | 110.0 | 80.0 | 60.0–80.0 | 2.0–5.0 |
| C15 | tension | 313.0 | 20.0 | 50.0–80.0 | 8.0–10.0 |
| C16 | tension | 92.0 | 30.0 | 20.0–30.0 | 3.0–8.0 |
| C17 | tension | 42.0 | 40.0 | 20.0–40.0 | 5.0–10.0 |
| C18 | tension | 353.0 | 50.0 | 15.0–20.0 | 3.0–5.0 |
| C19 | tension | 285.0 | 35.0 | 5.0–20.0 | 8.0–15.0 |
| C20 | tension | 88.0 | 300.0 | 50.0–80.0 | 260.0 |
Table 2.
Characteristics of small failures on the surface of the Ganjingzi landslide.
| Number | Sliding Direction (°) | Length (m) | Width (m) | Area (m2) | Volume (m3) |
|---|---|---|---|---|---|
| F1 | 335 | 62.0 | 20.0 | 1240.0 | 700.0 |
| F2 | 352 | 27.0 | 35.0 | 945 | 900.0 |
| F3 | 355 | 1.5 | 13.0 | 19.5 | 19.5 |
| F4 | 350 | 0.5 | 7.0 | 3.5 | 4.2 |
| F5 | 351 | 1.0 | 12.0 | 12.0 | 10.0 |
| F6 | 20 | 0.8 | 10.5 | 8.4 | 3.6 |
| F7 | 350 | 2.0 | 1.5 | 3.0 | 6.0 |
| F8 | 351 | 1.5 | 2.0 | 3.0 | 4.5 |
| F9 | 353 | 12.0 | 0.8 | 9.6 | 19.2 |
| F10 | 325 | 3.5 | 1.4 | 4.9 | 9.8 |
| F11 | 325 | 10.0 | 12.0 | 120.0 | 60.0 |
| F12 | 350 | 11.0 | 10.0 | 110.0 | 110.0 |
Table 3.
Yearly and total deformation of typical surface cracks.
| Method | Measure Point | Trend (°) | Initial Width (mm) | Yearly Deformation (mm) | Total Deformation (mm) | Average Rate (mm/Year) | ||
|---|---|---|---|---|---|---|---|---|
| 2015 | 2016 | 2017 | ||||||
| Manual crackmeter | M8 | 107.0 | 1903.5 | 55.6 | 342.8 | 39.8 | 438.2 | 146.1 |
| M12 | 320.0 | 3921.0 | 15.8 | 19.0 | 9.0 | 43.8 | 14.6 | |
| M17 | 342.0 | 1731.5 | 70.2 | 370.0 | 18.0 | 458.2 | 152.7 | |
| M20 | 87.0 | 6296.0 | 148.3 | 470.0 | 104.0 | 722.3 | 240.8 | |
| M23 | 32.0 | 5106.0 | 6.0 | 163.0 | 12.0 | 181.0 | 60.3 | |
| Extensometer | E1 | 12.0 | \ | 82.9 | 419.0 | 69.0 | 570.9 | 190.3 |
| E2 | 20.0 | \ | 21.6 | 1.4 | 19.4 | 42.4 | 14.3 | |
| E3 | 351.0 | \ | 190.4 | 132.2 | 98.6 | 421.2 | 140.4 | |
Table 4.
Statistics of landslide displacement, reservoir water level, and rainfall from 2016 to 2017.
Table 4.
Statistics of landslide displacement, reservoir water level, and rainfall from 2016 to 2017.
| Period | GNSS Point Number | Cumulative Displacement (mm) | Average Displacement Rate (mm/d) | Maximum Displacement Rate | Average Reservoir Fluctuation Rate (m/d) | Total Rainfall (mm) | |
|---|---|---|---|---|---|---|---|
| Value (mm/d) | Date | ||||||
| A (2016/1/5–2016/4/27) | 1 | 10.06 | 0.09 | 1.08 | 2016/3/11 | −0.11 | 174.8 |
| 3 | 13.84 | 0.12 | 1.14 | 2016/1/24 | |||
| 6 | 19.68 | 0.17 | 2.03 | 2016/4/25 | |||
| 8 | 46.26 | 0.41 | 3.23 | 2016/4/25 | |||
| B (2016/4/28–2016/6/8) | 1 | 15.72 | 0.37 | 1.89 | 2016/6/4 | −0.40 | 218.6 |
| 3 | 21.40 | 0.51 | 2.99 | 2016/6/8 | |||
| 6 | 25.00 | 0.60 | 4.40 | 2016/5/15 | |||
| 8 | 71.37 | 1.70 | 24.66 | 2016/6/8 | |||
| C (2016/6/9–2016/8/15) | 1 | 42.51 | 0.63 | 5.81 | 2016/7/6 | 0.01 | 405.3 |
| 3 | 71.73 | 1.05 | 8.27 | 2016/7/6 | |||
| 6 | 204.39 | 3.01 | 27.98 | 2016/7/3 | |||
| 8 | 525.08 | 7.72 | 69.14 | 2016/7/3 | |||
| D (2017/1/1–2017/4/17) | 1 | 6.48 | 0.06 | 2.84 | 2017/3/31 | −0.09 | 200.0 |
| 3 | 4.25 | 0.04 | 1.00 | 2017/2/5 | |||
| 6 | 12.97 | 0.12 | 1.95 | 2017/2/16 | |||
| 8 | 23.54 | 0.22 | 2.00 | 2017/3/31 | |||
| E (2017/4/18–2017/6/10) | 1 | 14.69 | 0.27 | 2.02 | 2017/5/29 | −0.32 | 229.9 |
| 3 | 19.13 | 0.35 | 6.05 | 2017/5/16 | |||
| 6 | 24.09 | 0.45 | 2.08 | 2017/5/17 | |||
| 8 | 34.08 | 0.63 | 2.47 | 2017/5/25 | |||
| F (2017/6/11–2017/8/18) | 1 | 17.96 | 0.26 | 7.84 | 2017/7/31 | 0.02 | 470.0 |
| 3 | 24.85 | 0.36 | 6.26 | 2017/7/31 | |||
| 6 | 38.38 | 0.56 | 2.50 | 2017/7/18 | |||
| 8 | 93.20 | 1.35 | 6.85 | 2017/7/18 | |||
Table 5.
Summary of the landslide development pattern.
| Stage | Begin | End | Dominant Factor of the Landslide Deformation | Deformation Features |
|---|---|---|---|---|
| Stable stage | \ | Before the construction of the TGR | \ | Ordinary colluvial slope without deformation |
| Initial movement stage | The operation of the TGR | The appearance of the main scarp | Reservoir water level drawdown | Retrogressive failure from toe to the upper part |
| Shallow movement stage | The appearance of the main scarp | \ | Rainfall | Plastic deformation within the shallow sliding mass |
Publisher’s Note: MDPI stays neutral with regard to jurisdictional claims in published maps and institutional affiliations. |
© 2021 by the authors. Licensee MDPI, Basel, Switzerland. This article is an open access article distributed under the terms and conditions of the Creative Commons Attribution (CC BY) license (http://creativecommons.org/licenses/by/4.0/).
Share and Cite
MDPI and ACS Style
Liang, X.; Gui, L.; Wang, W.; Du, J.; Ma, F.; Yin, K. Characterizing the Development Pattern of a Colluvial Landslide Based on Long-Term Monitoring in the Three Gorges Reservoir. Remote Sens. 2021, 13, 224. https://doi.org/10.3390/rs13020224
AMA Style
Liang X, Gui L, Wang W, Du J, Ma F, Yin K. Characterizing the Development Pattern of a Colluvial Landslide Based on Long-Term Monitoring in the Three Gorges Reservoir. Remote Sensing. 2021; 13(2):224. https://doi.org/10.3390/rs13020224
Chicago/Turabian StyleLiang, Xin, Lei Gui, Wei Wang, Juan Du, Fei Ma, and Kunlong Yin. 2021. "Characterizing the Development Pattern of a Colluvial Landslide Based on Long-Term Monitoring in the Three Gorges Reservoir" Remote Sensing 13, no. 2: 224. https://doi.org/10.3390/rs13020224
Note that from the first issue of 2016, this journal uses article numbers instead of page numbers. See further details here.