1. Introduction
Outgoing longwave radiation (OLR) is an essential contributor to the Earth radiation budget (ERB) at the top of the atmosphere (TOA), and is critical for understanding climate change, because the imbalance between the energy loss due to OLR and that from the Absorbed Solar Radiation at TOA is known to be a radiative forcing and thus a driver of climate change [
1,
2]. OLR has been widely used in climate sensitivity studies, diagnoses, and predictions [
3]. It is also used as a proxy for deep convection and precipitation, and as an indicator of cloudiness, tropical, and monsoon variability [
3]. Its applications are found in studies of El Niño/La Niña variability [
4] and, more recently, of earthquakes [
5]. These atmospheric and geodynamic processes occur in wide ranges of spatial-temporal scales. Therefore, for better monitoring and understanding of the dynamic Earth, it is vital to make OLR products available from multiple satellite datasets with a wide range of spatial/temporal resolutions.
Satellite OLR products are generated mainly from broadband [
6,
7,
8,
9], multispectral [
10,
11], and hyperspectral datasets [
12,
13,
14]. The Clouds and Earth’s Radiant Energy System (CERES) instruments are examples of broadband sensors that directly measure reflected solar radiation and Earth-emitted radiation from TOA to the surface, thus providing records of spatial and temporal variations of ERB components. The measured radiances are in three broad channels: the shortwave (SW) channel (0.3–5 μm), the window channel (8–12 μm), and the total channel (0.3–200 μm) [
6,
7,
8]. The CERES OLR are determined from the CERES TOA outgoing longwave fluxes and are among the broadband OLR products. They are derived by applying an empirical angular distribution mode to the unfiltered longwave (3.0–100 μm) radiances. We refer the reader to Su et al. [
8] for more details.
Ellingson et al. [
15] developed a multi-spectral OLR estimation method that uses radiance observations from the High-Resolution Infrared Sounder (HIRS) to estimate TOA total longwave flux. Liebmann and Smith [
16] developed a daily OLR product, based on the NOAA National Environmental Satellite, Data, and Information Service (NESDIS) operational OLR product [
17]. The datasets are from the Advanced Very High-Resolution Radiometer (AVHRR) sensor on the NOAA Polar Operational Environmental Satellites (POES). The products’ update schedules are irregular, occurring several times a year. Schreck III et al. [
11] derived an intersatellite-calibrated OLR climate data record (CDR) from the HIRS sensor, which is updated daily, but with a 36-h time delay.
Examples of hyperspectral infrared (IR)-derived OLR include those from the Atmospheric Infrared Sounder (AIRS) instrument on the National Aeronautics and Space Administration (NASA) Aqua satellite, and the Cross Track Infrared Sounder (CrIS) instruments onboard the Suomi National Polar-orbiting Partnership (SNPP) and the NOAA Joint Polar Satellite System (JPSS-1, renamed NOAA-20 after launch). CrIS is a step scan Fourier transform spectrometer (FTS) that provides hyperspectral observations of the atmosphere over the long-wave infrared (LWIR) band (9.14–15.38 μm), the middle-wave infrared (MWIR) band (5.71–8.26 μm), and the shortwave infrared (SWIR) band (3.92–4.64 μm) [
18,
19]. At the full spectral resolution (FSR), CrIS provides (a total of) 2211 spectral channel datasets with a 0.625 cm
−1 resolution across the three bands. In particular, the SNPP CrIS instrument has operated in the FSR mode since 4 December 2014; the NOAA-20 CrIS instrument has always operated in the FSR mode [
20].
Due to its hyperspectral nature and accurate radiometric and spectral calibration, CrIS has been selected as one of the standard instruments to assess other narrowband or broadband instrument calibration accuracy in the Global Space-based Inter-Calibration System framework. The CrIS sensor data records (SDRs) [
21] are geolocated, and radiometrically and spectrally calibrated, radiances with annotated quality indicators. They are widely used to retrieve profiles of atmospheric temperature, moisture [
22], and trace gases [
20]. They are also directly assimilated into numerical weather prediction models [
23]. In addition to SNPP and NOAA-20, CrIS will also be on the subsequent JPSS-2, JPSS-3, and JPSS-4 (scheduled to launch in 2022, 2026, and 2031 respectively). As such, the SNPP and JPSS satellites will provide the same spectral measurements for CrIS OLR products over the next two decades, which will be essential for long-term climate monitoring and model assessments [
24].
The OLR package of NOAA-Unique Combined Atmospheric Processing System (NUCAPS) provides hyper-spectral CrIS OLR products [
14]. It was first developed by the Joint Polar Satellite System (JPSS) program at the Center for Satellite Applications and Research (STAR), and was initially designed to provide OLR estimations directly from SNPP CrIS SDR radiance observations. In particular, this package can be used to generate near-real-time CrIS OLR products, with a 2-h latency in time (which is much shorter than the 5-month latency of CERES SSF TOA surface flux product). Therefore, the long-term, near-real-time CrIS OLR products can potentially fill the void of other satellite-derived OLR products [
11,
16].
To make the best utilization of CrIS for consistently long-term OLR products, it was recently expanded to include the NOAA-20 CrIS datasets (NOAA-20 was launched on 18 November 2017). The NUCAPS SNPP CrIS OLR products have been validated with the Aqua CERES OLR products, by meeting the JPSS SDR/EDR (Environmental Data Records) calibration/validation (Cal/Val) precision and accuracy requirements for large and representative cases, and have thus reached the validated maturity stage [
24]. Similar validation is also necessary for NOAA-20 CrIS OLR to meet the JPSS Cal/Val maturity requirements [
25]. These requirements specify the product performance over a range of representative conditions, using widely distributed, statistically robust, and globally well-represented datasets from independent instruments. The Cal/Val maturity is determined by validating the algorithm’s performance with the “truth” (Aqua CERES OLR, hereafter referred as truth), and by comparing the performance with the requirements [
25]. Obviously, it would be better if NOAA CERES OLR, which are not yet available for public applications, could be used as the truth for validation, as both the instruments are onboard NOAA-20 satellite.
In this paper, we report our work on the validation of the NUCAPS NOAA-20 CrIS OLR products. The algorithm for the NOAA-20 CrIS OLR products is the same as that for the SNPP CrIS products (see the next section for more detail). In our validation analysis, the datasets were chosen to be Aqua CERES OLR, SNPP CrIS OLR, and NOAA-20 CrIS OLR (to be validated). Similar to previous OLR product validation analyses [
13,
14], the Aqua CERES OLR products were treated as the truth [
26]. The NOAA-20 OLR products will be compared with the validated SNPP CrIS OLR products to ensure the CrIS product consistency. Therefore, the SNPP CrIS OLR products were used as the transfer standard in our validation process. This paper is organized as follows: in
Section 2, we describe the NUCAPS OLR methodology, the criteria, and the datasets used for the validation. In
Section 3, we provide validation results over daily, monthly, and yearly timescales. Discussions and conclusions are presented in
Section 4 and
Section 5, respectively.
2. Validation Methods and Datasets
The NUCAPS OLR package is designed to generate consistent and stable CrIS OLR records from hyperspectral infrared sounders. To evaluate CrIS OLR products, the package utilizes an approach that uses the Aqua CERES OLR as the absolute reference and the Aqua AIRS OLR as the third transfer. Previous analyses of Aqua CERES and AIRS OLR have shown that they are stable over the time period of this study [
13,
14], and are therefore suitable for our validation analysis. Included in our validation analysis are the two CrIS OLR products evaluated with the NUCAPS: the SNPP CrIS OLR and the NOAA-20 CrIS OLR. Both share the same algorithm but are derived from the SNPP CrIS and the NOAA-20 CrIS datasets, respectively. The SNPP CrIS OLR are already validated [
24], and were therefore used to assess the NOAA-20 CrIS OLR for the consistency test. Detailed information on the two datasets and of their comparisons can be found in [
20]. The algorithm and the workflow of the NUCAPS OLR package are briefly discussed in this paper to help to understand our validation results. More details of the methodology and its uncertainties are described by Zhang et al. [
14].
The NUCAPS workflow is straightforward: given the pseudo-channels and CrIS SDR L1b data, the radiance for each pseudo-channel is calculated first. Then the difference between the CrIS and the AIRS radiances is determined and used to adjust the radiance for each channel. The CrIS OLR products are then evaluated with the adjusted radiances.
In the NUCAPS OLR package, there are 17 “pseudo-channels” reduced from CrIS radiance spectra [
14]. The pseudo-channels are used to effectively avoid spectral gaps and “bad” channels in the AIRS and the CrIS radiances data [
14]. A pseudo-channel acts as an ideal bandpass filter, or a rectangular pulse-type spectral response function, which equals one in the channel spectral range and zero elsewhere. In the package, the pseudo-channels are constructed from 1567 (out of 2378) AIRS channels and 1496 (out of 2211) CrIS channels. For each pseudo-channel, the spectrally convolved CrIS radiance
is calculated by the integral:
where
is the pseudo-channel index;
is the view angle;
is the radiance at the quasi-monochromatic wavenumber
; the pair [
,
] specifies the wavenumber domain of the channel bandpass. The difference between the AIRS and the CrIS radiances for each pseudo-channel due to, e.g., instrumentation and measurement setting can be estimated by
where
K is the total number of channels included in the pseudo-channel. This difference should be adjusted to the observed CrIS radiances for estimation of the CrIS OLR for each FOV by:
where
n = 17 is the total number of the pseudo-channels,
is one of the eight CrIS viewing angle bins which are chosen to account for the view angle dependence of the AIRS and CrIS radiances. The correction regression coefficients
in (2) are trained with the simulated AIRS and CrIS radiances [
14,
27], and remain unchanged in our validation analysis; the OLR regression coefficients
in (3) are trained with AIRS and CERES datasets in eight zenith view angle ranges. In our analysis, the actual radiance adjustments
are also obtained via (2), but with the measured CrIS radiances
. The final adjusted CrIS radiance values
are then used in (3) to obtain the CrIS OLR for each FOV.
The two sets of the regression coefficients are part of the input data of the NUCAPS OLR package. The coefficients used to calculate the NOAA-20 CrIS OLR are the same as those for the SNPP OLR. The datasets used to train the regression coefficients in (3) are the CERES CER_SSF_Aqua-FM3-MODIS_Edition4A and the AIRS L1b data. The former can be downloaded from NASA Langley Research Center Atmospheric Science Data Center (ASDC) [
28], and the latter can be downloaded from the NASA Goddard Earth Sciences Data and Information Services Center (GES DISC) FTP server [
29]. The NOAA-20 and the SNPP CrIS SDR, which are used to calculate the CrIS OLR, can be accessed via the NOAA Comprehensive Large Array-Data Stewardship System (CLASS) [
30].
The NOAA-20 CrIS OLR validation was performed on daily, monthly, and yearly timescales, to capture a broad range of OLR applications. The daily validation was undertaken for the global focus day of September 16, 2018; the monthly validation was performed for August 2018. For yearly scale validation, one focus day was chosen per month for 12 consecutive months from April 2018 to March 2019 (see
Table 1).
Table 1 also shows the products used in our validation analysis. In addition, all OLR are mapped onto a
grid (in the latitude/longitude coordinate) to remove spatial and spectral differences among these data sets.
It should be noted that, in our work, the Aqua CERES is used as an absolute reference for all of our hyperspectral IR OLR products from either AIRS or CrIS, aiming at creating consistent and stable OLR records among different hyperspectral IR sensors. As shown in (2), the Aqua AIRS is used as a transfer instrument with the Aqua CERES OLR to estimate the CrIS OLR. Results of Zhang et al. [
14] and our own validation analysis (presented in the next section) have demonstrated that this approach indeed works very well. As such, we have a good baseline of data records.
3. Validation Results
As described in the previous section, our validation analysis was performed with three different OLR products: the Aqua CERES OLR (the truth), the SNPP CrIS OLR (the transfer standard), and the NOAA-20 CrIS OLR (the validation target). The validation was carried out on daily, monthly, and yearly timescales (
Table 1), on a fixed
spatial grid, and with both the ascending orbit data and the descending orbit data. The dates in
Table 1 were selected randomly to ensure statistically robust, yet sufficiently generic datasets over arbitrary periods.
We first show the validation results on the daily timescales.
Figure 1 demonstrates the global distributions of the Aqua CERES OLR (
Figure 1a,b), the SNPP CrIS OLR (
Figure 1c,d), and the NOAA-20 CrIS OLR (
Figure 1e,f) on September 16, 2018, for both the ascending (
Figure 1a,c,e) and the descending (
Figure 1b,d,f) orbit data. One can clearly observe that the three OLR products are very similar in both the spatial distribution patterns and the magnitude range. To further examine the consistencies between the two CrIS OLR products, and the agreement between the CrIS and the CERES OLR products, we plot in
Figure 2 the differences between the SNPP CrIS OLR and the CERES OLR (
Figure 2a,b), between the NOAA-20 CrIS OLR and the CERES OLR (
Figure 2c,d) and between the NOAA-20 CrIS OLR and the SNPP CrIS OLR (
Figure 2e,f). Similarly, the left and right panels in
Figure 2 are the results for the ascending orbit data and the descending orbit data, respectively. One can observe from the figure that the differences among the three OLR products are minimal globally. However, they are more significant in several isolated regions. For example, the difference between the Aqua CERES OLR and the NOAA-20 CrIS OLR for the ascending orbit data reaches ~30 Wm
−2 in a small region in the southern Pacific near Antarctica, as shown in the center and bottom two plots on the left panel (see more discussions in
Section 4). Our analysis shows further that the global mean difference (the accuracy) is approximately 0.2 Wm
−2 for both the ascending and the descending orbit data, and the standard deviation (the precision) is about 8.7 Wm
−2 for the ascending orbit data and 7.4 Wm
−2 for the descending orbit data. These values are comparable to those of the difference between the SNPP CrIS OLR and the Aqua CERES OLR: the accuracies and the precisions are 0.2 and 5.2 Wm
−2 for the ascending orbit data, and 0.4 and 5.6 Wm
−2 for the descending orbit data, respectively. Moreover, the small difference between the NOAA-20 CrIS OLR and the SNPP CrIS OLR products (
Figure 2e,f) demonstrates that the NUCAPS OLR package can generate consistent daily CrIS OLR products from the two different datasets. It should be noted that all of these values well satisfy the JPSS requirements (with 5.0 Wm
−2 in accuracy and 12.0 Wm
−2 in precision, see also
Table 2).
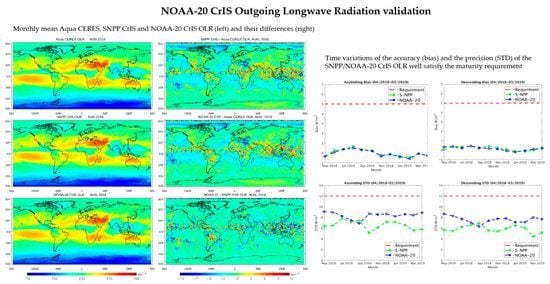
Next, we present our validation results on the monthly timescales by evaluating the monthly mean OLR over the entire month of August 2018, and the ascending and the descending orbit data. The Polar Operational Environmental Satellites (POES), including SNPP, NOAA-20, and Aqua, are designed to have 14.1 orbits per day and a 16 day orbit repeat cycle. The monthly average data use the satellite observations that cover a complete orbit cycle, and hence provide more reliable intersatellite comparisons.
Figure 3 shows the global distributions of the monthly mean OLR (
Figure 3a,c,e) and their differences (
Figure 3b,d,f). As shown in the figure, the differences among the three OLR products are even smaller than those of the daily OLR products (see
Figure 1 and
Figure 2). The most significant differences occur near the equator over the Intertropical Convergence Zone (ITCZ), which may be due to the inhomogeneity and variation caused by the presence of deep convective clouds. However, they are approximately 30% of the magnitudes of the daily OLR differences, suggesting that the causal processes are on sub-monthly time scales. The smaller differences are also shown clearly in
Figure 4, which shows the scatter plots of the SNPP CrIS OLR and the Aqua CERES OLR (
Figure 4a, and the NOAA-20 CrIS OLR and the Aqua CERES OLR (
Figure 4b). As shown in the figure, the accuracy and the precision for the NOAA-20/Aqua pair are approximately 0.3 and 1.9 Wm
−2, respectively (and 0.4 and 2.0 Wm
−2, respectively, for the SNPP/Aqua pair). Again, the small difference between the monthly mean NOAA-20 CrIS OLR and the SNPP CrIS OLR (
Figure 3f) demonstrates the remarkable consistency of the NUCAPS CrIS OLR products over monthly timescales.
Because the monthly mean values of the accuracy and of the precision may be lower than their daily values, we examine, in addition, the accuracy and precision variations of the SNPP CrIS OLR and the NOAA-20 CrIS OLR over the entire month.
Figure 5 shows the time-varying accuracy (
Figure 5a,b) and precision (
Figure 5c,d) for the ascending orbit data (
Figure 5a,c) and the descending orbit data (
Figure 5b,d). One can observe from the figure that the accuracies and the precisions of the SNPP CrIS OLR (green curves) and the NOAA-20 CrIS OLR (blue curves) oscillate in time about their mean values. Both the mean and the amplitude of the accuracies are significantly smaller than those of the precisions, thus well satisfying the JPSS requirements at all times (the red dashed lines, see
Table 2 for details).
Now, we consider the OLR validation on the yearly timescale. In this part of the validation, we analyzed the OLR products for the period from April 2018 to March 2019. Instead of using monthly mean OLR for the validation, we selected one representative day for each month within the period for our validation analysis (see
Table 1 for the specific dates). This should be sufficient for validation of the NOAA-20 CrIS OLR products on yearly timescales because, as shown in
Figure 5, most of the accuracy and precision variations occur on sub-weekly timescales. With this approach, distributions of the OLR products and their differences in each selected day are similar to those in
Figure 1 and
Figure 2, and are therefore not presented again here.
Therefore, we plot in
Figure 6 the precision and the accuracy variations in this period. From the figure, we can find that, similar to those in August 2018 (see
Figure 5), both the accuracy and the precision oscillate in time about their time-averaged values. However. the amplitudes of the accuracies are, in general, smaller than those of the precisions. Again, their values are significantly below the JPSS requirements (the red dashed lines).
It should be noted that there exist large discrepancies between the accuracies and precisions from the ascending data, and from the descending data, on a yearly time scale (
Table 2). This may be in part due to the fact that the sampling rate for the yearly OLR validation is four-fold lower than that for the monthly OLR validation (1 focus day vs. 4 focus days per month, see
Table 1). However, they do not affect the OLR validation performance because they are still well within the JPSS requirement.
4. Discussion
We presented our validation results in the previous section (see
Figure 1,
Figure 2,
Figure 3,
Figure 4,
Figure 5 and
Figure 6), focusing on the accuracy and the precision of NOAA-20 CrIS OLR products from the NUCAPS OLR package, and their agreements with the Aqua CERES OLR and the SNPP CrIS OLR on daily, monthly, and yearly timescales. Our validation results also provide additional information about the CrIS OLR products and potential implications for future work. We will elaborate on some of these in this section.
It is interesting to observe different performances of the NOAA-20 CrIS OLR and of the SNPP CrIS OLR relative to the Aqua CERES OLR, which are in particular noticeable in the spatial distributions of the OLR differences shown in
Figure 2. As shown in the
Figure 2b the difference between the SNPP CrIS OLR and the Aqua CERES OLR is the strongest in northeast Russia with the descending orbit data; whereas that between the NOAA-20 CrIS OLR and the Aqua CERES OLR is the strongest in the southern Atlantic Ocean near Antarctica with the ascending data (
Figure 2c. However, it appears that these significant regional differences do not persist over extended periods, because no similar difference is observed in the monthly mean OLR in
Figure 3b,d. This suggests that localized maxima may occur on short time scales. The regional differences may also be caused by the angular, temporal, and spatial sampling difference among SNPP, NOAA-20 CrIS, and Aqua CERES observations. The cloud cover and cloud-top height may also play an important role, particularly in the convective regions in the tropics and mid-latitudes. Moreover, as shown in the center-left plot and the top-right plot of
Figure 2, the SNPP CrIS OLR performs better with the descending orbit data, whereas the NOAA-20 CrIS OLR performs better with the ascending orbit data. These performance differences may suggest potentially optimal applications of the CrIS OLR products in the future.
Another interesting property is that the accuracies of the NOAA-20 and SNPP CrIS OLR decrease as the time scale increases, as shown in both the spatial distributions in
Figure 2 and
Figure 3 and the averaged values in
Table 2. However, their precisions do not show such monotonic decrease (with respect to the timescale): the precisions on a monthly scale are smaller than those of the daily and yearly timescales (see
Table 2). This may be due in part to the different approaches in assessing monthly and annual OLR products. In our validation analysis, the monthly OLR is the mean OLR over the entire month (08/2018), whereas the yearly OLR is given by the 12 focus days (one for each month) of the year (see
Table 1). If the yearly OLR is defined similarly as the monthly OLR, i.e., averaged over all days of the year, one should expect that the precision also decreases monotonically as the timescale increases. This monotonic decrease suggests that the OLR varies on timescales shorter than the monthly timescale. In particular, the sub-weekly variation shown in
Figure 5 may be mainly due to the highly variable air masses and cloud features. It also suggests that future OLR product validation may suffice on monthly timescales at most.
It should be noted that the accuracy and the precision, i.e., the bias and the STD, of the NOAA-20 CrIS OLR are also affected by spatial and temporal differences from Aqua CERES (the broadband instrument) and NOAA-20 CrIS (hyperspectral instrument), because they are on two different satellite platforms. In our analysis, we mapped all OLR products on a grid for consistency. Analyses with different spatial grids may help to understand the impact of the spatial differences, e.g., different samplings, on OLR products. To minimize the impacts of the time differences in the datasets, one possible improvement may be made with additional filters (in the time domain) for data pre-processing, such that datasets with time differences less than an appropriate threshold will be selected for validation. One of our future objectives is to reanalyze NOAA-20 CrIS OLR with NOAA-20 CERES OLR once they are made available for public scientific research and applications.
As described in
Section 2, our validation is based on the approach in which the Aqua AIRS is used as a transfer instrument with CERES Aqua OLR, for estimation of SNPP and NOAA-20 CrIS OLR. The working of this approach is demonstrated by the validation results of the SNPP CrIS OLR [
24] and of the NOAA-20 CrIS OLR described in this paper, which provide a good baseline of data records. Obviously, efforts can be made with different regressions for OLR validation. The results can then be compared with the baseline, to identify potential improvements in the consistency and the performance.
5. Conclusions
In this paper, we discuss our validation of the NOAA-20 CrIS OLR products obtained from the NUCAPS OLR package. In our validation analyses, the broadband Aqua CERES OLR products were treated as the truth, whereas the SNPP CrIS OLR products, another hyperspectral OLR from the NUCAPS, were used as the transfer standard, given that they were previously validated (with the Aqua CERES OLR). The three OLR products were reprocessed and mapped on a
grid to reduce the impacts of different spatial and temporal resolutions of the datasets. The validations were made on three different timescales: daily, monthly, and yearly.
Table 1 provides the specific dates selected for the validation. For the monthly OLR validation, we analyzed OLR for each day of the month, in addition to the monthly mean. Based on the daily and the monthly validation results, we opted for a simple approach for the yearly OLR validation, i.e., we used the daily OLR for one focus day per month for the entire year. With the exception of the monthly-mean OLR, validation analyses were separately performed for the OLR products from the ascending orbit (daytime) data and the descending orbit (nighttime) data.
Our validation analyses show that the NOAA-20 CrIS OLR products agree very well with both the SNPP CrIS OLR products and the Aqua CERES OLR products at all timescales. The differences between the NOAA-20 CrIS OLR and the Aqua CERES OLR, and between the NOAA-20 CrIS OLR and the SNPP CrIS OLR, are substantially smaller globally than the original OLR at daily (
Figure 2) and monthly (
Figure 3) timescales. As shown in
Figure 4,
Figure 5 and
Figure 6 and
Table 2, their bias (accuracy) and STD (precision) are also minimal and fall within the JPSS maturity validation requirements at all timescales. These validation results demonstrate that the NOAA-20 CrIS OLR products, generated with the NUCAPS OLR package using measurements of the CrIS instruments onboard SNPP and NOAA-20 satellites, are well defined over wide ranges of representative conditions.
The NUCAPS OLR products are distributed in a netCDF-4 file format with metadata attributes included. The near real-time update of the daily NOAA-20/SNPP CrIS OLR products can be found at NOAA CLASS [
30].


 ,
, 


