
Sensitivity Analysis of Canopy Structural and Radiative Transfer Parameters to Reconstructed Maize Structures Based on Terrestrial LiDAR Data

 ,
,
Abstract
:1. Introduction
2. Material and Methods
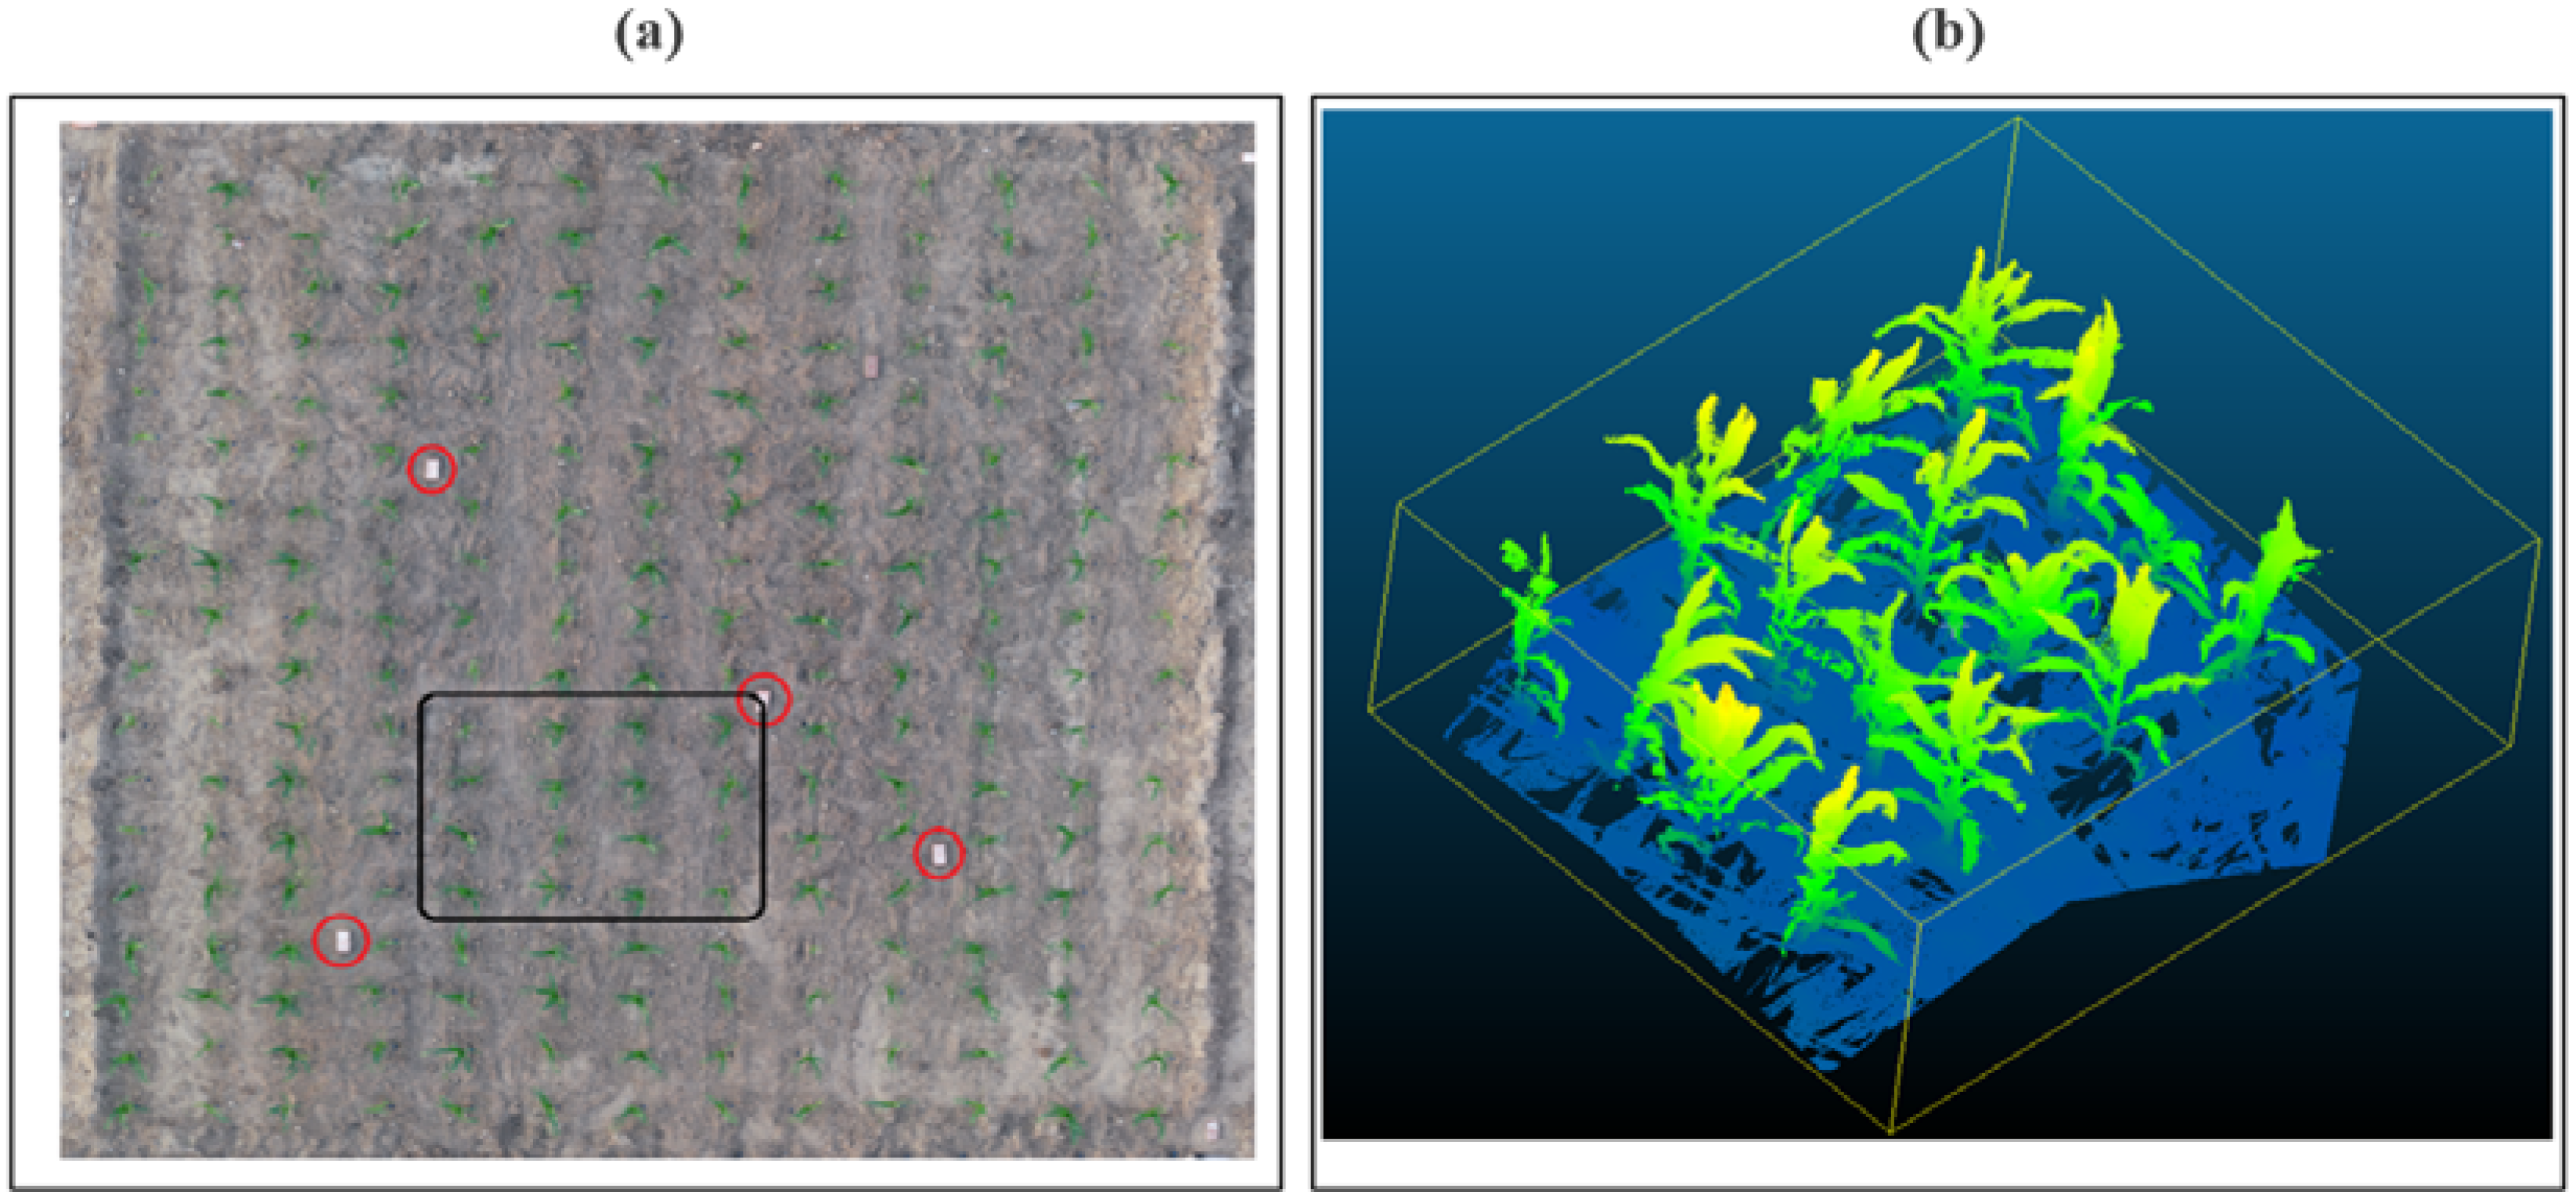
2.1. TLS Data Acquisition
2.2. Canopy Reconstruction
- Separating the plants. The first step was to separate the point cloud related to each plant in a different files by using CloudCompare. Available online: https://www.danielgm.net/cc/ (accessed on 1 August 2021).
- Filtering. The resulting point cloud also produced a comparatively high level of noise due to the devices’ resolution limit and the fine structure of a plant [9]. Especially for the edgy part at the end of maize leaves and the uppermost leaves because they were close to each other. We detected spurious points and removed them.
- Filling Holes. In some cases, because of the relatively high number of plants, some holes can exist between two parts of the same leaf. In this step, we carried out a visual inspection of such holes, and filled the voids with ordered points.
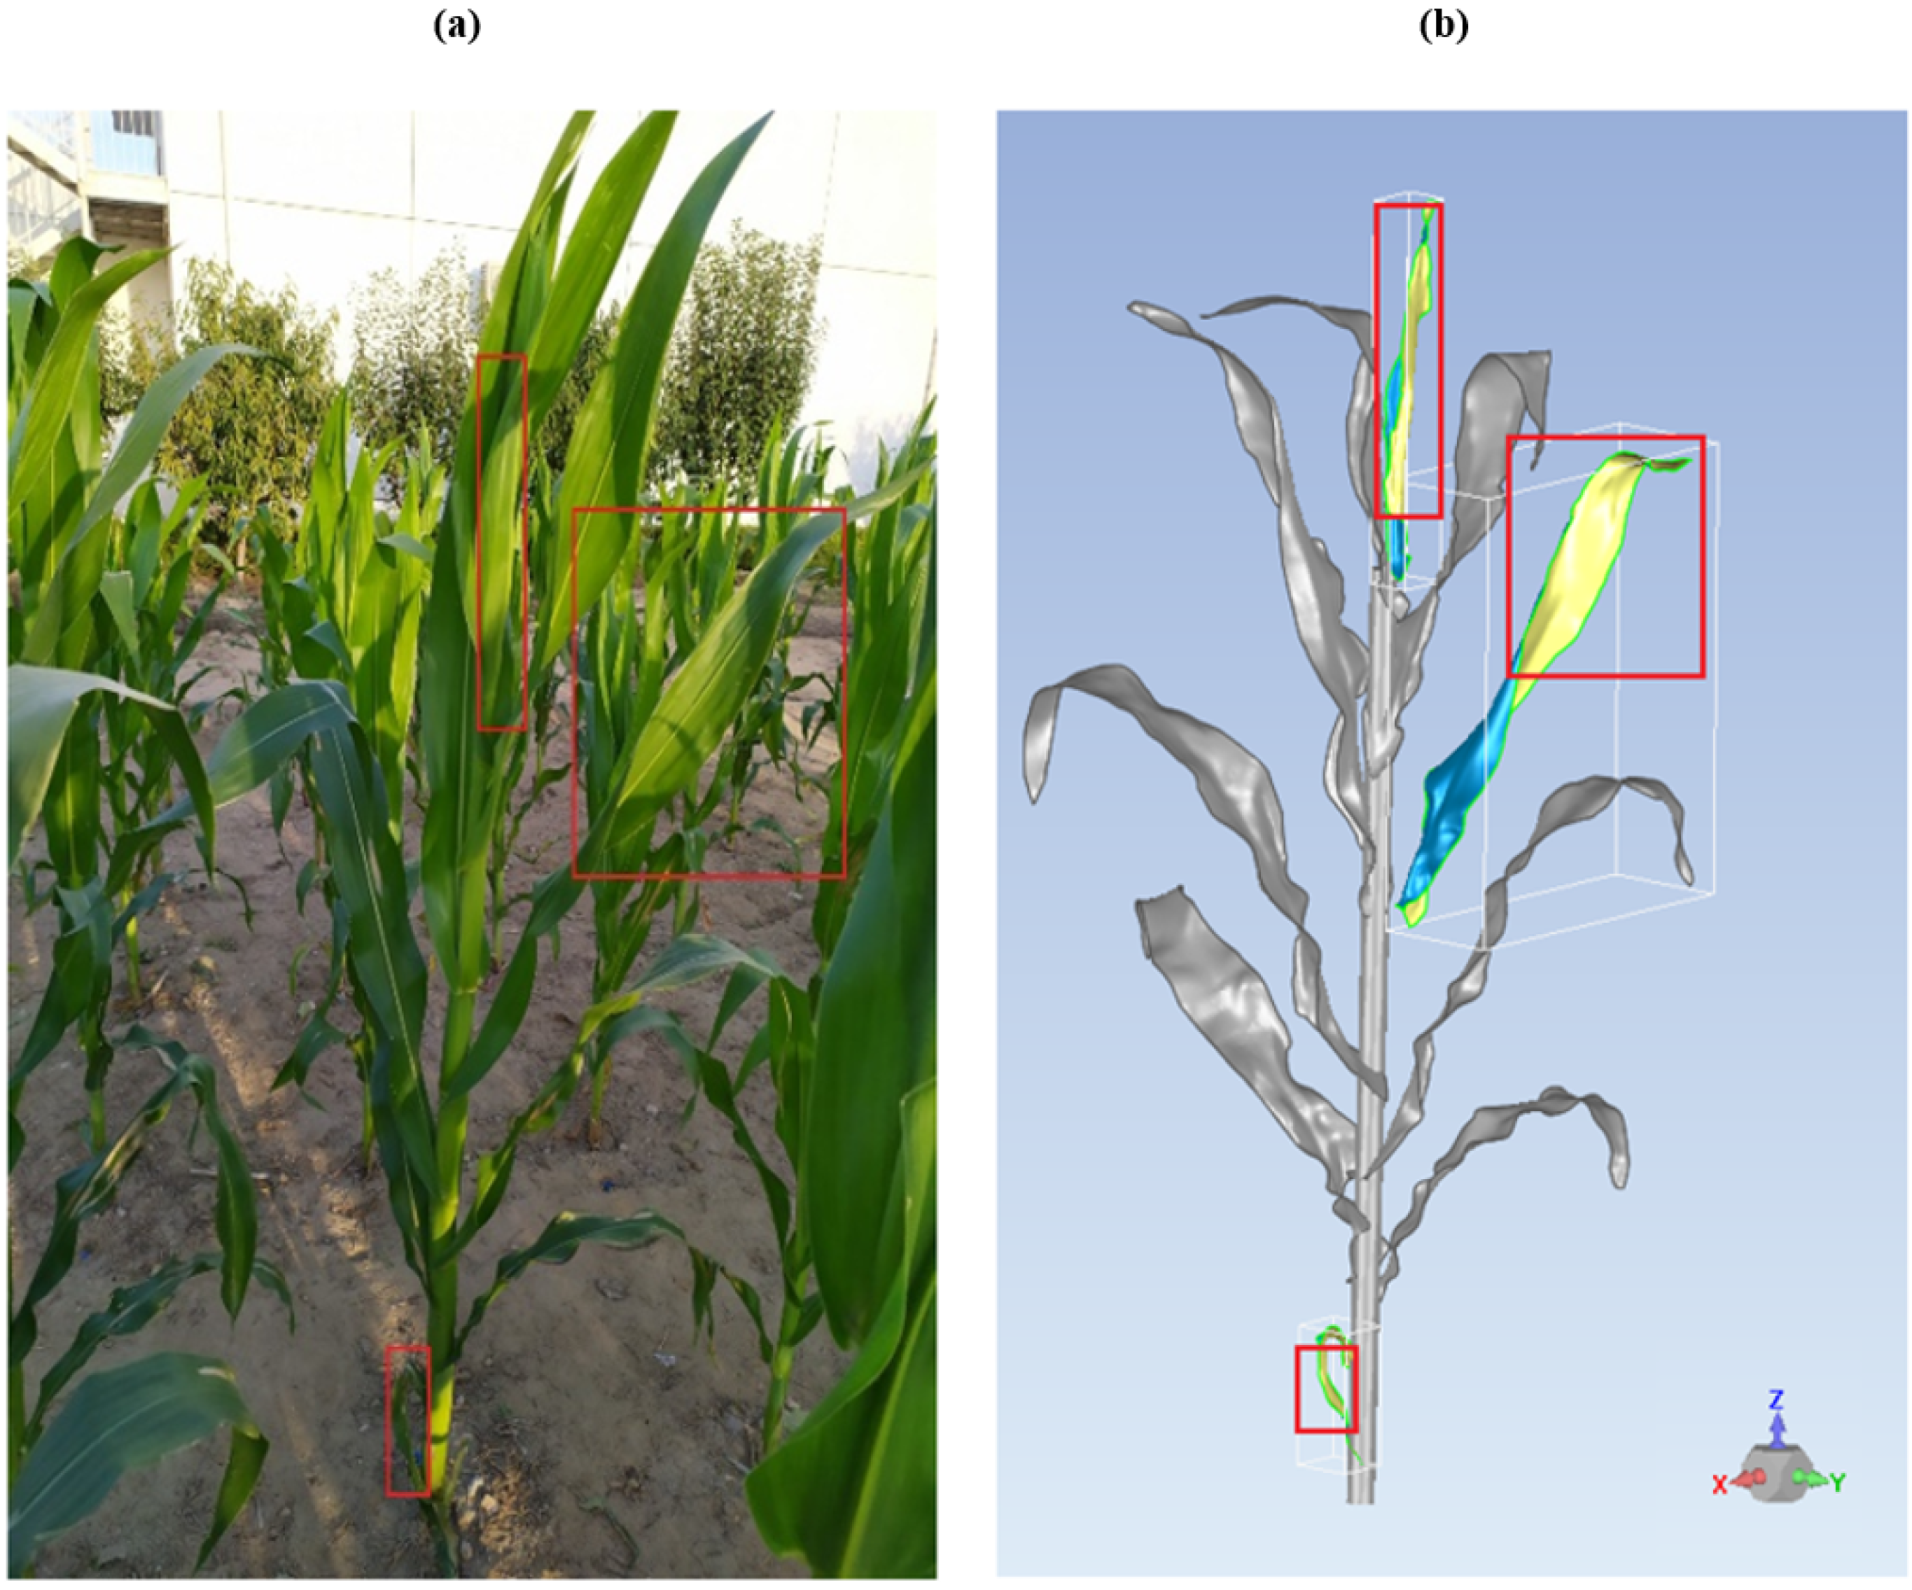
- Reducing scanner error. Minor wind may cause overlaps and offsets in the point clouds created during the 3D scanning process [26]. This results in making the smooth surfaces of the leaves rough. We used the module “Reduce Noise” in Geomagic Wrap, which moves points to statistically correct locations while removing more outliers to get smooth surfaces.
- Wrapping. The process of converting a point object to a polygon object is commonly called “wrapping”. It can be described as stretching plastic sheeting around a point object and pulling it tight to reveal a polygon surface. 3D polygon meshes were then created while maximizing shape retention.
- Smoothing the edges and filling holes. After the polygon mesh was generated, the leaves were treated separately. The small voids between the parts of the leaf were filled, and the edges were smoothed. The number of triangles was not defined at this step, which means that the structure will be generated with maximum retention (maximum number of triangles). Naturally, the maximum number of triangles are considered the finest triangulation.
- Adding stem. In our case, the stem was added manually, using the bottom and top points from the point clouds. The structure of the stem was approximated with a cone of 200 triangles. The base and top perimeter of the stem were chosen according to the stage of growth and the mesh of points.
- Combining the reconstructed plants. After generating all the plants from the same stage of growth, we combined them using the same coordinates system in one structure.
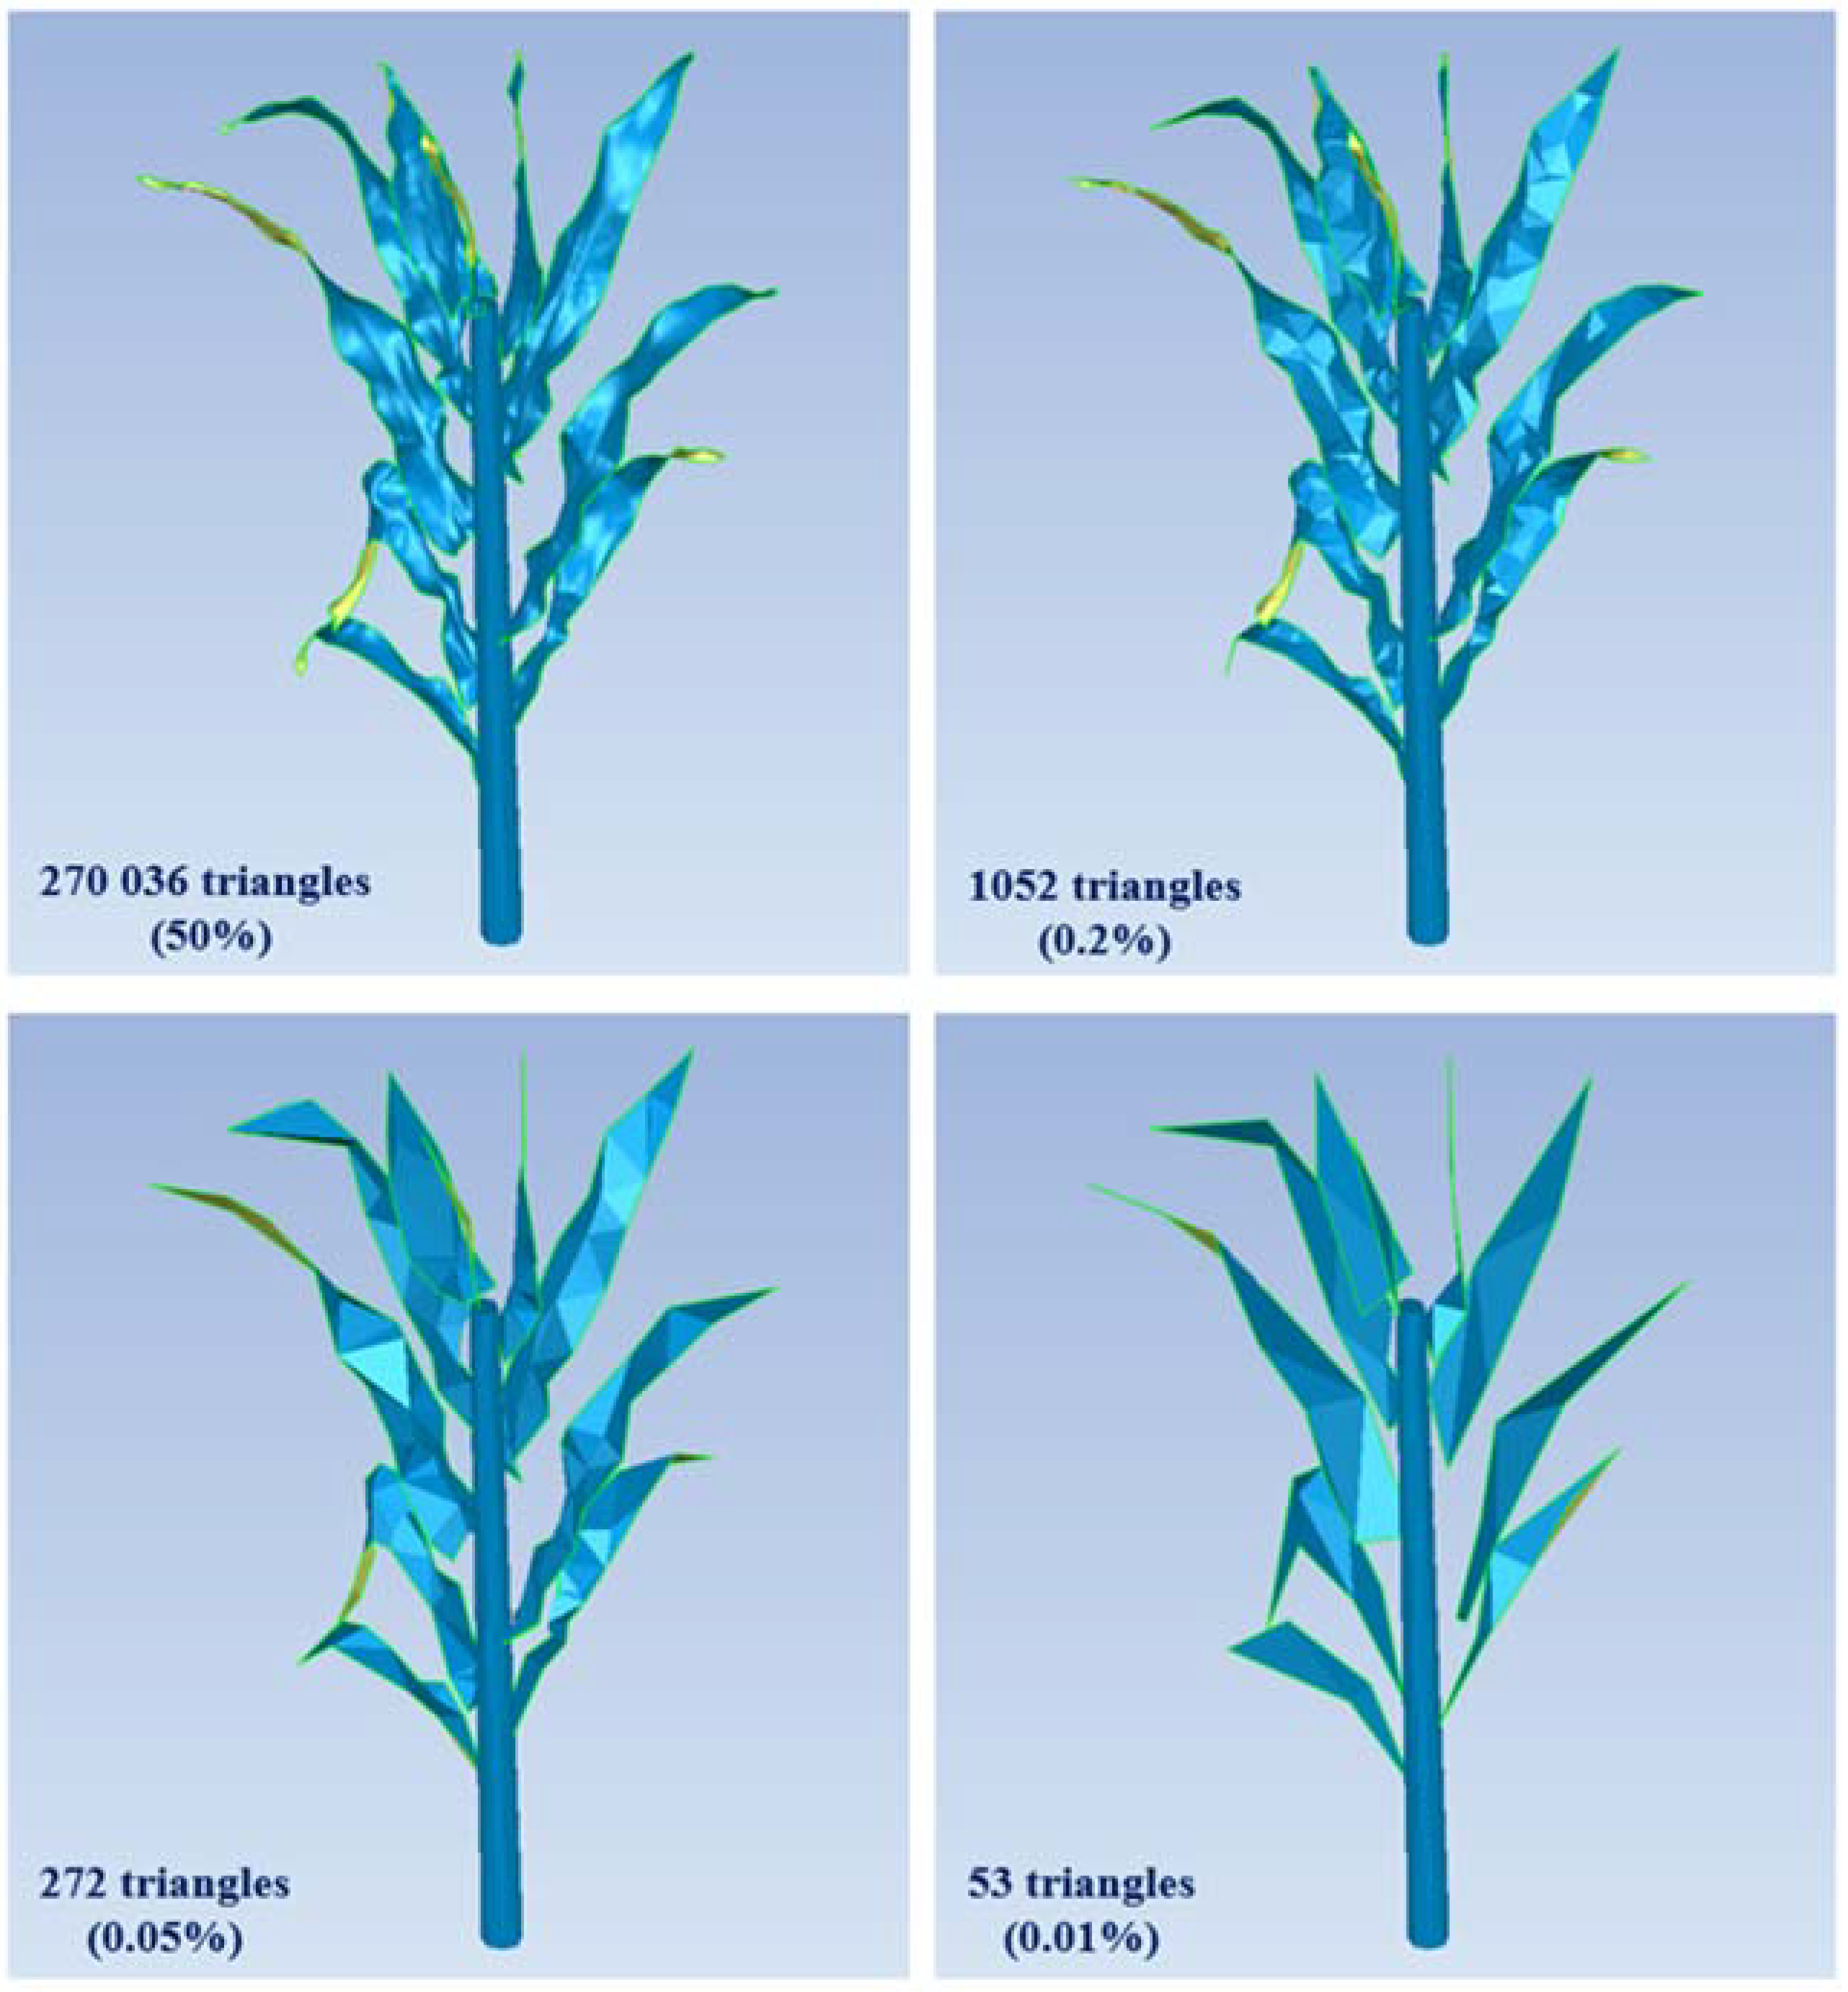
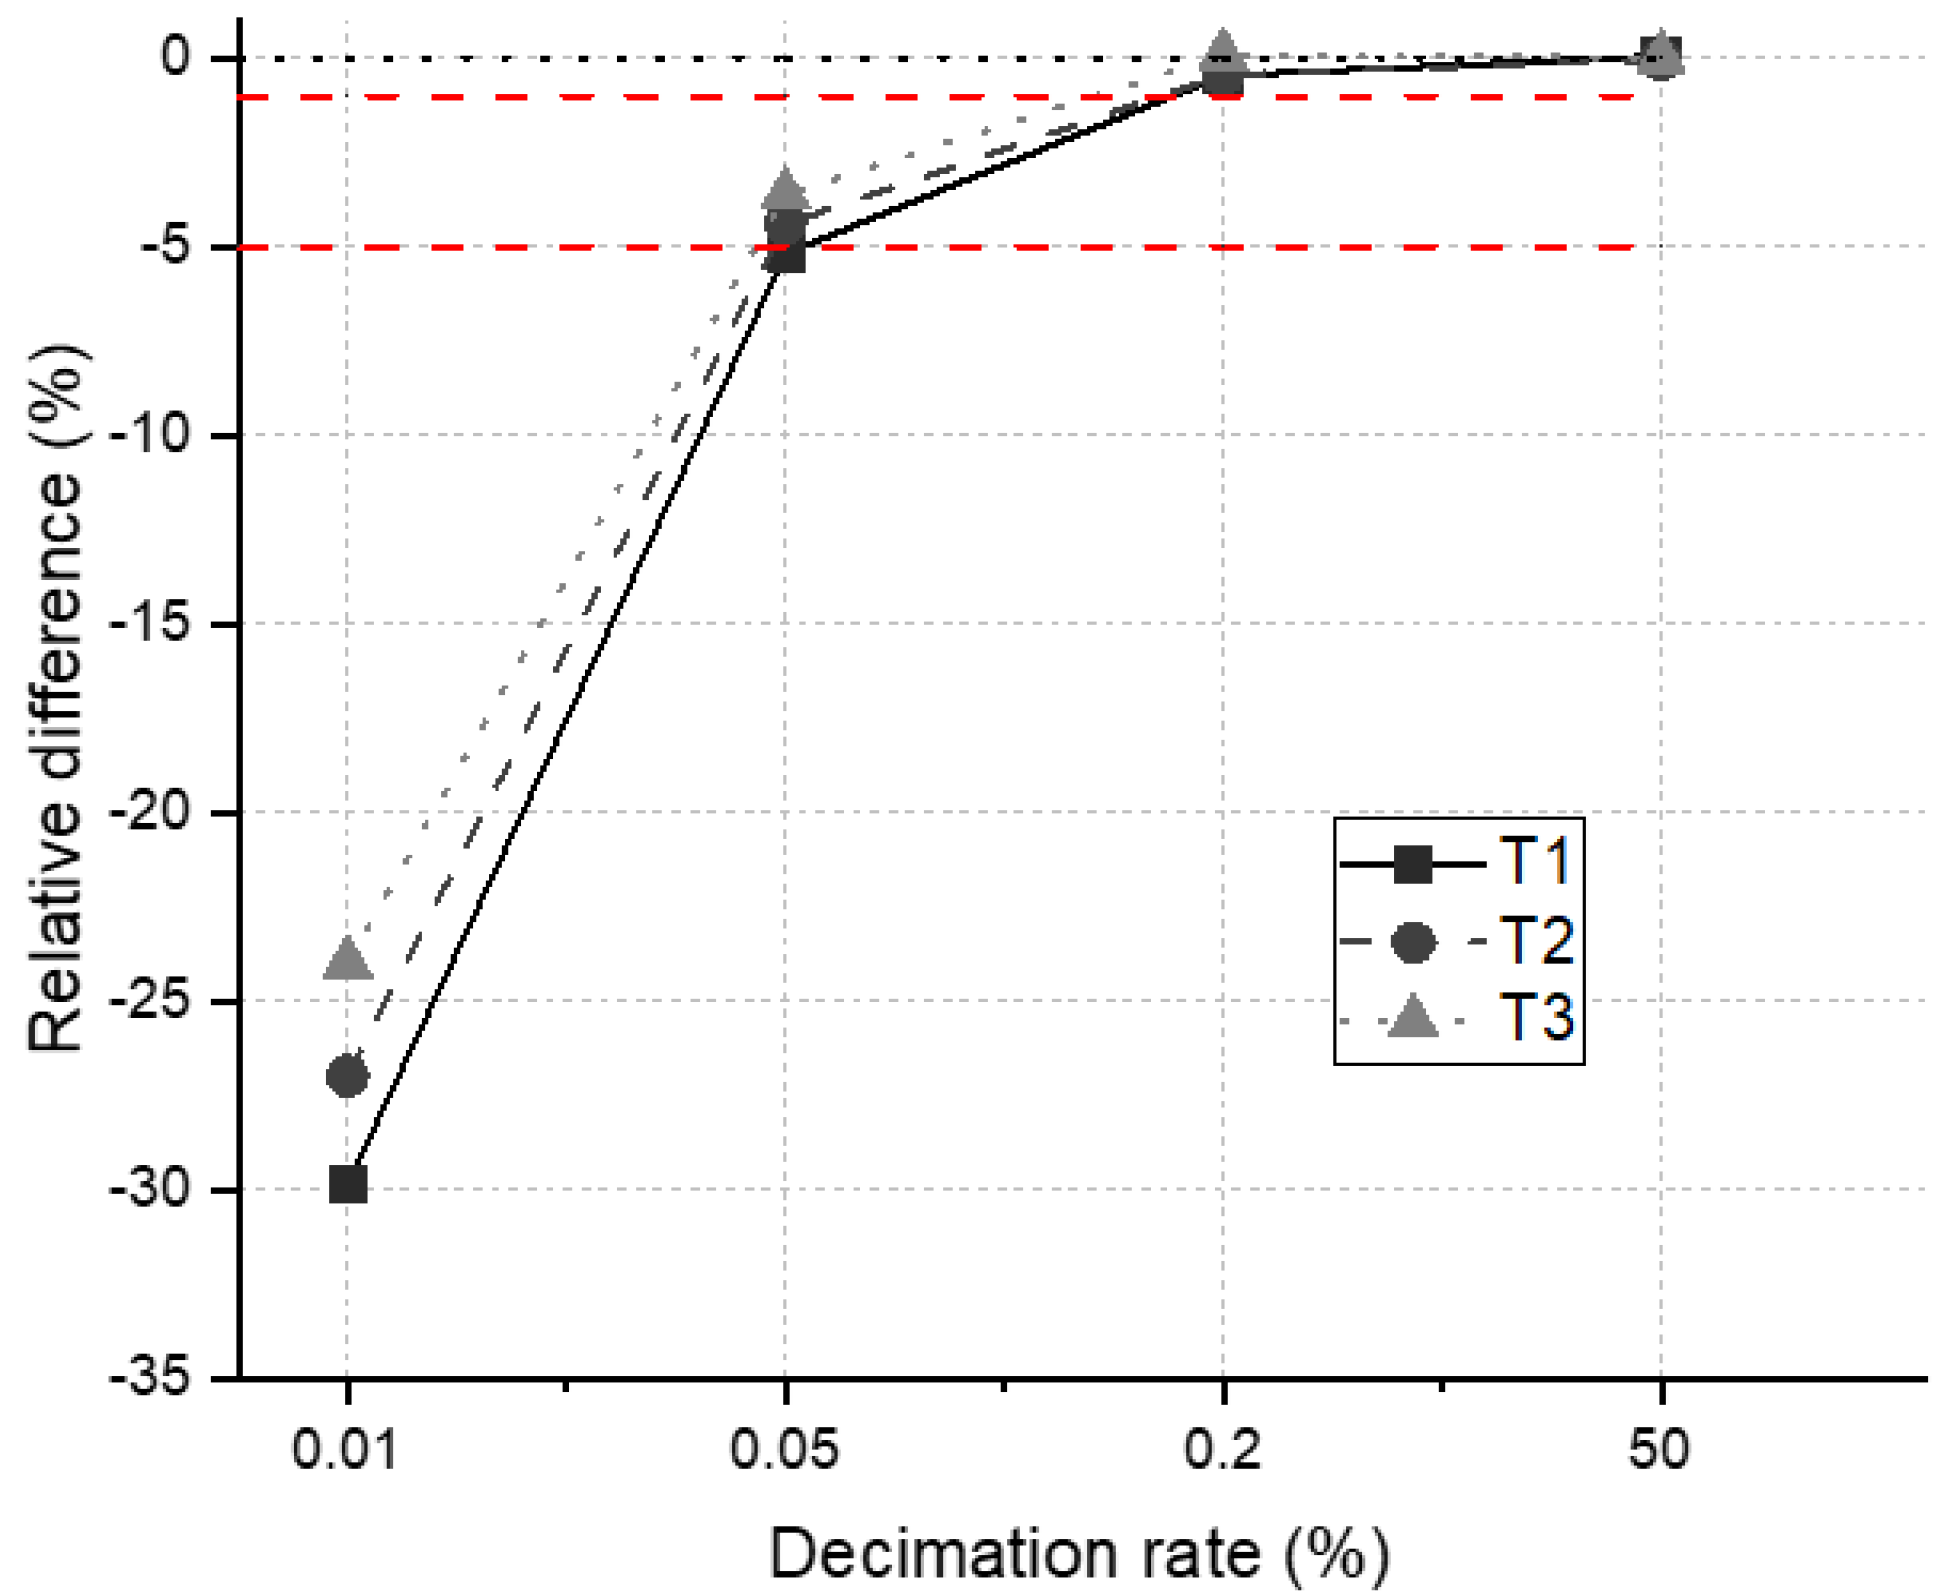
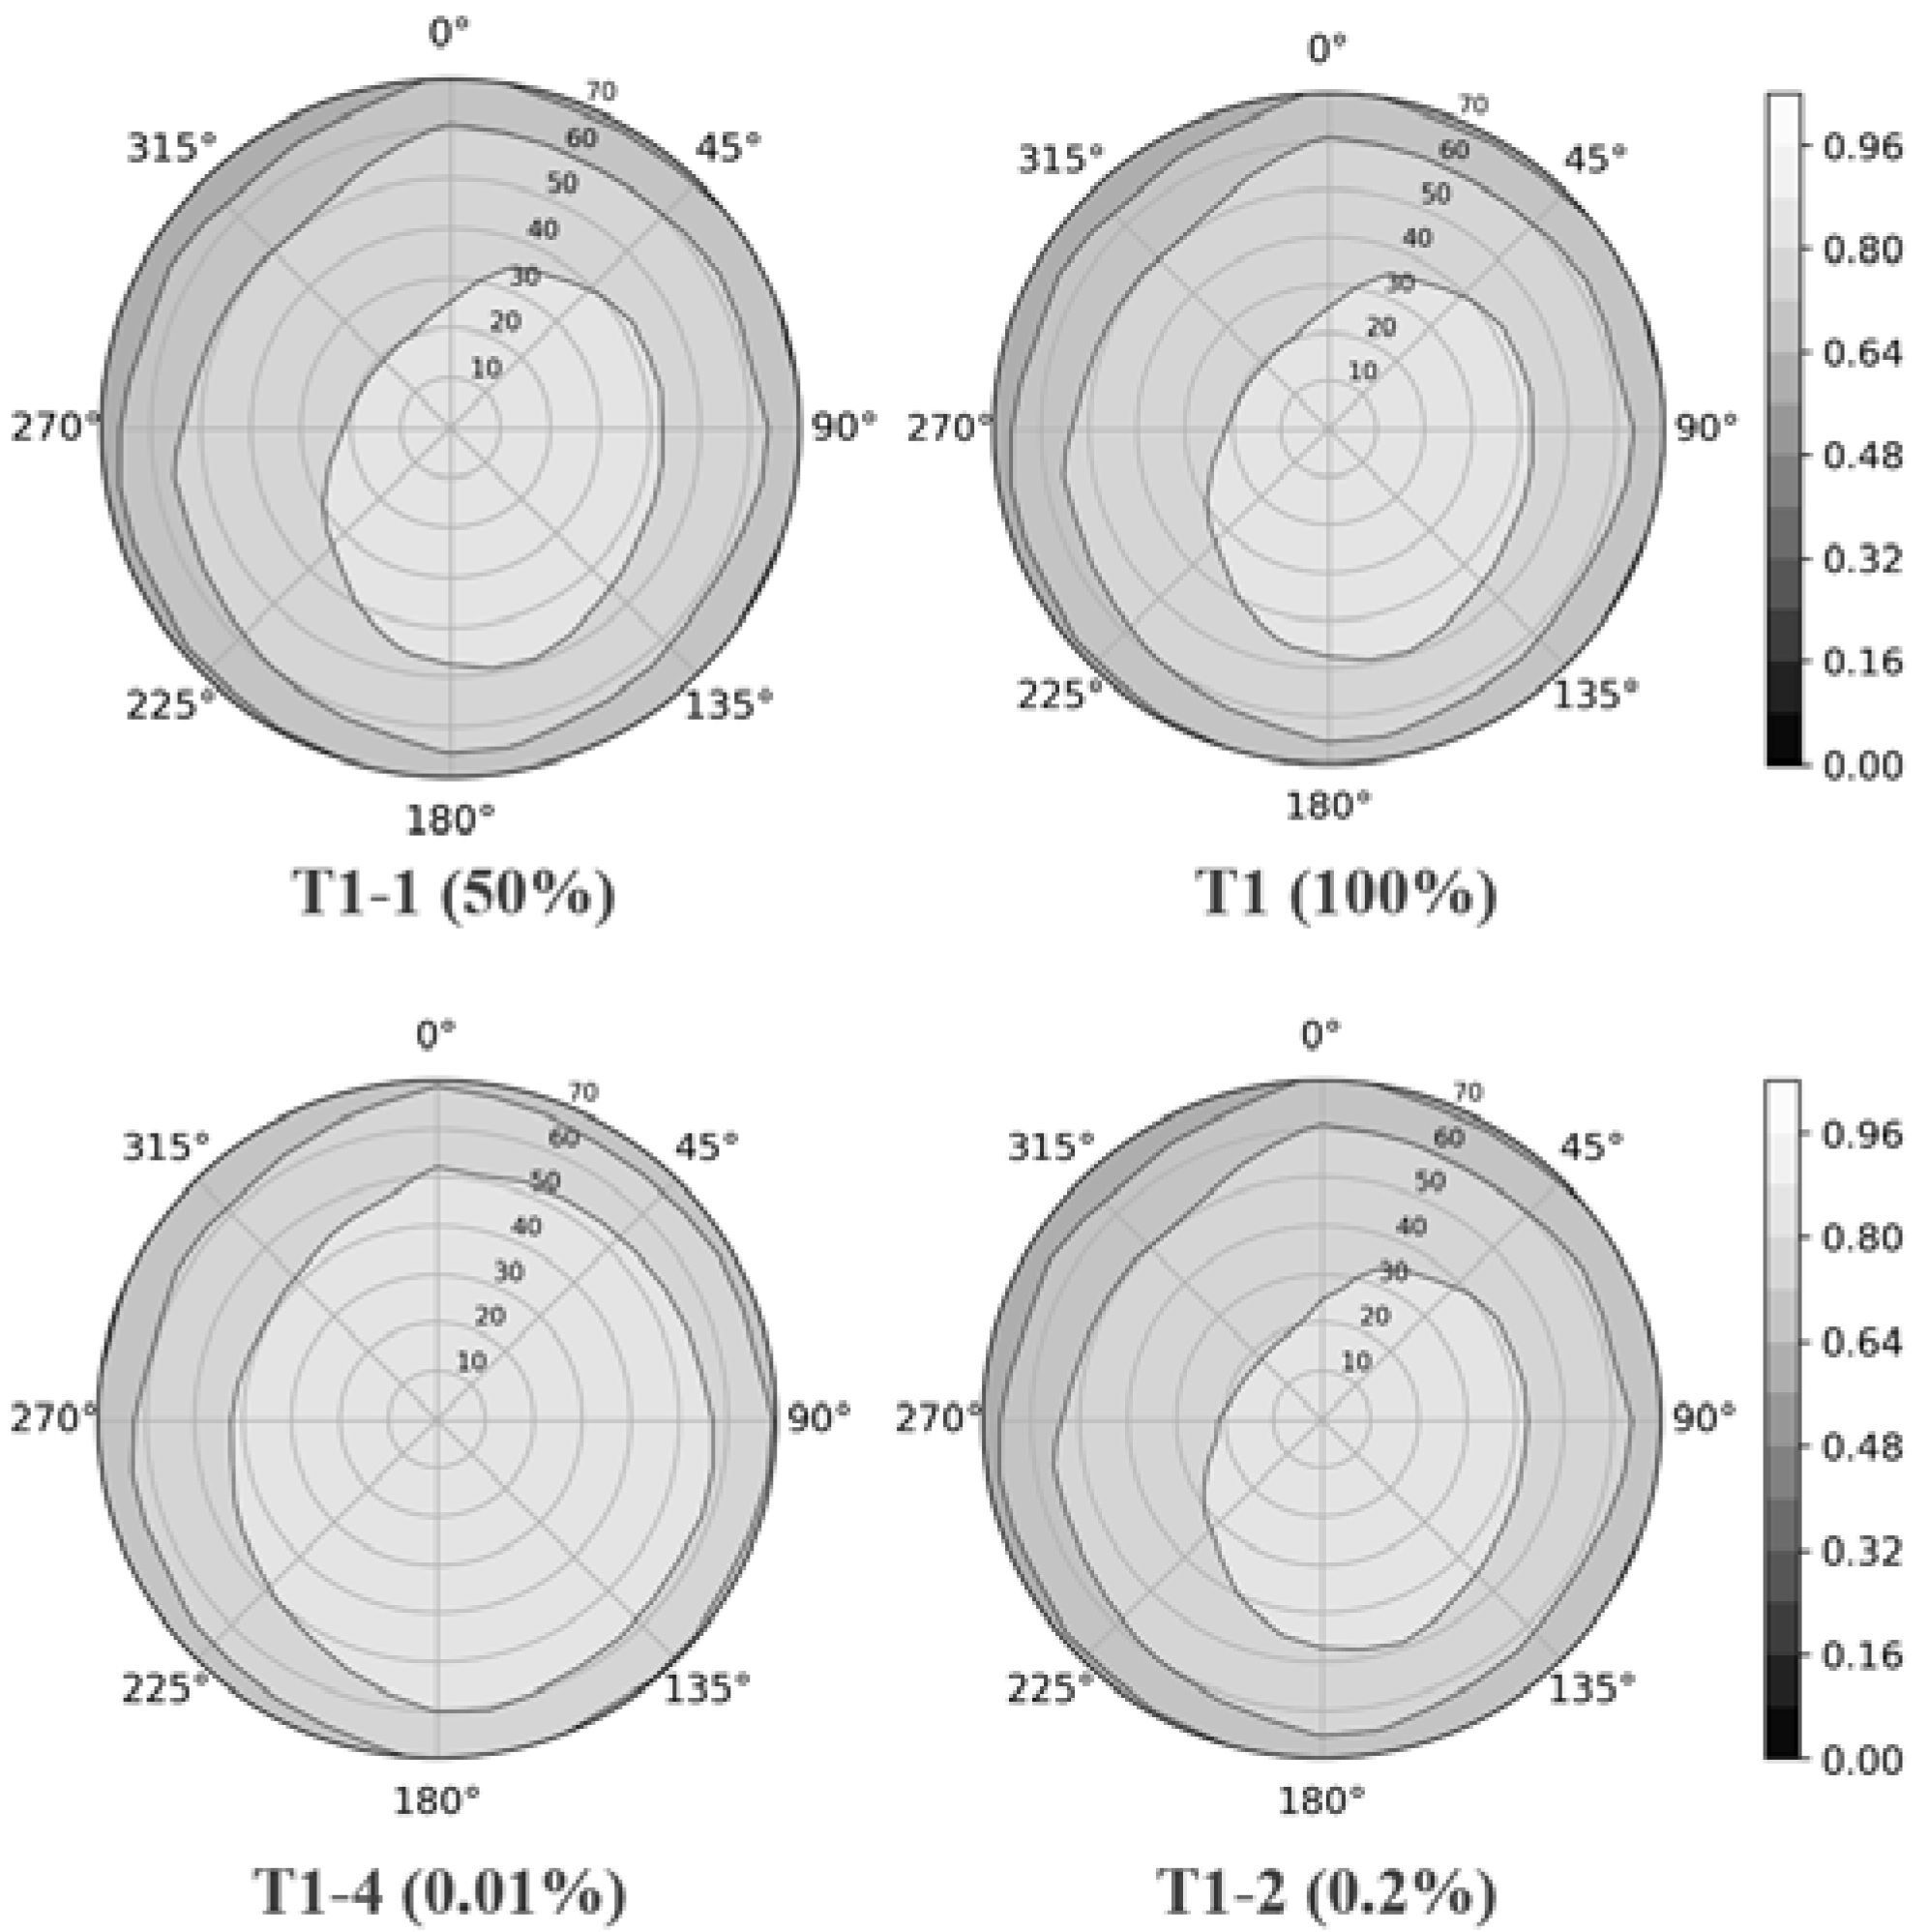
- Decimating. At this point, the structures with the finest configuration of the canopy were generated. We referred to these structures by T1 (4 161 209 triangles), T2 (4 981 651 triangles), and T3 (6 834 588 triangles) for the respective stages of growth where T1 is the earliest stage and T3 the latest stage. These structures were used as a reference for the computation of the various parameters. The decimated structures were generated by reducing the high number of triangles without compromising surface detail in respect to the targeted decimation rate and the Hausdorff distance (explained below). To have the same scale of decimating for all leaves, we reduced the total number of triangles for the scenes containing only the leaves without stem and soil. We chose four configurations for each stage of growth. The four configurations include four decimation rates (50%, 0.2%, 0.05%, and 0.01%) and their corresponding Hausdorff distances (Table 2). Figure 2 shows a plant in the third stage of growth in different decimating configurations.
- Visual assessment using photos of the plants. Deleting the overlapping triangles and control the overall quality of the structures by referring to the photos of the plants taken at the same time with LiDAR measurements. We used the software Geomagic Wrap 2015 from step 2 to step 10.
- Generating objects files. The last step is the generation of the input files describing the different structures by converting the STL file to an objects file. This was achieved in Visual studio 2013 (C++) by conserving only the coordinates of the triangles and deleting the extra information in the STL file. The object file is the input of the RT model WPS (Weighted Photon Spread, [27]). This process can be time consuming, especially for the finest structures, T1, T2, and T3, which correspond to an average file size of 34.52, 41.87, 57.81 Mega Byte (MB) for one maize plant, respectively.
2.3. Hausdorff Distance
3. Calculation of the Parameters
3.1. LAD and LAI
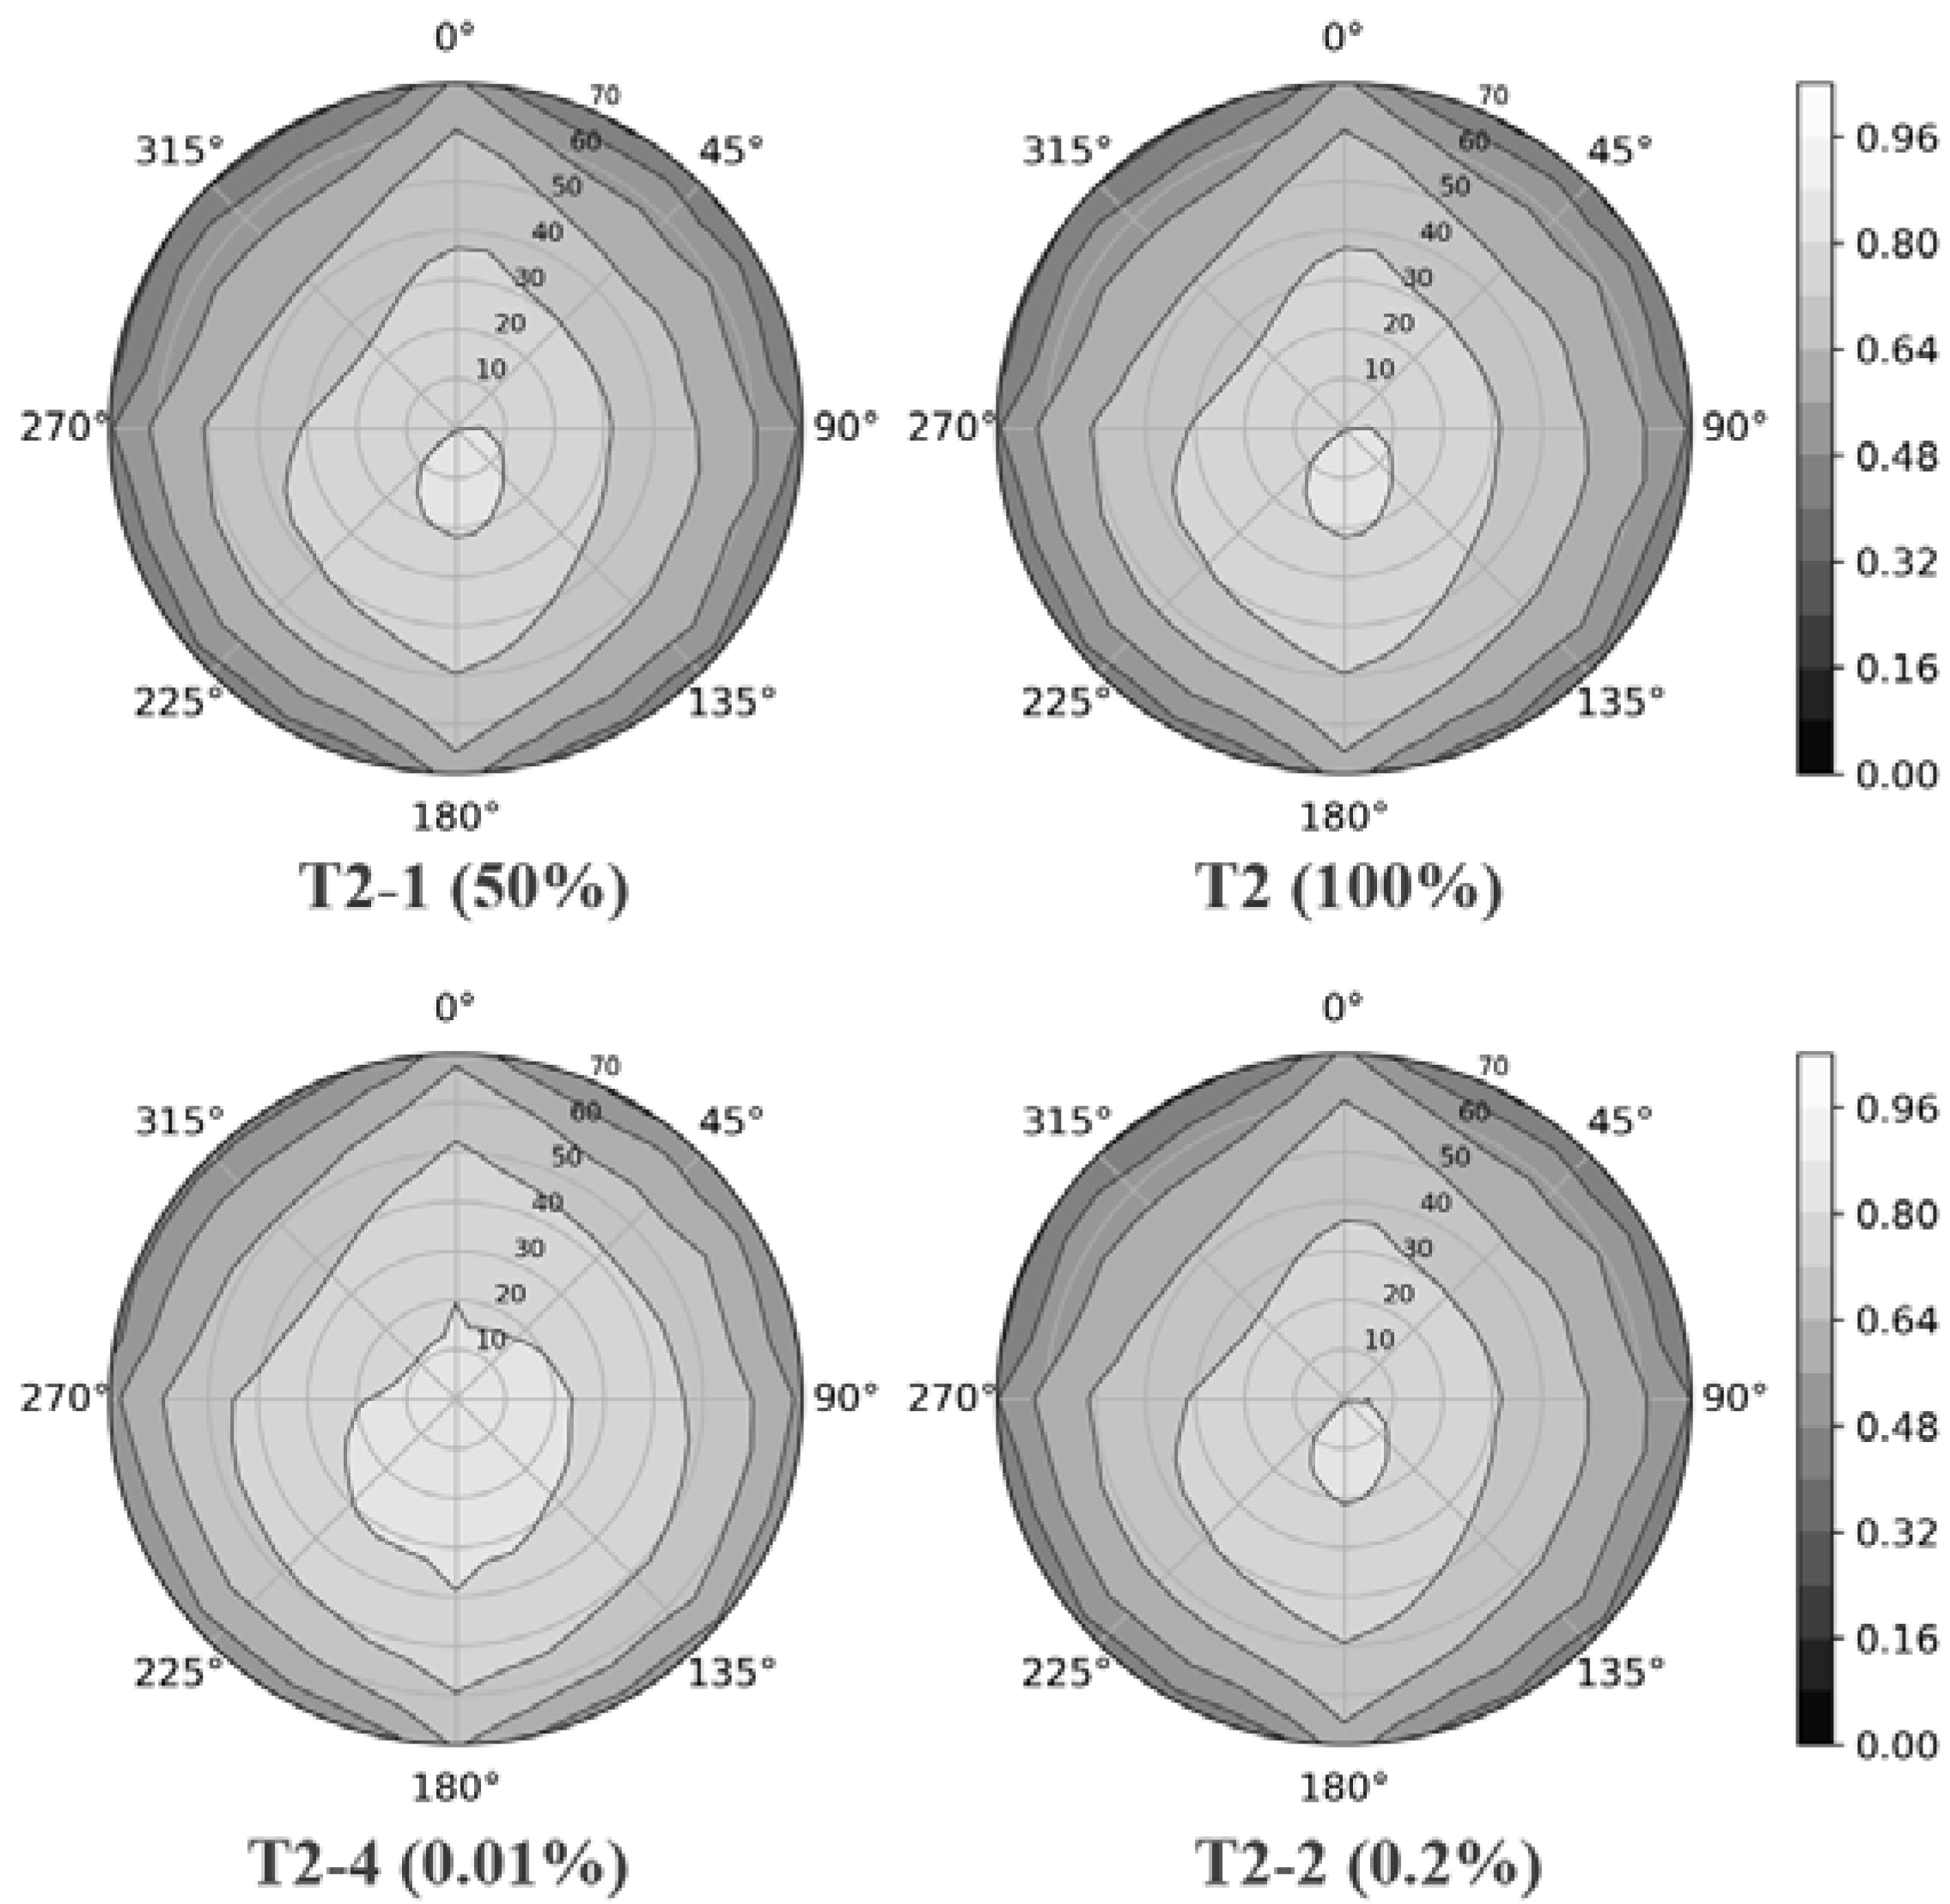
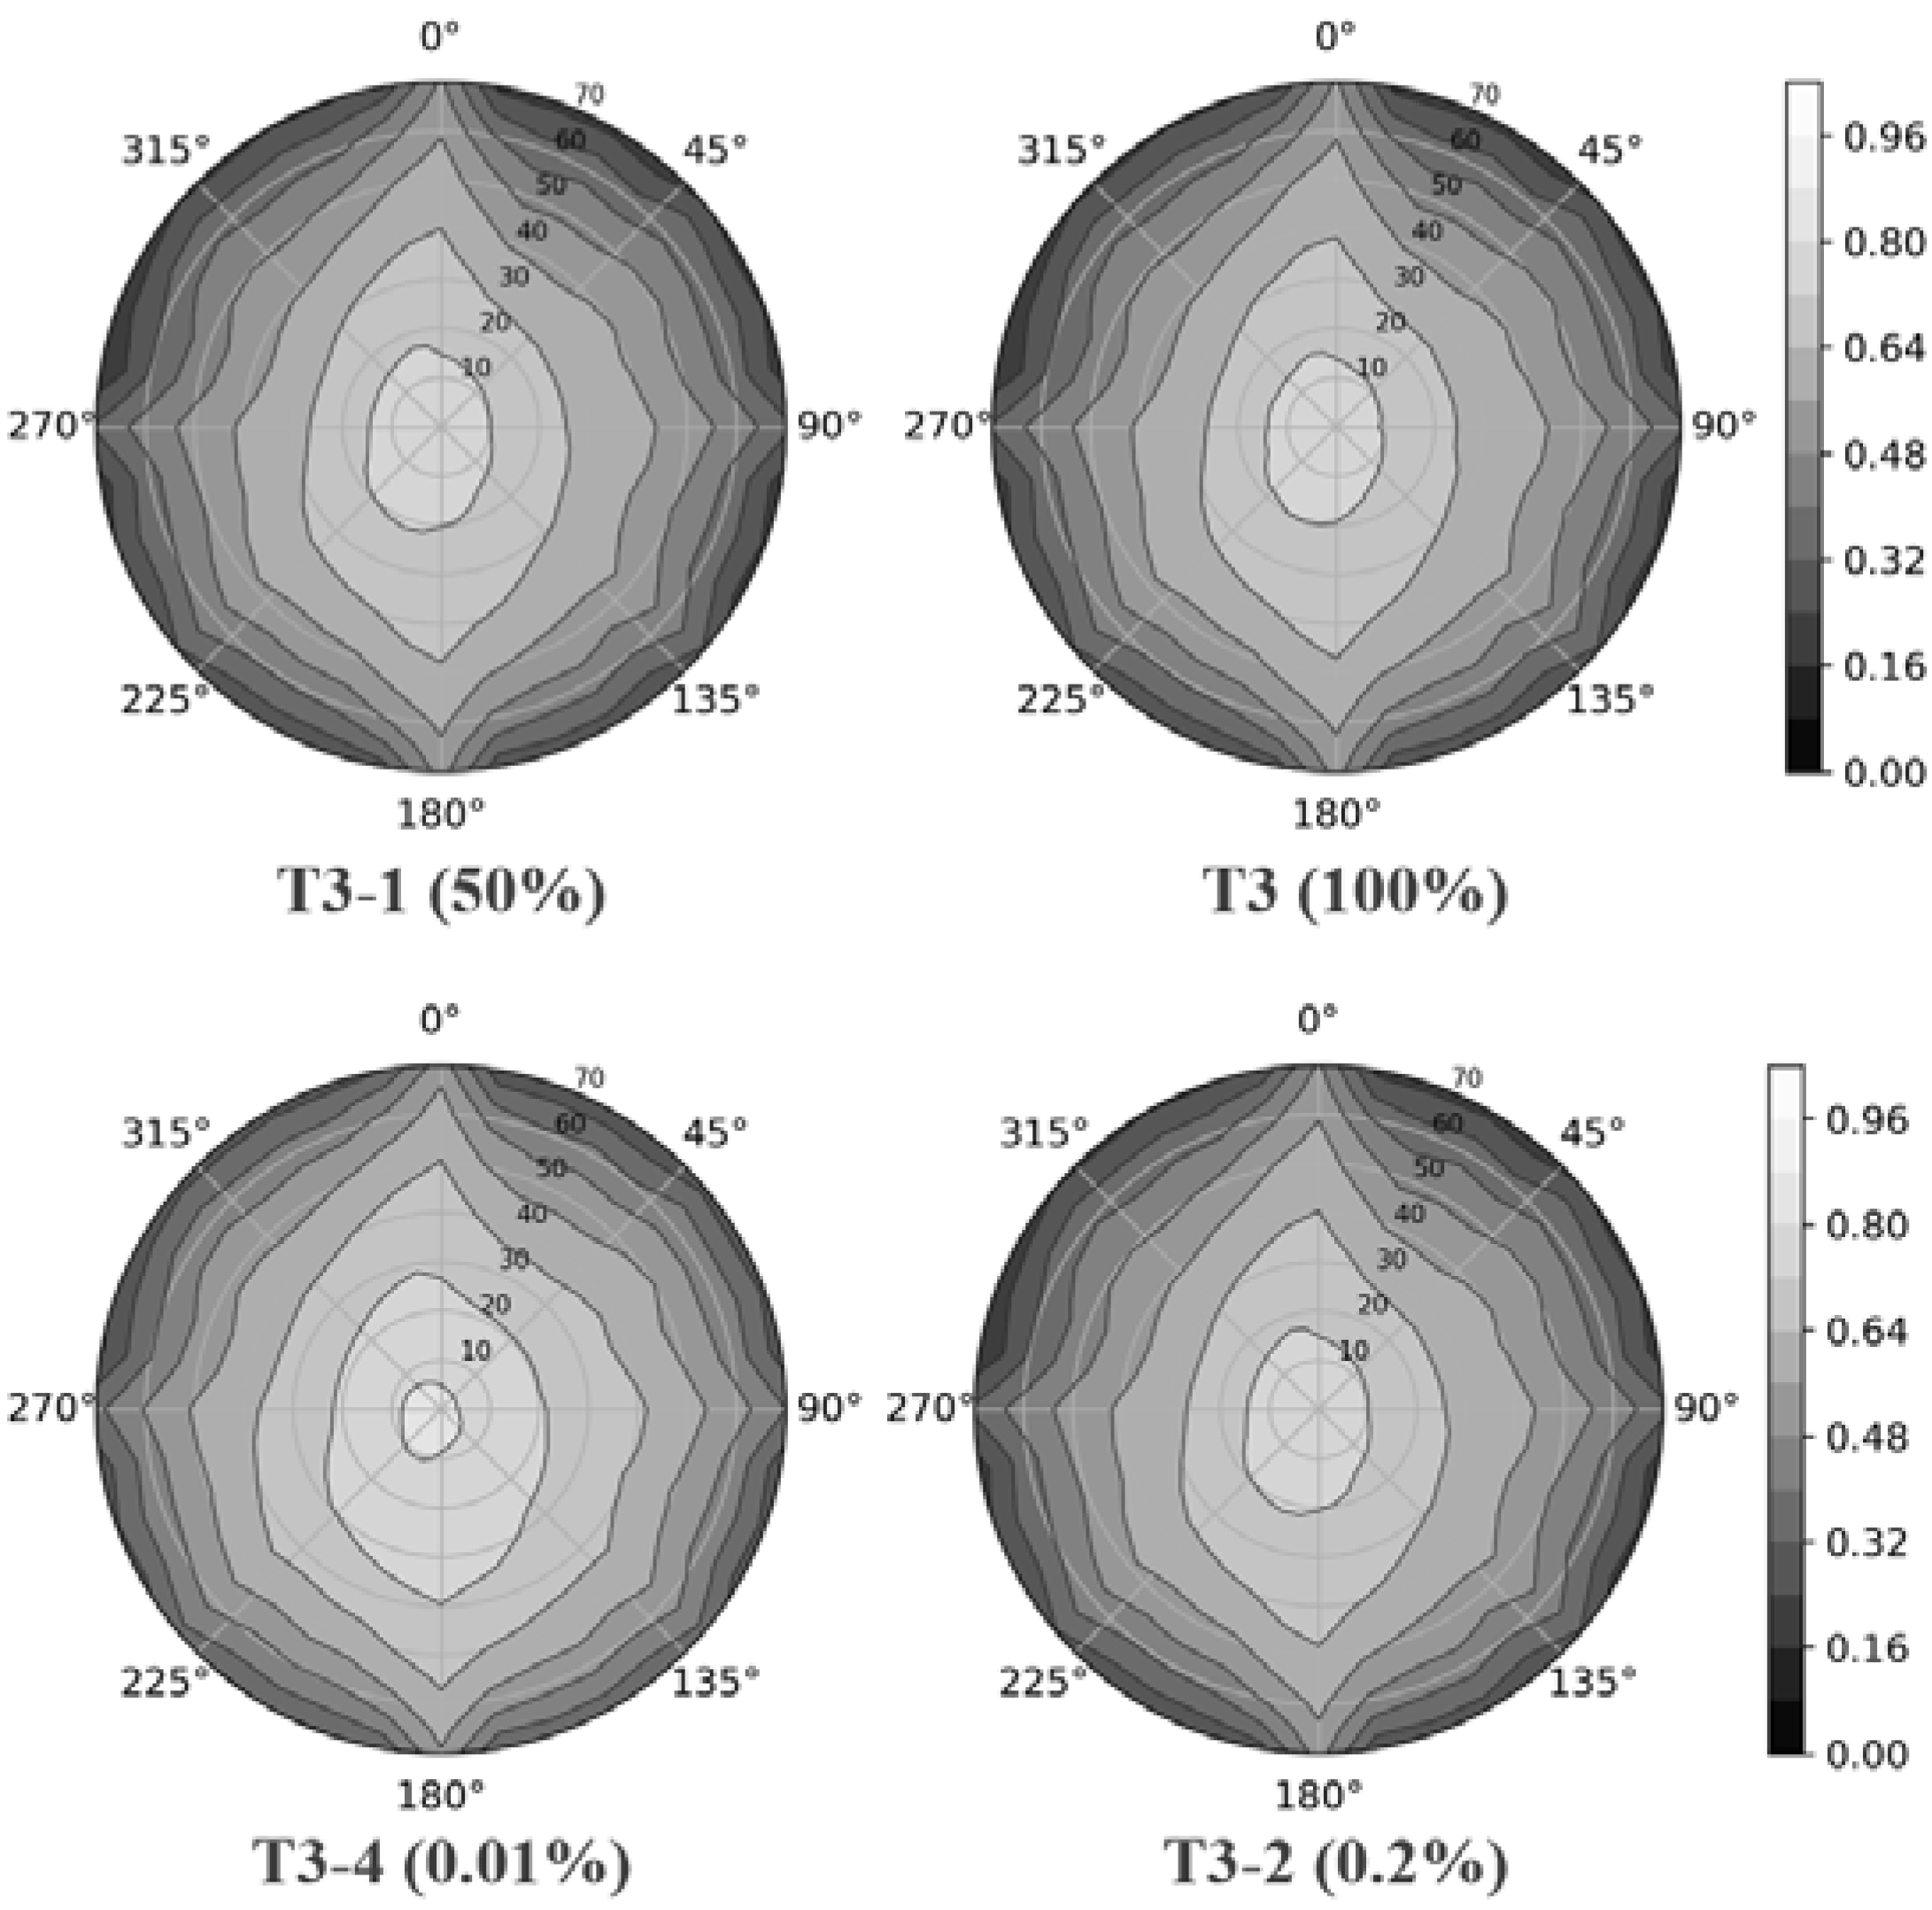
3.2. Gap Fraction and DRF
4. Results and Discussion
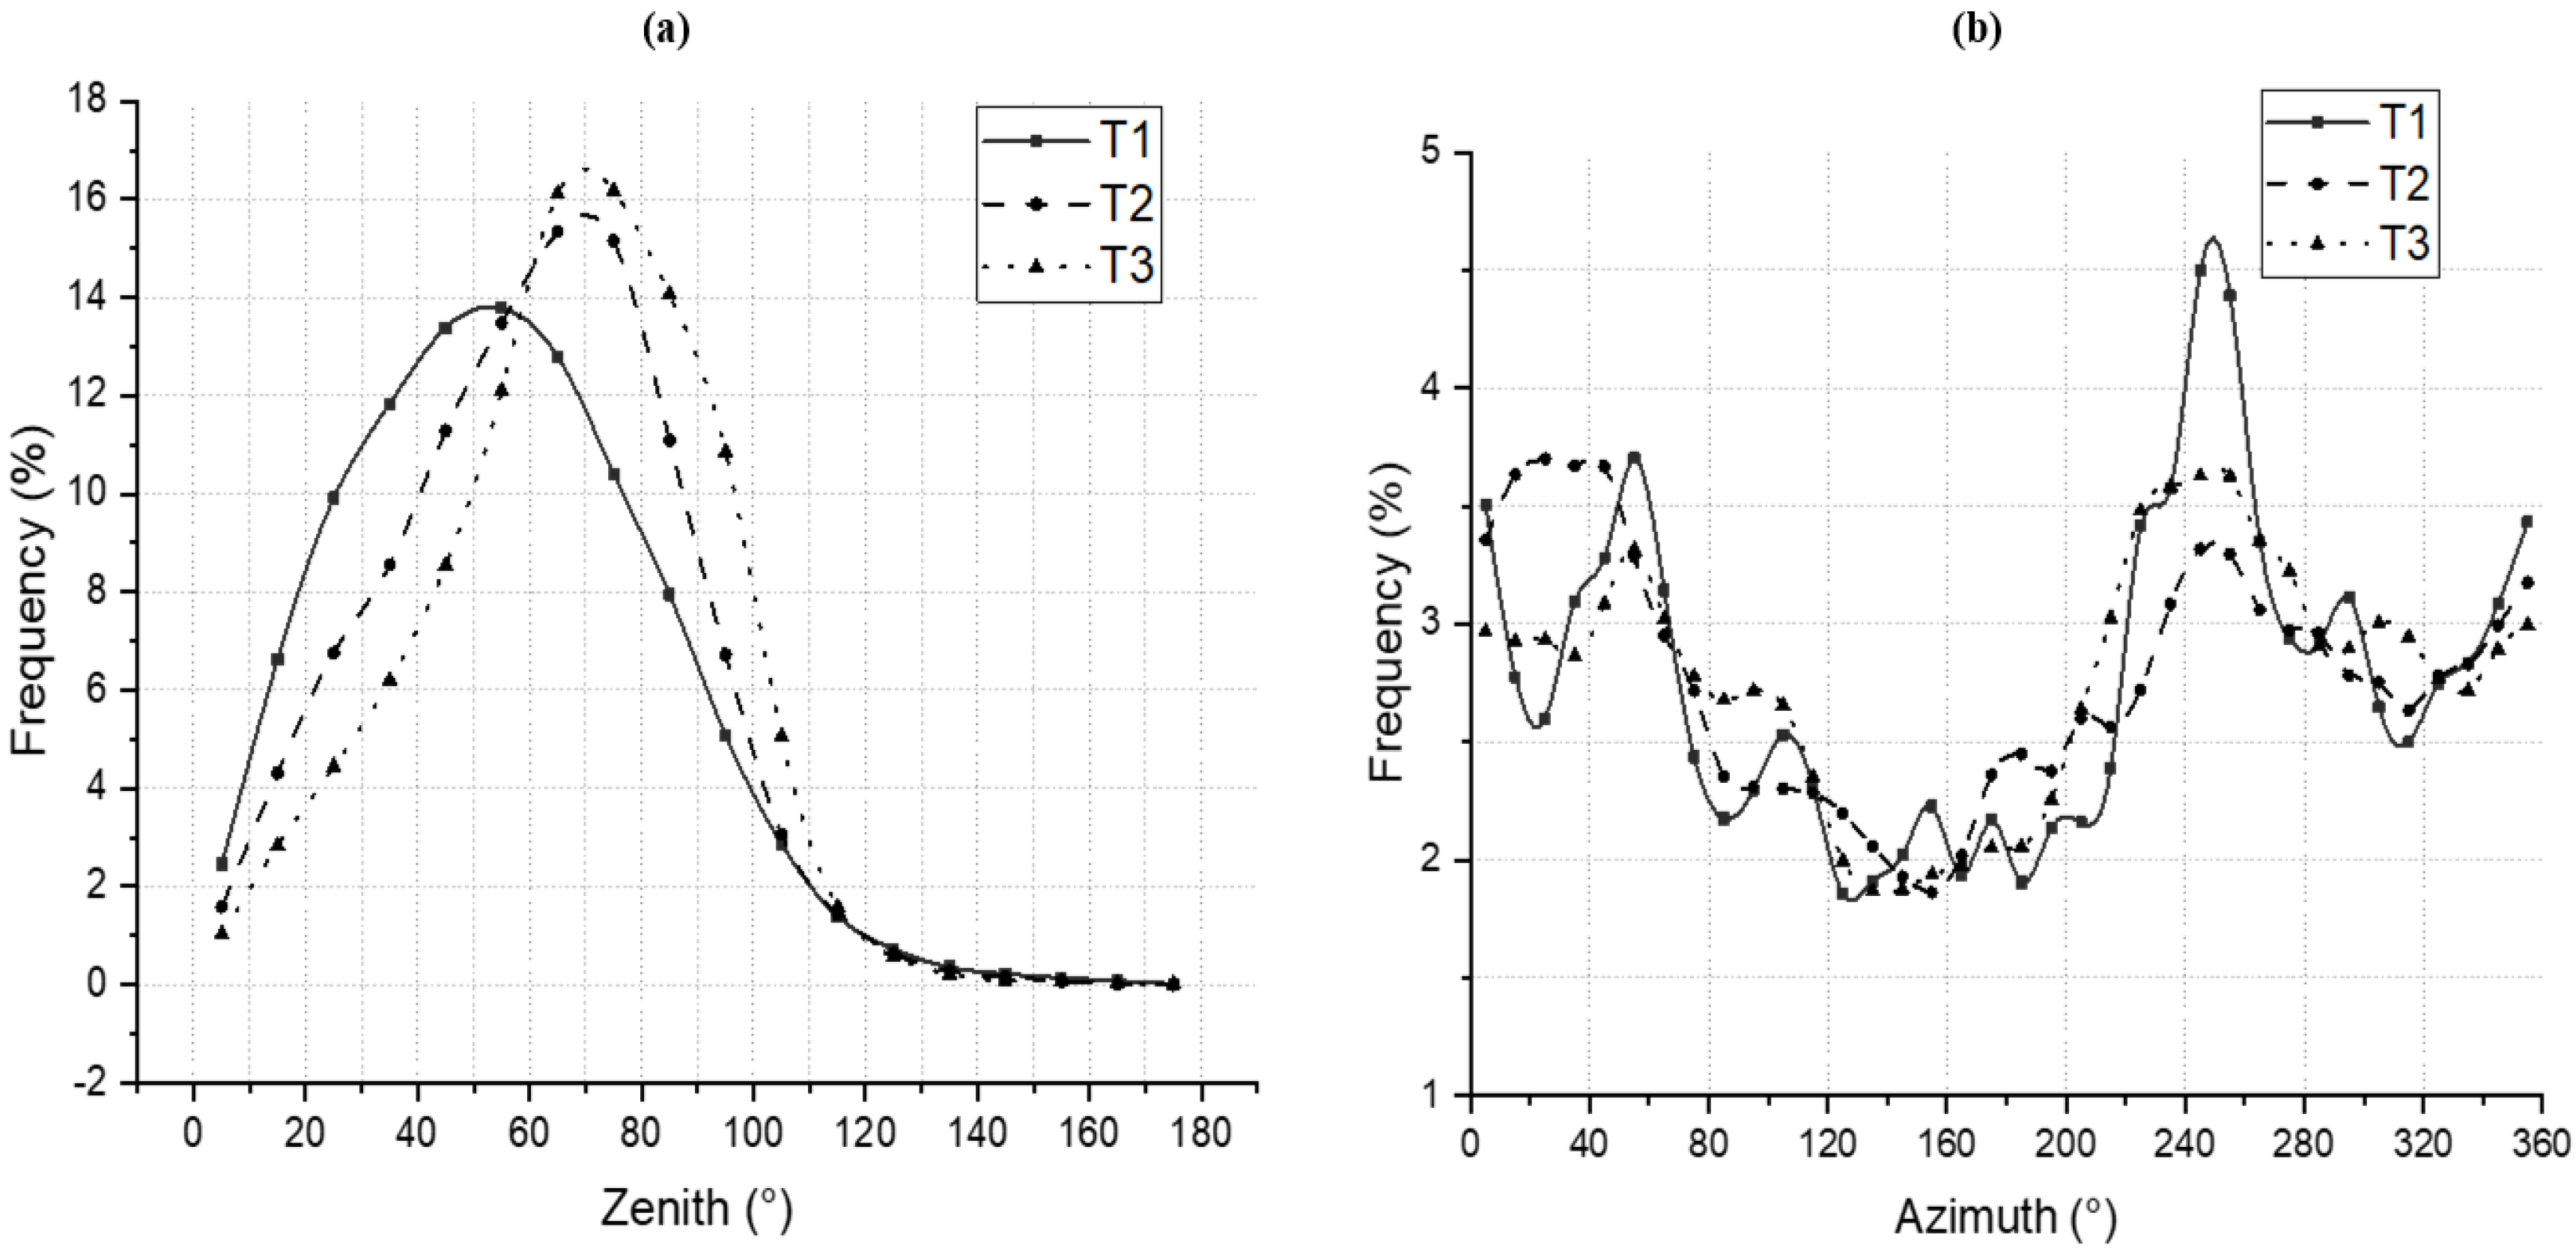
4.1. LAD
4.2. LAI
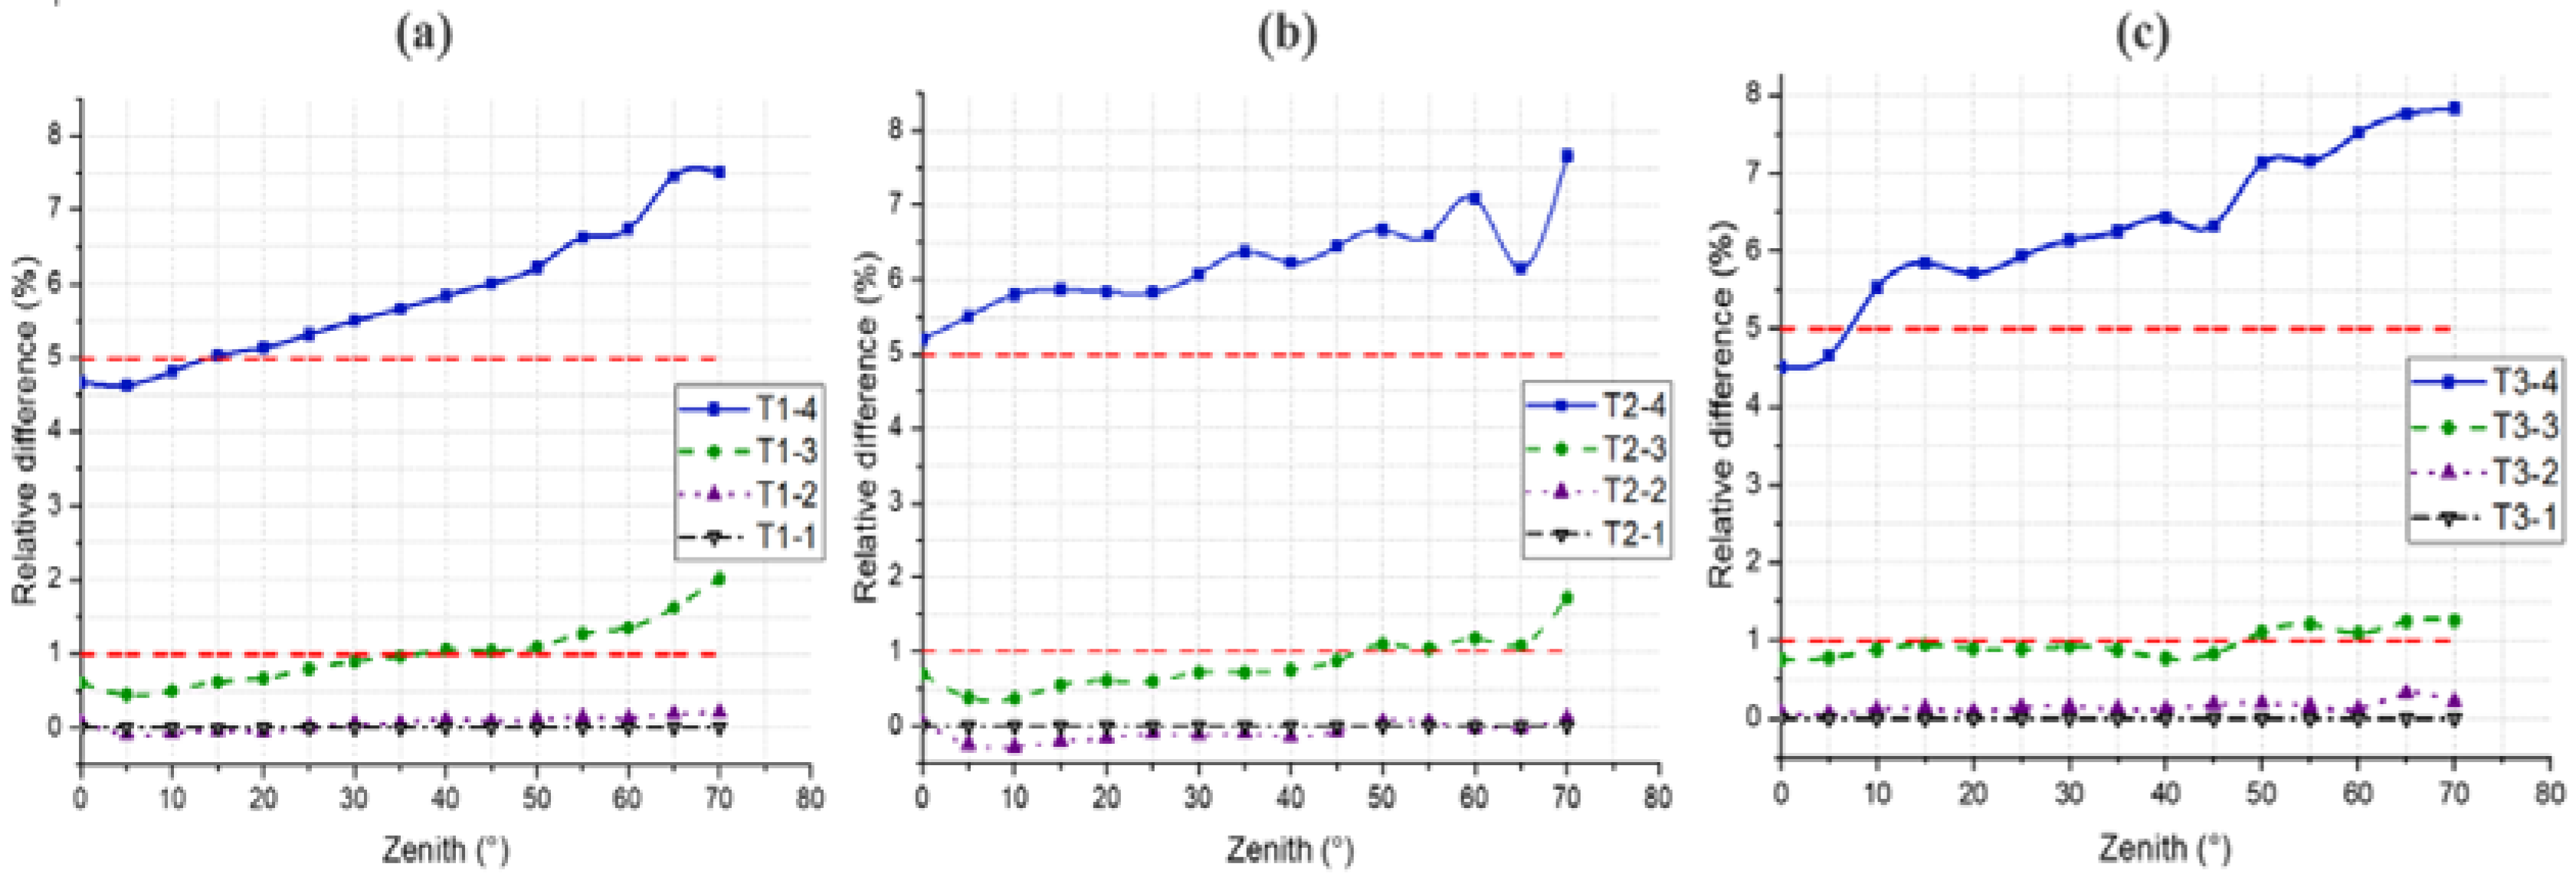
4.3. Gap Fraction
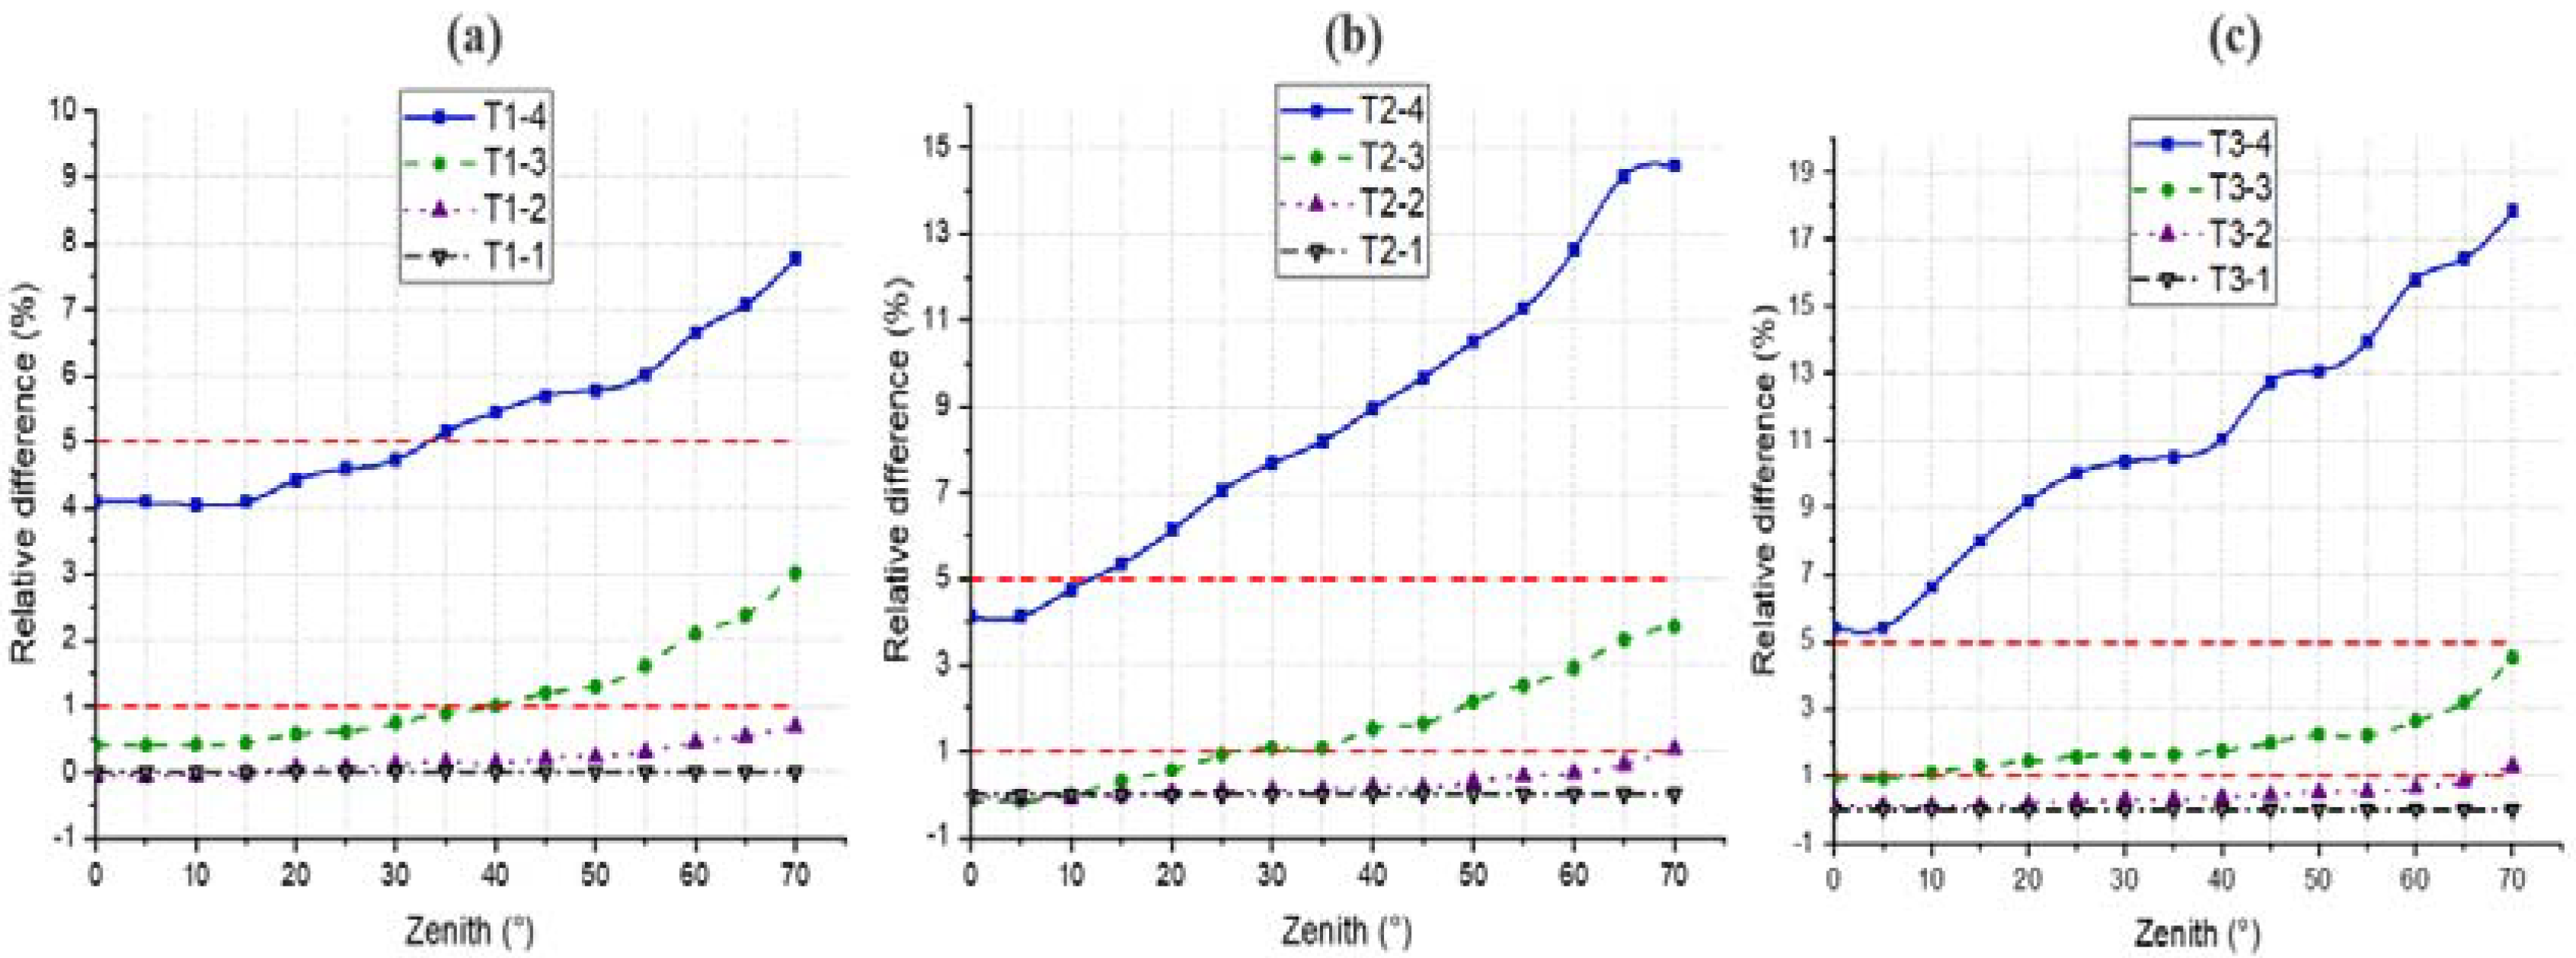
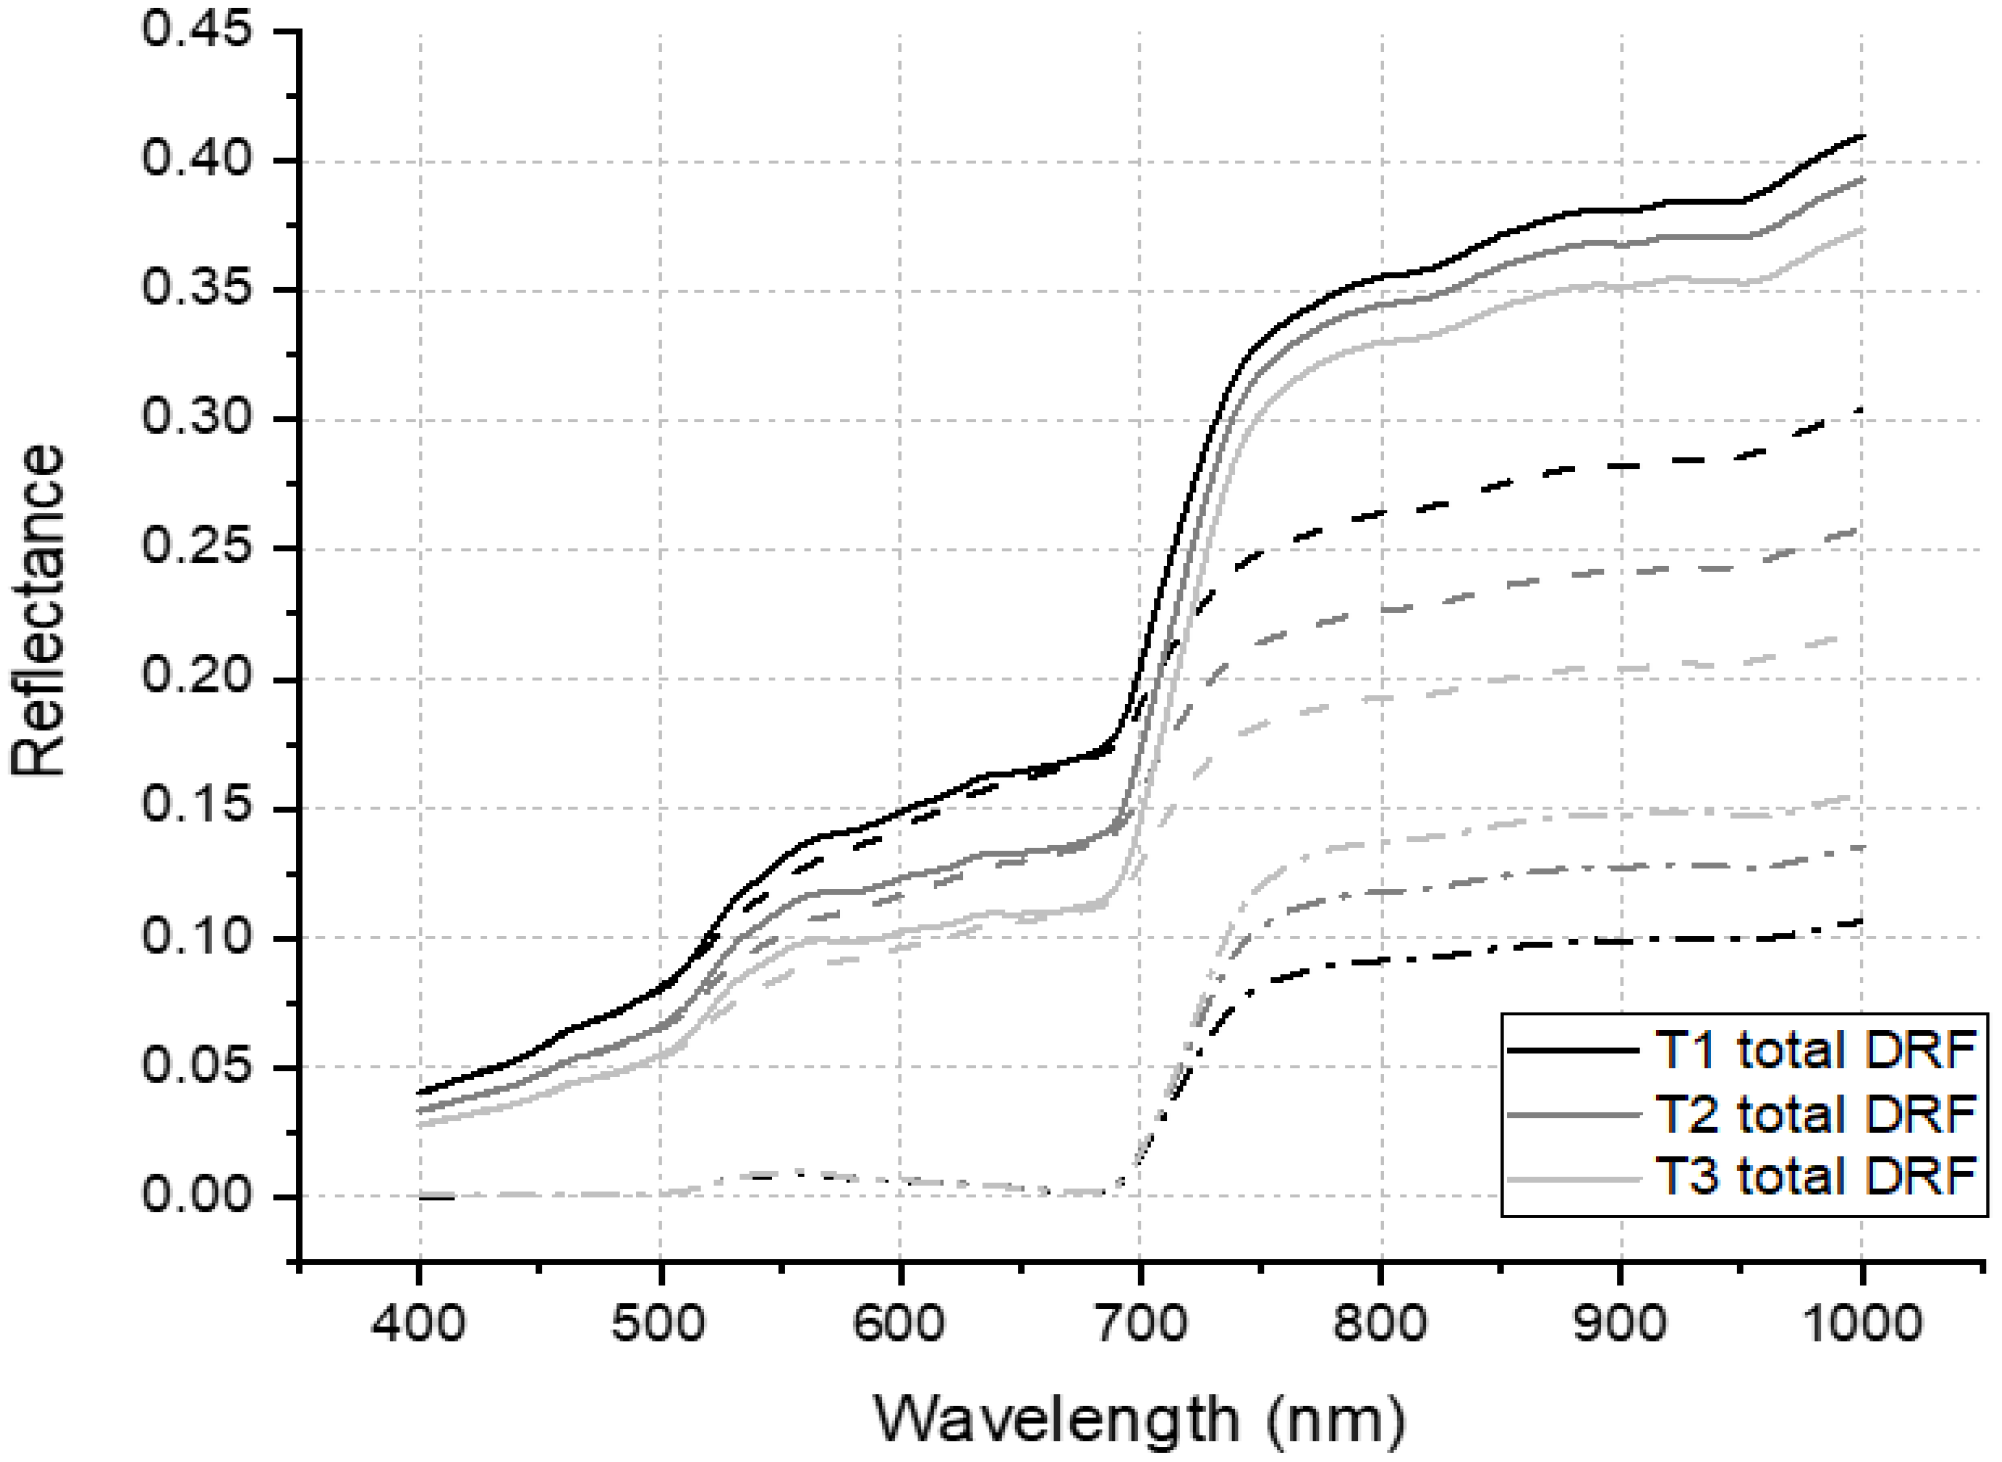
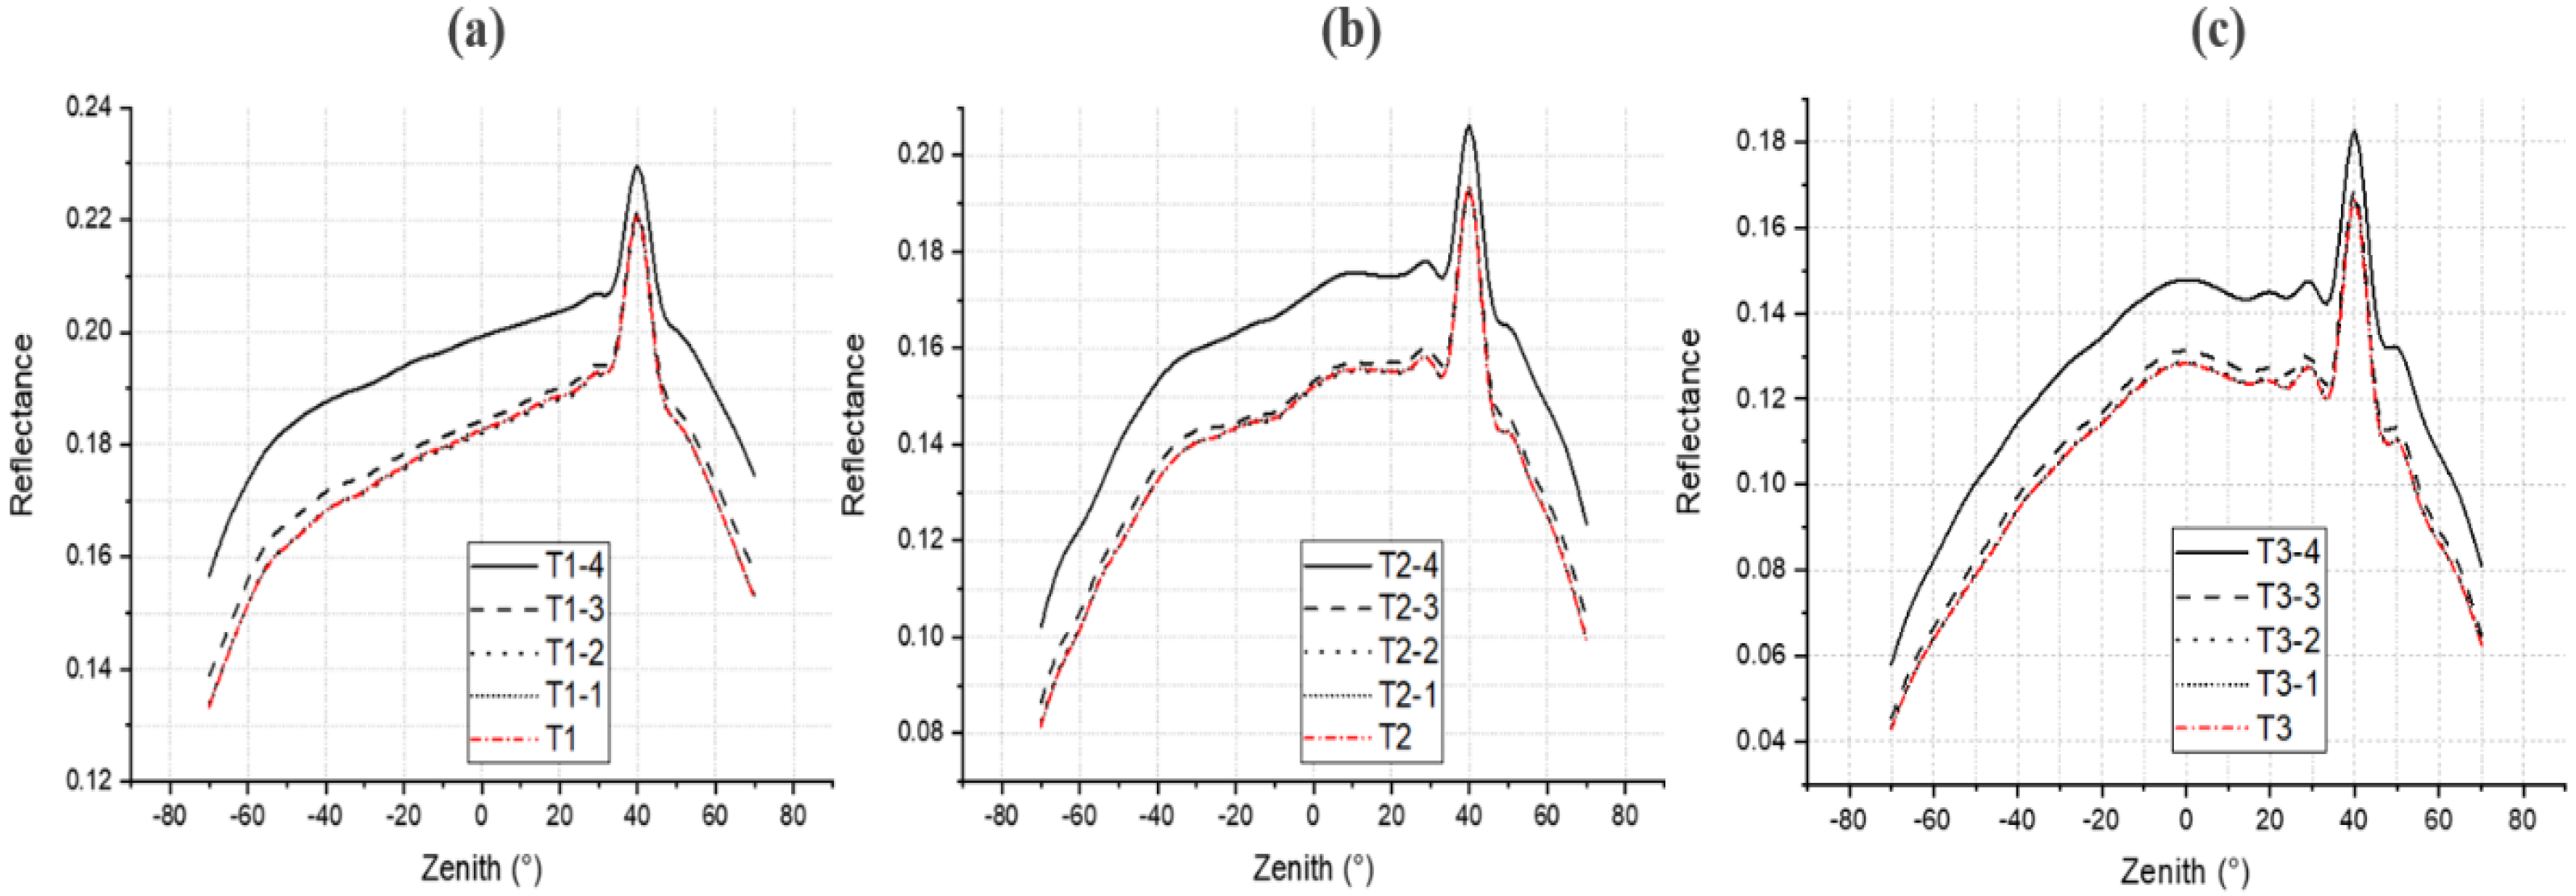
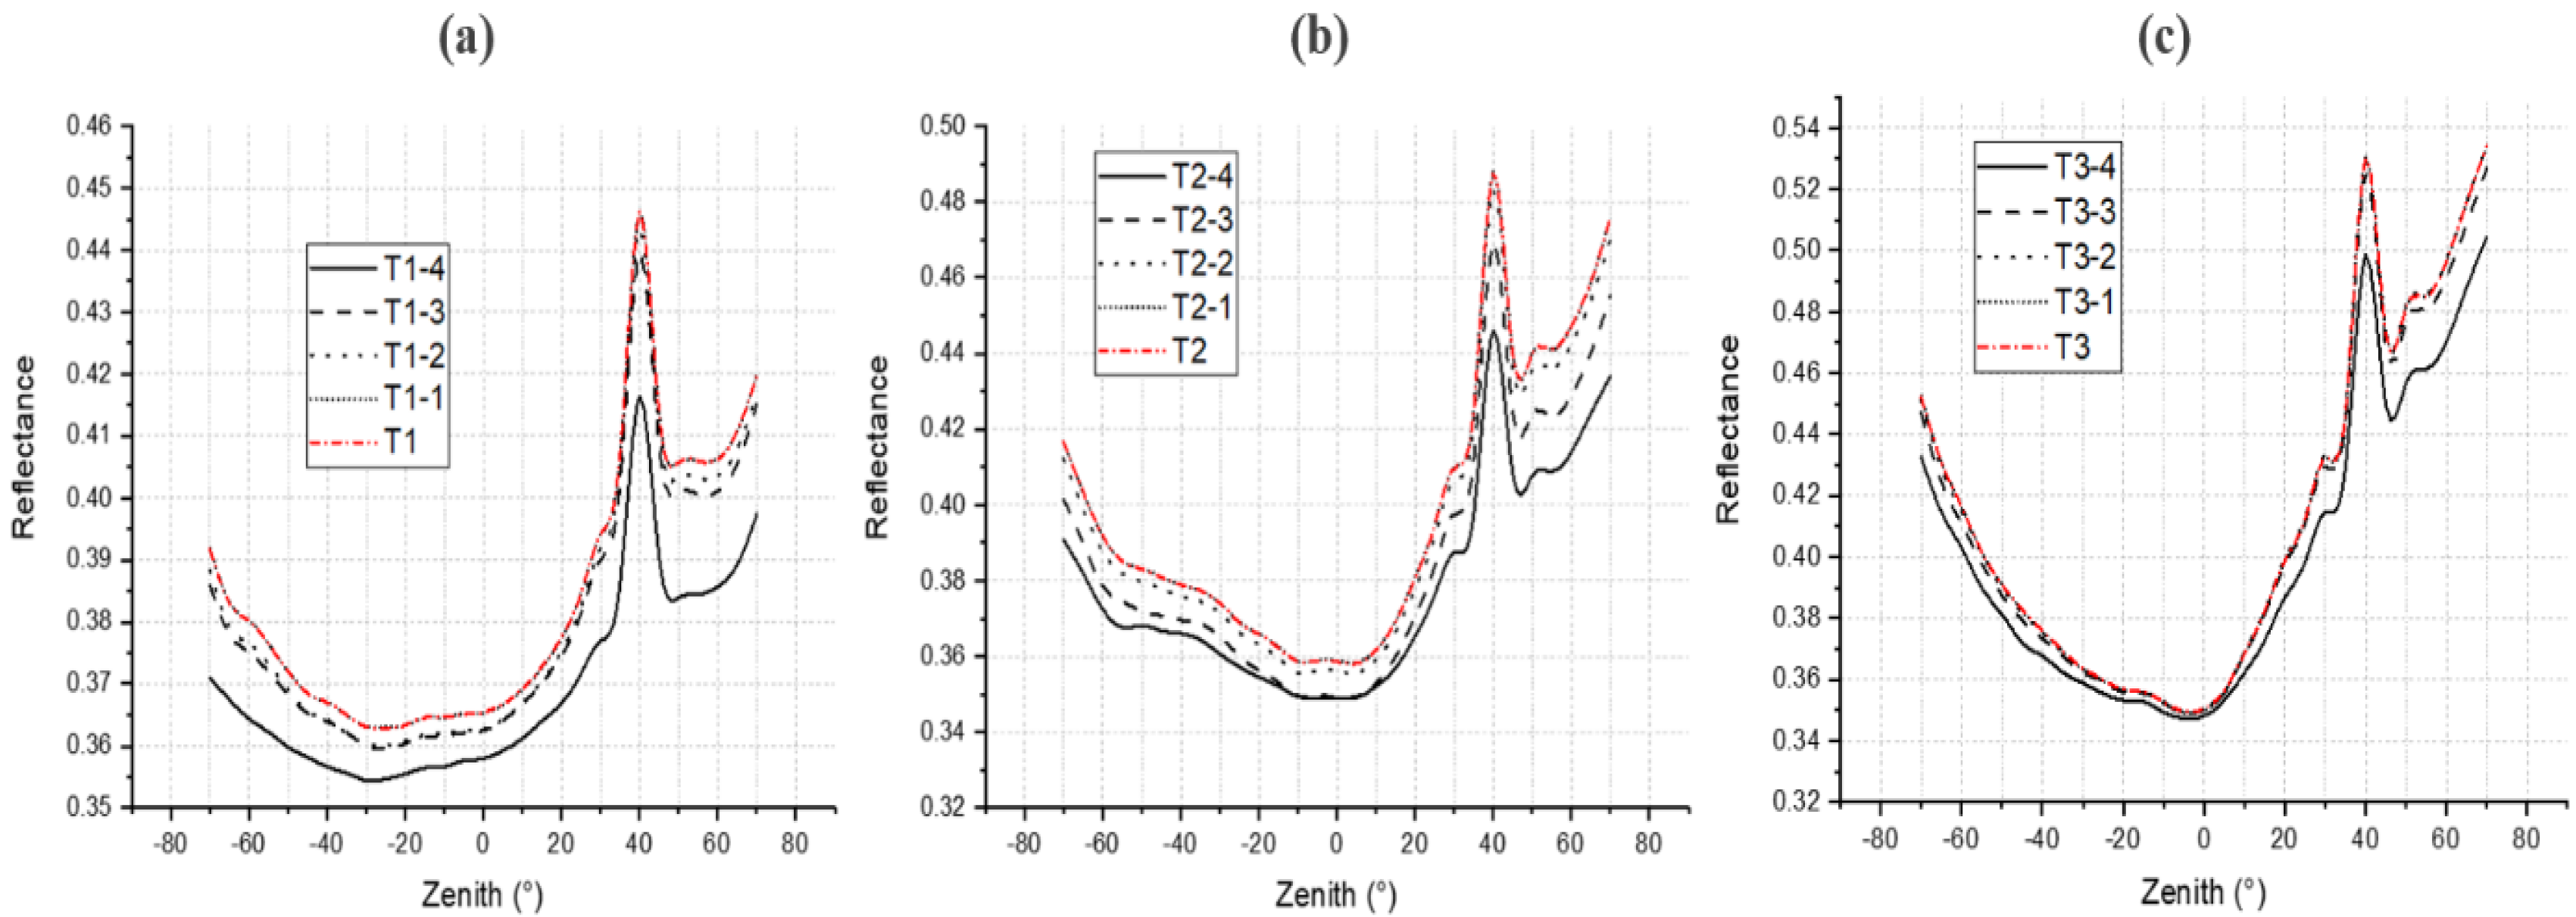
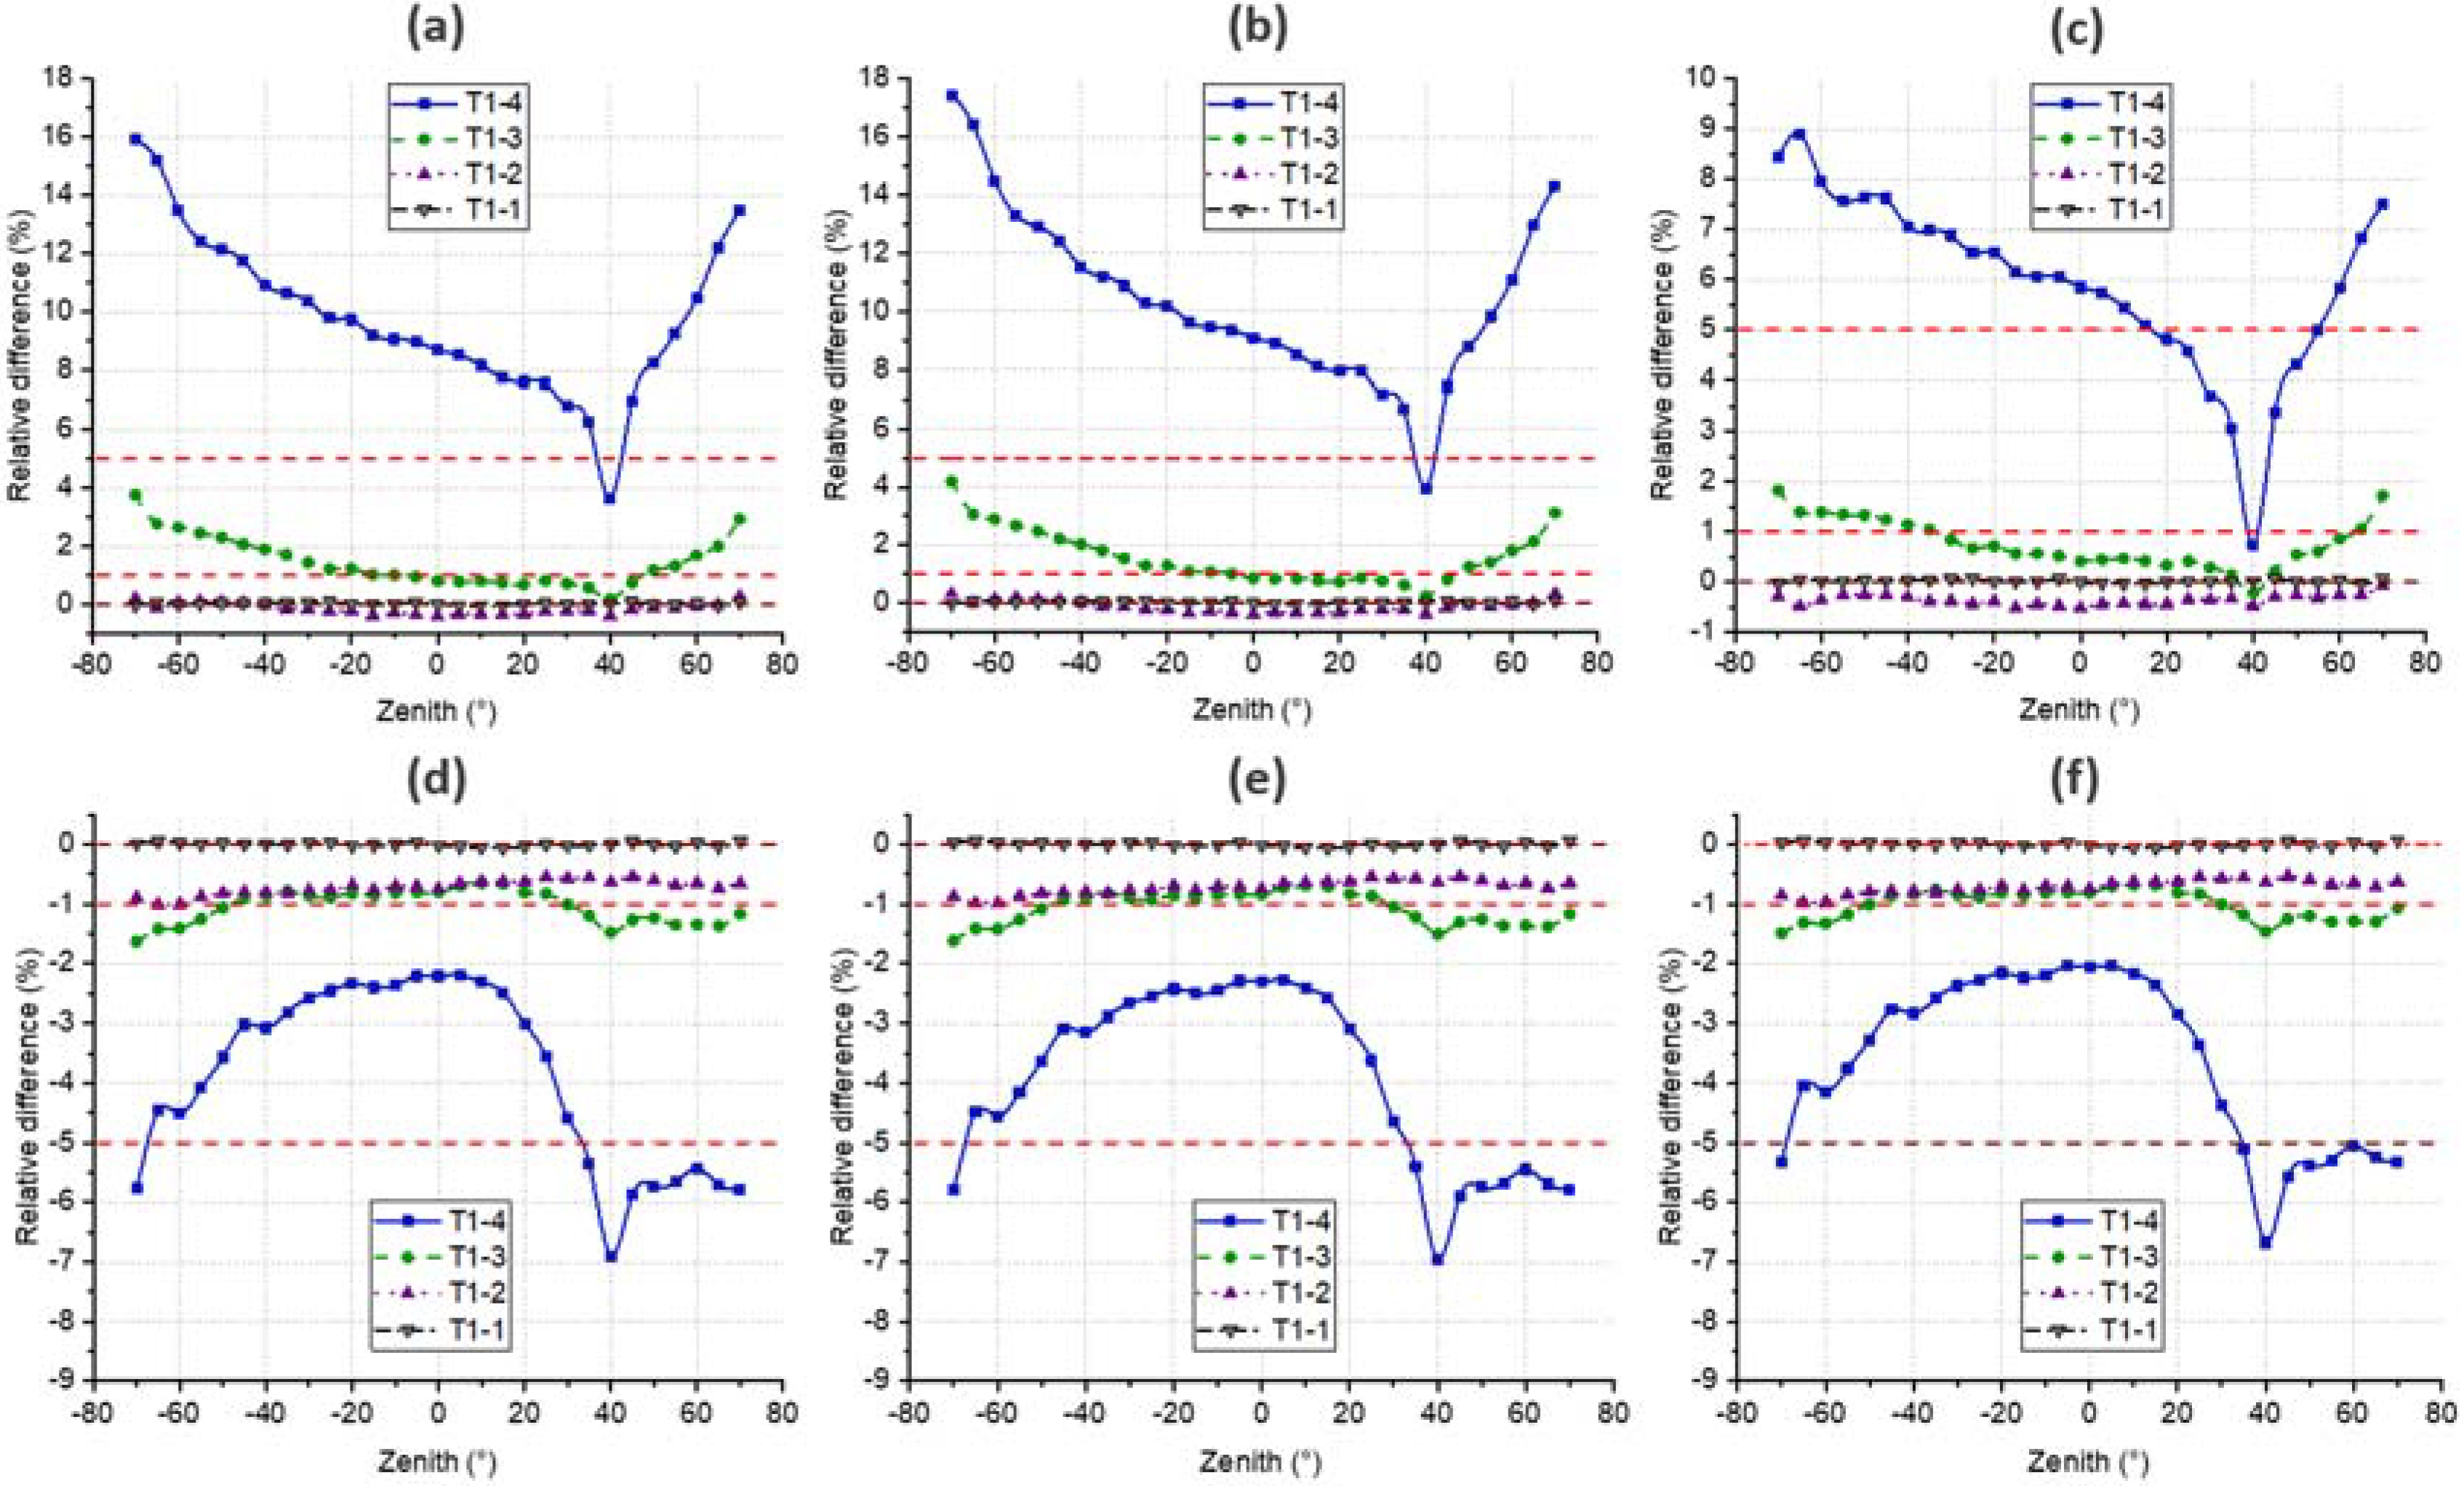
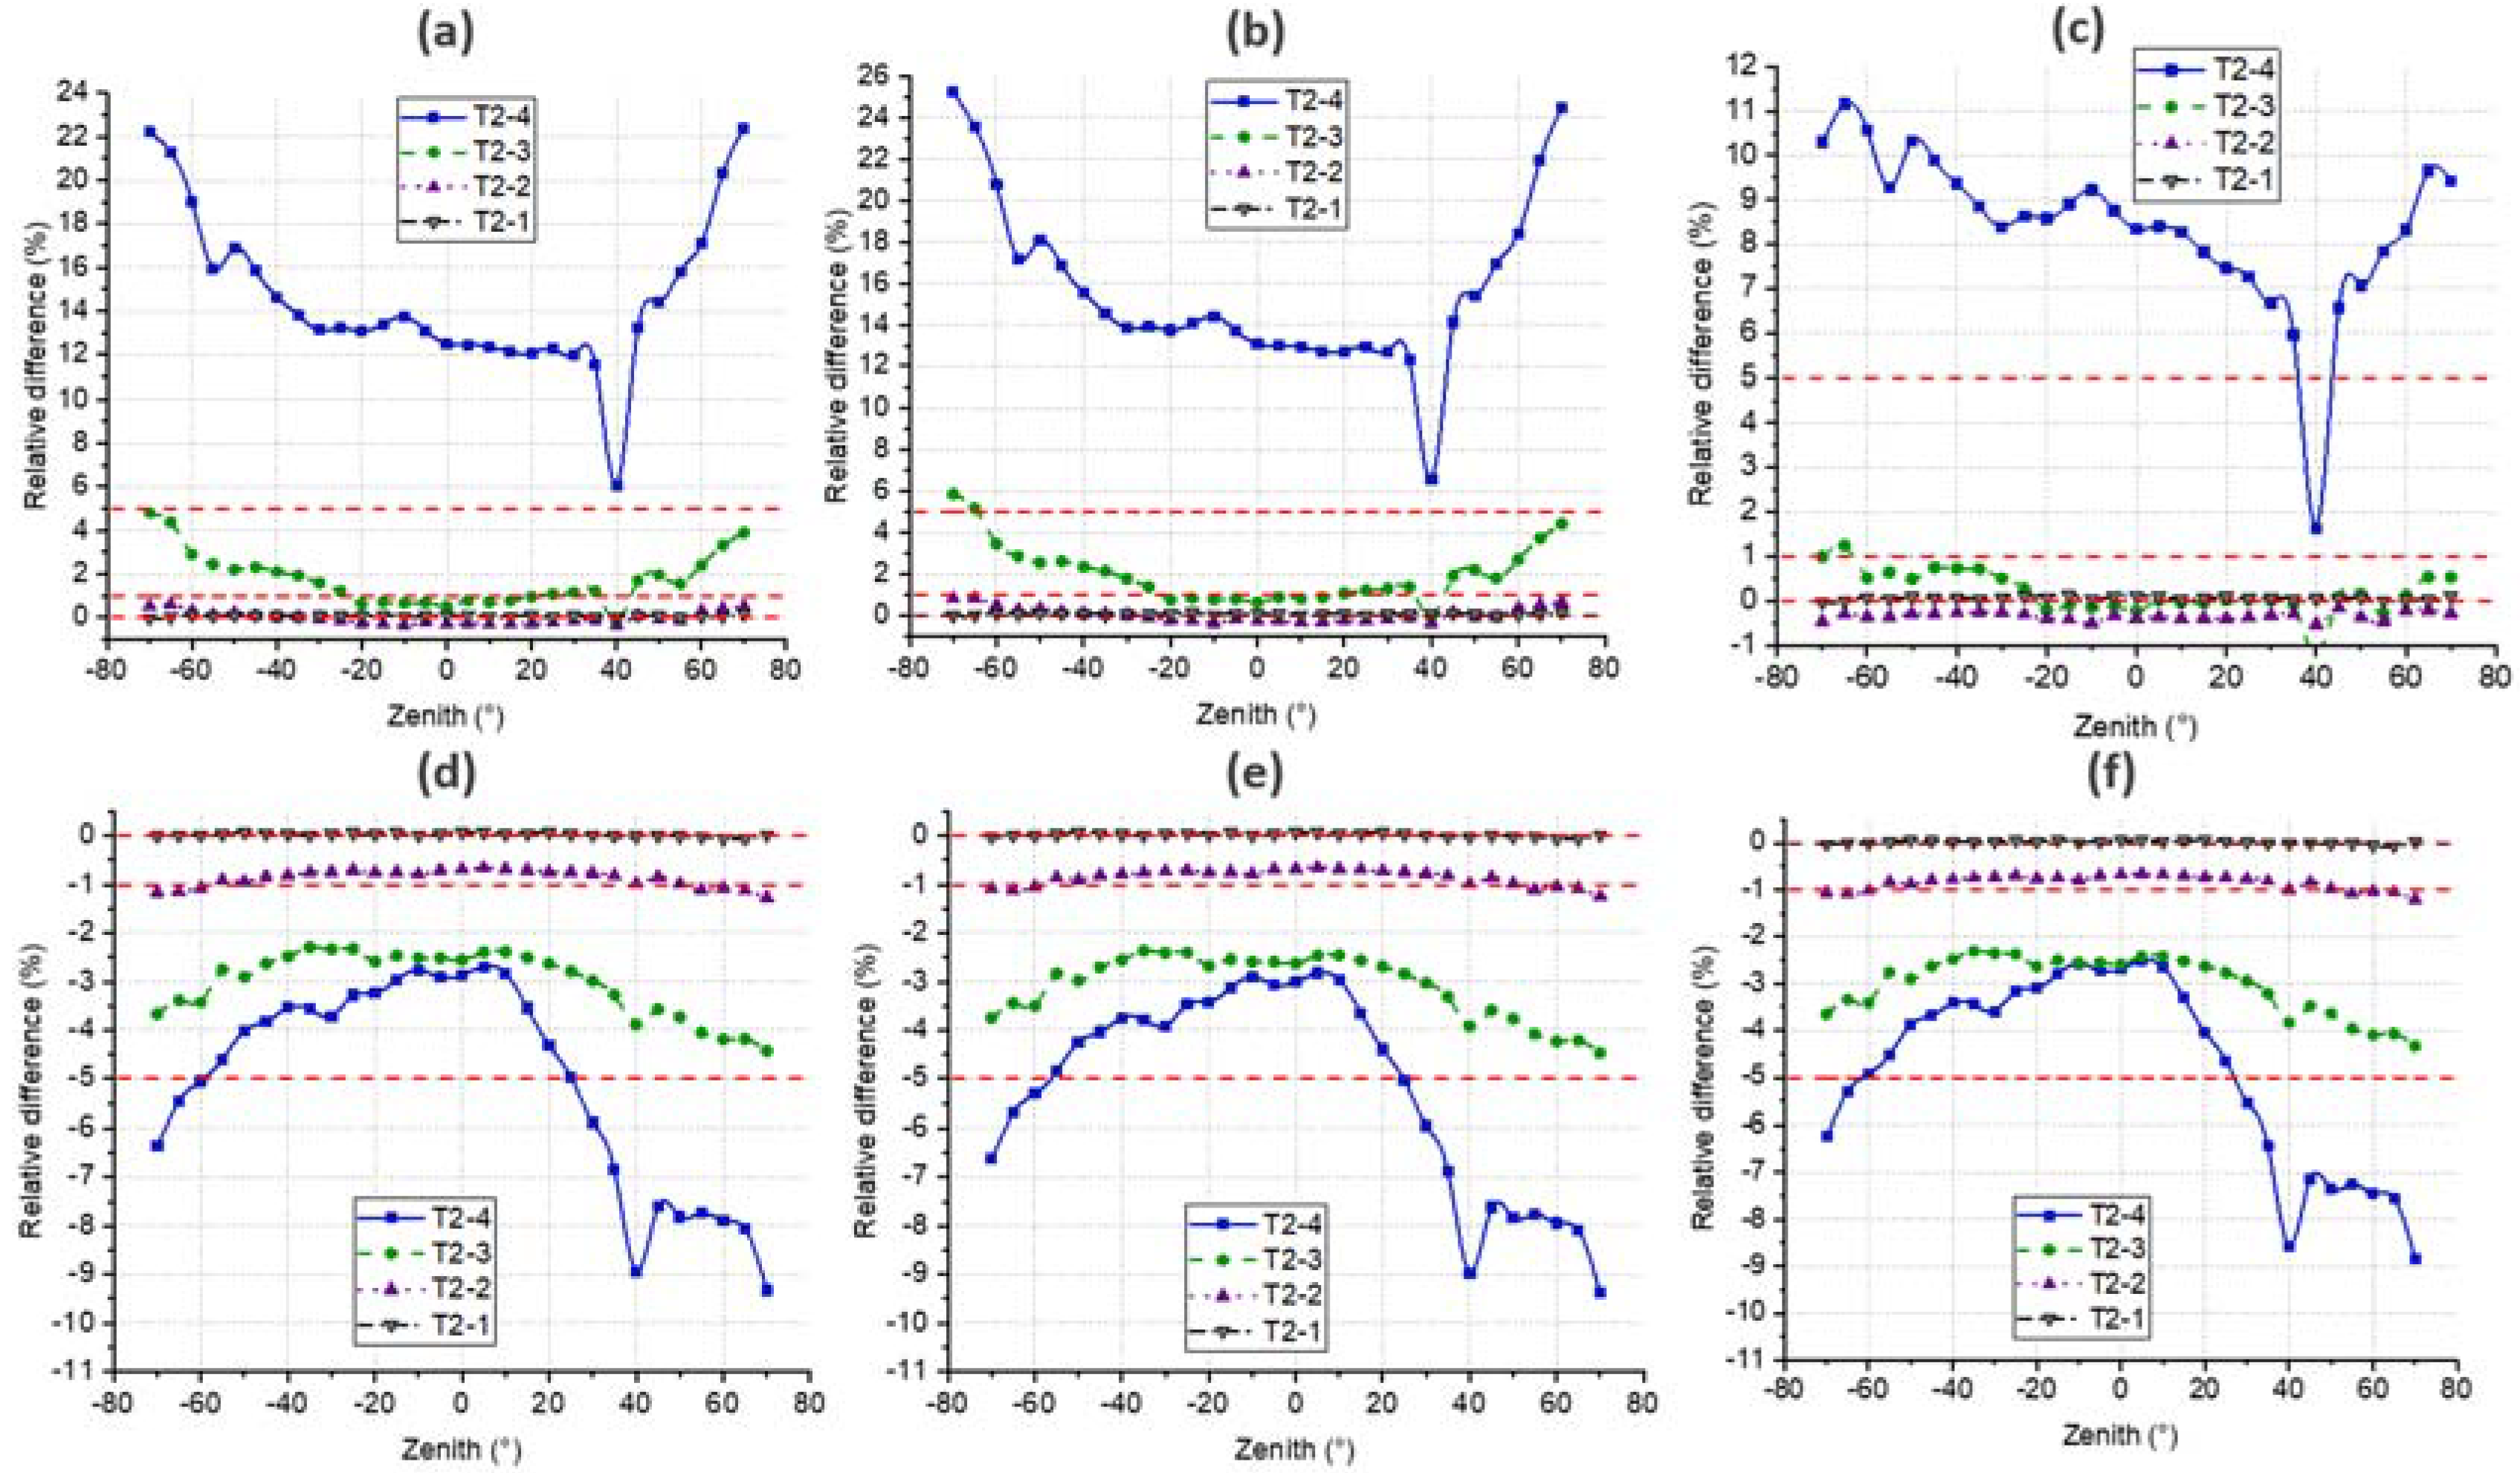
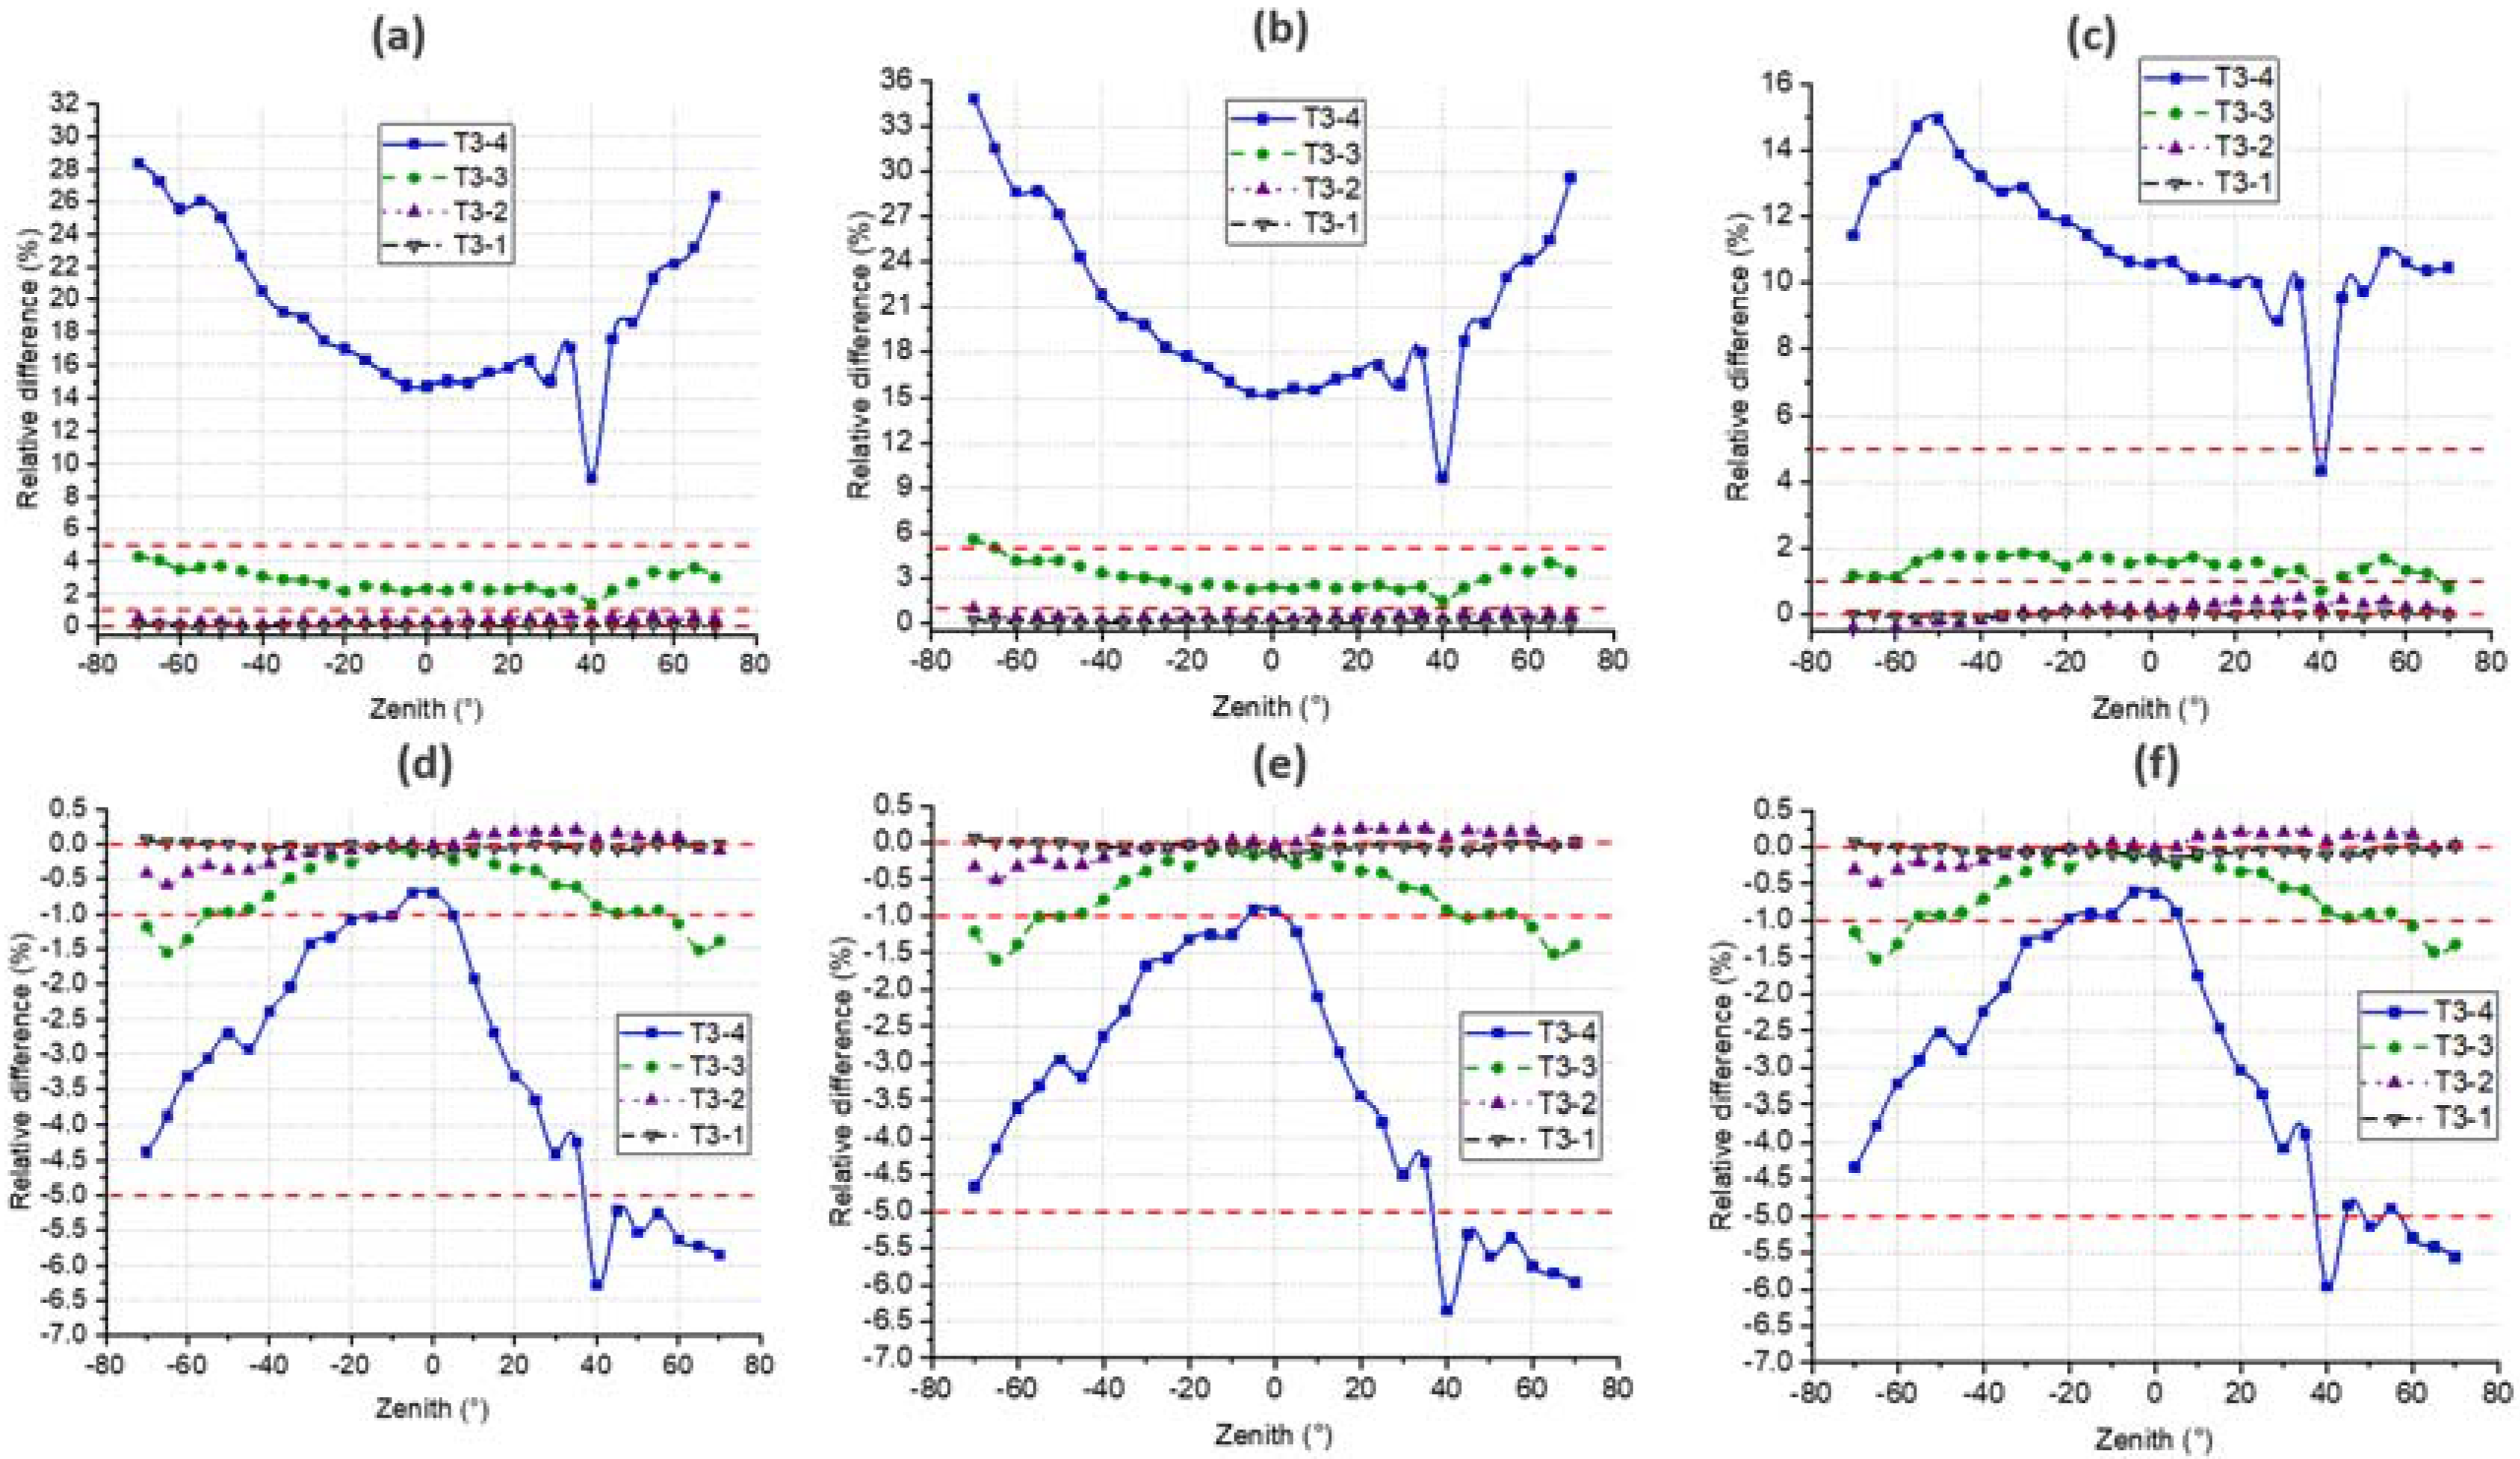
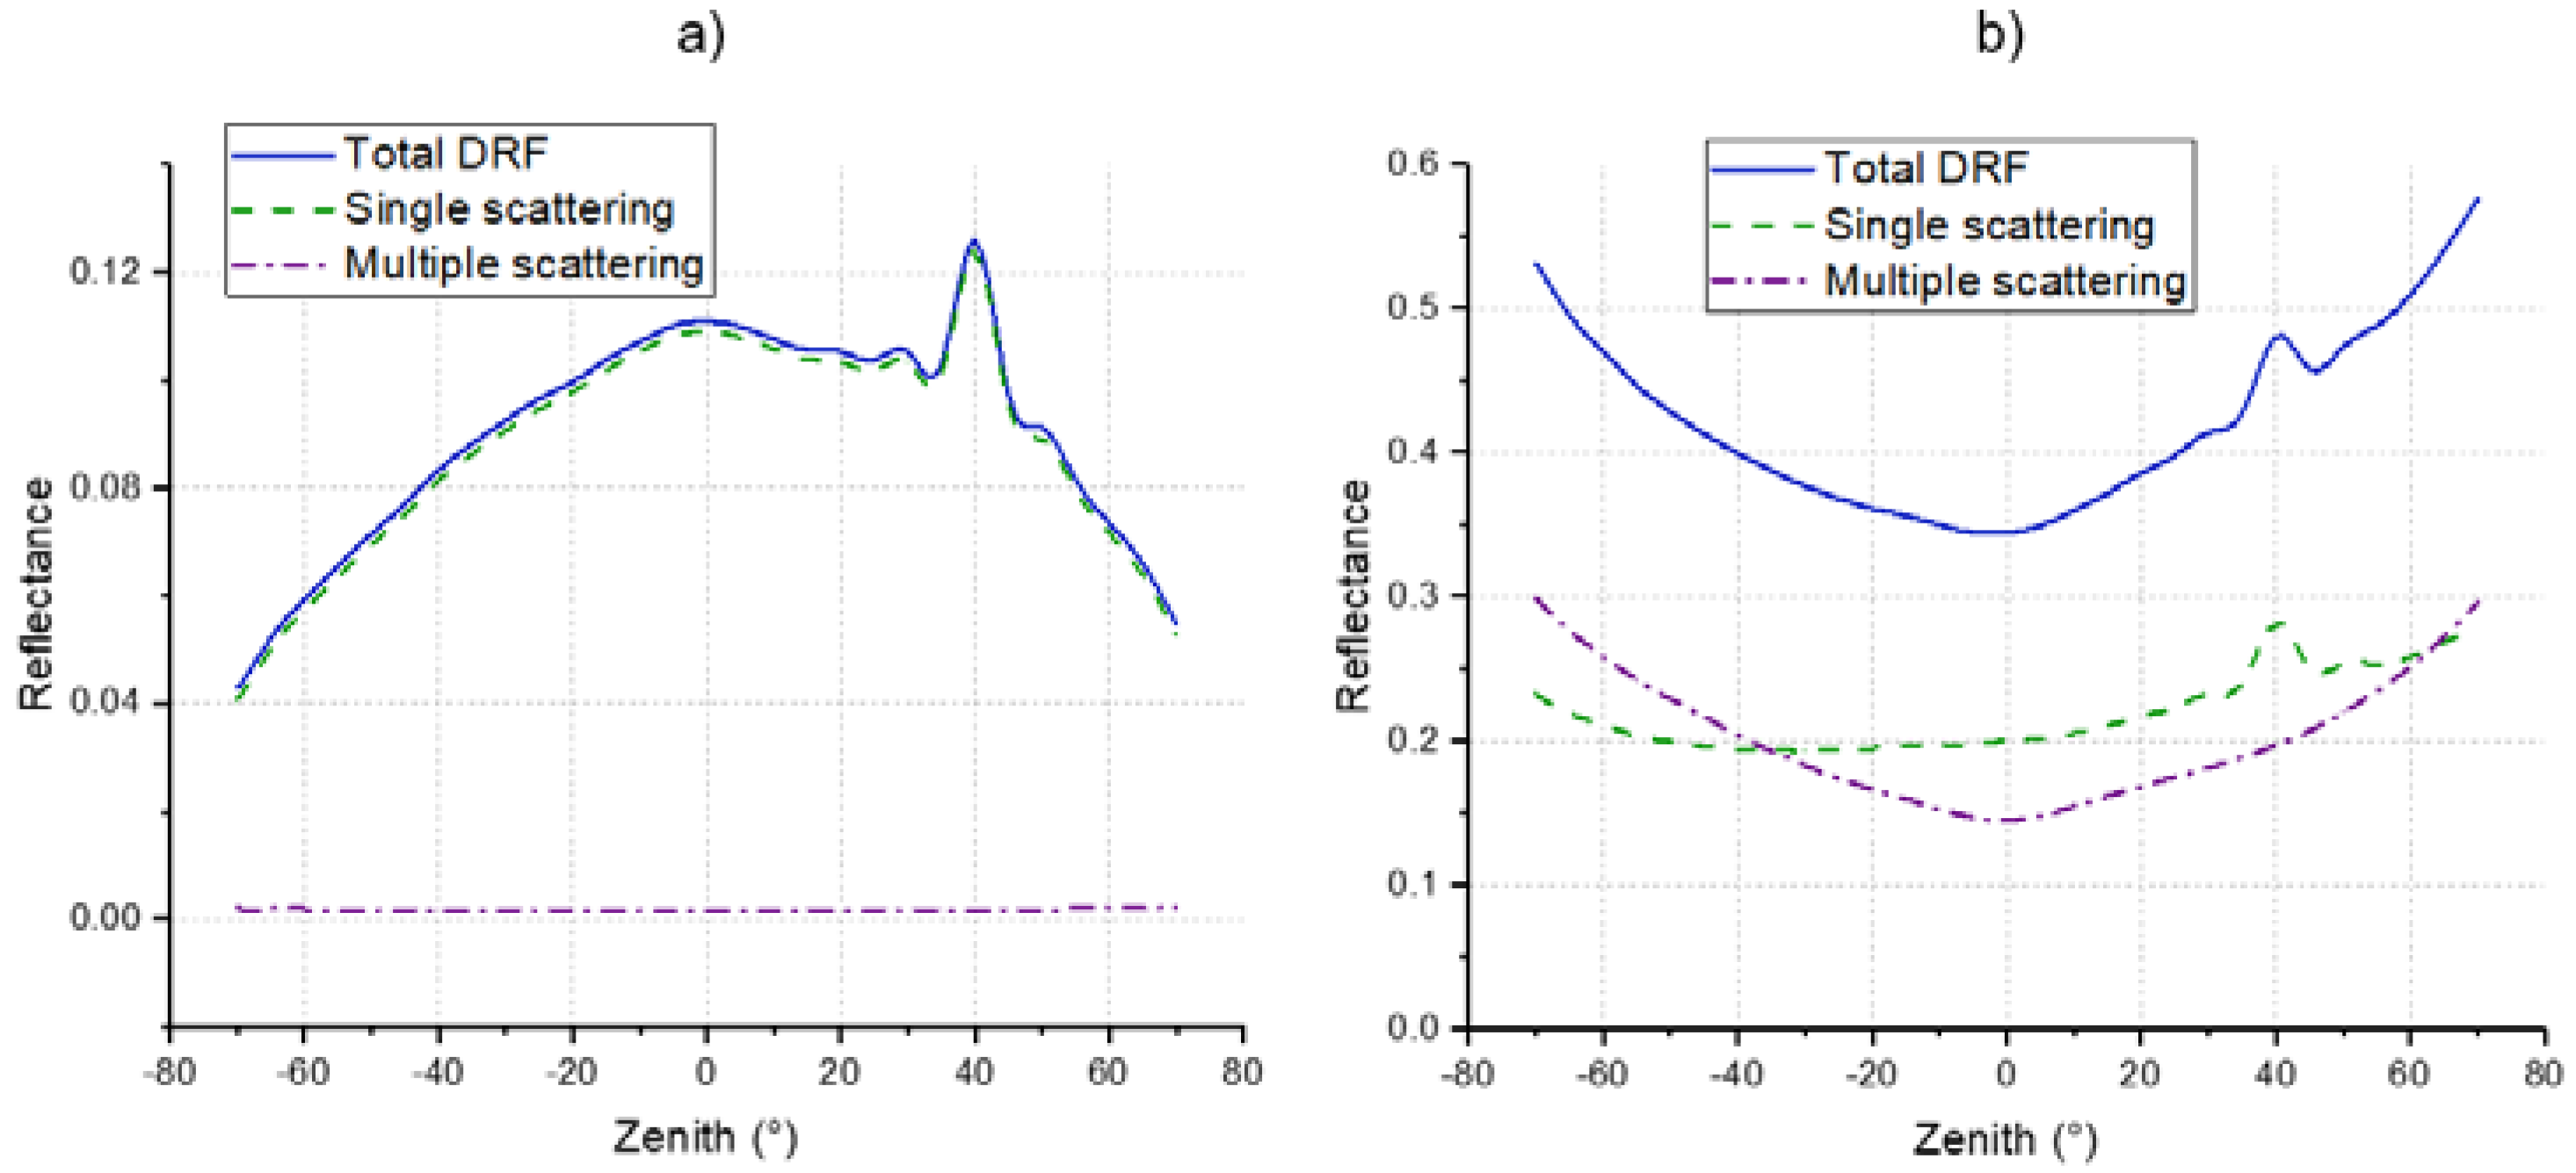
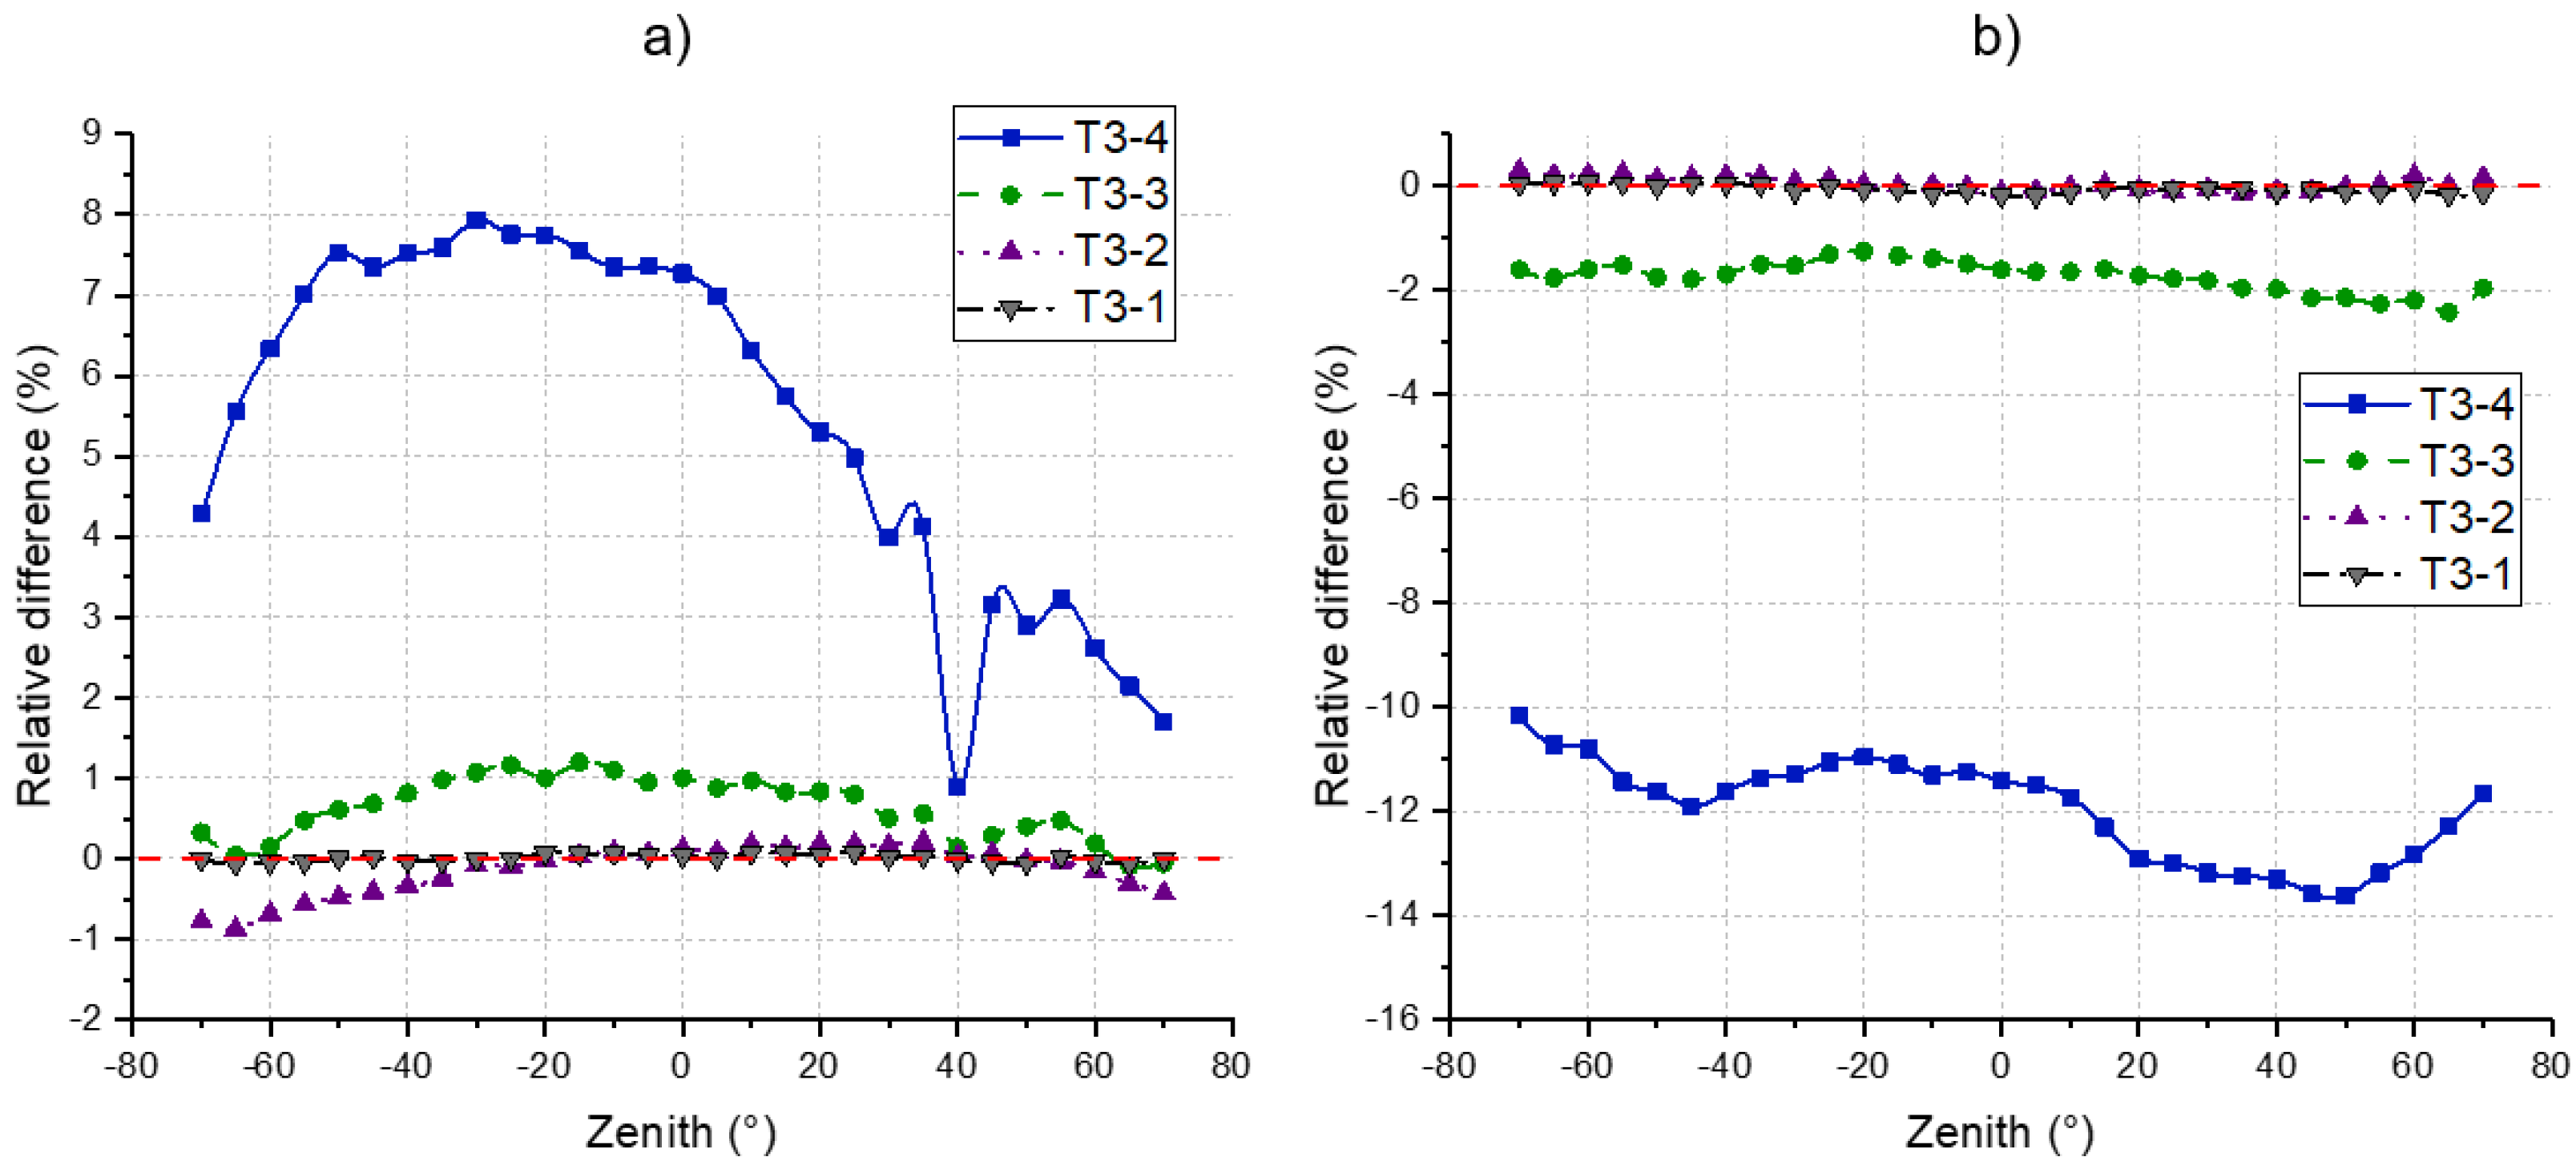
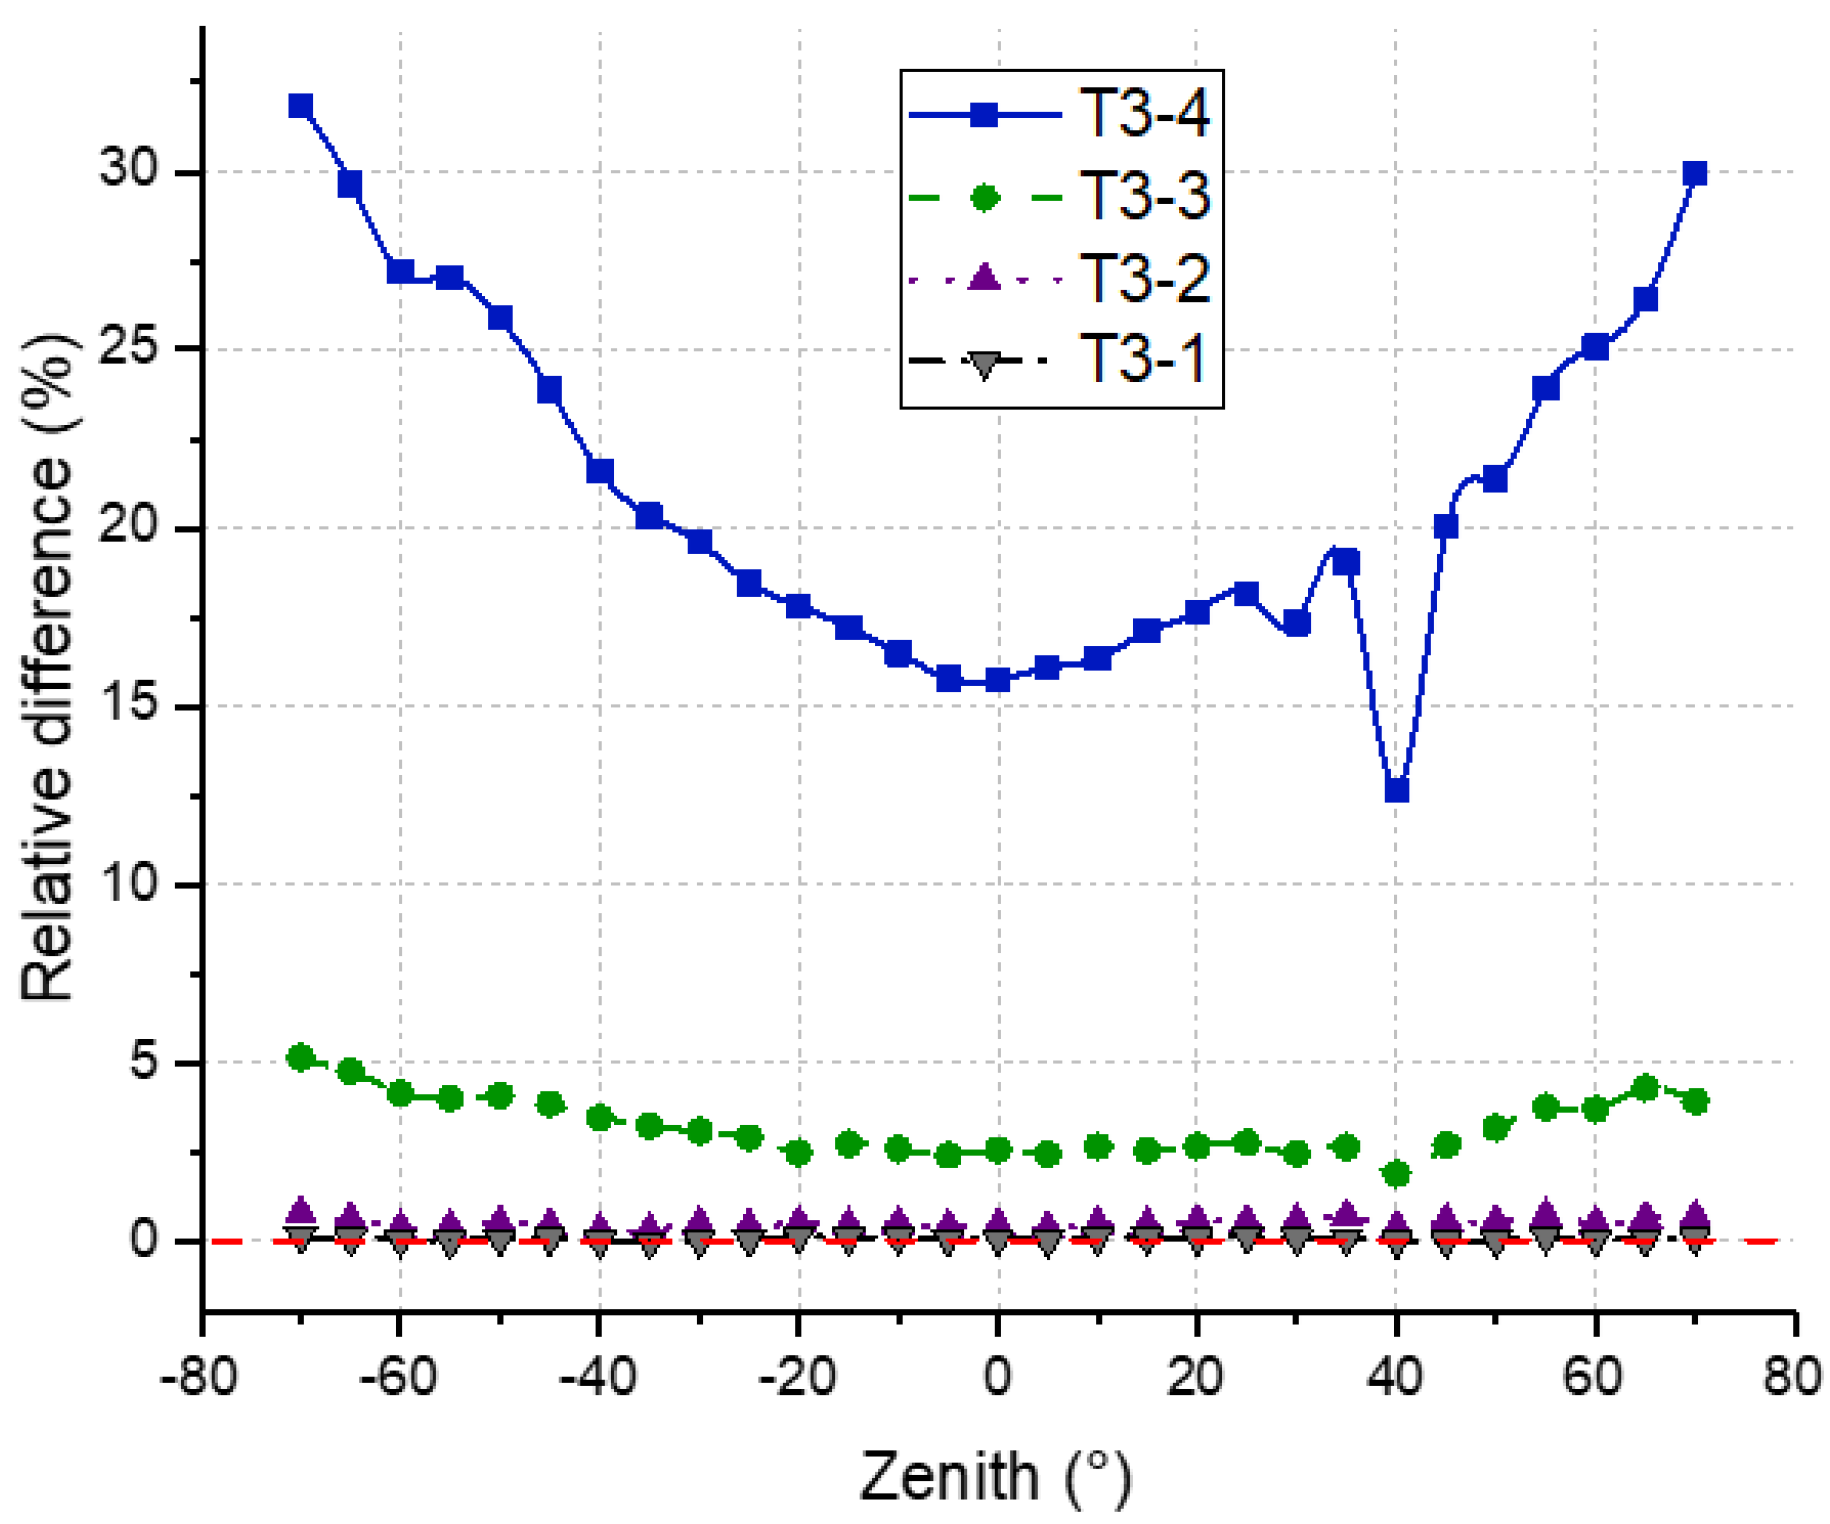
4.4. DRF
5. Conclusions
Author Contributions
Funding
Institutional Review Board Statement
Informed Consent Statement
Data Availability Statement
Conflicts of Interest
References
- Monteith, J.L.; Ross, J. The Radiation Regime and Architecture of Plant Stands; Junk Publishers: The Hague, The Netherlands, 1981. [Google Scholar]
- Lagergren, F.; Eklundh, L.; Grelle, A.; Lundblad, M.; Mölder, M.; Lankreijer, H.; Lindroth, A. Net primary production and light use efficiency in a mixed coniferous forest in Sweden. Plant Cell Environ. 2004, 28, 412–423. [Google Scholar] [CrossRef]
- Niinemets, Ü. A review of light interception in plant stands from leaf to canopy in different plant functional types and in species with varying shade tolerance. Ecol. Res. 2010, 25, 693–714. [Google Scholar] [CrossRef]
- Kuusk, A. Canopy Radiative Transfer Modeling. In Comprehensive Remote Sensing V. 3 Remote Sensing of Terrestrial Ecosystem; Liang, S., Ed.; Elsvier: Amsterdam, The Netherlands, 2018; pp. 9–22. [Google Scholar] [CrossRef]
- Goel, N.S. Models of vegetation canopy reflectance and their use in estimation of biophysical parameters from reflectance data. Remote Sens. Rev. 1988, 4, 1–212. [Google Scholar] [CrossRef]
- Levashova, N.; Lukyanenko, D.; Mukhartova, Y.; Olchev, A. Application of a Three-Dimensional Radiative Transfer Model to Retrieve the Species Composition of a Mixed Forest Stand from Canopy Reflected Radiation. Remote Sens. 2018, 10, 1661. [Google Scholar] [CrossRef] [Green Version]
- España, M.; Baret, F.; Chelle, M.; Aries, F.; Andrieu, B. A dynamic model of maize 3D architecture: Application to the parameterisation of the clumpiness of the canopy. Agronomie 1998, 18, 609–626. [Google Scholar] [CrossRef]
- Remondino, F.; El-Hakim, S. Image-based 3D Modelling: A Review. Photogramm. Rec. 2006, 21, 269–291. [Google Scholar] [CrossRef]
- Zhu, F.; Thapa, S.; Gao, T.; Ge, Y.; Walia, H.; Yu, H. 3D Reconstruction of plant leaves for high-throughput phenotyping. In Proceedings of the 2018 IEEE International Conference on Big Data, Seattle, WA, USA, 10–13 December 2018. [Google Scholar]
- Guo, Q.; Su, Y.; Hu, T.; Guan, H.; Jin, S.; Zhang, J.; Zhao, X.; Xu, K.; Wei, D.; Kelly, M.; et al. Lidar Boosts 3D Ecological Observations and Modelings: A Review and Perspective. IEEE Geosci. Remote Sens. Mag. 2021, 9, 232–257. [Google Scholar] [CrossRef]
- Koreň, M.; Mokroš, M.; Bucha, T. Accuracy of tree diameter estimation from terrestrial laser scanning by circle-fitting methods. Int. J. Appl. Earth Obs. Geoinf. 2017, 63, 122–128. [Google Scholar] [CrossRef]
- Wang, Y.; Lehtomäki, M.; Liang, X.; Pyörälä, J.; Kukko, A.; Jaakkola, A.; Liu, J.; Feng, Z.; Chen, R.; Hyyppä, J. Is field-measured tree height as reliable as believed—A comparison study of tree height estimates from field measurement, air-borne laser scanning and terrestrial laser scanning in a boreal forest. ISPRS J. Photogramm. Remote Sens. 2019, 147, 132–145. [Google Scholar] [CrossRef]
- Li, Y.; Guo, Q.; Su, Y.; Tao, S.; Zhao, K.; Xu, G. Retrieving the gap fraction, element clumping index, and leaf area index of individual trees using single-scan data from a terrestrial laser scanner. ISPRS J. Photogramm. Remote Sens. 2017, 130, 308–316. [Google Scholar] [CrossRef]
- Zheng, G.; Moskal, L.M. Leaf Orientation Retrieval from Terrestrial Laser Scanning (TLS) Data. IEEE Trans. Geosci. Remote Sens. 2012, 50, 3970–3979. [Google Scholar] [CrossRef]
- Walter, J.D.C.; Edwards, J.; McDonald, G.; Kuchel, H. Estimating Biomass and Canopy Height with LiDAR for Field Crop Breeding. Front. Plant Sci. 2019, 10, 1145. [Google Scholar] [CrossRef] [PubMed]
- Harkel, J.T.; Bartholomeus, H.; Kooistra, L. Biomass and Crop Height Estimation of Different Crops Using UAV-Based Lidar. Remote Sens. 2019, 12, 17. [Google Scholar] [CrossRef] [Green Version]
- Hu, T.; Sun, X.; Su, Y.; Guan, H.; Sun, Q.; Kelly, M.; Guo, Q. Development and Performance Evaluation of a Very Low-Cost UAV-Lidar System for Forestry Applications. Remote Sens. 2020, 13, 77. [Google Scholar] [CrossRef]
- Widlowski, J.-L.; Côté, J.-F.; Béland, M. Abstract tree crowns in 3D radiative transfer models: Impact on simulated open-canopy reflectances. Remote Sens. Environ. 2014, 142, 155–175. [Google Scholar] [CrossRef]
- Widlowski, J.-L.; Mio, C.; Disney, M.; Adams, J.; Andredakis, I.; Atzberger, C.; Brennan, J.; Busetto, L.; Chelle, M.; Ceccherini, G.; et al. The fourth phase of the radiative transfer model intercomparison (RAMI) exercise: Actual canopy scenarios and conformity testing. Remote Sens. Environ. 2015, 169, 418–437. [Google Scholar] [CrossRef]
- Espana, M.; Baret, F.; Aries, F.; Andrieu, B.; Chelle, M. Radiative transfer sensitivity to the accuracy of canopy description. The case of a maize canopy. Agron. EDP Sci. 1999, 19, 241–254. [Google Scholar] [CrossRef]
- Zhai, L.-C.; Xie, R.-Z.; Ming, B.; Li, S.-K.; Ma, D.-L. Evaluation and analysis of intraspecific competition in maize: A case study on plant density experiment. J. Integr. Agric. 2018, 17, 2235–2244. [Google Scholar] [CrossRef] [Green Version]
- Rockafellar, R.T.; Roger, J.-B.W. Variational Analysis; Springer: Berlin/Heidelberg, Germany, 2005; p. 117. [Google Scholar]
- Zhao, F.; Gu, X.; Verhoef, W.; Wang, Q.; Yu, T.; Liu, Q.; Huang, H.; Qin, W.; Chen, L.; Zhao, H. A spectral directional reflectance model of row crops. Remote Sens. Environ. 2010, 114, 265–285. [Google Scholar] [CrossRef]
- Zhu, B.; Liu, F.; Xie, Z.; Guo, Y.; Li, B.; Ma, Y. Quantification of light interception within image-based 3D reconstruction of sole and intercropped canopies over the entire growth season. Ann. Bot. 2020, 126, 701–712. [Google Scholar] [CrossRef] [Green Version]
- Hui, F.; Zhu, J.; Hu, P.; Meng, L.; Zhu, B.; Guo, Y.; Li, B.; Ma, Y. Image-based dynamic quantification and high-accuracy 3D evaluation of canopy structure of plant populations. Ann. Bot. 2018, 121, 1079–1088. [Google Scholar] [CrossRef] [PubMed]
- Wu, S.; Wen, W.; Xiao, B.; Guo, X.; Du, J.; Wang, C.; Wang, Y. An accurate skelton extraction approach from 3D point clouds of maize plants. Front. Plant Sci. 2019, 10, 248. [Google Scholar] [CrossRef] [Green Version]
- Zhao, F.; Li, Y.; Dai, X.; Verhoef, W.; Guo, Y.; Shang, H.; Gu, X.; Huang, Y.; Yu, T.; Huang, J. Simulated impact of sensor field of view and distance on field measurements of bidirectional reflectance factors for row crops. Remote Sens. Environ. 2015, 156, 129–142. [Google Scholar] [CrossRef]
- Cignoni, P.; Rocchini, C.; Scopigno, R. Metro: Measuring Error on Simplified Surfaces. Comput. Graph. Forum 1998, 17, 167–174. [Google Scholar] [CrossRef] [Green Version]
- Hussain, M. Fast and Reliable Decimation of Polygonal Models Based on Volume and Normal Field; Lecture Notes in Computer Science; Springer: Berlin/Heidelberg, Germany, 2010; pp. 64–73. [Google Scholar] [CrossRef]
- Böök, D. Make It Simpler: Structure-Aware Mesh Decimation of Large-Scale Models. Master’s Thesis, Department of Electrical Engineering, Linköping University, Linköping, Sweden, 2019. [Google Scholar]
- Chen, Z.; Zheng, X.; Guan, T. Structure-Preserving Mesh Simplification. KSII Trans. Internet Inf. Syst. 2020, 14, 4463–4482. [Google Scholar]
- Myneni, R.; Ross, J.; Asrar, G. A review on the theory of photon transport in leaf canopies. Agric. For. Meteorol. 1989, 45, 1–153. [Google Scholar] [CrossRef]
- Asner, G. Biophysical and Biochemical Sources of Variability in Canopy Reflectance. Remote Sens. Environ. 1998, 64, 234–253. [Google Scholar] [CrossRef]
- Liu, J.; Skidmore, A.K.; Wang, T.; Zhu, X.; Premier, J.; Heurich, M.; Beudert, B.; Jones, S. Variation of leaf angle distribution quantified by terrestrial LiDAR in natural European beech forest. ISPRS J. Photogramm. Remote Sens. 2019, 148, 208–220. [Google Scholar] [CrossRef]
- Li, X.; Strahler, A. Modeling the gap probability of a discontinuous vegetation canopy. IEEE Trans. Geosci. Remote Sens. 1988, 26, 161–170. [Google Scholar] [CrossRef]
- Weiss, M.; Baret, F.; Smith, G.J.; Jonckheere, I.; Coppin, P. Review of methods for In Situ leaf area index (LAI) determination. Agric. For. Meteorol. 2004, 121, 37–53. [Google Scholar] [CrossRef]
- Kobayashi, H.; Ryu, Y.; Baldocchi, D.D.; Welles, J.M.; Norman, J.M. On the correct estimation of gap fraction: How to remove scattered radiation in gap fraction measurements? Agric. For. Meteorol. 2013, 174–175, 170–183. [Google Scholar] [CrossRef]
- Zhao, F.; Dai, X.; Verhoef, W.; Guo, Y.; van der Tol, C.; Li, Y.; Huang, Y. FluorWPS: A Monte Carlo ray-tracing model to compute sun-induced chlorophyll fluorescence of three-dimensional canopy. Remote Sens. Environ. 2016, 187, 385–399. [Google Scholar] [CrossRef]
- Mandelbrot, B. How Long Is the Coast of Britain? Statistical Self-Similarity and Fractional Dimension. Science 1967, 156, 636–638. [Google Scholar] [CrossRef] [PubMed] [Green Version]

| Parameter | Range of Values |
|---|---|
| Scanning distance (m) | 0.6 to 330 |
| Scanning speed (points/s) | 122,000 to 976,000 |
| Ranging error (mm) | ±2 |
| Resolution (pixels) | 7 × 10⁷ |
| Vertical field of view (°) | 300 |
| Horizontal field of view (°) | 360 |
| Laser class | Class 1 |
| Wavelength (nm) | 1550 |
| Global Positioning System (GPS) | Integrated GPS receiver |
| Scenario | Decimation Rate | Hausdorff Distance | ||
|---|---|---|---|---|
| Stage 1 | Stage 2 | Stage 3 | ||
| T (stage N#)-1 | 50% | 0.29 | 0.59 | 0.34 |
| T (stage N#)-2 | 0.2% | 2.01 | 4.10 | 2.44 |
| T (stage N#)-3 | 0.05% | 4.70 | 6.97 | 5.85 |
| T (stage N#)-4 | 0.01% | 13.13 | 13.71 | 13.95 |
| Structure | ||||
|---|---|---|---|---|
| T1 | 55.775 | 27.163 | 189.291 | 106.310 |
| T1-1 | 55.749 | 27.194 | 189.263 | 106.421 |
| T1-2 | 55.352 | 27.550 | 188.929 | 106.422 |
| T1-3 | 53.825 | 26.951 | 190.392 | 107.134 |
| T1-4 | 52.772 | 22.871 | 195.698 | 107.753 |
| T2 | 61.520 | 25.317 | 177.123 | 109.123 |
| T2-1 | 61.428 | 25.395 | 177.404 | 109.278 |
| T2-2 | 61.194 | 25.938 | 178.038 | 109.616 |
| T2-3 | 60.345 | 25.549 | 178.684 | 110.242 |
| T2-4 | 59.898 | 22.650 | 182.191 | 112.445 |
| T3 | 67.475 | 24.496 | 182.264 | 106.617 |
| T3-1 | 67.616 | 24.572 | 183.455 | 106.628 |
| T3-2 | 67.503 | 25.208 | 183.687 | 106.983 |
| T3-3 | 67.128 | 24.964 | 183.036 | 107.974 |
| T3-4 | 66.524 | 21.386 | 183.758 | 108.815 |
| Decimation Rate | Stage 1 (Relative Difference) | Stage 2 (Relative Difference) | Stage 3 (Relative Difference) |
|---|---|---|---|
| 0.01% | 0.2589 (−29.84%) | 0.4216 (−26.98%) | 0.6386 (−23.97%) |
| 0.05% | 0.3499 (−5.17%) | 0.5521 (−4.39%) | 0.8097 (−3.61%) |
| 0.2% | 0.3673 (−0.45%) | 0.5750 (−0.43%) | 0.8407 (0.08%) |
| 50% | 0.3692 (0.05%) | 0.5772 (0.04%) | 0.8401 (0.01%) |
| 100% | 0.3690 | 0.5774 | 0.8399 |
Publisher’s Note: MDPI stays neutral with regard to jurisdictional claims in published maps and institutional affiliations. |
© 2021 by the authors. Licensee MDPI, Basel, Switzerland. This article is an open access article distributed under the terms and conditions of the Creative Commons Attribution (CC BY) license (https://creativecommons.org/licenses/by/4.0/).
Share and Cite
Ali, B.; Zhao, F.; Li, Z.; Zhao, Q.; Gong, J.; Wang, L.; Tong, P.; Jiang, Y.; Su, W.; Bao, Y.; et al. Sensitivity Analysis of Canopy Structural and Radiative Transfer Parameters to Reconstructed Maize Structures Based on Terrestrial LiDAR Data. Remote Sens. 2021, 13, 3751. https://doi.org/10.3390/rs13183751
Ali B, Zhao F, Li Z, Zhao Q, Gong J, Wang L, Tong P, Jiang Y, Su W, Bao Y, et al. Sensitivity Analysis of Canopy Structural and Radiative Transfer Parameters to Reconstructed Maize Structures Based on Terrestrial LiDAR Data. Remote Sensing. 2021; 13(18):3751. https://doi.org/10.3390/rs13183751
Chicago/Turabian StyleAli, Bitam, Feng Zhao, Zhenjiang Li, Qichao Zhao, Jiabei Gong, Lin Wang, Peng Tong, Yanhong Jiang, Wei Su, Yunfei Bao, and et al. 2021. "Sensitivity Analysis of Canopy Structural and Radiative Transfer Parameters to Reconstructed Maize Structures Based on Terrestrial LiDAR Data" Remote Sensing 13, no. 18: 3751. https://doi.org/10.3390/rs13183751