Article

Drought Monitoring over Yellow River Basin from 2003–2019 Using Reconstructed MODIS Land Surface Temperature in Google Earth Engine

1
College of Geography and Environmental Science, Henan University, Kaifeng 475004, China
2
Henan Key Laboratory of Earth System Observation and Modeling, Henan University, Kaifeng 475004, China
3
Key Laboratory of Geospatial Technology for the Middle and Lower Yellow River Regions (Henan University), Ministry of Education, Kaifeng 475004, China
4
Key Research Institute of Yellow River Civilization and Sustainable Development and Collaborative Innovation Center on Yellow River Civilization Jointly Built by Henan Province and Ministry of Education, Henan University, Kaifeng 475004, China
*
Author to whom correspondence should be addressed.
Remote Sens. 2021, 13(18), 3748; https://doi.org/10.3390/rs13183748
Submission received: 21 July 2021 / Revised: 9 September 2021 / Accepted: 14 September 2021 / Published: 18 September 2021
(This article belongs to the Special Issue Remote Sensing for Drought Monitoring and Forecasting)

Abstract

:
Drought is one of the most complex and least-understood environmental disasters that can trigger environmental, societal, and economic problems. To accurately assess the drought conditions in the Yellow River Basin, this study reconstructed the Land Surface Temperature (LST) using the Annual Temperature Cycle (ATC) model and the Normalized Difference Vegetation Index (NDVI). The Temperature Condition Index (TCI), Vegetation Condition Index (VCI), Vegetation Health Index (VHI), and Temperature-Vegetation Drought Index (TVDI), which are four typical remote sensing drought indices, were calculated. Then, the air temperature, precipitation, and soil moisture data were used to evaluate the applicability of each drought index to different land types. Finally, this study characterized the spatial and temporal patterns of drought in the Yellow River Basin from 2003 to 2019. The results show that: (1) Using the LST reconstructed by the ATC model to calculate the drought index can effectively improve the accuracy of drought monitoring. In most areas, the reconstructed TCI, VHI, and TVDI are more reliable for monitoring drought conditions than the unreconstructed VCI. (2) The four drought indices (TCI, VCI, VH, TVDI) represent the same temporal and spatial patterns throughout the study area. However, in some small areas, the temporal and spatial patterns represented by different drought indices are different. (3) In the Yellow River Basin, the drought level is highest in the northwest and lowest in the southwest and southeast. The dry conditions in the Yellow River Basin were stable from 2003 to 2019. The results in this paper provide a basis for better understanding and evaluating the drought conditions in the Yellow River Basin and can guide water resources management, agricultural production, and ecological protection of this area.

Graphical Abstract

1. Introduction

Drought is an extremely complex natural disaster, and the occurrence of drought leads to decreased agricultural productivity [1], land desertification, and forest degradation, among other social environmental problems [2,3,4]. Compared with other natural disasters, drought affects a wider area and has a longer duration, thus causing much more extensive losses than other natural disasters (e.g., floods and earthquakes) [5,6]. In recent decades, global environmental and climate change has caused changes in the water cycle; meanwhile, population growth and increased agricultural and industrial water use have further exacerbated water shortages [7,8]. This leads to the increasing frequency of drought events [9,10,11,12,13,14,15]. Therefore, it is necessary to monitor and study droughts to mitigate their impacts and ensure sustainable socioeconomic development.
The commonly used drought monitoring method is based on the observation data from meteorological stations, and it calculates a drought index (such as the Standardized Precipitation Index (SPI) [16,17], Palmer Drought Index (PDSI) [18,19], and Standard Precipitation Evapotranspiration Index (SPEI) [20]) and evaluates the regional scale drought status. This approach is divided into two more methods, one of which is calculating the drought index directly using site data to evaluate the regional drought situation at the site scale [21]. This method can only reflect the drought situation of the site location, and it is difficult to accurately assess the regional drought situation in areas with strong spatial heterogeneity. The other method is to interpolate the meteorological data observed to obtain the surface meteorological data and then calculate the drought index to evaluate the regional drought situation [22,23] on the regional scale. Although such methods can assess droughts at the regional scale, the extremely complex factors affecting the surface meteorological parameters obtained through interpolation have large uncertainty, making it difficult to truly reflect the regional drought situation [24,25]. The rapid development of remote sensing technology and its ability to quickly and accurately produce multi-source, multi-scale, and multi-time information facilitates regional-scale drought monitoring.
Currently, remote sensing has been widely used in multi-scale drought monitoring research [23,26,27,28,29,30,31]. Some studies assess the applicability of precipitation and evapotranspiration remote sensing data in drought monitoring and achieved reliable results [16,20,31]. Although SPI and PDSI indexes based on precipitation data can directly reflect the regional dry conditions, the current existing precipitation data has low spatial-temporal resolution, which presents the results of drought monitoring with many uncertainties. Compared with precipitation data, NDVI and LST data have higher spatial-temporal resolution, exploring the correlation between these data, and drought is of great significance to drought monitoring research [16,32,33]. Therefore, the NDVI and LST data were selected in this study to monitor the drought in the Yellow River Basin. Since the NDVI and LST remote sensing products are greatly affected by geographical location, ecosystems, and human activity, the simple use of NDVI and LST data for drought monitoring is very uncertain, and it is difficult to accurately characterize regional drought conditions [34]. To address this problem, Kogan proposed to normalize the NDVI and LST to build the Vegetation Condition Index (VCI) and the Temperature Condition Index (TCI) [26,27]. Under the influence of soil background and atmospheric noise, there are outliers present in almost all remote sensing data. To reduce the effect of NDVI and LST outliers on VCI and TCI index calculations, Konga performed filtering smoothing of NDVI and LST data and showed that filtering smoothing methods effectively remove the effects of external environmental factors on NDVI and LST and improve the accuracy of drought monitoring [26,27]. Since single factor drought indexes, such as VCI and TCI, can only reflect the effects of vegetation or land surface temperature, drought monitoring using VCI and TCI remains inaccurate, leading to the construction of the Vegetation Health Index (VHI) [35] and Temperature-Vegetation Drought Index (TVDI) [36]. The VHI is obtained by the weighted average of the VCI and TCI [35]; the TVDI is constructed through the spatial relationship between NDVI and LST. Studies have shown that the scatter maps of the NDVI and LST are presented as triangular [37] or trapezoidal [38]. In this study, the traditional Thermo-optical Trapezoidal model (TOTRAM) [39] is used to calculate TVDI, which characterizes the spatial characteristics of NDVI and LST. Compared with the two single factor drought indices of VCI and TCI, VHI and TVDI take full account of the regional drought conditions under the combination of NDVI and LST, further improving the accuracy of drought monitoring [35,36]. In recent years, the VCI, TCI, VHI, and TVDI have been widely used in the monitoring and analysis of drought. The reliability of these drought indices has been validated [26,27,32,36,40,41,42,43,44,45,46,47]. Compared with the drought index based on meteorological stations, such as SPI, PDSI, and SPEI, the above four drought indexes are easily accessible and continuous in time and space. At the same time, these four drought indexes are also easier to calculate compared to some other drought indexes. Therefore, the above four drought indexes were selected to evaluate the drought conditions in the Yellow River Basin, which provides a basis for exploring more efficient and accurate drought monitoring methods in the future. The above four drought indexes need to be further evaluated in monitoring the drought, which will provide us with an in-depth understanding of the drought’s impact on the ecosystem of the Yellow River Basin.
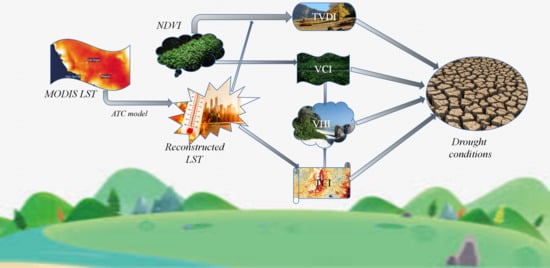
Currently, remote sensing data sources for drought assessment mainly includes Landsat TM (Thematic Mapper), ETM+ (Enhanced Thematic Mapper), OLI (Operational Land Imager) [48,49], Sentinel SAR (Synthetic Aperture Radar), MSI (Multispectral Imager) [50,51], and MODIS (Moderate Resolution Imaging Spectroradiometer) [52,53]. Landsat and Sentinel data have high spatial resolutions (30 m and 10 m), but, due to their long revisit cycle, it is difficult to cover the entire study area; therefore, Landsat and Sentinel data are only suitable for small regional drought monitoring. The MODIS data revisit period is short (2 times every day), has numerous remote sensing images and moderate spatial resolution (500 m), and it is fully suitable for large-scale drought monitoring research. This study calculated and analyzed four typical remote sensing drought indexes based on the MODIS NDVI and LST data to assess the applicability of the four drought indexes in the Yellow River Basin. Due to the influence of clouds and cloud shadows, there are many missing data and outliers in the LST data based on MODIS [52]. Therefore, this study used a widely recognized data reconstruction model named Annual Temperature Cycle (ATC) to reconstruct the LST data. This model is a very accurate and efficient LST data reconstruction model, which simulates the LST data change curve as a sinusoidal function based on the inter-annual variation characteristics of the LST [54,55]. The ATC model has been widely used in spatial-temporal changes of LST studies, and its reliability has been verified, which is beneficial to solving the lack of LST data and outliers in drought monitoring studies. However, there is no precedent for using the ATC model in drought monitoring. This study is the first attempt to monitor drought using the ATC model, which has significant reference for future drought research. The continuous LST datasets produced by the ATC model ensure the reliability of the research results. The main purpose of this study is to: (1) calculate the four typical remote sensing drought indexes (TCI, VCI, VHI, TVDI) to monitor the drought conditions in the Yellow River Basin; (2) verify the correlation between each drought index and precipitation, air temperature and soil moisture; and (3) analyze the spatial and temporal pattern and changing drought trends in the Yellow River Basin from 2003 to 2019.

2. Materials and Methods

2.1. Study Area

The Yellow River Basin, which includes the Yellow River drainage system, the Yellow River flood disaster area, and the Yellow River agricultural irrigation area, is located between 96°~119° E, 32°~42° N, 1900 km from East to West and 1100 km from South to North, with an area of 1.4129 × 10⁶ km2 (Figure 1) [56,57,58]. The elevation of the Yellow River Basin is high in the West and low in the East and crosses the Qinghai-Tibet Plateau, Inner Mongolia Plateau, Loess Plateau, and the Huang-Huai-Hai Plain. The Yellow River Basin is the most important ecological barrier in China [59]. The main land-cover types are grasslands, croplands, barren lands, deciduous broadleaf forests, savannas, urban and built-up lands, mixed forests, and woody savannas (>1 × 10⁴ km2) (Figure 1, Table 1). The Yellow River Basin spans the arid, semi-arid, and semi-humid climates, from arid in the Northwest and to humid in the Southeast. The annual average air temperature is between 4–14 °C, the annual rainfall is concentrated in 200–800 mm, and air temperature and precipitation are unevenly distributed and have drastic seasonal changes: hot and rainy in summer, cold and dry in winter [60].

2.2. Data and Processing

The data used in this study were all derived from the Google Earth Engine (GEE) Cloud Platform (https://developers.google.com/earth-engine/datasets, accessed on 14 October 2020) [61,62,63]. The platform contains a large number of remote sensing datasets and has powerful data processing capabilities. The datasets adopted in this paper include the MODIS, TerraClimate, and JRC (JRC Yearly Water Classification History, v1.3) datasets. The type, spatial-temporal resolution, and time span of each datasets are shown in Table 2.
To ensure the accuracy of the ATC model, the daily surface temperature products were selected, considering the impact of cloud and cloud shadow, the MYD11A1.006 (https://developers.google.com/earth-engine/datasets/catalog/MODIS_006_MYD11A1, accessed on 14 October 2020). LST products based on Aqua satellites were ultimately selected because the transit time of Aqua satellites was 1:30 p.m., usually the least cloud volume. Considering the significant decrease in nighttime surface temperature and large regional differences, which increases the uncertainty in the drought monitoring, only the daytime LST data in the MYD11A1.006 product was used. To maintain the same spatial resolution as the LST data, a 1 km spatial resolution MODIS NDVI product was selected in this study, and, although the temporal resolution of the MODIS NDVI data was 16 days, this data is a product composited from daily NDVI data, from which we can extract the daily NDVI data through the ‘DayOfYear’ band. Based on the ‘DayOfYear’ band, we found that Aqua satellite-based MYD13A2.006 products lacked data for the first 8 days per year (DayOfYear ≥ 9); therefore, Terra satellite-based MOD13A2.006 (https://developers.google.com/earth-engine/datasets/catalog/MODIS_006_MOD13A2, accessed on 14 October 2020) NDVI products were selected. The IGBP classification scheme in MCD12Q1 (https://developers.google.com/earth-engine/datasets/catalog/MODIS_006_MCD12Q1, accessed on 14 October 2020) was also selected to analyze the land cover types in the Yellow River Basin. Considering the reliability of the data, this study determined that the land types with less than 1 × 10⁴ km2 were negligible and only performed a time series analysis of drought indices in the land types with an area greater than 1 × 10⁴ km2.
The TerraClimate (https://developers.google.com/earth-engine/datasets/catalog/IDAHO_EPSCOR_TERRACLIMATE, accessed on 11 Feburary 2021) datasets provide monthly meteorological data for the period 1958–2019; its mixed datasets combine the WorldClim, CRU Ts4.0, and Japanese 55-year Reanalysis datasets. The datasets include evapotranspiration, precipitation, temperature, wind speed, air pressure, and soil moisture, with a spatial resolution of 2.5 arc minutes. To verify the accuracy of drought monitoring results, precipitation, temperature, and soil moisture data in the TerraClimate dataset were selected as validation data. Considering that the Aqua satellite transit time is 1:30 p.m., it is the highest temperature period of the day. Therefore, the maximum air temperature (tmmx) of TerraClimate dataset was selected in this paper. To remove the effects of water bodies on the drought index, the JRC datasets were used to extract water, which contains the location and time distribution of the surface water from 1984–2019 and provides statistics on the scope and variation of the water surface.
In this paper, the temporal resolution of NDVI data was 16 days. The Maximum Value Composite (MVC) method was used to generate NDVI annual data; soil moisture was at the monthly time interval, and the annual mean value was used to represent the annual soil moisture. The spatial resolutions of land cover, soil moisture, water, air temperature, and precipitation data were at 500 m, 2.5 arc minutes, 30 m, 2.5 arc minutes, and 2.5 arc minutes spatial resolutions, respectively. The default nearest proximity interpolation method of the Google Earth Engine platform was used to convert the spatial resolution of land cover, precipitation, maximum air temperature, soil moisture, and water datasets to 1 km. To obtain the accurate results of the time-series analysis, the mask method in the Google Earth Engine platform was used to remove the null value pixels and analyze only the high-quality pixels.

2.3. Methods

2.3.1. LST Reconstruction Method

In recent years, there have been studies using MODIS data to analyze the temporal and spatial patterns of regional surface temperature, and good results have been achieved [64]. However, local meteorological conditions, such as clouds, have a great impact on satellite-derived LST, resulting in many missing values, which makes it difficult to obtain continuous LST changes in space and time. Therefore, it is challenging to effectively characterize the surface and the dynamics of the thermal environment using original MODIS LST data. Since the LST variation is similar to the solar radiation flux change curve in the sinusoidal function change form [54,55], this study optimized the LST data using the ATC model. The calculation formula is as follows:
f ( d ) = M A S T + Y A S T . s i n ( 2 π ( d + θ ) 365 ) .
In Equation (1), MAST is the annual average LST, YAST is the amplitude of LST in a year, d represents the day of the year, and θ represents the phase shift. To maintain the ATC model rationality, the YAST should be larger than 0, and the phase shift is relative to the equinox with a range between −182.5 and +182.5 days, according to the definition [54,55]. For a given series of LST measurements, the MAST, YAST, and θ for every pixel were estimated with an unconstrained nonlinear optimization algorithm, minimizing the square sum of the residuals [65]. Therefore, we can obtain the daily surface temperature data based on parameter d.

2.3.2. Drought Index

The four drought indexes used in this study can be divided into two classes. The first class consists of single factor indexes, including TCI and VCI, which are calculated by LST and NDVI (Table 3); the second class consists of multiple factor indexes, including VHI, which is weighted by TCI and VCI (Table 4), and TVDI (Equations (2)–(4)), which is obtained by fitting the dry and wet edges according to the spatial relationship of LST and NDVI. The drought index is calculated as follows:
In Table 3, the subscript i represents the ith year of the study period; max and min represent the maximum and minimum of the corresponding index in the study area from 2003–2019.
Table 4 shows the equation to calculate the VHI; α and β represents the weight coefficient of TCI and VCI, respectively.
T V D I = ( L S T L S T min ) / ( L S T m a x L S T m i n ) ,
L S T min = a + b × N D V I ,
L S T max = c + d × N D V I .
In Equation (2), LST is the LST observation for each pixel, and LSTmin and LSTmax are obtained by Equations (3) and (4), respectively, where a, b, c, and d are wet and dry edge parameters estimated in the whole study region. The specific method of dry and wet edge fitting is to divide the interval [0,1] into 100 intervals, extract the maximum and minimum LST values where the NDVI values lies in the corresponding interval, and obtain 100 maximum values and minimum values, respectively. Then, the dry edge equation and the wet edge equation can be obtained by linear fitting (Formulas (3) and (4)). Figure 2 shows an example diagram of the fitting of the dry and wet edge equations.
The values of the four typical drought indexes range of 0 and 1; the larger the TVDI values, the more arid the region, while smaller values of the other three indexes represent more arid regions. Table 5 lists the correspondence of the magnitude of the 4 drought indexes [66].

2.3.3. Trend Analysis

This paper applied trend analysis to analyze the drought trends of the Yellow River Basin from 2003–2019. The formula is as follows:
S l o p e = n × i = 1 n i × D I i i = 1 n i i = 1 n D I i n × i = 1 n i 2 ( i = 1 n i ) 2 .
In Equation (5), n represents the total years of 2003–2019 (n = 17), and DIi represents the corresponding drought index value of ith year. Slope > 0 indicates an increasing trend of the drought index value in the study area between 2003–2019, and Slope < 0 indicates a negative trend of the drought index value in the study area between 2003–2019. The T test was used to determine the significance of the changing slope. While p > 0.05, the variation trend of drought index was not significant; while Slope > 0, p < 0.05, it indicated a significant upward trend; and, while Slope < 0, p < 0.05, it indicated a significant downward trend.

3. Results

3.1. Reconstruction of MODIS Time Series Data for Drought Monitoring

3.1.1. Performances of the ATC Model for LST

Due to the impacts of external environments, such as cloud and cloud shadow, there are some outliers in remote sensing data, it will greatly reduce the accuracy of ground observations of remote sensing satellites. Therefore, taking reasonable ways to remove outliers from remote sensing data is of great significance for scientific research. To analyze the reliability of the original MODIS and the effectiveness of the ATC model in reconstructing the LST data, the number of outliers in the raw MODIS data, as well as the highest and lowest LST values, were counted (Table 6 and Table 7). It can be seen from Table 6 that the MODIS original annual average LST data obtained by simple cloud removal still has many excessively high or low values. Among them, in 2008, 2012, and 2019, the annual average LST of 2722, 2269, and 1541 pixels was below 0 °C, respectively; in 2006, 2008, and 2012, the annual average LST of 114, 1703, and 358 pixels was lower than −10 °C. At the same time, the annual average LST value of hundreds of pixels is higher than 40 °C every year, and the annual average LST value of a few pixels exceeds 50 °C.
The main reason for these outliers is the uneven temporal distribution of MODIS images. If all the high-quality observations of a certain pixel occur in summer, the observation value of each LST is very high, and the annual average LST calculated with these high-value data will also be high; and, if the high-quality observations all occur in winter, the calculated annual average LST value is very low.
Due to the existence of these outliers, there are many uncertainties in calculating the drought index using the original MODIS LST data. Therefore, this study uses the ATC model to process the MODIS LST data. The annual average maximum and minimum values of the MODIS LST data and the LST data generated by the ATC model were also compared. The results are shown in Table 7.
Table 7 shows the highest and lowest annual average LST values of the Yellow River Basin from 2003 to 2019. The results show that, in the MODIS original annual average LST data obtained by simple cloud removal processing, the highest value of each year in the entire study area exceeds 50 °C, while the lowest value is lower than 0 °C, and both the highest value and the lowest value are relatively large fluctuations. After processing through the ATC model, the highest annual average LST is lower than 40 °C, and the lowest annual average LST value is higher than 0 °C, except for 2019 (−1.402 °C). Excessive high and low values in the original data are successfully removed, and the volatility of the data is also reduced. This fully reflects the excellent effect of the ATC model in processing abnormal images.
The Root Mean Square Error (RMSE) is a statistical indicator characterizing the deviation size of the true and predictive values, a smaller RMSE value indicates a smaller deviation. It can be calculated by Equation (6). To analyze the consistency between ATC LST and MODIS LST, the RMSE distribution of the difference between ATC and MODIS LST were calculated. The results can be found in Figure 3.
RMSE = 1 n i = 1 n ( y i ^ y i ) 2 .
In Equation (6), y i ^ represents the prediction value, y i represents the true value, and n represents the number of observations.
It can be seen from Figure 3 that the annual average LST processed by the ATC model is in good agreement with the original MODIS data. Areas with RMSE < 2 accounted for 53.38% of the entire study area, and areas with RMSE < 3 accounted for 84.33% of the entire study area. It shows that the ATC model does not change the value of the original MODIS data too much after successfully removing the over-high and under-values in the MODIS data, and it has good fidelity. This fully demonstrates the reliability of calculating the drought index using the ATC model reconstructed LST data and ensures the accuracy of the drought monitoring results.

3.1.2. Performances of the ATC Model for Drought Indices

In order to evaluate the effectiveness of the ATC LST in drought monitoring, the difference between the drought index calculated by the ATC LST and MODIS LST (ATC drought index minus MODIS drought index) were analyzed, and the results are shown in Figure 4.
It can be seen from Figure 4 that, among the three drought indices of TCI, VHI, and TVDI, the VHI index has the smallest difference before and after reconstruction, and the difference in all regions is between −0.1~0.1. The drought conditions are exactly the same. Unlike the VHI index, the reconstructed TCI and TVDI indexes showed more severe drought conditions in some areas of the Yellow River Basin than the non-reconstructed indices. It can be seen from Figure 4a that, in most areas of the southwestern part of the Yellow River Basin, the TCI difference is between −0.2~−0.1, which indicates that the reconstructed TCI index of the ATC model is lower than the TCI index based on MODIS, the drought is more serious; it can be seen from Figure 4e that, in the southwest and northwest of the Yellow River Basin, the reconstructed TVDI index is higher than that based on MODIS, and the drought is also more serious. These results show that the drought index calculated using the ATC LST data shows severer drought conditions compared to the drought index calculated by the original MODIS LST data, which facilitates the identification of mild drought. In some mild arid regions, it is often difficult to obtain drought conditions with MODIS LST data, while using the ATC LST data can effectively obtain drought conditions in these regions, which is also an advantage of the ATC model in drought monitoring.

3.2. Accuracy Assessment

To verify the reliability of the drought index, the correlation of the four drought indexes of different land types with precipitation, air temperature, and soil moisture were analyzed. The precipitation, air temperature, and soil moisture data were obtained from the TerraClimate datasets. The results are shown in Figure 5.
According to Figure 5, in the grasslands area, VCI, VHI has a significant correlation with precipitation and soil moisture (R2 > 0.5), and TCI, TVDI has a significant correlation with the air temperature (R2 > 0.6), indicating that drought in grasslands is affected by precipitation, temperature, and soil moisture. In croplands and urban lands, there is weak correlation with precipitation, temperature, and soil moisture due to human activity (R2 < 0.3). In barren lands, deciduous broadleaf forests, savannas, and mixed forests, drought is mainly affected by temperature, and drought indexes of TCI, VHI, and TVDI are strongly related with temperature (R2 > 0.4), while VCI is weakly correlated with temperature (R2 < 0.1). In woody savannas, TCI, VHI, and TVDI are more associated with temperature and soil moisture than in other regions, and the drought conditions are more affected by temperature and soil moisture.

3.3. Spatial Patterns of Drought

The annual mean of the four drought indexes from 2003–2019 shows the drought conditions is highest in the northwest and lowest in the southwest and southeast of the Yellow River Basin (Figure 6). The results show that the patterns of four drought indexes can be divided into two categories: (1) patterns represented by TCI and TVDI and (2) patterns represented by VCI and VHI. Figure 6a,d show that, in the northwest of the Yellow River Basin, the drought levels are the highest. In the southwest of the Yellow River Basin, the drought levels are the lowest. In the central and southeast of the Yellow River Basin, it mostly shows mild drought conditions (Table 5). Figure 6b,c show a severe drought conditions in the northwest and moist conditions in the southwest and southeast of the Yellow River Basin. According to the results of the land cover shown in Figure 1, the northwest area of the Yellow River Basin is mainly desert (Tengger Desert) and barren land, the southwest and central regions are mainly grassland, and the southeast regions are mainly farmland, indicating that the results of this study are consistent with the actual situation. Unlike TCI and TVDI, VCI and VHI also show moist conditions in the central and southeastern regions of the Yellow River Basin, and the drought conditions differ from those characterized by TCI and TVDI (The TCI and the TVDI indexes indicate moderate drought in the central and southeastern regions of the Yellow River Basin, and the VCI and VHI indicate that it is moist there.).
Overall, the spatial-temporal patterns of the four drought indexes are consistent throughout the study area and vary somewhat locally. The TCI and VCI regard LST and NDVI as the leading factors of drought. Although the two combined drought indexes comprehensively consider the effects of LST and NDVI on drought, the principles and methods on which they are based are very different. Thus, for regional drought monitoring, selecting the appropriate drought index according to the actual situation to ensure the accuracy of the results is necessary. For example, in areas with high vegetation coverage, NDVI is extremely sensitive to drought changes; therefore, monitoring drought through VCI is more reasonable than with other indexes, whereas, in the desert, using TCI to monitor drought is a better choice.

3.4. Inter-Annual Variability and Trends of Drought

Equation (5) was used to calculate the slope of the four typical remote sensing drought indexes from 2003–2019. Areas with a positive slope (Slope > 0) indicate that the corresponding drought index from 2003–2019 has an increasing trend, and regions with a negative slope (Slope < 0) indicate that the corresponding drought index from 2003–2019 was declining. Based on the T test method, the study area was divided into three categories, including no significant change (p > 0.05), significant increase (Slope > 0, p < 0.05), and significant decrease (Slope < 0, p < 0.05); the results are shown in Figure 7. According to Figure 7a, the TCI value in the central region of the Yellow River Basin has a significant increase trend; the drought levels decrease as the TCI value increases. The TCI value in the southeast and northwest regions has a significant decrease trend; the drought condition is getting worse. The TCI value has no significant change in other regions of the Yellow River Basin, which indicates that the drought condition is very stable. Unlike the TCI, the VCI variation trend shown in Figure 7b is a significant increase in most areas of the Yellow River Basin, which indicates an increasing drought trend. The change trend of VHI in Figure 7c has the same pattern as the VCI index, with an upward trend in the central region and downward trend in the southeast region of the Yellow River Basin. In Figure 7d, the TVDI value is significantly increased in the central of the Yellow River Basin, indicating increasing drought. The TVDI value is significantly decreased in some areas at the northwest and central of Yellow River Basin. In other regions of the Yellow River Basin, the TVDI value has no significant change trend, which indicates that there is no obvious change of drought.
As shown in Figure 7, the drought index values in the study area have similar overall trends, as well as local differences. This shows that the application of each drought index to the natural geographical environment is different. Therefore, when carrying out drought monitoring and forecast research on the regional scale, it is necessary to comprehensively consider various factors (such as temperature, precipitation, and soil moisture, among others) and select the appropriate drought index to ensure the reliability of the research results.
To analyze the drought change trends of the different land types, the time series of the drought index of each land type in the Yellow River Basin was conducted. According to Figure 8, VCI and VHI have similar change trends, which is consistent with the previous slope analysis results of the drought index. In grasslands, barren lands, and urban and built-up lands, the values of TVDI are the largest, which indicates a high degree of drought in these regions. In croplands, deciduous broadleaf forests, savannas, mixed forests, and woody savannas, the VCI index is the largest, which indicates a low level of drought in these regions. TCI values are lower in croplands and urban and built-up lands than in other areas, indicating a high land surface temperature and, thus, drought in these areas. The value of the VHI index is between the other three indices throughout the study area; VHI is obtained by the two exponential complexes of TCI and VCI. Compared to TCI and VCI, the two mono-factor drought indexes, VHI is more comprehensive.
For deeper understanding the change trends of drought index in the Yellow River Basin, we performed a significance analysis, for which the results are shown in Figure 8. Table 8 and Table 9 show the mean value of slope and P-values of the four drought indices in the different land types. It can be seen from Table 8 that all slope values are less than 0.01, indicating stable dry conditions for all land types in the Yellow River Basin between 2003 and 2019. Table 9 shows that both VCI and VHI indexes showed significant inter-annual trends (Yellow, p < 0.05) in most regions, while neither TCI nor TVDI indexes showed any significant trends (p > 0.05) in most land types. In general, the change trend of the four drought indexes in the whole study area was relatively stable from 2003–2019, which shows that the drought situation from 2003–2019 at the Yellow River Basin was relatively stable. However, given the apparent changes in the drought in local small areas, it will be necessary to conduct an in-depth analysis of the drought situation of these small areas in the future.

3.5. Comparison with SPI and PDSI

To better understand the reliability of the four drought indices (TCI, VCI, VHI, TVDI), the SPI and PDSI indices on a 1-month time scale were calculated as the reference data. Figure 9 shows the spatial-temporal distribution pattern of the SPI and PDSI indices in the Yellow River Basin. Figure 9a shows that there was severe drought in the southwest of the Yellow River Basin and humidity in the northwest. Figure 9b shows that the southwest of the Yellow River Basin is humid, and the central region has a moderate drought level. Overall, there are large problems with the drought conditions characterized by both SPI and PDSI indices, for example, with high values in the Tengger Desert region, where extreme severe drought conditions were not monitored; the main reason for this problem is the minimal rainfall in the Tengger Desert region, and the indices SPI and PDSI based on precipitation data fail to effectively characterize their drought conditions. In areas with perennial insufficient rainfall, monitoring the drought conditions of the region is more accurate and effective by using vegetation index and temperature data. The four drought indices based on NDVI and LST data selected in this study effectively monitored the drought conditions in the Tengger Desert area. Although both SPI and PDSI drought indices are widely recognized internationally, since both indexes depend on precipitation data and most of the precipitation data have low spatial-temporal resolution, therefore, drought monitoring in local regions using these two indexes has great uncertainty. When drought monitoring was performed using SPI and PDSI, more constraints (e.g., setting thresholds for precipitation data, etc.) must be added to achieve more reliable results, which obviously increases the workload. The NDVI and LST data used in this study are characterized by high spatial-temporal resolution to effectively monitor regional drought conditions, which are important implications for future studies.

4. Discussion

4.1. Advantages of Data Reconstruction

The accuracy of remote sensing drought monitoring is mainly dependent on the accuracy of remote sensing data. Due to the influence of the atmospheric environment (such as clouds and cloud shadows), the original remote sensing data often have many missing values and outliers, which reduces the accuracy of drought monitoring results. To address this problem, this study reconstructed the annual LST of 2003–2019 in the Yellow River Basin by using the ATC model [65]. The reconstruction method successfully removes the outliers in the original LST data and obtains high-quality spatial-temporal continuous LST datasets, which ensures the accuracy of drought monitoring. The ATC model treats the change in LST as periodic changes of the sinusoidal function. In contrast to data reconstruction methods, such as the Savitzky-Golay filter [67], Time Series Harmonic Analysis (HANTS) [68], Whittaker Smother [69], and Random Forest [70], the ATC model represents the LST changes in the region in a simple and effective manner. Currently, existing data reconstruction methods, such as Savitzky-Golay filter, HANTS, Whittaker Smoother, and Random Forest, have been widely used in the construction of high quality, spatial-temporal, continuous remote sensing data (such as EVI, NDVI, and NDWI) [71,72]. However, few studies on drought monitoring used data reconstruction methods, and reconstructing LST using the ATC model provides a reference for future drought monitoring research. The results show that the drought indexes of TCI, VHI, and TVDI found through the ATC model are related to precipitation, temperature, and soil moisture, which fully reflects the necessity of data reconstruction methods in drought monitoring research.

4.2. Spatial-Temporal Pattern of Drought

The spatial pattern of the four drought indexes is basically the same, and the results show that the drought of the northwest desert area of the Yellow River Basin is very severe, while the grasslands in the southwest and central areas and the croplands in the southeast have moderate drought or no drought; these results are similar to those of the drought study of the Yellow River Basin by Wang and Zhu et al. [58,73]. The results of trend analysis show that the drought in the Yellow River Basin from 2003–2019 was stable with no obvious changes. Most studies have analyzed the interaction of climate change and regional drought conditions through site meteorological data [74,75], and they rarely analyze the impact of climate change on drought in specific land types (such as grasslands, farmlands, urban construction lands, woodlands, and deserts). To fill this knowledge gap, this study analyzed the time series change curve of the drought indices of eight major land types (grasslands, croplands, barren lands, deciduous broadleaf forest, savannas, urban, mixed forest, and woody savannas) in the Yellow River Basin and analyzed their correlation with precipitation, air temperature, and soil moisture; the results show that, on different land types, the changing trends in each drought index and their correlation with climate factors vary [76]. This shows that different drought indices apply differently to the various land types [77,78]. Subsequent studies should properly select the most appropriate drought index to monitor the regional drought conditions to ensure that the research results are true and reliable.

4.3. Uncertainty

Although the results of this paper clearly present the spatial and temporal patterns and the changing trends of the drought in the Yellow River Basin from 2003 to 2019, as well as the feedback effect of the drought situation on climate change, there are still some uncertainties. First, the land cover data used in this study is the single-year data of the MCD12Q1.006 datasets, which does not consider the land cover type change in parts of the Yellow River Basin during the period 2003–2019. Thus, there are some errors in time series analysis and correlation analysis. Second, since the Yellow River Basin also includes small areas of other land types, such as grasslands, croplands, and barren lands, the correlation analysis for smaller land types is not representative, and subsequent research should analyze the drought situation of these land cover types in a larger area. Third, the ATC model adopted in this paper is a basic LST data reconstruction model, which simply attributes the LST change form to a sinusoidal function, without comprehensively considering other factors affecting the LST. Therefore, there are still many unknown problems in the reconstructed LST. These uncertainties will be the focus of future studies.

5. Conclusions

This study used MODIS LST and NDVI to calculate TCI, VCI, VHI, and TVDI and analyze the drought status and change trend of the Yellow River Basin from 2003 to 2019. The spatial distribution and changing trends of the four typical remote sensing drought indexes shows that: TCI has the smallest value in the northwest of the Yellow River Basin and the largest value in the southwest, indicating drought conditions in the northwest and wet conditions in the southwest; in the central and southeast regions of the Yellow River Basin, the TCI value indicates a mild drought status. According to the slope of the index change, the TCI value is rising in the southwest and central Yellow River Basin, but decreasing in northwest and southeast, which indicates that the drought decreases in the southwest and central regions and increases in the northwest and southeast. The VCI and VHI are consistent in spatial distribution, and their values are low in the northwest of the Yellow River Basin, where there are severe drought conditions; and they are very high in the southwest, southeast, and central regions, where there are basically no drought conditions. Unlike the TCI slope, the VCI and VHI slopes are negative (Slope < 0) in the southwest region of the Yellow River Basin; this indicates an increasing drought in the southwest region of the Yellow River Basin. The values of TVDI are the largest in the northwest of the Yellow River Basin, smallest in the southwest, and relatively large in the central and southeast, which indicates severe drought in the northwest, humidity in the southwest, and mild drought in the central and southeast, all of which are consistent with the drought pattern characterized by the TCI index. The TVDI slope is negative in the northwest of the Yellow River Basin, positive in the southwest, and near 0 in the central and southeast, which indicates decreasing drought in the northwest, increasing drought in the southwest, and no significant change in the central and southeast study area. Time series analysis of the four drought indexes showed that the drought conditions were stable in most areas of the Yellow River Basin from 2003 to 2019. Overall, the drought conditions in the central and southeast of the Yellow River Basin are basically unchanged, with a slightly changing trend in the northwest and southwest areas. The results of correlation analysis show that, in most areas of the Yellow River Basin, the three drought indexes calculated by the ATC model are significantly correlated with temperature and soil moisture, while the VCI index is only significantly correlated with precipitation in the grasslands, which indicates the necessity of optimization and reconstruction of data in drought monitoring.
The four drought indices used in this study can more accurately monitor the spatial patterns of regional drought when compared to the meteorological drought index SPI and PDSI indices. In areas where rainfall is perennially scarce, such as the Tengger Desert, they are often exhibited as drought conditions for several or even decades, where drought conditions cannot be monitored using drought indexes, such as SPI, PDSI based on precipitation data. Due to the coarse spatial-temporal resolution of the precipitation data, the details of local small-area drought cannot be identified when monitoring regional-scale drought conditions. Compared with the precipitation data, the NDVI and LST data used in this study have high spatial-temporal resolution, and the vegetation and surface temperature have very stable inter-annual changes. Therefore, the drought conditions and historical changes of the NDVI and LST data can very accurately monitor the drought for many years, which is more important for more human understanding and effective response to drought disasters in the future.

Author Contributions

Conceptualization, H.X.; methodology, X.Z.; software, X.Z.; validation, X.Z., H.X., L.P., H.S., W.N., R.W., X.B., R.L., Y.G. and Y.Q.; formal analysis, X.Z. and H.X.; investigation, X.Z.; resources, X.Z. and H.X.; data curation, X.Z.; writing—original draft preparation, X.Z.; writing—review and editing, X.Z., H.X. and H.S.; visualization, X.Z. and H.X.; supervision, H.X.; project administration, H.X. and Y.Q.; funding acquisition, H.X. and Y.Q. All authors have read and agreed to the published version of the manuscript.

Funding

This research was funded by “National Natural Science Foundation Project of China (32130066)”, “Henan Provincial Department of Science and Technology Research Project (212102310019)”, ”Natural Science Foundation of Henan (202300410531)”, ”Youth Science Foundation Program of Henan Natural Science Foundation (202300410077)”, and “the major project of Collaborative Innovation Center on Yellow River Civilization jointly built by Henan Province and Ministry of Education (2020M19)”.

Institutional Review Board Statement

Not applicable.

Informed Consent Statement

Not applicable.

Data Availability Statement

MODIS, TerraClimate, JRC and TRMM3B43 data are openly available via the Google Earth Engine.

Acknowledgments

We are grateful to the anonymous reviewers whose constructive suggestions have improved the quality of this study, and wish to express our gratitude to USGS and GEE platform for supplying MODIS, TerraClimate, JRC and TRMM3B43 data. We are grateful to the data support from “Data Center of Middle & Lower Yellow River Regions, National Earth System Science Data Center, National Science & Technology Infrastructure of China. (http://henu.geodata.cn, accessed on 14 October 2020)”. We also wish to express our gratitude to “Dabieshan National Observation and Research Field Station of Forest Ecosystem at Henan” for supplying computer platform.

Conflicts of Interest

The authors declare no conflict of interest.

References

  1. Xie, X.; Li, A. Development of a topographic—Corrected temperature and greenness model (TG) for improving GPP estimation over mountainous areas. Agric. For. Meteorol. 2020, 295, 108193. [Google Scholar] [CrossRef]
  2. Li, J.; Wang, Z.; Lai, C. Severe drought events inducing large decrease of net primary productivity in mainland China during 1982–2015. Sci. Total. Environ. 2020, 703, 135541. [Google Scholar] [CrossRef]
  3. Li, Q.; He, P.; He, Y.; Han, X.; Zeng, T.; Lu, G.; Wang, H. Investigation to the relation between meteorological drought and hydrological drought in the upper Shaying River Basin using wavelet analysis. Atmos. Res. 2020, 234, 104743. [Google Scholar] [CrossRef]
  4. Xie, X.; Li, A. An adjusted two-leaf light use efficiency model for improving GPP simulations over mountainous areas. J. Geophys. Res. 2020, 125, e2019JD031702. [Google Scholar] [CrossRef]
  5. Vicente-Serrano, S.M.; López-Moreno, J.I. Hydrological response to different time scales of climatological drought: An evaluation of the Standardized Precipitation Index in a mountainous Mediterranean basin. Hydrol. Earth Syst. Sci. 2005, 9, 523–533. [Google Scholar] [CrossRef] [Green Version]
  6. Wei, K.; Ouyang, C.; Duan, H.; Li, Y.; Chen, M.; Ma, J.; An, H.; Zhou, S. Reflections on the catastrophic 2020 Yangtze River Basin flooding in southern China. Innovation 2020, 1, 100038. [Google Scholar]
  7. Xia, H.; Zhao, W.; Li, A.; Bian, J.; Zhang, Z. Subpixel inundation mapping using landsat-8 OLI and UAV Data for a wetland region on the Zoige Plateau, China. Remote Sens. 2017, 9, 31. [Google Scholar] [CrossRef] [Green Version]
  8. Xia, H.; Qin, Y.; Feng, G.; Meng, Q.; Cui, Y.; Song, H.; Ouyang, Y.; Liu, G. Forest phenology dynamics to climate change and topography in a geographic and climate transition zone: The Qinling mountains in Central China. Forests 2019, 10, 1007. [Google Scholar] [CrossRef] [Green Version]
  9. Ahmed, K.; Shahid, S.; Nawaz, N. Impacts of climate variability and change on seasonal drought characteristics of Pakistan. Atmos. Res. 2018, 214, 364–374. [Google Scholar] [CrossRef]
  10. Damberg, L.; AghaKouchak, A. Global trends and patterns of drought from space. Theor. Appl. Climatol. 2014, 117, 441–448. [Google Scholar] [CrossRef]
  11. Masih, I.; Maskey, S.; Mussá, F.; Trambauer, P. A review of droughts on the African continent: A geospatial and long-term perspective. Hydrol. Earth Syst. Sci. 2014, 18, 3635. [Google Scholar] [CrossRef] [Green Version]
  12. Mishra, A.K.; Singh, V.P. A review of drought concepts. J. Hydrol. 2010, 391, 202–216. [Google Scholar] [CrossRef]
  13. Oloruntade, A.J.; Mohammad, T.A.; Ghazali, A.H.; Wayayok, A. Analysis of meteorological and hydrological droughts in the Niger-South Basin, Nigeria. Glob. Planet. Chang. 2017, 155, 225–233. [Google Scholar] [CrossRef]
  14. Yu, M.; Li, Q.; Hayes, M.J.; Svoboda, M.D.; Heim, R.R. Are droughts becoming more frequent or severe in China based on the standardized precipitation evapotranspiration index: 1951–2010? Int. J. Climatol. 2014, 34, 545–558. [Google Scholar] [CrossRef]
  15. Zhao, A.; Zhang, A.; Cao, S.; Liu, X.; Liu, J.; Cheng, D. Responses of vegetation productivity to multi-scale drought in Loess Plateau, China. Catena 2018, 163, 165–171. [Google Scholar] [CrossRef]
  16. Chen, S.; Zhang, L.; Zhang, Y.; Guo, M.; Liu, X. Evaluation of Tropical Rainfall Measuring Mission (TRMM) satellite precipitation products for drought monitoring over the middle and lower reaches of the Yangtze River Basin, China. J. Geogr. Sci. 2020, 30, 53–67. [Google Scholar] [CrossRef] [Green Version]
  17. Li, L.; She, D.; Zheng, H.; Lin, P.; Yang, Z.-L. Elucidating diverse drought characteristics from two meteorological drought indices (SPI and SPEI) in China. J. Hydrometeorol. 2020, 21, 1513–1530. [Google Scholar] [CrossRef]
  18. Dehghan, S.; Salehnia, N.; Sayari, N.; Bakhtiari, B. Prediction of meteorological drought in arid and semi-arid regions using PDSI and SDSM: A case study in Fars Province, Iran. J. Arid. Land 2020, 12, 318–330. [Google Scholar] [CrossRef]
  19. Ghosh, S.; Bandopadhyay, S.; Sánchez, D.A.C. Long-term sensitivity analysis of Palmer Drought Severity Index (PDSI) through uncertainty and error estimation from plant productivity and biophysical parameters. In Proceedings of the 1st International Electronic Conference on Forests, Online, 15–30 November 2020; Volume 3, p. 57. [Google Scholar]
  20. Jiang, S.; Wei, L.; Ren, L.; Xu, C.-Y.; Zhong, F.; Wang, M.; Zhang, L.; Yuan, F.; Liu, Y.J.A.R. Utility of integrated IMERG precipitation and GLEAM potential evapotranspiration products for drought monitoring over mainland China. Atmos. Res. 2021, 247, 105141. [Google Scholar] [CrossRef]
  21. Wang, F.; Wang, Z.; Yang, H.; Zhao, Y. Study of the temporal and spatial patterns of drought in the Yellow River basin based on SPEI. Sci. China Earth Sci. 2018, 61, 1098–1111. [Google Scholar] [CrossRef]
  22. Qian, W.; Shan, X.; Zhu, Y. Ranking regional drought events in China for 1960–2009. Adv. Atmos. Sci. 2011, 28, 310–321. [Google Scholar] [CrossRef]
  23. Rhee, J.; Im, J.; Carbone, G.J. Monitoring agricultural drought for arid and humid regions using multi-sensor remote sensing data. Remote Sens. Environ. 2010, 114, 2875–2887. [Google Scholar] [CrossRef]
  24. Akhtari, R.; Morid, S.; Mahdian, M.H.; Smakhtin, V. Assessment of areal interpolation methods for spatial analysis of SPI and EDI drought indices. Int. J. Climatol. J. R. Meteorol. Soc. 2009, 29, 135–145. [Google Scholar] [CrossRef]
  25. Chen, H.; Fan, L.; Wu, W.; Liu, H.-B. Comparison of spatial interpolation methods for soil moisture and its application for monitoring drought. Environ. Monit. Assess. 2017, 189, 1–13. [Google Scholar] [CrossRef] [PubMed]
  26. Kogan, F.N. Application of vegetation index and brightness temperature for drought detection. Adv. Space Res. 1995, 15, 91–100. [Google Scholar] [CrossRef]
  27. Kogan, F.N. Droughts of the late 1980s in the United States as derived from NOAA polar-orbiting satellite data. Bull. Am. Meteorol. Soc. 1995, 76, 655–668. [Google Scholar] [CrossRef] [Green Version]
  28. Kogan, F.N. Global drought watch from space. Bull. Am. Meteorol. Soc. 1997, 78, 621–636. [Google Scholar] [CrossRef]
  29. Liang, L.; Qin, Z.; Zhao, S.; Di, L.; Zhang, C.; Deng, M.; Lin, H.; Zhang, L.; Wang, L.; Liu, Z. Estimating crop chlorophyll content with hyperspectral vegetation indices and the hybrid inversion method. Int. J. Remote Sens. 2016, 37, 2923–2949. [Google Scholar] [CrossRef]
  30. Qin, Z.; Li, W.; Gao, M. An algorithm to retrieve land surface temperature from ASTER thermal band data for agricultural drought monitoring. In Proceedings of the Remote Sensing for Agriculture, Ecosystems, and Hydrology Viii, Stockholm, Sweden, 11–14 September 2006. [Google Scholar]
  31. Gavahi, K.; Abbaszadeh, P.; Moradkhani, H.; Zhan, X.; Hain, C. Multivariate assimilation of remotely sensed soil moisture and evapotranspiration for drought monitoring. J. Hydrometeorol. 2020, 21, 2293–2308. [Google Scholar] [CrossRef]
  32. Liang, L.; Zhao, S.-H.; Qin, Z.-H.; He, K.-X.; Chen, C.; Luo, Y.-X.; Zhou, X.-D. Drought change trend using MODIS TVDI and its relationship with climate factors in China from 2001 to 2010. J. Integr. Agric. 2014, 13, 1501–1508. [Google Scholar] [CrossRef]
  33. Yang, X.; Huang, P. Restored relationship between ENSO and Indian summer monsoon rainfall around 1999/2000. Innovation 2021, 2, 100102. [Google Scholar]
  34. Han, Y.; Li, Z.; Huang, C.; Zhou, Y.; Zong, S.; Hao, T.; Niu, H.; Yao, H. Monitoring droughts in the Greater Changbai Mountains using multiple remote sensing-based drought indices. Remote Sens. 2020, 12, 530. [Google Scholar] [CrossRef] [Green Version]
  35. Kogan, F. World droughts in the new millennium from AVHRR-based vegetation health indices. Eos Trans. Am. Geophys. Union 2002, 83, 557–563. [Google Scholar] [CrossRef]
  36. Sandholt, I.; Rasmussen, K.; Andersen, J. A simple interpretation of the surface temperature/vegetation index space for assessment of surface moisture status. Remote Sens. 2002, 79, 213–224. [Google Scholar] [CrossRef]
  37. Carlson, T.N.; Gillies, R.R.; Perry, E.M. A method to make use of thermal infrared temperature and NDVI measurements to infer surface soil water content and fractional vegetation cover. Remote Sens. Rev. 1994, 9, 161–173. [Google Scholar] [CrossRef]
  38. Moran, M.; Clarke, T.; Inoue, Y.; Vidal, A. Estimating crop water deficit using the relation between surface-air temperature and spectral vegetation index. Remote Sens. Environ. 1994, 49, 246–263. [Google Scholar] [CrossRef]
  39. Sadeghi, M.; Babaeian, E.; Tuller, M.; Jones, S.B. The optical trapezoid model: A novel approach to remote sensing of soil moisture applied to Sentinel-2 and Landsat-8 observations. Remote Sens. Environ. 2017, 198, 52–68. [Google Scholar] [CrossRef] [Green Version]
  40. Guo, H.; Bao, A.; Liu, T.; Ndayisaba, F.; Jiang, L.; Zheng, G.; Chen, T.; De Maeyer, P. Determining variable weights for an optimal scaled drought condition index (OSDCI): Evaluation in central Asia. Remote Sens. Environ. 2019, 231, 111220. [Google Scholar] [CrossRef]
  41. Bokusheva, R.; Kogan, F.; Vitkovskaya, I.; Conradt, S.; Batyrbayeva, M. Satellite-based vegetation health indices as a criteria for insuring against drought-related yield losses. Agric. For. Meteorol. 2016, 220, 200–206. [Google Scholar] [CrossRef] [Green Version]
  42. Han, Y.; Wang, Y.; Zhao, Y. Estimating soil moisture conditions of the greater Changbai Mountains by land surface temperature and NDVI. IEEE Trans. Geosci. Remote Sens. 2010, 48, 2509–2515. [Google Scholar]
  43. Guoliang, Y.T.T. The application of thermal inertia method the monitoring of soil moisture of North China plain based on NOAA-AVHRR data. J. Remote Sens. 1997, 1, 24–32. [Google Scholar]
  44. Fuqin, S.H.T.G.L. Two-layer model for monitoring drought using remote sensing. J. Remote. Sens. 1997, 1, 220–224. [Google Scholar]
  45. Price, J.C. On the analysis of thermal infrared imagery: The limited utility of apparent thermal inertia. Remote Sens. Environ. 1985, 18, 59–73. [Google Scholar] [CrossRef]
  46. Jackson, R.; Reginato, R.; Idso, S. Wheat canopy temperature: A practical tool for evaluating water requirements. Water Resour. Res. 1977, 13, 651–656. [Google Scholar] [CrossRef]
  47. Jackson, R.; Idso, S.; Reginato, R.; Ehrler, W. Crop temperature reveals stress. Crops Soils 1977, 29, 10–13. [Google Scholar]
  48. Ozelkan, E.; Chen, G.; Ustundag, B.B. Multiscale object-based drought monitoring and comparison in rainfed and irrigated agriculture from Landsat 8 OLI imagery. Int. J. Appl. Earth Obs. Geoinf. 2016, 44, 159–170. [Google Scholar] [CrossRef]
  49. Ghaleb, F.; Mario, M.; Sandra, A.N. Regional landsat-based drought monitoring from 1982 to 2014. Climate 2015, 3, 563–577. [Google Scholar] [CrossRef] [Green Version]
  50. Zhou, X.; Wang, P.; Tansey, K.; Zhang, S.; Li, H.; Wang, L. Developing a fused vegetation temperature condition index for drought monitoring at field scales using Sentinel-2 and MODIS imagery. Comput. Electron. Agric. 2020, 168, 105144. [Google Scholar] [CrossRef]
  51. Puletti, N.; Mattioli, W.; Bussotti, F.; Pollastrini, M. Monitoring the effects of extreme drought events on forest health by Sentinel-2 imagery. J. Appl. Remote Sens. 2019, 13, 020501. [Google Scholar] [CrossRef]
  52. Klisch, A.; Atzberger, C. Operational drought monitoring in Kenya using MODIS NDVI time series. Remote Sens. 2016, 8, 267. [Google Scholar] [CrossRef] [Green Version]
  53. Wan, Z.; Wang, P.; Li, X. Using MODIS land surface temperature and normalized difference vegetation index products for monitoring drought in the southern Great Plains, USA. Int. J. Remote Sens. 2004, 25, 61–72. [Google Scholar] [CrossRef]
  54. Zhao, W.; He, J.; Yin, G.; Wen, F.; Wu, H. Spatiotemporal variability in land surface temperature over the mountainous region affected by the 2008 Wenchuan earthquake from 2000 to 2017. J. Geophys. Res. Atmos. 2019, 124, 1975–1991. [Google Scholar] [CrossRef]
  55. Zhao, W.; He, J.; Wu, Y.; Xiong, D.; Wen, F.; Li, A. An analysis of land surface temperature trends in the central Himalayan region based on MODIS products. Remote Sens. 2019, 11, 900. [Google Scholar] [CrossRef] [Green Version]
  56. Niu, W.; Xia, H.; Wang, R.; Pan, L.; Meng, Q.; Qin, Y.; Li, R.; Zhao, X.; Bian, X.; Zhao, W. Research on large-scale urban shrinkage and expansion in the yellow river affected area using night light data. ISPRS Int. J. Geo Inf. 2021, 10, 5. [Google Scholar] [CrossRef]
  57. Shen, W.; Zheng, Z.; Qin, Y.; Li, Y. Spatiotemporal characteristics and driving force of ecosystem health in an important ecological function region in China. Int. J. Environ. Res. Public Health 2020, 17, 5075. [Google Scholar] [CrossRef] [PubMed]
  58. Si-Yuan, W.; Jing-Shi, L.; Cun-Jian, Y. Eco-environmental vulnerability evaluation in the Yellow River Basin, China. Pedosphere 2008, 18, 171–182. [Google Scholar]
  59. Shi, H.; Shao, M. Soil and water loss from the Loess Plateau in China. J. Arid. Environ. 2000, 45, 9–20. [Google Scholar] [CrossRef] [Green Version]
  60. Zhu, Y.; Liu, Y.; Ma, X.; Ren, L.; Singh, V.P. Drought analysis in the yellow river basin based on a short-scalar palmer drought severity index. Water 2018, 10, 1526. [Google Scholar] [CrossRef] [Green Version]
  61. Pan, L.; Xia, H.; Yang, J.; Niu, W.; Wang, R.; Song, H.; Guo, Y.; Qin, Y. Mapping cropping intensity in Huaihe basin using phenology algorithm, all Sentinel-2 and Landsat images in Google Earth Engine. Int. J. Appl. Earth Obs. Geoinf. 2021, 102, 102376. [Google Scholar] [CrossRef]
  62. Pan, L.; Xia, H.; Zhao, X.; Guo, Y.; Qin, Y. Mapping winter crops using a phenology algorithm, time-series Sentinel-2 and Landsat-7/8 images, and Google Earth Engine. Remote Sens. 2021, 13, 2510. [Google Scholar] [CrossRef]
  63. Xia, H.; Zhao, J.; Qin, Y.; Yang, J.; Cui, Y.; Song, H.; Ma, L.; Jin, N.; Meng, Q. Changes in water surface area during 1989–2017 in the Huai River Basin using Landsat data and Google earth engine. Remote Sens. 2019, 11, 1824. [Google Scholar] [CrossRef] [Green Version]
  64. Yang, M.; Zhao, W.; Zhan, Q.; Xiong, D. Spatiotemporal patterns of land surface temperature change in the tibetan plateau based on MODIS/Terra daily product from 2000 to 2018. J. Sel. Top. Appl. Earth Obs. Remote Sens. 2021, 14, 6501–6514. [Google Scholar] [CrossRef]
  65. Bechtel, B. A new global climatology of annual land surface temperature. Remote Sens. 2015, 7, 2850–2870. [Google Scholar] [CrossRef] [Green Version]
  66. Zhang, L.; Jiao, W.; Zhang, H.; Huang, C.; Tong, Q. Studying drought phenomena in the Continental United States in 2011 and 2012 using various drought indices. Remote Sens. Environ. 2017, 190, 96–106. [Google Scholar] [CrossRef]
  67. Savitzky, A.; Golay, M.J. Smoothing and differentiation of data by simplified least squares procedures. Anal. Chem. 1964, 36, 1627–1639. [Google Scholar] [CrossRef]
  68. Jakubauskas, M.E.; Legates, D.R.; Kastens, J.H. Crop identification using harmonic analysis of time-series AVHRR NDVI data. Comput. Electron. Agric. 2002, 37, 127–139. [Google Scholar] [CrossRef]
  69. Eilers, P.H. A perfect smoother. Anal. Chem. 2003, 75, 3631–3636. [Google Scholar] [CrossRef]
  70. Pal, M. Random forest classifier for remote sensing classification. Int. J. Remote Sens. 2005, 26, 217–222. [Google Scholar] [CrossRef]
  71. Cao, R.; Chen, Y.; Shen, M.; Chen, J.; Zhou, J.; Wang, C.; Yang, W. A simple method to improve the quality of NDVI time-series data by integrating spatiotemporal information with the Savitzky-Golay filter. Remote Sens. Environ. 2018, 217, 244–257. [Google Scholar] [CrossRef]
  72. Chen, J.; Jönsson, P.; Tamura, M.; Gu, Z.; Matsushita, B.; Eklundh, L. A simple method for reconstructing a high-quality NDVI time-series data set based on the Savitzky–Golay filter. Remote Sens. Environ. 2004, 91, 332–344. [Google Scholar] [CrossRef]
  73. Wang, F.; Wang, Z.; Yang, H.; Zhao, Y.; Li, Z.; Wu, J. Capability of remotely sensed drought indices for representing the spatio–temporal variations of the meteorological droughts in the Yellow River Basin. Remote Sens. 2018, 10, 1834. [Google Scholar] [CrossRef] [Green Version]
  74. King, A.D.; Pitman, A.J.; Henley, B.J.; Ukkola, A.M.; Brown, J.R. The role of climate variability in Australian drought. Nat. Clim. Chang. 2020, 10, 177–179. [Google Scholar] [CrossRef]
  75. Hanson, P.J.; Weltzin, J.F. Drought disturbance from climate change: Response of United States forests. Sci. Total. Environ. 2000, 262, 205–220. [Google Scholar] [CrossRef]
  76. Song, Y.; Wang, J.; Yu, Q.; Huang, J. Using MODIS LAI data to monitor spatio-temporal changes of winter wheat phenology in response to climate warming. Remote Sens. 2020, 12, 786. [Google Scholar] [CrossRef] [Green Version]
  77. Orimoloye, I.R.; Ololade, O.O.; Belle, J.A. Satellite-based application in drought disaster assessment using terra MOD13Q1 data across free state province, South Africa. J. Environ. Manag. 2021, 285, 112112. [Google Scholar] [CrossRef] [PubMed]
  78. Dyosi, M.; Kalumba, A.; Magagula, H.; Zhou, L.; Orimoloye, I.R. Drought conditions appraisal using geoinformatics and multi-influencing factors. Environ. Monit. Assess. 2021, 193, 1–19. [Google Scholar] [CrossRef]
Figure 1. The Yellow River Basin and its land cover types.
Remotesensing 13 03748 g001
Figure 2. Sketch illustrating parameters of the traditional Thermal-optical Trapezoid model [39].
Remotesensing 13 03748 g002
Figure 3. Root Mean Square Error (RMSE) distribution of the difference between ATC and MODIS LST.
Remotesensing 13 03748 g003
Figure 4. Statistics of the difference between ATC and MODIS drought indices. (a) Spatial distribution of TCIdif; (b) percentage statistics of different TCIdif pixels; (c) spatial distribution of VHIdif; (d) percentage statistics of different VHIdif pixels; (e) spatial distribution of TVDIdif; (f) percentage statistics of different TVDIdif pixels.
Remotesensing 13 03748 g004aRemotesensing 13 03748 g004b
Figure 5. Correlation of the drought index with precipitation, air temperature, and soil moisture. (a) Grasslands; (b) croplands; (c) barren; (d) deciduous broadleaf forest; (e) savannas; (f) urban; (g) mixed forest; (h) woody savannas.
Remotesensing 13 03748 g005aRemotesensing 13 03748 g005b
Figure 6. Average of drought index during the period 2003–2019. (a) TCI; (b) VCI; (c) VHI; (d) TVDI.
Remotesensing 13 03748 g006
Figure 7. Significance of drought indices change trends during the period 2003–2019. (a) TCI; (b) VCI; (c) VHI; (d) TVDI.
Remotesensing 13 03748 g007
Figure 8. Time series analysis of drought indices in different land types. (a) Grasslands; (b) croplands; (c) barren; (d) deciduous broadleaf forests; (e) savannas; (f) urban and built-up lands; (g) mixed forests; (h) woody savannas.
Remotesensing 13 03748 g008aRemotesensing 13 03748 g008b
Figure 9. Average of SPI and PDSI with a 1-month time scale during the period 2003–2019. (a) SPI; (b) PDSI.
Remotesensing 13 03748 g009
Table 1. Land cover type and proportion.
NumberLand TypeArea (×104 km2)Area Proportion
1Grasslands58.93150.57%
2Croplands33.80129.01%
3Barren11.5359.90%
4Deciduous Broadleaf Forests3.6653.15%
5Savannas3.1512.70%
6Urban and Built-up Lands1.6831.44%
7Mixed Forests1.5851.36%
8Woody Savannas1.4761.27%
9Cropland/Natural Vegetation Mosaics0.4090.35%
10Permanent Wetlands0.1340.11%
11Open Shrub lands0.090.08%
12Closed Shrub lands0.0480.04%
13Evergreen Needleleaf Forests0.0180.02%
Table 2. Main data used in this study.
Data ProductsData TypeSpatial ResolutionTemporal ResolutionTime Span
MOD13A2.006NDVI1000 m16 days2000–2020
MYD11A1.006LST1000 mdaily2002–2020
MCD12Q1.006LC_Type1500 myearly2001–2019
TerraClimatepr, soil, tmmx2.5 arc minutesmonthly1958–2019
JRCWater30 myearly1984–2019
Table 3. Calculation formula of single factor drought index.
Drought IndexData SourceFormulas
TCIMODIS T C I = L S T m a x L S T i L S T m a x L S T m i n
VCIMODIS V C I = N D V I i N D V I m i n N D V I m a x N D V I m i n
Table 4. Calculation formula for multi-factor drought index.
Drought IndexFormulasWeightWeight Type
VHI V H I = α T C I + β V C I α = 0.5 , β = 0.5 Experience weight
Table 5. Drought level classification scheme [66].
Drought LevelTCIVCIVHITVDI
Extreme drought0–0.10–0.10–0.1
Severe drought0.1–0.20.1–0.20.1–0.20.8–1
Moderate drought0.2–0.30.2–0.30.2–0.30.6–0.8
Mild drought0.3–0.40.3–0.40.3–0.40.4–0.6
Abnormal drought0.4–0.50.4–0.5
No drought(arid)0.5–10.5–10.4–10–0.4
Table 6. Number of outliers in the MODIS LST data from 2003 to 2019.
YearLess Than −10 °CLess Than 0 °CGreater Than 40 °CGreater Than 50 °C
20031713401
2004815458226
2005121268715
20061148947044
200701225737
20081703272252521
2009136759720
201001264307
2011122746363
201235822693823
201307158414
201412304876
2015119456816
201601254353
2017016261413
2018464357511
2019015415904
Table 7. Maximum and minimum annual average LST from 2003 to 2019.
YearMODmax (°C)MODmin (°C)ATCmax (°C)ATCmin (°C)
200350.05−10.3536.1453.467
200455.89−12.5137.1572.332
200553.35−17.3137.0830.933
200653.41−13.8138.0112.14
200752.67−7.4736.4752.151
200854.23−18.5137.2270.583
200955.95−11.8337.6093.011
201052.51−9.5935.9483.153
201151.11−11.4136.4923.086
201251.35−20.2936.8670.469
201354.15−4.8737.8413.885
201454.87−18.2137.5242.817
201553.17−15.6537.4321.571
201652.11−9.2136.7873.537
201752.41−6.9438.0021.259
201853.45−11.9936.8883.471
201951.23−8.5937.426−1.402
Table 8. Statistic of Slope in different land cover types.
Land Cover TypeTCIVCIVHITVDI
Grasslands0.0003 0.0042 0.0023 −0.0019
Croplands−0.0019 0.0016 −0.0001 −0.0007
Barren−0.0017 0.0010 −0.0003 0.0013
Deciduous Broadleaf Forests0.0004 0.0025 0.0014 −0.0027
Savannas0.0003 0.0028 0.0016 −0.0032
Urban and Built-up Lands−0.0027 −0.0016 −0.0022 0.0005
Mixed Forests0.0005 0.0025 0.0015 −0.0020
Woody Savannas0.0005 0.0025 0.0015 −0.0028
Table 9. Statistic of p-Value in different land cover types.
p-ValueTCIVCIVHITVDI
Grasslands0.5850.0010.0080.059
Croplands0.0800.0101.0000.558
Barren0.1070.0130.7240.136
Deciduous Broadleaf Forests0.4350.0000.0060.135
Savannas0.4590.0000.0020.036
Urban and Built-up Lands0.0120.0070.0030.842
Mixed Forests0.2390.0000.0010.140
Woody Savannas0.4330.0000.0040.111
Publisher’s Note: MDPI stays neutral with regard to jurisdictional claims in published maps and institutional affiliations.

