
MUSSOL: A Micro-Uas to Survey Ship Cargo hOLds
by
 , ,
, ,
Francisco Bonnin-Pascual
1,2 ,
,
Emilio Garcia-Fidalgo
1,2 ,
,
Joan P. Company-Corcoles
1,2 and
Alberto Ortiz
1,2,* 1
Department of Mathematics and Computer Science, University of the Balearic Islands, Cra. de Valldemossa km 7.5, 07122 Palma de Mallorca, Spain
2
IDISBA (Institut d’Investigacio Sanitaria de les Illes Balears), Cra. de Valldemossa 79, 07120 Palma de Mallorca, Spain
*
Author to whom correspondence should be addressed.
Remote Sens. 2021, 13(17), 3419; https://doi.org/10.3390/rs13173419
Submission received: 1 August 2021
/
Revised: 23 August 2021
/
Accepted: 24 August 2021
/
Published: 28 August 2021
(This article belongs to the Special Issue Robotics and AI for Infrastructure Inspection and Monitoring)
Abstract
:Because of their high maneuverability and fast deployment times, aerial robots have recently gained popularity for automating inspection tasks. In this paper, we address the visual inspection of vessel cargo holds, aiming at safer, cost-efficient and more intensive visual inspections of ships by means of a multirotor-type platform. To this end, the vehicle is equipped with a sensor suite able to supply the surveyor with imagery from relevant areas, while the control software is supporting the operator during flight with enhanced functionalities and reliable autonomy. All this has been accomplished in the context of the supervised autonomy (SA) paradigm, by means of extensive use of behaviour-based high-level control (including obstacle detection and collision prevention), all specifically devised for visual inspection. The full system has been evaluated both in laboratory and in real environments, on-board two different vessels. Results show the vehicle effective for the referred application, in particular due to the inspection-oriented capabilities it has been fitted with.
1. Introduction
Structural failures are the major cause of maritime accidents. For these reasons, an important part of the inspection effort focuses on ensuring that the hull surfaces and structures from the different vessel areas are all in good condition. Those structures and surfaces can be affected by different kinds of defective situations, such as coating breakdown, corrosion, and, ultimately, cracks. The presence and spread of these defects are indicators of the state of the vessel hull and, as such, an early detection prevents the structure from buckling or fracturing.
In this regard, since visual inspections are and will be an important source of information for structure condition assessment, it seems necessary to try to reduce the effort and cost related to these activities with the introduction of new technological tools which can complement and make safer the human inspections. This becomes particularly relevant for, at least, those ships where there is a real cost saving, i.e., the inspection is likely to result in no repair, so that the preparation of the vessel is indeed for the inspection itself [1].
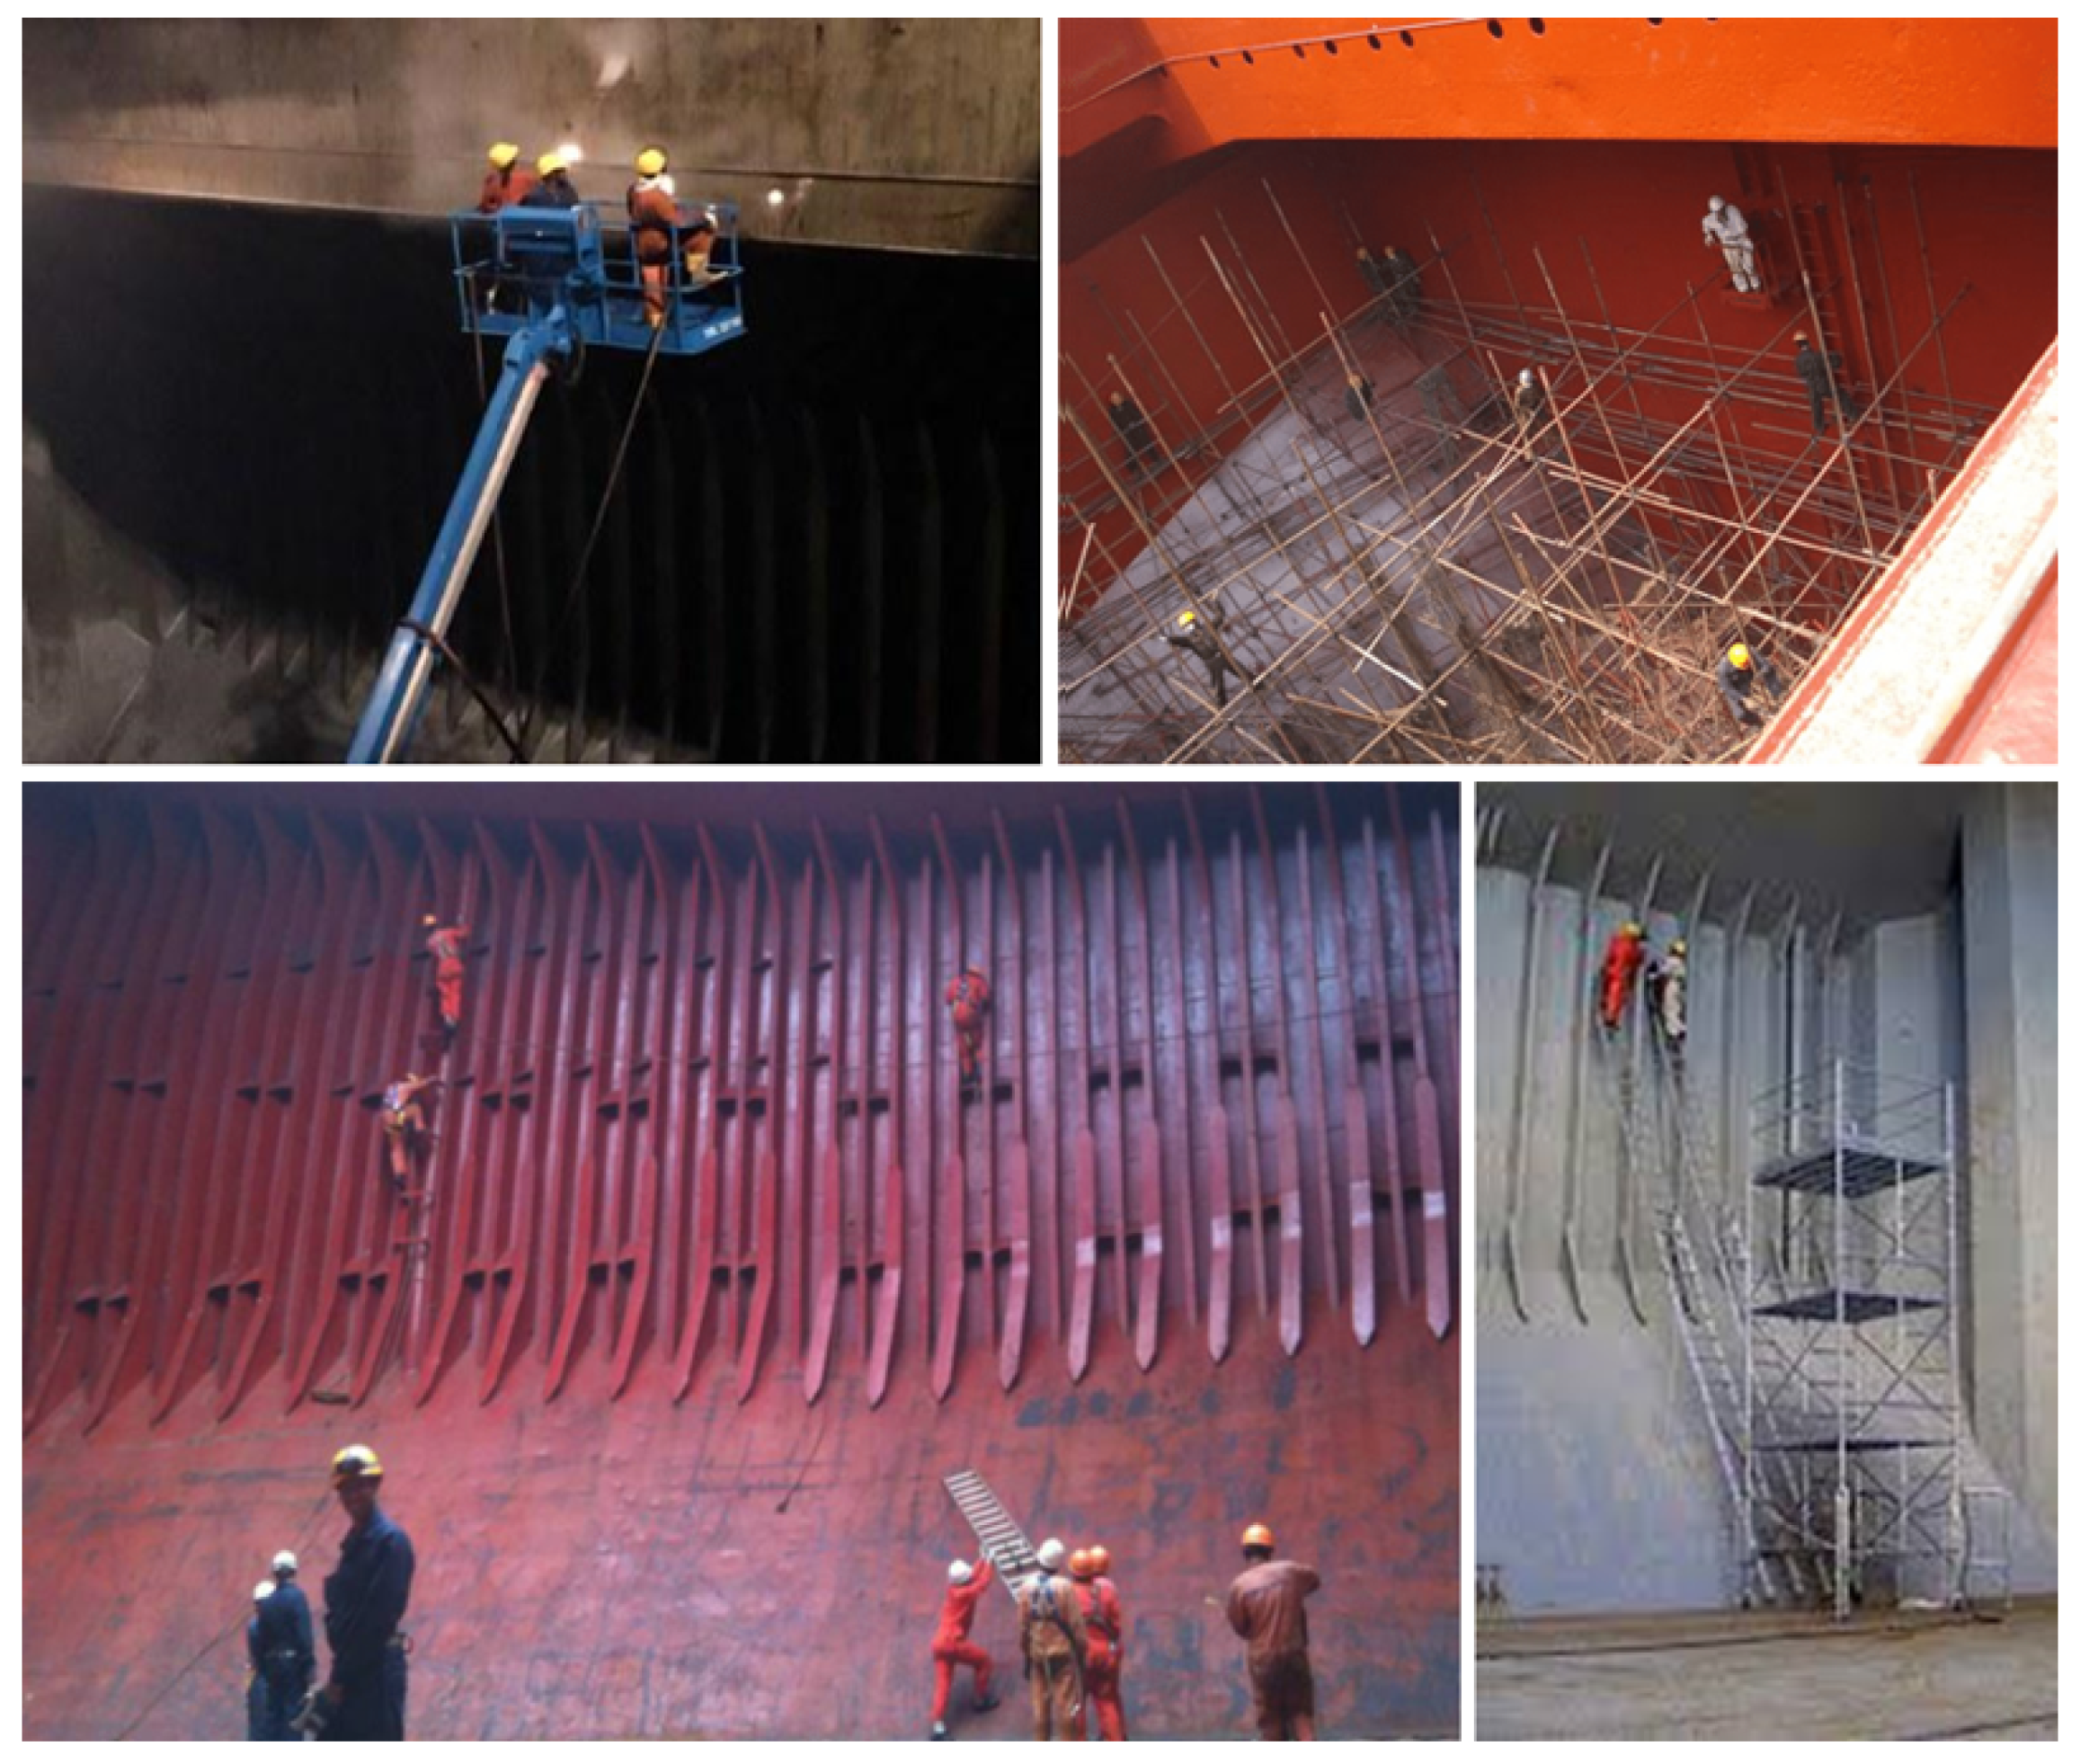
Cargo holds and cargo tanks, which can be found in e.g., bulk carriers, container ships, tankers or general cargoes, are vessel areas that are considered by the H2020 ROBINS project (www.robins-project.eu, accessed on 27 August 2021) as representative of the operational scenarios where costs and risks connected to inspection activities are more significant. These environments feature wide volumes with significant heights, which typically require costly access means to reach highest points. Moreover, the large unobstructed heights between levels may imply safety risks for surveyors. In these environments, inspections are nowadays carried out by means of mainly scaffolding, portable ladders, and cherry pickers (see Figure 1).
For such scenarios, it is clear the interest in the use of robotic platforms that permit surveyors to perform safer and more comfortable inspections. Aerial robots have already been shown as potential solutions for these cases, given their ability to reach areas hard to access for humans. However, manoeuvring these vehicles is not an easy task for a non-expert user. This suggests the idea of devising inspection-oriented platforms with usability in mind. Under this context, in this paper, we introduce MUSSOL, a novel and robust unmanned aerial platform specifically devised for collecting inspection data from the aforementioned vessels’ areas. In more detail, its control architecture is intended to fit the robot with enhanced functionalities and skills aiming at safer, more efficient and potentially more intensive visual inspections. To this end, MUSSOL is equipped with a sensor suite intended to supply the surveyor with inspection data from the areas that require attention, while, during inspections, the platform takes care of low-level control issues, as well as of its own preservation, thanks to its control architecture.
The control software has been implemented around the Supervised Autonomy (SA) paradigm [2], defining several autonomy levels and making extensive use of behaviour-based high-level control. In respect to our previous works in this area, the platform here described constitutes a new development, from both the hardware and software points of view, taking into account the lessons learnt from the performance of previous designs, as well as the advice from end-users (as part of the developments during the EU-H2020 project ROBINS). In respect to this and after a number of careful considerations, the full system has been designed (both hardware and software) with the visual inspection problem in mind, so that the result which is here described is fully oriented to generic visual inspection, with a particular focus on vessel inspection, and this can be considered as the main contribution of this work.
The rest of the paper is organized as follows: Section 2 overviews the platform requirements and reviews related works; Section 3 overviews the system developed, while Section 4 details the hardware integrated into the robot, and Section 5 describes the platform’s control architecture; Section 6 focuses on the interface with the user, considering either the available platform operation modes and commands, as well as the platform feedback to the operator, all this available through the system ground station; Section 7 reports on experimental results, collected from both laboratory environments and field trials; finally, Section 8 summarizes main conclusions and findings.
2. Platform Requirements and Related Work
The assessment of the structural integrity of a vessel entails, among others, the evaluation of the condition of different structures that can be found within vessel holds [1,3]. The fact that these holds consist of mainly high vertical structures is of particular relevance for close-up visual inspection procedures (see Figure 1), as this requires the provision of access means together with work at high altitude. Hence, to make proper repair/no repair decisions, the surveyor must be provided with imagery detailed enough so as to enable the remote visual assessment of the involved structures by means of the aerial platform imaging devices. Furthermore, the platform can be either required to sweep the relevant metallic surfaces and grab pictures at a rate compatible with its speed, or else provide visual evidence of the state of a particular area suspected of being defective. Those images are in turn desirable to be tagged with pose information, so that the areas suspected of being defective can be located on the vessel structure, and even revisited for comparing images across inspections.
Therefore, the main requirements for the aerial platform stem directly from the very nature of the inspection process: the vehicle must be able to perform vertical, stationary and low speed flight, as well as permit indoor flight. These requirements rapidly discard fixed-wing aircraft and focus the search on helicopter-type UAVs, naturally capable of manoeuvres such as hovering and vertical take-off and landing. Additionally, the platform should not only rely on GPS data for positioning because it could be required to operate indoors or in poor GPS reception areas (e.g., due to satellites being occluded by the vessel structures, multi-path effects, etc.).
Because of their fast deployment times and convenient size, a number of recent works have considered the use of multirotor-based vehicles within the context of the inspection and monitoring of industrial facilities and assets, for data collection at remote or safety-compromised areas, difficult to reach by humans and ground vehicles, and with large areas to be covered as fast as possible. The aforementioned works consider, among others, power plant boilers and chimneys [4,5,6], dam walls and penstocks [7,8], bridges [9,10,11], power lines [12,13,14], wind turbines [15,16], mines and tunnels [17,18], petrochemical facilities [19,20], and large-tonnage vessels [21,22]. A survey on existing UAS for the inspection of varied infrastructures can be found in [23].
The popularity that these vehicles have gained in recent years has led to the availability of a number of control and navigation solutions. They differ mainly in the sensors used to solve the navigation tasks, the amount of processing that is performed on-board/off-board, and the assumptions made about the environment. Apart from other devices, such as infrared and ultrasound sensors, laser scanners [24,25,26,27] and vision cameras [28,29,30,31,32,33] have become the preferred sensor modalities to undertake these tasks, mostly within Simultaneous Localization and Mapping (SLAM) frameworks and combined with Inertial Measuring Units (IMU).
The inspection solution presented in this paper is built on top of the previous experience of the research team, which has been involved in past research projects related to vessel inspection and many field trials on-board a diverse set of vessels: bulk carriers, oil tankers, containerships, and Ro-Ro vessels. More specifically, projects MINOAS and INCASS had among their goals the development of robotic devices that could be incorporated into visual inspection procedures. Their respective outputs comprised, among others, first aerial platforms specifically designed for ship inspection (although with a different focus with regard to project ROBINS). Starting from the multi-rotor platforms developed along projects MINOAS (first proof of concept, [34]) and INCASS (purely tele-operated platform, [35]), and taking into account the lessons learnt during the respective field trials, several options about structure, control approach, platform localization, capabilities and interface with the user have been considered and integrated within the framework of project ROBINS to increase the Technology Readiness Level (TRL) of the platform, with a special focus on platform autonomy and the development of a full inspection system around the SA paradigm (accordingly with end-user needs). A first, partial description of the cargo-hold inspection ROBINS platform can be found in [36].
3. System Overview
Operating an aerial robot in close proximity to a structure can be a challenging task due to complex environmental conditions and potentially poor situation awareness of the remote pilot. To reduce the mental workload of the pilot in these situations, it is clear that it is beneficial to provide the vehicle with its own situation awareness. Following this idea, the control architecture of the robot has been designed around the SA paradigm [2]. This model defines a framework for human-robot interaction that aims at the alleviation of stress on human users through an appropriate level of instructions and feedback. In other words, the human user is not burdened with the complete control of the system, and hence he can concentrate on the inspection task at hand.
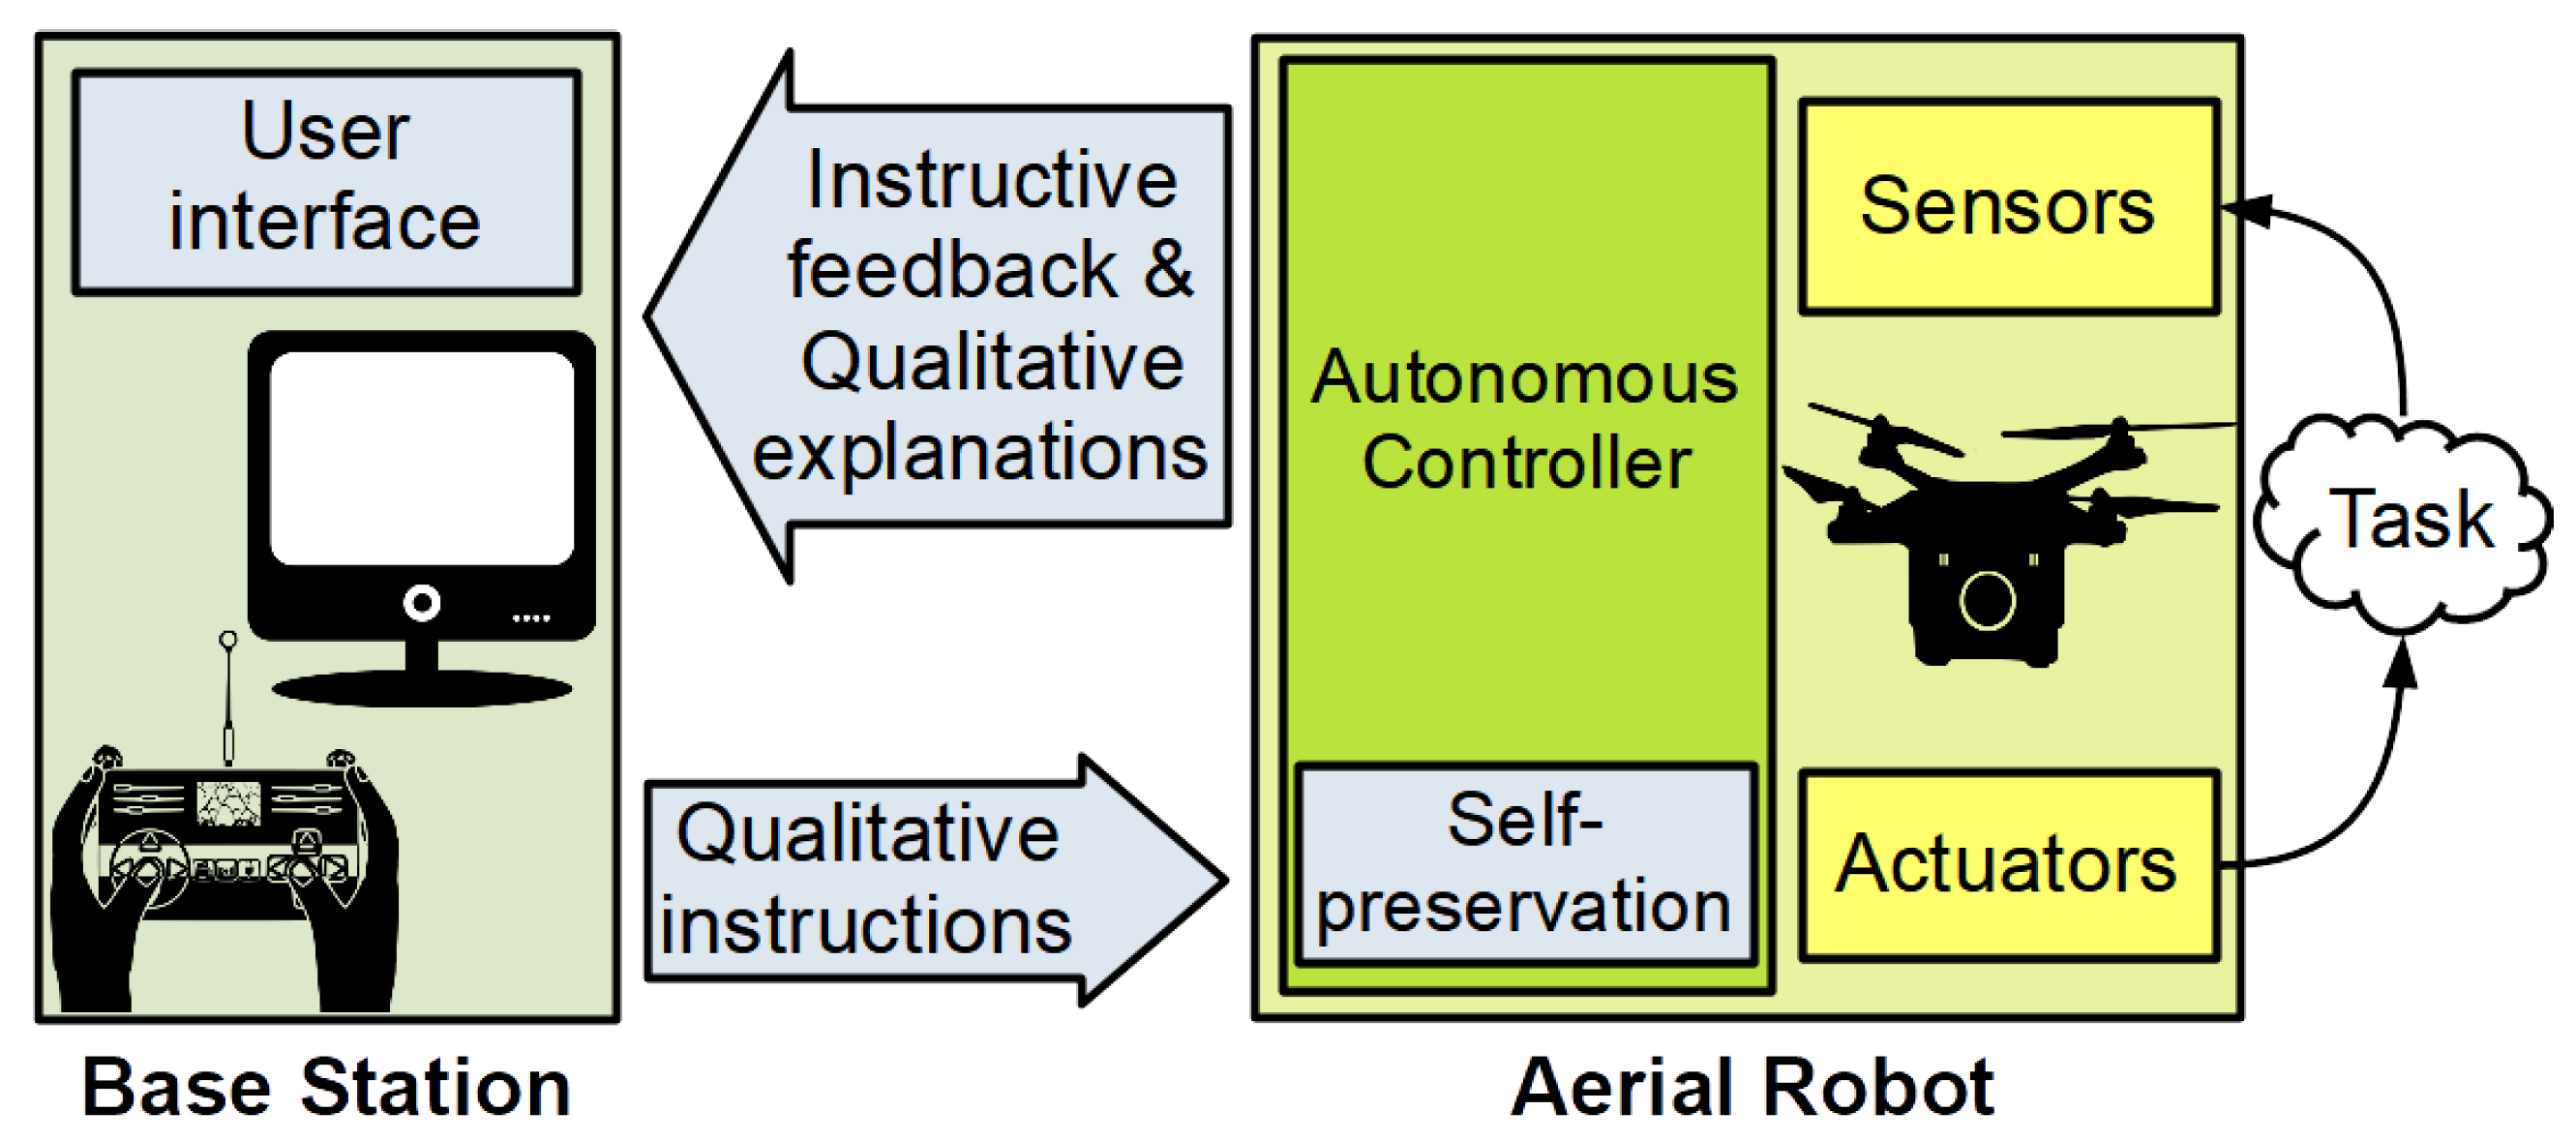
The SA framework comprises five concepts: self preservation, which states that the robot itself is in charge of performing the necessary tasks to ensure its integrity; instructive feedback, used to provide the user with the same perception capabilities as the robot; qualitative instructions, to command the robot in an easy-to-understand manner; qualitative explanations, to show to the user what is happening using a language similar to the qualitative instructions; and a user interface to visualize the instructive feedback and allow the user to issue qualitative instructions. Figure 2 illustrates graphically the full visual inspection system, designed in accordance to the SA paradigm as explained above.
To implement the SA framework, the system architecture comprises two separate agents: the vehicle and the Base Station (BS). On the one hand, the aerial platform, which is fitted with suitable sensors and actuators, is in charge of working out the control-related issues required to successfully carry out the specific task. Moreover, the same autonomous controller is also in charge of the self-preservation of the platform. On the other hand, the base station allows the operator/surveyor to feed the robot with qualitative instructions by means of human-robot interaction devices. At the same time, the BS provides the operator/surveyor with information about the mission’s state and the robot status, using instructive feedback and qualitative explanations. The communication between both agents is performed via wireless connections. For the case of the aerial robot, the autonomous controller comprises a set of behaviours that are in charge of accomplishing the intended task while ensuring the platform self-preservation. By way of illustration, a behaviour can be in charge of moving the platform as indicated by the user, another can prevent collisions with the surrounding obstacles, another can keep a constant distance to the inspected surface, etc.
This design introduces the user into the main control loop, allowing him to take control of the platform whenever necessary, e.g., to take the vehicle to a specific point of the environment (which cannot be reached autonomously, or just because allowing an autonomous operation can be unsafe), or maybe to perform an emergency, corrective action. In both cases, the operator is assisted at all time by the control software. Furthermore, the SA paradigm allows for the incorporation of as much autonomy as desired in order to provide additional levels of assistance for the task at hand (what, according to past experience, fully agrees with the end-user needs).
Summing up, the platform is hence fitted with a number of autonomous functionalities focusing on the particularities of visual inspection, but it is designed for safe tele-operation from its very inception. This permits performing certain inspection operations autonomously, and also allows the user to reach any point of the inspection area which cannot be attained autonomously, in a safe and assisted way to simplify the flight. Moreover, the user can take control at any moment during any flight, to introduce corrections or avoid a major problem. All this intends to make the platform a flexible and usable tool. The details of how MUSSOL accomplishes all this are given in the following sections.
4. Hardware Architecture and Sensor Suite
As for any other application of sufficient relevance, the design of the flying inspection tool requires accurate enough estimates of the platform state during flight, mostly comprising the vehicle pose and/or speed. As it is well known, flying inside enclosed spaces makes it difficult to use GNSS systems, such as GPS, for state estimation purposes. Furthermore, the large dimensions of holds and tank vessels make normally unfeasible the use of typical motion tracking systems (which in turn can be affected by the presence of traces of goods or rust particles). Because of that, the estimation of the vehicle state must rely on available on-board sensors, what requires fitting the platform with an adequate navigation sensor suite. For obvious reasons, the focus has been on lightweight devices that can be easily carried as payload by an aerial robot.
As already mentioned, the MUSSOL aerial platform implements a multi-rotor design, which takes, as a basis, the Matrice 100 quadrotor by DJI. This model is fitted, by default, with a Flight Management Unit (FMU) for platform stabilization in roll, pitch and yaw, and thrust control. This FMU is equipped with a 3-axis Inertial Measurement Unit (IMU) and a barometric pressure sensor. Additionally, the original configuration supplied by the platform’s manufacturer comprises a GPS receiver and a compass.
In order to enhance the platform with the capabilities required for the inspection task, the vehicle features the following additional sensors and devices:
- A lightweight laser scanner Hokuyo UST-20LX, which provides 20 m coverage for a 270° angular sector. This sensor is used to estimate 2D speed as well as to measure the distance to surrounding obstacles.
- A downward-looking LIDAR-Lite v3 single-beam laser range finder used to supply height data for a maximum range of 40 m. This sensor complements the aforementioned barometric pressure sensor the vehicle is fitted with as part of its FMU. Vertical speed is estimated by proper differentiation of the height measurements.
- An upward-looking TeraRanger Evo 60 m Time-of-Flight (ToF) infrared range finder to supply the distance to the ceiling up to a maximum range of 60 m.
- Upward-oriented MaxBotix HRLV EZ0 and backward-oriented MaxBotix HRLV EZ4 ultrasonic sensors (US) to supply the distance to the closest obstacle upwards/backwards, up to a maximum range of 5 m (these sensors complement, respectively, the upward-looking IR ranger finder thanks to the US wider lobe, what allows detecting any close obstacle above the platform during flight, and the laser scanner, which does not cover the 360° circumference around the platform).
- An imaging system, including own light sources in the form of:
- −
- two front-looking pairs of LEDs, capable of delivering 2 × 613 lumens per pair (11.2 V, 3.92 W), and
- −
- one upward-looking pair of LEDs, with the same technical specifications;
and two cameras to collect, from the vessel structures under inspection, two streams:- −
- RGB-D images on demand, from an Intel Realsense D435i camera, integrating a 6 DOF IMU, and
- −
- video footage, by means of either: (1) a Zenmuse X3 camera, or (2) an auto-focus/zoom-capable Zenmuse Z3 camera, each mounted on a gimbal.
- An Ultra-Wide Band (UWB) Pozyx receiver/tag, used as part of a UWB-based global localization system.
- An embedded PC fitted with an Intel Core i7-8650U, 4 × 1.9 GHz processor with 16 GB RAM. Among others, the on-board PC avoids sending sensor data to the base station, but processes them on-board and, thus, prevents communications latency inside critical control loops.
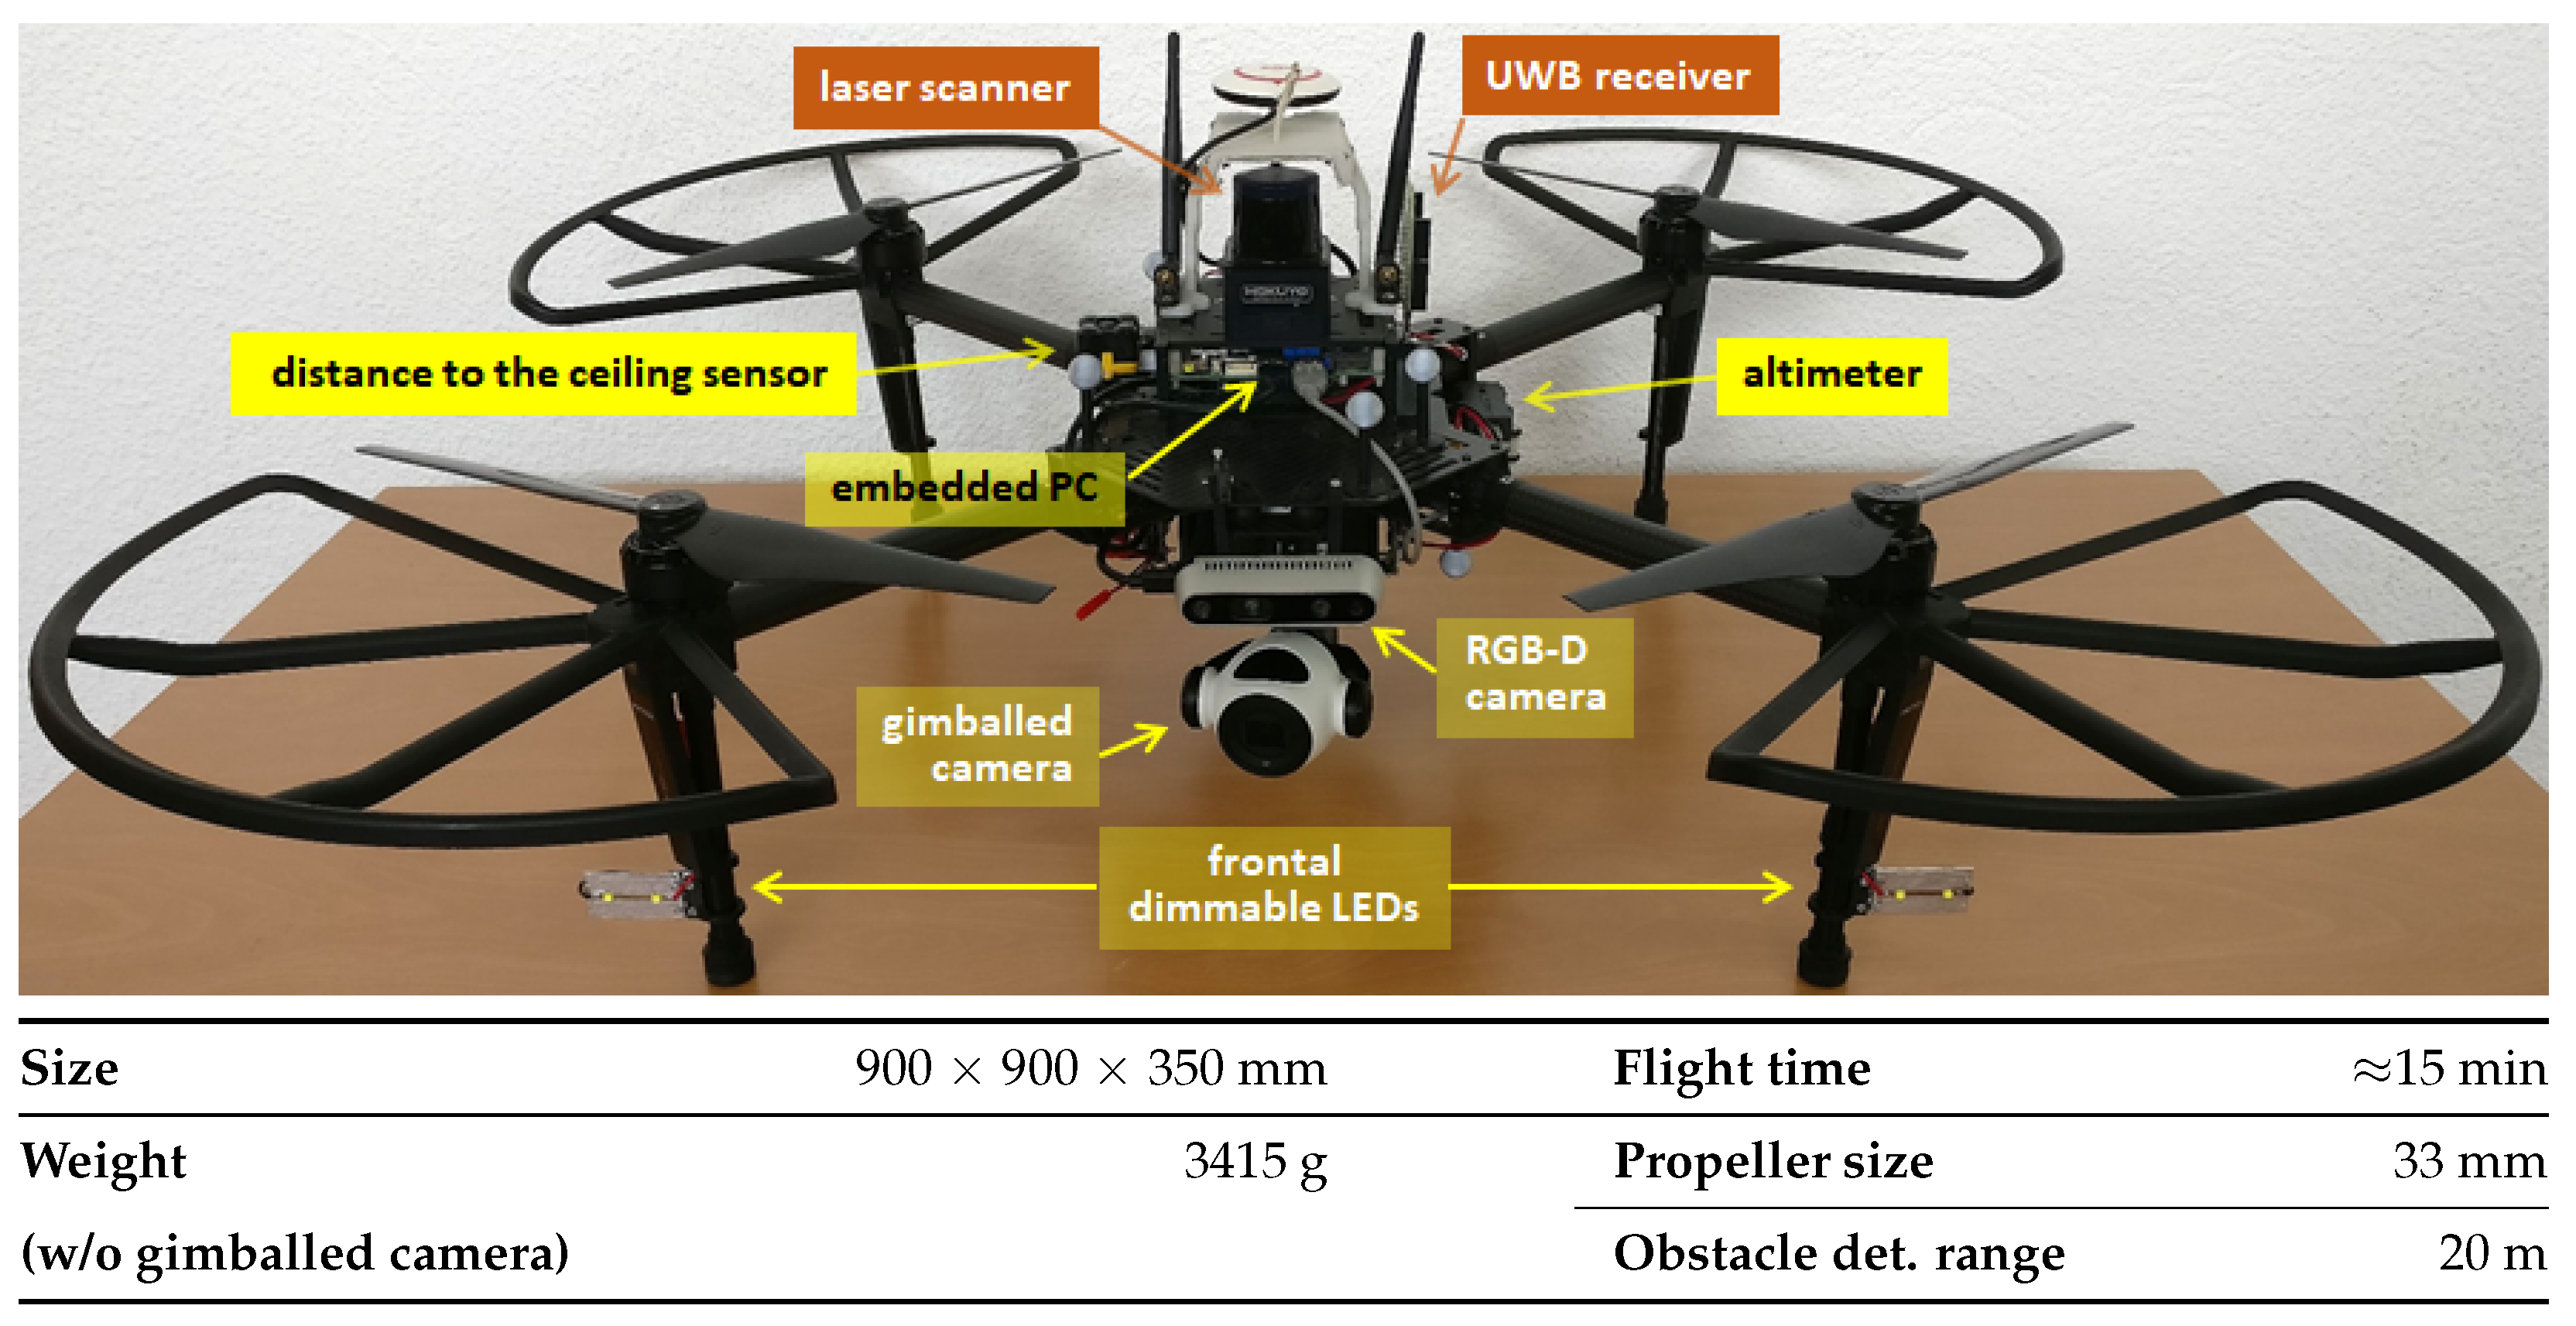
These devices have been chosen on the basis of the requirements stemming from the application (outlined in Section 1 and Section 2) as well as from lessons learnt from previous developments and trials. Figure 3 shows the aerial platform, with detailed indication of the localization of each main component.
Apart from other sensor suites capable of also supplying speed and height measurements, the previous configuration allows navigation under low-light conditions, as required in certain vessel compartments such as e.g., oil tanker cargo holds, for which a single manhole-sized entry point is typically available. Further, the LED-based system is intended to facilitate the capture of useful images despite the absence of ambient lighting. Thanks to a specific power system, they can be remotely dimmed from the embedded PC to adjust light to the available ambient illumination and to the operating distance to the walls during flight.
5. Control Architecture
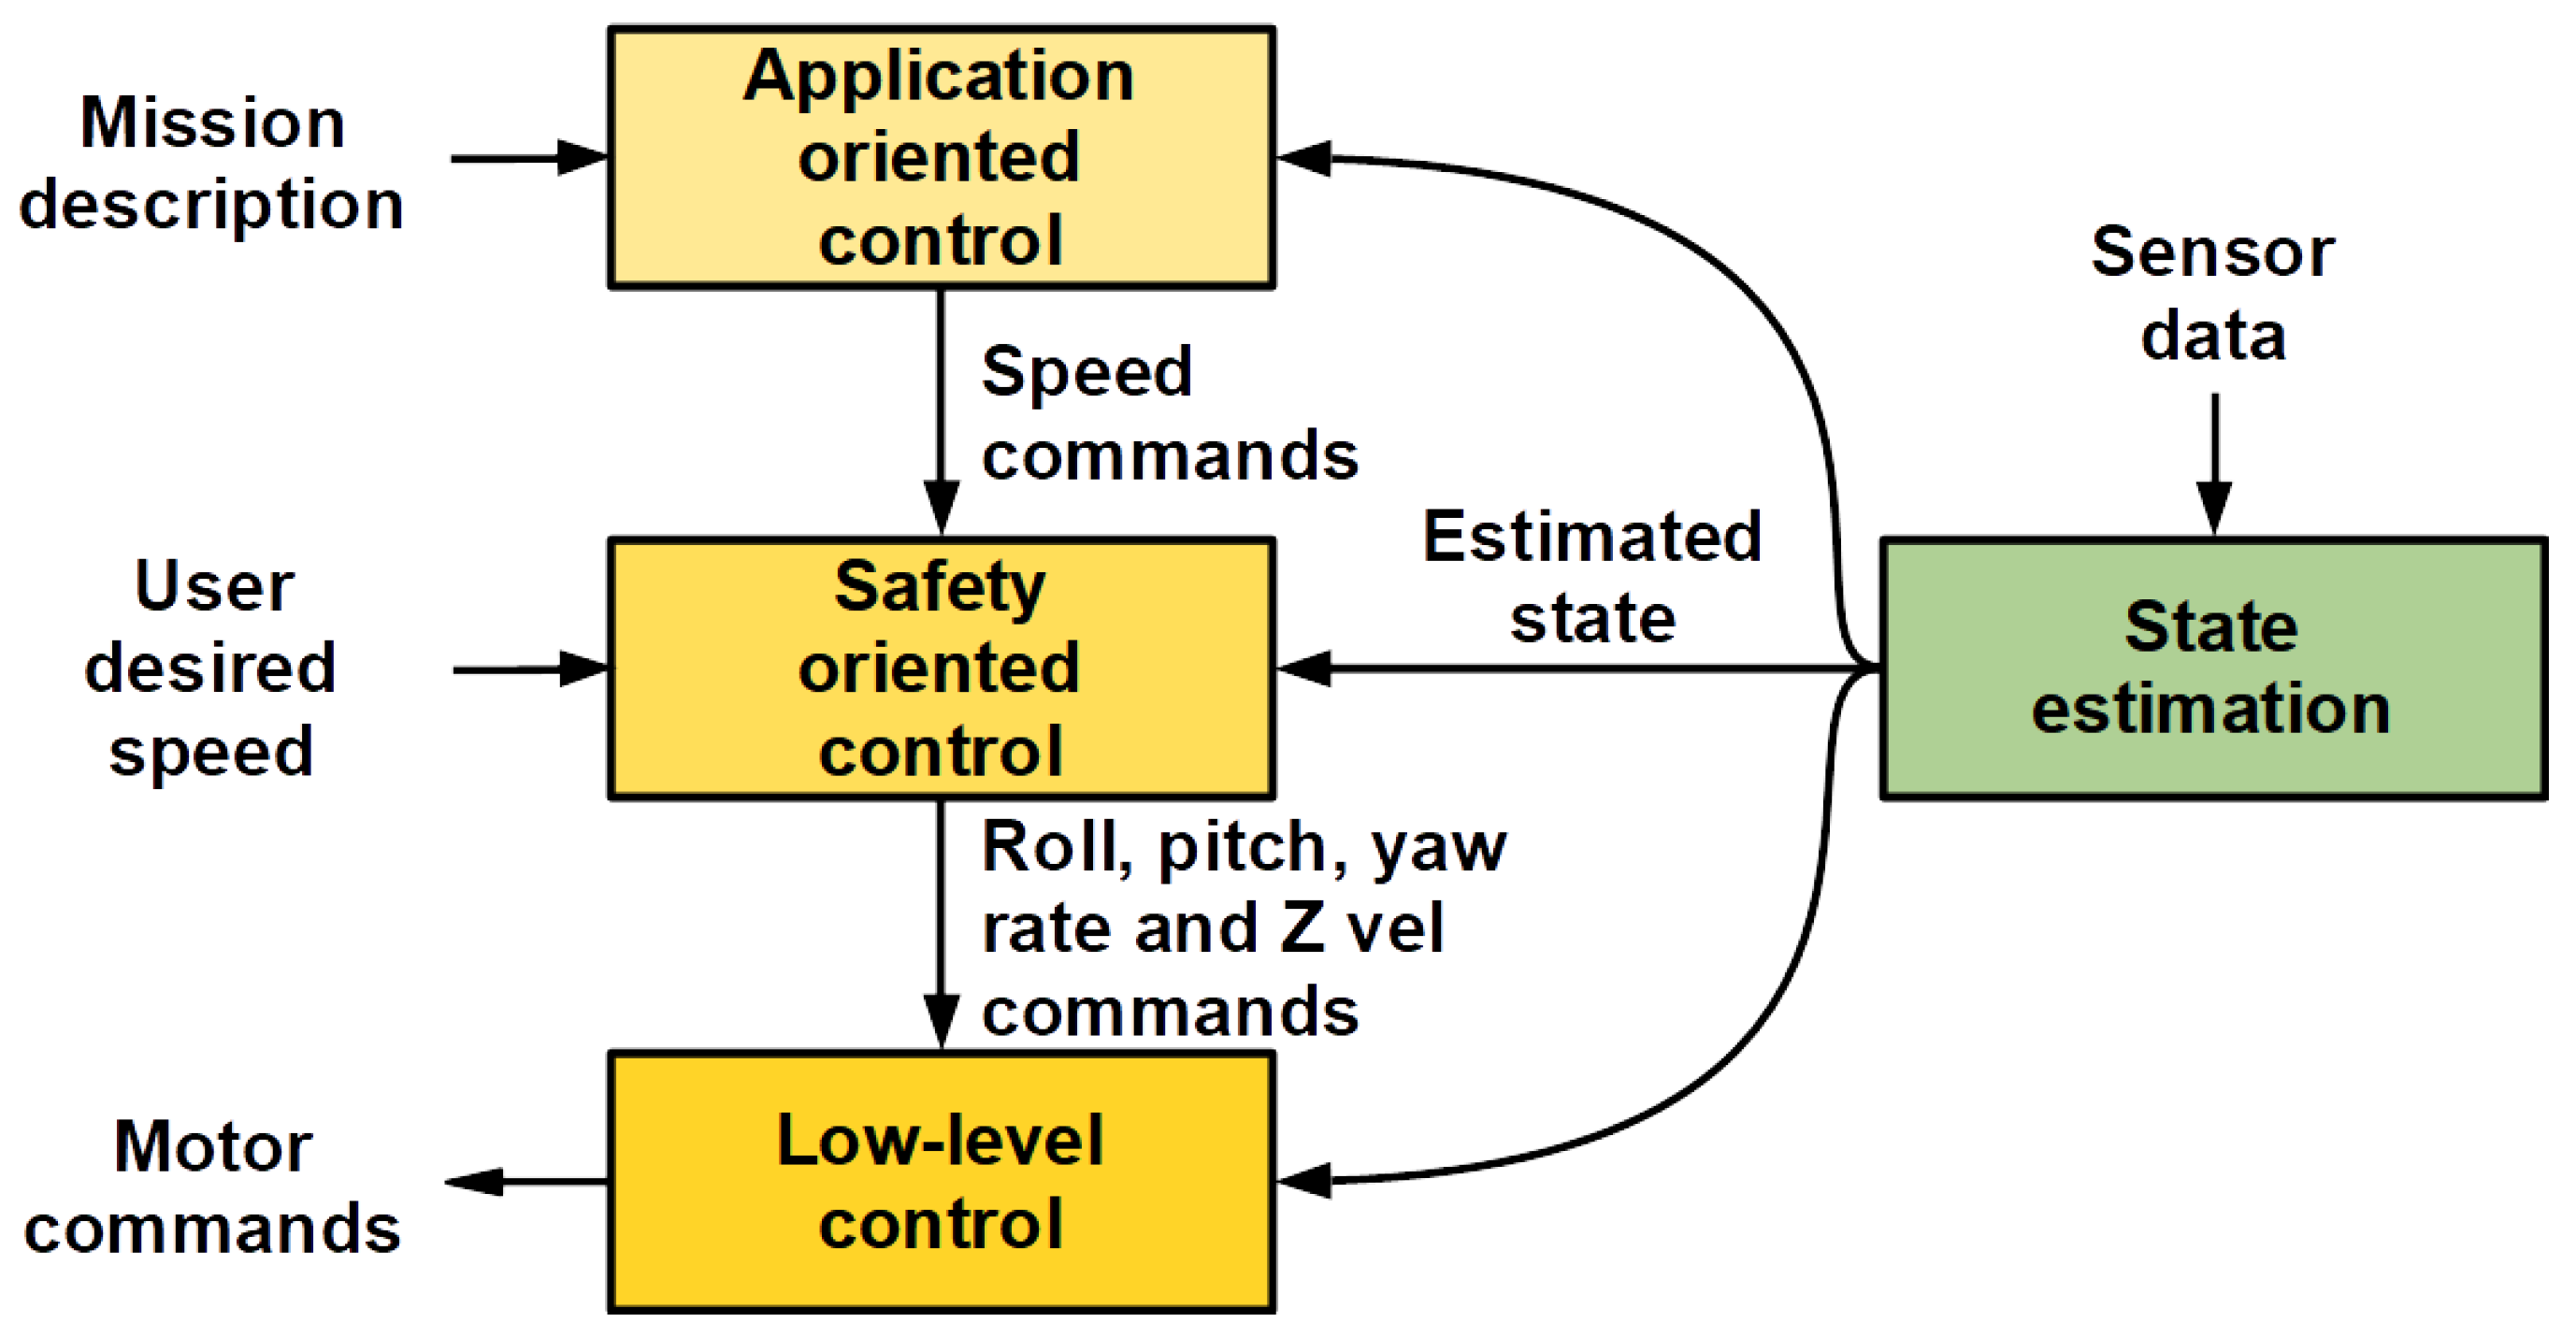
As shown in Figure 4, the control architecture of the robot assimilates to a hierarchical layered structure, where each layer implements a different level of control. Moreover, mid- and high-level control layers run different robot behaviours that contribute to the generation of the final motion control command. Additional details follow next:
- The low-level control layer comprises attitude and thrust control, as well as the behaviours that check the viability of the flight. We make use of the DJI FMU services, through the DJI Software Development Kit (SDK), to make available this functionality.
- The safety-oriented control layer includes the Safety manager module, which comprises several robot behaviours that combine the user desired speed command with the available sensor data to obtain final and safe speed and height set-points that are sent to, respectively, the horizontal speed and height controllers.
- At the highest level of the hierarchy, the application-oriented control layer allows the execution of predefined missions by means of the Mission manager module, which is in charge of executing higher autonomy behaviours that implement missions defined as a set of way-points to attain. The corresponding motion commands are generated in sequence and issued to the corresponding position controller, while monitoring way-point achievement and overall correct mission execution.
Additionally, as shown in Figure 4, a State estimation module is transverse to all layers. This module is in charge of processing and fusing all the sensor data available on-board, to estimate with enough accuracy the platform state. The state estimate is employed in all control layers.
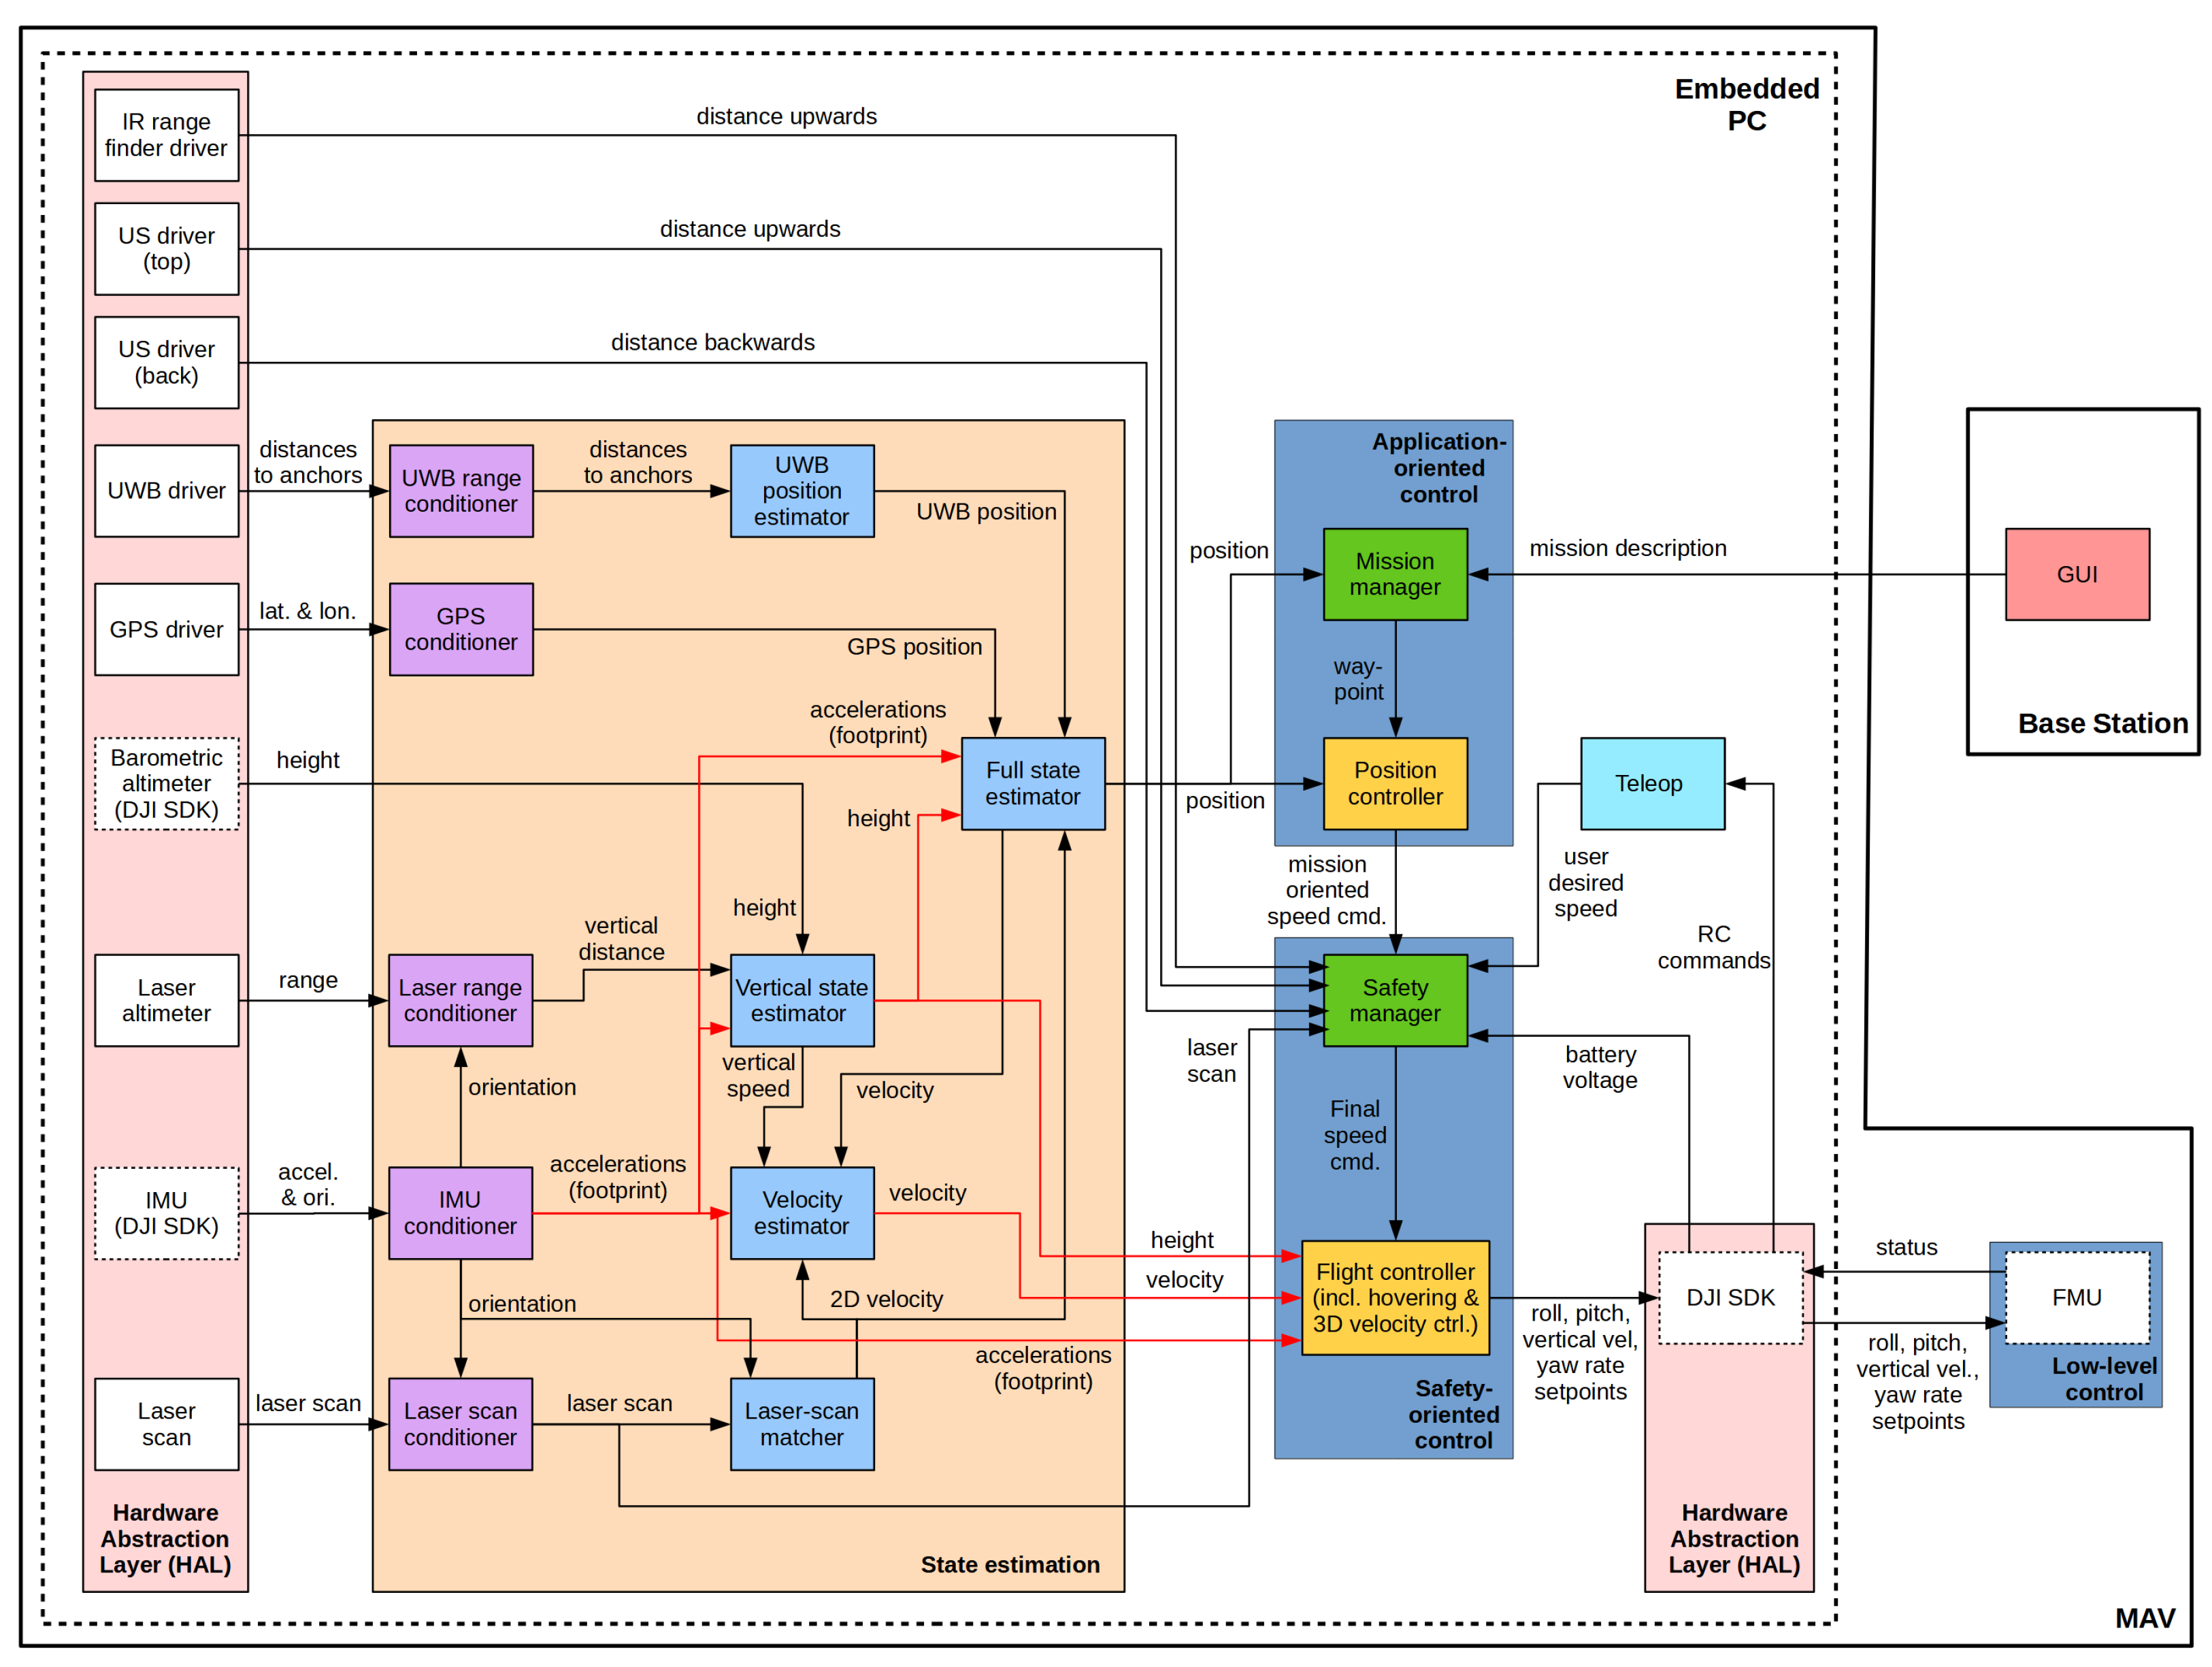
The vehicle control software has been designed around open-source components and following modularity and software reutilization principles. In this way, adapting the framework for different platforms involving different payloads, or the selective activation of software modules, can be performed in a fast and reliable way. The architecture has been developed on top of the Robot Operating System (ROS) and GNU Linux Ubuntu. Figure 5 details the software modules that lie on each layer. Further information can be found next.
5.1. State Estimation
5.1.1. Navigation Data Processing
The estimation of the robot state always starts by pre-processing the available navigation data, part of which are made available from the SDK functions provided by the base platform manufacturer, i.e., the IMU and the barometric altimeter. The remaining sensors become input data sources to the architecture through the respective device drivers/ROS nodes.
Referring specifically to sensor data processing, the IMU conditioner, the Laser range conditioner and the Laser scan conditioner modules counteract biases, filter outliers and/or perform roll and pitch compensation on the basis of the attitude estimates supplied by the IMU. Next, on the one hand, the processed scan feeds the Laser-scan matcher module, which computes the platform 2D roto-translation between consecutive scans using the IMU yaw for initialization. On the other hand, the processed height reaches the Vertical state estimator module which: (1) calculates the difference between two consecutive measurements and decides whether the change is due to motion along the vertical axis or because of a discontinuity in the floor surface (e.g., the vehicle overflies a table), and (2) supplies filtered height, vertical speed and acceleration coming from a linear Kalman Filter fed by the laser and barometric altimeters, as well as by the IMU. Finally, the resulting X, Y and Z velocities, together with the IMU accelerations, enter the Velocity estimator module to yield a final 3-axis speed estimation also by means of Kalman filtering. The Full state estimator module contributes as an additional source of data to the Velocity estimator module. Further detail on this link is given later in this section.
The UWB range conditioner module removes outliers in the estimated ranges (e.g., detected as sudden abrupt differences between consecutive ranges from the same beacon) by means of a smoothing filtering process. The resulting ranges feed the UWB position estimator module, which calculates an absolute position by means of a modified version of the well-known point cloud-alignment algorithm ICP (Iterative Closest Point). This variant performs point-to-sphere correspondences to estimate through an iterative process the translation required to compensate the distance from spheres centered at the current platform position to the corresponding anchors. See [37] for more details about this module.
Finally, the GPS conditioner module transforms from latitude/longitude measurements to a local coordinate system. As can be expected, GPS data contribute to the estimation of the vehicle state only if the GPS signal is available.
5.1.2. Platform State
During flight, the aerial platform is intended to collect inspection data on demand or at a fixed rate, e.g., 10 fps, as well as log flight data. Regarding the latter, the vehicle pose, i.e., 3D position and 3D attitude, as well as the distance to the inspected surfaces become of particular relevance in order to be able to associate to the data collected a position in the hold and scale information (ultimately, to characterize the defects found).
Besides, a secondary aim is to ensure proper surface coverage in order to supply the surveyor with complete information about the surface under inspection, e.g., a bulkhead. This is also to contribute, in an effective way, to the 3D reconstruction of the area from the visual data collected.
Consequently, to implement the aforementioned functionalities, the platform not only needs to estimate its speed but also determine its position with enough accuracy. Regarding the inspection itself, the general requirement on positioning accuracy is that it should be possible to map a defect to the structure it is in. In a bulk carrier vessel hold, the elements of reference for localizing any other element are typically the structural frames (see the bottom pictures at Figure 1); actually, this is the way how surveyors record the incidences found during an inspection, e.g., crack found between frames number 43 and 44. Therefore, position estimates should be accurate enough to be possible to determine the frames of the hull at both sides of the defect. The average distance between frames is of the order of meters, ranging from 800mm for transverse frames to 2400 mm for web frames [38], what gives an idea of the accuracy which is needed for this application.
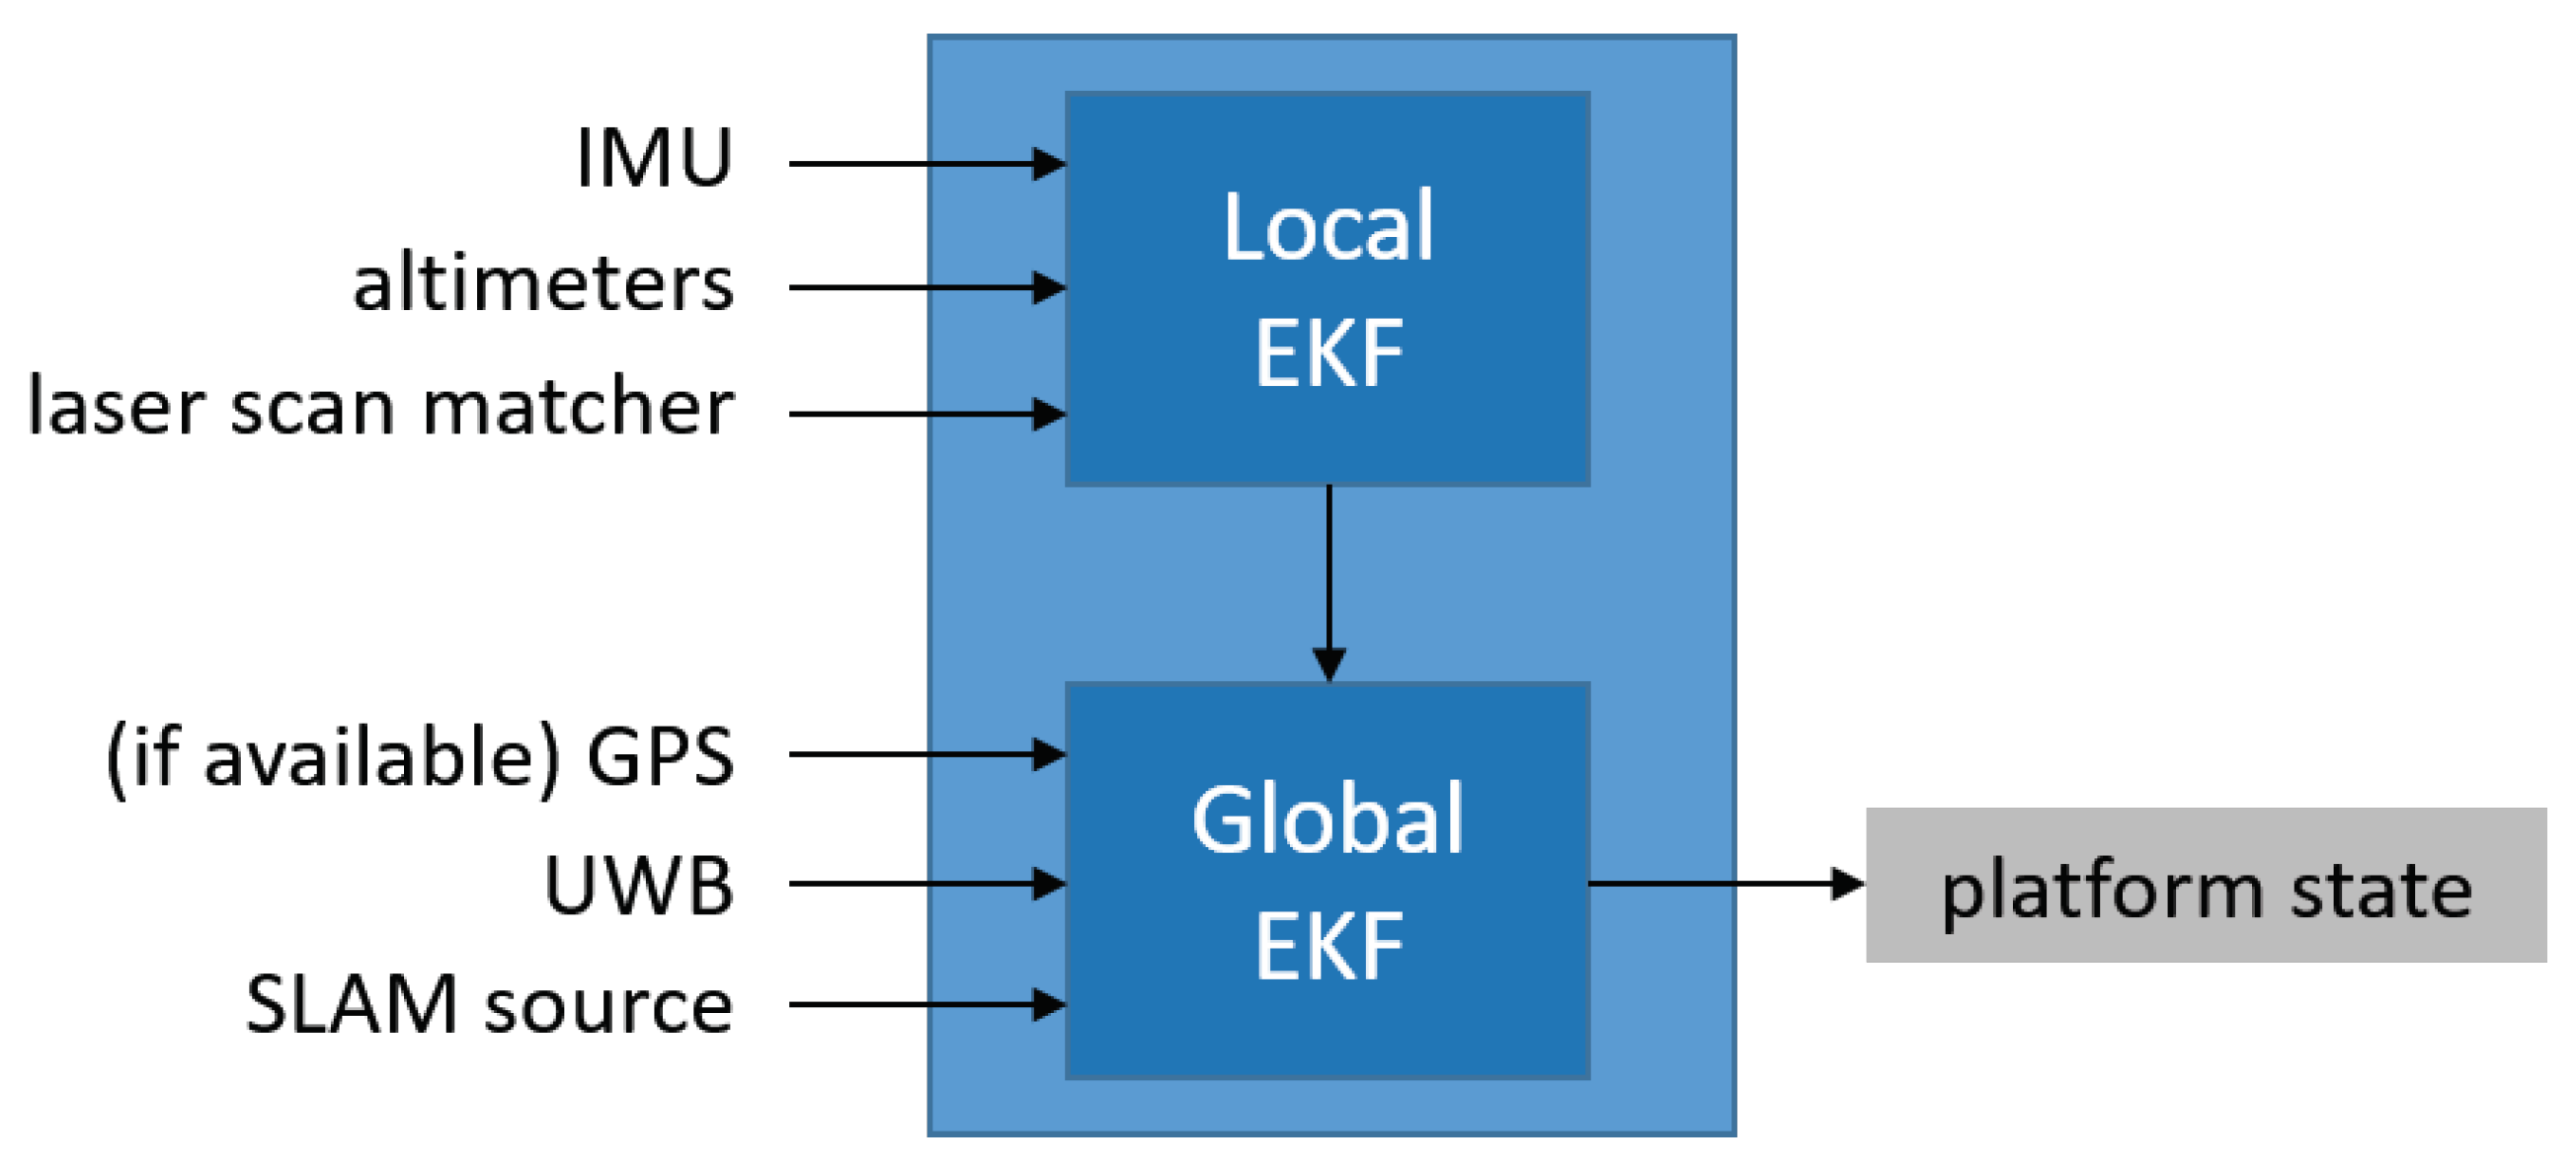
The vehicle state comprises the platform pose , the linear velocities and accelerations , and the angular velocities . The Full state estimator (FSE) module shown in Figure 6 supplies these state estimates by fusing the available navigation data (once processed) and a number of different position sources. More precisely, the FSE module comprises two cascaded Extended Kalman Filters (EKF): the local EKF fuses navigation data from motion and relative-position sources, while, similarly to [39], the global EKF combines estimates from the local EKF with positioning data from global localization sources such as GPS and/or UWB-based position estimators, as well as from SLAM algorithms (whichever are available) fed by the on-board sensors.
For this particular application, this approach combining diverse platform motion/pose estimates in a two-tier fusion strategy has proved to result in reliable and robust estimates of the platform state, as it is shown in Section 7.
To finish, notice that the Full state estimator also provides the Velocity estimator with per-axis velocity estimates, which are fed into the latter as additional observations (see Figure 5).
5.2. Low-Level Control
The low-level control layer, as previously indicated, makes use of the FMU services. It is in charge of controlling vertical motion, attitude stabilization and direct motor control. The embedded PC and the FMU communicate by means of a serial connection, through which motion commands with roll, pitch, vertical velocity and yaw-rate set-points are sent from within the corresponding control loops (by means of the corresponding SDK functions). The low-level control layer is also responsible of monitoring the connection with the RC as well as the battery voltage level (this status information is also made available by the SDK). When the link with the RC is interrupted and it cannot be restored after some seconds, the vehicle autonomously descends and lands. The same maneuver is performed when the battery voltage is below 10%. These two behaviours, namely connection lost landing and low battery landing, are mentioned here because they involve FMU services, although logically they are part of the behaviour-based architecture, which is detailed next.
5.3. Behaviour-Based Architecture
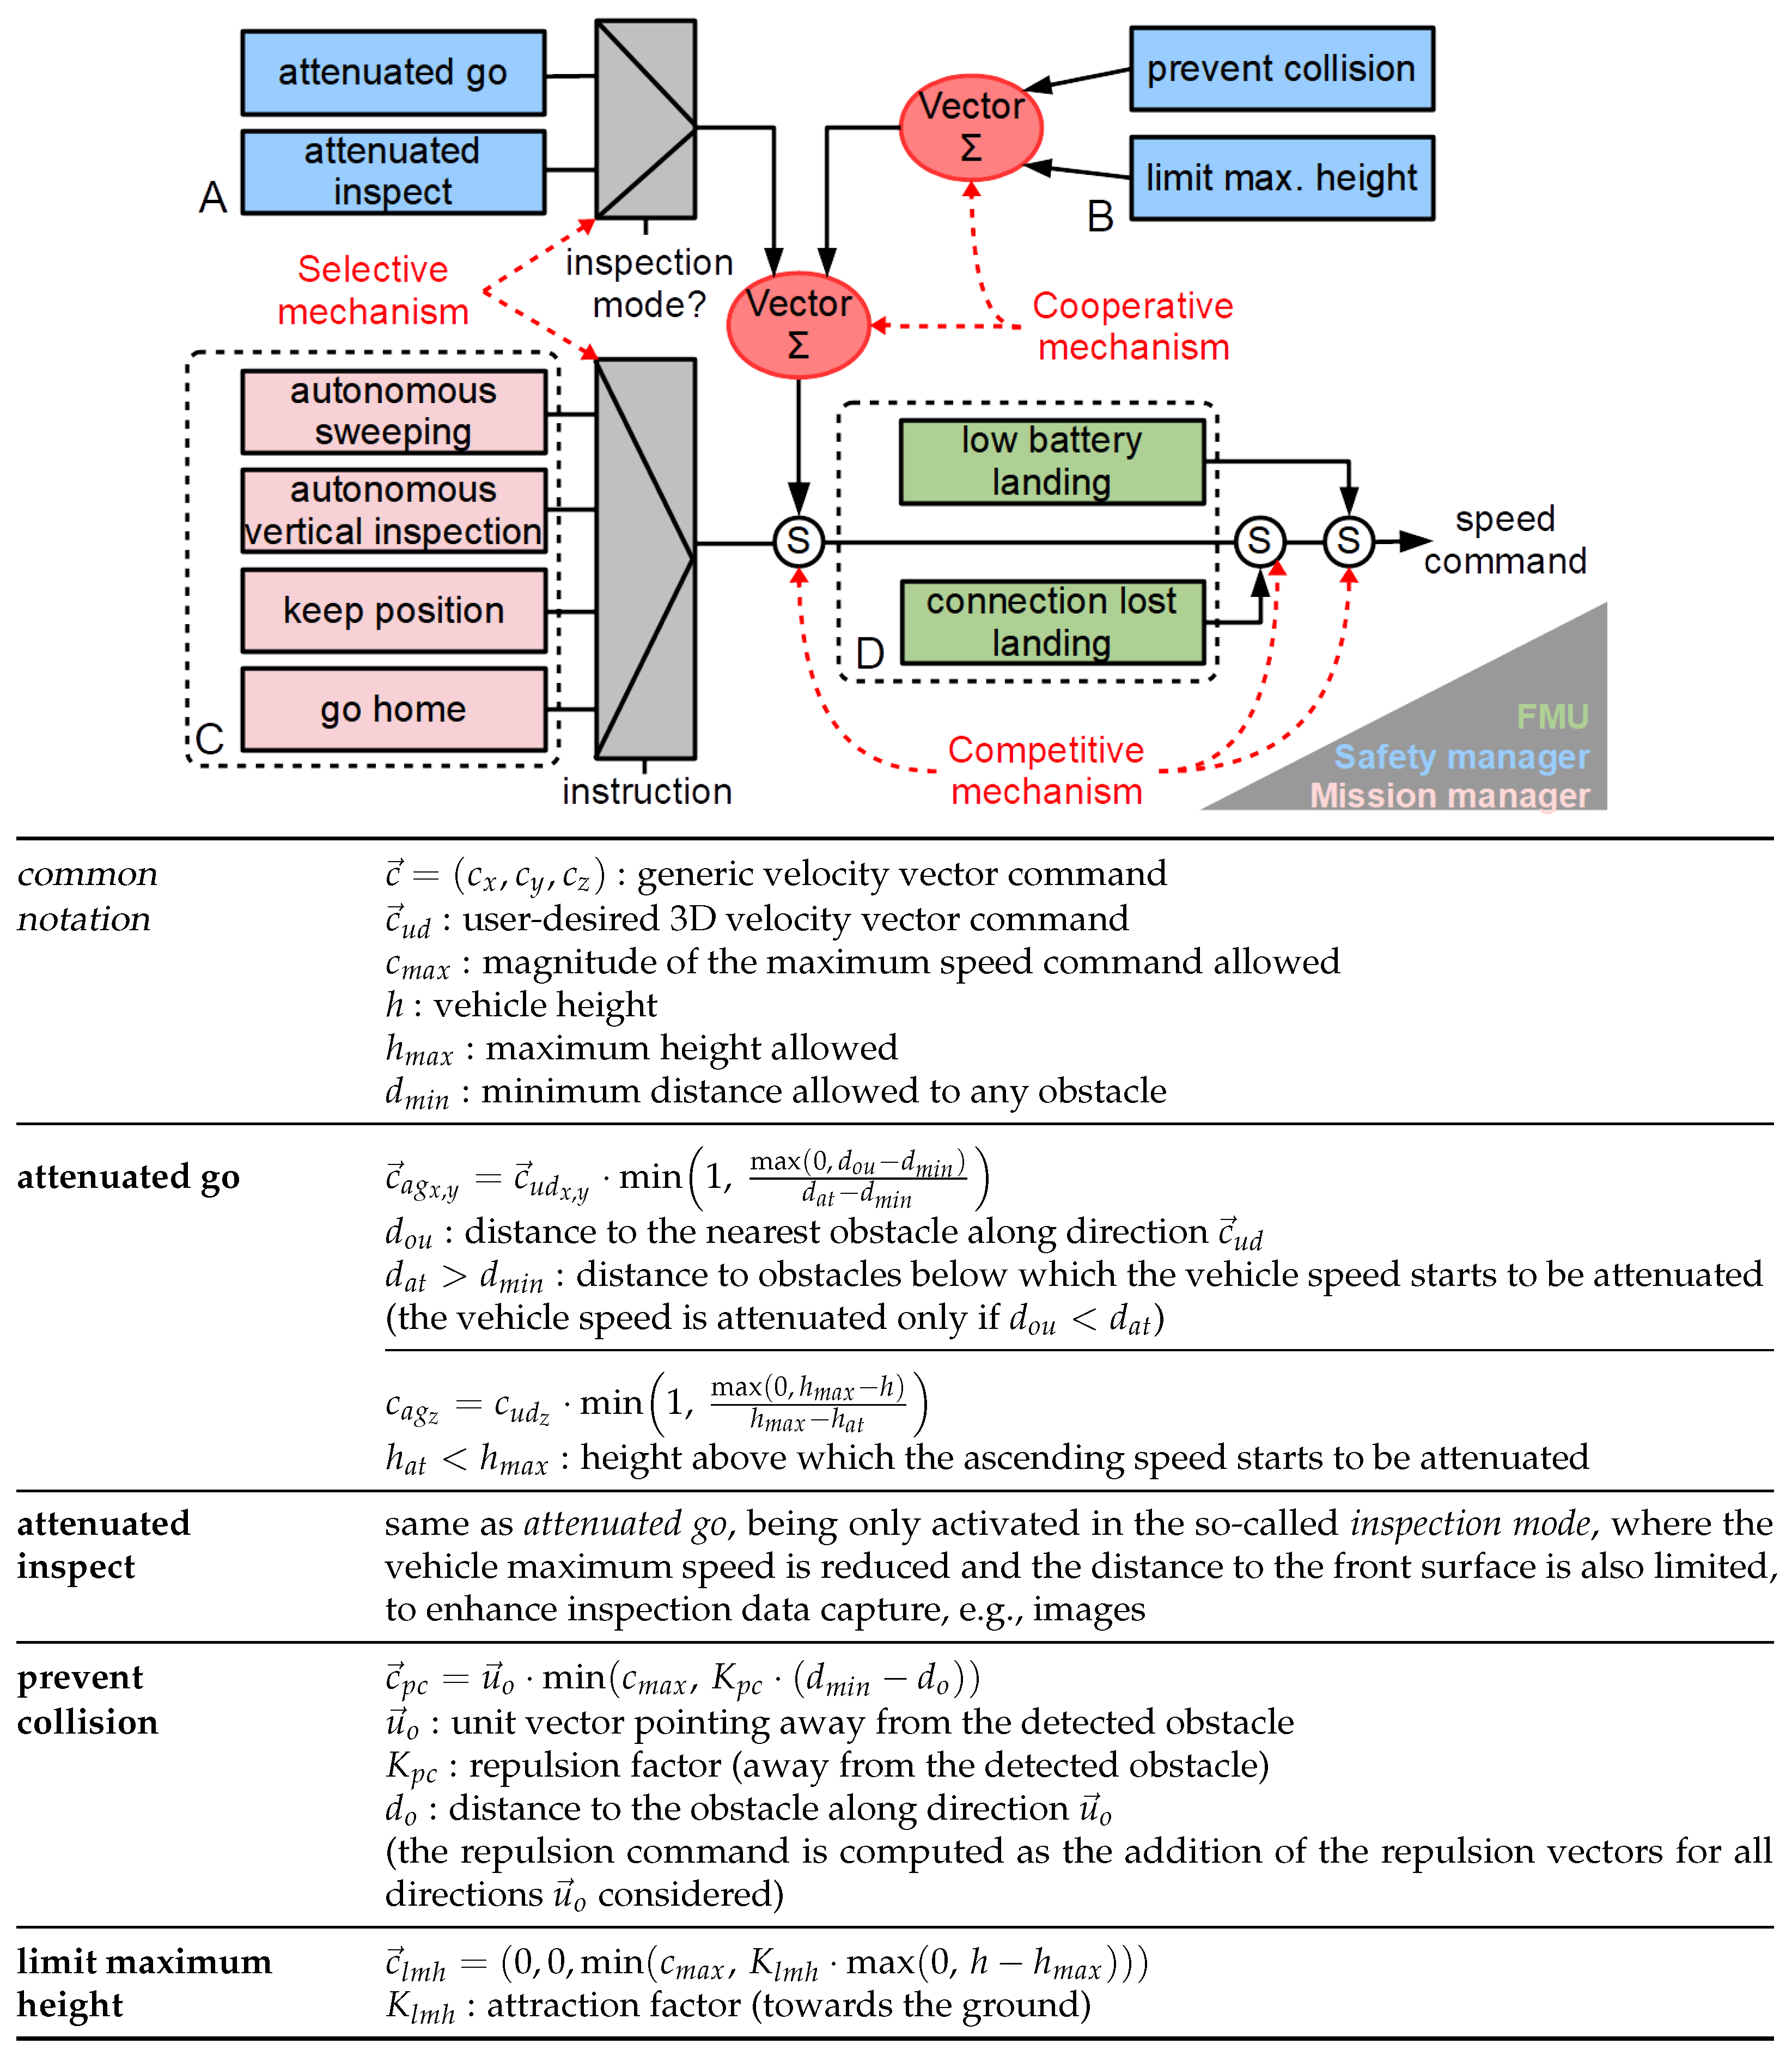
The speed commands fed into the low-level control layer are generated by a set of robot behaviours organized in a hybrid competitive-cooperative framework [40]. That is to say, on the one hand, higher priority behaviours can overwrite the output (or part of the output) of lower priority behaviours by means of a suppression mechanism taken from the subsumption architectural model (indicated as competitive mechanism in Figure 7). On the other hand, the cooperation between behaviours with the same priority level is performed through motor schemas, where the involved behaviours supply each a motion vector and the final output is their weighted summation (indicated as cooperative mechanism in Figure 7). An additional flow control mechanism selects, according to a specific input, among the outputs produced by two or more behaviours (indicated as selective mechanism in Figure 7).
Figure 7 details the behaviour-based architecture showing how the different behaviours are organized and how they contribute to the final speed command (see the bottom table at Figure 7). These behaviours have been identified as useful for visual inspection after a careful analysis of the inspection problem and taking into account the particularities of the platform involved. As shown in Figure 7, these behaviours are organized in a total of four general categories depending on its purpose: (A) behaviours to accomplish the user intention, (B) behaviours to ensure the platform safety within the environment, (C) behaviours to increase the autonomy level, and (D) behaviours to check flight viability. Behaviours in the first three categories run either within the Safety manager or within the Mission manager (see Figure 5), which in turn are part of, respectively, the Safety-oriented control layer and the Application-oriented control layer (see Figure 5). At last, category (D) groups those behaviours in charge of ensuring that the flight can start or progress at a certain moment in time. It comprises the two behaviours introduced in the previous section, i.e., the connection lost landing behaviour and the low battery landing behaviour, both making use of the FMU services, as mentioned before. Details follow next.
5.4. Safety-Oriented Control
The main functionality of this layer is to preserve the integrity of the platform, generating safe control commands to operate the vehicle during an inspection flight. It comprises the Safety manager and Flight controller modules.
The Safety manager gives rise to velocity commands that combine the output of the behaviours that accomplish the user intention (Figure 7, category A) and the behaviours that account for the safety of the platform within the environment (Figure 7, category B). They are described in the following:
- Behaviours to accomplish the user intention. This group comprises the attenuated go and the attenuated inspect behaviours. The attenuated go behaviour propagates the user desired speed vector command, attenuating it towards zero in the presence of close obstacles. In more detail, when the vehicle is moving towards an obstacle, the speed is reduced in accordance to the proximity to the obstacle. The speed is not attenuated when the user is intent to move the platform away from close obstacles.The attenuated inspect behaviour proceeds in the same way, being only activated in the so-called inspection mode. While in this mode, during an inspection, the vehicle maximum speed is reduced, to be compatible with image capture, and the distance to the inspected surface is also limited, to keep the platform at a close and constant distance to the front surface and prevent thus large changes in scale in the images collected. This not only provides the surveyor with easier-to-compare images, but also helps to reconstruct the surveyed area from images.
- Behaviours to ensure the platform safety within the environment. This category includes the prevent collision behaviour, which generates a repulsive vector to separate the platform from surrounding obstacles (including the ceiling), whose magnitude increases as a function of proximity. The joint actuation of this behaviour and the attenuated go / attenuated inspect behaviours implements the collision prevention and avoidance functionality on-board the platform.Finally, the behaviour limit maximum height produces an attraction vector towards the ground when the vehicle is approaching the maximum flight height.
On the other side, the Flight controller is in charge of generating the commands that are sent to the FMU. This module implements a finite state machine that comprises four states: on ground, taking off, flying and landing. The transitions between the states take place when particular conditions are met. For example, the vehicle changes from on ground to taking off when the user issues the take-off command. Some other transitions do not depend on the user commands but on sensor data and on the vehicle state, e.g., the vehicle changes from taking off to flying when the estimated height is above a certain value (0.3 m in the current configuration).
When the vehicle is in the flying stage, two PID controllers are in charge of tracking the speed command in the longitudinal and lateral axes (respectively, X and Y axes), while the control on vertical motion runs inside the FMU. When the speed command along the vertical axis is zero, a height PID controller is activated to generate the velocity commands required to keep constant the platform height.
5.5. Application-Oriented Control
The main goal of this layer is to increase the autonomy level of the platform by means of inspection-oriented autonomous missions. Those missions are described in a qualitative way, e.g., sweep the front wall from end to end, using the graphical user interface (GUI), in accordance to the SA paradigm. Internally, this layer transforms user-specified missions into a sequence of platform motion commands. For now, autonomous inspection missions are defined in terms of way-points (to be reached by means of the Position controller, which we refer to below), although it is intended to be highly extensible, to be able to incorporate additional autonomy, in any form, as it is available. The Mission manager and the Position controller modules make up this layer.
The Mission manager is defined in terms of behaviours. These behaviours belong to category C in Figure 7. For now, this category comprises four behaviours, namely autonomous sweeping, autonomous vertical inspection, keep position and go home. The behaviour-based nature of the Mission manager makes it highly extensible. This permits incorporating new, additional behaviours as needed, in order to boost the autonomy degree of the platform regarding specifically the inspection of vessels, as well as adapting it for other use-cases of interest.
The autonomous sweeping behaviour generates a sequence of waypoints to carry out autonomously the inspection of a wall, by sweeping it from end to end and from top to bottom (Figures 14, 16, 17 and 21 illustrate this task). The scope of the sweeping is indicated through the user interface in terms of the area to cover, N × M m. Way-points are considered reached by the behaviour if the platform is within a tolerance distance to the intended way-point. Similarly, the autonomous vertical inspection behaviour, through the appropriate sequence of way-points, makes the platform move along a vertical structure (e.g., a pipe or a ladder) to inspect it from both sides, going upwards to observe the structure from the left, and then downwards observing it from the right. The inspection can be performed up to the ceiling or up to a certain height specified by the user through the user interface. The keep position behaviour enables the position controller to make the platform keep the current position, what helps the user/pilot to operate the vehicle when it is moved in an undesired way, e.g., because of the wind. Finally, the go home behaviour makes the vehicle go back to the home position. This way-point is automatically defined after the platform take-off, or when the user invokes the set home action using the user interface. In this case, the current position of the platform is saved as the home position.
In all cases, the way-points generated are sent sequentially to the Position controller, which, in this case, runs a set of uncoupled position PID controllers that generate the required speed commands for the platform. It must be noticed that these commands are not the final speeds that reach the FMU, but they are consolidated within the Safety manager module to ensure that the platform integrity is preserved at all times.
6. Interface with the User
According to the SA paradigm, our solution comprises two main agents: the robot and the BS. In turn, the BS comprises a Ground Control Unit (GCU), which runs a web-based Graphical User Interface (GUI), and one or more Remote Controllers (RC). Besides, stemming from the inspection application, flights are performed under line-of-sight conditions since operations can take place inside the cargo hold under inspection. We consider next the aforementioned elements accordingly with the relevance that the interface with the user is credited with within SA.
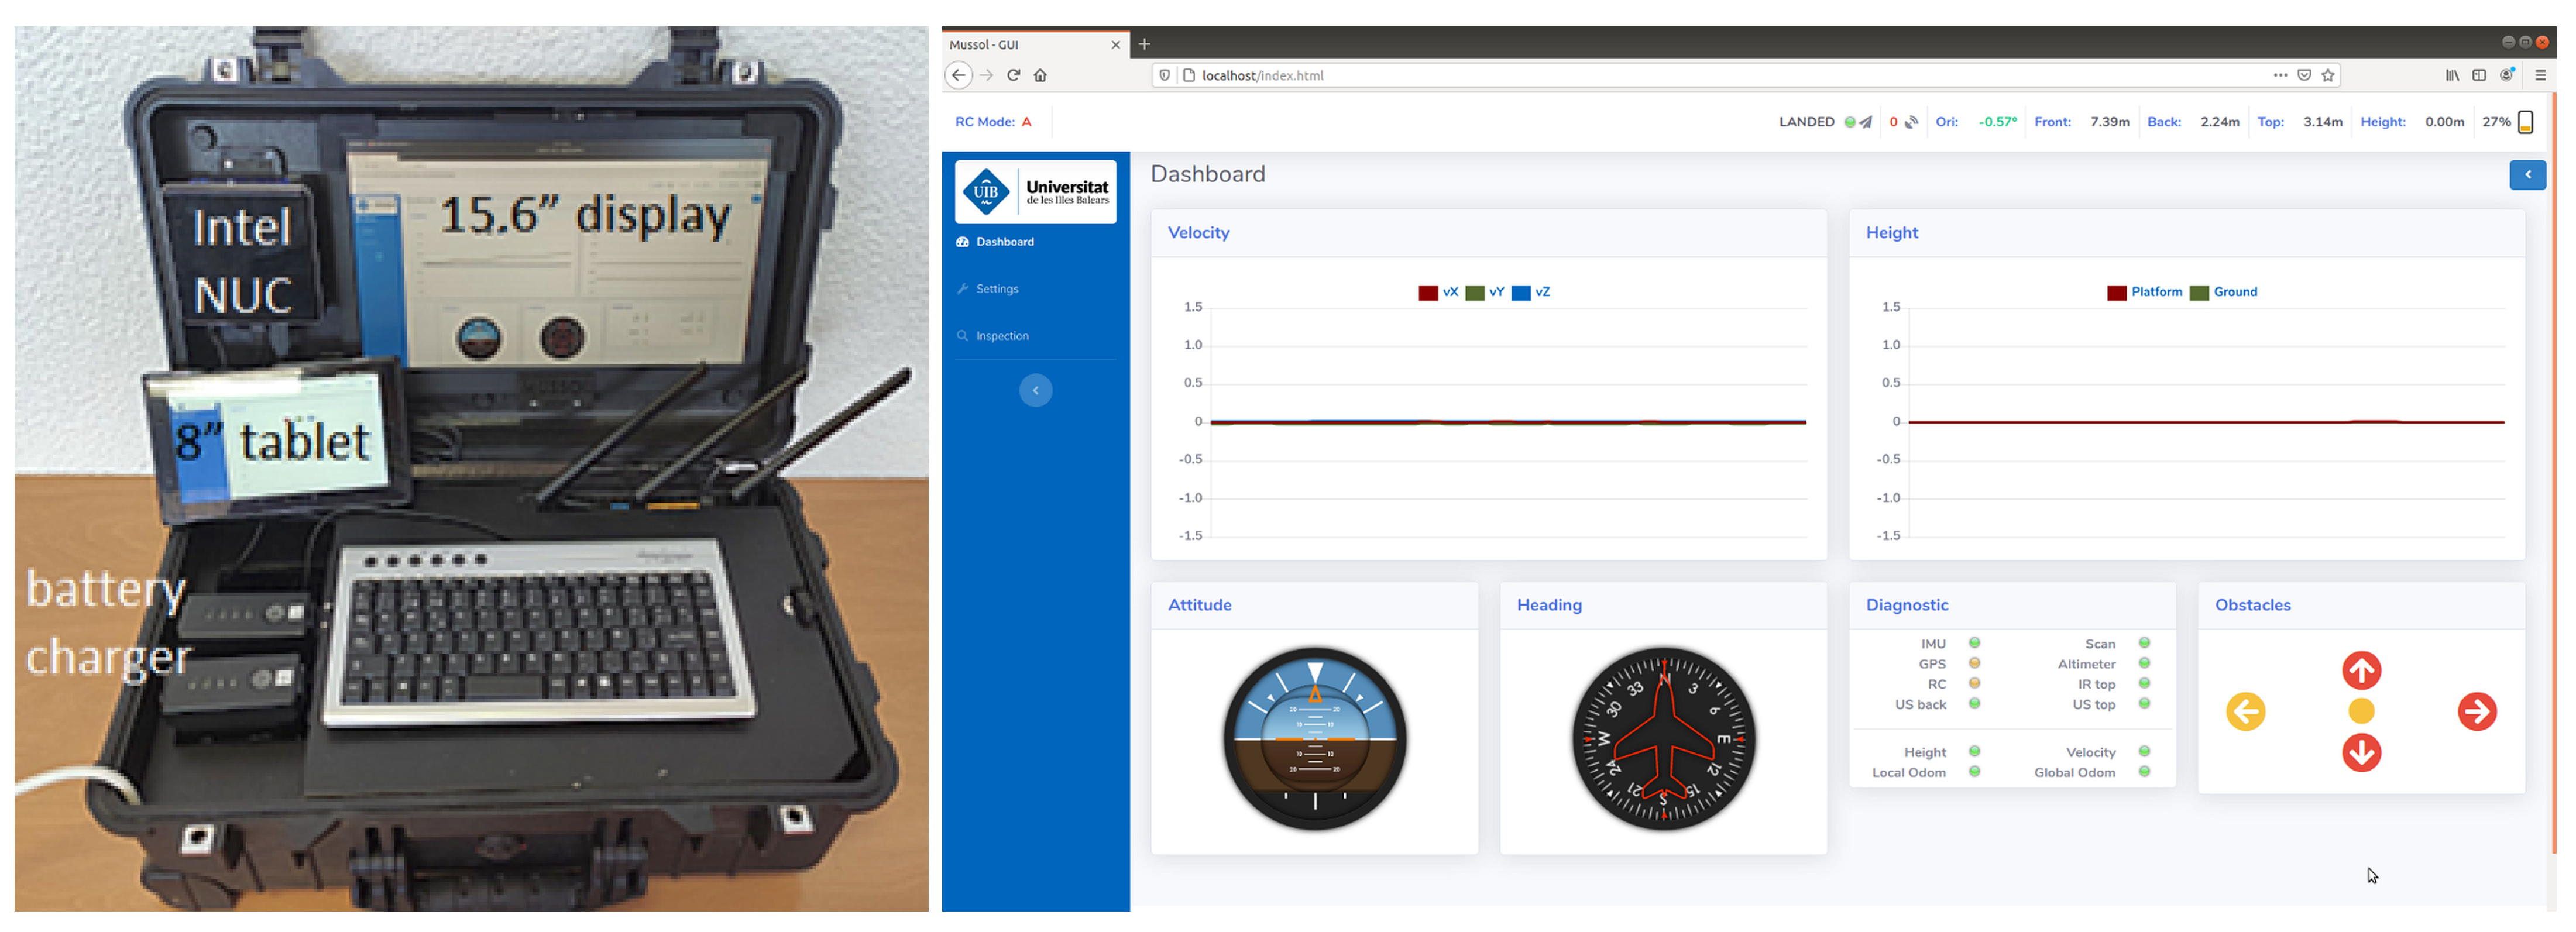
The Ground Control Unit (GCU) is intended to allow for fast deployment times prior to starting any inspection flight. The GCU integrates all the required hardware components into a ruggedized case including an embedded PC (featuring an Intel Core i7-7567U 2; ×, 35; GHz, processor, 16 GB RAM, 240 GB-SSD and 2 TB-HD of storage space), a 15.6” integrated display, a dual-band router and a number of battery chargers (3 in the current configuration). The embedded PC runs ROS over GNU Linux Ubuntu and is linked to the robot via 5GHz Wi-Fi connections (which have shown to be compatible with the operating scenario). Battery chargers, powered directly by the GCU, allows charging batteries while performing inspection flights without bringing additional devices to the field. Additionally, the GCU can be powered from one of the batteries by DC/DC conversion whenever the AC power supply is not available, what has resulted very convenient to deploy the platform as soon as possible while in the field. Figure 8 shows some pictures of the GCU.
Within the SA framework, the interface between the robot and the operator is realized through qualitative instructions and explanations; that is to say, the user sends out high-level instructions to the platform through adequate Human Interaction Devices (HID), and it replies with instructive feedback. In our system, qualitative commands are issued through one or several RCs, e.g., a Radio Controller (R/C), a gamepad, etc. which can be used in combination with a mobile phone or tablet to provide the user with visual feedback (in our case, each R/C communicates with the FMU using the Lightbridge protocol by DJI, which has worked robustly in all cases under the operating conditions of a real vessel). While the platform is taking care of attitude stabilization, speed and height control, as well as prevents collisions, the user is only required to issue simple/qualitative commands related to the inspection operation, such as go up, go down, go left, go right, advance in a certain direction, etc. Moreover, the flight can take place following the specifications indicated by a surveyor, which in turn can be provided with an additional R/C connected in slave mode to the system, what allows him to set, among others, the orientation and the camera zoom, as well as take pictures or videos on demand, without disturbing the flight.
A web-based GUI has been developed to facilitate the visualization and interaction with the system through several types of devices. This GUI has been developed following responsive design principles to permit the visualization on different displays. HTML5, CSS and Javascript are the main technologies supporting the interface, in combination with the library ros.js, used to interact with ROS from Javascript client code. The web server runs on the GCU and is reachable from any device connected to the wireless network published by the dual-band router. Further qualitative commands can be issued from the input side of the GUI. Conversely, the output side of the GUI is employed for handling the robot feedback in an intuitive and rich way. By way of example, the GCU and the tablet that are seen in Figure 8 both show the web-based GUI.
7. Experimental Results
This section reports on the results of a number of experiments that involve the MUSSOL system in different environments to illustrate and assess its capabilities regarding visual inspection. To be more precise, we provide results from experiments performed
- within a laboratory facility fitted with a motion tracking system (supplying highly accurate ground truth motion data for quantitative assessment of platform performance) and within a wider in-campus facility of around 30 × 18 × 12 m (L × W × H), which permits evaluating the platform within a volume of a size similar to that of a typical cargo hold; and
- on-board real ships. (At this moment, it is worth noting the difficulties of testing inside real vessels because of the usual unavailability of these ships due to day-to-day operation, what requires looking for alternative testing environments.)
In all experiments, the global pose sources for the Global EKF (Figure 6) were the laser-based SLAM algorithm Gmapping [41] and the ICP-based method for UWB-based positioning described in [37]. Regarding the latter, the UWB beacons were spread all over the testing area at different heights. No GPS source was in use in any of the aforementioned environments.
7.1. Assessment of the Platform Capabilities
In this section, we report and discuss on some of the experiments performed to check quantitatively and qualitatively the capabilities of the platform. The experimental data have been logged from a number of flights involving different functionalities and trajectories. Each experiment pursues the evaluation of the correctness of the corresponding skill, together with the self-localization capability of the platform whenever ground truth data is available. In the figures, we show, among others, the final, fused pose produced by the Global EKF and the true positions supplied by the motion tracking system if available during the experiment; they are respectively labelled as global pose and ground truth in the different plots.
The first class of experiment that we report in this section illustrates the performance of the behaviours that are related to obstacle detection and collision prevention, which become crucial skills for the platform to be able to navigate safely within the environment either in a tele-operated way or autonomously. Results for the attenuated go and the prevent collision behaviours, part of the functionality of the Safety manager module, can be found in Figure 9. In this experiment, an R/C is used to issue commands to move the platform towards a wall, trying to make the robot collide. The plot shows how the longitudinal speed command produced by the Safety manager module coincides with a user command of 1 m/s until the wall in front of the vehicle becomes closer than 2.5 m (instant A), moment at which the user-desired velocity is attenuated by the attenuated go behaviour making the speed command decrease in accordance to the closeness to the wall. When the wall becomes closer than 1.3 m (instant B), which is the minimum distance allowed, the user-desired speed is completely cancelled by the prevent collision behaviour, and the final speed command becomes negative to separate the vehicle enough from the wall (what is achieved at instant C).
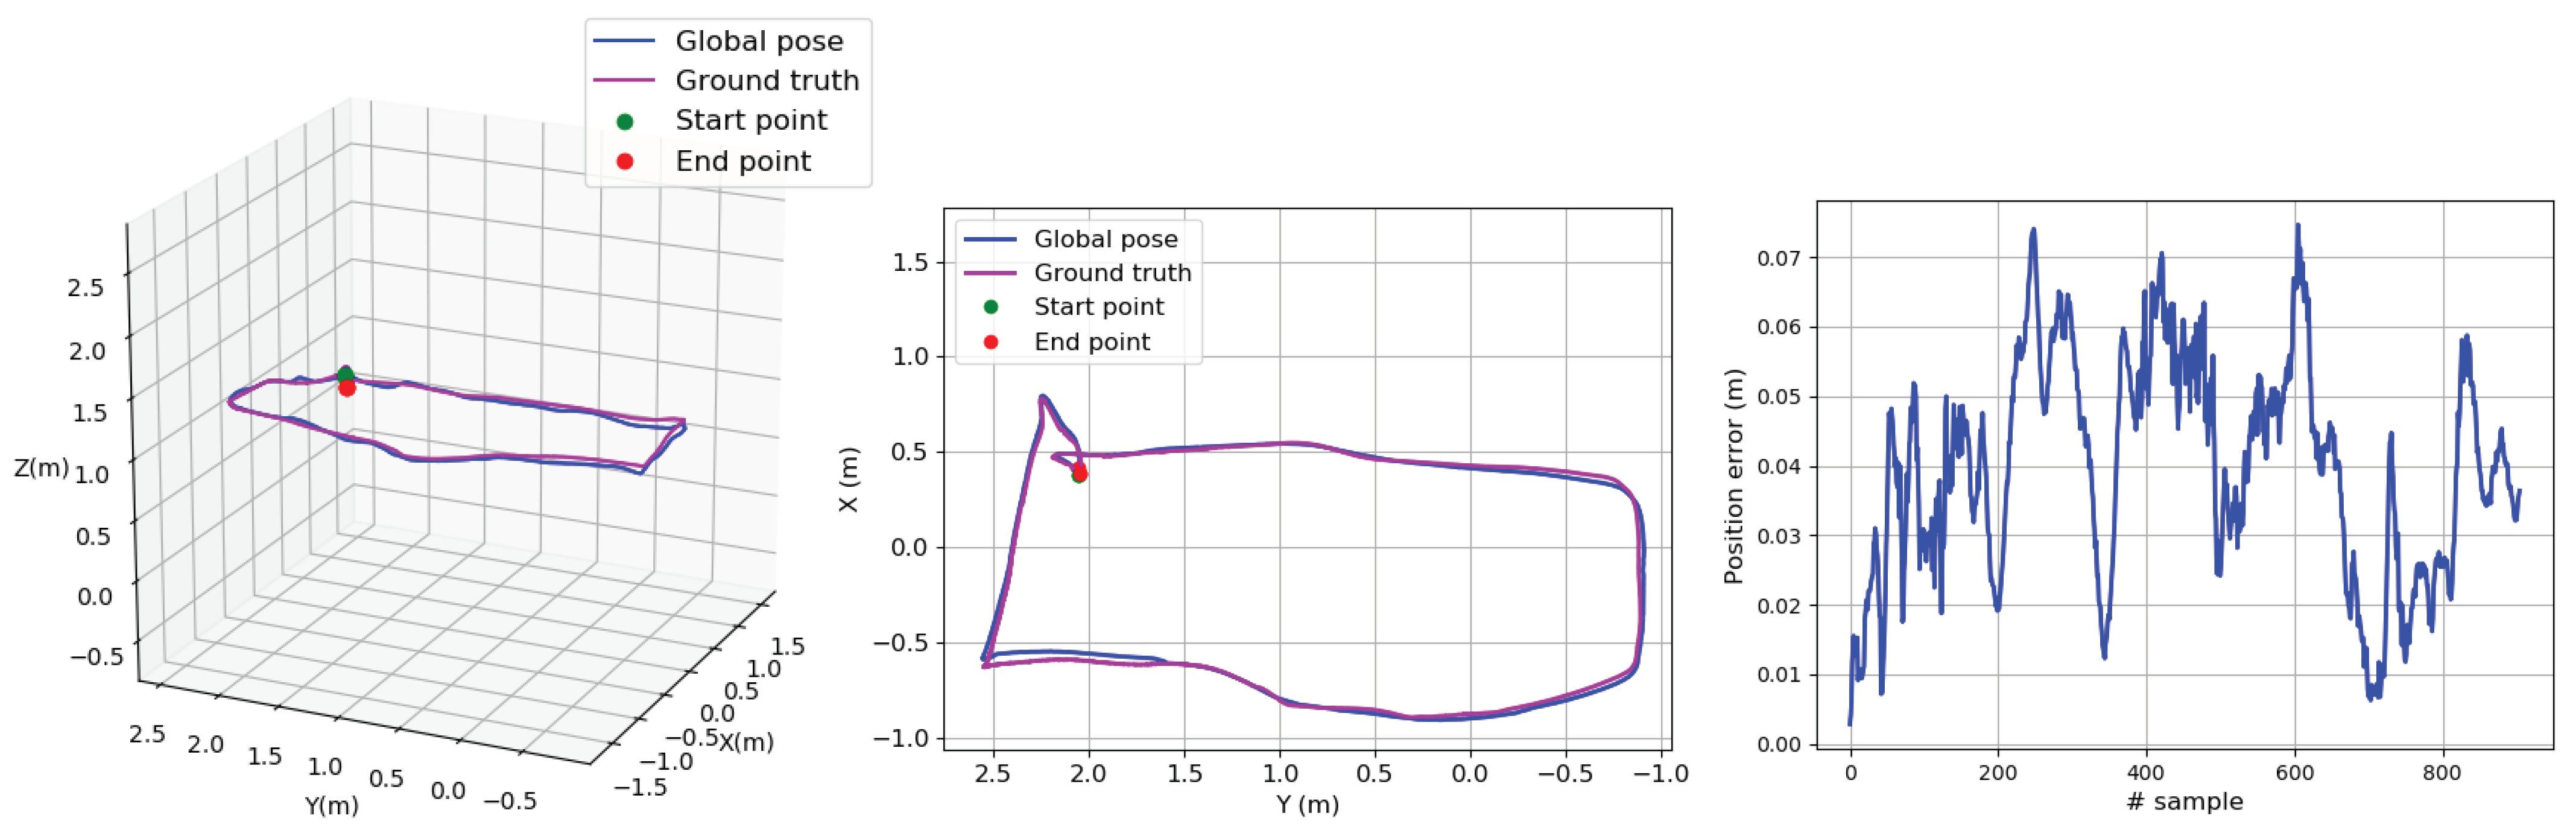
Switching to the navigation skills, the first experiment of this class that we describe focuses on the evaluation of the self-localization capability of the platform as well as on its ability to obey the motion commands issued by the operator. Figure 10 reports on the results for this experiment, where the platform is tele-operated following a rectangular path at a constant height. As can be seen, the path estimated by the state estimation module looks very similar to the path provided by the motion tracking system. The positioning error along time between these two paths can be found in Figure 10 (right). As can be observed, the error committed by the state estimator is below 7 cm most of the time.
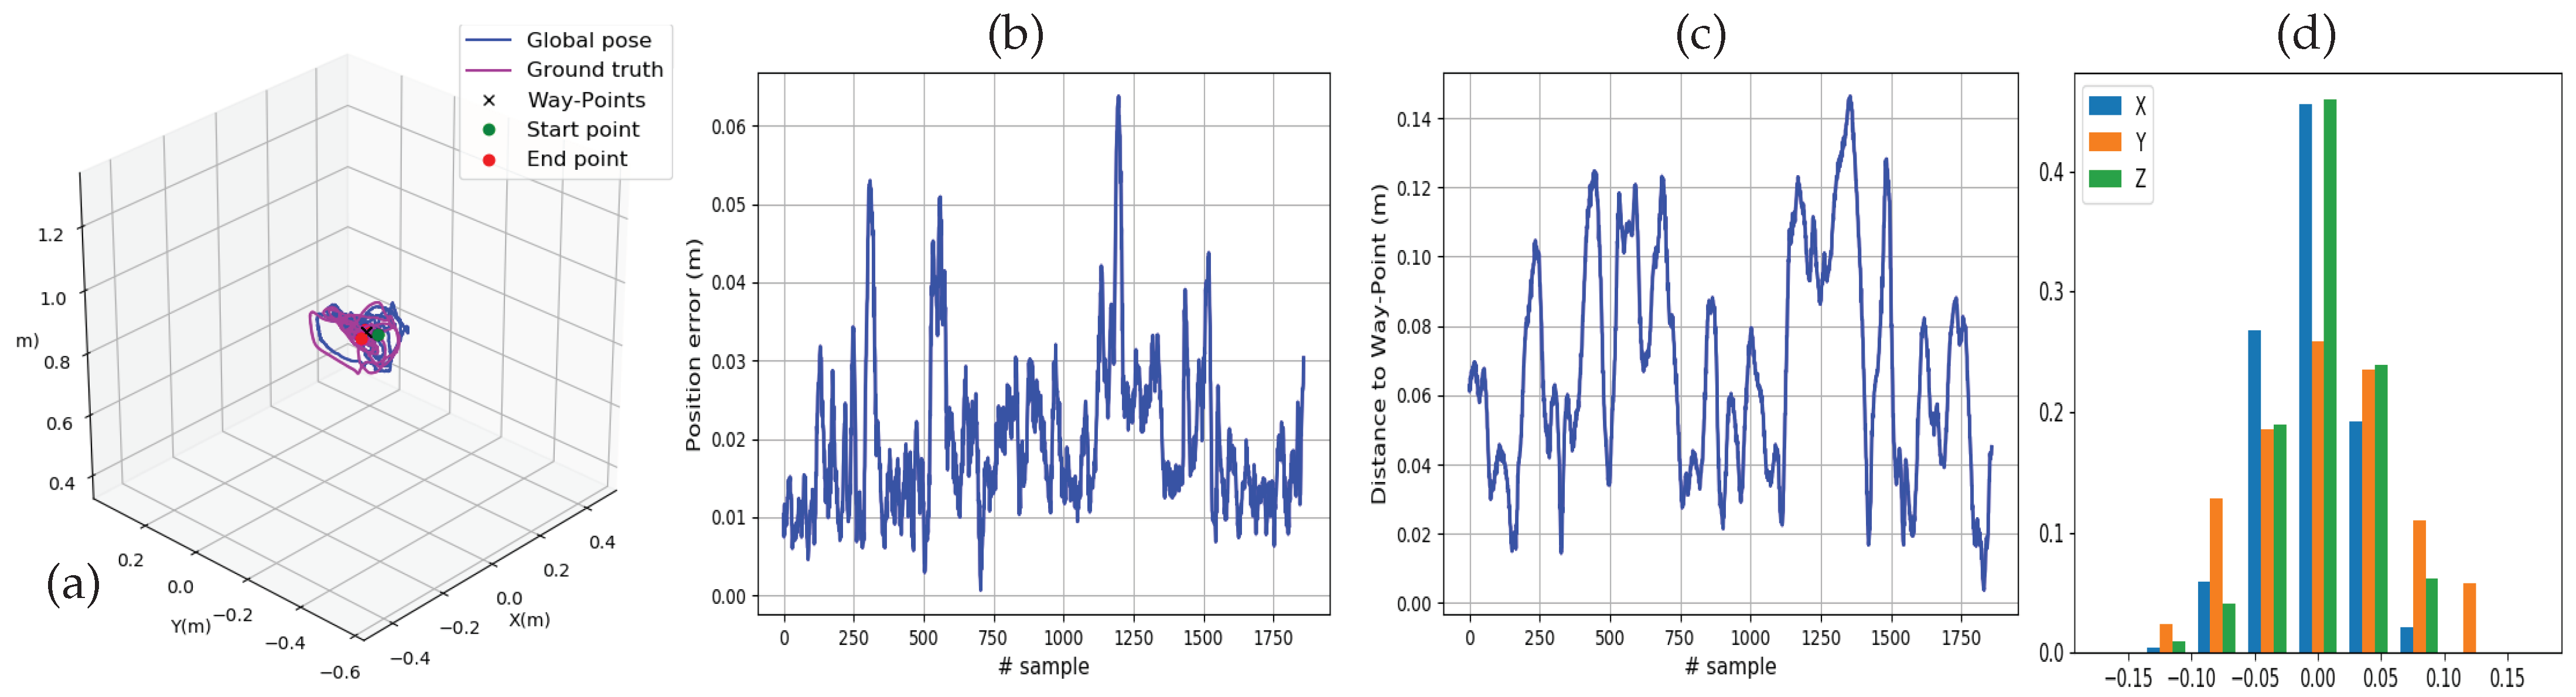
The next experiment evaluates the capability for hovering of the platform, which in turn involves the position control capability. Figure 11 shows the results corresponding to a 1-minute period after issuing a keep position command. Figure 11a shows the motion of the vehicle during the experiment and compares the estimated position with the ground truth as above. In this regard, Figure 11b provides the error committed by the state estimator along time. The plot of Figure 11c shows the distance of the vehicle to the commanded position along time, i.e., the error managed by the position control loop, while the histogram shown in Figure 11d shows the error for each axis separately in the form of the respective Probability Density Functions (PDF). As can be observed, the PDFs are all centered at zero and most part of the probability keeps confined within the interval ±5 cm with respect to the issued way-point. These results indicate that the vehicle is able to hover effectively in the consigned point.
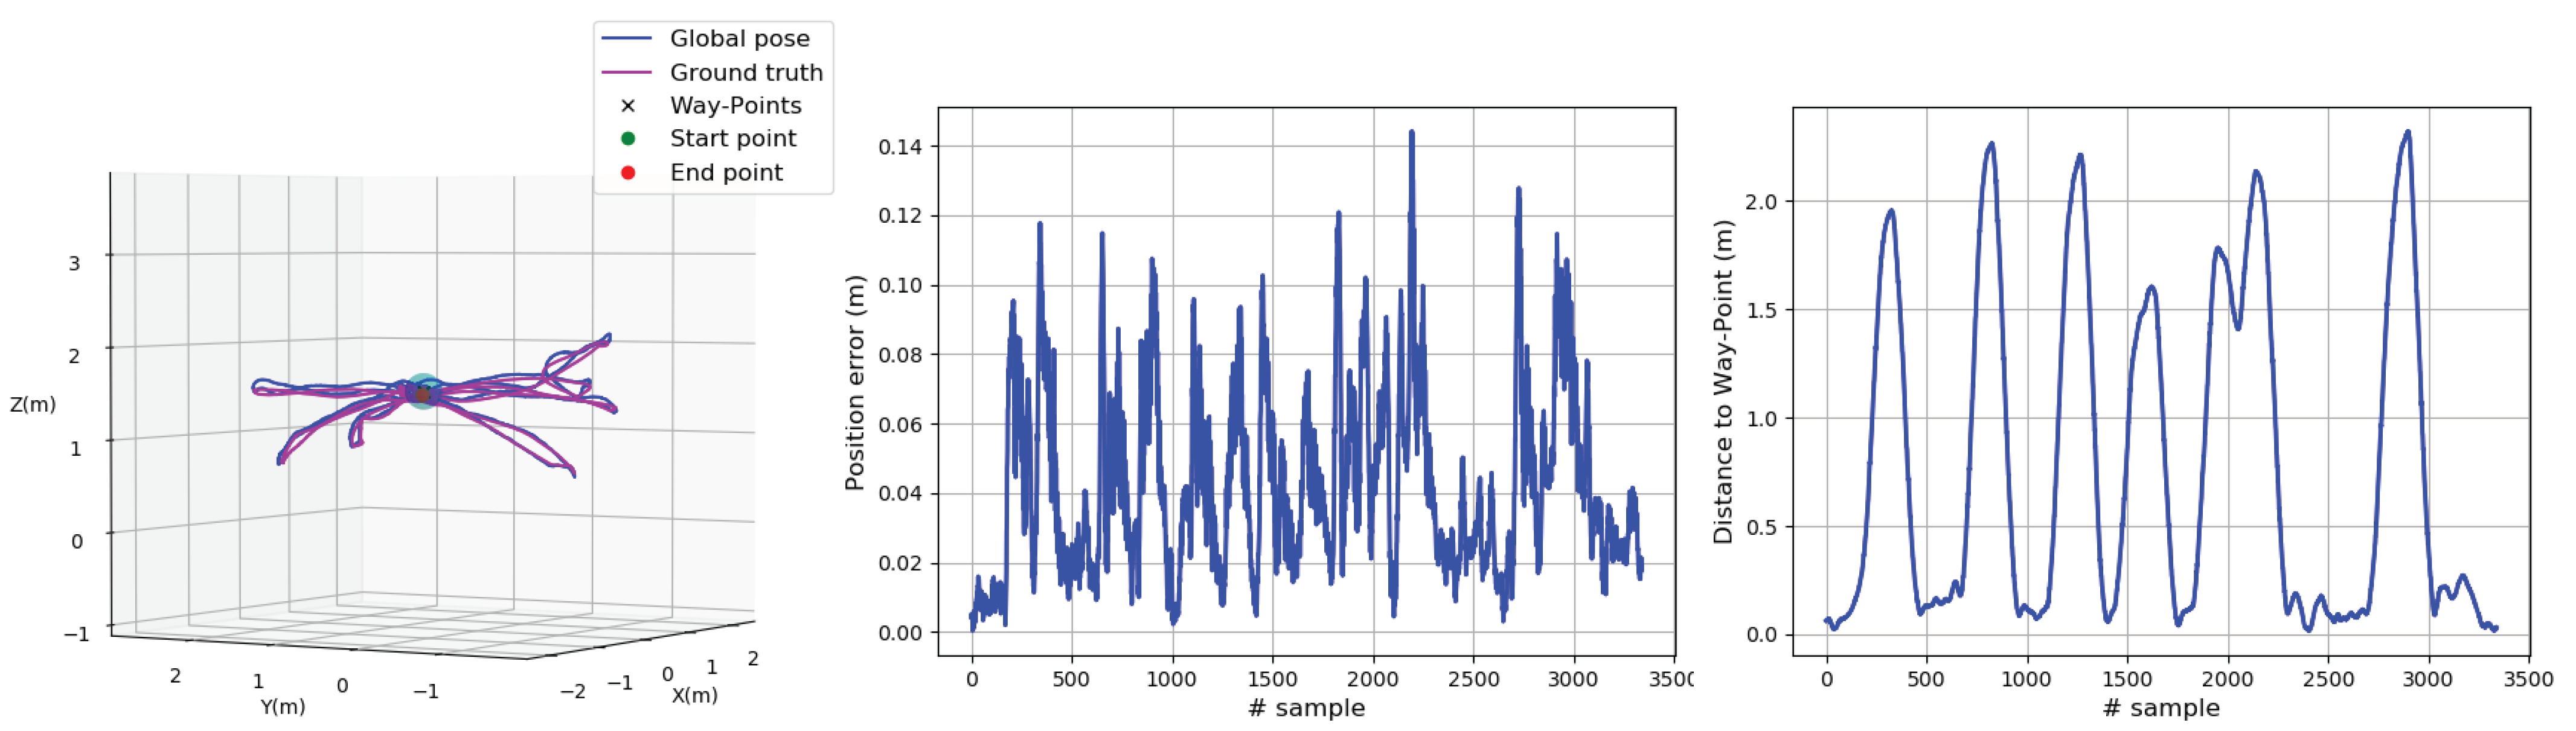
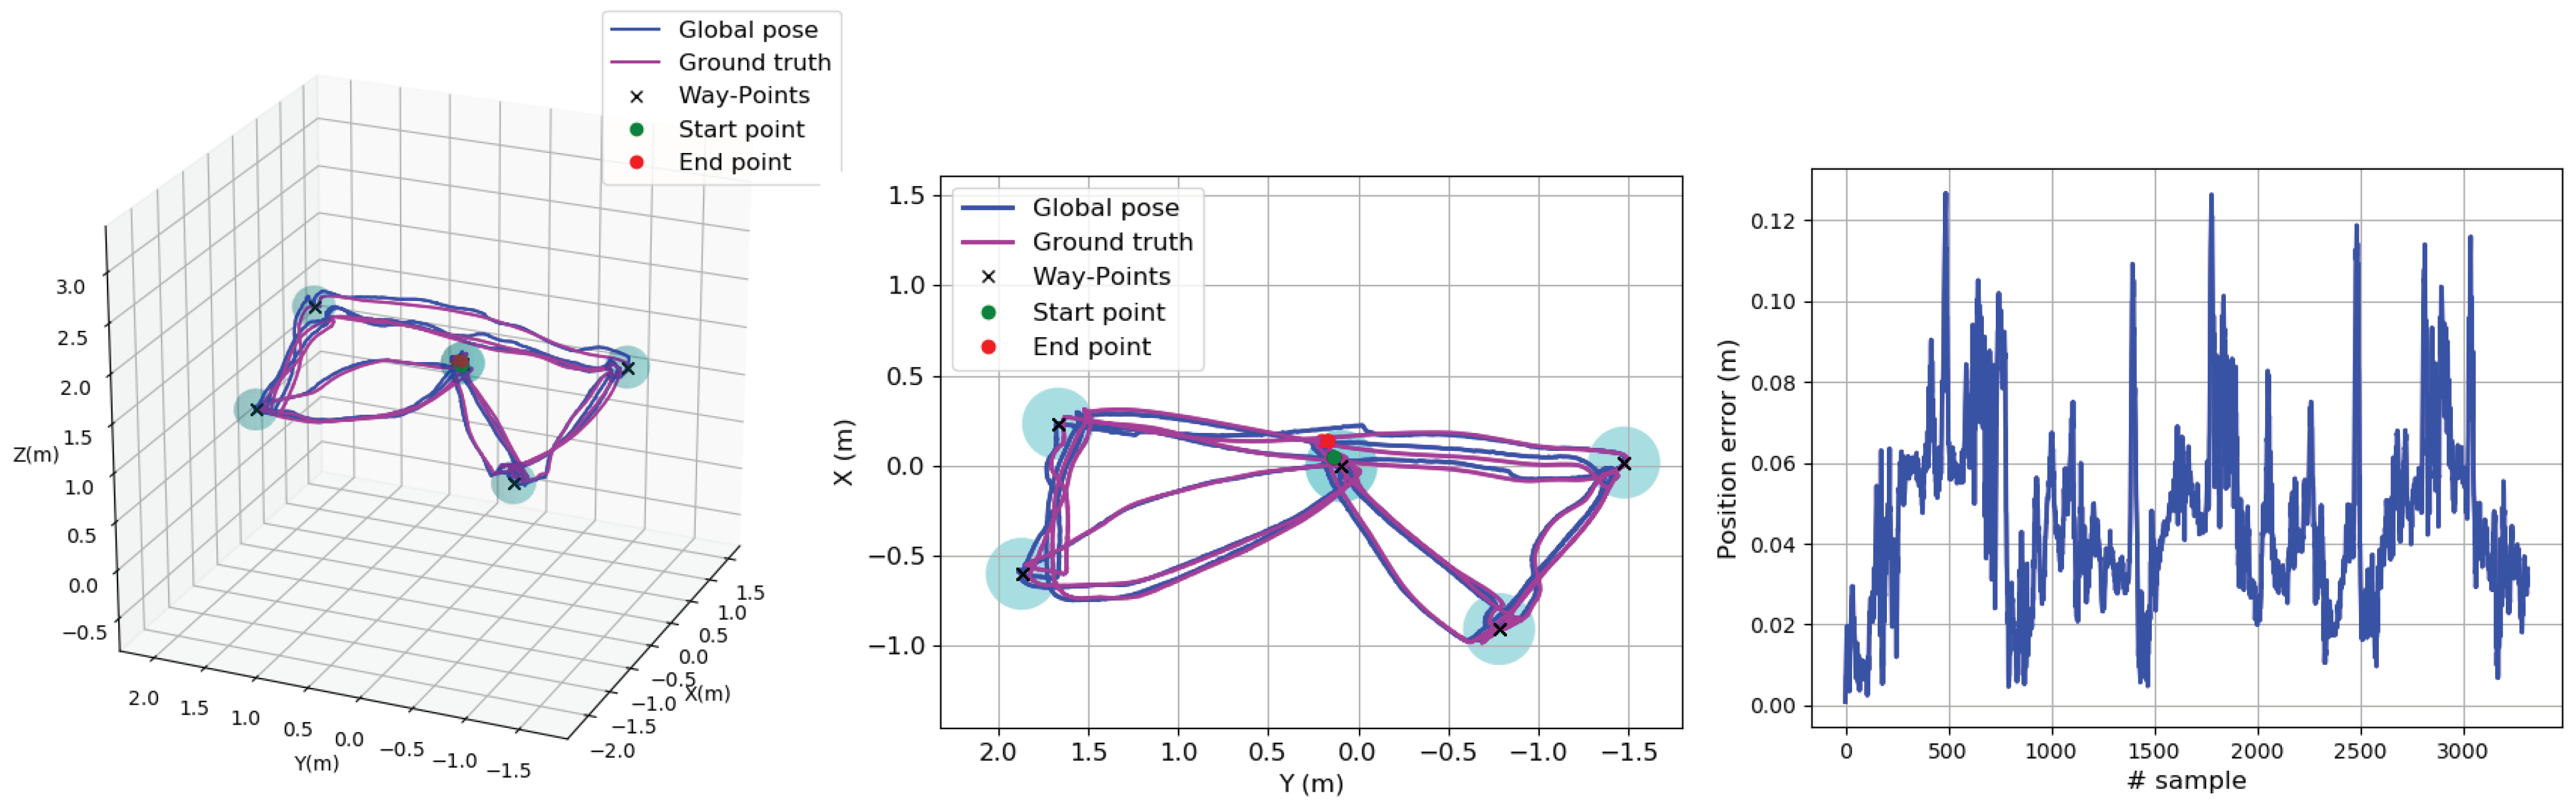
Also regarding the keep position capability, for the next experiment, we take the platform to a point in the middle of the laboratory, set it as the point to keep, and then we separate the platform from it on several occasions. After each separation, we observe how the control software makes the platform return to the set point. Figure 12 (left) shows true and estimated paths during the experiment, while Figure 12 (middle) plots the localization error (below 10 cm most of the time) and Figure 12 (right) shows the evolution of the distance between the platform and the point to keep (as can be observed from the six peaks, we separated the platform from the set-point on six occasions).
The next experiment evaluates further the performance of the vehicle when it is sent back to previously visited locations using the go to point command. Figure 13 reports on this experiment. It starts after situating the platform in the middle of the laboratory and saving this location. The platform is then successively displaced (by tele-operation) to four different locations within the laboratory, and the corresponding points are recorded as way-points. Then, the platform is sent back to the initial position, closing a first loop within the laboratory. From this point, the platform is successively sent to the stored locations following the same sequence, making use of the go to point command every time, finishing again at the initial position. This process consisting of a set of autonomous displacements is repeated twice, performing a second and a third loop within the laboratory. The trajectory comprising the three loops (the tele-operated loop and the two autonomous loops) is shown in Figure 13 (left, middle). The error between the estimated and the actual positions, which is also below 10 cm most part of the time, can be found in Figure 13 (right). For ease of reference, Figure 13 shows as black crosses ‘×’ the way-points generated by the Mission manager module during flight. A way-point is considered attained when the robot is inside a 50 cm-sphere centred into the way-point (the sphere is shown in the plots in blue).
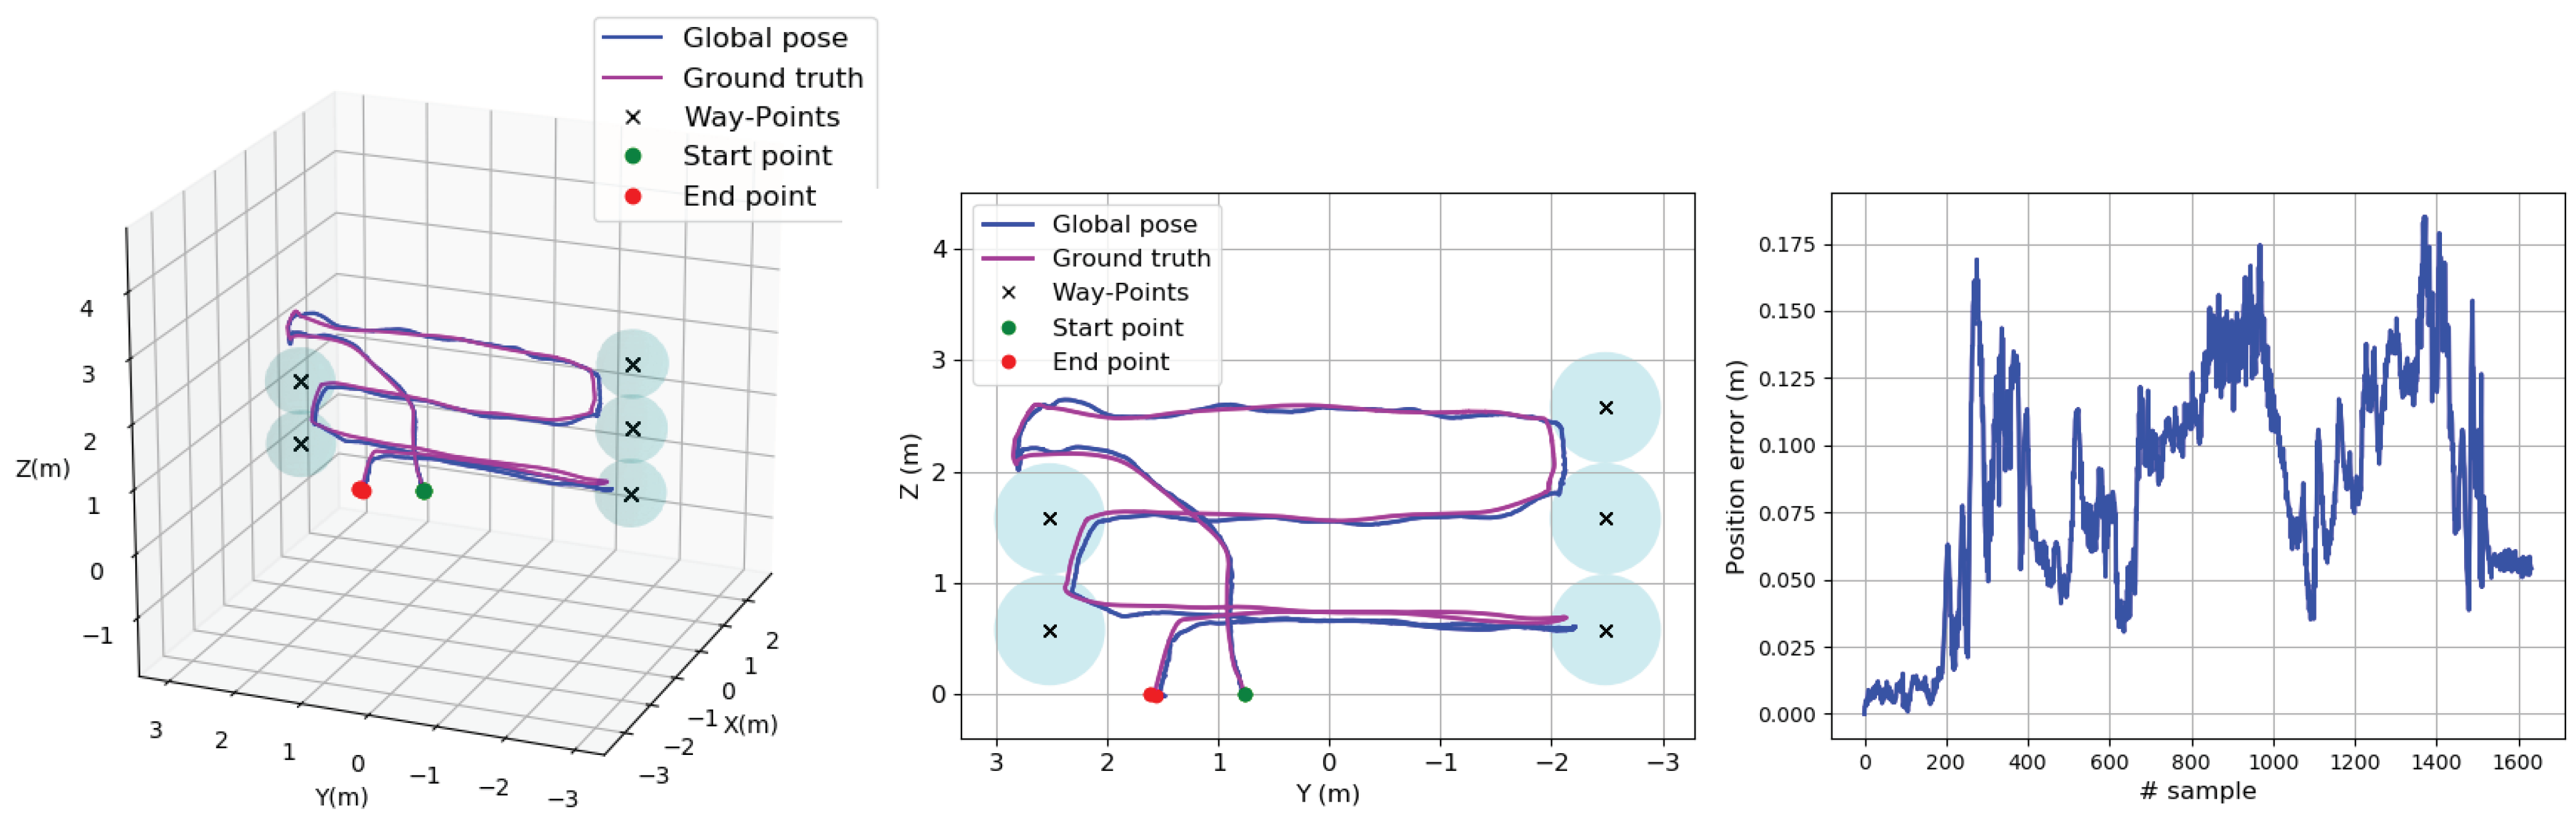
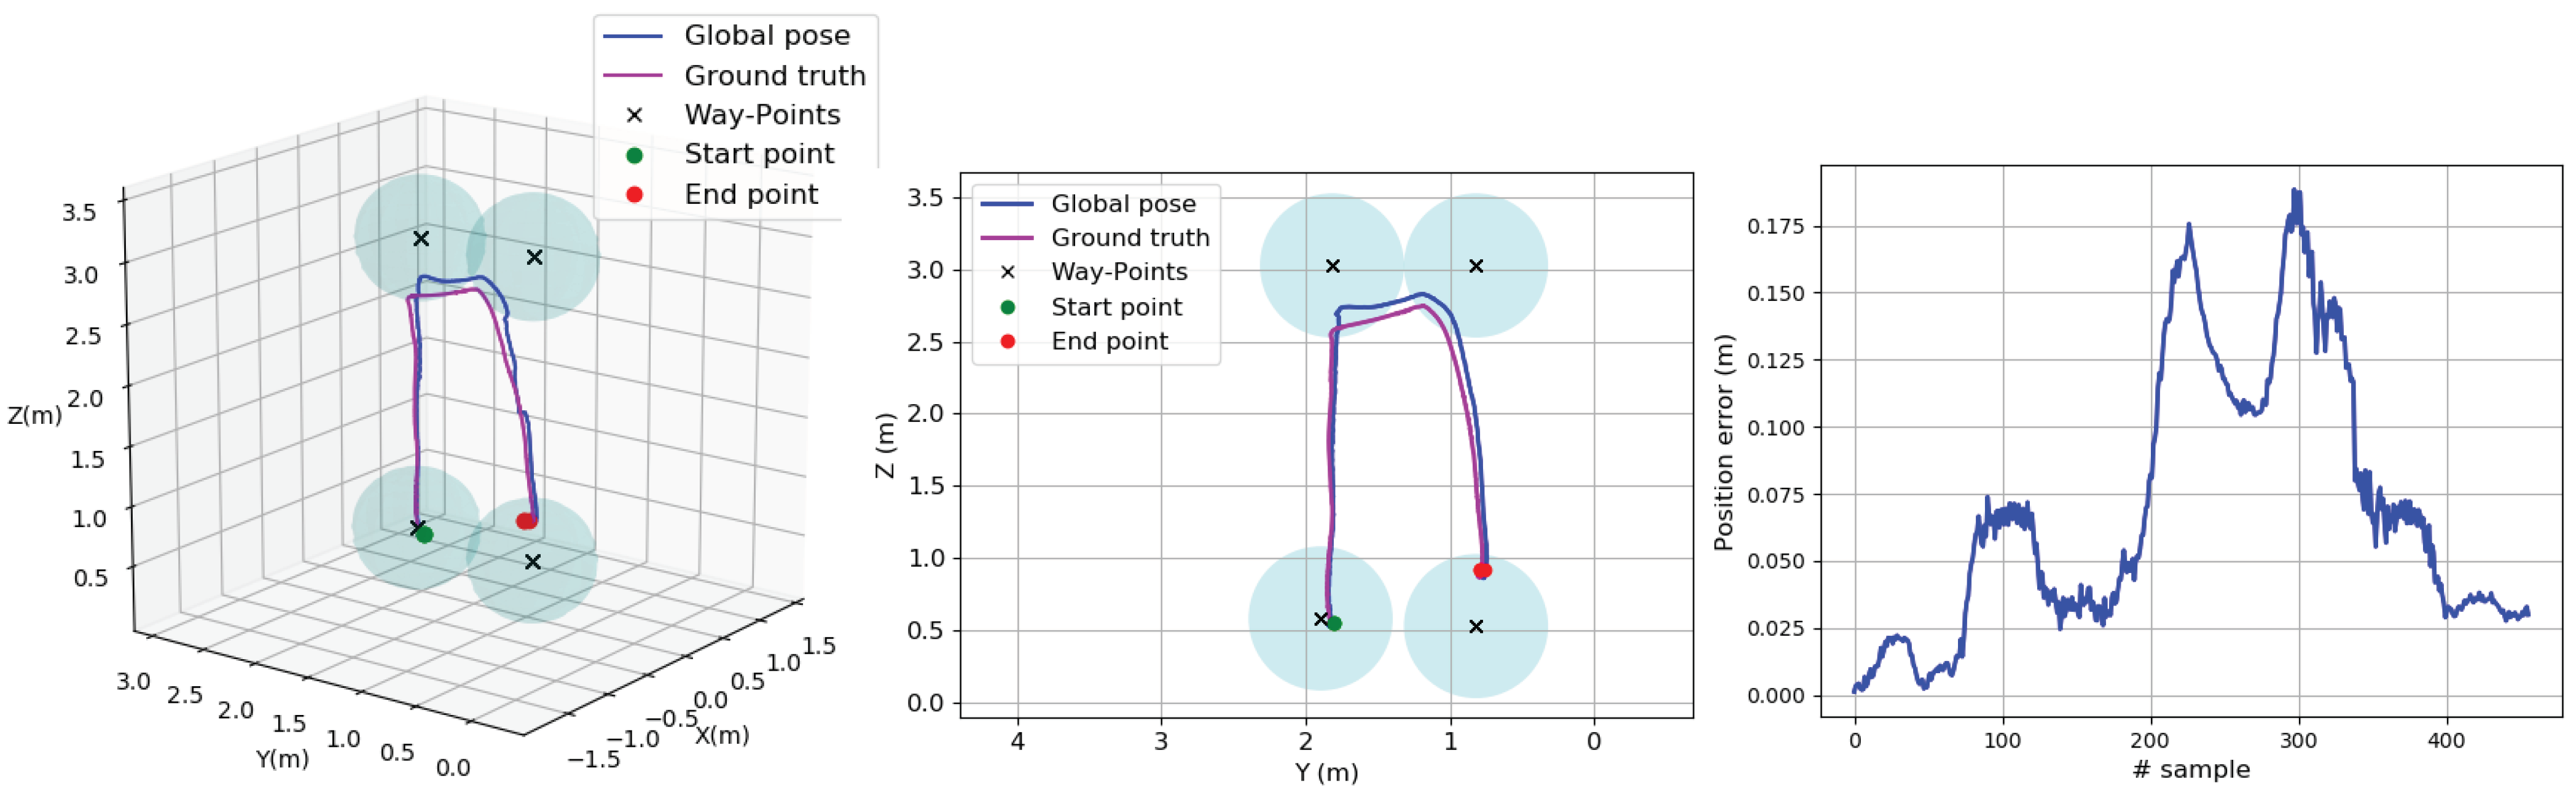
Following with way-point navigation, in Figure 14, we show results for a 5 × 3-meter autonomous sweeping at the laboratory, descending 1 m between transects. The area to sweep was configured through the web-based GUI, specifying the area width and height together with the step between transects; the sweeping starts at the point in 3D space where the operator activates the inspection mission, i.e., at the top-left corner of the intended path. The trajectories shown in Figure 14 indicate that the MAV is able to successfully perform an autonomous sweeping keeping the position error below 15 cm almost all the time (see Figure 14 (right)). For completeness, Figure 15 shows the same kind of results for a vertical inspection flight, with a performance similar to that of the autonomous sweeping skill.
Table 1 summarizes quantitatively the performance related to the self-localization capability of the platform for all the experiments reported up to now (the experiments are referenced by the number of the figure where the corresponding results have been shown). The table reports on the mean and the standard deviation of the error, as well as the Root Mean Squared Error (RMSE), for every case and globally, showing an average error of about 5–6 cm.
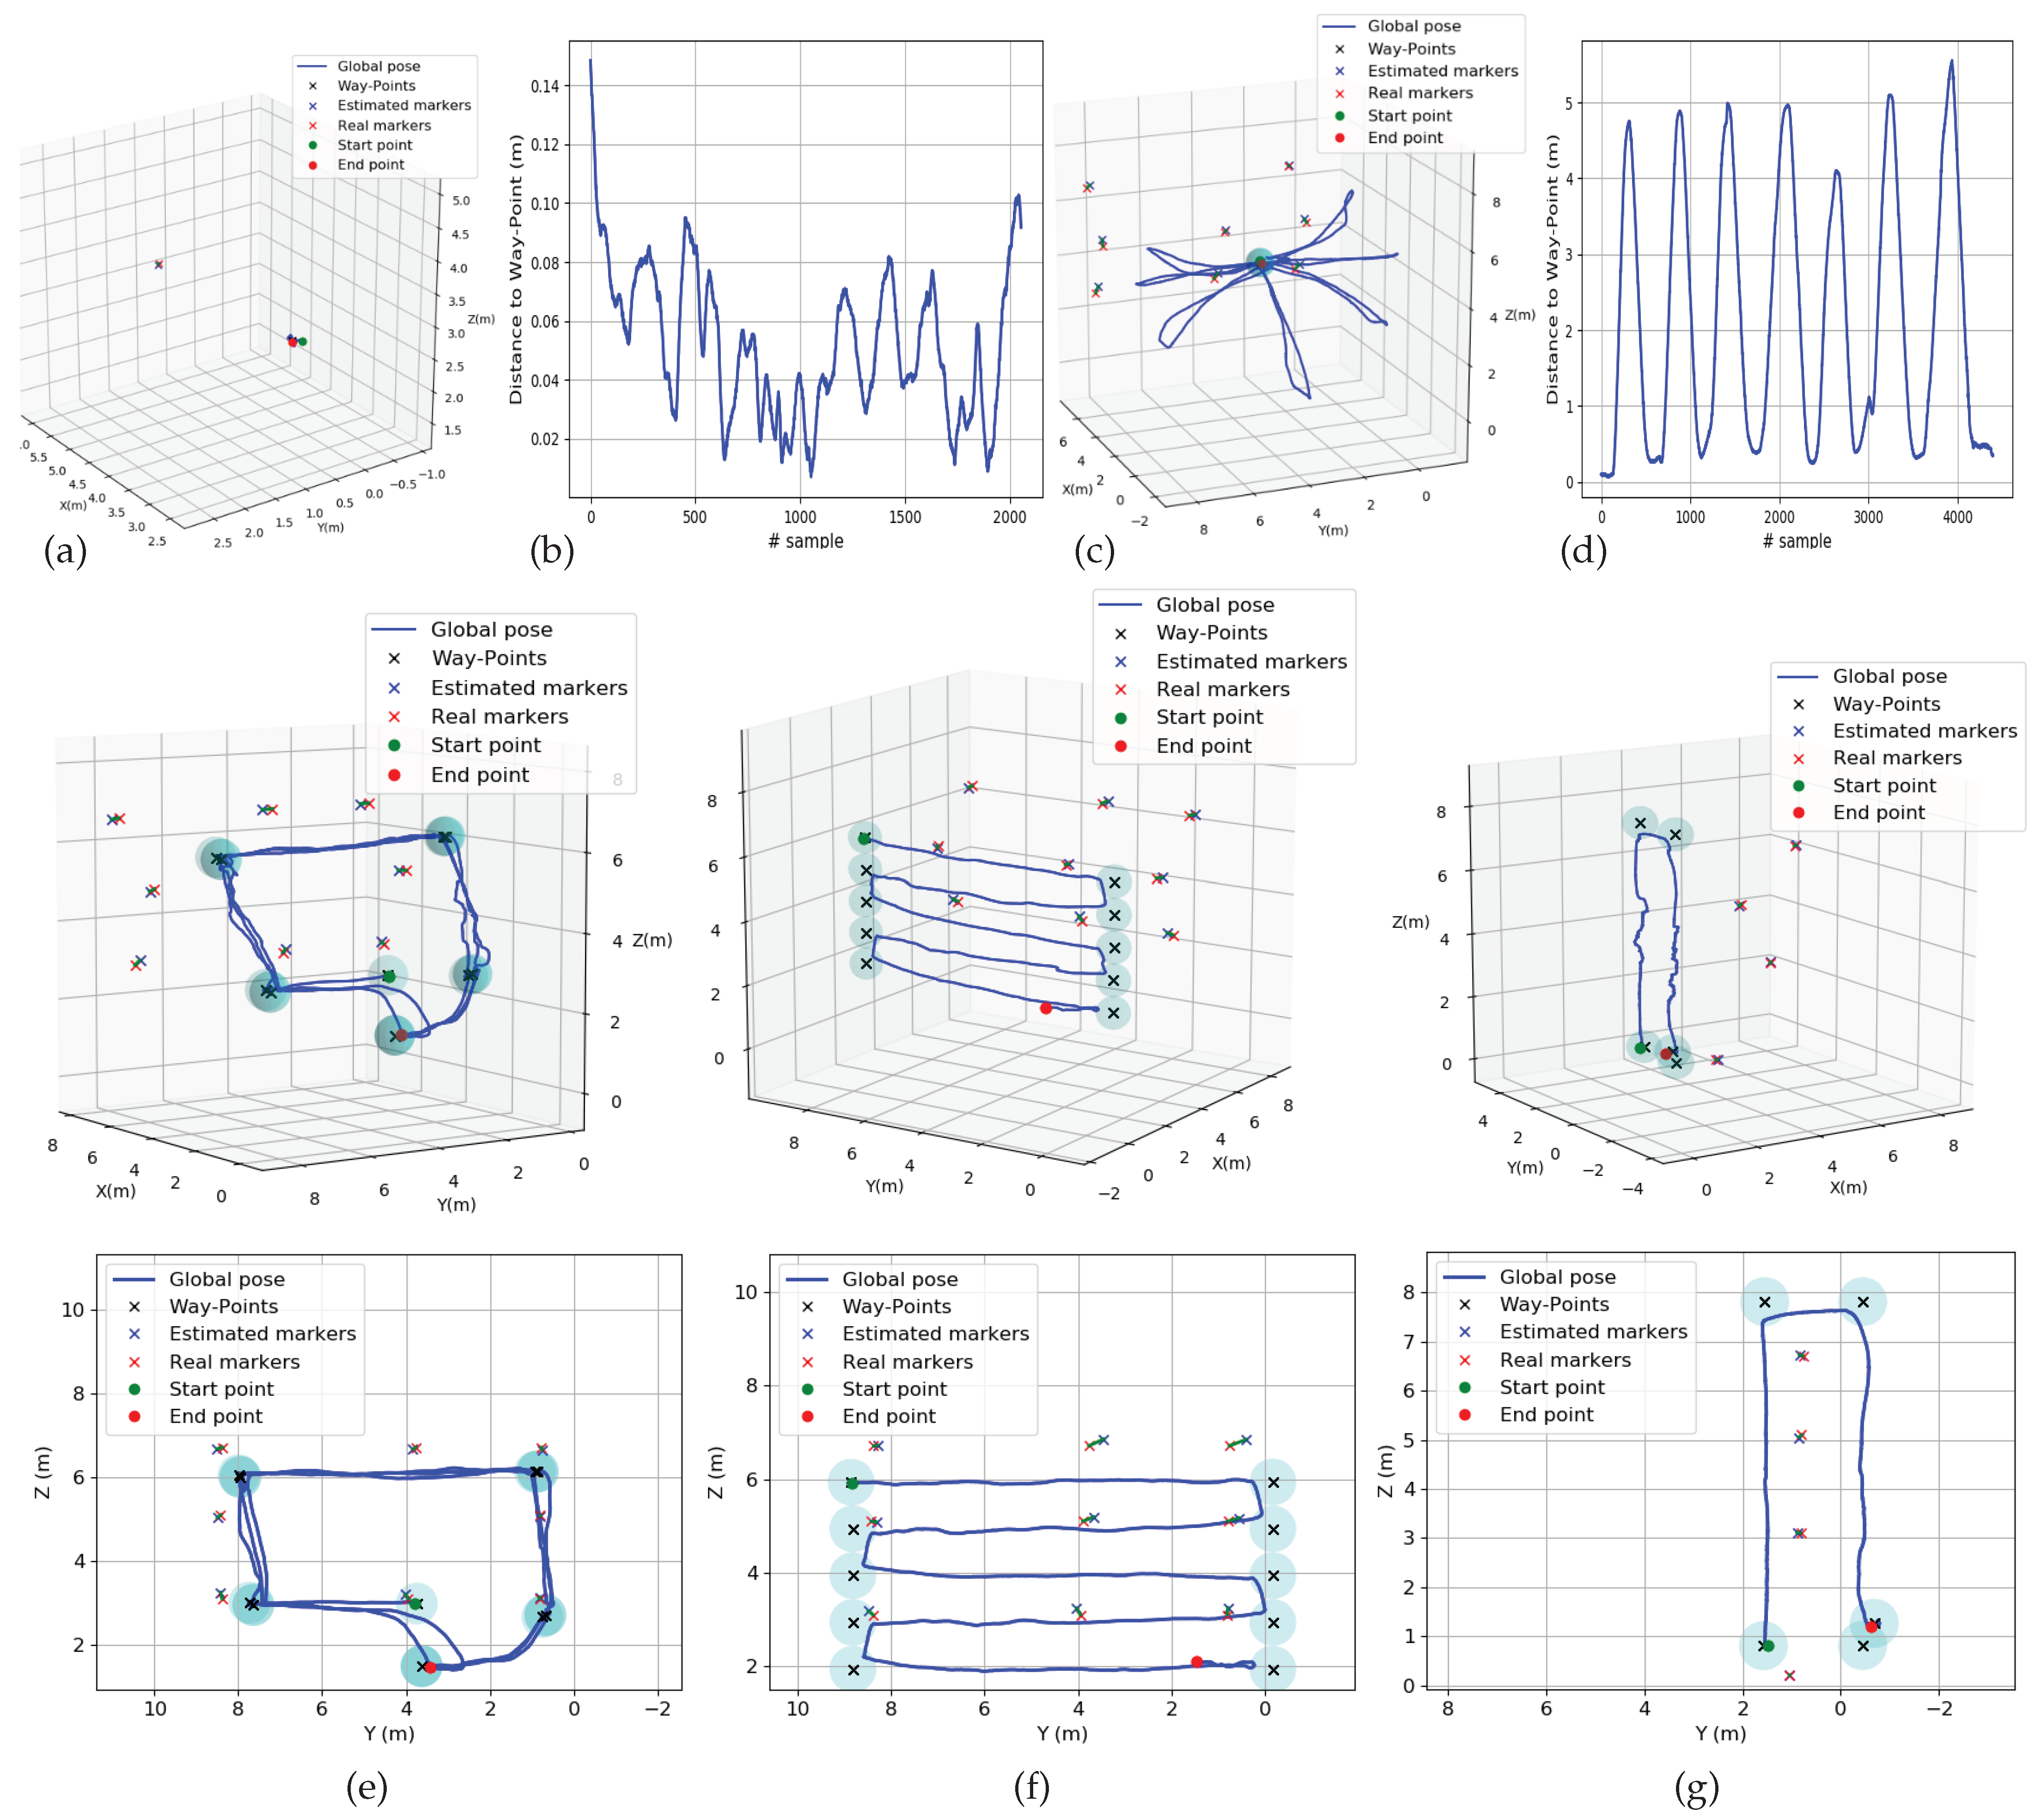
We switch now to a testing environment wider than the laboratory to observe the performance of the vehicle when operating within an inspection area whose dimensions are closer to the size of a typical cargo hold (the motion capture system was not available for this environment). Plots at Figure 16 report on some flights oriented to check the different skills. As can be observed, all the tests could be replicated without any difficulty.
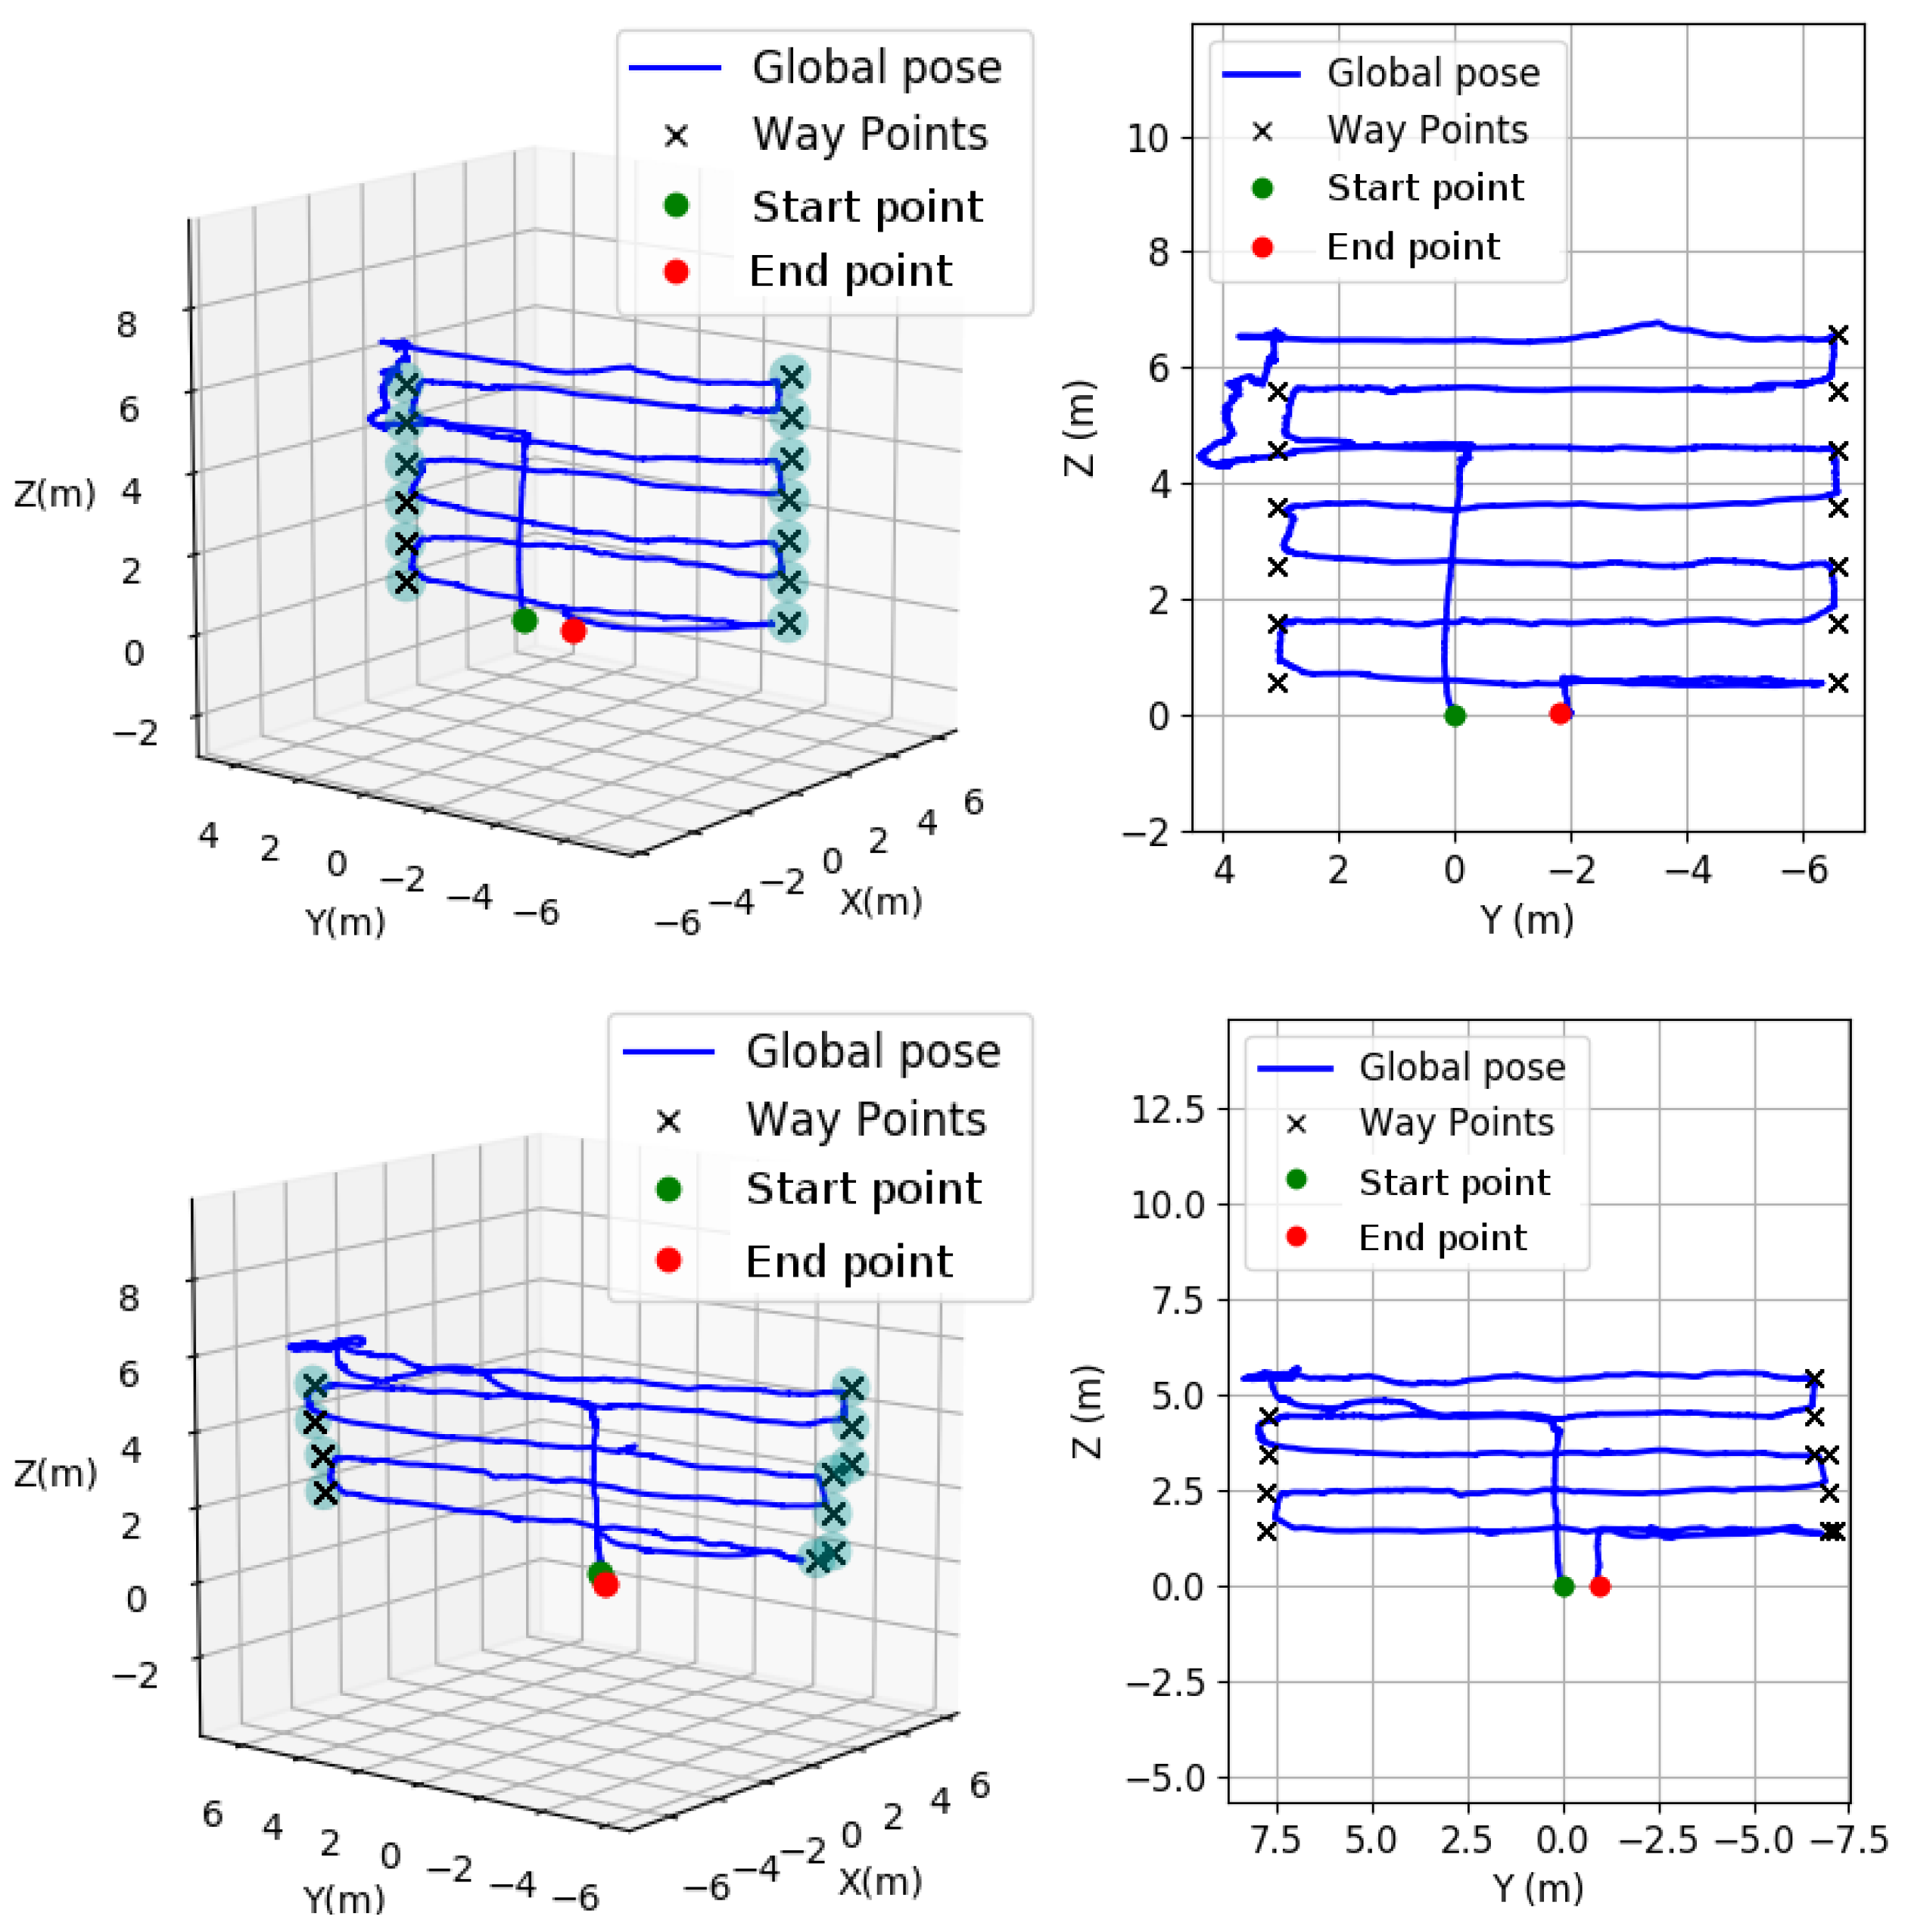
Figure 17 plots two more autonomous sweeping flights which are worth commenting. As on previous occasions, the sweepings were respectively configured through the GUI to cover areas of 10 × 6 m (Figure 17 (top)) and 15 × 4 m (Figure 17 (bottom)) with 1 m descent when reaching the left/right end. As before, the plots also show the way-points generated by the Mission manager, and the 50-cm light blue spheres that can be observed on the rightmost/leftmost sides of both figures show the tolerance volumes as for the achievement of way-points. The ‘replicated’ way-points that can be observed at the right ends of some of the transects plotted at Figure 17 (bottom) are due to the fact that the sweeping was paused after issuing a motion command from the R/C: this functionality permits correcting the position of the platform if needed during autonomous operation. The sweeping was resumed after the rectification, what made the Mission manager generate new way-points as a consequence of the new position attained, and in order to travel the distance remaining up to the other end of the area to sweep.
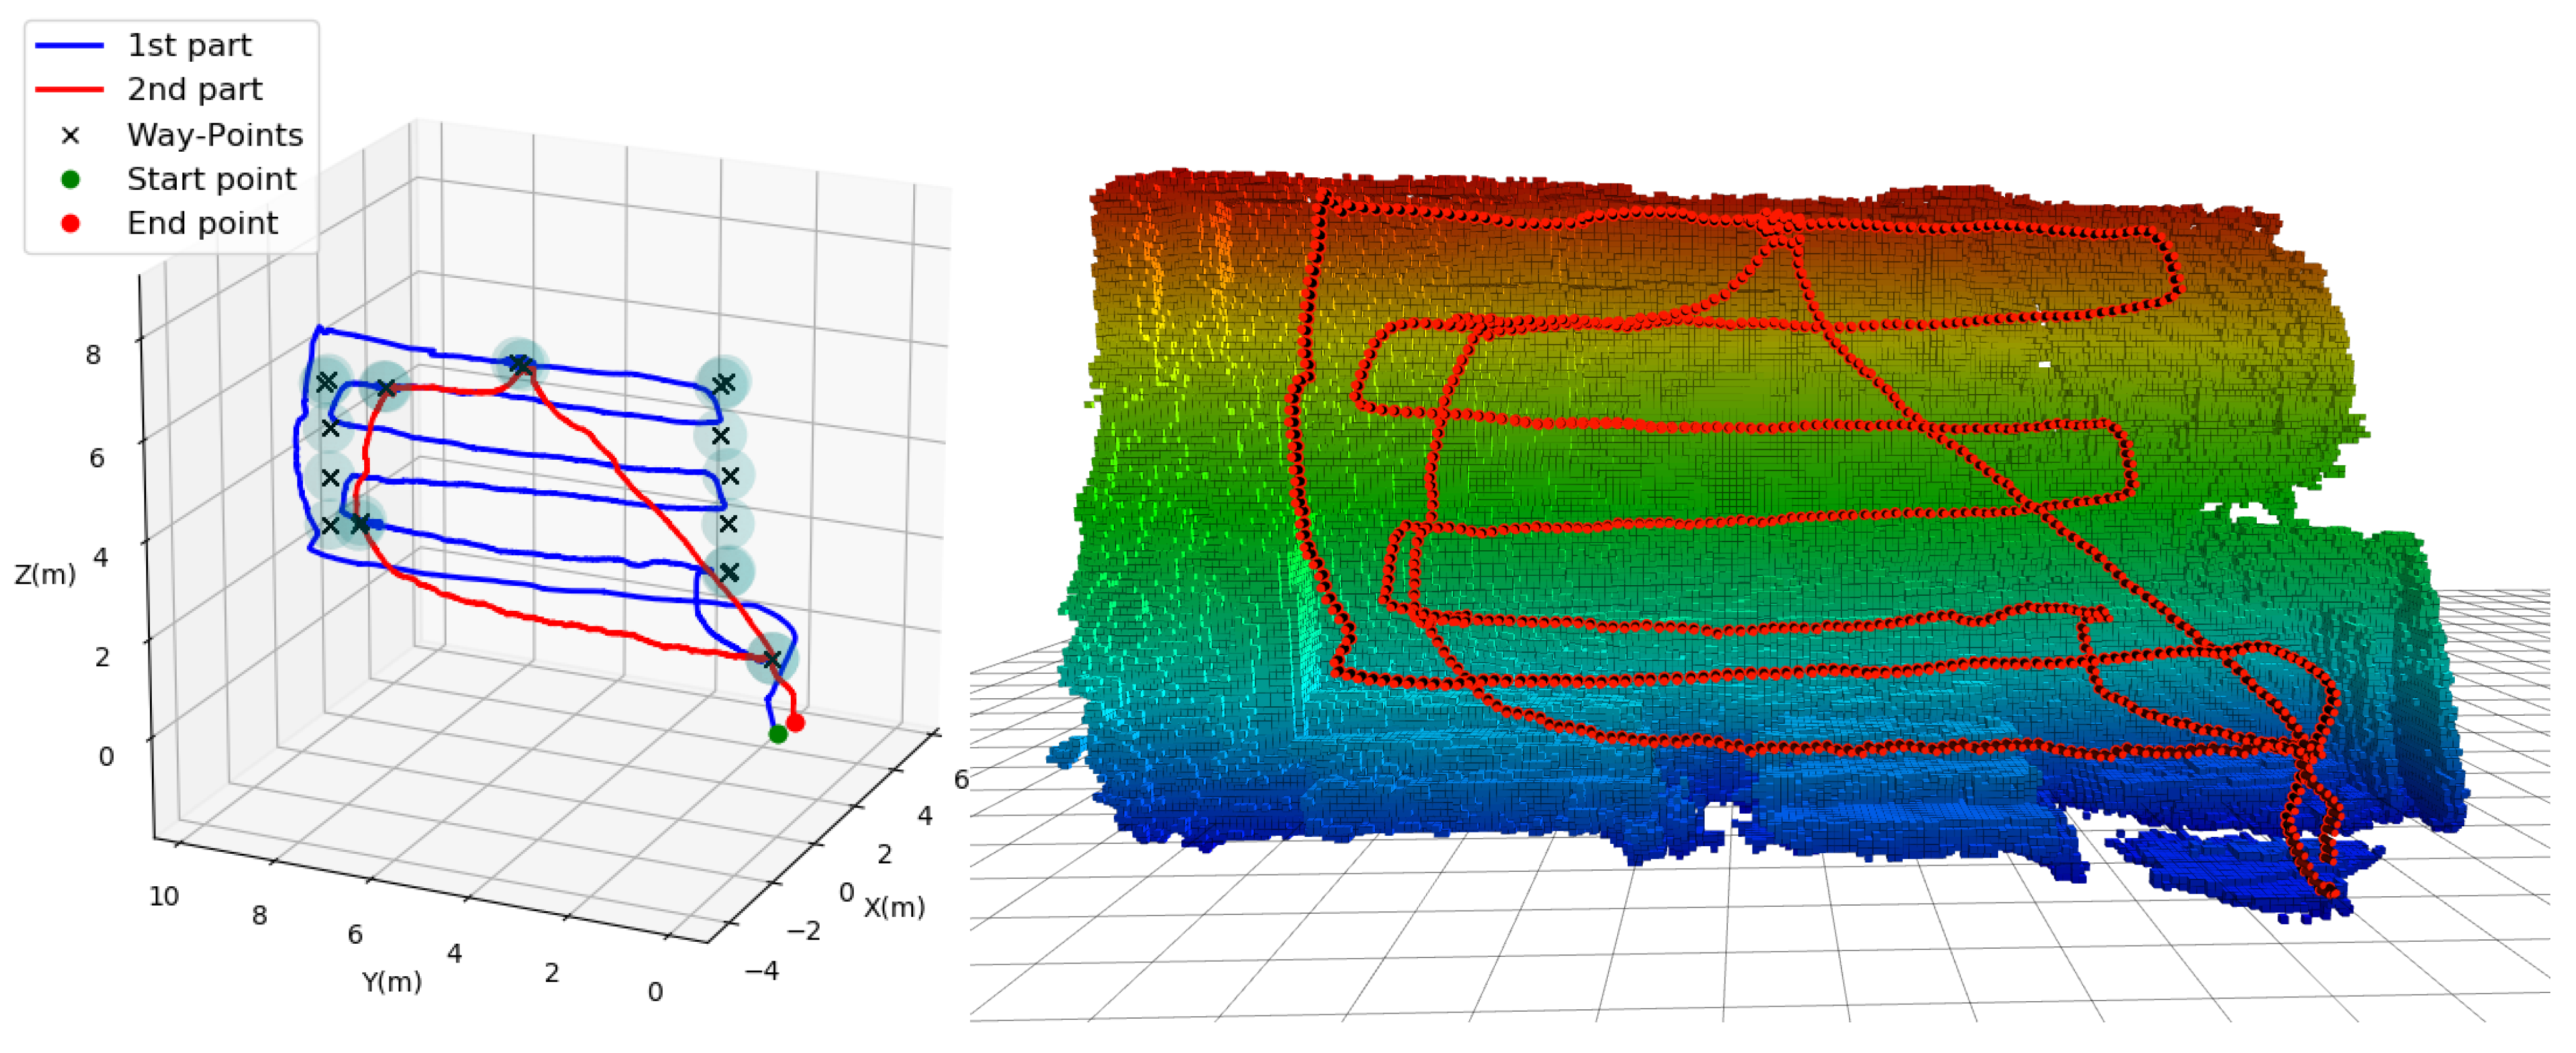
To finish, in Figure 18 and Figure 19, we show plots of several flights emulating more complex inspection scenarios within a cargo hold to illustrate additional functionalities which result from the control architecture the platform has been fitted with, and that result relevant from the inspection point of view. On the one hand, Figure 18 shows a sweeping operation where several points of interest that could be suspicious of being affected by some sort of defect are detected, recorded and visited again for closer inspection (supposedly under request of a surveyor attending the inspection operation). On this occasion, an occupancy grid is also included to show the coverage achieved by the inspection data, i.e., the imagery collected during flight; the collected RGB-D data was used to build the occupancy grid. On the other hand, Figure 19 plots two sweeping operations performed in a row to inspect two contiguous walls. This illustrates the performance achievable in respect to how intensive data capture can be during inspection flights, as well as regarding the consistency of position estimates.
7.2. Field Trials
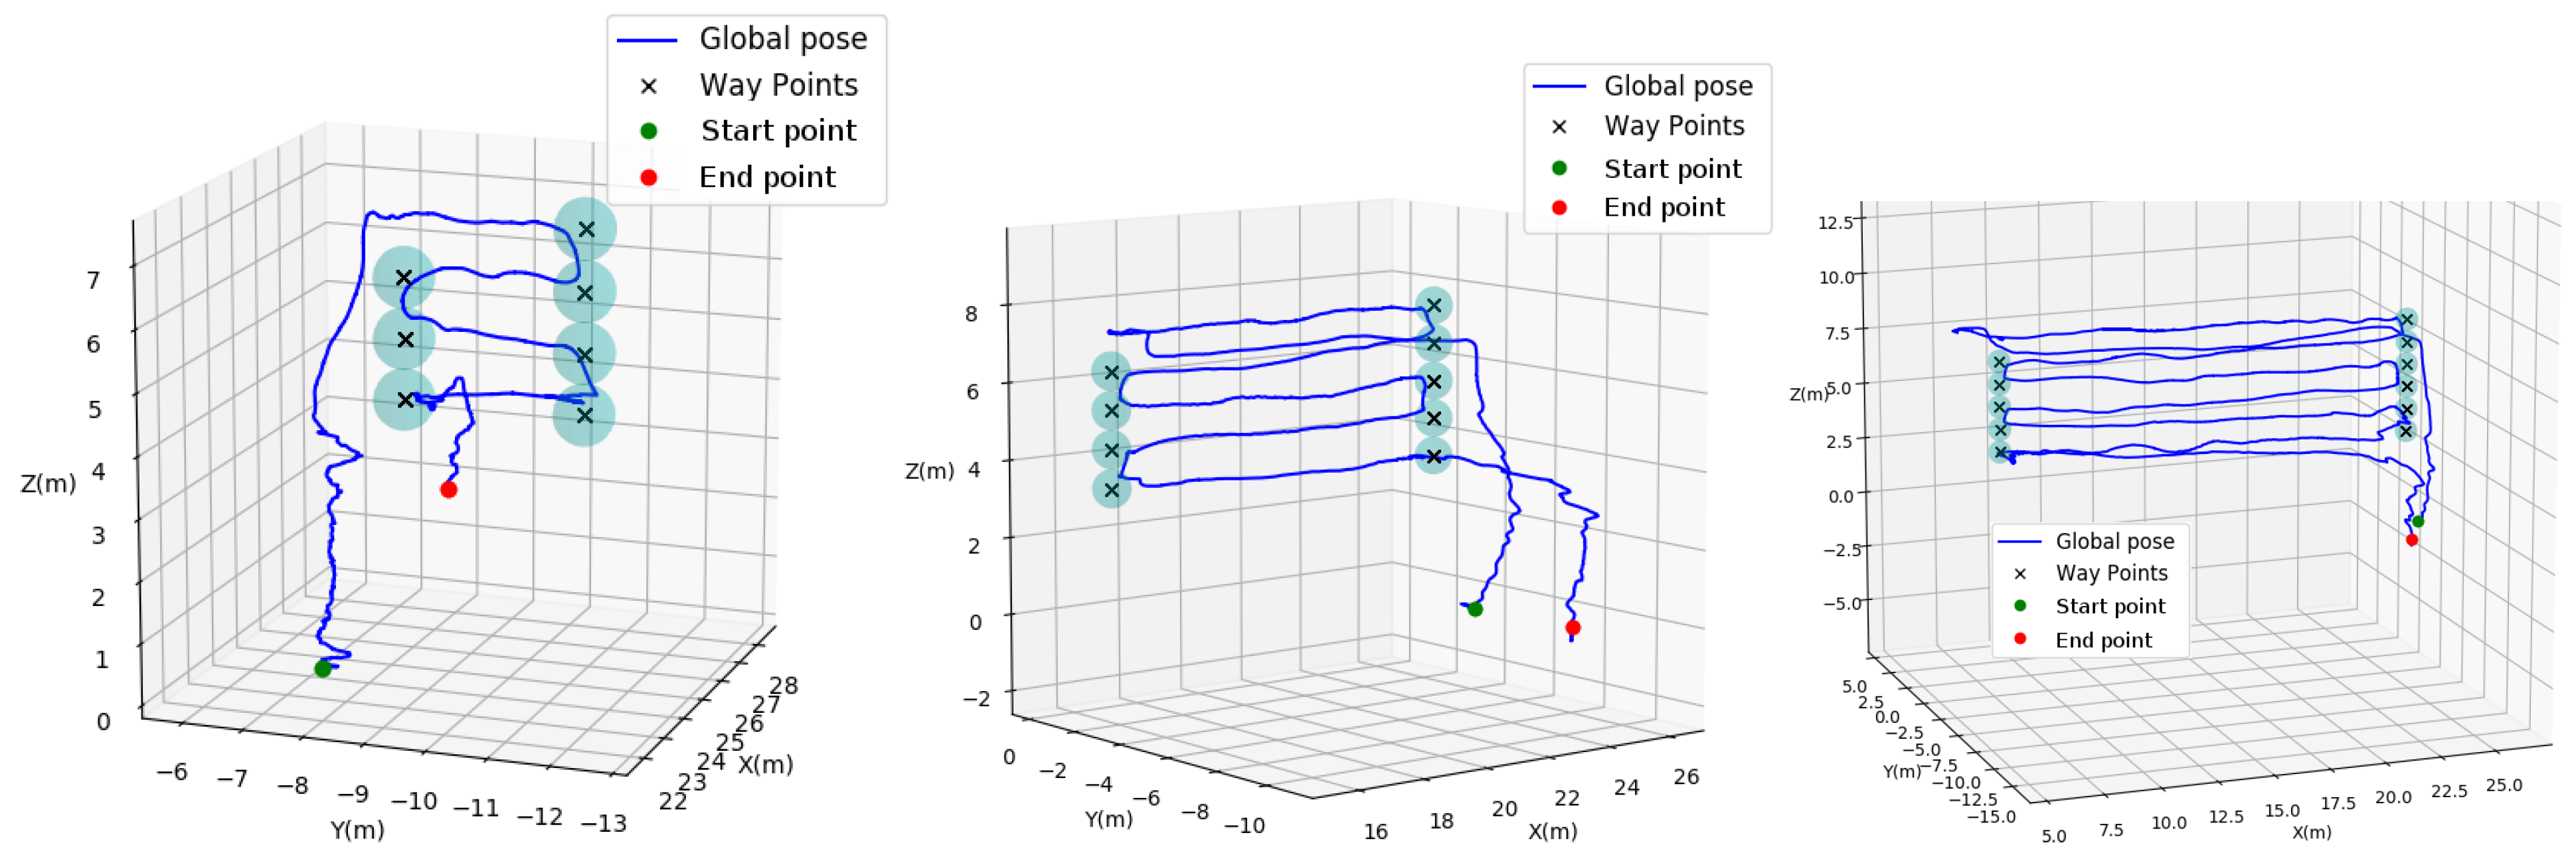
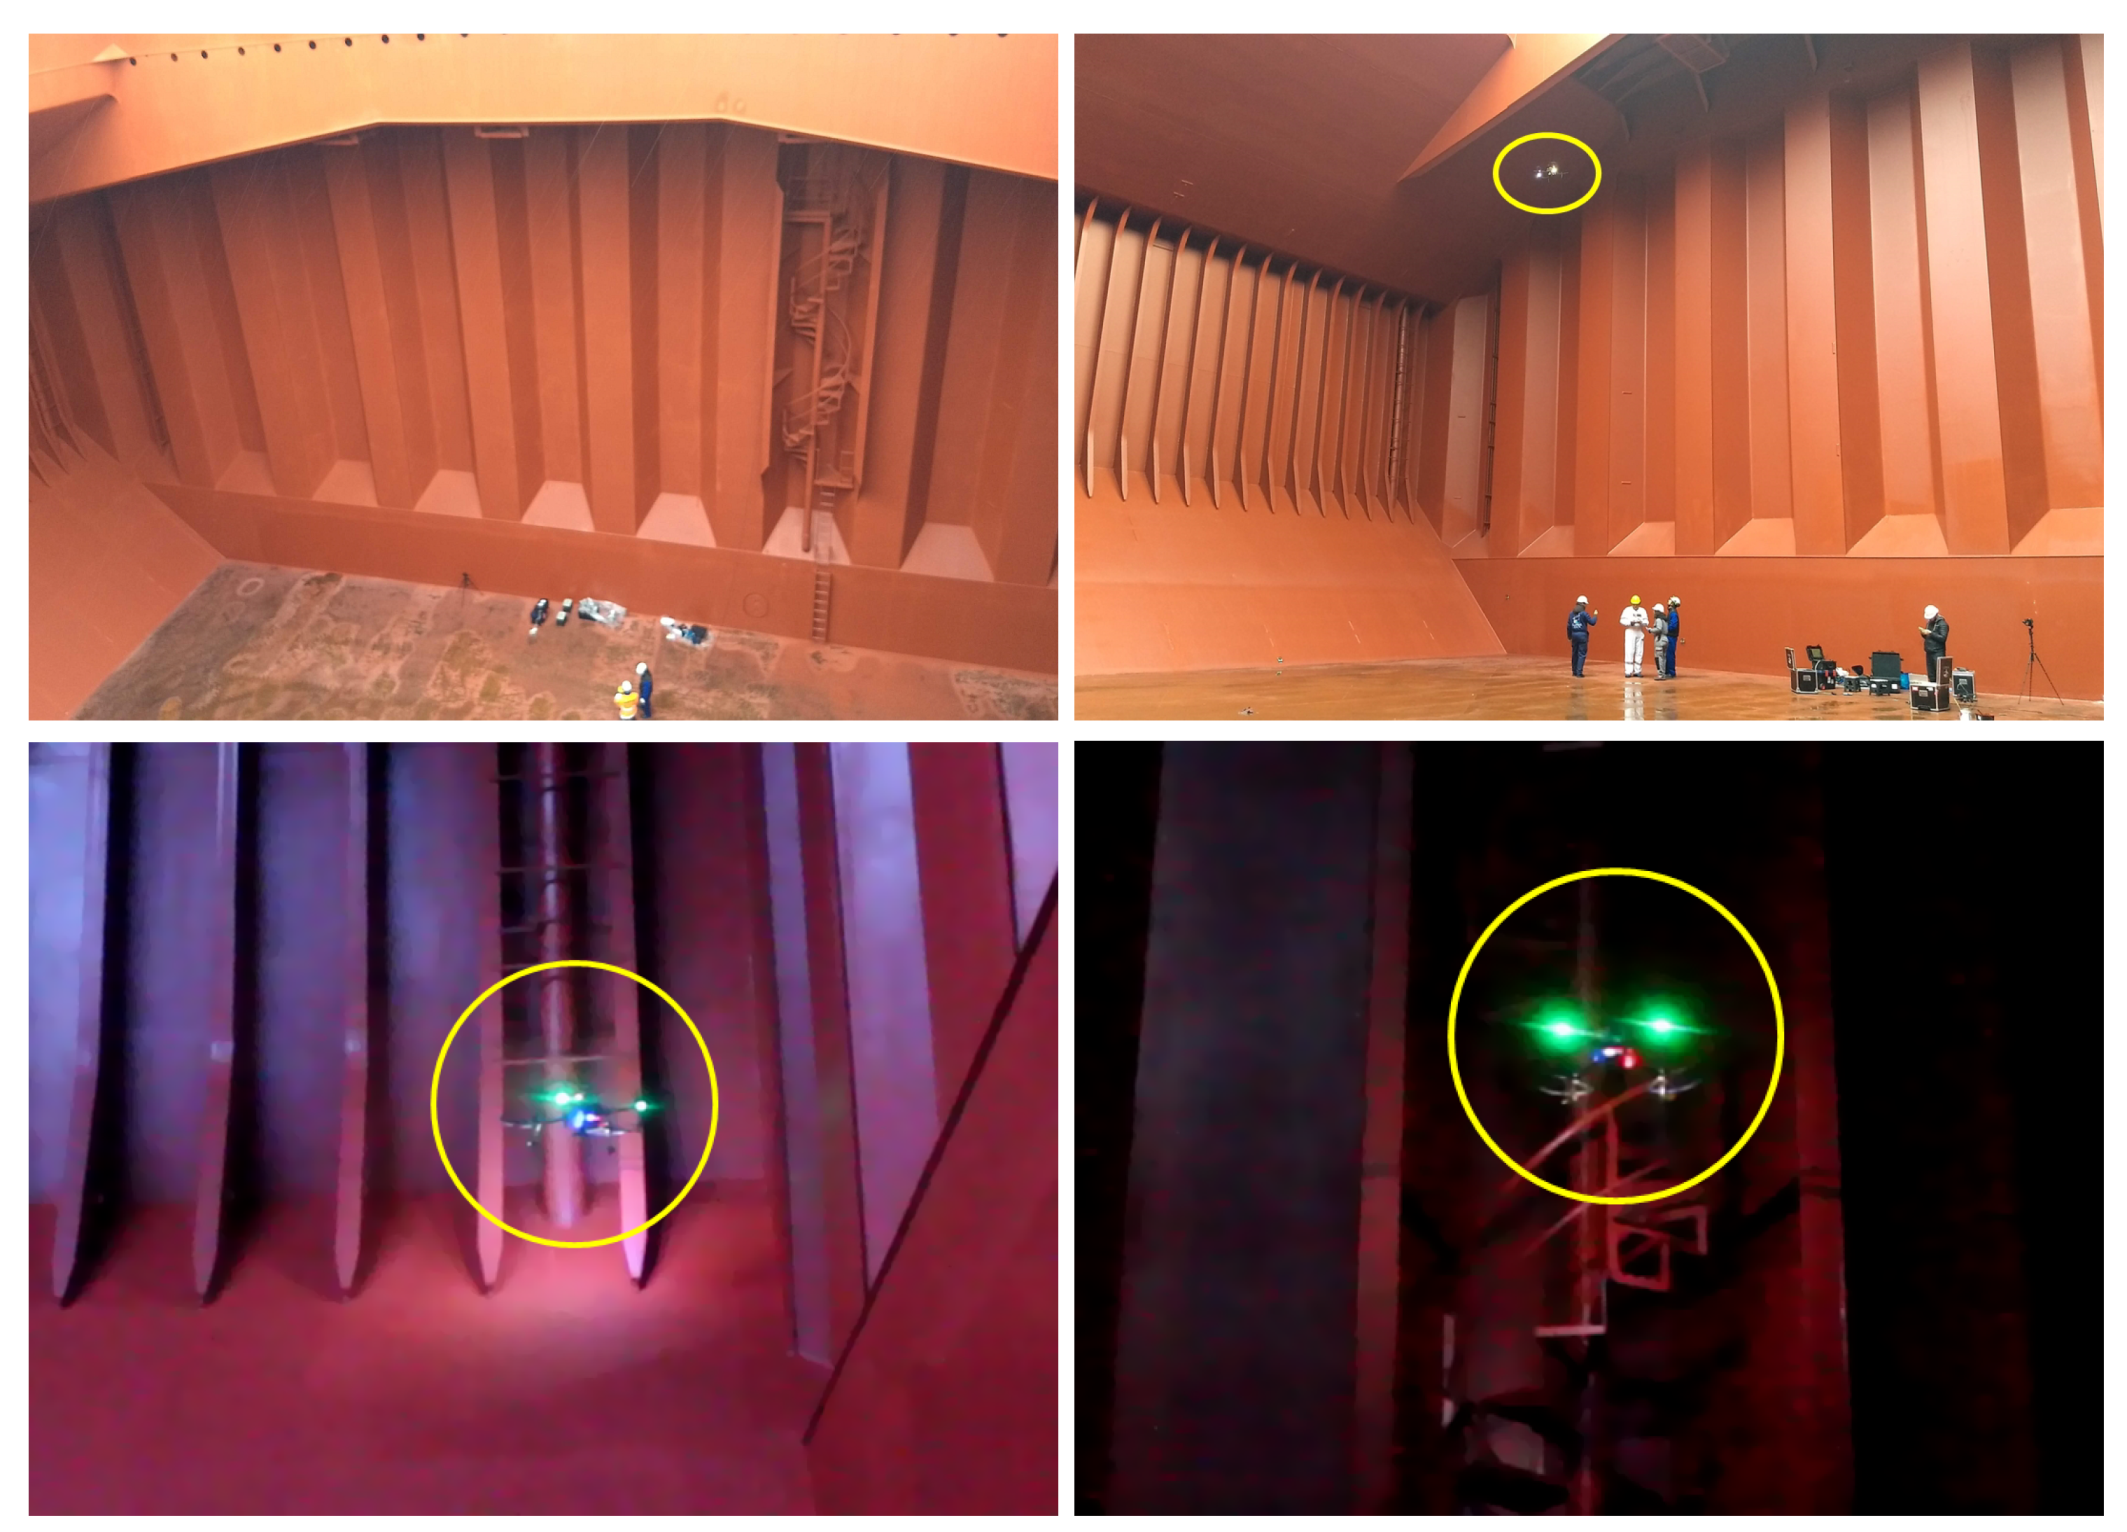
The MUSSOL system has been submitted to several field trials on-board real vessels during its development. In this section, we report on the field trial that took place inside the cargo hold #2 of a 95.000 DWT bulk carrier (see Figure 20). For these experiments, the platform was developed up to the level described in this paper, and was used to perform the inspection of the different walls and structures of the cargo hold in the presence of an experienced surveyor. The operation was totally conducted by the surveyor, defining the areas from which visual data should be collected for the inspection to be relevant and giving instructions to reach specific points. Besides, using the secondary R/C (the one in slave mode), he was able to operate the camera at all time, setting its orientation and zoom to perform an effective inspection. Figure 21 shows the paths followed by the robot during different autonomous sweepings. The left and middle plots correspond to sweepings whose dimensions were specified by the user, while the rightmost plot corresponds to a sweeping flight autonomously covering all the frames of the port side wall of the cargo hold, from end to end (approx. 18 m). All was configured by means of a tablet displaying the GUI. Way-points are indicated similarly to the previous tests.
8. Conclusions and Future Work
This paper introduces MUSSOL, a novel aerial robot intended for the visual inspection of cargo holds. The vehicle has been designed, in terms of locomotion abilities and operational features, to satisfy the scope of the survey activities, aiming at safer, more cost-efficient and more intensive inspection of wide spaces. A commercial platform has been used as a basis for the mechanical structure, being fitted with the sensing required to provide enhanced functionality and autonomy during inspection flights. A specifically designed base station complements the vehicle with computational resources and HIDs intended to facilitate the interaction with the robot and collect the inspection data.
To fit the platform with the necessary capabilities, a control architecture has been specifically designed and developed around the Supervised Autonomy (SA) paradigm. A number of suitable behaviours oriented towards visual inspection have been accordingly defined and integrated after analyzing the needs of visual inspection problems.
Successful performance, in the form of both qualitative and quantitative results, has been reported for a set of experiments aiming at assessing the different functionalities of the platform. These experiments have been performed not only under laboratory conditions, but also within real vessels. After all these tests, some lessons have been learnt, to be addressed in the near future:
- Although cargo holds are essentially similar from bottom to top, so that sensing from a 2D laser scanner results enough for navigation, a 3D laser scanner would provide enhanced perception. The incorporation of this kind of sensor will require changes at different levels of the control architecture here described, but with the benefit of enhanced capabilities.
- UWB technology has been observed convenient for the operation inside vessels. In [37], we provide more detail in this regard, including the method currently running on-board the platform. This method involves pre- and post-processing stages able to deal successfully with the sort of range estimations returned by the UWB tag in cargo holds. These stages and the method itself are now in the process of being improved to enhance the quality of the position estimates that are reported in [37].
Additionally, given the general orientation of the platform for visual inspection applications, we are extending the capabilities of the platform to enable the inspection of other areas of the vessel, e.g., the outer hull, which also requires regular inspections as part of a general maintenance programme.
Author Contributions
Conceptualization, all; methodology, all; software, F.B.-P., E.G.-F. and J.P.C.-C.; validation, all; formal analysis, all; investigation, all; resources, A.O.; data curation, all; writing—original draft preparation, F.B.-P., E.G.-F. and A.O.; writing—review and editing, A.O.; visualization, all; supervision, A.O.; project administration, A.O.; funding acquisition, A.O. All authors have read and agreed to the published version of the manuscript.
Funding
This work is partially supported by EU-H2020 projects BUGWRIGHT2 (GA 871260) and ROBINS (GA 779776), PGC2018-095709-B-C21 (MCIU/AEI/FEDER, UE), and PROCOE/4/2017 (Govern Balear, 50% P.O. FEDER 2014-2020 Illes Balears). This publication reflects only the authors views and the European Union is not liable for any use that may be made of the information contained therein.
Institutional Review Board Statement
Not applicable.
Informed Consent Statement
Not applicable.
Data Availability Statement
Not applicable.
Conflicts of Interest
The authors declare no conflict of interest.
Abbreviations
The following abbreviations are used in this manuscript:
| BS | Base Station |
| FMU | Flight Management Unit |
| GCU | Ground Control Unit |
| GUI | Graphical User Interface |
| HID | Human Interaction Device |
| MAV | Micro-Aerial Vehicle |
| RC | Remote Controller |
| R/C | Radio Controller |
| SA | Supervised Autonomy (robot control paradigm) |
References
- Ortiz, A.; Bonnin-Pascual, F.; Gibbins, A.; Apostolopoulou, P.; Bateman, W.; Eich, M.; Spadoni, F.; Caccia, M.; Drikos, L. First Steps Towards a Roboticized Visual Inspection System for Vessels. In Proceedings of the 2010 IEEE 15th Conference on Emerging Technologies & Factory Automation (ETFA 2010), Bilbao, Spain, 13–16 September 2010; pp. 1–6. [Google Scholar]
- Cheng, G.; Zelinsky, A. Supervised Autonomy: A Framework for Human-Robot Systems Development. Auton. Robot. 2001, 10, 251–266. [Google Scholar] [CrossRef]
- Lazakis, I.; Dikis, K.; Michala, A.L.; Theotokatos, G. Advanced ship systems condition monitoring for enhanced inspection, maintenance and decision making in ship operations. Transp. Res. Procedia 2016, 14, 1679–1688. [Google Scholar] [CrossRef] [Green Version]
- Burri, M.; Nikolic, J.; Hürzeler, C.; Caprari, G.; Siegwart, R. Aerial Service Robots for Visual Inspection of Thermal Power Plant Boiler Systems. In Proceedings of the 2012 2nd International Conference on Applied Robotics for the Power Industry (CARPI), Zurich, Switzerland, 11–13 September 2012; pp. 70–75. [Google Scholar]
- Nikolic, J.; Burri, M.; Rehder, J.; Leutenegger, S.; Huerzeler, C.; Siegwart, R. A UAV System for Inspection of Industrial Facilities. In Proceedings of the 2013 IEEE Aerospace Conference, Big Sky, MT, USA, 2–9 March 2013; pp. 1–8. [Google Scholar]
- Quenzel, J.; Nieuwenhuisen, M.; Droeschel, D.; Beul, M.; Houben, S.; Behnke, S. Autonomous MAV-based Indoor Chimney Inspection with 3D Laser Localization and Textured Surface Reconstruction. J. Intell. Robot. Syst. 2019, 93, 317–335. [Google Scholar] [CrossRef]
- Ozaslan, T.; Loianno, G.; Keller, J.; Taylor, C.J.; Kumar, V.; Wozencraft, J.M.; Hood, T. Autonomous Navigation and Mapping for Inspection of Penstocks and Tunnels With MAVs. IEEE Robot. Autom. Lett. 2017, 2, 1740–1747. [Google Scholar] [CrossRef]
- Angeli, S.; Lingua, A.M.; Maschio, P.; Piantelli, L.; Dugone, D.; Giorgis, M. Dense 3D Model Generation of a Dam Surface Using UAV for Visual Inspection. In Advances in Service and Industrial Robotics; Aspragathos, N.A., Koustoumpardis, P.N., Moulianitis, V.C., Eds.; Springer International Publishing: Cham, Switzerland, 2019; pp. 151–162. [Google Scholar]
- Jimenez-Cano, A.E.; Braga, J.; Heredia, G.; Ollero, A. Aerial Manipulator for Structure Inspection by Contact from the Underside. In Proceedings of the 2015 IEEE/RSJ International Conference on Intelligent Robots and Systems (IROS), Hamburg, Germany, 28 September–2 October 2015; pp. 1879–1884. [Google Scholar]
- Potenza, F.; Rinaldi, C.; Ottaviano, E.; Gattulli, V. A robotics and computer-aided procedure for defect evaluation in bridge inspection. J. Civ. Struct. Health Monit. 2020, 10, 471–484. [Google Scholar] [CrossRef]
- Shanthakumar, P.; Yu, K.; Singh, M.; Orevillo, J.; Bianchi, E.; Hebdon, M.; Tokekar, P. View Planning and Navigation Algorithms for Autonomous Bridge Inspection with UAVs. In Proceedings of the International Symposium on Experimental Robotics; Xiao, J., Kröger, T., Khatib, O., Eds.; Springer International Publishing: Cham, Switzerland, 2020; pp. 201–210. [Google Scholar]
- Araar, O.; Aouf, N. Visual Servoing of a Quadrotor UAV for Autonomous Power Lines Inspection. In Proceedings of the 22nd Mediterranean Conference on Control and Automation, Palermo, Italy, 16–19 June 2014; pp. 1418–1424. [Google Scholar]
- Cacace, J.; Orozco-Soto, S.M.; Suarez, A.; Caballero, A.; Orsag, M.; Bogdan, S.; Vasiljevic, G.; Ebeid, E.; Rodriguez, J.A.A.; Ollero, A. Safe Local Aerial Manipulation for the Installation of Devices on Power Lines: AERIAL-CORE First Year Results and Designs. Appl. Sci. 2021, 11, 6220. [Google Scholar] [CrossRef]
- Martinez, C.; Sampedro, C.; Chauhan, A.; Collumeau, J.F.; Campoy, P. The Power Line Inspection Software (PoLIS): A versatile system for automating power line inspection. Eng. Appl. Artif. Intell. 2018, 71, 293–314. [Google Scholar] [CrossRef]
- Stokkeland, M.; Klausen, K.; Johansen, T.A. Autonomous Visual Navigation of Unmanned Aerial Vehicle for Wind Turbine Inspection. In Proceedings of the 2015 International Conference on Unmanned Aircraft Systems (ICUAS), Denver, CO, USA, 9–12 June 2015; pp. 998–1007. [Google Scholar]
- Car, M.; Markovic, L.; Ivanovic, A.; Orsag, M.; Bogdan, S. Autonomous Wind-Turbine Blade Inspection Using LiDAR-Equipped Unmanned Aerial Vehicle. IEEE Access 2020, 8, 131380–131387. [Google Scholar] [CrossRef]
- Gohl, P.; Burri, M.; Omari, S.; Rehder, J.; Nikolic, J.; Achtelik, M.; Siegwart, R. Towards Autonomous Mine Inspection. In Proceedings of the 2014 3rd International Conference on Applied Robotics for the Power Industry, Foz do Iguacu, Brazil, 14–16 October 2014. [Google Scholar]
- Pahwa, R.S.; Chan, K.Y.; Bai, J.; Saputra, V.B.; Do, M.N.; Foong, S. Dense 3D Reconstruction for Visual Tunnel Inspection using Unmanned Aerial Vehicle. In Proceedings of the 2019 IEEE/RSJ International Conference on Intelligent Robots and Systems (IROS), Macau, China, 3–8 November 2019; pp. 7025–7032. [Google Scholar]
- Huerzeler, C.; Caprari, G.; Zwicker, E.; Marconi, L. Applying Aerial Robotics for Inspections of Power and Petrochemical Facilities. In Proceedings of the 2012 2nd International Conference on Applied Robotics for the Power Industry (CARPI), Zurich, Switzerland, 11–13 September 2012; pp. 167–172. [Google Scholar]
- Trujillo, M.; de Dios, J.M.; Martín, C.; Viguria, A.; Ollero, A. Novel Aerial Manipulator for Accurate and Robust Industrial NDT Contact Inspection: A New Tool for the Oil and Gas Inspection Industry. Sensors 2019, 19, 1305. [Google Scholar] [CrossRef] [PubMed] [Green Version]
- Ortiz, A.; Bonnin-Pascual, F.; Garcia-Fidalgo, E.; Company-Corcoles, J.P. Vision-Based Corrosion Detection Assisted by a Micro-Aerial Vehicle in a Vessel Inspection Application. Sensors 2016, 16, 2118. [Google Scholar] [CrossRef]
- Fang, Z.; Yang, S.; Jain, S.; Dubey, G.; Roth, S.; Maeta, S.; Nuske, S.; Zhang, Y.; Scherer, S. Robust Autonomous Flight in Constrained and Visually Degraded Shipboard Environments. J. Field Robot. 2017, 34, 25–52. [Google Scholar] [CrossRef]
- Bonnin-Pascual, F.; Ortiz, A. On the use of Robots and Vision Technologies for the Inspection of Vessels: A Survey on Recent Advances. Ocean Eng. 2019, 190, 106420. [Google Scholar] [CrossRef]
- Bachrach, A.; Prentice, S.; He, R.; Roy, N. RANGE-Robust Autonomous Navigation in GPS-denied Environments. J. Field Robot. 2011, 28, 644–666. [Google Scholar] [CrossRef]
- Dryanovski, I.; Valenti, R.; Xiao, J. An Open-source Navigation System for Micro Aerial Vehicles. Auton. Robot. 2013, 34, 177–188. [Google Scholar] [CrossRef]
- Beul, M.; Droeschel, D.; Nieuwenhuisen, M.; Quenzel, J.; Houben, S.; Behnke, S. Fast Autonomous Flight in Warehouses for Inventory Applications. IEEE Robot. Autom. Lett. 2018, 3, 3121–3128. [Google Scholar] [CrossRef] [Green Version]
- Perez-Grau, F.J.; de Dios, J.R.M.; Paneque, J.L.; Acevedo, J.J.; Torres-González, A.; Viguria, A.; Astorga, J.R.; Ollero, A. Introducing autonomous aerial robots in industrial manufacturing. J. Manuf. Syst. 2021, 60, 312–324. [Google Scholar] [CrossRef]
- Chowdhary, G.; Johnson, E.; Magree, D.; Wu, A.; Shein, A. GPS-denied Indoor and Outdoor Monocular Vision Aided Navigation and Control of Unmanned Aircraft. J. Field Robot. 2013, 30, 415–438. [Google Scholar] [CrossRef]
- Engel, J.; Sturm, J.; Cremers, D. Scale-Aware Navigation of a Low-Cost Quadrocopter with a Monocular Camera. Robot. Auton. Syst. 2014, 62, 1646–1656. [Google Scholar] [CrossRef] [Green Version]
- Fraundorfer, F.; Heng, L.; Honegger, D.; Lee, G.H.; Meier, L.; Tanskanen, P.; Pollefeys, M. Vision-based Autonomous Mapping and Exploration using a Quadrotor MAV. In Proceedings of the 2012 IEEE/RSJ International Conference on Intelligent Robots and Systems, Vilamoura-Algarve, Portugal, 7–12 October 2012; pp. 4557–4564. [Google Scholar]
- Shen, S.; Mulgaonkar, Y.; Michael, N.; Kumar, V. Vision-Based State Estimation and Trajectory Control Towards High-Speed Flight with a Quadrotor. In Proceedings of the Robotics: Science and Systems 2013, Berlin, Germany, 24–28 June 2013. [Google Scholar]
- Troiani, C.; Martinelli, A.; Laugier, C.; Scaramuzza, D. Low Computational-Complexity Algorithms for Vision-Aided Inertial Navigation of Micro Aerial Vehicles. Robot. Auton. Syst. 2015, 69, 80–97. [Google Scholar] [CrossRef] [Green Version]
- Galtarossa, L.; Navilli, L.F.; Chiaberge, M. Visual-Inertial Indoor Navigation Systems and Algorithms for UAV Inspection Vehicles. In Industrial Robotics; Grau, A., Wang, Z., Eds.; IntechOpen: Rijeka, Croatia, 2020; Chapter 9. [Google Scholar]
- Eich, M.; Bonnin-Pascual, F.; Garcia-Fidalgo, E.; Ortiz, A.; Bruzzone, G.; Koveos, Y.; Kirchner, F. A Robot Application to Marine Vessel Inspection. J. Field Robot. 2014, 31, 319–341. [Google Scholar] [CrossRef]
- Bonnin-Pascual, F.; Ortiz, A.; Garcia-Fidalgo, E.; Company-Corcoles, J.P. A reconfigurable framework to turn a MAV into an effective tool for vessel inspection. Robot. CIM-Int. Manuf. 2019, 56, 191–211. [Google Scholar] [CrossRef]
- Garcia-Fidalgo, E.; Bonnin-Pascual, F.; Company-Corcoles, J.P.; Ortiz, A. Evaluation of a Skill-based Control Architecture for a Visual Inspection-oriented Aerial Platform. In Proceedings of the Workshop on Robot-Based Inspection Systems and Post-Processing Tools (IEEE ETFA), Vienna, Austria, 8 September 2020. [Google Scholar]
- Bonnin-Pascual, F.; Ortiz, A. UWB-Based Self-Localization Strategies: A Novel ICP-Based Method and a Comparative Assessment for Noisy-Ranges-Prone Environments. Sensors 2020, 20, 5613. [Google Scholar] [CrossRef] [PubMed]
- Eyres, D.; Bruce, G. (Eds.) Ship Construction, 7th ed.; Butterworth-Heinemann: Oxford, UK, 2012. [Google Scholar]
- Moore, T.; Stouch, D. A Generalized Extended Kalman Filter Implementation for the Robot Operating System. In Intelligent Autonomous Systems 13; Springer International Publishing: Cham, Switzerland, 2016; Available online: http://docs.ros.org/melodic/api/robot_localization/html/index.html (accessed on 27 August 2021).
- Arkin, R.C. Behavior-Based Robotics; MIT Press: Cambridge, MA, USA, 1998. [Google Scholar]
- Grisetti, G.; Stachniss, C.; Burgard, W. Improved Techniques for Grid Mapping with Rao-Blackwellized Particle Filters. IEEE Trans. Robot. 2007, 23, 34–46. [Google Scholar] [CrossRef] [Green Version]
Figure 1.
Access means to be arranged for close-up inspection in typical cargo holds: cherry pickers, scaffolding, portable ladders, etc.
Figure 1.
Access means to be arranged for close-up inspection in typical cargo holds: cherry pickers, scaffolding, portable ladders, etc.
Figure 2.
Overview of the visual inspection system as designed around SA.
Figure 3.
View of the aerial platform with main components highlighted: laser scanner, range finders to measure distance to bottom and to the ceiling, an imaging system with two cameras and LED-based illumination, UWB receiver and an embedded PC. Main specifications are given in the bottom table.
Figure 3.
View of the aerial platform with main components highlighted: laser scanner, range finders to measure distance to bottom and to the ceiling, an imaging system with two cameras and LED-based illumination, UWB receiver and an embedded PC. Main specifications are given in the bottom table.

Figure 4.
Control software of the aerial robot shown as a layered architecture.
Figure 5.
Detailed view of the control architecture of the aerial platform.
Figure 6.
Full state estimator module.
Figure 7.
Behaviour-based architecture: (A) groups behaviours to accomplish the user intention, (B) groups behaviours that ensure the platform safety within the environment, (C) groups behaviours that increase the autonomy level, and (D) groups behaviours oriented to check flight viability. Behaviour combination mechanisms are highlighted with red arrows. The formulation of the behaviours adopting a potential fields approach is at the bottom table. On-board obstacle detection sensors supply the distances to surrounding obstacles.

Figure 8.
Ground Control Unit (MUSSOL Nest).

Figure 9.
Performance of the behaviours related with collision avoidance.
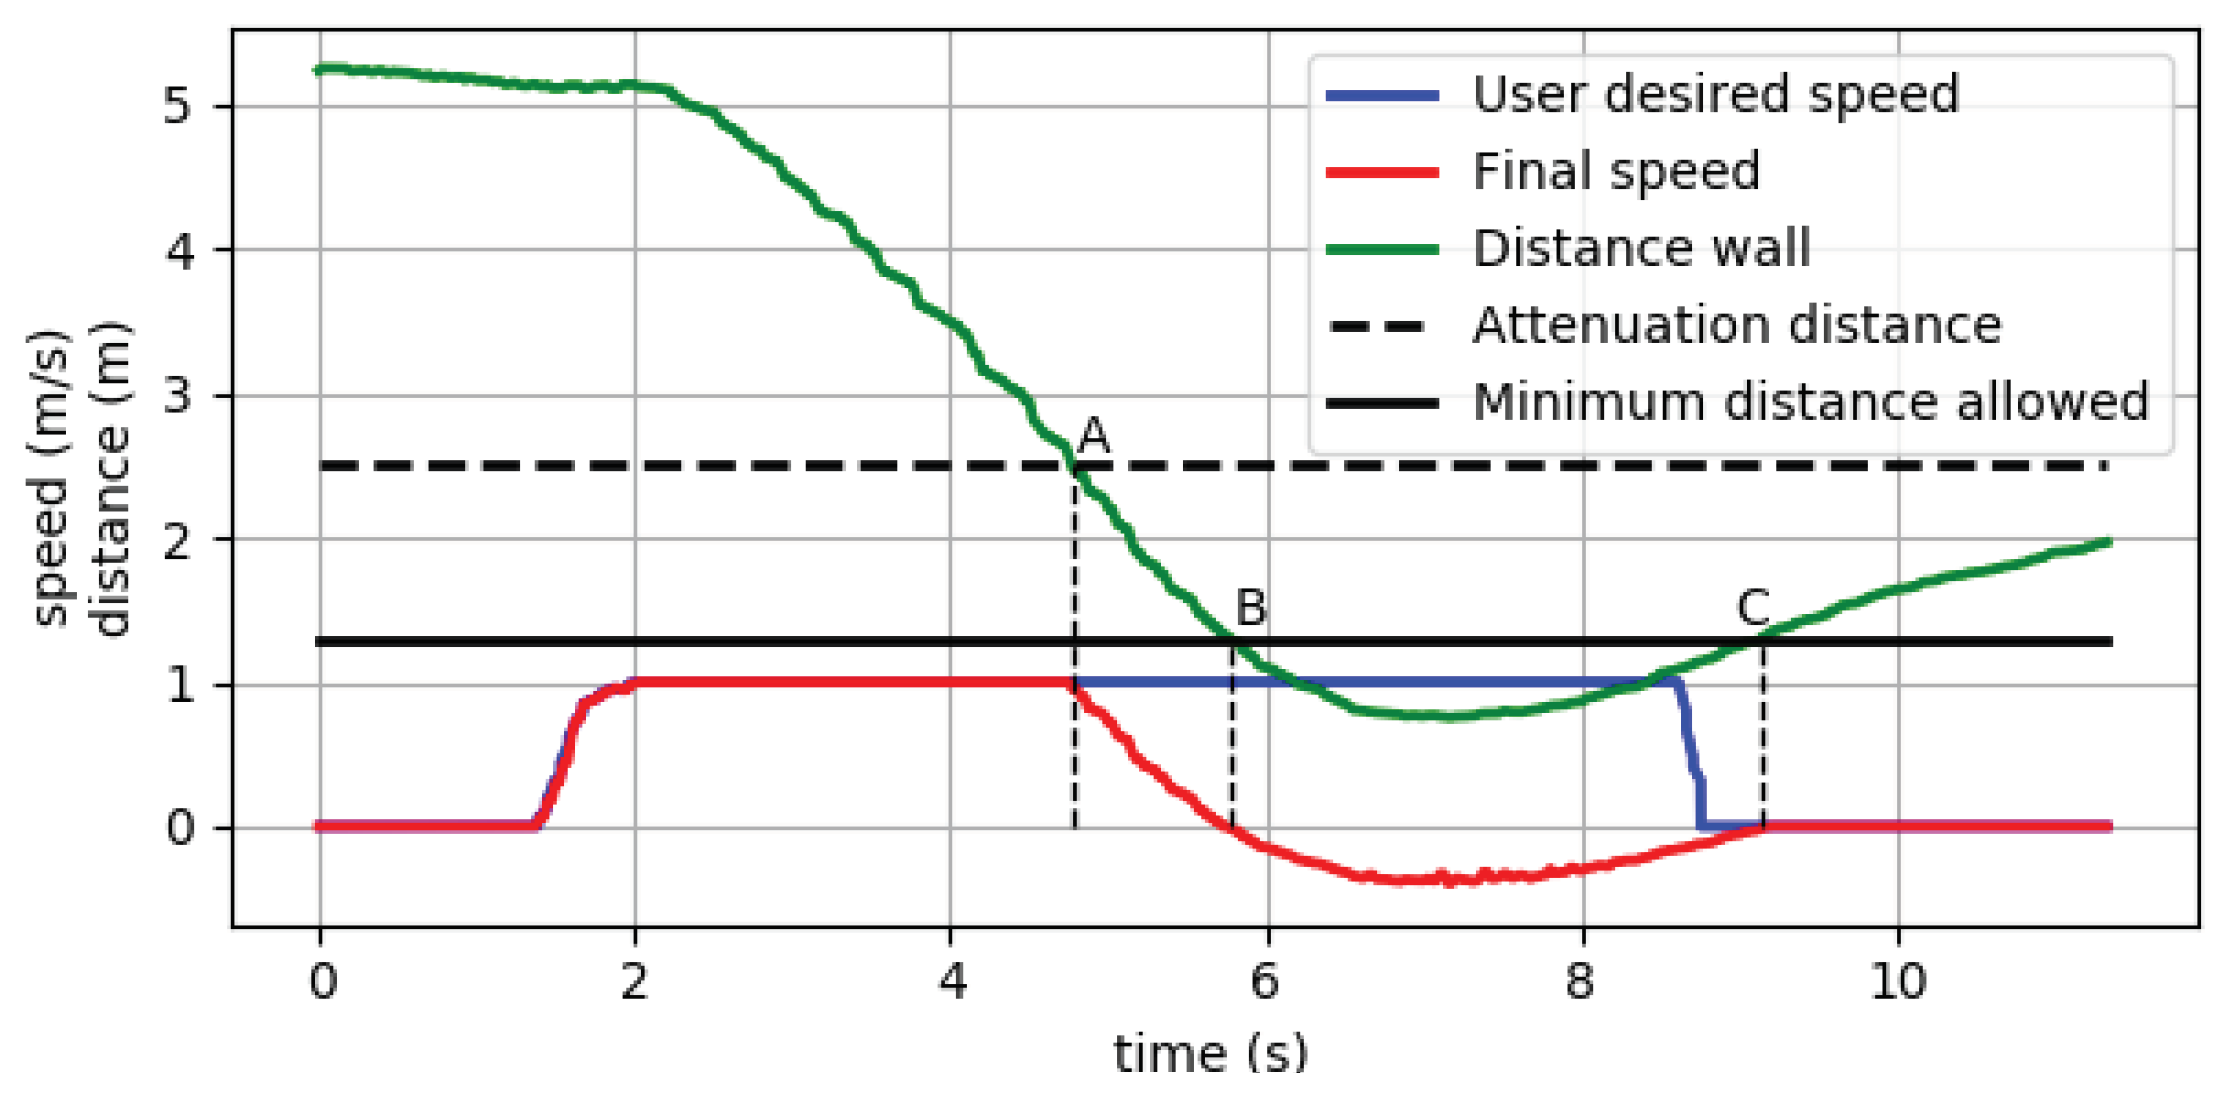
Figure 10.
Tele-operated flight following a rectangle-like path at constant altitude: (left) estimated and true paths, (middle) 2D projection of the trajectory, (right) position estimation error. (All values are in meters.).
Figure 10.
Tele-operated flight following a rectangle-like path at constant altitude: (left) estimated and true paths, (middle) 2D projection of the trajectory, (right) position estimation error. (All values are in meters.).

Figure 11.
1-minute hovering flight: (a) estimated and true paths, (b) position estimation error, (c) distances to the consigned position, (d) PDFs of the differences with the consigned position for each axis separately. (All values are in meters.).
Figure 11.
1-minute hovering flight: (a) estimated and true paths, (b) position estimation error, (c) distances to the consigned position, (d) PDFs of the differences with the consigned position for each axis separately. (All values are in meters.).

Figure 12.
Keep-position experiment: (left) estimated and true paths, (middle) position estimation error, (right) distance to the return position. (All units are in meters.).
Figure 12.
Keep-position experiment: (left) estimated and true paths, (middle) position estimation error, (right) distance to the return position. (All units are in meters.).
Figure 13.
Way-point visitation experiment: (left) estimated and true paths, (middle) 2D projection of the trajectory, (right) position estimation error. In the plots, × in the center of a blue sphere denotes a way-point. (All units are in meters.).
Figure 13.
Way-point visitation experiment: (left) estimated and true paths, (middle) 2D projection of the trajectory, (right) position estimation error. In the plots, × in the center of a blue sphere denotes a way-point. (All units are in meters.).

Figure 14.
Autonomous sweeping: (left) estimated and true paths, (middle) 2D projection of the resulting path, (right) position estimation error. In the plots, × in the center of a blue sphere denotes a way-point. (All values are in meters.).
Figure 14.
Autonomous sweeping: (left) estimated and true paths, (middle) 2D projection of the resulting path, (right) position estimation error. In the plots, × in the center of a blue sphere denotes a way-point. (All values are in meters.).
Figure 15.
Autonomous vertical inspection: (left) estimated and true paths, (middle) 2D projection of the trajectory, (right) position estimation error. In the plots, × in the center of a blue sphere denotes a way-point. (All units are in meters.).
Figure 15.
Autonomous vertical inspection: (left) estimated and true paths, (middle) 2D projection of the trajectory, (right) position estimation error. In the plots, × in the center of a blue sphere denotes a way-point. (All units are in meters.).
Figure 16.
Experiments in a space whose size is similar to a cargo hold: (a) estimated path and (b) position estimation error for a 1-minute hovering flight; (c) estimated path and (d) distance to return position for a keep position experiment; (e) perspective and 2D projection of estimated path for a way-point visitation experiment, (f) for a sweeping flight and (g) for a vertical inspection flight. In the plots, × in the center of a blue sphere denotes a way-point. (All units are in meters.).

Figure 17.
Autonomous sweepings of 10 × 6 m (top) and 15 × 4 m (bottom), descending 1 m between transects. In the plots, × in the center of a blue sphere denotes a way-point. (All units are in meters.).
Figure 17.
Autonomous sweepings of 10 × 6 m (top) and 15 × 4 m (bottom), descending 1 m between transects. In the plots, × in the center of a blue sphere denotes a way-point. (All units are in meters.).
Figure 18.
(left) Sweeping operation (blue path) followed by way-point re-visitation (red path). (right) Occupancy grid to show the coverage achieved. (All units are in meters.).
Figure 18.
(left) Sweeping operation (blue path) followed by way-point re-visitation (red path). (right) Occupancy grid to show the coverage achieved. (All units are in meters.).
Figure 19.
Two sweeping operations in a row: (top) estimated paths of the first sweeping (blue) and the second sweeping (red), perspective and 2D projected views are shown; (bottom) occupancy grid to show the coverage achieved. (All units are in meters.).
Figure 19.
Two sweeping operations in a row: (top) estimated paths of the first sweeping (blue) and the second sweeping (red), perspective and 2D projected views are shown; (bottom) occupancy grid to show the coverage achieved. (All units are in meters.).
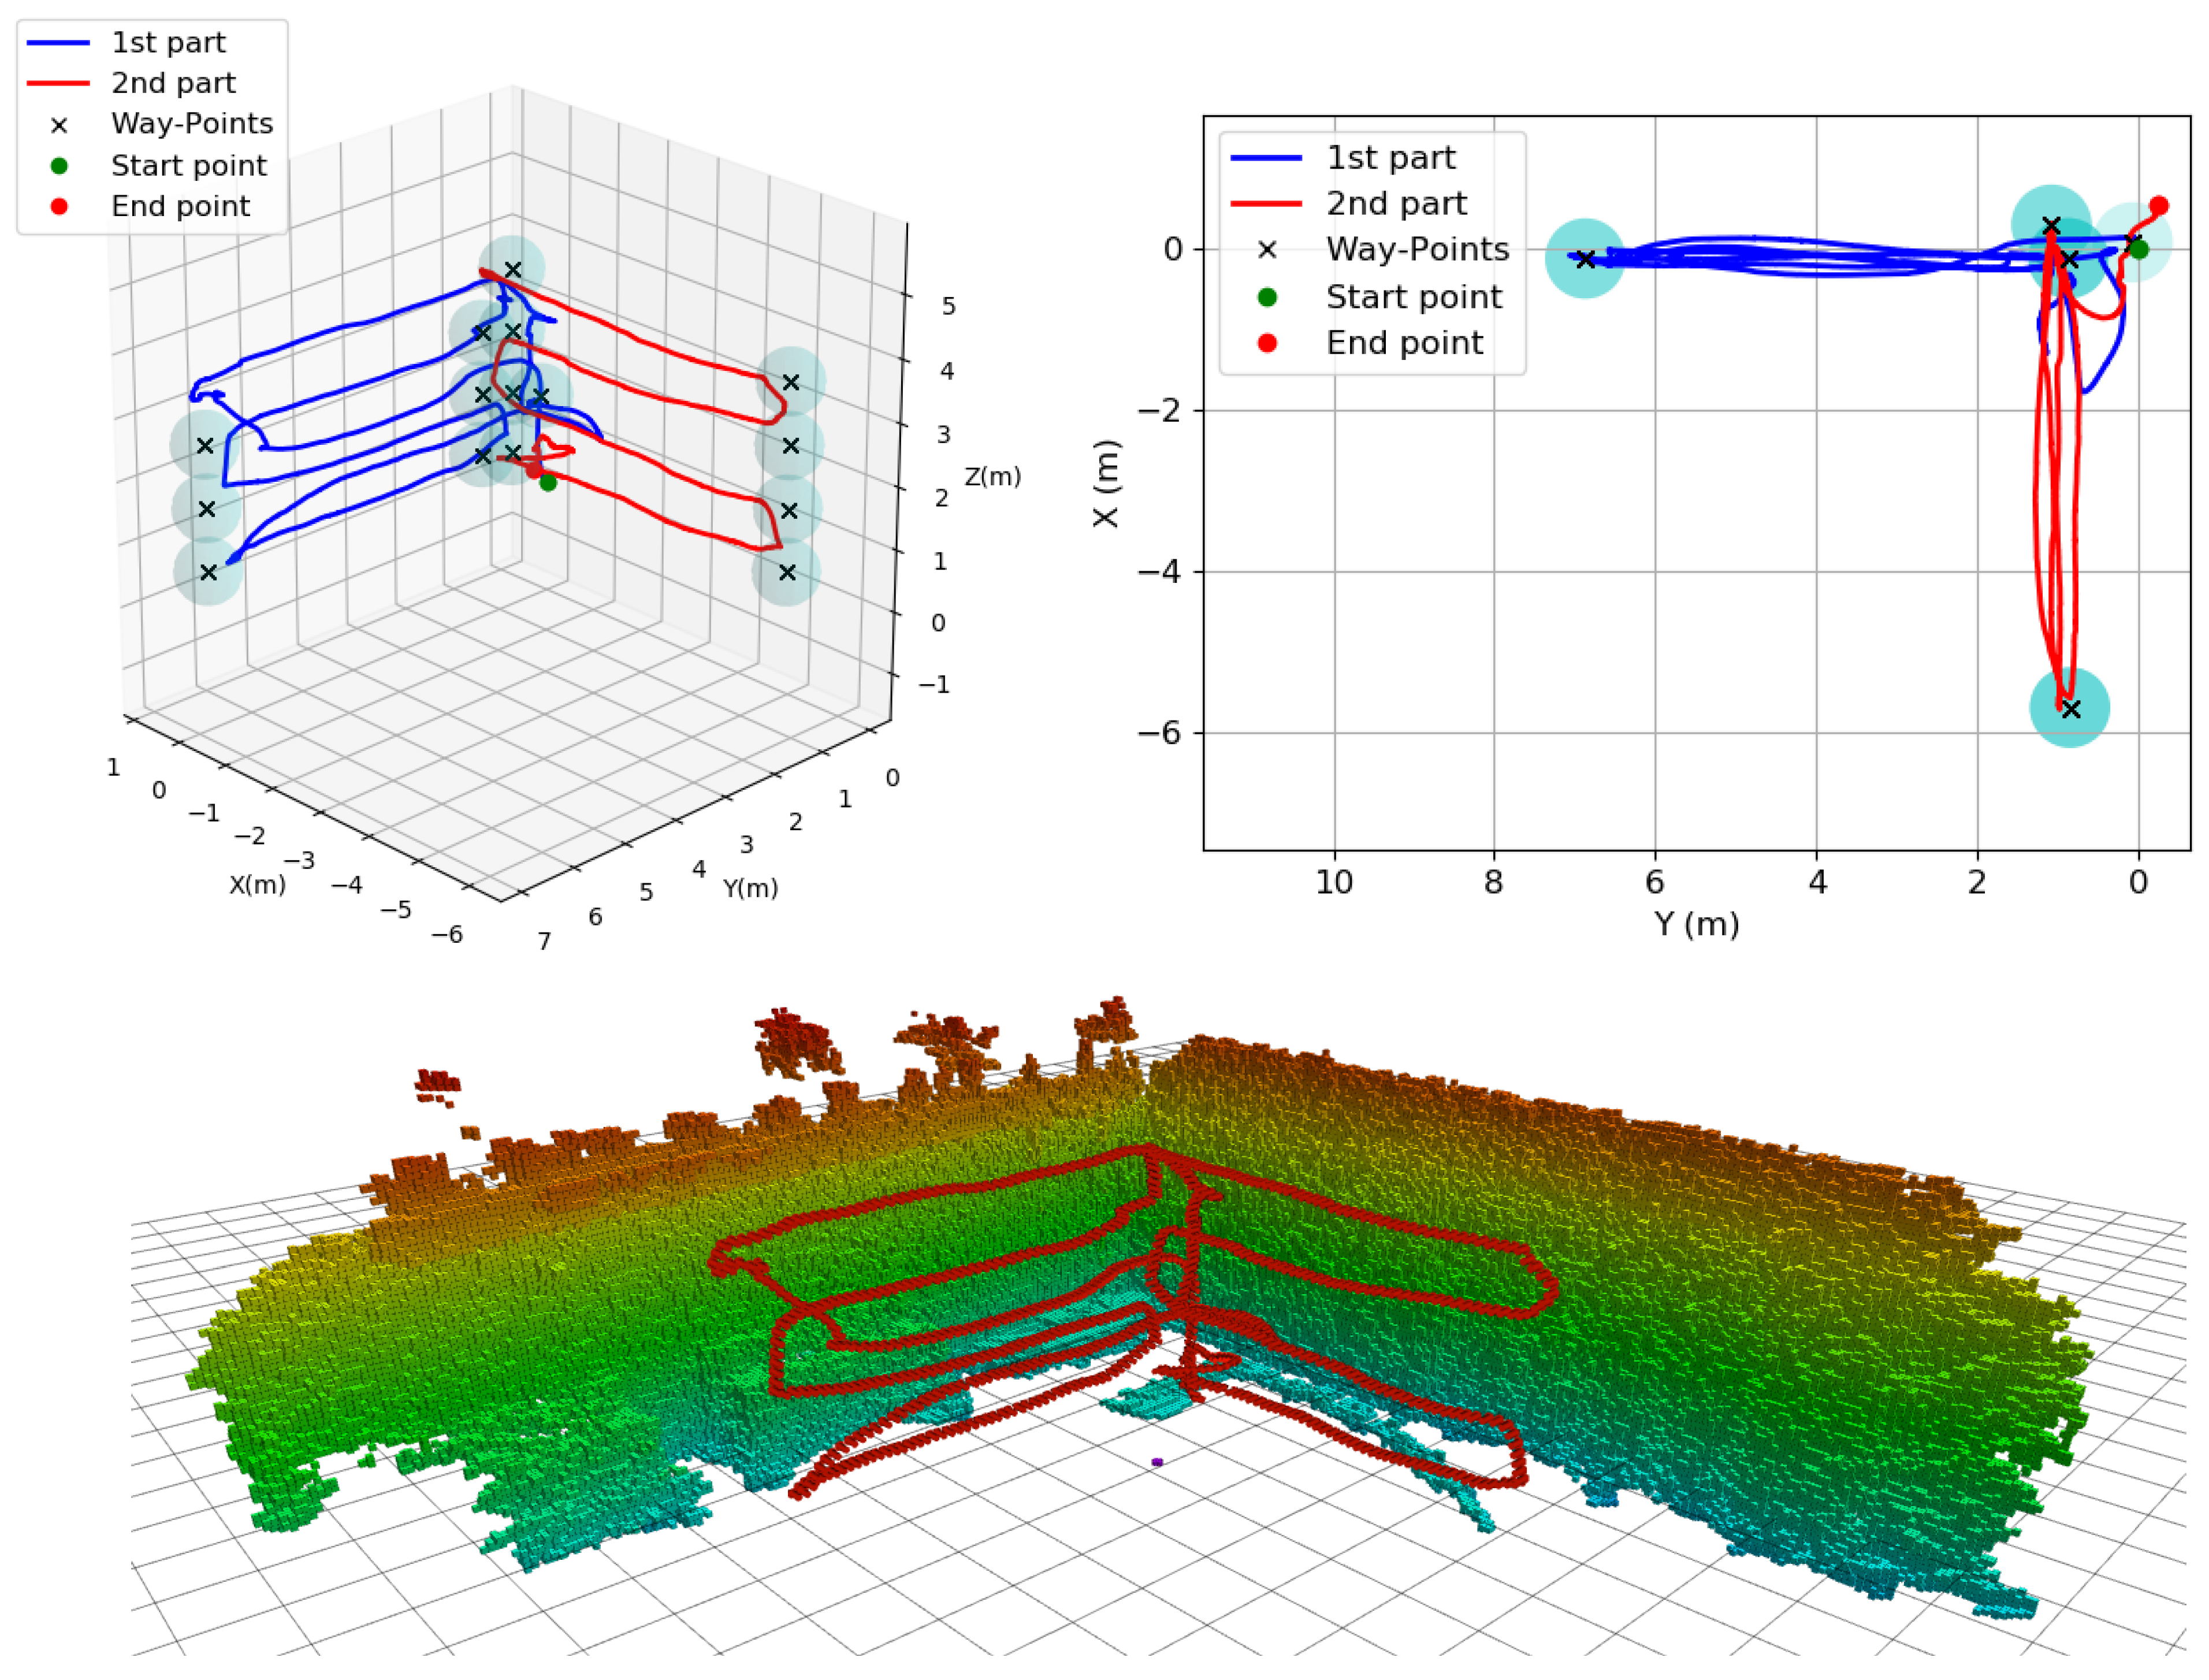
Figure 20.
Pictures from field trials on-board a bulk carrier, with MUSSOL flying under normal and low-light conditions. In the rightmost and lowermost pictures, we highlight the robot during flight.
Figure 20.
Pictures from field trials on-board a bulk carrier, with MUSSOL flying under normal and low-light conditions. In the rightmost and lowermost pictures, we highlight the robot during flight.

Figure 21.
Estimated paths for different flights performed on-board a bulk carrier. In the plots, × in the center of a blue sphere denotes a way-point.
Figure 21.
Estimated paths for different flights performed on-board a bulk carrier. In the plots, × in the center of a blue sphere denotes a way-point.

Publisher’s Note: MDPI stays neutral with regard to jurisdictional claims in published maps and institutional affiliations. |
© 2021 by the authors. Licensee MDPI, Basel, Switzerland. This article is an open access article distributed under the terms and conditions of the Creative Commons Attribution (CC BY) license (https://creativecommons.org/licenses/by/4.0/).
Share and Cite
MDPI and ACS Style
Bonnin-Pascual, F.; Garcia-Fidalgo, E.; Company-Corcoles, J.P.; Ortiz, A. MUSSOL: A Micro-Uas to Survey Ship Cargo hOLds. Remote Sens. 2021, 13, 3419. https://doi.org/10.3390/rs13173419
AMA Style
Bonnin-Pascual F, Garcia-Fidalgo E, Company-Corcoles JP, Ortiz A. MUSSOL: A Micro-Uas to Survey Ship Cargo hOLds. Remote Sensing. 2021; 13(17):3419. https://doi.org/10.3390/rs13173419
Chicago/Turabian StyleBonnin-Pascual, Francisco, Emilio Garcia-Fidalgo, Joan P. Company-Corcoles, and Alberto Ortiz. 2021. "MUSSOL: A Micro-Uas to Survey Ship Cargo hOLds" Remote Sensing 13, no. 17: 3419. https://doi.org/10.3390/rs13173419
Note that from the first issue of 2016, this journal uses article numbers instead of page numbers. See further details here.