
Sea Surface Salinity and Wind Speed Retrievals Using GNSS-R and L-Band Microwave Radiometry Data from FMPL-2 Onboard the FSSCat Mission


CommSensLab—UPC, Universitat Politècnica de Catalunya—BarcelonaTech, and IEEC/CTE-UPC, 08034 Barcelona, Spain
*
Author to whom correspondence should be addressed.
Remote Sens. 2021, 13(16), 3224; https://doi.org/10.3390/rs13163224
Submission received: 13 July 2021
/
Revised: 11 August 2021
/
Accepted: 12 August 2021
/
Published: 13 August 2021
(This article belongs to the Special Issue Applications of GNSS Reflectometry for Earth Observation II)
Abstract
:The Federated Satellite System mission (FSSCat), winner of the 2017 Copernicus Masters Competition and the first ESA third-party mission based on CubeSats, aimed to provide coarse-resolution soil moisture estimations and sea ice concentration maps by means of the passive microwave measurements collected by the Flexible Microwave Payload-2 (FMPL-2). The mission was successfully launched on 3 September 2020. In addition to the primary scientific objectives, FMPL-2 data are used in this study to estimate sea surface salinity (SSS), correcting for the sea surface roughness using a wind speed estimate from the L-band microwave radiometer and GNSS-R data themselves. FMPL-2 was executed over the Arctic and Antarctic oceans on a weekly schedule. Different artificial neural network algorithms have been implemented, combining FMPL-2 data with the sea surface temperature, showing a root-mean-square error (RMSE) down to 1.68 m/s in the case of the wind speed (WS) retrieval algorithms, and RMSE down to 0.43 psu for the sea surface salinity algorithm in one single pass.
1. Introduction
In 1992, the United Nations (UN) established the Global Climate Observing System (GCOS) and defined the different Essential Climate Variables (ECV) [1] that need to be monitored for a better understanding of our climate and the effects of climate change [2,3]. Moreover, in 2015, seventeen Sustainable Development Goals (SDG) were defined to ensure sustainable human progress, reducing our footprint on planet Earth. SDG number thirteen entails taking urgent actions to combat climate change and its impacts on the planet, which requires the monitoring of these ECVs.
The loss of sea ice volume in the poles [4] may threaten the thermohaline circulation (Figure 1a) [5] and the way in which oceans moderate the Earth’s temperature. One of the main drivers of the thermohaline circulation are the salinity changes in the oceans, which, together with surface temperature, determine the water density. The melting of the polar caps increases the amount of freshwater discharged into the oceans, which may change the warm shallow ocean currents and the cold and salty deep currents that moderate the Earth’s climate [6]. As shown in Figure 1b, the SSS has varied in recent years, most notably over polar regions.
Ocean salinity is one of these critical ECVs that can be monitored using remote sensing techniques on board satellites. The first spaceborne mission to monitor the ocean salinity was the Soil Moisture and Ocean Salinity Mission (SMOS) mission from the European Space Agency (ESA), which was launched on 2 November 2009. As a secondary product, it also provided sea ice thickness maps over the North Pole. Traditional Earth Observation (EO) missions such as SMOS typically include a micro- or mini-satellite carrying onboard a single instrument, providing moderate-to-long revisit times, with high accuracy. However, in the last few years, the use of small satellites for EO has become a reality, and large constellations can be deployed, drastically reducing the revisit time and providing new types of products. Some examples are NASA’s Cyclone Global Navigation Satellite System (CyGNSS) mission of Global Navigation Satellite System—Reflectometry (GNSS-R) payloads [8], or the U.S. company Spire Global, Inc. constellation with GNSS-Radio Occultation (GNSS-RO) payloads [9]. U.S. company Planet Labs, Inc. has also an operational CubeSat-based constellation including Visual and Near Infrared (VNIR) multi-spectral imagers [10]. More recently, the FSSCat mission [11] was launched, as a proof-of-concept mission with two 6-unit federated CubeSats including passive microwave (L-band microwave radiometer and GNSS-R) and VNIR + Thermal Infrared hyper-spectral imagery payloads.
In principle, thanks to the use of small satellites, a larger amount of data can be collected. This large amount of data and the use of machine learning algorithms are changing the way EO is conducted [10,12]. New EO missions, mostly the ones based on small satellites, are using machine learning algorithms to retrieve geophysical parameters, to generate new observables, or to calibrate EO products [13,14]. Moreover, small satellites allow us to rapidly design and deploy novel technologies and payloads, such as the Flexible Microwave Payload -2 (FMPL-2) part of the FSSCat mission [15], developed in less than 1.5 years and successfully launched into orbit on 3 September 2020 [16]. As planned, the mission was operated for 3 months until 4 December 2020. Then, a solar coronal mass ejection harmed irreversibly the payload memory.
FMPL-2 is a dual passive microwave instrument, comprising a Global Navigation Satellite System—Reflectometer (GNSS-R), and an L-band radiometer [15]. The instrument aimed at providing coarse soil moisture over land, and sea ice concentration/extension and thickness maps over the poles. Data collected from 1 October 2020 to 4 December 2020 have been used in this study to validate the capability of FMPL-2 to retrieve sea ice concentration and extension [17], sea ice thickness [18], and soil moisture [19]. One of the key aspects of FMPL-2 algorithms is the use of machine learning techniques and, in particular, Artificial Neural Networks (ANN) to retrieve these ECVs. Moreover, as presented in [17,19], the use of combined GNSS-R and L-band MWR measurements as input features of an ANN algorithm provides the best sea ice and soil moisture estimates.
In this study, a similar methodology is now applied for ocean monitoring to retrieve SSS and wind speed (WS) over the ocean using FMPL-2 data. The manuscript is organized as follows: Section 1 introduces the problem, Section 2 presents a literature review of SSS and WS retrieval using L-band measurements, Section 3 presents the FMPL-2 data and data from other sources used to train and validate the different ANN algorithms to retrieve SSS and WS, Section 4 presents the results of the different algorithms implemented, and their comparison with respect to the target ground truth, Section 5 includes some discussions and prospects for future ocean monitoring missions, and, finally, Section 6 summarizes the main results of this work.
2. Review of the State of the Art
L-band radiometers, as in ESA SMOS or NASA AQUARIUS missions, have provided global SSS maps. In both cases, a radiative-transfer model is implemented to estimate the SSS from the brightness temperature measurements. As detailed in [20,21], the emissivity of the ocean surface depends on the SSS, the sea surface temperature (SST), and the ocean surface roughness, which is mostly linked to the WS over the ocean (typically measured at 10 m height: U10). As developed in Section 4.3.4 of [22], and reproduced below for the readers’ convenience, at a given frequency (f) and polarization (p), both the reflectivity () and the emissivity (e) of the “flat” ocean surface (i.e., without roughness) are affected by the , the , the incidence angle () through , the dielectric constant of the sea water:
The WS changes the effective roughness of the ocean surfaces. For an L-band radiometer, this is translated into a change in the brightness temperature, as detailed in Figure 6 and Equations (4)–(6) of [23]. For reflectivity measurements (e.g., as provided by a GNSS-R instrument), this is translated into a lower reflectivity.
The use of reflectivity measurements collected by a GNSS-R instrument to better estimate the surface roughness (i.e., wind speed or other proxies) and infer a better-quality SSS product was first proposed in 2003 by Prof. Camps, who was granted an EURY Award in 2004 to develop the PAU instrument [24], a combined L-band microwave radiometer and GNSS-Reflectometer. Even a flight model was built [25], but unfortunately the mission was canceled and it never flew. The same idea was then studied in [26,27,28], but data were never presented to provide this enhanced product.
Moreover, the GNSS-R technique has been proven to retrieve wind speed products, both for the UK TechDemoSat-1 [29] and the CyGNSS mission [30,31]. Several algorithms have been used to estimate WS from GNSS-R data, by looking at the Delay-Doppler Map (DDM) dispersion (as illustrated in Figure 2), computing the normalized bi-static radar cross-section, by looking to the leading edge slope of the waveform, or to other metrics, such as the Delay-Doppler Map average or variance, as shown in [32].
WS can also be retrieved from the GNSS-R reflectivity (which is similar to the metrics used in the Delay-Doppler Map Average (DDMA) method in [32]) and the SNR drop due to the increased ocean surface roughness, which will be largely degraded for larger wind speeds (Figure 2) where the SNR goes from 3.8 dB for a very windy situation up to 20.68 dB for calm ocean. In addition, recent studies have shown the potential of using the standard deviation of the land reflectivity (), as a proxy to correct the land surface roughness [19,34]. Moreover, the combined GNSS-R and L-band radiometry data (complementary measurements) have shown their potential over land to improve the quality of the surface roughness corrections, allowing the retrieval of a better-quality soil moisture product [19].
In this manuscript, GNSS-R and MWR data from FMPL-2, a CubeSat-based instrument that simultaneously generates GNSS-R and MWR data, are used to retrieve WS and SSS information. Both measurements are combined with different ANN topologies to correct for the surface roughness effects, retrieving an enhanced EO product from a CubeSat platform.
In the following sections, the same methodology is explored to retrieve SSS and WS over the ocean.
3. Methodology and Data Description
ANNs have demonstrated their capabilities for EO, capturing relationships that were not evident. As an example, the CyGNSS mission is using these types of networks to retrieve a soil moisture product [35,36,37]; the SMOS near-real-time soil moisture product is also being implemented through an ANN algorithm [38]. To evaluate the capabilities of FMPL-2 to retrieve SSS and WS over the ocean, several ANNs are implemented and evaluated. In this process, the following products are used:
The ground-truth data used in this manuscript are the ERA-5 WS (Figure 3a) data and the SSS from SMOS (Figure 3b). ERA-5 data are retrieved every three hours, and the ERA-5 points selected as ground truth are those with the shortest temporal distance to the FMPL-2 measurement. In the case of the SSS ground truth, due to the lower dynamics of this variable, measurements falling 24 h apart are considered.
The data collected by FMPL-2 are presented in Figure 4. The data have been filtered out using the ERA-5 sea ice extent product [41] to include only points falling in open ocean. It is important to remark that, because of the large antenna footprint (350 × 500 km2), and the re-gridding of the radiometric data into a 12.5 km EASE Grid 2.0 mesh, the number of points retrieved by the L-band radiometer is significantly larger (×150) than the ones retrieved by the GNSS-R instrument. However, the resolution of the GNSS-R instrument is much better (∼600 m) [44,45] than that of the L-band radiometer. Furthermore, the GNSS-R observable used here is the reflectivity, computed as in Equation (19) from [15]. FMPL-2 collects both the direct and the reflected signals, minimizing the effects of changes in the transmitted power of the GPS constellation, and it uses short incoherent integration times (40 ms), which minimizes the blurring of the GNSS-R waveform, maximizing the spatial resolution of the GNSS-R reflection [46].
3.1. Product Description
Due to the difference in the number of points, two types of products are presented: for those cases using only L-band radiometry data, the entire set of points from Figure 4a is used. Note that brightness temperature data from FMPL-2 have been filtered out using an upper threshold to remove potential sea ice or land contamination. In this regard, brightness temperature values higher than 135 K are discarded from this study. Regarding the products using GNSS-R data only, or in combination with L-band radiometry data, the points presented in Figure 4b will be used.
To validate the capabilities of ANNs to combine data fusion between SST, GNSS-R, and L-band MWR data to retrieve WS and SSS, different algorithms are proposed, and they are detailed in Table 1 and Table 2 for WS and SSS, respectively. Note that a validation set has been also selected for WS and SSS retrieval not using any FMPL-2 data but only WS and SST, and then the same model using FMPL-2, in order to prove that the output algorithm performs better when FMPL-2 data are included.
It is important to remark that the models using GNSS-R data are using the same input features as presented in [19], where the reflectivity, , is used in combination with the standard deviation of the reflectivity computed in a certain time window (movstd()), and the local incidence angle () as a proxy to correct for the surface roughness effects [34]. To analyze the impact of adding this input feature, two networks are implemented, one without using the movstd() and another one using the movstd() for both WS and SSS algorithms. Note that the local incidence angles of the 50% of the reflections are from an elevation angle of 40º to 60º, and 75% comprise an elevation angle between 35º and 65º.
3.2. Initial Evaluation: Correlation Matrix
Figure 5 presents the correlation coefficient matrix between the different input features and the target outputs. To compute this matrix, the gridded data have been 2D linearly interpolated over the specular reflection points (i.e., the points shown in Figure 4b, using a 2D nearest neighbor algorithm with linear interpolation). As expected, there is a positive, but small correlation between the WS, the SST, and the SSS products. Furthermore, the GNSS-R data present almost 0 correlation with the SST, but a negative correlation (∼−0.25) with the WS, and the SSS data. In this case, a slightly larger correlation between the movstd() and the WS product (∼−0.3) is also noticeable, due to the fact that the movstd() can act as a proxy of the ocean surface roughness, caused by the WS or any other sources, such as swell, etc. Finally, the L-band MWR data also show a small correlation with the WS, the SST, and the SSS, but the largest correlation corresponds to the SST, which is the main driver of brightness temperature changes, as shown in [22].
3.3. ANN Topology and Training Methodology
As presented in Figure 6, all the ANNs implemented in this work follow the same training and validation scheme. To prevent any kind of over-fitting, the training algorithm is the Bayesian regularization back-propagation algorithm from MATLAB®, based on a Levenberg–Marquardt algorithm, but in general, providing a network that generalizes better than the Levenberg–Marquardt algorithm itself (i.e., it prevents over-fitting) [47]. The Bayesian regularization back-propagation algorithm uses the Bayes theorem to regularize the neural network [48]. The inverse probability law from this theorem is used to re-compute the weights in the neural network, as described in [48]. One of the most remarkable features of this algorithm is that it is difficult to over-train the network (i.e., to over-fit on the data set), as the training algorithm automatically eliminates neuron weights with values very close to zero. The weights and biases of the Bayesian regularization algorithm are obtained by means of the Levenberg–Marquardt optimization, which is a damped version of the least-squares algorithm to solve non-linear problems. In this regard, the algorithm minimizes the root mean square error between the expected value (i.e., the output or the ground truth data) and the output of the neural network.
Furthermore, the data are trained using 20% of the available points, which is a typical training set size used in other ANN-based algorithms using GNSS-R data [49,50] and the size of the ANN topology is fixed to two hidden layers and 25 neurons per layer for the L-band radiometry cases (the two first cases), and 8 neurons per layer for the GNSS-R cases (the other four cases). The input and output layers are using the min/max normalization (i.e., the minimum value of a given feature is set to −1 and the maximum to 1), and the neurons are implementing the sigmoid function. The training epoch (i.e., maximum number of iterations) is set to 200 for the products only including L-band radiometry data, and 100 for those including GNSS-R points. However, the training process stops earlier following the Bayesian Regularization algorithm, which, after every epoch, computes validation checks against 15% of the training set. In the MWR cases, this maximum epoch is never reached, and all networks presented are trained with 140–160 epochs. In the GNSS-R cases, the maximum epoch of 100 is always reached. Finally, all networks are also pruned after training [51].
Note that, to provide a generalized network, data from both the northern and southern hemispheres have been included in the training process; by means of this strategy, the trained network is able to generalize for both hemispheres.
4. Results
This section presents the outputs of the previous ANN models, first for the WS product and then for the SSS salinity product.
4.1. Wind Speed Results
4.1.1. Using L-Band Radiometry Data Only
Figure 7 presents the results of the first two ANNs for WS retrieval over the FMPL-2 antenna footprint. The validation network using SST and SSS only shows a low correlation coefficient, and also a “strange” scatter plot shape. In this case, the ANN “tries” to infer WS data from both measurements, but it cannot perform well, as MWR is missing as an input feature (as expected from Figure 6 of [23]). In the second case, when the L-band data from FMPL-2 are added to the SST and the SSS data, the correlation coefficient increases to 0.46, and the root mean square error (RMSE) is 3.66 m/s. However, there is still a large dispersion in the scatter-density plot, notably for wind speeds between 5 and 12 m/s. Despite the better correlation coefficient, the output of this model is still providing marginal results.
As presented in Figure 8, most of the errors are concentrated over the regions that are close to the sea ice, where the wind speed is lower, and where, due to the coarse antenna footprint (350 × 500 km2), mixed pixel effects prevent the model from retrieving the WS. It is important to remark that similar performances for low wind speeds have been presented for the SMAP and the SMOS missions. For the first one, the SMAP radiometer performs better for wind speeds above 15 m/s (notably better for wind speeds in the range of 40 m/s and above), as shown in [52]. For the SMOS case, WS retrieval errors (i.e., RMSE) range from 2.6 m/s for WS below 15 m/s down to 2 m/s for winds above 35 m/s [53]. In the FMPL-2 case, because of the region of observation, such large winds cannot be found; the region below 12–15 m/s presents the largest errors, whereas for wind speeds larger than 15 m/s, the scatter-density plot in Figure 7 shows a smaller dispersion.
4.1.2. Using GNSS-R Data Combined with the L-Band Radiometry Data
For low wind speeds, GNSS-R performs better than the L-band MWR. In this case, where the MWR fails to recover, the GNSS-R performs better, and vice versa. Figure 9 presents the results of different ANNs applied to the GNSS-R data from FMPL-2. Figure 9a presents the case when only GNSS-R data are used, without the movstd() magnitude. Here, the linearity is slightly better than in the L-band MWR case, but the RMSE is quite large ∼2.65 m/s. In this case, points falling within the 5–10 m/s range also present a larger dispersion. When the movstd() is added, the algorithm shows a slight improvement of 0.05 m/s, with a slightly better linearity as in the case of not using it.
The third approach merges GNSS-R and L-band MWR data, and the output is significantly better, showing a correlation coefficient between the ground truth and the ANN output of 0.84, and an RMSE of 2.05 m/s. Here, the use of combined MWR (i.e., emissivity) and GNSS-R data (i.e., reflectivity) within the neural network is able to compensate for the surface roughness effects and retrieve a better WS product.
Finally, the fourth ANN model presents the combination of the GNSS-R and the L-band MWR data with the SST and the SSS data, which also present some correlation with the WS, as shown in Figure 5. In this case, the correlation coefficient increases up to 0.89, and the RMSE is reduced down to 1.68 m/s. The map showing the results of this ANN is presented in Figure 10. As can be seen, most wind speed errors are smaller than 2–3 m/s (i.e., 10% of the measurement range).
In order to validate the performance of this last network, the daily ASCAT MeteOp product at a 25 km resolution has been used as a validation data set [43]. Note that the correlation coefficient between the ERA-5 and the ASCAT product for the selected time span (1 October 2020 to 30 November 2020) is 0.75, and the RMSE is 2.60 m/s, which is consistent with other studies [54]. Figure 11 shows the density-scatter plot between the ASCAT WS product and the ANN output that combines the FMPL-2 measurements (GNSS-R + L-band MWR) with the ERA-5 SST and SSS products. As can be seen, the agreement between the FMPL-2 and the ASCAT product is almost the same as the agreement between the ERA-5 and the ASCAT.
4.2. Sea Surface Salinity Results
The previous section has shown the sensitivity of FMPL-2 to wind speed. In this regard, GNSS-R data combined with L-band MWR data provide better performance to retrieve the WS product. In fact, the use of GNSS-R to correct for the ocean roughness for L-band radiometers has been a matter of analysis and discussion, as presented in Section 2. The combination of both measurements has proven to be a proxy to correct the ocean roughness and to retrieve a WS product from it. In this section, the same methodology is followed to present the sensitivity of FMPL-2 MWR and GNSS-R measurements to SSS.
4.2.1. Using L-Band Radiometry Data Only
The first case presents the SSS retrievals by combining the SST and the WS product from ERA-5. This case is used as validation, similarly to the first ANN used to validate the WS product. The scatter-density plots and the error histograms are presented in Figure 12. As shown in Figure 12a, the correlation coefficient for the range comprising 31.5 to 36 psu is 0.38, with an RMSE of 0.705 psu. As shown in Figure 12b, the ANN presents a better output, with a larger correlation coefficient of R = 0.52 and an RMSE of 0.625 psu when FMPL-2 MWR data are added. However, the histogram is neither Gaussian nor symmetric, and it can be clearly identified that, for values of SSS below ∼33 psu, the scatter-density plot shows a larger error. These areas with low salinity values are notably present near the coastline or the sea ice (see Figure 3), where freshwater is poured into the ocean. This particularity has been also examined in other MWR missions, such as SMOS, SMAP, or Aquarius, showing similar results (RMSEs even larger than 3 psu in the Arctic ocean) near coastlines or sea ice [55,56].
This last network has been implemented, and one month of data have been averaged and compared to the ground truth data, as presented in Figure 13. As can be seen, larger errors are concentrated around the Bering Sea and the Beaufort Sea (top part of the image), where there is a larger influence of sea ice and coastlines. In the bottom part of the maps corresponding to the Arctic Ocean (below Greenland and on top of the Scandinavian peninsula), the error in this region is around 0, showing an RMSE ∼0.3 psu. For the Antarctic Ocean, the errors are lower than 0.1–0.2 psu in most of the cases. In this case, there are no nearby coastlines, where most of the SSS measurements present errors due to freshwater discharge over the ocean surface and the effect of the coastline into the antenna footprint, as shown in [56].
4.2.2. Using GNSS-R Data Only and in Combination with L-Band Radiometry Data
Although the L-band MWR product performs well for large SSS values, this is not the case for lower values between 31.5 and 33.5 psu, where the low salinity is due to freshwater discharge from melting sea ice or land rivers. In this case, due to the large antenna footprint, the algorithm is not able to discern between the low-salinity water and high-salinity water. In this case, the use of GNSS-R data, with a much higher spatial resolution, should mitigate this effect and therefore enhance the SSS retrieval. Prior to the combination of both data sets, a first network is presented using only GNSS-R data; then, both L-band MWR and GNSS-R measurements are merged together, and finally, a third case is presented merging both measurements with the ERA-5 SST data. The scatter-density plot and the error histograms of the three models are presented in Figure 14.
The first case (Figure 14a) shows the performance of the ANN without using any ancillary data, but only GNSS-R data (without using the movstd()). In this case, the performance is similar to the case shown in Figure 12b, with an RMSE of ∼0.67 psu. Similarly to the WS algorithm, a slight improvement is presented when adding the movstd() as an input feature, which acts as a proxy of the sea roughness caused by the WS. In this case, the correlation coefficient increases from R = 0.64 to R = 0.67 and the RMSE decreases down to 0.65 psu.
In these two first cases, the dielectric constant, and hence the reflectivity of the ocean surface, is also affected by SST variations, but for the region under study (mostly reflection points in the North pole), the temperature variation is quite small, within a range between −1.7 °C and 10 °C (average value 2.64 °C, standard deviation 3.23 °C).
The third case (Figure 14c) combines both GNSS-R and MWR measurements. In this case, the correlation coefficient increases up to 0.80, and the RMSE is 0.52 psu for the whole range of measurements between 31.5 and 35.5 psu. In the scatter-density plot, a larger linearity can be seen for low salinity values from 31.5 to 33.5 psu, but as the reflectivity and the measured brightness temperature have a small dependence on the SST, the result is not optimum. Finally, Figure 14d shows the results of the ANN combining these three variables. The correlation coefficient increases up to 0.87, and the RMSE for the same range of observation decreases to 0.43 psu, providing a better result as compared to the case where only L-band MWR data were used in combination with the ERA-5 SST and WS information from ERA-5. The result of this ANN is comparable to the results found in other SSS studies using similar ranges of measurement [55,56]; moreover, in this case, SSS values are measured near the coastlines and sea ice.
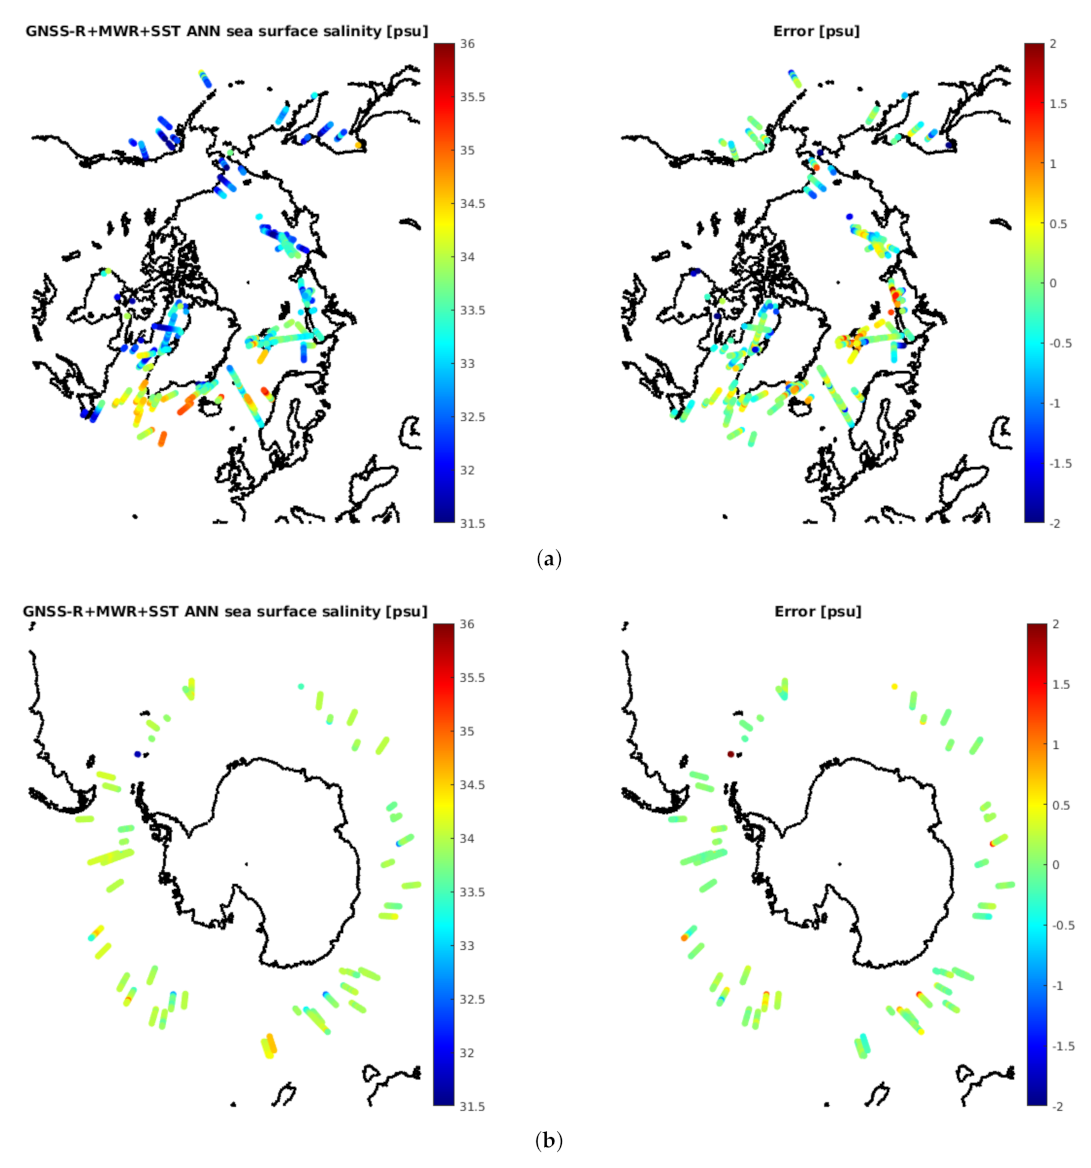
Finally, Figure 15 presents the geo-located SSS measurements. As can be seen, SSS estimates in the Antarctic Ocean present a lower error than the ones in the Arctic Ocean, similarly to the case of only using L-band radiometry data, but now with a much lower dispersion. As seen in this case, large errors are concentrated in the northern part of Europe and Russia, similar to the L-band MWR case. In this case, the use of the L-band MWR data is crucial to determine the SSS.
5. Discussion
Due to the large fraction of the Earth’s surface covered by oceans, their role in heat exchange and transport is critical, and monitoring oceanic ECVs is crucial to understand the effects of climate change.
The results presented in this study highlight the potential of nano-satellites and, in particular, CubeSats, for EO applications. The use of FMPL-2, a dual passive microwave instrument comprising a GNSS-R and an L-band MWR, provides different types of complementary measurements that can be merged to retrieve an enhanced product. The combination of GNSS-R and L-band MWR measurements as input features of an ANN model allows the simultaneous retrieval of ocean surface WS and SSS. The algorithms presented for WS retrieval show a correlation coefficient R ∼ 0.89 with an RMSE ∼1.69 m/s (∼8% of error) when the GNSS-R and the L-band radiometry data are combined with the ERA-5 SST and the SSS products. The ANN algorithm that merges FMPL-2 and SST to retrieve SSS in a single pass presents a correlation coefficient of 0.87, and an RMSE of 0.43 psu for SSS between 31.5 and 35.5 psu (∼10% of error). Furthermore, an algorithm has been also presented only using FMPL-2 data both for WS and SSS retrieval. The first algorithm uses GNSS-R and MWR data to retrieve a WS product over specular reflection point locations, with an RMSE of 2.05 m/s, and the second algorithm uses the same data to estimate SSS over the specular points, with an RMSE of 0.52 psu in a single satellite pass.
EO using CubeSats and SmallSats offer the potential of increased temporal and spatial resolutions without sacrificing accuracy. For the particular case of FMPL-2, using the instrument in three CubeSats with deployable solar panels (instead of body-mounted ones) so as to increase the payload duty cycle would allow coverage of both poles (latitudes above 55°) everyday. Furthermore, by using eight CubeSats, the entire globe can be covered everyday.
Future CubeSat constellations using different types of instruments will likely make use of machine learning algorithms to digest the large quantity of data generated. Hereof, the use of traditional high-quality missions is still required, mostly to develop, calibrate, and validate these new algorithms.
6. Conclusions
This manuscript has presented the first evaluation of the FMPL-2 to retrieve WS and SSS, by combining GNSS-R and L-band radiometry data. A preliminary correlation analysis has been performed, showing also the suitability of the movstd() observable as a proxy of the ocean surface roughness, which can be used as an input feature of an ANN to estimate WS and SSS. Moreover, the combination of this parameter with L-band radiometry data retrieved by FMPL-2 with a coarse resolution of 350 × 500 km2 allows us to further correct the surface roughness effect. The L-band microwave radiometer measures the emissivity of a surface, while a GNSS-R receiver measures the reflectivity. By combining these two complementary measurements in an ANN, the output of the network trained to retrieve either WS or SSS indeed is better than the one without their combination.
Ten different ANN-based algorithms have been presented, five to retrieve WS, and five to retrieve SSS. The first algorithm for both cases is a “validation algorithm", where the ancillary data are used to ensure that the network topology selected is not over-fitting to the output feature. This strategy validates that subsequent implementations of the same network topology are not over-fitting the target output. The second algorithm combines these ancillary data with the FMPL-2 L-band MWR data, showing an improvement in the retrieved product, with a correlation coefficient of 0.48 and an RMSE of 3.66 m/s. It is important to remark that most of the retrieved winds are in the range between 0 and 20 m/s, where the L-band MWR estimates show the worst performance [53]. Similarly, using GNSS-R data, the correlation coefficient is slightly better, ∼0.65, with an RMSE of 2.65 m/s, but still shows some errors concentrated around moderate winds ∼10 m/s. In this case, the improvement comes when MWR and GNSS-R data are combined in the same ANN, where the correlation coefficient increases up to 0.84, with an RMSE of 2.05 m/s. Finally, when SST and SSS are added as ancillary data, the error decreases to 1.68 m/s, and the correlation coefficient increases up to 0.89. In terms of the SSS retrieval, it is important to remark that low values of SSS cannot be correctly measured by the FMPL-2, mostly due to the fact that this low SSS is mostly present near the coastlines, due to the presence of river mouths or melted sea ice. In this case, in the range of SSS between 31.5 and 35.5 psu, the correlation coefficient with respect to the SMOS ground-truth data is 0.52, and the RMSE is 0.63 psu. When the L-band radiometry data are combined with the GNSS-R data and with the SST data set, the improvement is noticeable. For the same SSS range, the RMSE is decreased to 0.43 psu, with a correlation coefficient of 0.87.
The capabilities of CubeSat-based instruments, and, in particular, of FMPL-2, to perform SSS and WS mapping over the ocean have been presented in this study. Future EO mission based on nano-satellite constellation will likely apply machine learning and ANN algorithms to digest the large amount of data generated, and the use of high-quality data from traditional missions as SMOS or Aquarius to train and validate these algorithms will be required.
Author Contributions
Conceptualization, J.F.M.-M. and A.C.; methodology, J.F.M.-M. and A.C.; software, J.F.M.-M.; validation, J.F.M.-M. and A.C.; formal analysis, J.F.M.-M. and A.C.; investigation, J.F.M.-M. and A.C.; resources A.C.; data curation J.F.M.-M. and A.C.; visualization J.F.M.-M.; supervision A.C.; project administration A.C.; funding acquisition, A.C.; writing—original draft preparation, J.F.M.-M. and A.C.; writing—review and editing, J.F.M.-M. and A.C. Both authors read and agreed to the published version of the manuscript.
Funding
This work was supported by the 2017 ESA S3 Challenge and Copernicus Masters Overall Winner award (“FSSCat” project). This work was (partially) sponsored by project SPOT: Sensing with Pioneering Opportunistic Techniques grant RTI2018-099008-B-C21/AEI/10.13039/501100011033, and by the Unidad de Excelencia Maria de Maeztu MDM-2016-0600. Joan Francesc Munoz-Martin received support in the form of a grant for the recruitment of early-stage research staff FI-DGR 2018 from the AGAUR—Generalitat de Catalunya (FEDER), Spain.
Institutional Review Board Statement
Not applicable.
Informed Consent Statement
Not applicable.
Data Availability Statement
Data used in this study are publicly available and free, accessible from the NextGeoss portal (https://catalogue.nextgeoss.eu/, accessed on 22 June 2021) as part of the FSSCat mission.
Acknowledgments
The authors would like to thank all NanoSat-Lab members who made possible the development and testing of the FMPL-2 payload, as well as the support in building the Montsec S-band ground station used to download FMPL-2 data. The authors would like to thank Balamis S.L. employees Roger Jové, Adrià Amezaga, and Ricard Gonzálvez, who designed and manufactured the RF front-end board of FMPL-2 with the internal calibrators and the FSSCat consortium. We especially thank the Tyvak operations team, the Deimos DPGS team, and the Golbriak OU team for their support during the mission operations. Finally, the authors would like to give special thanks to Bernardo Carnicero and Massimiliano Pastena (ESA/ESTEC) for their continued technical support and advice during the whole project.
Conflicts of Interest
The authors declare no conflict of interest.
References
- GCOS. What are Essential Climate Variables? Available online: https://gcos.wmo.int/en/essential-climate-variables/abouth (accessed on 18 January 2021).
- Miralles, D.G.; Gentine, P.; Seneviratne, S.I.; Teuling, A.J. Land-atmospheric feedbacks during droughts and heatwaves: State of the science and current challenges. Ann. New York Acad. Sci. 2018, 1436, 19–35. [Google Scholar] [CrossRef] [PubMed]
- Lang, A.; Yang, S.; Kaas, E. Sea ice thickness and recent Arctic warming. Geophys. Res. Lett. 2016, 44, 409–418. [Google Scholar] [CrossRef]
- Arzel, O.; Fichefet, T.; Goosse, H. Sea ice evolution over the 20th and 21st centuries as simulated by current AOGCMs. Ocean. Model. 2006, 12, 401–415. [Google Scholar] [CrossRef]
- Latif, M.; Böning, C.; Willebrand, J.; Biastoch, A.; Dengg, J.; Keenlyside, N.; Schweckendiek, U.; Madec, G. Is the Thermohaline Circulation Changing? J. Clim. 2006, 19, 4631–4637. [Google Scholar] [CrossRef]
- UCAR Center for Science Education, The National Center for Atmospheric Research. Ocean on the Move: Thermohaline Circulation. Available online: http://scied.ucar.edu/ocean-move-thermohaline-circulation (accessed on 29 January 2021).
- Olmedo, E.; González-Haro, C.; Hoareau, N.; Umbert, M.; González-Gambau, V.; Martínez, J.; Gabarró, C.; Turiel, A. Nine years of SMOS sea surface salinity global maps at the Barcelona Expert Center. Earth Syst. Sci. Data 2021, 13, 857–888. [Google Scholar] [CrossRef]
- Ruf, C.; Unwin, M.; Dickinson, J.; Rose, R.; Rose, D.; Vincent, M.; Lyons, A. CyGNSS: Enabling the Future of Hurricane Prediction [Remote Sensing Satellites]. IEEE Geosci. Remote Sens. Mag. 2013, 1, 52–67. [Google Scholar] [CrossRef]
- Lemur-2. Gunter’s Space Page. Available online: https://space.skyrocket.de/doc_sdat/lemur-2.htm (accessed on 3 November 2020).
- Weaver, O.A.; Kerekes, J.P. The role of large constellations of small satellites in emergency response situations. In Proceedings of the 2015 IEEE International Geoscience and Remote Sensing Symposium (IGARSS), Milan, Italy, 26–31 July 2015; pp. 4200–4203. [Google Scholar] [CrossRef]
- Camps, A.; Golkar, A.; Gutierrez, A.; de Azua, J.A.R.; Munoz-Martin, J.F.; Fernandez, L.; Diez, C.; Aguilella, A.; Briatore, S.; Akhtyamov, R.; et al. FSSCat, the 2017 Copernicus Masters’ “ESA Sentinel Small Satellite Challenge” Winner: A Federated Polar and Soil Moisture Tandem Mission Based on 6U Cubesats. In Proceedings of the IGARSS 2018—2018 IEEE International Geoscience and Remote Sensing Symposium, Valencia, Spain, 22–27 July 2018; pp. 8285–8287. [Google Scholar] [CrossRef]
- Lary, D.J.; Zewdie, G.K.; Liu, X.; Wu, D.; Levetin, E.; Allee, R.J.; Malakar, N.; Walker, A.; Mussa, H.; Mannino, A.; et al. Machine Learning Applications for Earth Observation. In Earth Observation Open Science and Innovation; Mathieu, P.P., Aubrecht, C., Eds.; Springer: Cham, Switzerland, 2018; pp. 165–218. [Google Scholar] [CrossRef] [Green Version]
- Jing, C.; Niu, X.; Duan, C.; Lu, F.; Di, G.; Yang, X. Sea Surface Wind Speed Retrieval from the First Chinese GNSS-R Mission: Technique and Preliminary Results. Remote Sens. 2019, 11, 3013. [Google Scholar] [CrossRef] [Green Version]
- Ruf, C.S.; Gleason, S.; McKague, D.S. Assessment of CyGNSS Wind Speed Retrieval Uncertainty. IEEE J. Sel. Top. Appl. Earth Obs. Remote Sens. 2019, 12, 87–97. [Google Scholar] [CrossRef]
- Munoz-Martin, J.F.; Fernandez-Capon, L.; Ruiz-de-Azua, J.; Camps, A. The Flexible Microwave Payload-2: A SDR-Based GNSS-Reflectometer and L-Band Radiometer for CubeSats. IEEE J. Sel. Top. Appl. Earth Obs. Remote Sens. 2020, 13, 1298–1311. [Google Scholar] [CrossRef]
- Munoz-Martin, J.F.; Fernandez, L.; Perez, A.; de Azua, J.A.R.; Park, H.; Camps, A.; Domínguez, B.C.; Pastena, M. In-Orbit Validation of the FMPL-2 Instrument—The GNSS-R and L-Band Microwave Radiometer Payload of the FSSCat Mission. Remote Sens. 2020, 13, 121. [Google Scholar] [CrossRef]
- Llaveria, D.; Munoz-Martin, J.F.; Herbert, C.; Pablos, M.; Park, H.; Camps, A. Sea Ice Concentration and Sea Ice Extent Mapping with L-Band Microwave Radiometry and GNSS-R Data from the FFSCat Mission Using Neural Networks. Remote Sens. 2021, 13, 1139. [Google Scholar] [CrossRef]
- Herbert, C.; Munoz-Martin, J.F.; Llaveria, D.; Pablos, M.; Camps, A. Sea Ice Thickness Estimation Based on Regression Neural Networks Using L-Band Microwave Radiometry Data from the FSSCat Mission. Remote Sens. 2021, 13, 1366. [Google Scholar] [CrossRef]
- Munoz-Martin, J.F.; Llaveria, D.; Herbert, C.; Pablos, M.; Park, H.; Camps, A. Soil Moisture Estimation Synergy Using GNSS-R and L-Band Microwave Radiometry Data from FSSCat/FMPL-2. Remote Sens. 2021, 13, 994. [Google Scholar] [CrossRef]
- Font, J.; Camps, A.; Borges, A.; Martín-Neira, M.; Boutin, J.; Reul, N.; Kerr, Y.H.; Hahne, A.; Mecklenburg, S. SMOS: The Challenging Sea Surface Salinity Measurement From Space. Proc. IEEE 2010, 98, 649–665. [Google Scholar] [CrossRef] [Green Version]
- Reul, N.; Grodsky, S.; Arias, M.; Boutin, J.; Catany, R.; Chapron, B.; D’Amico, F.; Dinnat, E.; Donlon, C.; Fore, A.; et al. Sea surface salinity estimates from spaceborne L-band radiometers: An overview of the first decade of observation (2010–2019). Remote Sens. Environ. 2020, 242, 111769. [Google Scholar] [CrossRef]
- Emery, W.; Camps, A. Microwave Radiometry. In Introduction to Satellite Remote Sensing; Elsevier: Amsterdam, The Netherlands, 2017; pp. 131–290. [Google Scholar] [CrossRef]
- Camps, A.; Font, J.; Vall-llossera, M.; Gabarro, C.; Corbella, I.; Duffo, N.; Torres, F.; Blanch, S.; Aguasca, A.; Villarino, R.; et al. The WISE 2000 and 2001 field experiments in support of the SMOS mission: Sea surface L-band brightness temperature observations and their application to sea surface salinity retrieval. IEEE Trans. Geosci. Remote Sens. 2004, 42, 804–823. [Google Scholar] [CrossRef]
- Camps, A.; Bosch-Lluis, X.; Ramos-Perez, I.; Marchan-Hernandez, J.F.; Izquierdo, B.; Rodriguez-Alvarez, N. New Instrument Concepts for Ocean Sensing: Analysis of the PAU-Radiometer. IEEE Trans. Geosci. Remote Sens. 2007, 45, 3180–3192. [Google Scholar] [CrossRef]
- Camps, A.; Marchán, J.F.; Valencia, E.; Ramos, I.; Bosch-Lluis, X.; Rodriguez, N.; Park, H.; Alcayde, A.; Mollfulleda, A.; Galindo, J.; et al. PAU instrument aboard INTA MicroSat-1: A GNSS-R demonstration mission for sea state correction in L-band radiometry. In Proceedings of the 2011 IEEE International Geoscience and Remote Sensing Symposium, Vancouver, Canada, 24–29 July 2011; pp. 4126–4129. [Google Scholar] [CrossRef]
- Sabia, R.; Caparrini, M.; Ruffini, G. Potential Synergetic Use of GNSS-R Signals to Improve the Sea-State Correction in the Sea Surface Salinity Estimation: Application to the SMOS Mission. IEEE Trans. Geosci. Remote Sens. 2007, 45, 2088–2097. [Google Scholar] [CrossRef]
- Valencia, E.; Camps, A.; Rodriguez-Alvarez, N.; Ramos-Perez, I.; Bosch-Lluis, X.; Park, H. Improving the accuracy of sea surface salinity retrieval using GNSS-R data to correct the sea state effect. Radio Sci. 2011, 46, 1–11. [Google Scholar] [CrossRef]
- Liu, B.; Wan, W.; Hong, Y. Can the Accuracy of Sea Surface Salinity Measurement be Improved by Incorporating Spaceborne GNSS-Reflectometry? IEEE Geosci. Remote Sens. Lett. 2021, 18, 3–7. [Google Scholar] [CrossRef]
- Asgarimehr, M.; Wickert, J.; Reich, S. TDS-1 GNSS Reflectometry: Development and Validation of Forward Scattering Winds. IEEE J. Sel. Top. Appl. Earth Obs. Remote Sens. 2018, 11, 4534–4541. [Google Scholar] [CrossRef]
- Ruf, C.S.; Balasubramaniam, R. Development of the CYGNSS Geophysical Model Function for Wind Speed. IEEE J. Sel. Top. Appl. Earth Obs. Remote Sens. 2019, 12, 66–77. [Google Scholar] [CrossRef]
- Asharaf, S.; Waliser, D.E.; Posselt, D.J.; Ruf, C.S.; Zhang, C.; Putra, A.W. CYGNSS Ocean Surface Wind Validation in the Tropics. J. Atmos. Ocean. Technol. 2021, 38, 711–724. [Google Scholar] [CrossRef]
- Clarizia, M.P.; Ruf, C.S.; Jales, P.; Gommenginger, C. Spaceborne GNSS-R Minimum Variance Wind Speed Estimator. IEEE Trans. Geosci. Remote Sens. 2014, 52, 6829–6843. [Google Scholar] [CrossRef]
- Wang, H.Y.; Juang, J.C. Retrieval of Ocean Wind Speed Using Super-Resolution Delay-Doppler Maps. Remote Sens. 2020, 12, 916. [Google Scholar] [CrossRef] [Green Version]
- Munoz-Martin, J.F.; Onrubia, R.; Pascual, D.; Park, H.; Camps, A.; Rüdiger, C.; Walker, J.; Monerris, A. Single-Pass Soil Moisture Retrieval Using GNSS-R at L1 and L5 Bands: Results from Airborne Experiment. Remote Sens. 2021, 13, 797. [Google Scholar] [CrossRef]
- Clarizia, M.P.; Pierdicca, N.; Costantini, F.; Floury, N. Analysis of CyGNSS Data for Soil Moisture Retrieval. IEEE J. Sel. Top. Appl. Earth Obs. Remote Sens. 2019, 12, 2227–2235. [Google Scholar] [CrossRef]
- Chew, C.; Small, E. Description of the UCAR/CU Soil Moisture Product. Remote Sens. 2020, 12, 1558. [Google Scholar] [CrossRef]
- Yan, Q.; Huang, W.; Jin, S.; Jia, Y. Pan-tropical soil moisture mapping based on a three-layer model from CyGNSS GNSS-R data. Remote Sens. Environ. 2020, 247, 111944. [Google Scholar] [CrossRef]
- Rodriguez-Fernandez, N.J.; Aires, F.; Richaume, P.; Kerr, Y.H.; Prigent, C.; Kolassa, J.; Cabot, F.; Jimenez, C.; Mahmoodi, A.; Drusch, M. Soil Moisture Retrieval Using Neural Networks: Application to SMOS. IEEE Trans. Geosci. Remote Sens. 2015, 53, 5991–6007. [Google Scholar] [CrossRef]
- Elecnor, D.; Cesnet; EGI; CoLAB+Atlantic. NextGEOSS Project, a European Contribution to GEOSS. Available online: https://catalogue.nextgeoss.eu/ (accessed on 13 July 2021).
- Brodzik, M.J.; Billingsley, B.; Haran, T.; Raup, B.; Savoie, M.H. EASE-Grid 2.0: Incremental but Significant Improvements for Earth-Gridded Data Sets. ISPRS Int. J. Geo-Inf. 2012, 1, 32–45. [Google Scholar] [CrossRef] [Green Version]
- Hersbach, H.; Bell, B.; Berrisford, P.; Biavati, G.; Horányi, A.; Muñoz Sabater, J.; Nicolas, J.; Peubey, C.; Radu, R.; Rozum, I.; et al. ERA5 Hourly Data on Single Levels from 1979 to Present. Copernicus Climate Change Service (C3S) Climate Data Store (CDS). 14 June 2018. Available online: https://cds.climate.copernicus.eu/cdsapp#!/dataset/reanalysis-era5-single-levels?tab=overview (accessed on 20 May 2012).
- Olmedo, E.; González-Haro, C.; González, V.; Turiel, A. BEC SMOS Sea Surface Salinity Global L3 Product (V.2.0) [Dataset]; CSIC - Instituto de Ciencias del Mar (ICM): Barcelona, Spain, 2020. [Google Scholar] [CrossRef]
- OSI SAF. ASCAT L2 25 km Winds Data Record Release 1—Metop; EUMETSAT SAF on Ocean and Sea Ice: Darmstadt, Germany, 2016. [Google Scholar] [CrossRef]
- Camps, A.; Munoz-Martin, J.F. Analytical Computation of the Spatial Resolution in GNSS-R and Experimental Validation at L1 and L5. Remote Sens. 2020, 12, 3910. [Google Scholar] [CrossRef]
- Camps, A. Spatial Resolution in GNSS-R Under Coherent Scattering. IEEE Geosci. Remote Sens. Lett. 2019. [Google Scholar] [CrossRef]
- Park, H.; Pascual, D.; Camps, A.; Martin, F.; Alonso-Arroyo, A.; Carreno-Luengo, H. Analysis of Spaceborne GNSS-R Delay-Doppler Tracking. IEEE J. Sel. Top. Appl. Earth Obs. Remote Sens. 2014, 7, 1481–1492. [Google Scholar] [CrossRef]
- Ying, X. An Overview of Overfitting and its Solutions. J. Phys. Conf. Ser. 2019, 1168, 022022. [Google Scholar] [CrossRef]
- Burden, F.; Winkler, D. Bayesian Regularization of Neural Networks. In Methods in Molecular Biology™; Humana Press: Totowa, NJ, USA, 2008; pp. 23–42. [Google Scholar] [CrossRef]
- Reynolds, J.; Clarizia, M.P.; Santi, E. Wind Speed Estimation From CYGNSS Using Artificial Neural Networks. IEEE J. Sel. Top. Appl. Earth Obs. Remote Sens. 2020, 13, 708–716. [Google Scholar] [CrossRef]
- Balasubramaniam, R.; Ruf, C. Neural Network Based Quality Control of CYGNSS Wind Retrieval. Remote Sens. 2020, 12, 2859. [Google Scholar] [CrossRef]
- Karnin, E.D. A simple procedure for pruning back-propagation trained neural networks. IEEE Trans. Neural Netw. 1990, 1, 239–242. [Google Scholar] [CrossRef]
- Meissner, T.; Ricciardulli, L.; Wentz, F.J. Capability of the SMAP Mission to Measure Ocean Surface Winds in Storms. Bull. Am. Meteorol. Soc. 2017, 98, 1660–1677. [Google Scholar] [CrossRef]
- Cotton, J.; Francis, P.; Heming, J.; Forsythe, M.; Reul, N.; Donlon, C. Assimilation of SMOS L-band wind speeds: Impact on Met Office global NWP and tropical cyclone predictions. Q. J. R. Meteorol. Soc. 2018, 144, 614–629. [Google Scholar] [CrossRef]
- Rivas, M.B.; Stoffelen, A. Characterizing ERA-Interim and ERA5 surface wind biases using ASCAT. Ocean. Sci. 2019, 15, 831–852. [Google Scholar] [CrossRef] [Green Version]
- Olmedo, E.; Gabarró, C.; González-Gambau, V.; Martínez, J.; Ballabrera-Poy, J.; Turiel, A.; Portabella, M.; Fournier, S.; Lee, T. Seven Years of SMOS Sea Surface Salinity at High Latitudes: Variability in Arctic and Sub-Arctic Regions. Remote Sens. 2018, 10, 1772. [Google Scholar] [CrossRef] [Green Version]
- Bao, S.; Wang, H.; Zhang, R.; Yan, H.; Chen, J. Comparison of Satellite-Derived Sea Surface Salinity Products from SMOS, Aquarius, and SMAP. J. Geophys. Res. Ocean. 2019, 124, 1932–1944. [Google Scholar] [CrossRef]
Figure 1.
(a) Ilustration of the thermohaline circulation. Adapted from https://earthobservatory.nasa.gov (accessed on 5 July 2021). (b) Difference between the 2011–2019 average of sea surface salinity maps and the World Ocean Atlas Sea Surface Salinity 2013 (adapted from Figure 3 of [7]).
Figure 1.
(a) Ilustration of the thermohaline circulation. Adapted from https://earthobservatory.nasa.gov (accessed on 5 July 2021). (b) Difference between the 2011–2019 average of sea surface salinity maps and the World Ocean Atlas Sea Surface Salinity 2013 (adapted from Figure 3 of [7]).
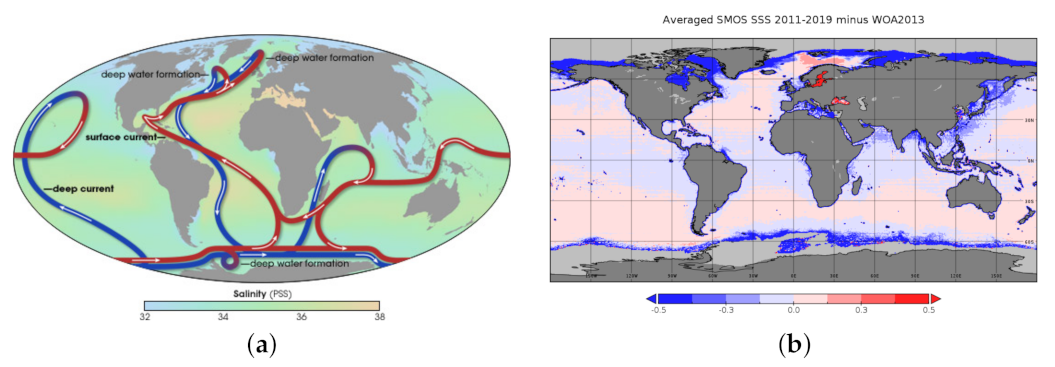
Figure 2.
Example of incoherent (a) and coherent (b) Delay-Doppler Map (DDM). The measured incoherent DDM has an SNR of 3.80 dB with a wind speed of 29.90 m/s. The measured coherent DDM has an SNR of 20.68 dB with a wind speed of 2.92 m/s (adapted from Figure 10 of [33]).
Figure 2.
Example of incoherent (a) and coherent (b) Delay-Doppler Map (DDM). The measured incoherent DDM has an SNR of 3.80 dB with a wind speed of 29.90 m/s. The measured coherent DDM has an SNR of 20.68 dB with a wind speed of 2.92 m/s (adapted from Figure 10 of [33]).
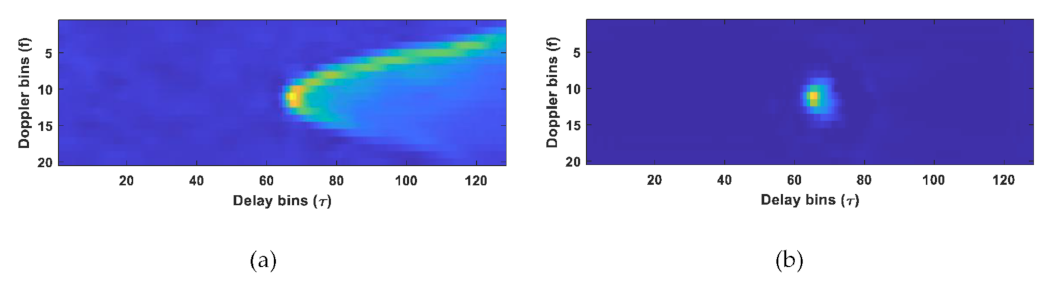
Figure 3.
(a,c) Co-located data ERA-5 WS on top of the FMPL-2 radiometric footprint for a three-day period for the Arctic (10–13 October 2020) and Antarctic (5–8 November 2020) oceans, respectively. (b,d) Co-located SMOS SSS data on top of the FMPL-2 radiometric footprint for a one-month period (October 2020) for the Arctic and Antarctic oceans, respectively.
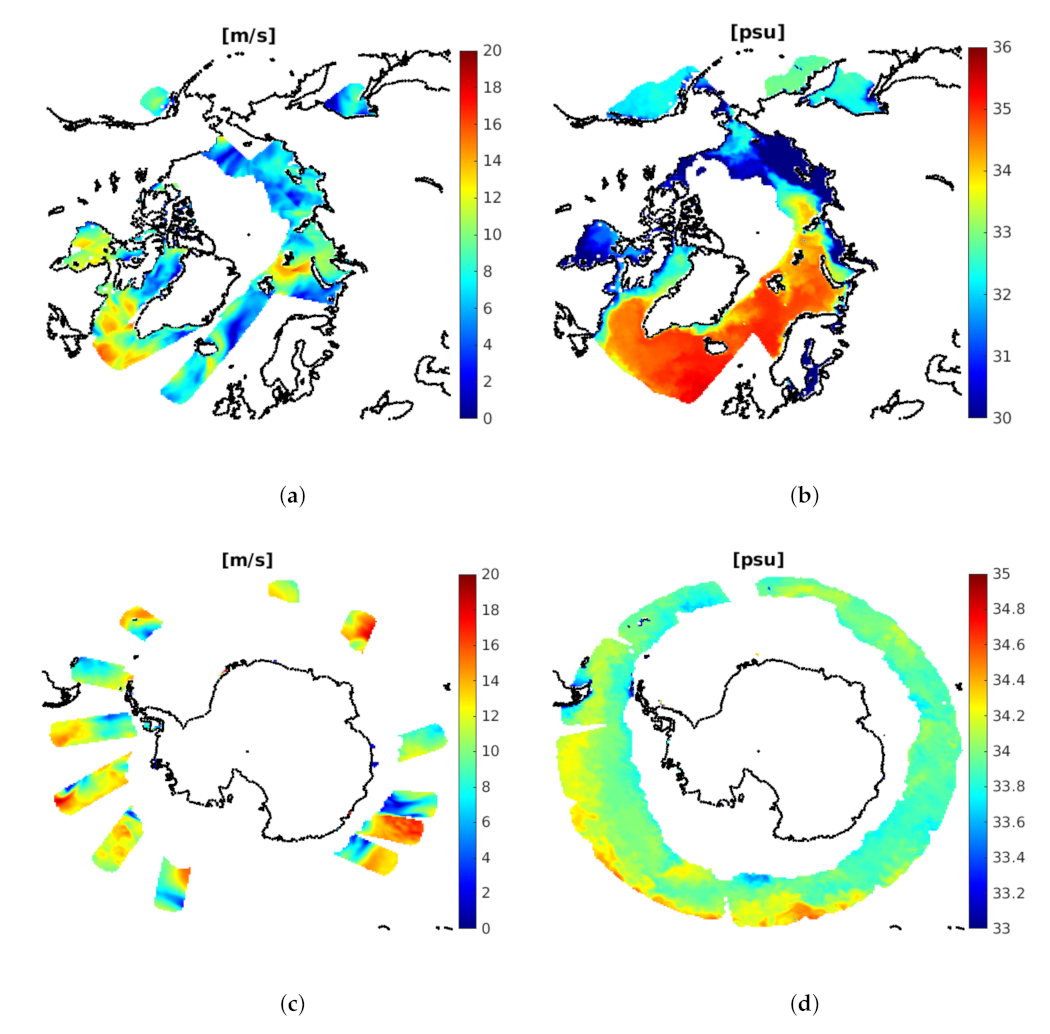
Figure 4.
(a,b) Data density of MWR measurements collected by FMPL-2 over open ocean in the Arctic and Antarctica in the period from 1 October 2020 to 30 November 2020 (2.2 Million points in a 100 km2 grid), and (c,d) data density of GNSS-R reflections over open ocean in the same time period, with a signal-to-noise ratio above the 3 dB threshold (14,750 points in a 100 km2 grid).
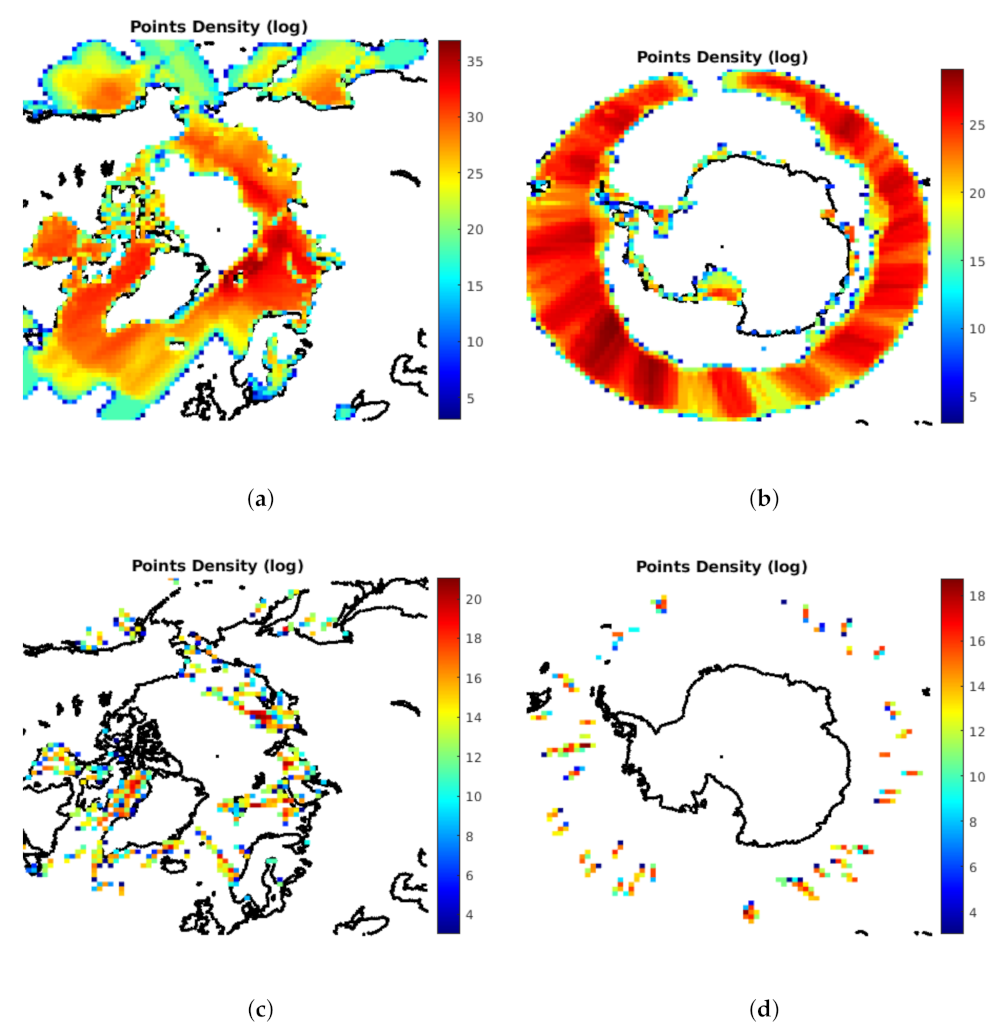
Figure 5.
Pearson correlation matrix between the GNSS-R data ( and movstd()), the L-band microwave radiometry data, and the WS, SST, and SSS salinity products.
Figure 5.
Pearson correlation matrix between the GNSS-R data ( and movstd()), the L-band microwave radiometry data, and the WS, SST, and SSS salinity products.

Figure 6.
Training and test division strategy. Data are randomly split into 20% for training and 80% for testing. The training data are split again by the MATLAB® deep learning toolbox to generate the trained network.
Figure 6.
Training and test division strategy. Data are randomly split into 20% for training and 80% for testing. The training data are split again by the MATLAB® deep learning toolbox to generate the trained network.

Figure 7.
(Top) Scatter–density plot and (bottom) error histogram of (left) the validation ANN to output WS data from SST and SSS, and (right) the ANN deployed to estimate WS using SST, SSS, and L-band microwave radiometry data from FMPL-2.
Figure 7.
(Top) Scatter–density plot and (bottom) error histogram of (left) the validation ANN to output WS data from SST and SSS, and (right) the ANN deployed to estimate WS using SST, SSS, and L-band microwave radiometry data from FMPL-2.

Figure 8.
Output of the ANN for WS retrieval using combined SST + SSS + MWR data over the FMPL-2 footprint in the Arctic Ocean, for (a) 10–13 October 2020 and (b) 10–14 November 2020.
Figure 8.
Output of the ANN for WS retrieval using combined SST + SSS + MWR data over the FMPL-2 footprint in the Arctic Ocean, for (a) 10–13 October 2020 and (b) 10–14 November 2020.
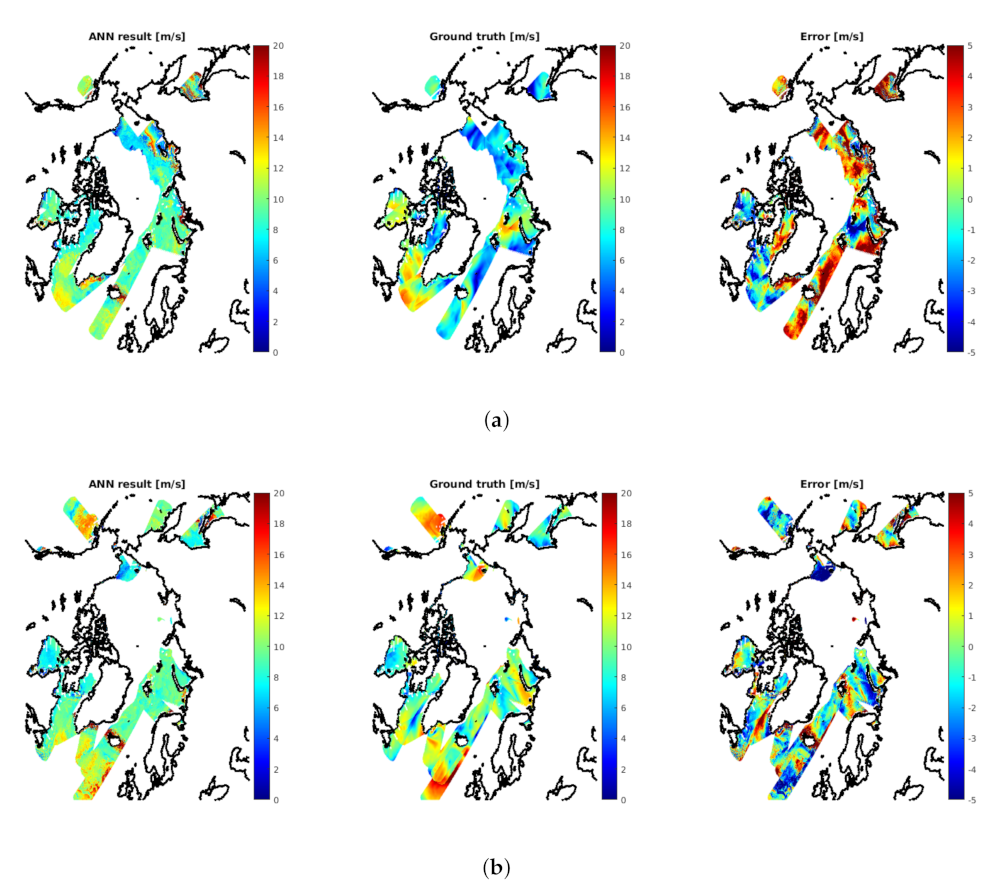
Figure 9.
(Top) Scatter–density plot and (bottom) error histogram of the three different ANN outputs for (a) using GNSS-R data to estimate WS, (b,c) adding FMPL-2 MWR measurements to the previous case, and (d) adding SST data to the second case.
Figure 9.
(Top) Scatter–density plot and (bottom) error histogram of the three different ANN outputs for (a) using GNSS-R data to estimate WS, (b,c) adding FMPL-2 MWR measurements to the previous case, and (d) adding SST data to the second case.
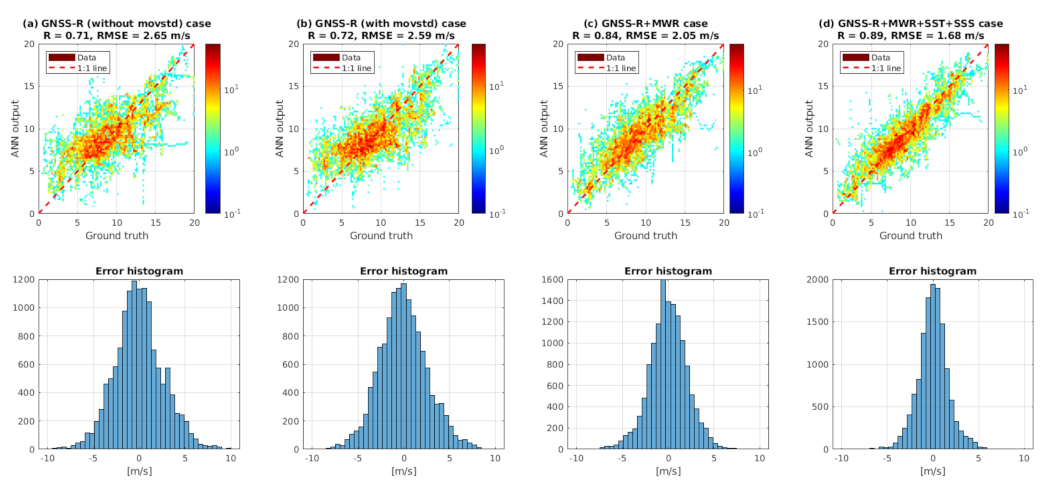
Figure 10.
(Left) Wind speed product using combined GNSS-R, L-band MWR, SST, and SSS data, and (right) error with respect to ERA-5 WS product. (a) North pole and (b) South pole.
Figure 10.
(Left) Wind speed product using combined GNSS-R, L-band MWR, SST, and SSS data, and (right) error with respect to ERA-5 WS product. (a) North pole and (b) South pole.
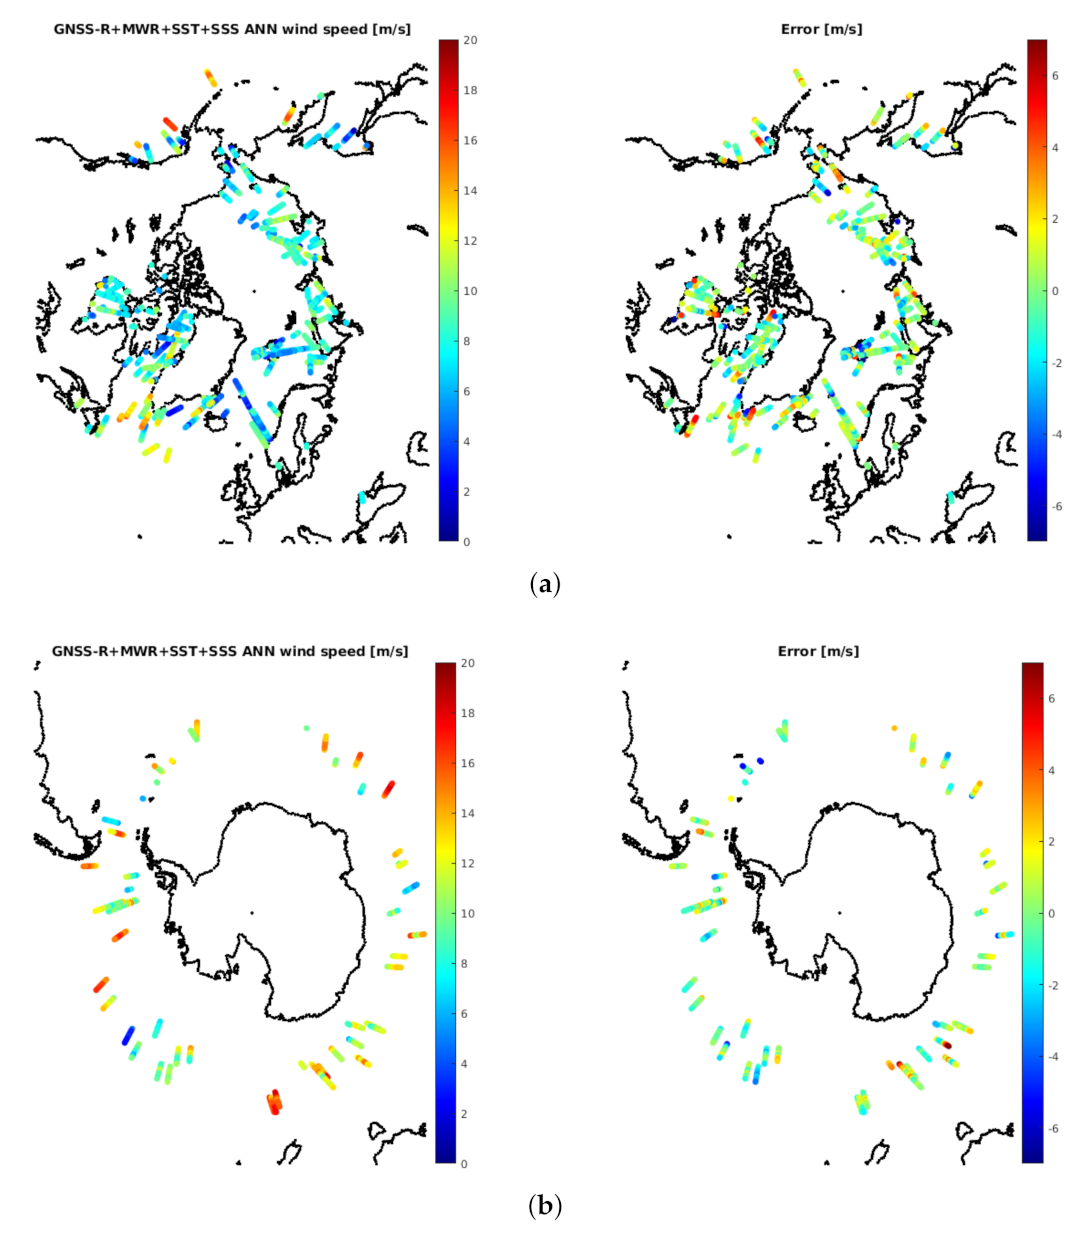
Figure 11.
Comparison between ASCAT wind speed product with the FMPL-2 ANN output using GNSS-R + L-band MWR + SST + SSS data.
Figure 11.
Comparison between ASCAT wind speed product with the FMPL-2 ANN output using GNSS-R + L-band MWR + SST + SSS data.

Figure 12.
(Left) Scatter–density plot and (right) error histogram of the three different ANN outputs for (a) using SST and WS data to produce SSS (for validation purposes), and (b) adding FMPL-2 MWR measurements to the previous case.
Figure 12.
(Left) Scatter–density plot and (right) error histogram of the three different ANN outputs for (a) using SST and WS data to produce SSS (for validation purposes), and (b) adding FMPL-2 MWR measurements to the previous case.
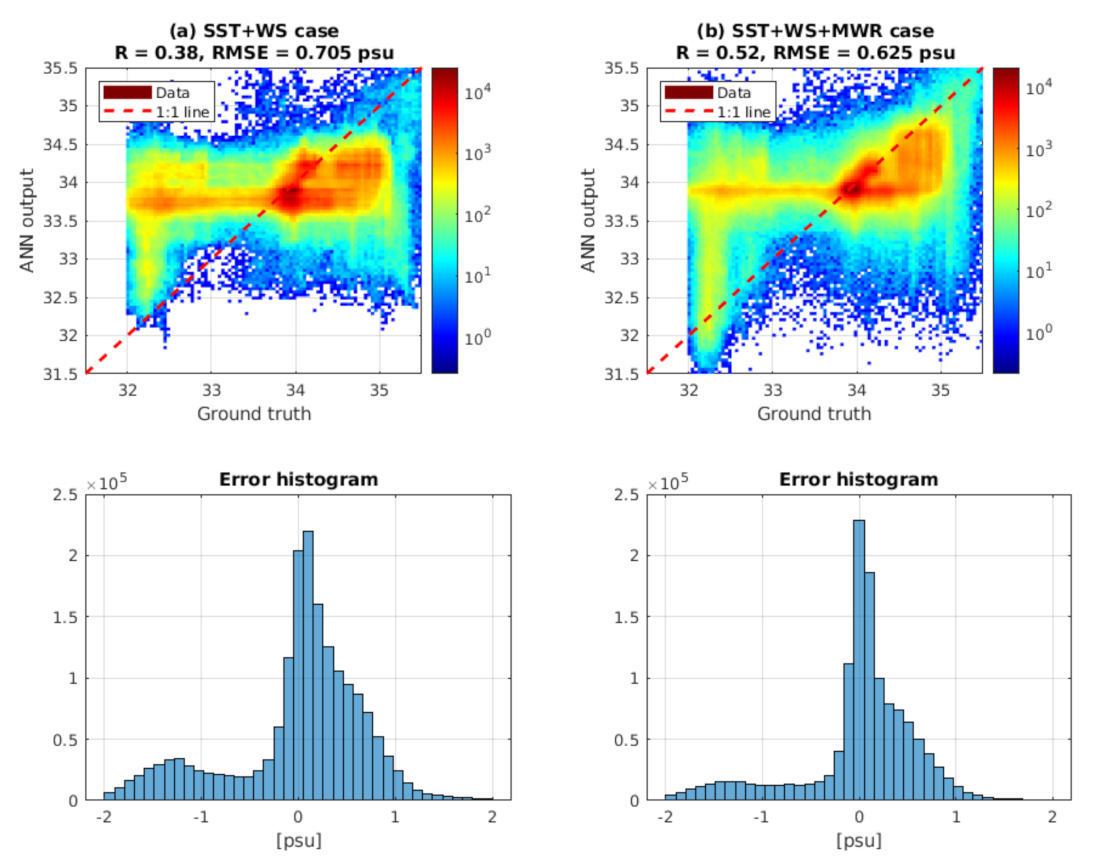
Figure 13.
From left to right: SSS corresponding to the ANN presented in Figure 12, ground truth associated, and error map. (a) corresponds to October 2020, (b) to November 2020, both for the Arctic ocean, and (c) November for the Antarctic ocean (in October 2020, there was still a larger extension of sea ice, so the map has not been reproduced).
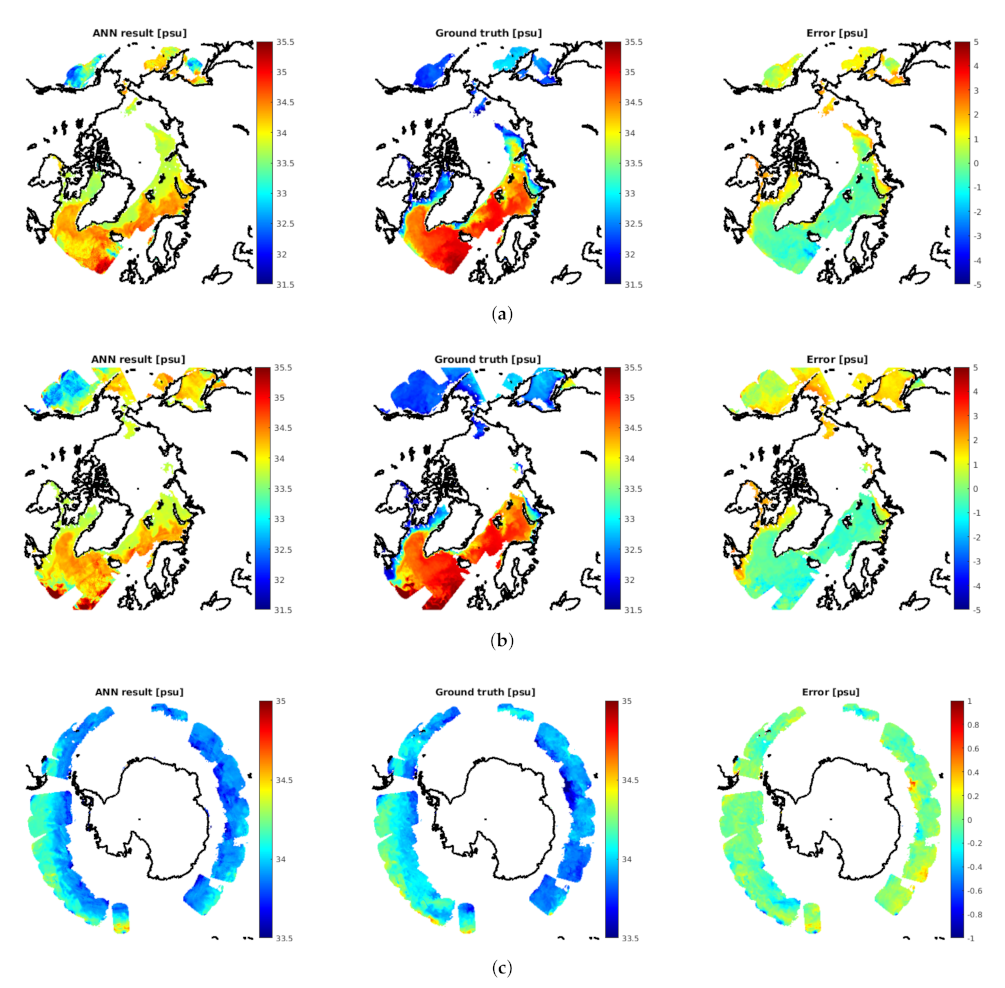
Figure 14.
(Top) Scatter–density plot and (bottom) error histogram of the three different ANN outputs for (a,b) using GNSS-R data to estimate SSS without and with movstd(), (c) adding FMPL-2 MWR measurements to the previous case, and (d) adding SST data to the third case.
Figure 14.
(Top) Scatter–density plot and (bottom) error histogram of the three different ANN outputs for (a,b) using GNSS-R data to estimate SSS without and with movstd(), (c) adding FMPL-2 MWR measurements to the previous case, and (d) adding SST data to the third case.

Figure 15.
(Left) SSS product from the combination of GNSS-R, MWR, and SST data, and (right) its error with respect to the SMOS SSS product for the whole 31.5 to 35.5 psu range. (a) North Pole and (b) South Pole.
Figure 15.
(Left) SSS product from the combination of GNSS-R, MWR, and SST data, and (right) its error with respect to the SMOS SSS product for the whole 31.5 to 35.5 psu range. (a) North Pole and (b) South Pole.

Table 1.
Summary of the ANN-based models implemented to estimate WS.
| Model | Target Output | Description |
|---|---|---|
| SST + SSS | WS | Validation set without FMPL-2 data |
| SST + SSS + MWR | WS | WS retrieval using FMPL-2 and SST + SSS data |
| GNSS-R | WS | WS retrieval over specular reflection points using GNSS-R data (not using movstd()) from FMPL-2 |
| GNSS-R | WS | WS retrieval over specular reflection points using GNSS-R data (using movstd()) from FMPL-2 |
| GNSS-R + MWR | WS | WS retrieval over specular reflection points using combined GNSS-R and L-band radiometry data from FMPL-2 |
| GNSS-R + MWR + SST + SSS | WS | WS retrieval over specular reflection points using combined GNSS-R and L-band radiometry data from FMPL-2, and aided by the SST and SSS data sets |
Table 2.
Summary of the ANN-based models implemented to estimate SSS.
| Model | Target Output | Description |
|---|---|---|
| SST + WS | SSS | Validation set without FMPL-2 data |
| SST + WS + MWR | SSS | SSS retrieval using FMPL-2 and SST + WS data |
| GNSS-R | SSS | SSS retrieval over specular reflection points using GNSS-R data (not using movstd()) from FMPL-2 |
| GNSS-R | SSS | SSS retrieval over specular reflection points using GNSS-R data (using movstd()) from FMPL-2 |
| GNSS-R + MWR | SSS | SSS retrieval over specular reflection points using combined GNSS-R and L-band radiometry data from FMPL-2 |
| GNSS-R + MWR + SST | SSS | SSS retrieval over specular reflection points using combined GNSS-R and L-band radiometry data from FMPL-2, and aided by the SST data set |
Publisher’s Note: MDPI stays neutral with regard to jurisdictional claims in published maps and institutional affiliations. |
© 2021 by the authors. Licensee MDPI, Basel, Switzerland. This article is an open access article distributed under the terms and conditions of the Creative Commons Attribution (CC BY) license (https://creativecommons.org/licenses/by/4.0/).
Share and Cite
MDPI and ACS Style
Munoz-Martin, J.F.; Camps, A. Sea Surface Salinity and Wind Speed Retrievals Using GNSS-R and L-Band Microwave Radiometry Data from FMPL-2 Onboard the FSSCat Mission. Remote Sens. 2021, 13, 3224. https://doi.org/10.3390/rs13163224
AMA Style
Munoz-Martin JF, Camps A. Sea Surface Salinity and Wind Speed Retrievals Using GNSS-R and L-Band Microwave Radiometry Data from FMPL-2 Onboard the FSSCat Mission. Remote Sensing. 2021; 13(16):3224. https://doi.org/10.3390/rs13163224
Chicago/Turabian StyleMunoz-Martin, Joan Francesc, and Adriano Camps. 2021. "Sea Surface Salinity and Wind Speed Retrievals Using GNSS-R and L-Band Microwave Radiometry Data from FMPL-2 Onboard the FSSCat Mission" Remote Sensing 13, no. 16: 3224. https://doi.org/10.3390/rs13163224
Note that from the first issue of 2016, this journal uses article numbers instead of page numbers. See further details here.