
Rice Leaf Blast Classification Method Based on Fused Features and One-Dimensional Deep Convolutional Neural Network
by
Shuai Feng
1, 
Yingli Cao
1,2,
Tongyu Xu
1,2,*,
Fenghua Yu
1,2,
Dongxue Zhao
1 and
Guosheng Zhang
1 1
College of Information and Electrical Engineering, Shenyang Agricultural University, Shenyang 110866, China
2
Liaoning Engineering Research Center for Information Technology in Agriculture, Shenyang 110866, China
*
Author to whom correspondence should be addressed.
Remote Sens. 2021, 13(16), 3207; https://doi.org/10.3390/rs13163207
Submission received: 15 July 2021
/
Revised: 9 August 2021
/
Accepted: 10 August 2021
/
Published: 13 August 2021
(This article belongs to the Special Issue Advances in Hyperspectral Data Exploitation)
Abstract
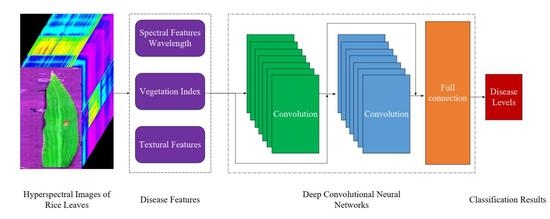
:Rice leaf blast, which is seriously affecting the yield and quality of rice around the world, is a fungal disease that easily develops under high temperature and humidity conditions. Therefore, the use of accurate and non-destructive diagnostic methods is important for rice production management. Hyperspectral imaging technology is a type of crop disease identification method with great potential. However, a large amount of redundant information mixed in hyperspectral data makes it more difficult to establish an efficient disease classification model. At the same time, the difficulty and small scale of agricultural hyperspectral imaging data acquisition has resulted in unrepresentative features being acquired. Therefore, the focus of this study was to determine the best classification features and classification models for the five disease classes of leaf blast in order to improve the accuracy of grading the disease. First, the hyperspectral imaging data were pre-processed in order to extract rice leaf samples of five disease classes, and the number of samples was increased by data augmentation methods. Secondly, spectral feature wavelengths, vegetation indices and texture features were obtained based on the amplified sample data. Thirdly, seven one-dimensional deep convolutional neural networks (DCNN) models were constructed based on spectral feature wavelengths, vegetation indices, texture features and their fusion features. Finally, the model in this paper was compared and analyzed with the Inception V3, ZF-Net, TextCNN and bidirectional gated recurrent unit (BiGRU); support vector machine (SVM); and extreme learning machine (ELM) models in order to determine the best classification features and classification models for different disease classes of leaf blast. The results showed that the classification model constructed using fused features was significantly better than the model constructed with a single feature in terms of accuracy in grading the degree of leaf blast disease. The best performance was achieved with the combination of the successive projections algorithm (SPA) selected feature wavelengths and texture features (TFs). The modeling results also show that the DCNN model provides better classification capability for disease classification than the Inception V3, ZF-Net, TextCNN, BiGRU, SVM and ELM classification models. The SPA + TFs-DCNN achieved the best classification accuracy with an overall accuracy (OA) and Kappa of 98.58% and 98.22%, respectively. In terms of the classification of the specific different disease classes, the F1-scores for diseases of classes 0, 1 and 2 were all 100%, while the F1-scores for diseases of classes 4 and 5 were 96.48% and 96.68%, respectively. This study provides a new method for the identification and classification of rice leaf blast and a research basis for assessing the extent of the disease in the field.
1. Introduction
Crop pests and diseases cause huge losses of agricultural production [1]. According to the Food and Agriculture Organization of the United Nations, the annual reduction in food production caused by pests and diseases accounts for about 25% of the total food production worldwide, with 14% of the reduction caused by diseases and 10% by pests [2]. In China, the amount of grain lost due to pest and disease outbreaks and hazards is about 30% of the total production each year, which has a huge impact on the domestic economy [3]. We still mainly rely on plant protection personnel to conduct field surveys and field sampling in order to monitor crop disease. Although these traditional detection methods have high accuracy and reliability, they are time-consuming, laborious and lack representativeness. These traditional diagnostic methods mainly rely on the subjective judgment of investigators, which is prone to human misjudgment, subjective errors and variability [4,5,6,7]. Therefore, there is an urgent need to improve pest and disease monitoring and control methods.
Rice blast is one of the most serious rice diseases in the north and south rice-growing areas of China and it is known as one of the three major rice diseases together with bacterial blight and sheath blight [8]. In September 2020, rice blast was listed as a Class I crop pest by the Ministry of Agriculture and Rural Affairs of China. Rice blast is caused by magnaporthe grisea and phytophthora grisea, which infest the leaves, neck and ears of rice by producing conidia and causing devastating effects on the physiological aspects of rice growth [9]. According to the period and location of damage, rice blast can be divided into the seedling blast, leaf blast and spike blast, etc., among which leaf disease is the most harmful. Leaf blast usually occurs after the three-leaf stage of rice plants and is increasingly serious from the tillering stage to the jointing stage. The spots first appear as white dots and gradually become 1~3 cm long diamond-shaped spots. The disease spot is gray in the middle and is surrounded by a dark brown color. In severe infestation, the entire leaf dries out [10,11] and reduces the green leaf area and photosynthesis in the lesioned area [12], thus causing a substantial rice yield reduction. It generally causes a 10~30% yield reduction in rice. Under favourable conditions, it can destroy an entire rice field in 15 to 20 days and cause up to 100% yield loss [13]. In China, the average annual occurrence of rice blasts is as high as 3.8 million hectares, with annual losses of hundreds of millions of kilograms of rice. In order to control the spread of leaf blast fungus over a large area and reduce yield losses. It is urgent to develop methods of rapid and accurate monitoring and discrimination of leaf blast disease.
Spectroscopy is a commonly used technique for plant disease detection, and its non-destructive, rapid and accurate characteristics have attracted the attention of a wide range of scholars [14]. Multispectral techniques [15,16] and near-infrared spectroscopy [17,18] have been studied in crop disease stress classification. However, multispectral and near-infrared techniques obtain less spectral data information, making it more difficult to detect the disease at its early stage of development and resulting in the inability to accurately discriminate against it. Compared with the above-mentioned spectroscopic techniques, hyperspectral imaging technology, which has characteristics of multiple spectral bands, high resolution and can provide spatial-domain and spectral-domain information, has thus gradually become a research hotspot for scholars. This technique has been widely used for disease detection in vegetables [19,20], fruits [21,22] and grains [23,24,25]. In recent years, with the development and application of hyperspectral imaging technology, the technology has made great progress in crop disease detection and greatly improved the science of accurate prevention and controls and management decisions in the field. Luo et al. [26], after comparing the accuracy of rice blast identification with different spectral processing methods and modeling approaches, concluded that the probabilistic neural network classification based on logarithmic spectra was the best, with an accuracy of 75.5% in the test set. Liu et al. [27] used support vector machine and extreme learning machine methods to model and classify white scab and anthracnose of tea, respectively, with a classification accuracy of 95.77%. Yuan et al. [28] extracted hyperspectral data from healthy and diseased leaves without disease spots, leaves with less than 10% disease spot area and less than 25% disease spot area, respectively, and used CARS-PCA for dimensionality reduction in order to construct SVM rice blast classification models. The accuracy of all categories was greater than 94.6%. Knauer et al. [29] used hyperspectral imaging for the accurate classification of powdery mildew of wine grapes. Nagasubramanian et al. [30] used hyperspectral techniques and built soybean charcoal rot early identification models based on genetic algorithms and support vector machines. Nettleton et al. [31] used operational process-based models and machine learning models for the predictive analysis of rice blast. It was concluded that machine learning methods showed better adaptation to the prediction of rice blast in the presence of a training data set. All the above-mentioned studies achieved good results, but all of them focused on the detection of diseases in crops using spectral information from hyperspectral images, and they did not address texture features in hyperspectral images which are directly related to disease characterization. Texture features as inherent properties possessed by the crop, which are not easily disturbed by the external environment, can reflect the image properties and the spatial distribution of adjacent pixels, compensating to some extent for the saturation of crop disease detection relying only on spectral information [32]. Zhang et al. [33] used spectral features and texture features to construct a support vector machine classification model. The results demonstrated that the classification model was able to effectively classify healthy, moderate and severe diseases in wheat. Al-Saddik et al. [34] concluded that combining texture features of grape leaves and spectral information to construct a classification model resulted in the effective classification of yellowness and esca with an overall accuracy of 99%. Zhang and Zhu et al. [35,36] concluded after analysis that the classification model constructed by fusing spectral and texture features had superior classification accuracy compared to the classification model using only spectral or texture features. The above literature shows that it is feasible to construct plant disease classification models by fusing spectral and texture information from hyperspectral images. However, the study of using fusion features of spectral and textural information to discriminate different disease levels of rice leaf blast needs to be explored deeply.
In the above-mentioned studies, researchers mostly used machine learning methods such as support vector machines and back propagation neural networks to model hyperspectral data. However, there are still relatively few studies using deep learning methods for crop disease identification and recognition based on hyperspectral imaging data. The reason for this may be the small quantity of sample data obtained, which makes it impossible to build a deep learning model. In existing studies, researchers have mostly used deep learning methods to build models for hyperspectral data due to the powerful feature extraction capabilities of these models. Nagasubramanian et al. [37] constructed a 3D convolutional neural network recognition model for soybean charcoal rot by using hyperspectral image data with a classification accuracy of 95.73%. Huang et al. [38] obtained hyperspectral images of rice spike blast and constructed a detection model based on the GoogLeNet method with a maximum accuracy of 92%. Zhang et al. [39] used a three-dimensional deep convolutional neural network model to model yellow rust of winter wheat with an overall accuracy of 85%. Although this modeling approach can achieve high accuracy rates, it still requires the use of expensive hyperspectral instruments in practical agricultural applications in order to obtain data and cannot be applied on a large scale.
In view of this, this study draws on existing research methods to expand the sample data size. Data dimensionality reduction uses augmented sample data to extract spectral feature wavelengths, vegetation indices and texture features. A total of seven one-dimensional deep convolutional neural network classification models were constructed for leaf blast disease classification based on the above features and their fusion features. Finally, Inception V3, ZF-Net, BiGRU, TextCNN, SVM and ELM models were used for comparative analysis with the model of this study to determine the best classification features and classification model for leaf blast. It is expected to provide some scientific theory and technical support for the identification of rice leaf blast disease grades.
2. Materials and Methods
2.1. Study Site
Rice leaf blast trials were conducted from July to August 2020 at Liujiaohe Village, Shenyang New District, Shenyang, Liaoning Province (42°01′17.16”N, 123°38′14.57”E). The region has a temperate semi-humid continental climate, with an average annual temperature of 9.7 °C and an average annual precipitation of 700 mm, making it a typical cold-land rice-growing area. Mongolian rice with a high susceptibility to leaf blast was used as the test variety, and it was planted on an area of about 100 m2 with a row spacing of 30 cm and a plant spacing of 17 cm. Nitrogen, potassium and phosphorus fertilizers were applied according to local standards at 45, 15 and 51.75 kg/hm2, respectively. Prior to basal fertilizer application, soil samples were collected using the five-point sampling method from the disease trial plots, and soil nutrients were measured and analyzed. The measured results showed that the rapid potassium content ranged from 86.83 to 120.62 mg/kg; the effective phosphorus content ranged from 3.14 to 21.18 mg/kg; the total nitrogen content ranged from 104.032 to 127.368 mg/kg; and the organic matter content ranged from 15.8 to 20.0 g/kg. Leaf blast inoculation was carried out at 5:00 p.m. on the same day (3 July 2020) by using a spore suspension at a concentration of 9 mg/100 mL (in order to inoculate, the spore suspension was shaken well and sprayed evenly over the surface of the plant leaves until the leaves were completely covered with water droplets), which was wrapped in a moistened black plastic bag after inoculation and removed at 6:30 a.m. the following morning. The test plots were not treated with any disease control, and field management was normal. Five days after inoculation, the plants began to show symptoms, and healthy and diseased rice leaves were obtained from the field under the guidance of a plant protection specialist and taken back to the hyperspectral laboratory in order to obtain hyperspectral image data.
2.2. Data Acquisition and Processing
2.2.1. Sample Collection
Five trials were conducted to collect healthy and diseased plants at three critical fertility stages: the rice jointing stage (8 July; 15 July), the booting stage (25 July; 2 August) and the heading stage (10 August). Under the supervision of plant protection experts, 57, 61 and 27 leaf samples with five different levels of disease were collected at the jointing, booting and heading stages, respectively, and a total of 145 rice leaf samples were obtained. In the experiment, in order to maintain the moisture content of the rice leaves, the leaves were placed in a portable refrigerator to maintain their freshness. Hyperspectral image data were then acquired indoors by using a hyperspectral imaging system. Figure 1 shows pictures of healthy and different disease grades of rice leaves. We used ENVI 5.3 (ITT Visual Information Solutions, Boulder, CO, USA) software for manual segmentation of rice leaves, leaf background and disease areas. The number of pixel points for the whole leaf and the diseased area was calculated, along with the number of diseased pixel points as a percentage of the number of pixel points on the leaf. According to the GBT 15790-2009 Rules of Investigation and Forecast of the Rice Blast, classification was carried out according to the size of the disease spot, as shown in Table 1. Level 5 leaf blast samples were not found in this study; therefore, the criteria for determining level 5 disease are not listed in Table 1.
2.2.2. Hyperspectral Image Acquisition
In this study, a hyperspectral imaging system was used to acquire hyperspectral images of rice leaves, as shown in Figure 2. The main components of the system include a hyperspectral imaging spectrometer (ImSpector V10E, Spectral Imaging Ltd., Oulu, Finland), a high-definition camera (IGV-B1410, Antrim, Northern Ireland), a precision displacement control stage, a light-free dark box, two 150 W fiber optic halogen lamps (Ocean Optics, Dunedin, FL, USA) and a computer. The effective spectral range obtained by this hyperspectral imaging system is 400–1000 nm with a spectral resolution of 0.64 nm. The distance of the camera lens from the surface of the rice leaves was set to 32 cm before acquiring the images. The lens focus was adjusted by using a white paper focusing plate with black stripes until the black stripes were imaged and the transition area between the black stripes and the white paper was clear. In order to obtain the best image quality, the light source intensity and exposure rate were adjusted and the scanning speed was set to 1.1 mm/s.
Due to the problem of inconsistent intensity values of different spatial hyperspectral data caused by the variation of light intensity on the leaf surface and the camera’s dark current, the original hyperspectral images needed to be processed by black-and-white plate correction by using Equation (1) to obtain the final image spectral reflectance:
where is the corrected hyperspectral reflectance of rice leaves, is the spectral reflectance of the original hyperspectral images of rice leaves, and and are the spectral reflectance of the corrected white plate and corrected black plate, respectively. The acquisitions and transmissions of spectral images were completed by using the system’s hyperspectral acquisition software (Isuzu Optics, Hsinchu, China).
2.2.3. Spectra Extraction and Processing
In this study, the whole rice leaf was treated as a separate region of interest (ROI), and ENVI5.3 was used to manually delineate the region of interest and extract its average spectral reflectance. This culminated in 29 health data and 116 disease data (27, 32, 27 and 30 disease data for levels 1, 2, 3 and 4 respectively), for a total of 145 hyperspectral imaging data.
In order to determine the best classification features and classification model for leaf blast, there were two main considerations in this study. Firstly, the leaf blast classification features extracted from the existing data scale are contingent and not universal. Secondly, the constructed leaf blast classification model is not generalizable and is not sufficient for constructing a deep learning model based on big data and calibrated supervision mechanisms. In view of these two considerations, in this study, the data set was divided into a training set and a testing set, and then the data augmentation method proposed by Chen et al. [40] for data augmentation was used. This method augments the data by adding light intensity perturbations and Gaussian noise to the raw spectral data to simulate interference factors such as uneven illumination and instrument noise. The formula is shown in Equation (2):
where is the weight of the control Gaussian noise , alp is the light intensity perturbation factor and is the raw spectral data. Figure 3 shows the effect of data augmentation.
In the end, a total of 986 healthy sample data, 918 level 1 disease data, 1088 level 2 disease data, 918 level 3 disease data and 1020 level 4 disease data were obtained, resulting in a total of 4930 sample data. Figure 3 shows the effect of data augmentation.
2.3. Optimal Spectral Feature Selection
Hyperspectral data are characterized by rich information content, high resolution and band continuity, which can fully reflect the differences in physical structure and chemical composition within the leaf. However, there is still a large amount of redundant information in the spectral information, which affects modeling accuracy. Therefore, hyperspectral data need to be subjected to dimension-reduced processing to extract valid and representative spectral features as model input to improve modeling accuracy. In this study, no new descending dimension methods were proposed or used, but both the successive projections algorithm (SPA) and random frog (RF) methods were used to extract spectral feature wavelengths. This is due to the fact that a wide range of researchers have confirmed that the characteristic wavelengths of SPA and RF screening are representative. At the same time, the SPA and RF methods screen for a smaller number of characteristic wavelengths, making it easy to generalize and use the model. In this study, the SPA and RF methods were used to extract the feature wavelengths of the spectra.
SPA is a forward feature variable dimension reduction method [41]. SPA is able to obtain the combination of variables that contains the least redundant information and the minimum characteristic co-linearity. The algorithm uses projection analysis of vectors to map spectral wavelengths onto other spectral wavelengths in order to compare the magnitude of the mapping vectors and to. obtain the wavelength with the largest projection vector, which is the spectral wavelength to be selected. A multiple linear regression analysis model was then developed to obtain the RMSECV of the modeling set. The number and wavelength corresponding to the smallest RMSECV value in the different subsets of features to be selected consists of the optimal spectral feature wavelength combinations.
RF is a relatively new method of signature variable screening, initially used for gene expression data analysis of diseases [42]. The method uses the Reversible Jump Markov Chain Monte Carlo (RJMCMC) method to transform and sample the dimensions of the spectrum. From there, a Markov chain is modeled in space that conforms to the steady-state distribution to calculate the frequency of selection for each wavelength variable. The selection of frequencies was used as a basis for eliminating redundant variables, resulting in the best spectral characteristic wavelength.
2.4. Texture Features Extraction
Textural features contain important information about the structural tissue arrangement of the leaf spot surface and the association of the spot with its surroundings. Therefore, TFs can reflect the physical characteristics of the crop leaves and information on the growth status of the crop [26]. When leaf blast infects leaves, cell inclusions and cell walls are damaged, the chlorophyll content is reduced and the volume is reduced. This results in a change in color in some areas of the leaf surface and causes changes in textural characteristics.
A gray-level co-occurrence matrix (GLCM) is a common method for extracting texture features on the leaf surface. It reflects the comprehensive information of the image in terms of direction, interval and magnitude of change by calculating the correlation between the gray levels of two points at a certain distance and in a certain direction in the image [43]. At the same time, the energy, entropy, correlation and contrast can better reflect the difference between the diseased and normal parts of the leaf, thus improving the modeling accuracy (energy reflects the degree of gray distribution and texture thickness; entropy is a measure of the amount of information in the image; correlation measures the similarity of images at the gray level in the row or column direction; and contrast reflects the sharpness of the image and the depth of the texture grooves). Hence, in this study, energy, entropy, correlation and contrast were calculated from four directions, namely 0°, 45°, 90° and 135°, at a relative pixel distance d of 1. The formulae for energy, entropy, correlation and contrast are shown in Table 2. The average and standard deviation were calculated for energy, entropy, correlation and contrast in each of the four directions. A total of eight texture features were obtained, specifically the mean value of energy (MEne), the standard deviation of capacity (SdEne), the mean value of entropy (MEnt), the standard deviation of entropy (SdEnt), the mean value of correlation (MCor), the standard deviation of correlation (SDCor), the mean value of contrast (MCon) and the standard deviation of contrast (SDCon).
2.5. Vegetation Index Extraction
VIs are indicators constructed by combining different spectral bands in linear and nonlinear combinations, and they are often used to monitor and discriminate the degree of vegetation disease. In this study, the VIs with the highest correlation of leaf blast disease levels were screened by establishing a contour of the decision coefficient. The method arbitrarily selects two spectral bands in the spectral range to construct a certain spectral index, and then the Pearson correlation coefficient method is used to calculate the correlation between the disease class and the vegetation index to find the vegetation index with a higher classification ability.
Based on previous research results, the ratio spectral index (RSI), the difference spectral index (DSI) and the normalized difference spectral index (NDSI) were used to construct the contour of the decision coefficient. The formula is as follows:
where and denote the spectral reflectance values in the spectral band range.
2.6. Disease Classification Model
Deep Convolutional Neural Network
The human visual system has a powerful ability to classify, monitor and recognize. Therefore, in recent years, a wide range of researchers have been inspired by bio-vision systems to develop advanced data processing methods. Convolutional Neural Networks (CNNs) are deep neural networks developed to emulate biological perceptual mechanisms. The networks are capable of automatically extracting sensitive features at both shallow and deep levels in the data. The Residual Network (ResNet) [44] is a typical representative of CNN, as shown in Figure 4. The residual module (both the direct mapping and residual components) is designed with the idea of the better extraction of data features and to prevent degradation of the network. ResNet is well recognized for its feature extraction and classification in the ILSVRC 2015 competition.
As ResNet has a deeper network hierarchy, it is prone to over-fitting during training. ResNet was initially used mainly in image classification and was not applicable to spectral data. Therefore, this study adapts ResNet to render it suitable for modeling one-dimensional data. Firstly, the data in this study were all one-dimensional, and thus the number of input features was used as the network input, and there was no need to experimentally derive the optimum input layer size. The number of channels in the FC layer of ResNet was also adjusted to 5 for the 5 classification problems of normal, level 1, level 2, level 3 and level 4 diseases of rice leaf blast. ResNet is a DCNN designed for application to large-scale data, and its training process is computationally intensive. The classification problems for different disease classes are smaller in terms of data size and computational effort of training. Therefore, in order to improve the modeling effect of the model, different types of classification networks were designed by adjusting the network depth and structure of ResNet by adding the BatchNorm layer and Dropout layer while maintaining the design concept of ResNet (Figure 5) in order to be applicable to the data obtained from this study. The model in this paper was compared and analyzed with SVM [45], ELM [46], Inception V3 [47], ZF-Net [48], BiGRU [49] and TextCNN [50] models to determine the best leaf blast disease class classification model.
The above DCNN model was built using the deep learning computational framework Keras 2.3 for model building. The hardware environment for the experiments was 32G RAM, Bronze 3204 CPU and Quadro P5000 GPU.
3. Results
3.1. Spectral Response Characteristics of Rice Leaves
As shown in Figure 6, the mean spectral reflectance of healthy rice leaves and disease-susceptible leaves showed a consistent trend. The reflectance at 500~600 and 770~1000 nm changed significantly after rice blast spores infested the leaves. There is a slight increase in the reflectance of diseased leaves in the 500 to 600 nm range. At 700~1000 nm, the reflectance decreases significantly. In the range of 680 to 770 nm, the spectral curves of the different disease degrees were shifted to the short-wave direction compared to the healthy leaf spectral curves, i.e., the phenomenon of “blue shift”. This is due to damage to chloroplasts or other organelles within the leaf caused by the disease and changes in pigment content, resulting in changes in spectral reflectance [51]. The band range between 400 and 450 nm shows severe reflectance overlap, and thus the band range of 450 to 1000 nm was chosen as the main band for spectral feature extraction.
3.2. Optimal Features
3.2.1. Vegetation Indices
Figure 7 shows the contour of the decision coefficient of DSI, RSI and NDSI constituted by any two-band combinations with the leaf disease class. In Figure 7a, the NDSI constructed by the combination of spectral bands from 623 to 700 and 700 to 1000, 556 to 702 and 450 to 623 nm correlated well with the disease levels, and the coefficient of determination R2 was greater than 0.8. Among them, the NDSI vegetation index constructed by the combination of 600 and 609 nm had the best correlation with R2 of 0.8947. Compared with NDSI, RSI correlated better with the disease class in fewer band ranges, mostly concentrated in the visible band range (Figure 7b). The best RSI vegetation index was constructed for the combination of 725 and 675 nm with an R2 of 0.9103. Relatively, the DSI constructed at 548 nm and 698 nm had the highest correlation, with an R2 of 0.800 (Figure 7c).
3.2.2. Extraction of Hyperspectral Features
The spectral data were processed by using the SPA to obtain the characteristic wavelengths of the spectra with high correlation. In this study, a minimum screening number of eight and a maximum screening number of ten were set, and the RMSE was used as the evaluation criterion for selecting the best spectral feature wavelength. Figure 8a shows the eight optimal spectral characteristic wavelengths, and the spectral wavelengths are given in Table 3. The RMSE curve drops sharply as the wavelength changes from 0 to 5 and stabilizes at the eighth wavelength. The final SPA selects eight spectral features at wavelengths evenly distributed in the visible, red-edge and near-infrared regions.
The RF algorithm was used to screen the spectral feature wavelengths, setting the maximum number of potential variables to 6, the initial number of sampled variables to 1000 and the screening threshold to 0.1. Given that the RF algorithm uses RJMCMC as the screening principle, the characteristic bands are slightly different each time they are screened. The RF algorithm was, therefore, run a total of 10 times, and the final average of the results was taken as the basis for the judgment of the characteristic wavelengths. The screening probability results for each spectral characteristic wavelength are shown in Figure 8b. The larger the screening probability, the more important the corresponding spectral feature wavelengths are; thus, the wavelengths with a screening probability greater than 0.1 were selected as the best spectral feature wavelengths (Table 3), with a total of 13 spectral feature wavelengths, accounting for approximately 2.36% of the full wavelength band.
3.2.3. Extraction of Texture Features by GLCM
Since hyperspectral images contain a large amount of redundant information, PCA is used to reduce the dimensionality of hyperspectral images and to generate principal component images containing a large amount of effective information. The cumulative contribution of the first three principal component images (PC1–PC3) was greater than 95% and, therefore, was used to extract texture features. Figure 9 shows the principal component images of healthy and diseased leaves after dimensionality reduction by PCA.
The GLCM was used to calculate the PC1-PC3 images separately to obtain eight features such as the means and standard deviations of the energy, entropy, contrast and correlation. In order to further improve the modeling accuracy, redundant texture features were removed. Eight texture features were subjected to Pearson correlation analysis with different disease classes to screen the significantly correlated and highly significantly correlated texture features, and the correlation coefficients and significance are shown in Table 4. The correlation and significance variation between the eight characteristics and the different disease classes can be observed in Table 4. Among them, MEne, SDEne, MEnt, SDEnt, MCon, SDCon and Mcor displayed highly significant correlations, while SDCor displayed a lower correlation. Therefore, in this study, seven highly significant features such as MEne were chosen as the final texture features to be modeled.
3.3. Sensitivity Analysis of the Number of Convolutional Layers and Convolutional Kernel Size for the DCNN
Figure 10 shows a comparison of the accuracy of the convolutional layers for different input features in the proposed model. From the figure, it can be observed that the DCNN constructed based on the features obtained from SPA, RF, TFs, SPA + TFs and RF + TFs achieved the best classification accuracy when the number of convolutional layers in the residual block was two. For Vis, Vis + TFs, the DCNN achieved the best classification results when the number of convolution layers was three.
Based on the optimal number of convolutional layers, we investigated the effect of different sizes of convolutional kernels on the classification accuracy through a set of experiments. Figure 11 shows a comparison of the accuracy of the models built with different sizes of convolutional kernels. When the convolutional kernel size was (3,3), the DCNN models constructed from features screened by SPA, RF, TFs, SPA + TFs and RF + TFs were better for classification. Meanwhile, the DCNN models constructed with VIs and Vis + TFs had the best classification accuracy when the convolutional kernel size was (1,3,3).
3.4. DCNN-Based Disease Classification of Rice Leaf Blast
3.4.1. DCNN Model Training and Analysis
The modeling was carried out using 4930 rice leaf blast data obtained for different disease classes as samples (including data obtained by data augmentation methods), where the training set, validation set and test set were divided according to 7:1:2. The relevant training experiments were carried out for the seven DCNN models with different dimensionality reduction methods in Figure 4. The overall accuracy (OA), Kappa coefficient and F1-score were selected as the model evaluation criteria for the experiment. In order to train the DCNN model, the Nadam algorithm [52] was used. The same learning rate was used for all layers in the network, with an initial learning rate of 0.002 and exponential decay rates of 0.9 and 0.999 for the first and second orders, respectively. The initialization of the weights has a large impact on the convergence speed of the model training. In this study, a normal distribution with a mean of 0 and a standard deviation of 0.01 was used to initialize the weights of all layers of the network, and the bias of the convolutional layer and the full connection was initialized to 0. In order to determine the best disease classification features and classification models, each DCNN model was fully trained. The epochs for SPA-DCNN, RF-DCNN, VIs-DCNN, TFs-DCNN, SPA + TFs-DCNN, RF + TFs-DCNN and Vis + TFs-DCNN were 200, 180, 300, 150, 150, 150 and 250. The training results of different DCNN models are shown in Figure 12.
As can be observed from Figure 12, the training error of all DCNN models gradually decreases as the number of iterations increases and finally reaches a state of convergence. At the beginning of the training period, the training loss decreases rapidly by updating the gradient of the loss function with small batches of samples. This shows that batch_size and the optimization algorithm play a better role. In addition, as the training loss decreases, the prediction accuracy of the model for the training set shows an overall upward trend.
3.4.2. DCNN Model Testing and Analysis
In order to obtain the best leaf blast classification features, spectral features, vegetation indices, texture features (TFs) and their fusion features were used to construct the DCNN leaf blast classification model. The modeling results are shown in Table 5.
The data in Table 5 show that all seven DCNN models designed based on different characteristics have high classification accuracy with OA greater than 88% and Kappa coefficients greater than 85% for different disease degree classification. In the DCNN model constructed with a single feature, better classification results were obtained for the feature wavelengths selected by the SPA and RF methods, with OA and Kappa reaching 97.67% and 96.75% and 97.08% and 95.93%, respectively. In the DCNN model constructed based on TFs, although the model constructed was not as accurate as the spectral feature wavelength model, it still achieved better classification results, indicating that the image data also had the ability to identify rice leaf blast. Among the DCNN models constructed by fusing features, SPA + TFs-DCNN obtained the highest classification accuracy, with OA and Kappa of 98.58% and 98.22%, respectively. The F1-scores of SPA + TFs-DCNN are greater than those of the other fusion features for the identification of specific different disease classes. The F1-scores for Level 0, Level 1, Level 2, Level 3 and Level 4 were 100%, 100%, 100%, 96.48% and 96.68%, respectively. This result shows that the fusion of spectral wavelengths and textural features screened by SPA can more accurately represent valid information about the different disease levels in rice.
3.4.3. Comparison with Other Classification Models
The model in this paper was analyzed and compared with six classification models, namely Inception V3, ZF-Net, BiGRU, TextCNN, SVM and ELM. The classification results of the six models are shown in Table 6.
As can be observed from Table 6, all six models achieved good accuracy in disease classification. The model constructed by fusing spectral wavelengths and texture features screened by SPA as input quantities has the best classification accuracy, with OA and Kappa of greater than 90% and 88%, respectively. In addition, for the identification of the different disease classes, F1-score were greater than 84% for levels 0, 2 and 4 and greater than 82% for levels 1 and 3 (shown in Appendix Table A1, Table A2 and Table A3). In addition, the experimental results of the models simultaneously show that the fusion of spectral feature wavelengths with texture features can enhance the classification of the models. Compared to machine learning models (SVM and ELM), the OA, Kappa and F1-scores of the models in this paper are significantly improved. In particular, OA and Kappa improved by 3.04% and 3.81%, respectively, compared to the SPA + TFs-SVM model. Compared to the SPA + TFs-ELM model, OA and Kappa improved by 6.91% and 8.63%, respectively. In comparison with the other four deep learning models, it can be observed that the classification accuracy of ZF-Net, Inception V3, TextCNN and BiGRU is lower than that of the present model. The classification results of ZF-Net, Inception V3, TextCNN and BiGRU for one-dimensional disease data were not very different, all with the best models constructed with features obtained from SPA + TFs (OA > 97%, Kappa > 96%). In view of this, it is evident from the comparative analysis of different input features and different modeling methods that the fusion of spectral features wavelength and texture features extracted by SPA is the best feature for leaf blast classification. At the same time, the DCNN model proposed in this paper has the best accuracy in classifying disease classes.
We performed a comparative analysis of the performance of the models constructed based on the best classification features (SPA + TFs) using the OA and test time, as shown in Table 7. As can be observed from Table 7, the deep learning model took significantly more time than the machine learning model on the 986 test datasets. However, the machine learning model is insufficient in OA. In the performance comparison of the deep learning models, it was found that the convolutional neural network took significantly less time than the recurrent neural network (BiGRU), which may be due to the fact that BiGRU is trained in a fully connected manner and requires more parameters. In comparison with DCNN models such as Inception V3, ZF-Net and TextCNN, our proposed model has the highest classification accuracy and the shortest testing time. On 986 test data, disease classification took only 0.22 s. Therefore, our proposed DCNN model has the best classification performance.
4. Discussion
At present, the identification and disease degree classification of rice blast is mainly carried out through the subjective judgment of plant protection personnel, with high professional ability but low efficiency of detection. Hyperspectral imaging technology is a highly promising disease detection technology that has attracted the interest of scholars because of its non-destructive, fast and accurate characteristics [53,54].
This study first pre-processed the hyperspectral imaging data to extract rice leaf samples of different disease classes and increased the number of samples by data augmentation methods. Secondly, in order to reduce the dimensionality of hyperspectral data, methods such as SPA, RF, the contour of decision coefficient and GLCM were used to screen spectral features, vegetation indices and texture features. Finally, deep learning and machine learning methods were used to construct rice leaf blast classification models and to determine the best classification features and classification models for leaf blast.
When a crop is infested with a disease, it results in changes in a range of physiological parameters of rice, such as chlorophyll content, water content and cell structure [55]. The changes in these physiological parameters are reflected both in the spectral reflectance curves and in the crop image features, as shown in Figure 2 and Figure 3. When rice leaves were infested with leaf blast, the leaf blast level showed a correlation with the change in the mean spectral curve. In the visible wavelength range, the spectral reflectance appeared slightly increased, which was due to the rhombus-shaped lesions on the leaf cells infested with magnaporthe grisea, which reduced the cytochrome content and activity and weakened the absorption of light. At the same time, as the chlorophyll content decreased, the absorption band narrowed and the red edge (680~770 nm) shifted to the short-wave direction, resulting in a “blue shift” phenomenon. There was a greater correlation between 770~1000 nm and the internal structure of the leaves. Compared to healthy leaves, the cell layer inside the diseased leaves was reduced and the spectral reflectance decreased [51]. The above phenomenon, therefore, provides some basis for research to obtain graded characteristics of leaf blast.
In this work, the focus was on the use of hyperspectral imaging data to determine the best classification features and classification models for leaf blast. In terms of data dimensionality reduction, this study used the SPA and RF methods to screen the spectral feature wavelengths, and 8 and 13 feature wavelengths were obtained, respectively, as shown in Table 4. The contour of the decision coefficient method was used to extract the three best vegetation indices with R2 all greater than 0.8. The seven best texture features were also selected by combining GLCM and rank correlation analysis, as shown in Table 5. In DCNN modeling, the network depth, number and size of convolutions of the DCNN model can seriously affect its performance [56]. Therefore, we borrowed the design concept of ResNet and adjusted the network depth and convolutional layer parameters of ResNet through multiple tests to determine the best model structure. BatchNorm and Dropout layers were also added to avoid overfitting and to ensure accuracy. We constructed seven DCNN-based rice blast classification models based on different input features. The results show that all seven DCNN models designed based on different features have high classification accuracy, with OA greater than 88% and Kappa coefficient greater than 85%. The reason for this may be due to the fact that DCNN uses the ResNet model design concept as a reference and adopts a “shortcut” structure. This structure enables the inclusion of the full information of the previous layer of data in each residual module, preserving more of the original information to some extent. At the same time, the data augmentation method was used to increase the quantity of sample data and improve the diversity of the samples, further enhancing the generalization capability of the model. In comparing the DCNN models constructed with different features, the DCNN models constructed based on fused features all achieved high classification accuracy. The highest classification accuracy was obtained for SPA + TFs-DCNN, with OA and Kappa of 98.58% and 98.22%, respectively. All had high classification accuracy in the identification of detailed disease classes, with F1-scores of 100%, 100%, 100%, 96.48% and 96.68% for levels 0, 1, 2, 3 and 4, respectively. This suggests that the fusion of spectral and texture features to construct a classification model has the ability to improve the accuracy of model classification. This is consistent with previous studies [57].
In order to further determine the best classification features and classification model, the model in this paper was compared and analyzed with Inception V3, ZF-Net, BiGRU, TextCNN, SVM and ELM models. In the SVM and ELM modeling results, it was shown that the SPA screened feature wavelengths combined with TFs constructed the model with the best classification accuracy. Compared with the DCNN classification model, the OA, Kappa and F1-score of both the SVM and ELM classification models were significantly lower than those of the DCNN model. The reason for this may be that the convolutional layer of DCNN is able to further extract disease features and obtain significant differences between different diseases, thus improving model accuracy. The classification accuracy results of ZF-Net, Inception V3, TextCNN and BiGRU are all lower than the results of the model in this paper, as can be observed in the modeling results of the deep learning methods. This may be due to the fact that the model in this paper uses the shortcut structure of ResNet to retain more of the fine-grained features between diseases. Models such as Inception V3, on the other hand, gradually ignores fine-grained features and retain coarse-grained features as the number of iterations increases. In the case of intra-class classification problems, fine-grained features are the key to achieving higher accuracy.
Therefore, in this study, it is concluded from the comparative analysis of different input features and different modeling methods that the DCNN model constructed based on the fused features of feature wavelength and texture features acquired by SPA has the highest classification accuracy. It can realize the accurate classification of the severity of rice leaf blight and provides some technical support for the next step of UAV hyperspectral remote sensing monitoring of rice leaf blasts. It is worth noting that only rice leaf blast was modeled and analyzed in this study, and no other leaf diseases of rice were studied. Therefore, future research work will further explore the best classification features for different rice diseases and establish a more representative, generalized and comprehensive disease classification model.
5. Conclusions
Leaf blast, a typical disease of rice, has major impacts on the yield and quality of grain. In this study, an indoor hyperspectral imaging system was used to acquire hyperspectral images of leaves. With limited hyperspectral data, data augmentation was performed by drawing on data augmentation methods from existing studies to augment the sample data from 145 to 4930. Then, spectral features, vegetation indices and texture features were extracted based on the augmented hyperspectral images. The above features and their fusion features were used to construct leaf blast classification models. The results showed that the model constructed based on fused features was significantly better than the model constructed based on single feature variables in terms of accuracy in the classification of the degree of leaf blast disease. The best performance was achieved by combining the SPA screened spectral features (450, 543, 679, 693, 714, 757, 972 and 985 nm) with textural features (MEne, SDEne, MEnt, SDEnt, MCon, SDCon and MCor). The modeling results also showed that the proposed DCNN model provided better classification performance in disease classification compared to traditional machine learning models (SVM and ELM), with an improvement of 3.04% and 6.91% in OA and 3.81% and 8.63% in Kappa, respectively. Compared to deep learning models such as Inception V3, ZF-Net, BiGRU and TextCNN, this model also has the best classification accuracy. In comparison to ZF-Net and TextCNN, both OA and Kappa improved by 0.81% and 1.02%. OA and Kappa improved by 1.52% and 1.22% and 1.9% and 1.52%, respectively, compared to Inception V3 and BiGRU. Therefore, this study confirms the great potential of the proposed one-dimensional deep convolutional neural network model for applications in disease classification. The best fusion features identified in this study can further improve the modeling accuracy of the disease classification model. In addition, in the next study, we will further explore the classification features of rice diseases such as sheath blight and bacterial blight to establish a more stable, accurate and comprehensive disease classification model.
Appendix A

Table A1.
F1-score for the SVM and ELM models.
| Methods | SVM - F1-Score /% | ELM - F1-Score /% | ||||||||
|---|---|---|---|---|---|---|---|---|---|---|
| Level 0 | Level 1 | Level 2 | Level 3 | Level 4 | Level 0 | Level 1 | Level 2 | Level 3 | Level 4 | |
| SPA | 100.00 | 92.93 | 90.41 | 87.89 | 95.81 | 97.53 | 88.64 | 87.31 | 83.96 | 92.46 |
| RF | 100.00 | 89.80 | 88.84 | 86.39 | 91.26 | 100 | 88.45 | 83.25 | 89.26 | 95.90 |
| VIs | 93.30 | 81.91 | 86.61 | 80.10 | 87.39 | 98.64 | 82.64 | 74.47 | 72.04 | 90.39 |
| TFs | 86.93 | 84.48 | 89.85 | 87.75 | 91.77 | 76.55 | 70.25 | 88.79 | 80.00 | 93.75 |
| SPA+TFs | 98.77 | 94.49 | 95.88 | 93.97 | 95.10 | 97.41 | 88.76 | 86.44 | 87.19 | 97.94 |
| RF+TFs | 97.03 | 90.03 | 93.56 | 93.64 | 96.90 | 97.94 | 88.69 | 86.55 | 86.17 | 95.77 |
| VIs+TFs | 95.93 | 79.58 | 78.99 | 64.09 | 83.25 | 95.81 | 66.09 | 67.29 | 65.35 | 80.98 |
Table A2.
F1-score for the Inception V3 and ZF-Net models.
| Methods | Inception V3 - F1-Score /% | ZF-Net - F1-Score /% | ||||||||
|---|---|---|---|---|---|---|---|---|---|---|
| Level 0 | Level 1 | Level 2 | Level 3 | Level 4 | Level 0 | Level 1 | Level 2 | Level 3 | Level 4 | |
| SPA | 100 | 94.43 | 94.54 | 93.01 | 94.39 | 100 | 96.61 | 89.74 | 87.61 | 97.04 |
| RF | 99.10 | 98.21 | 84.04 | 83.46 | 94.12 | 99.55 | 97.41 | 95.80 | 93.51 | 96.16 |
| VIs | 97.40 | 82.39 | 81.35 | 79.78 | 92.42 | 96.91 | 85.71 | 94.99 | 79.64 | 88.79 |
| TFs | 95.24 | 84.52 | 88.79 | 85.99 | 89.72 | 98.46 | 93.11 | 89.72 | 87.34 | 92.38 |
| SPA+TFs | 98.20 | 97.28 | 97.40 | 94.85 | 97.51 | 99.00 | 98.76 | 98.40 | 95.36 | 97.41 |
| RF+TFs | 97.16 | 94.64 | 96.88 | 91.91 | 95.77 | 98.06 | 96.59 | 96.28 | 92.71 | 96.07 |
| VIs+TFs | 96.06 | 73.19 | 76.14 | 73.94 | 90.75 | 96.52 | 83.12 | 80.57 | 77.68 | 91.13 |
Table A3.
F1-score for the BiGRU and TextCNN models.
| Methods | BiGRU - F1-Score /% | TextCNN - F1-Score /% | ||||||||
|---|---|---|---|---|---|---|---|---|---|---|
| Level 0 | Level 1 | Level 2 | Level 3 | Level 4 | Level 0 | Level 1 | Level 2 | Level 3 | Level 4 | |
| SPA | 100 | 94.94 | 93.43 | 95.82 | 98.50 | 100 | 94.22 | 92.02 | 93.82 | 97.99 |
| RF | 100 | 93.77 | 92.60 | 89.33 | 94.69 | 99.10 | 87.58 | 88.21 | 75.47 | 90.28 |
| VIs | 96.91 | 85.94 | 83.73 | 82.97 | 92.86 | 96.91 | 80.57 | 77.43 | 77.64 | 87.40 |
| TFs | 89.69 | 91.45 | 94.25 | 85.79 | 88.41 | 93.11 | 80.79 | 87.29 | 92.31 | 98.37 |
| SPA+TFs | 100 | 99.07 | 96.68 | 94.21 | 97.24 | 100 | 98.79 | 97.88 | 95.31 | 97.03 |
| RF+TFs | 96.06 | 95.58 | 98.13 | 94.95 | 96.73 | 97.22 | 94.74 | 96.31 | 93.26 | 95.85 |
| VIs+TFs | 95.51 | 73.90 | 74.44 | 73.04 | 89.45 | 96.61 | 8032 | 81.34 | 73.23 | 87.62 |
Author Contributions
Conceptualization, S.F., Y.C., T.X. and G.Z.; methodology, S.F.; software, S.F.; validation, S.F., F.Y., G.Z. and D.Z.; formal analysis, S.F. and T.X.; investigation, S.F.; resources, S.F. and G.Z.; data curation, S.F., G.Z. and D.Z.; writing—original draft preparation, S.F.; writing—review and editing, S.F. and T.X.; visualization, S.F.; supervision, T.X.; project administration, T.X.; funding acquisition, T.X. All authors have read and agreed to the published version of the manuscript.
Funding
This work was supported by the Liaoning Provincial Key R&D Program Project (2019JH2/10200002).
Institutional Review Board Statement
Not applicable.
Informed Consent Statement
Informed consent was obtained from all subjects involved in the study.
Data Availability Statement
Data sharing is not applicable to this article.
Conflicts of Interest
The authors declare no conflict of interest.
References
- Srivastava, D.; Shamim, M.; Kumar, M.; Mishra, A.; Pandey, P.; Kumar, D.; Yadav, P.; Siddiqui, M.H.; Singh, K.N. Current Status of Conventional and Molecular Interventions for Blast Resistance in Rice. Rice Sci. 2017, 24, 299–321. [Google Scholar] [CrossRef]
- Deutsch, C.A.; Tewksbury, J.J.; Tigchelaar, M.; Battisti, D.S.; Merrill, S.C.; Huey, R.B.; Naylor, R.L. Increase in crop losses to insect pests in a warming climate. Science 2018, 361, 916–919. [Google Scholar] [CrossRef] [PubMed] [Green Version]
- Huang, W.; Shi, Y.; Dong, Y.; Ye, H.; Wu, M.; Cui, B.; Liu, L. Progress and prospects of crop diseases and pests monitoring by remote sensing. Smart Agric. 2019, 1, 1–11. [Google Scholar]
- Akintayo, A.; Tylka, G.L.; Singh, A.K.; Ganapathysubramanian, B.; Singh, A.; Sarkar, S. A deep learning framework to discern and count microscopic nematode eggs. Sci. Rep. 2018, 8, 9145. [Google Scholar] [CrossRef] [PubMed]
- Bock, C.H.; Poole, G.H.; Parker, P.E.; Gottwald, T.R. Plant Disease Severity Estimated Visually, by Digital Photography and Image Analysis, and by Hyperspectral Imaging. Crit. Rev. Plant Sci. 2010, 29, 59–107. [Google Scholar] [CrossRef]
- Naik, H.S.; Zhang, J.; Lofquist, A.; Assefa, T.; Sarkar, S.; Ackerman, D.; Singh, A.; Singh, A.K.; Ganapathysubramanian, B. A real-time phenotyping framework using machine learning for plant stress severity rating in soybean. Plant Methods 2017, 13, 23. [Google Scholar] [CrossRef] [Green Version]
- Zhang, J.; Naik, H.S.; Assefa, T.; Sarkar, S.; Reddy, R.V.C.; Singh, A.; Ganapathysubramanian, B.; Singh, A.K. Computer vision and machine learning for robust phenotyping in genome-wide studies. Sci. Rep. 2017, 7, srep44048. [Google Scholar] [CrossRef]
- Zheng, Z.; Qi, L.; Ma, X.; Zhu, X.; Wang, W. Grading method of rice leaf blast using hyperspectral imaging technology. Trans. Chin. Soc. Agric. Eng. 2013, 29, 138–144. [Google Scholar]
- Asibi, A.E.; Chai, Q.; Coulter, J.A. Rice Blast: A Disease with Implications for Global Food Security. Agronomy 2019, 9, 451. [Google Scholar] [CrossRef] [Green Version]
- Larijani, M.R.; Asli-Ardeh, E.A.; Kozegar, E.; Loni, R. Evaluation of image processing technique in identifying rice blast disease in field conditions based on KNN algorithm improvement by K-means. Food Sci. Nutr. 2019, 7, 3922–3930. [Google Scholar] [CrossRef]
- Zarbafi, S.S.; Rabiei, B.; Ebadi, A.A.; Ham, J.H. Statistical analysis of phenotypic traits of rice (Oryza sativa L.) related to grain yield under neck blast disease. J. Plant Dis. Prot. 2019, 126, 293–306. [Google Scholar] [CrossRef]
- Bastiaans, L. Effects of leaf blast on photosynthesis of rice. 1. Leaf photosynthesis. Eur. J. Plant Pathol. 1993, 99, 197–203. [Google Scholar] [CrossRef] [Green Version]
- Nabina, N.; Kiran, B. A Review of Blast Disease of Rice in Nepal. J. Plant Pathol. Microbiol. 2021, 12, 1–5. [Google Scholar]
- Gowen, A.; O'Donnell, C.; Cullen, P.; Downey, G.; Frias, J. Hyperspectral imaging—An emerging process analytical tool for food quality and safety control. Trends Food Sci. Technol. 2007, 18, 590–598. [Google Scholar] [CrossRef]
- Feng, L.; Chai, R.-Y.; Sun, G.-M.; Wu, D.; Lou, B.-G.; He, Y. Identification and classification of rice leaf blast based on multi-spectral imaging sensor. Spectrosc. Spectr. Anal. 2009, 29, 2730–2733. [Google Scholar]
- Qi, L.; Ma, X.; Liao, X.-L. Rice bast resistance identification based on multi-spectral computer vision. J. Jilin Univ. Eng. Technol. Ed. 2009, 39, 356–359. [Google Scholar]
- Feng, L.; Wu, B.; Zhu, S.; Wang, J.; Su, Z.; Liu, F.; He, Y.; Zhang, C. Investigation on Data Fusion of Multisource Spectral Data for Rice Leaf Diseases Identification Using Machine Learning Methods. Front. Plant Sci. 2020, 11, 1664. [Google Scholar] [CrossRef]
- Wu, D.; Cao, F.; Zhang, H.; Sun, G.-M.; Feng, L.; He, Y. Study on disease level classification of rice panicle blast based on visible and near infrared spectroscopy. Spectrosc. Spectr. Anal. 2009, 29, 3295–3299. [Google Scholar]
- Barreto, A.; Paulus, S.; Varrelmann, M.; Mahlein, A.-K. Hyperspectral imaging of symptoms induced by Rhizoctonia solani in sugar beet: Comparison of input data and different machine learning algorithms. J. Plant Dis. Prot. 2020, 127, 441–451. [Google Scholar] [CrossRef]
- Abdulridha, J.; Ampatzidis, Y.; Roberts, P.; Kakarla, S.C. Detecting powdery mildew disease in squash at different stages using UAV-based hyperspectral imaging and artificial intelligence. Biosyst. Eng. 2020, 197, 135–148. [Google Scholar] [CrossRef]
- Fajardo, J.U.; Andrade, O.B.; Bonilla, R.C.; Cevallos-Cevallos, J.; Mariduena-Zavala, M.; Donoso, D.O.; Villardón, J.L.V. Early detection of black Sigatoka in banana leaves using hyperspectral images. Appl. Plant Sci. 2020, 8, e11383. [Google Scholar] [CrossRef]
- Bagheri, N.; Monavar, H.M.; Azizi, A.; Ghasemi, A. Detection of Fire Blight disease in pear trees by hyperspectral data. Eur. J. Remote Sens. 2017, 51, 1–10. [Google Scholar] [CrossRef] [Green Version]
- Liu, Z.-Y.; Wu, H.-F.; Huang, J. Application of neural networks to discriminate fungal infection levels in rice panicles using hyperspectral reflectance and principal components analysis. Comput. Electron. Agric. 2010, 72, 99–106. [Google Scholar] [CrossRef]
- Zhang, G.; Xu, T.; Tian, Y.; Xu, H.; Song, J.; Lan, Y. Assessment of rice leaf blast severity using hyperspectral imaging during late vegetative growth. Australas. Plant Pathol. 2020, 49, 571–578. [Google Scholar] [CrossRef]
- Guo, A.; Huang, W.; Ye, H.; Dong, Y.; Ma, H.; Ren, Y.; Ruan, C. Identification of Wheat Yellow Rust Using Spectral and Texture Features of Hyperspectral Images. Remote Sens. 2020, 12, 1419. [Google Scholar] [CrossRef]
- Luo, Y.-H.; Jiang, P.; Xie, K.; Wang, F.-J. Research on optimal predicting model for the grading detection of rice blast. Opt. Rev. 2019, 26, 118–123. [Google Scholar] [CrossRef]
- Lu, B.; Jun, S.; Ning, Y.; Xiaohong, W.; Xin, Z. Identification of tea white star disease and anthrax based on hyperspectral image information. J. Food Process. Eng. 2020, 44, e13584. [Google Scholar] [CrossRef]
- Kang, L.; Yuan, J.Q.; Gao, R.; Kong, Q.M.; Jia, Y.J.; Su, Z.B. Early Identification of Rice Leaf Blast Based on Hyperspectral Imaging. Spectrosc. Spectr. Anal. 2021, 41, 898–902. [Google Scholar]
- Knauer, U.; Matros, A.; Petrovic, T.; Zanker, T.; Scott, E.S.; Seiffert, U. Improved classification accuracy of powdery mildew infection levels of wine grapes by spatial-spectral analysis of hyperspectral images. Plant Methods 2017, 13, 47. [Google Scholar] [CrossRef] [PubMed]
- Nagasubramanian, K.; Jones, S.; Sarkar, S.; Singh, A.K.; Singh, A.; Ganapathysubramanian, B. Hyperspectral band selection using genetic algorithm and support vector machines for early identification of charcoal rot disease in soybean stems. Plant Methods 2018, 14, 86. [Google Scholar] [CrossRef] [PubMed]
- Nettleton, D.F.; Katsantonis, D.; Kalaitzidis, A.; Sarafijanovic-Djukic, N.; Puigdollers, P.; Confalonieri, R. Predicting rice blast disease: Machine learning versus process-based models. BMC Bioinform. 2019, 20, 514–516. [Google Scholar] [CrossRef]
- Jia, D.; Chen, P. Effect of Low-altitude UAV Image Resolution on Inversion of Winter Wheat Nitrogen Concentration. Nongye Jixie Xuebao/Trans. Chin. Soc. Agric. Mach. 2020, 51, 164–169. [Google Scholar]
- Zhang, D.; Chen, G.; Zhang, H.; Jin, N.; Gu, C.; Weng, S.; Wang, Q.; Chen, Y. Integration of spectroscopy and image for identifying fusarium damage in wheat kernels. Spectrochim. Acta Part A Mol. Biomol. Spectrosc. 2020, 236, 118344. [Google Scholar] [CrossRef] [PubMed]
- Al-Saddik, H.; Laybros, A.; Billiot, B.; Cointault, F. Using Image Texture and Spectral Reflectance Analysis to Detect Yellowness and Esca in Grapevines at Leaf-Level. Remote Sens. 2018, 10, 618. [Google Scholar] [CrossRef] [Green Version]
- Zhang, D.-Y.; Chen, G.; Yin, X.; Hu, R.-J.; Gu, C.-Y.; Pan, Z.-G.; Zhou, X.-G.; Chen, Y. Integrating spectral and image data to detect Fusarium head blight of wheat. Comput. Electron. Agric. 2020, 175, 105588. [Google Scholar] [CrossRef]
- Zhu, H.; Chu, B.; Zhang, C.; Liu, F.; Jiang, L.; He, Y. Hyperspectral Imaging for Presymptomatic Detection of Tobacco Disease with Successive Projections Algorithm and Machine-learning Classifiers. Sci. Rep. 2017, 7, 4125. [Google Scholar] [CrossRef] [Green Version]
- Nagasubramanian, K.; Jones, S.; Singh, A.K.; Sarkar, S.; Singh, A.; Ganapathysubramanian, B. Plant disease identification using explainable 3D deep learning on hyperspectral images. Plant Methods 2019, 15, 1–10. [Google Scholar] [CrossRef] [PubMed]
- Huang, S.; Sun, C.; Qi, L.; Ma, X.; Wang, W. Rice panicle blast identification method based on deep convolution neural network. Trans. Chin. Soc. Agric. Eng. 2017, 33, 169–176. [Google Scholar]
- Zhang, X.; Han, L.; Dong, Y.; Shi, Y.; Huang, W.; Han, L.; González-Moreno, P.; Ma, H.; Ye, H.; Sobeih, T. A Deep Learning-Based Approach for Automated Yellow Rust Disease Detection from High-Resolution Hyperspectral UAV Images. Remote Sens. 2019, 11, 1554. [Google Scholar] [CrossRef] [Green Version]
- Chen, Y.; Jiang, H.; Li, C.; Jia, X.; Ghamisi, P. Deep Feature Extraction and Classification of Hyperspectral Images Based on Convolutional Neural Networks. IEEE Trans. Geosci. Remote Sens. 2016, 54, 6232–6251. [Google Scholar] [CrossRef] [Green Version]
- Araujo, M.; Saldanha, T.C.B.; Galvão, R.K.H.; Yoneyama, T.; Chame, H.C.; Visani, V. The successive projections algorithm for variable selection in spectroscopic multicomponent analysis. Chemom. Intell. Lab. Syst. 2001, 57, 65–73. [Google Scholar] [CrossRef]
- Li, H.-D.; Xu, Q.-S.; Liang, Y.-Z. Random frog: An efficient reversible jump Markov Chain Monte Carlo-like approach for variable selection with applications to gene selection and disease classification. Anal. Chim. Acta 2012, 740, 20–26. [Google Scholar] [CrossRef]
- Haralick, R.M.; Shanmugam, K.; Dinstein, I. Textural Features for Image Classification. IEEE Trans. Syst. Man Cybern. 1973, SMC-3, 610–621. [Google Scholar] [CrossRef] [Green Version]
- He, K.; Zhang, X.; Ren, S.; Sun, J. Deep residual learning for image recognition. In Proceedings of the 29th IEEE Conference on Computer Vision and Pattern Recognition (CVPR 2016), Las Vegas, NV, USA, 26 June —1 July 2016; pp. 770–778. [Google Scholar]
- Xia, J.; Chanussot, J.; Du, P.; He, X. Rotation-Based Support Vector Machine Ensemble in Classification of Hyperspectral Data With Limited Training Samples. IEEE Trans. Geosci. Remote Sens. 2016, 54, 1519–1531. [Google Scholar] [CrossRef]
- Huang, G.-B.; Zhu, Q.-Y.; Siew, C.-K. Extreme learning machine: Theory and applications. Neurocomputing 2006, 70, 489–501. [Google Scholar] [CrossRef]
- Christian, S.; Vincent, V.; Sergey, L.; Jonathon, S.; Zbigniew, W. Rethinking the inception architecture for computer vision. arXiv 2015, arXiv:1512.00567. [Google Scholar]
- Matthew, D.Z.; Rob, F. Visualizing and understanding convolutional networks. arXiv 2013, arXiv:1311.2901. [Google Scholar]
- Chuang, J.Y.; Gulcehre, C.; Cho, K.; Bengio, Y. Empirical evaluation of gated recurrent neural networks on sequence modeling. arXiv 2014, arXiv:1412.3555. [Google Scholar]
- Kim, Y. Convolutional Neural Networks for Sentence Classification. Assoc. Comput. Linguist. 2014, 13, 1746–1751. [Google Scholar]
- Zhang, J.; Huang, Y.; Pu, R.; González-Moreno, P.; Yuan, L.; Wu, K.; Huang, W. Monitoring plant diseases and pests through remote sensing technology: A review. Comput. Electron. Agric. 2019, 165, 104943. [Google Scholar] [CrossRef]
- Le, T.T.H.; Kim, J.; Kim, H. An Effective Intrusion Detection Classifier Using Long Short-Term Memory with Gradient Descent Optimization. In Proceedings of the 2017 International Conference on Platform Technology and Service, IEEE 2017, Busan, Korea, 13–15 February 2017; pp. 155–160. [Google Scholar]
- Behmann, J.; Bohnenkamp, D.; Paulus, S.; Mahlein, A.-K. Spatial Referencing of Hyperspectral Images for Tracing of Plant Disease Symptoms. J. Imaging 2018, 4, 143. [Google Scholar] [CrossRef] [Green Version]
- Chen, B.; Wang, G.; Liu, J.-D.; Ma, Z.-H.; Wang, J.; Li, T.-N. Extraction of Photosynthetic Parameters of Cotton Leaves under Disease Stress by Hyperspectral Remote Sensing. Spectrosc. Spectr. Anal. 2018, 38, 1834–1838. [Google Scholar]
- Ma, H.; Huang, W.; Jing, Y.; Pignatti, S.; Laneve, G.; Dong, Y.; Ye, H.; Liu, L.; Guo, A.; Jiang, J. Identification of Fusarium Head Blight in Winter Wheat Ears Using Continuous Wavelet Analysis. Sensors 2019, 20, 20. [Google Scholar] [CrossRef] [PubMed] [Green Version]
- Zhou, Y.C.; Xu, T.Y.; Zheng, W.; Deng, H.B. Classification and recognition approaches of tomato main organs based on DCNN. Trans. Chin. Soc. Agric. Eng. 2017, 33, 219–226. [Google Scholar]
- Huang, L.; Li, T.; Ding, C.; Zhao, J.; Zhang, D.; Yang, G. Diagnosis of the Severity of Fusarium Head Blight of Wheat Ears on the Basis of Image and Spectral Feature Fusion. Sensors 2020, 20, 2887. [Google Scholar] [CrossRef] [PubMed]
Figure 1.
Healthy and different disease levels of rice leaves.
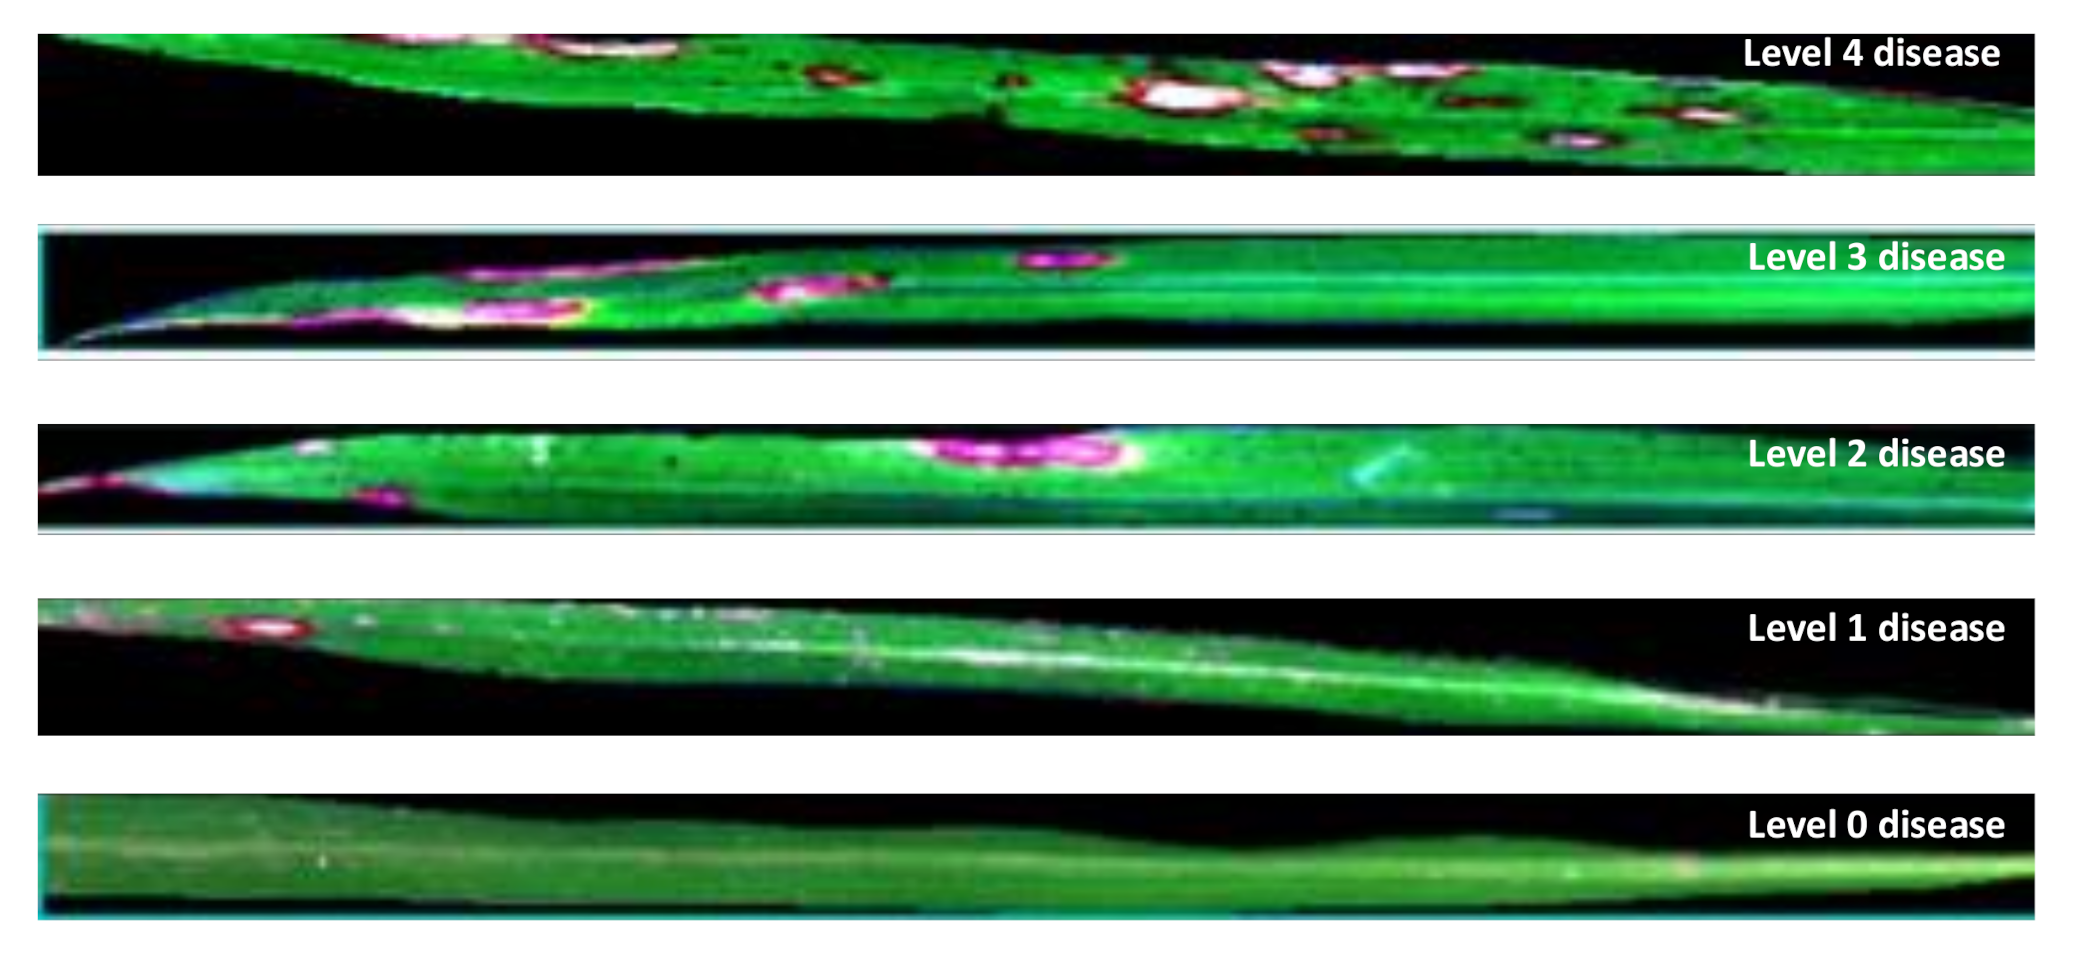
Figure 2.
Hyperspectral imaging system: (1) EMCCD HD camera; (2) hyperspectral imaging spectrometer; (3) lens; (4) light source controller; (5) light source; (6) computer; (7) displacement stage; (8) displacement stage controller.
Figure 2.
Hyperspectral imaging system: (1) EMCCD HD camera; (2) hyperspectral imaging spectrometer; (3) lens; (4) light source controller; (5) light source; (6) computer; (7) displacement stage; (8) displacement stage controller.
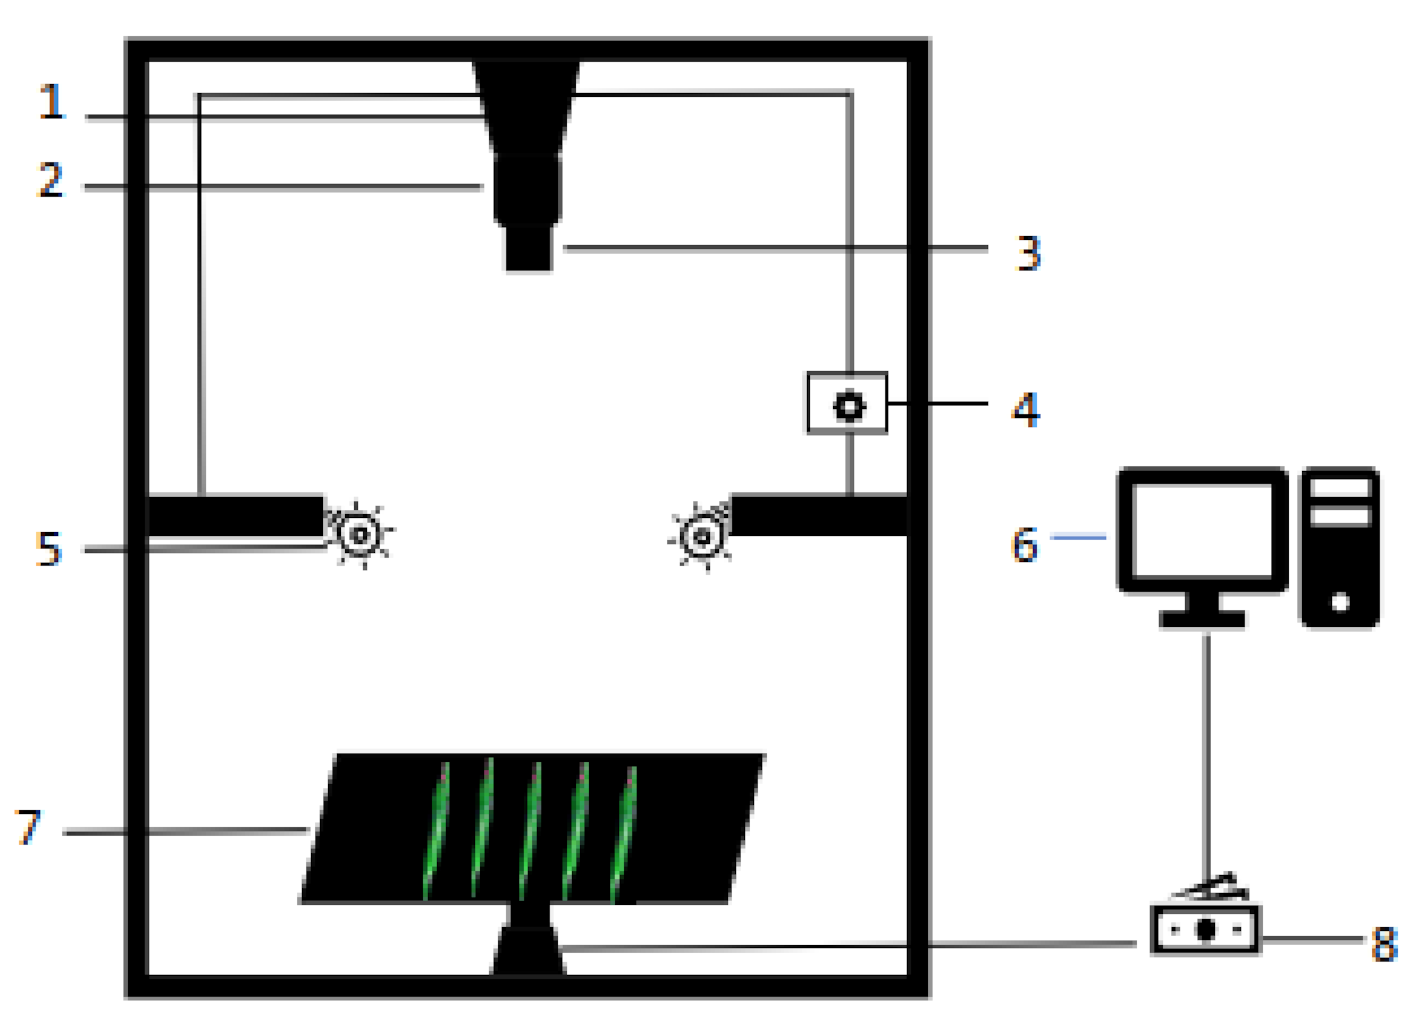
Figure 3.
The effect of data augmentation.
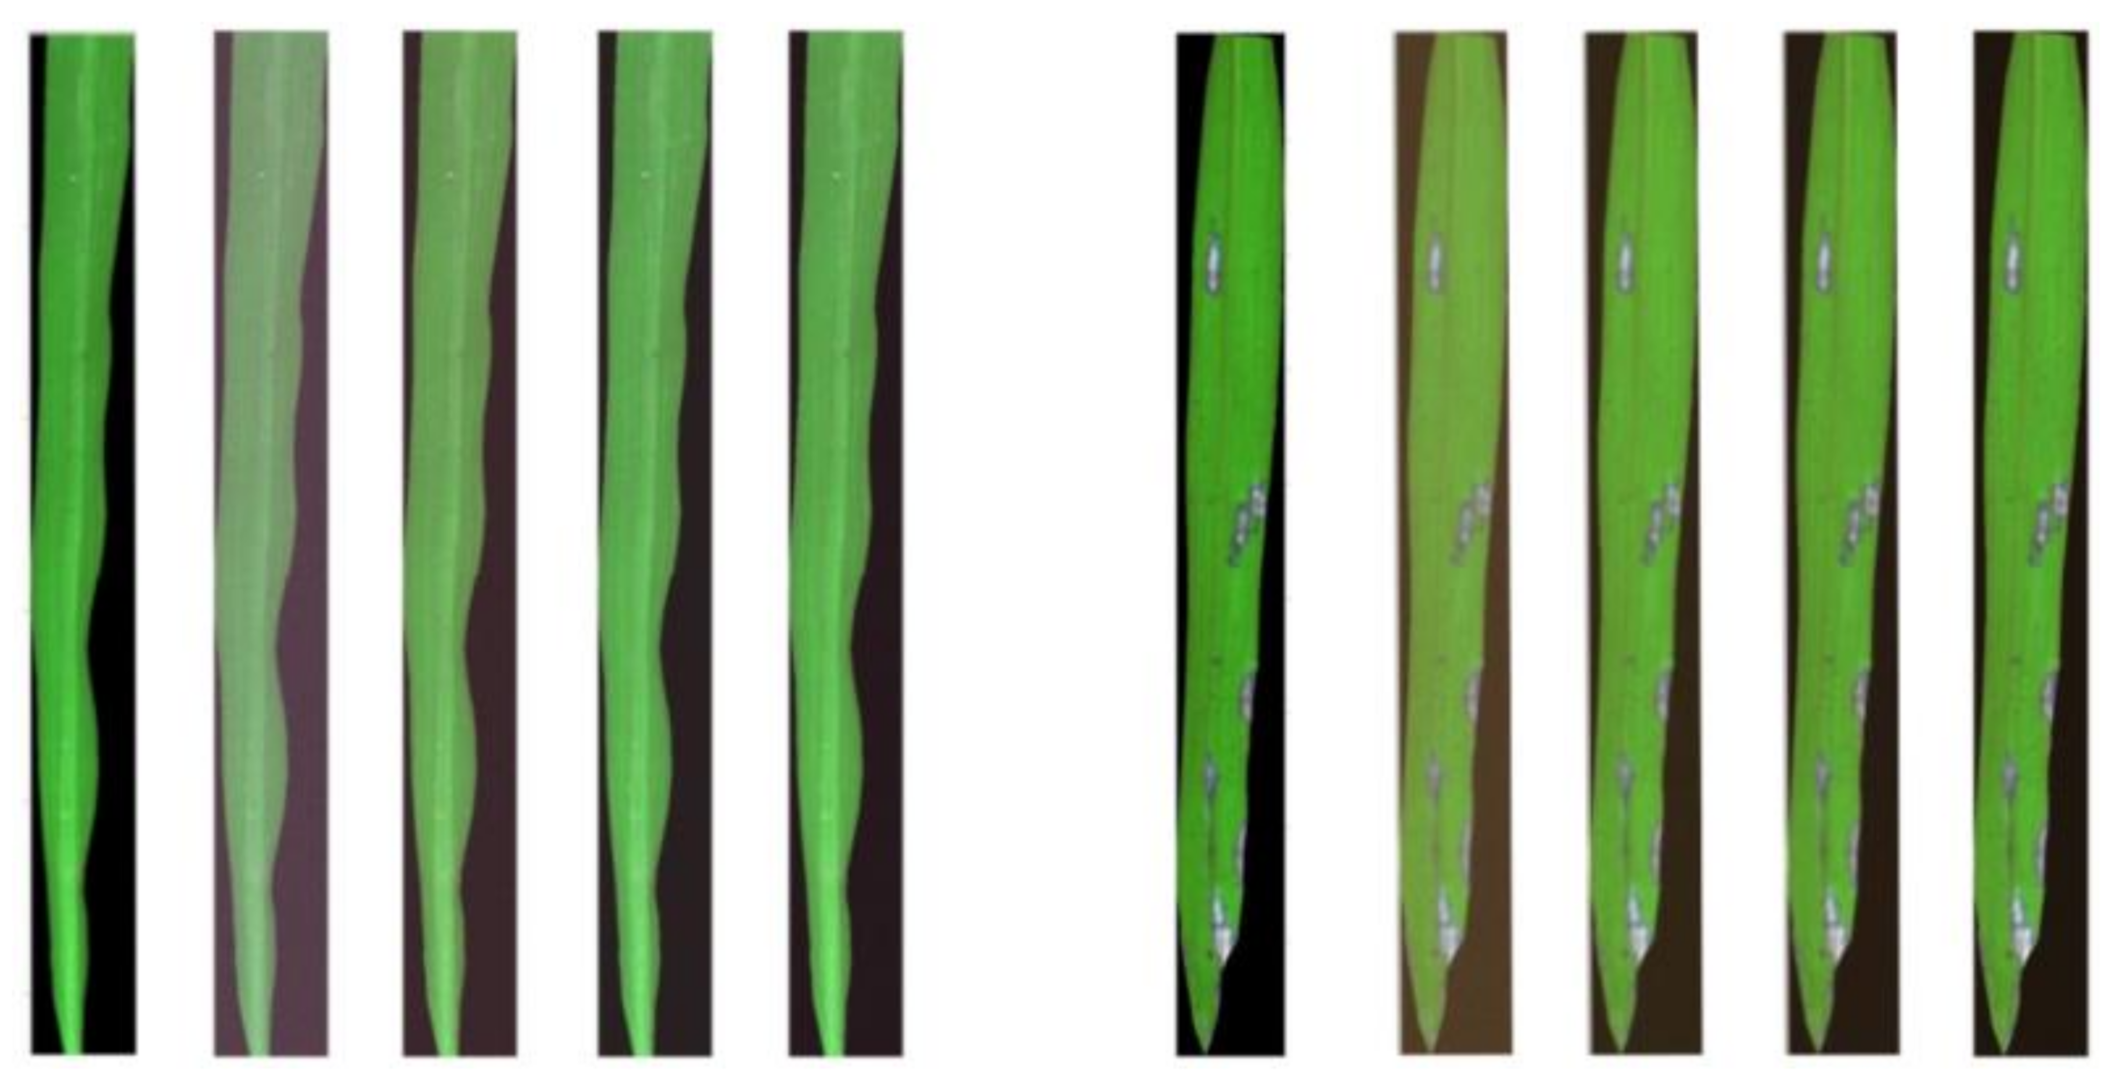
Figure 4.
ResNet structure.

Figure 5.
DCNN models with different dimensionality reduction methods.

Figure 6.
Comparison of average spectral curves. (a) Average spectral curves of diseases at 400 to 1000 nm. (b) Average spectral curves of diseases at 680 to 770 nm.
Figure 6.
Comparison of average spectral curves. (a) Average spectral curves of diseases at 400 to 1000 nm. (b) Average spectral curves of diseases at 680 to 770 nm.

Figure 7.
Contour of decision coefficient between disease levels and DSI, RSI and NDSI. (a) NDSI. (b) RSI. (c) DSI.
Figure 7.
Contour of decision coefficient between disease levels and DSI, RSI and NDSI. (a) NDSI. (b) RSI. (c) DSI.
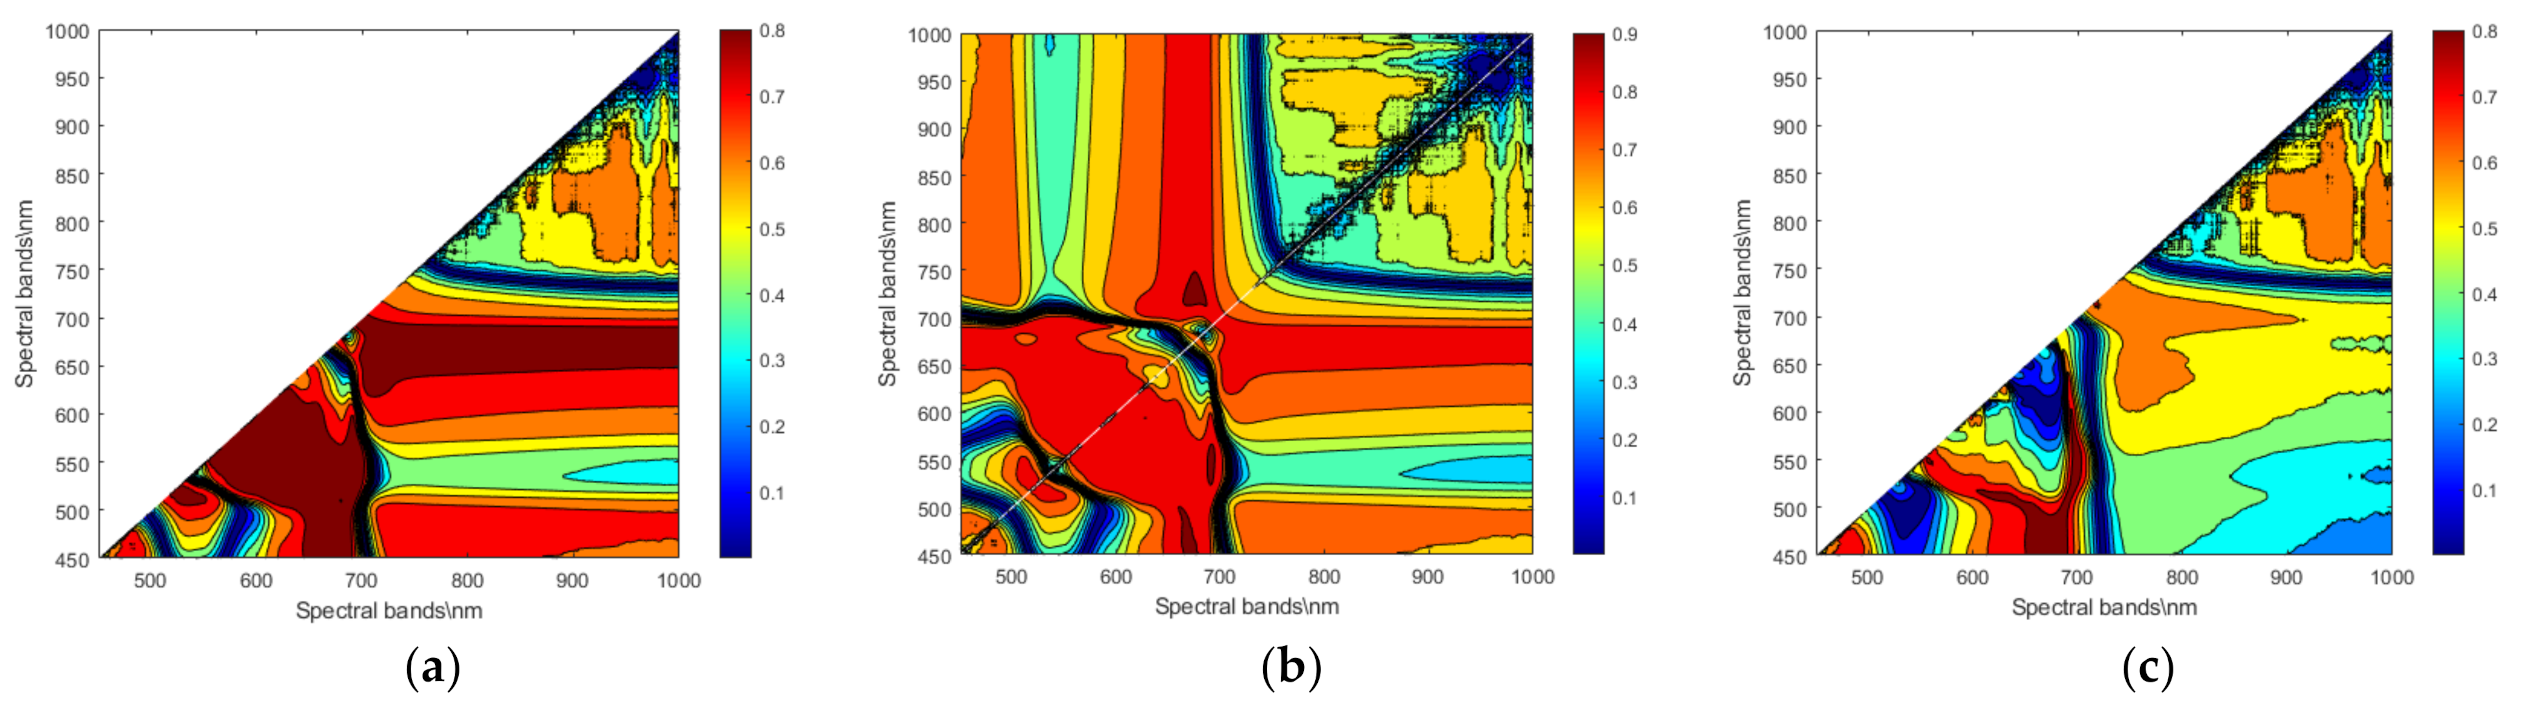
Figure 8.
Selected optimal variables using (a) SPA and (b) RF.
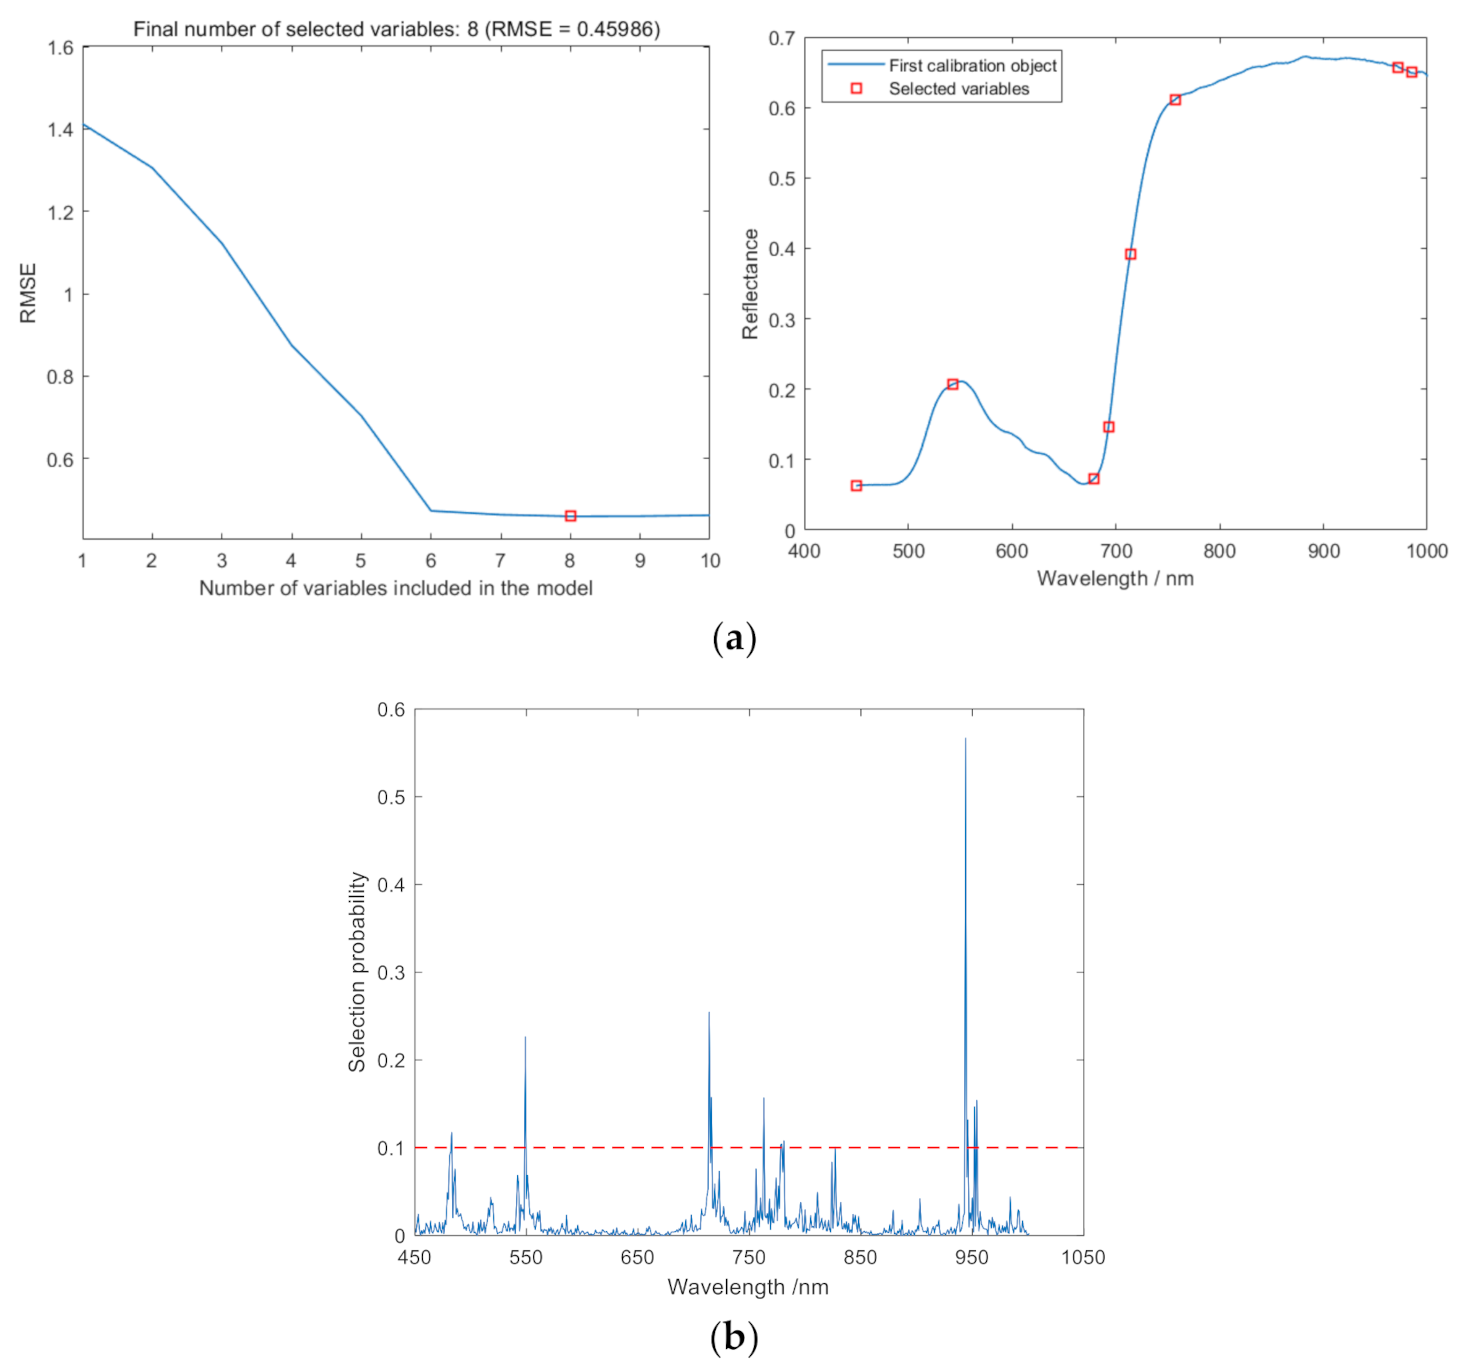
Figure 9.
Principal component images of healthy and diseased leaves.

Figure 10.
Effect of the number of DCNNs in the proposed DCNN model on classification accuracy.
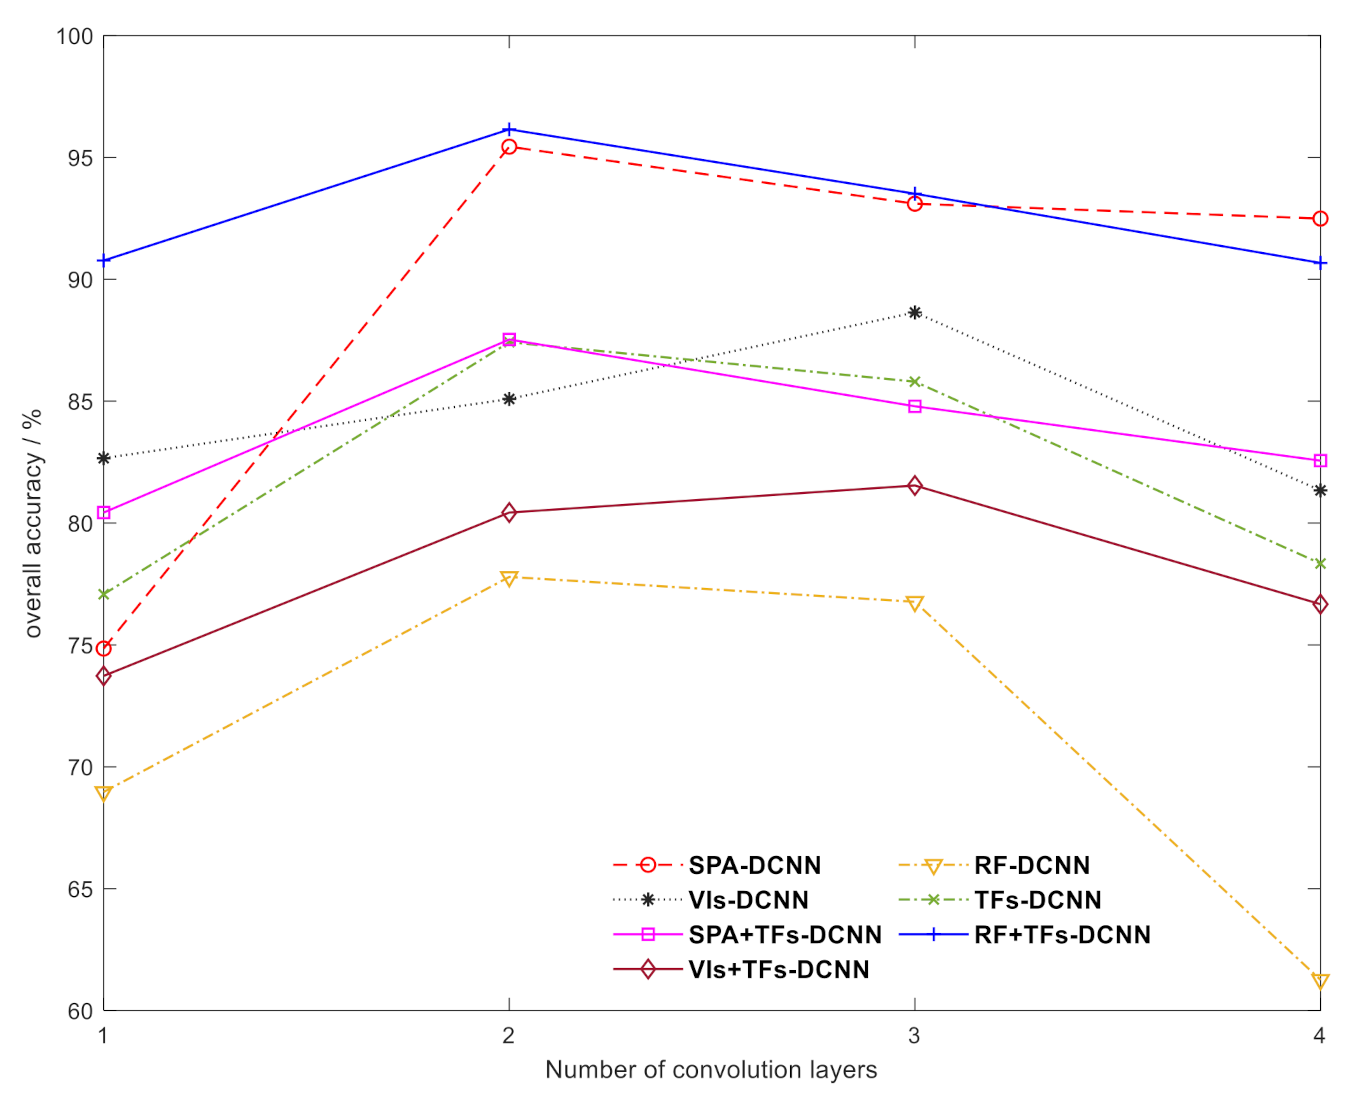
Figure 11.
Comparison of the accuracy of models built with different sizes of convolutional kernels. Note: (3,3), etc., denotes two convolutional layers with convolutional kernel sizes of 3 and 3; (1,3,3), etc., denotes three convolutional layers with convolutional kernel sizes of 1, 2 and 3.
Figure 11.
Comparison of the accuracy of models built with different sizes of convolutional kernels. Note: (3,3), etc., denotes two convolutional layers with convolutional kernel sizes of 3 and 3; (1,3,3), etc., denotes three convolutional layers with convolutional kernel sizes of 1, 2 and 3.
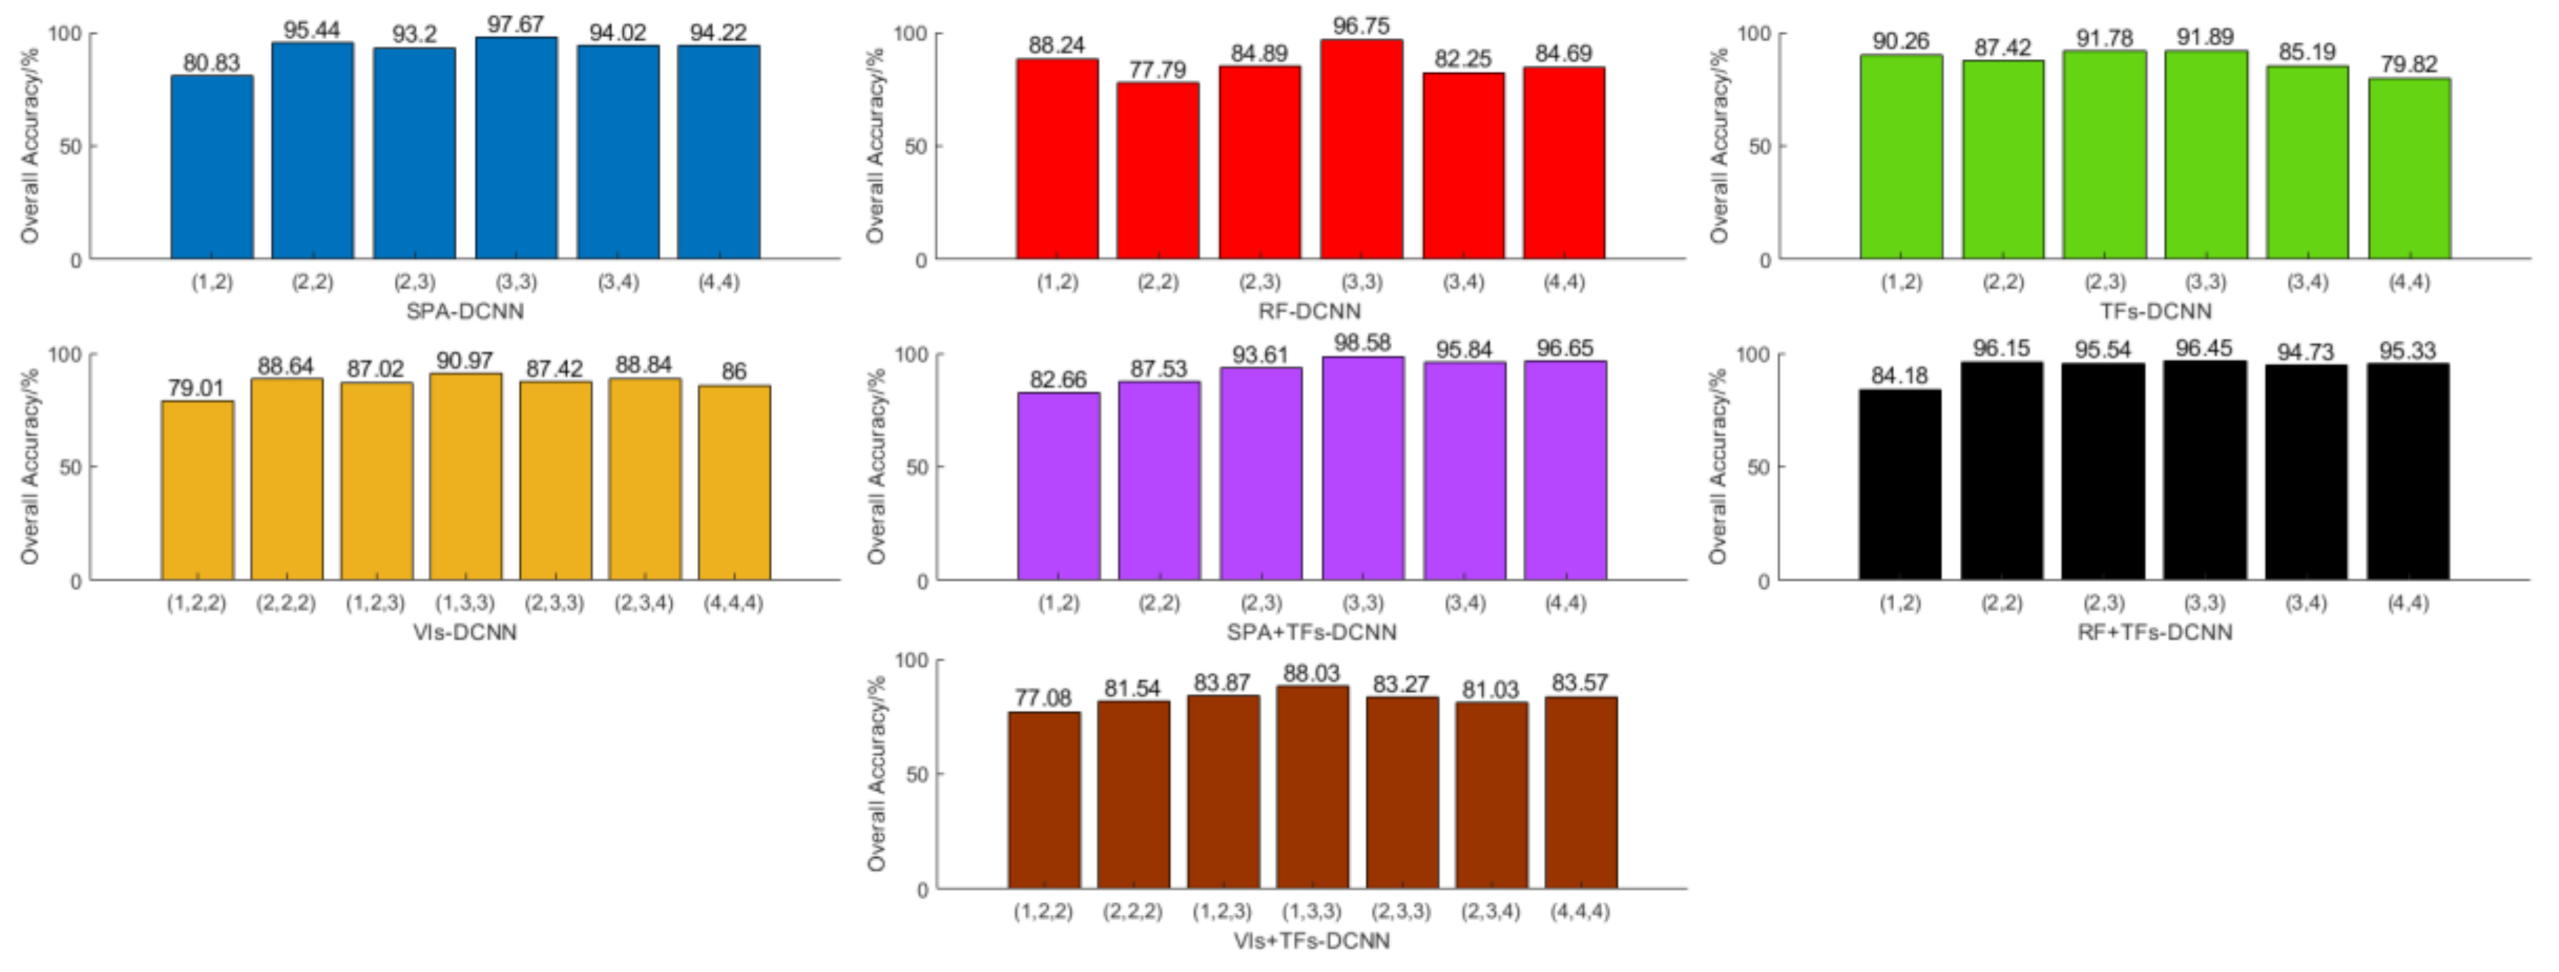
Figure 12.
Change of loss function value and accuracy with iteration curves.

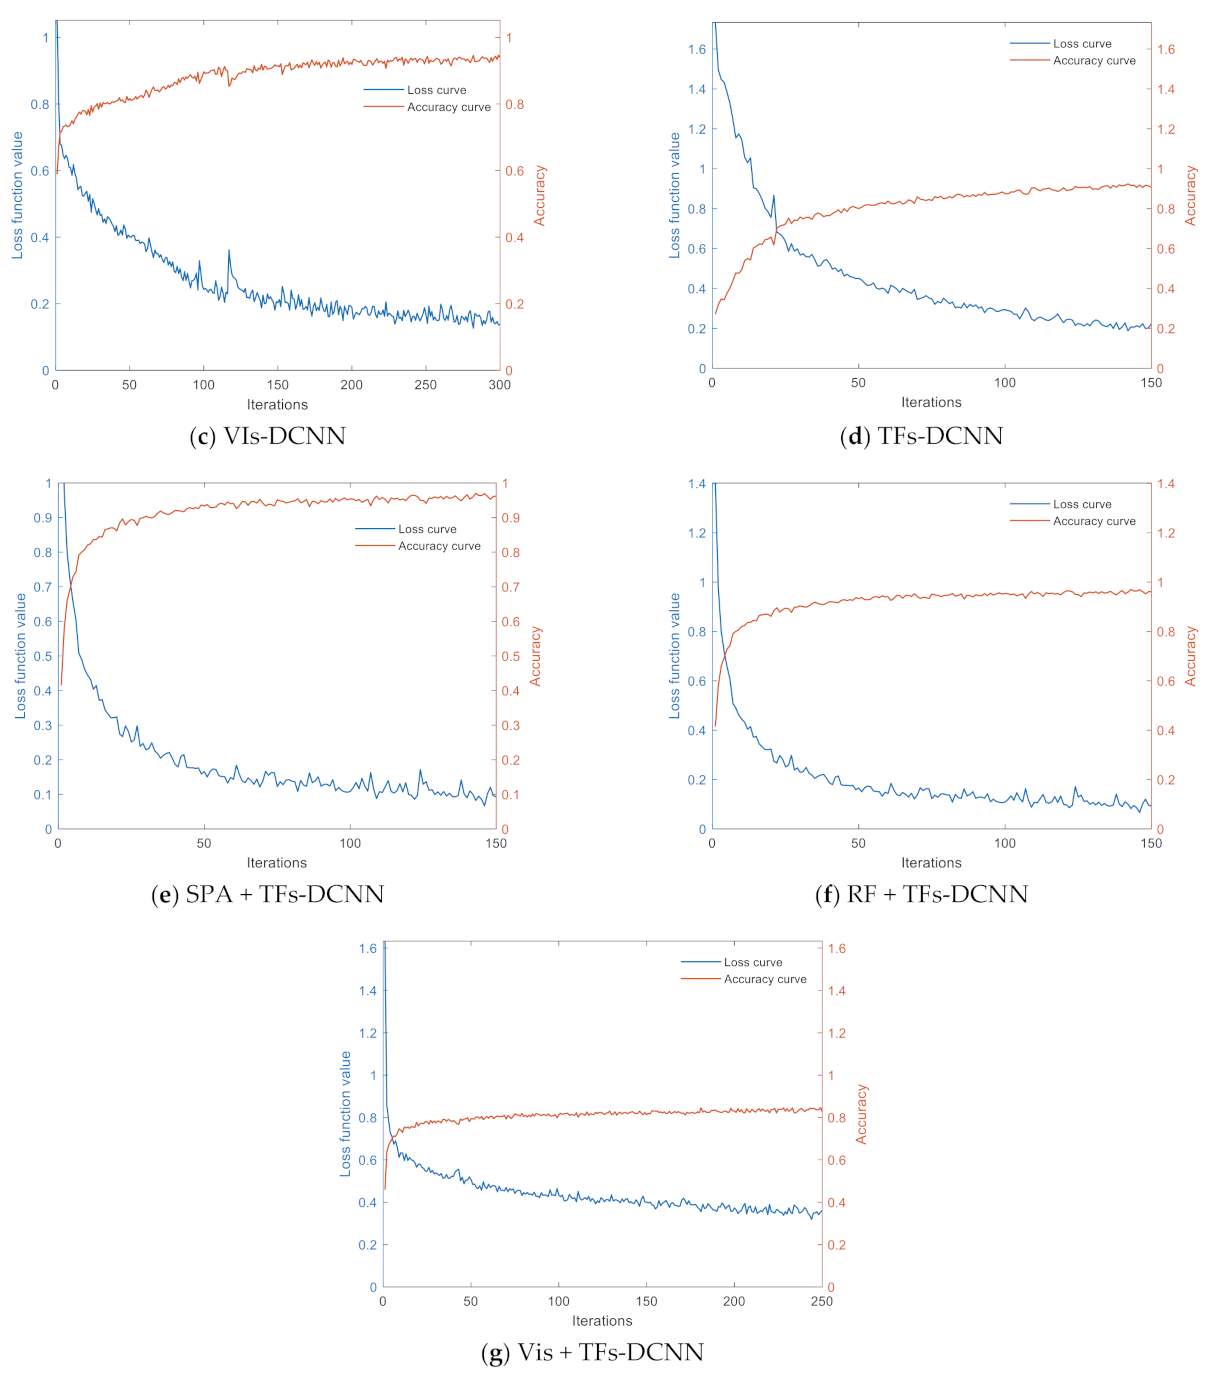
Table 1.
Criteria for determining different disease levels of leaf blades and sample size.
| Disease Level | Disease Level Determination Criteria | Sample Size |
|---|---|---|
| Level 0 | No disease spots. | 29 |
| Level 1 | Few and small spots, disease spot area less than 1% of leaf area. | 27 |
| Level 2 | Small and many spots or large and few disease spot area of 1~5% of leaf area. | 32 |
| Level 3 | Large and more spots, disease spot area of 5~10% of leaf area. | 27 |
| Level 4 | Large and more spots, disease spot area of 10~50% of leaf area. | 30 |
Table 2.
Four texture features extracted from the GLCM.
| Texture Features | Equation |
|---|---|
| Entropy | |
| Energy | |
| Correlation | |
| Contrast |
Note: and represent the row number and column number of the grayscale co-occurrence matrix, respectively; denotes the relative frequency of two neighboring pixels.
Table 3.
The variables selected by SPA and RF.
| Method | Variable Number | Wavelength/Nm |
|---|---|---|
| SPA | 8 | 450 543 679 693 714 757 972 985 |
| RF | 13 | 482 548 713 715 762 777 778 780 826 943 945 951 953 |
Table 4.
Correlation of texture features with different disease classes.
| Texture Features | Correlation Coefficient | p Value | Significance |
|---|---|---|---|
| MEne | 0.5618 | <0.001 | *** |
| SDEne | −0.2632 | <0.001 | *** |
| MEnt | −0.4914 | <0.001 | *** |
| SDEnt | −0.4263 | <0.001 | *** |
| MCon | −0.2308 | <0.001 | *** |
| SDCon | −0.2265 | <0.001 | *** |
| MCor | 0.1165 | <0.001 | *** |
| SDCor | −0.0365 | 0.0105 | ** |
Note: ** indicates significant correlation at 0.01 (0.01 < p < 0.05). *** indicates highly significant correlation at 0.001 (p < 0.001).
Table 5.
Results of the DCNN disease classification model based on different features.
| Descending Dimension Method | F1-Score (%) | OA (%) | Kappa (%) | ||||
|---|---|---|---|---|---|---|---|
| Level 0 | Level 1 | Level 2 | Level 3 | Level 4 | |||
| SPA | 100 | 97.44 | 95.74 | 96.15 | 98.54 | 97.67 | 97.08 |
| RF | 100 | 96.05 | 94.51 | 95.01 | 97.73 | 96.75 | 95.93 |
| VIs | 98.36 | 84.18 | 87.04 | 88.64 | 95.48 | 90.97 | 88.70 |
| TFs | 92.67 | 92.23 | 92.93 | 86.88 | 93.96 | 91.89 | 89.84 |
| SPA + TFs | 100.00 | 100.00 | 100.00 | 96.48 | 96.68 | 98.58 | 98.22 |
| RF + TFs | 100.00 | 100.00 | 97.93 | 91.36 | 93.66 | 96.45 | 95.55 |
| Vis + TFs | 97.17 | 83.66 | 85.79 | 80.72 | 92.13 | 88.03 | 85.04 |
Table 6.
Overall classification results.
| Methods | SVM | ELM | Inception V3 | ZF-Net | BiGRU | TextCNN | ||||||
|---|---|---|---|---|---|---|---|---|---|---|---|---|
| OA (%) | Kappa (%) | OA (%) | Kappa (%) | OA (%) | Kappa (%) | OA (%) | Kappa (%) | OA (%) | Kappa (%) | OA (%) | Kappa (%) | |
| SPA | 93.41 | 91.74 | 90.19 | 87.82 | 95.44 | 94.28 | 94.42 | 93.01 | 96.65 | 95.81 | 95.74 | 94.66 |
| RF | 91.28 | 89.09 | 90.96 | 89.07 | 91.89 | 89.85 | 96.55 | 95.68 | 94.32 | 92.88 | 88.95 | 86.12 |
| VIs | 86.09 | 82.60 | 83.40 | 79.22 | 86.92 | 83.62 | 89.76 | 87.17 | 88.64 | 85.80 | 84.08 | 80.09 |
| TFs | 88.34 | 85.40 | 89.13 | 87.27 | 88.95 | 86.14 | 92.09 | 90.08 | 89.96 | 87.41 | 90.97 | 88.68 |
| SPA + TFs | 95.54 | 94.41 | 91.67 | 89.59 | 97.06 | 96.32 | 97.77 | 97.20 | 97.36 | 96.70 | 97.77 | 97.20 |
| RF + TFs | 94.42 | 93.01 | 91.02 | 88.82 | 95.33 | 94.16 | 96.04 | 95.05 | 96.35 | 95.43 | 95.54 | 94.41 |
| Vis + TFs | 80.61 | 75.69 | 74.94 | 68.79 | 83.47 | 79.30 | 86.00 | 82.49 | 81.14 | 76.40 | 83.77 | 79.73 |
Table 7.
Results of model detection efficiency comparison.
| Method | OA (%) | Test Time (s) |
|---|---|---|
| SPA + TFs-SVM | 95.54 | 0.1058 |
| SPA + TFs-ELM | 91.67 | 0.0279 |
| SPA + TFs-Inception V3 | 97.06 | 0.5222 |
| SPA + TFs-ZF-Net | 97.77 | 0.4152 |
| SPA + TFs-BiGRU | 97.36 | 1.2086 |
| SPA + TFs-TextCNN | 97.77 | 0.3388 |
| SPA + TFs-DCNN (the model of this study) | 98.58 | 0.2200 |
Publisher’s Note: MDPI stays neutral with regard to jurisdictional claims in published maps and institutional affiliations. |
© 2021 by the authors. Licensee MDPI, Basel, Switzerland. This article is an open access article distributed under the terms and conditions of the Creative Commons Attribution (CC BY) license (https://creativecommons.org/licenses/by/4.0/).
Share and Cite
MDPI and ACS Style
Feng, S.; Cao, Y.; Xu, T.; Yu, F.; Zhao, D.; Zhang, G. Rice Leaf Blast Classification Method Based on Fused Features and One-Dimensional Deep Convolutional Neural Network. Remote Sens. 2021, 13, 3207. https://doi.org/10.3390/rs13163207
AMA Style
Feng S, Cao Y, Xu T, Yu F, Zhao D, Zhang G. Rice Leaf Blast Classification Method Based on Fused Features and One-Dimensional Deep Convolutional Neural Network. Remote Sensing. 2021; 13(16):3207. https://doi.org/10.3390/rs13163207
Chicago/Turabian StyleFeng, Shuai, Yingli Cao, Tongyu Xu, Fenghua Yu, Dongxue Zhao, and Guosheng Zhang. 2021. "Rice Leaf Blast Classification Method Based on Fused Features and One-Dimensional Deep Convolutional Neural Network" Remote Sensing 13, no. 16: 3207. https://doi.org/10.3390/rs13163207
Note that from the first issue of 2016, this journal uses article numbers instead of page numbers. See further details here.