
Analysis of the Spatial and Temporal Pattern of Changes in Abandoned Farmland Based on Long Time Series of Remote Sensing Data

1
Beijing Research Center for Information Technology in Agriculture, Beijing 100097, China
2
School of Surveying and Land Information Engineering, Henan Polytechnic University, Jiaozuo 454000, China
3
College of Information and Electrical Engineering, China Agricultural University, Beijing 100083, China
4
College of Geodesy and Geomatics, Shandong University of Science and Technology, Qingdao 266590, China
*
Author to whom correspondence should be addressed.
Remote Sens. 2021, 13(13), 2549; https://doi.org/10.3390/rs13132549
Submission received: 29 April 2021
/
Revised: 29 May 2021
/
Accepted: 24 June 2021
/
Published: 29 June 2021
Abstract
:With the rapid increase in the costs of rural labour and the adjustment of planting structures, the phenomenon of farmland abandonment has appeared in China. It is of great significance to promptly and accurately grasp the information on dynamic temporal and spatial changes in abandoned farmland to ensure national food security and the sustainable use of cultivated land. Luquan District in Hebei, China was selected as the research area based on multispectral images from Sentinel-2A, Landsat-7, and Landsat-8 combined with methods of random forest (RF) classification and vegetation index change detection. Rules for the identification of abandoned farmland were also developed, and remote sensing monitoring of the abandonment status of the cultivated land was also carried out in the study area. We also obtained the spatial distribution of abandoned and reclaimed farmland and analysed the frequency of farmland abandonment. The results show that the overall accuracy of the land-use time-series map ranged from 90.20% to 96.92% for the study period of 2010–2020. The average rate of farmland abandonment in the study area was 10.62%, with the lowest rate (5.83%) in 2020 and the highest (14.09%) in 2012. From 2011 to 2020, the maximum farmland abandonment area was 3906.02 hm2, and the minimum area was 1618.74 hm2. The farmland abandonment area showed a trend of first increasing and then decreasing. From 2012 to 2020, the maximum area of reclaimed farmland was 291.49 hm2, and the highest rate of reclamation was 14.26%. The overall reclamation rate was low. The abandonment frequency of most of the abandoned farmland was 1–3 years, covering an area of 8193.73 hm2, which comprised 79% of the total area of abandoned farmland. The frequency of abandonment was inversely proportional to the area of abandoned farmland. Farmland abandonment mainly occurred in hilly areas. We expect that our results can provide case studies for long time series in farmland abandonment research and can provide a reference for studying the driving factors, risk assessment, and policymaking with respect to abandoned farmland.

1. Introduction
In recent years, with the rapid increase in rural labour costs and the acceleration of urbanisation in China, an increasing number of rural people have moved into cities to work and do business [1,2], and the agricultural labour force has gradually transferred to non-agricultural industries. The decline in the quantity and quality of the agricultural labour force has led to reduced planting, and the trend of farmland abandonment is becoming increasingly serious. Owing to the improvement of mechanisation and the reduction of planting costs, large-scale and high-quality cultivated land receives more input, and fragmented or remote cultivated land is gradually withdrawn from agricultural production [3,4,5]. Statistics show that about 28% of the cultivated land in the mountainous counties of China is abandoned [6], and the phenomenon of abandoned cultivated land in remote areas is serious [7]. As a developing country with rapid economic development, China has not paid enough attention to the phenomenon of cultivated land abandonment [8], and it lacks official statistical data on abandoned farmland [9]. Numerous studies have shown that arable land abandonment has an impact on biodiversity [10], soil quality [11,12], the carbon cycle [13,14], and the ecological environment [15]; extracting the spatial distribution of abandoned cultivated land can provide a data basis for an analysis of the impact on the ecological environment of abandoned cultivated land. Therefore, a timely and accurate understanding of the dynamics of the changes in the spatial and temporal patterns of abandoned farmland is of importance for ensuring national food security and the sustainable use of arable land.
Methods for extracting information on abandoned farmland can be divided into three categories: household surveys, detection of change in land-use types, and remote sensing interpretation. Although household surveys can help researchers accurately understand the mechanisms of farmland abandonment, these are time-consuming and inefficient because of their subjectivity and topic sensitivity; obtaining adequate sample sizes and experimental design can also be problematic. It is difficult to obtain objective and comprehensive abandonment information and to determine the spatial distribution and sustainability of abandoned farmland by using household surveys [16,17,18]. Change detection uses land-use data to identify abandoned farmland by analysing changes in land-use types. However, land-use data are difficult to obtain and may be confidential, which limits scientific research. With the development of remote sensing technology, the temporal and spatial resolution of images obtained from satellites has significantly improved. A higher temporal resolution helps to capture the temporal change information of cultivated land abandonment, and a high spatial resolution helps to solve the problem of cultivated land in mountainous areas being relatively fragmented and difficult to accurately monitor. The use of remote sensing images to extract abandoned farmland has become a fast and effective method [19] that is of great significance in the accurate estimation and understanding of the dynamic changes in cultivated land. Scholars have conducted extensive research and exploration with respect to the remote sensing monitoring of abandoned farmland. Xiao et al. used the counties of Qingyun and Wudi in Shandong Province as examples in which they classified Landsat data and HJ-1A data using a cart decision tree, formulated the rules of recognition of abandoned farmland, and analysed the spatial distribution and change trends of the abandoned farmland in the study area from 1992 to 2017 [9]. Witmer et al. used multi-temporal Landsat TM images to extract abandoned farmland caused by the war in northeast Bosnia by using a change detection method [20]. Cheng et al. identified abandoned farmland by analysing the time-series characteristics of the normalised difference vegetation index (NDVI) at the sampling points and matching them with the growth cycles of crops; they further considered that the abandoned farmland identification method based on the time-series characteristics of the NDVI was the most suitable [21]. Niu et al. analysed the spatial distribution and driving factors of abandoned farmland in economically underdeveloped areas based on support vector machine classification and a landscape index. The results showed that the accuracy of the extraction of abandoned farmland from remote sensing images was greater than 90% [22]. Yang et al. extracted various types of abandoned farmland in Linger County through the method of joint change detection with multi-source data, and the total accuracy of this method was 97.6% [23].
In this research, the Luquan District in Hebei, China was selected as the research area. Multiple data sources were used to classify and validate the data (Sentinel-2A, Landsat-7 ETM, and Landsat-8 OLI images, Google Earth images, and field surveys and data from two seasons in the year). The spatial distribution of abandoned farmland from 2011 to 2020 was extracted by using abandoned farmland identification rules, as well as maps created and figures calculated for the area of abandoned farmland and reclamation. The purpose of this research was to acquire accurate data on the amount, distribution, and rate of farmland abandonment on the basis of the maintenance of food security and sustainable land use, as well as to provide a case for the study of long time series of abandoned farmland.
2. Study Zone Description and Database
2.1. Study Zone Description
Luquan District (Figure 1), under the jurisdiction of Shijiazhuang City, Hebei Province, is in the central and southern part of Hebei Province—between 114°18′ E and 38°05′ N—covering an area of 603 km2. The terrain is generally high-lying in the west and low-lying in the east. The western region forms part of the Taihang Mountain, comprising a low mountain and hilly area. To the east is an alluvial–proluvial plain, which is located at the western edge of the North China Plain. It has a warm temperate semi-humid monsoon continental climate with simultaneous rain, heat, and enough light. Luquan District has good natural conditions, a solid agricultural foundation, and a high level of agricultural mechanisation. It has 433 km2 of agricultural land, including 280 km2 of cultivated land where crop rotation is implemented. From June to October, the main crops are corn and soybeans. From October to June, the main crops are winter wheat and other crops, such as millet, cotton, and various types of fruit. In recent years, the improved mechanisation and large-scale cultivation of high-quality agricultural land has enabled increased investment. In contrast, owing to the fragmentation, remote location, low mechanisation, and limited cultivated land in the western (mountainous) region of the study area, the phenomenon of abandoned farmland is more common. In summary, the geographical location, land-use methods, and topographic features of Luquan make it a representative area for the study of cultivated land abandonment. Therefore, the researchers in this study chose Luquan District as the research area to explore the process of farmland abandonment.
2.2. Dataset Description
2.2.1. Remote Sensing Data
This study used Landsat-7 ETM and Landsat-8 OLI remote sensing data that covered the period of 2010–2016 with a resolution of 30 m. These data were sourced from the Geospatial Data Cloud website (http://www.gscloud.cn, accessed on 19 January 2021). Further, Sentinel-2 remote sensing data with a resolution of 10 m—covering the period 2017–2020 and sourced from the European Space Agency website (https://scihub.copernicus.eu, accessed on 18 February 2021)—were also used. The combined datasets formed a continuous time series from 2010 to 2020. Two periods of images were selected per year—namely, April–May and June–July, totalling 22 remote sensing images. These 22 images provided the basic data for feature recognition and classification. Because the crops grow luxuriantly in April–May and are then harvested in the June–July period, the spectrum differs significantly for these two periods. This enabled cultivated land to easily be distinguished from uncultivated land. Therefore, remote-sensing images with clear images and less cloud cover in these two periods were selected as the basic data for extracting abandoned farmland. Because of the poor quality of the Landsat-7 data from 2013 to 2020, Landsat-8 data from 2013 to 2017 and Sentinel-2 data from 2017 to 2020 were selected to replace them. The image acquisition dates and cloud coverage are listed in Table 1.
2.2.2. Other Data
- (a)
- Farmland DataFarmland data can be used to avoid errors in image interpretation in the whole region, as well as inconsistencies in patch boundaries for different periods of image interpretation in the same region. According to the phenological characteristics of crops, the boundary of cultivated land is clear in winter, which makes it easier to extract farmland. In this study, a Google Earth image with a resolution of 0.5 m from December 2018 was used to extract farmland by using an artificial digital method (taking full advantage of the high spatial resolution characteristics of Google Earth images, the farmland boundary information was obtained by observing the images, and the farmland boundaries were manually outlined on the image and saved as a vector in the ArcMap 10.3 software) (Figure 2). The abandoned farmland information was extracted based on the farmland data.
- (b)
- Field Survey DataWe obtained 110 field survey points based on the field survey, including 48 in grassland, 13 in cultivated land, and 49 in bare land (Figure 2). This was combined with high-resolution image data from Google Earth to provide the basic data for selecting the training and verification samples.
- (c)
- Digital Elevation Model (DEM) DataThe DEM utilised in this research used ASTER GDEM data (Figure 3) with a resolution of 30 m provided by the Geospatial Data Cloud (http://www.gscloud.cn, accessed on 19 January 2021). In RF classification, it was used as a feature band to improve the accuracy of the classification results. The slope was calculated in Arcmap 10.3 based on the DEM data as one of the feature bands of the RF classification.
- (d)
- High-Resolution Images from Google EarthIn the Google Earth software, according to multi-source data from different years, we adjusted the acquisition year of the Google Earth images and tried to ensure that the acquisition years of the Google Earth images were consistent with the acquisition years of the multi-source data. We acquired a total of 11 Google Earth images from 2010 to 2020 with a resolution of 0.5 m, which were used to extract farmland vector data and as a reference for selecting the training samples and validation samples.
3. Research Methods
3.1. Definition of Abandoned Farmland
At present, there is no unified definition of how long-idle farmland can be determined as abandoned farmland. In 1995, the United Nations Food and Agriculture Organisation defined abandoned farmland as arable land that has not been used for agricultural production or other agricultural purposes for at least five years [24]. In China, the definition of abandoned farmland includes arable land that has been idle for more than one year and cannot create value, and is thus determined as abandoned [25]; cultivated land that has been idle for three years can be regarded as abandoned [26]; if the cultivated land is deserted for one season or more, it can be regarded as abandoned [27], and so on.
Through field surveys and previous studies, this study defined abandoned farmland as follows: Under the comprehensive effects of social, economic, and natural factors, cultivated land that has been idle or abandoned for more than one year (including one year) is abandoned farmland. Because farmland abandonment is a process of transformation of the land-use type, it cannot be directly classified by remote sensing images. In this experiment, the study area was classified first, and then the transformation process of land-use types was judged year by year to determine whether the cultivated land was abandoned.
3.2. Methodology
Figure 4 shows the process employed for identifying abandoned farmland in the study area. The main steps were as follows:
- (1)
- Data pre-processing.
- (2)
- Creating a land-use time-series map for the period of 2010–2020.
- (3)
- Accuracy validation.
- (4)
- Establishing rules for identifying abandoned farmland and building an abandonment time-series distribution map for the period of 2011–2020.
- (5)
- Establishing rules for identifying abandoned farmland that was re-cultivated to build a re-cultivation time-series distribution map for the period of 2012–2020.
- (6)
- Analysis of the frequency of abandoned farmland.
3.2.1. Data Pre-Processing
In this study, the specific process of running the RF algorithm followed several steps. The remote sensing images from 2010 to 2020 were first pre-processed, which included radiometric calibration, atmospheric correction, and tailoring of the study area’s boundaries. In ENVI5.3, the radiometric calibration tool was used to complete the radiometric calibration of the Landsat data, and then the FLAASH atmospheric correction module was used to perform atmospheric correction on the radiometric calibration data. The Sentinel data used were L2A products that were geometrically corrected and radiometrically calibrated, and the atmospheric correction of Sentinel 2A is realised with the Sen2Cor atmospheric correction model of the ESA’s official SNAP software. Based on the Gram–Schmidt pan-sharpening fusion method, the 30 m resolution Landsat multispectral band and 15 m resolution panchromatic band were fused to generate high-resolution multispectral images; the Landsat-7 ETM + airborne scan line corrector failed in May 2003, which led to stripe phenomena on the images acquired since then. Therefore, the Landsat-7 data from 2010 to 2012 were processed using differential stripe repair.
Subsequently, the NDVI, normalised difference water index (NDWI), and normalised difference built-up index (NDBI) were calculated using ENVI5.3 according to the band information of the images. The use of the normalised indexes described above can better distinguish vegetation, buildings, and water and can improve the accuracy of RF classification [28]. The calculation formulas are as follows:
where NIR represents the near-infrared band, R represents the visible red band, G represents the visible green band, and SWIR represents the short-wave infrared band (band 7 for Landsat and band 12 for Sentinel).
Then, the Iterative Self-Organising Data Analysis Technique (ISODATA) for unsupervised classification was performed by using the ENVI5.3 software; the number of classes was set to 10–15 and the maximum iterations were set to 10. The advantages of conducting unsupervised classification with ISODATA were to attainment of abundant band information and improvement of the subsequent RF classification accuracy [29]. The DEM data were calculated in ArcMap10.3 to obtain the slope result.
Finally, the NDVI, NDBI, NDWI, red band, green band, blue band, and near-infrared band layers, as well as the ISODATA unsupervised classification iteration layer and slope layer, were used to compound the multi-source data, which were the basic data for the RF classification of the nine bands.
3.2.2. Creating the Land-Use Time-Series Map
The images for the crop growing period from April to May were called “period 1” images, and the images after crop harvesting from June to July were called “period 2” images. The images were combined with the high-resolution Google Earth images and field survey data, and training sample sets were established year by year. In the Google Earth software, according to the multi-source data from different years, we adjusted the acquisition years of the Google Earth images and tried to ensure that the acquisition years of the Google Earth images were consistent with the acquisition years of the multi-source data. The field survey data were divided into six categories: cultivated land, forestry, water, bare land, grassland, and built-up areas. The training samples and the multi-band combination images for period 1 were input into the RF classifier for classification, and the RF classification results were obtained. In remote sensing image classification, owing to the variety of vegetation and land types, the use of only a single period of images or a single method can be easily affected by the phenomenon of the same object with different spectra or different objects within the same spectrum. This results in low recognition accuracy. To improve the accuracy of the classification results, the maximum inter-class variance (Otsu) method was used to determine the change threshold in ENVI5.3, and the cultivated land data were used as a mask to detect the changes in the NDVI in the two images for period 1 and period 2. From May to July, the crops changed into bare soil after harvesting, and their NDVI value dropped sharply, while weeds gradually grew more vigorously during this period, and the NDVI showed an upward trend. Therefore, under the mask of the farmland vector data, the part with a significantly reduced NDVI was regarded as cultivated land, and the part with the increased NDVI was regarded as grassland; these data were superimposed on the RF classification results to cover the original classification results in order to improve their accuracy. The images from 2010 to 2020 were processed to obtain the land-use time-series map for the period of 2010–2020.
3.2.3. Accuracy Validation
The accuracy of the land-use time-series map was verified in order to validate the accuracy of the classification results. By using field survey data and visual interpretation methods, we randomly selected verification samples with a uniform distribution from the original image and verified the accuracy of the confusion matrix for 11 classification results from 2010 to 2020. The accuracy validation indices included the overall accuracy and kappa coefficient.
3.2.4. Identification and Extraction of Abandoned Farmland
As a key part of this study, the accuracy of abandoned farmland extraction was related to the accuracy in the identification of subsequently abandoned and then reclaimed farmland, as well as a sustainability analysis.
Based on the definition of abandoned farmland in Section 3.1, this study developed abandoned farmland identification and extraction rules. Using the farmland data obtained from the high-resolution remote sensing image digitisation as the mask, the land-use classification maps for two consecutive years from 2010 to 2020 were compared year by year. Taking the Nth year as the base year, we could judge the change in land-use types in the cultivated land area in the Nth + 1 year. If the plot changed from cultivated land to bare land, it was regarded as abandoned farmland. It was also found through field investigations that after an extended period, abandoned farmland was gradually covered with grass; thus, grassland was also classified as a form of abandoned farmland. Finally, because the cultivated land may have been abandoned before the monitoring cycle, that is, the plot was transformed from cultivated land into bare land or grassland, and it was manifested as bare land or grassland in the monitoring cycle; therefore, this classification was also within the scope of extraction of abandoned farmland. In summary, in this experiment, under the mask of farmland data, the plots from the cultivated land that changed into bare land, cultivated land that changed into grassland, bare land that changed into grassland, permanent grassland, and permanent bare land were recognised as abandoned farmland in the Nth + 1 year and so on in other years and were extracted.The spatial distribution maps of abandoned farmland from 2011 to 2020 were obtained.
The abandonment rate was introduced in order to quantitatively express the situation of farmland abandonment, that is, the proportion of abandoned area in the Nth + 1 year to the Nth year. The expression is as follows:
where Pa is the abandonment rate during the Nth + 1 year, AN + 1 is the abandoned area in the Nth + 1 year, and AN is the cultivated area in the Nth year.
3.2.5. Reclamation Identification and Analysis of the Frequency of Abandoned Farmland
Restoration of abandoned farmland is also called abandoned farmland reclamation. According to the results for the recognition of abandoned farmland, the changes in abandoned farmland in two consecutive years were determined, and the following rules for the recognition of abandoned farmland reclamation were established: Using the results of the extraction of abandoned farmland in the Nth year as the mask to cut the land-use classification map in the Nth + 1 year, the cultivated land part in the cutting results was extracted to represent the results of the reclamation of abandoned farmland in the Nth + 1 year, and the spatial distribution maps of reclaimed cultivated land in 2012–2020 were obtained.
The reclamation rate was introduced to quantitatively express the situation of abandoned farmland reclamation, that is, the proportion of abandoned farmland reclamation area in the Tth + 1 year to abandoned farmland area in Tth year. The expression is as follows:
where Pr is the reclamation rate in the Tth + 1 year, AT+1 is the reclamation area of abandoned farmland in the Tth + 1 year, and At is the abandoned farmland area in the Tth year.
Finally, the results of the identification of abandoned farmland in all years were superimposed to obtain the frequency of abandoned farmland. Based on this method, the trend of continuous abandonment in the study area was analysed.
4. Results
4.1. Land-Use Time-Series Map
Figure 5 shows the land-use time-series map for Luquan from 2010 to 2020, including the cultivated land, forestry, grassland, built-up area, bare land, and water. Cultivated land and forestry accounted for a large proportion of land-use types in Luquan District, while water accounted for a small proportion. With economic development, the extent of built-up areas increased year by year, and the area of unused land gradually decreased. The abandoned cultivated land in the western mountainous areas is gradually being transformed into built-up areas and forestry.
The periods for which the Google Earth images were acquired were adjusted to ensure that these corresponded with the images to be classified. Combined with the existing field survey data, validation samples were established year by year for the entire study area, and the accuracy of the classification results was validated with a confusion matrix. Table 2 shows the accuracy of the land-use time-series maps for the period of 2010–2020, which was calculated by using confusion matrices. The classification accuracy of the land-use time-series maps ranged from 90.20% to 96.92% after superimposing the change detection results, with an average of 94.03%. In contrast, the overall accuracy of the classification results obtained through the RF classification ranged from 81.18% to 93.25%, with an average of 86.32%. The higher overall accuracy when using the superimposed change detection results was preferable, as it was 7.71% higher than the accuracy of the RF classification.
4.2. Abandoned Farmland
The abandonment time-series distribution map in Luquan for the period 2011–2020 was extracted based on the land-use time-series map obtained with the RF classification method according to the abandoned farmland identification rules established in Section 3.2.4 (Figure 6). Figure 6 shows that abandoned farmland was located in all sections of the study area, but was mainly concentrated in the western mountains, and the degree of abandoned farmland in the eastern plain was relatively low.
The annual abandonment rate was calculated based on the definition in Section 3. Table 3 and Figure 7 show the area of abandoned farmland and the abandonment rate in Luquan for 2011–2020. The abandoned area ranged from 1618.74 to 3906.02 hm2, with an average of 2946.68 hm2. The largest area of abandoned land was identified for 2012, and the smallest was for 2020. The abandonment rate was 5.83–14.09%, and the average abandonment rate was 10.63%. In 2011–2017, the abandoned farmland showed an upward trend and began to show a downward trend from 2018. The abandoned farmland showed a trend of first increasing and then decreasing in the whole monitoring cycle, indicating that the phenomenon of abandoned farmland has been controlled to a certain extent in recent years.
4.3. Recultivation of Abandoned Farmland
The large-scale abandonment of cultivated farmland is not conducive to agricultural production, and because cultivation materially contributes to human survival and development, it affects national food security. Therefore, determining the extent of reclamation of cultivation has become an important part of abandoned farmland monitoring. Based on the maps detailing the distribution of abandoned farmland, we extracted the spatial distribution of re-cultivated farmland for the period of 2012–2020 (Figure 8) according to the re-cultivation recognition rules established in Section 3.2.5.
Figure 9 and Table 4 show the area of abandoned farmland that was re-cultivated and the reclamation rate in Luquan during the period 2012–2020. The reclamation area ranged from 34.94 to 291.49 hm2, with an average of 130.14 hm2. The largest and smallest areas of re-cultivated land were in 2020 and 2014, respectively. The reclamation rate was ~0.95–14.26%, and the average reclamation rate was 4.67%, which was regarded as low. Abandoned farmland reclamation was mainly concentrated in the (eastern) plains, which have superior conditions for cultivation; in contrast, there was almost no sign of reclamation in the western mountainous areas. The reason is that there are many sloping fields, much fragmented farmland, remote locations, and a poor quality of cultivated land in this area. With the acceleration of urbanisation and the improvement of agricultural mechanisation, this region with a poor quality of cultivated land is gradually being abandoned. The change process for this region where farmland is being abandoned is cultivated land → bare land → grassland → forestry or built-up areas. When the abandoned farmland is converted into forestry or a built-up area, the abandoned state ceases, which is regarded as a change in the land-use type, and reclamation of this abandoned farmland does not occur.
4.4. Frequency of Abandoned Farmland
Figure 10 shows the distribution of the frequency of abandonment of farmland in Luquan during the period of 2011–2020; this was used to describe the number of times that the farmland was abandoned over the study period. The total area of abandoned farmland with abandonment frequencies of less than three years was 8193.73 hm2, accounting for 72.79% of the total area of all abandonment. The frequency of abandonment for most abandoned farmland was 1–3 years. The areas with a high frequency of abandonment were mainly in the mountains of west Luquan; in contrast, the areas with a low frequency of abandonment were mostly in the plains of east Luquan. The frequency of abandonment was inversely proportional to the area of abandoned farmland (Figure 11 and Table 5). The area of farmland with an abandonment frequency of one year was the most extensive at 4261.07 hm2, and the area of abandoned farmland with a frequency of 10 years was the smallest at 33.04 hm2.
5. Discussion
The accurate acquisition of the area and spatial distribution of abandoned farmland is the premise and foundation for solving the problem of abandoned farmland. Owing to the complexity and particular context of cultivated land abandonment, it is difficult to directly identify and extract abandoned farmland information from remote sensing images; thus, there are still many challenges in the extraction of data on large-scale abandonment of farmland.
- (1)
- Definition of abandoned farmland: In addition to the definition of the frequency of abandonment in Section 3.1, some scholars have different standards from diverse perspectives. For example, according to the different degrees of abandoned farmland, the IEEP divided abandoned farmland into completely abandoned, excessively abandoned, and incompletely abandoned farmland [30]; Some scholars divide abandoned farmland into active abandonment and passive abandonment according to different wishes of farmers [31]. Further refinement of this division involves the relative commitment of farmers; from the combination of the abandoned farmland and labour force, this classification can be divided into the expansion of (or increase in) abandoned farmland [32] and the recession of (or decrease in) abandoned farmland [27]. Different definitions of abandoned farmland will produce divergent results. This study only defined and extracted abandoned farmland from the perspective of the frequency of abandonment combined with the local cropping policies and crop phenology. Abandoned farmland should be defined according to local conditions and research purposes in specific areas.
- (2)
- Remote sensing image classification error transfer: In the process of remote sensing classification, the plots interpreted as grassland by remote sensing may contain other crops. This is particularly the case in spring, when crop land appears similar to grassland. This can result in incorrect classification; however, this is not a problem in autumn when the crops are easily distinguished from grassland. In this experiment, the detection of the changes in the vegetation index for spring and autumn and the spring image classification results were superimposed to minimise the incorrect classification of grassland and cultivated land, as well as the phenomenon of the non-identification of cultivated land. Because of the complexity of the phenomenon of abandoned farmland, it is difficult to identify abandoned farmland directly by using remote sensing images. In this experiment, the entire study area was interpreted through remote sensing, and the recognition rules for abandoned farmland were then determined. Thereafter, the abandoned farmland data were extracted. The classification errors evident in the remote sensing image classification were transferred to the extraction of the subsequently abandoned farmland, resulting in errors in the abandoned farmland extraction; such errors are difficult to eliminate. The abandoned farmland extraction error can be reduced by improving the classification accuracy of remote sensing images.
- (3)
- Precision validation: The abandonment of farmland does not involve a single type of land, such as areas buildings and water, but rather results in a change in the type of cultivated land. It is difficult to obtain verification data through the visual interpretation of location, texture, colour, and other characteristics. Real verification requires data on actual cultivated land that has been abandoned. However, there are insufficient available historical statistical data on the abandonment of farmland. Furthermore, the accuracy of the extraction of abandoned farmland data can only be indirectly confirmed by verifying the accuracy of land classification results; thus, the precision validation method needs improvement.
The accuracy of the extraction of data on abandoned land can be ensured by improving the single-stage classification accuracy in follow-up research. The image band type is relatively singular; thus, the spatial location information of ground objects can be introduced in the future to improve the image classification accuracy. This is particularly the case given the textural and spectral characteristics of the images and the lack of spatial information. Further, land cultivation is controlled by the natural environment and human factors. In the process of extracting data on the cultivation of land based on a variety of crops, selecting remote sensing images from different periods can reduce the omission of cultivated land. For example, to identify annual double cropping in an area of cultivated land, at least two images can be selected to represent the growth periods of the two crops; similarly, for triple cropping, at least three representative images can be selected. This can improve the accuracy of the identification of cultivated land, reduce the omission of cultivated land, and provide high-precision background data on the cultivated land. In addition, obtaining actual abandoned farmland data can provide verification data for the identification of abandoned farmland. Because there are few historical high-resolution remote sensing images, it is difficult to obtain such data. In recent years, field investigations and interviews with local farmers have enabled researchers to determine the locations of abandoned farmland plots based on the farmers’ memories. This has provided real verification samples for the precise verification of abandoned land. However, this method of obtaining real samples requires substantial labour and financial resources.
6. Conclusions
The large-scale abandonment of farmland aggravates the contradiction between humans and farmland and even involves a nation’s food security. Therefore, accurately extracting abandoned farmland is of great significance. Based on long time series of multi-source data, the abandoned farmland was extracted by using remote sensing methods with random forest classification and the detection of changes in vegetation indexes. The spatial distribution of abandoned farmland and reclaimed farmland was analysed, and the frequency of abandonment in the study area within a period of 10 years was obtained. Our conclusions are as follows:
- (1)
- A land-use time-series map for Luquan from 2010 to 2020 was obtained by using RF classification and NDVI detection methods; the overall classification accuracy was between 91.81% and 96.92%, and the kappa coefficient was in the range of 0.89–0.96, which is highly accurate and can be used as the basic data for abandoned farmland identification.
- (2)
- From 2011 to 2020, the maximum abandoned area was 3906.02 hm2, and the minimum was 1618.74 hm2. The highest and lowest abandonment rates were 14.09% and 5.83%, respectively. From 2012 to 2017, the abandonment rate was comparatively high at more than 10%. In recent years, the abandonment rate has declined. During the monitoring period, the abandoned area showed a trend of first increasing and then decreasing in the study area.
- (3)
- From 2012 to 2020, the maximum reclamation area of abandoned farmland was 291.49 hm2, and the minimum was 34.94 hm2. The highest reclamation rate was 14.26%, the lowest was 0.95%, and the annual average reclamation rate was 4.67%. The overall reclamation rate was low, with reclamation mainly being concentrated in the plain areas, which are suited to cultivation; in contrast, the abandoned cultivated land in the western mountainous areas showed almost no signs of reclamation.
- (4)
- The areas with a high frequency of abandonment were mainly concentrated in the western mountainous area of Luquan, while the eastern plain had a relatively low frequency of abandonment. The area of abandoned farmland gradually decreased as the frequency of abandoned farmland increased.
Author Contributions
Conceptualisation, X.G. and Z.W.; methodology, Z.W.; software, Z.W.; validation, Z.W.; formal analysis, X.G.; investigation, X.H. and Q.S.; resources, Y.G.; data curation, Z.W.; writing—original draft preparation, Z.W.; writing—review and editing, X.G.; visualisation, X.G.; supervision, X.G.; project administration, X.G.; funding acquisition, X.G. All authors have read and agreed to the published version of the manuscript.
Funding
This research was funded by the National Natural Science Foundation of China (41801276); the Beijing Natural Science Foundation (8192015); the Beijing Talents Project (2020A58); Science and Technology Support Program of Langfang (2019011027).
Data Availability Statement
Data are available on the Geospatial Data Cloud website (http://www.gscloud.cn, accessed on 19 January 2021) and the European Space Agency website (https://scihub.copernicus.eu, accessed on 18 February 2021).
Acknowledgments
We extend our warm thanks to the technical teams at the Shijiazhuang Academy of Agriculture and Forestry Sciences who participated in the ground-truth measurement campaigns and data processing.
Conflicts of Interest
The authors declare no conflict of interest.
References
- Tian, Y.; Li, X.; Ma, G. Influences of labor emigration from agriculture on the production abandonment of cultivated land in ecological sensitive areas. China Land Sci. 2010, 24, 4–9. [Google Scholar]
- Liu, G.; Wang, H.; Cheng, Y. Impact of rural out-migration on arable land use intensity: Evidence from mountain areas in Guangdong, China. Land Use Pol. 2016, 59, 569–579. [Google Scholar] [CrossRef]
- Li, S.; Li, X. Progress and prospect on farmland abandonment. Acta Geogr. Sin. 2016, 71, 370–389. (In Chinese) [Google Scholar]
- Yan, J.; Yang, Z.; Li, Z.; Li, X.; Xin, L.; Sun, L. Drivers of cropland abandonment in mountainous areas: A household decision model on farming scale in Southwest China. Land Use Pol. 2016, 57, 459–469. [Google Scholar] [CrossRef] [Green Version]
- Zhang, Y.; Li, X.; Song, W. Determinants of cropland abandonment at the parcel, household and village levels in mountain areas of China: A multi-level analysis. Land Use Pol. 2014, 41, 186–192. [Google Scholar] [CrossRef]
- Li, S.; Li, X.; Sun, L.; Cao, G.; Fischer, G.; Tramberend, S. An estimation of the extent of cropland abandonment in mountainous regions of China. Land Degrad. Dev. 2018, 29, 1327–1342. [Google Scholar] [CrossRef]
- Li, X.; Zhao, Y. Forest Transition, Agricultural land marginalization and ecological restoration. China Popul. Resour. Environ. 2011, 21, 91–95. [Google Scholar]
- Deng, X.; Xu, D.; Zeng, M.; Qi, Y. Landslides and Cropland Abandonment in China’s Mountainous Areas: Spatial Distribution, Empirical Analysis and Policy Implications. Sustainability 2018, 10, 3390. [Google Scholar] [CrossRef] [Green Version]
- Xiao, G.; Zhu, X.; Hou, C.; Xia, X. Extraction and analysis of Abandoned Farmland: A case study of Qingyun county and Wudi County in Shandong Province. Acta Geogr. Sinica 2019, 73, 1658–1673. (In Chinese) [Google Scholar] [CrossRef] [Green Version]
- Cibele, Q.; Ruth, B.; Carl, F.; Regina, L. Farmland Abandonedz: Threat or Opportunity for Biodiversity Conservation? A Global Review. Front. Ecol. Environ. 2014, 12, 288–296. [Google Scholar]
- Molinillo, M.; Lasanta, T.; García-Ruiz, J.M. RESEARCH: Managing Mountainous Degraded Landscapes After Farmland Abandonment in the Central Spanish Pyrenees. Environ. Manag. 1997, 21, 587–598. [Google Scholar] [CrossRef]
- Bakker, M.M.; Govers, G.; van Doorn, A.; Quetier, F.; Chouvardas, D.; Rounsevell, M. The Response of Soil Erosion and Sediment Export to Land-use Change in Four Areas of Europe: The Importance of Landscape Pattern. Geo Morphol. 2008, 98, 213–226. [Google Scholar] [CrossRef]
- Batllebayer, L.; Batjes, N.H.; Bindraban, P.S. Changes in Organic Ca-rbonStocks upon Land Use Conversion in the Brazilian Cerrado: A Review. Agric. Ecosyst. Environ. 2010, 137, 47–58. [Google Scholar] [CrossRef]
- Vuichard, N.; Ciais, P.; Belelli, L.; Smith, P.; Valentini, R. Carbon Sequestration Due to the Abandoned of Agriculture in the Former USSR Since 1990. Glob. Biogeochem. Cycles 2008, 22, 1417–1430. [Google Scholar] [CrossRef]
- MacDonald, D.; Crabtree, J.R.; Wiesinger, G.; Dax, T.; Stamou, N.; Fleury, P.; Gutierrez Lazpita, J.; Gibon, A. Agricultural Aban-donment in Mountain Areas of Europe: Environmental Consequences and Policy Response. J. Environ. Manag. 2000, 59, 47–69. [Google Scholar] [CrossRef]
- Xie, H.; Wang, P.; Yao, G. Exploring the Dynamic Mechanisms of Farmland Abandonment Based on a Spatially Explicit Economic Model for environmental Sustainability. Sustainability 2014, 6, 1260–1282. [Google Scholar] [CrossRef] [Green Version]
- Dong, J.; Liu, J.; Yan, H.; Tao, F.; Kuang, W. Spatio-temporal Pattern and Rationality of Land Reclamation and Cropland Abandonment in Mid-eastern Inner Mongolia of China in 1990–2005. Environ. Monit. Assess. 2011, 179, 137–153. [Google Scholar] [CrossRef]
- Li, Z.; Yan, J.; Hua, X.; Xin, L.; Li, X. Study on abandonment of different types of farmers and its influencing factors: A case study of 12 typical villages in Chongqing. Geogr. Res. 2014, 33, 721–734. (In Chinese) [Google Scholar]
- Song, S.; Liang, X.; Chen, H.; Mao, N. Simulation of cultivated land abandonment based on Multi-Agent and land conversion model: A case study of Mizhi County, Shaanxi Province. J. Nat. Resour. 2018, 33, 515–525. (In Chinese) [Google Scholar]
- Witmer, F.D.W. Detecting War-induced Abandoned Agricultural Land in Northeast Bosnia Using Multispectral, Multitemporal Landsat TM Imagery. Int. J. Remote Sens. 2008, 29, 3805–3831. [Google Scholar] [CrossRef]
- Cheng, W.; Zhou, Y.; Wang, S.; Han, Y.; Wang, F.; Pu, Q. Study on abandoned farmland identification based on Multispectral Remote Sensing. Spectrosc. Spectr. Anal. 2011, 31, 1615–1620. (In Chinese) [Google Scholar]
- Niu, J.; Lin, H.; Niu, Y.; Fan, Y.; Tang, W. Analysis on spatial pattern and driving factors of abandoned farmland in economically underdeveloped areas. J. Agric. Mach. 2017, 48, 146–154. (In Chinese) [Google Scholar]
- Yang, T.; Guo, X.; Yue, D.; Wang, X.; Han, S. Extraction of cultivated land abandonment information based on joint change detection and analysis of driving factors. Acta Agric. Mech. Sinica 2019, 50, 201–208. (In Chinese) [Google Scholar]
- Xu, M. Food and Agriculture Organization of the United Nations. In Selected Indicators of Food and Agriculture Development in Asia Pacific Region: 1996–2006; China Agriculture Press: Beijing, China, 2009; pp. 89–90. (In Chinese) [Google Scholar]
- Shi, T.; Li, X. Research on cultivated land abandonment in Europe and Its Enlightenment to China. Geogr. Geogr. Inf. Scienc 2013, 29, 101–103. (In Chinese) [Google Scholar]
- Song, S.; Liang, X.; Mei, Y.; Wen, X.; Wang, Y.; Mao, N. Construction and Simulation of farmers’ cultivated land abandonment behavior model based on CBDI: A case study of fengyangdi village, Mizhi County, Shanxi Province. J. Nat. Resour. 2016, 31, 1926–1937. (In Chinese) [Google Scholar]
- Shen, S. Study on the Problem of Agricultural Land Abandonment in Western Poor Mountainous Areas; Capital University of Economics and Trade: Beijing, China, 2017. (In Chinese) [Google Scholar]
- Ding, R.; Zhang, E.; Xie, Z.; Ji, W.; Shao, H. Extraction and analysis of abandoned farmland in Hebei Shandong Henan provincial border area. Hubei Agric. Sci. 2019, 58, 122–128. (In Chinese) [Google Scholar]
- Wei, S. Mapping Cropland Abandonment in Mountainous Areas Using an Annual Land-Use Trajectory Approach. Sustainability 2019, 11, 5951. [Google Scholar]
- Clunie, K.; Graham, T. Farmland Abandonment in the EU: An Assessment of Trends and Prospects; Report Prepared for WWF; WWF: Zeist, The Netherlands, 2010; pp. 20–40. [Google Scholar]
- Feng, Y.; Dong, Y.; Wang, F. Analysis on abandonment behavior and influencing factors of farmers in suburbs of big cities: A case study of farmers in Panyu District of Guangzhou. J. Nat. Resour. 2010, 25, 722–734. (In Chinese) [Google Scholar]
- Huang, J.; Li, L. Analysis of cultivated land abandonment behavior from the perspective of rural labor force: An Empirical Study Based on rural areas of Huitong County. J. Beijing Univ. Technol. (Soc. Sci. Ed.) 2009, 11, 42–47. (In Chinese) [Google Scholar]
Figure 1.
Location of the study area.

Figure 2.
Farmland and field survey data in the study area.
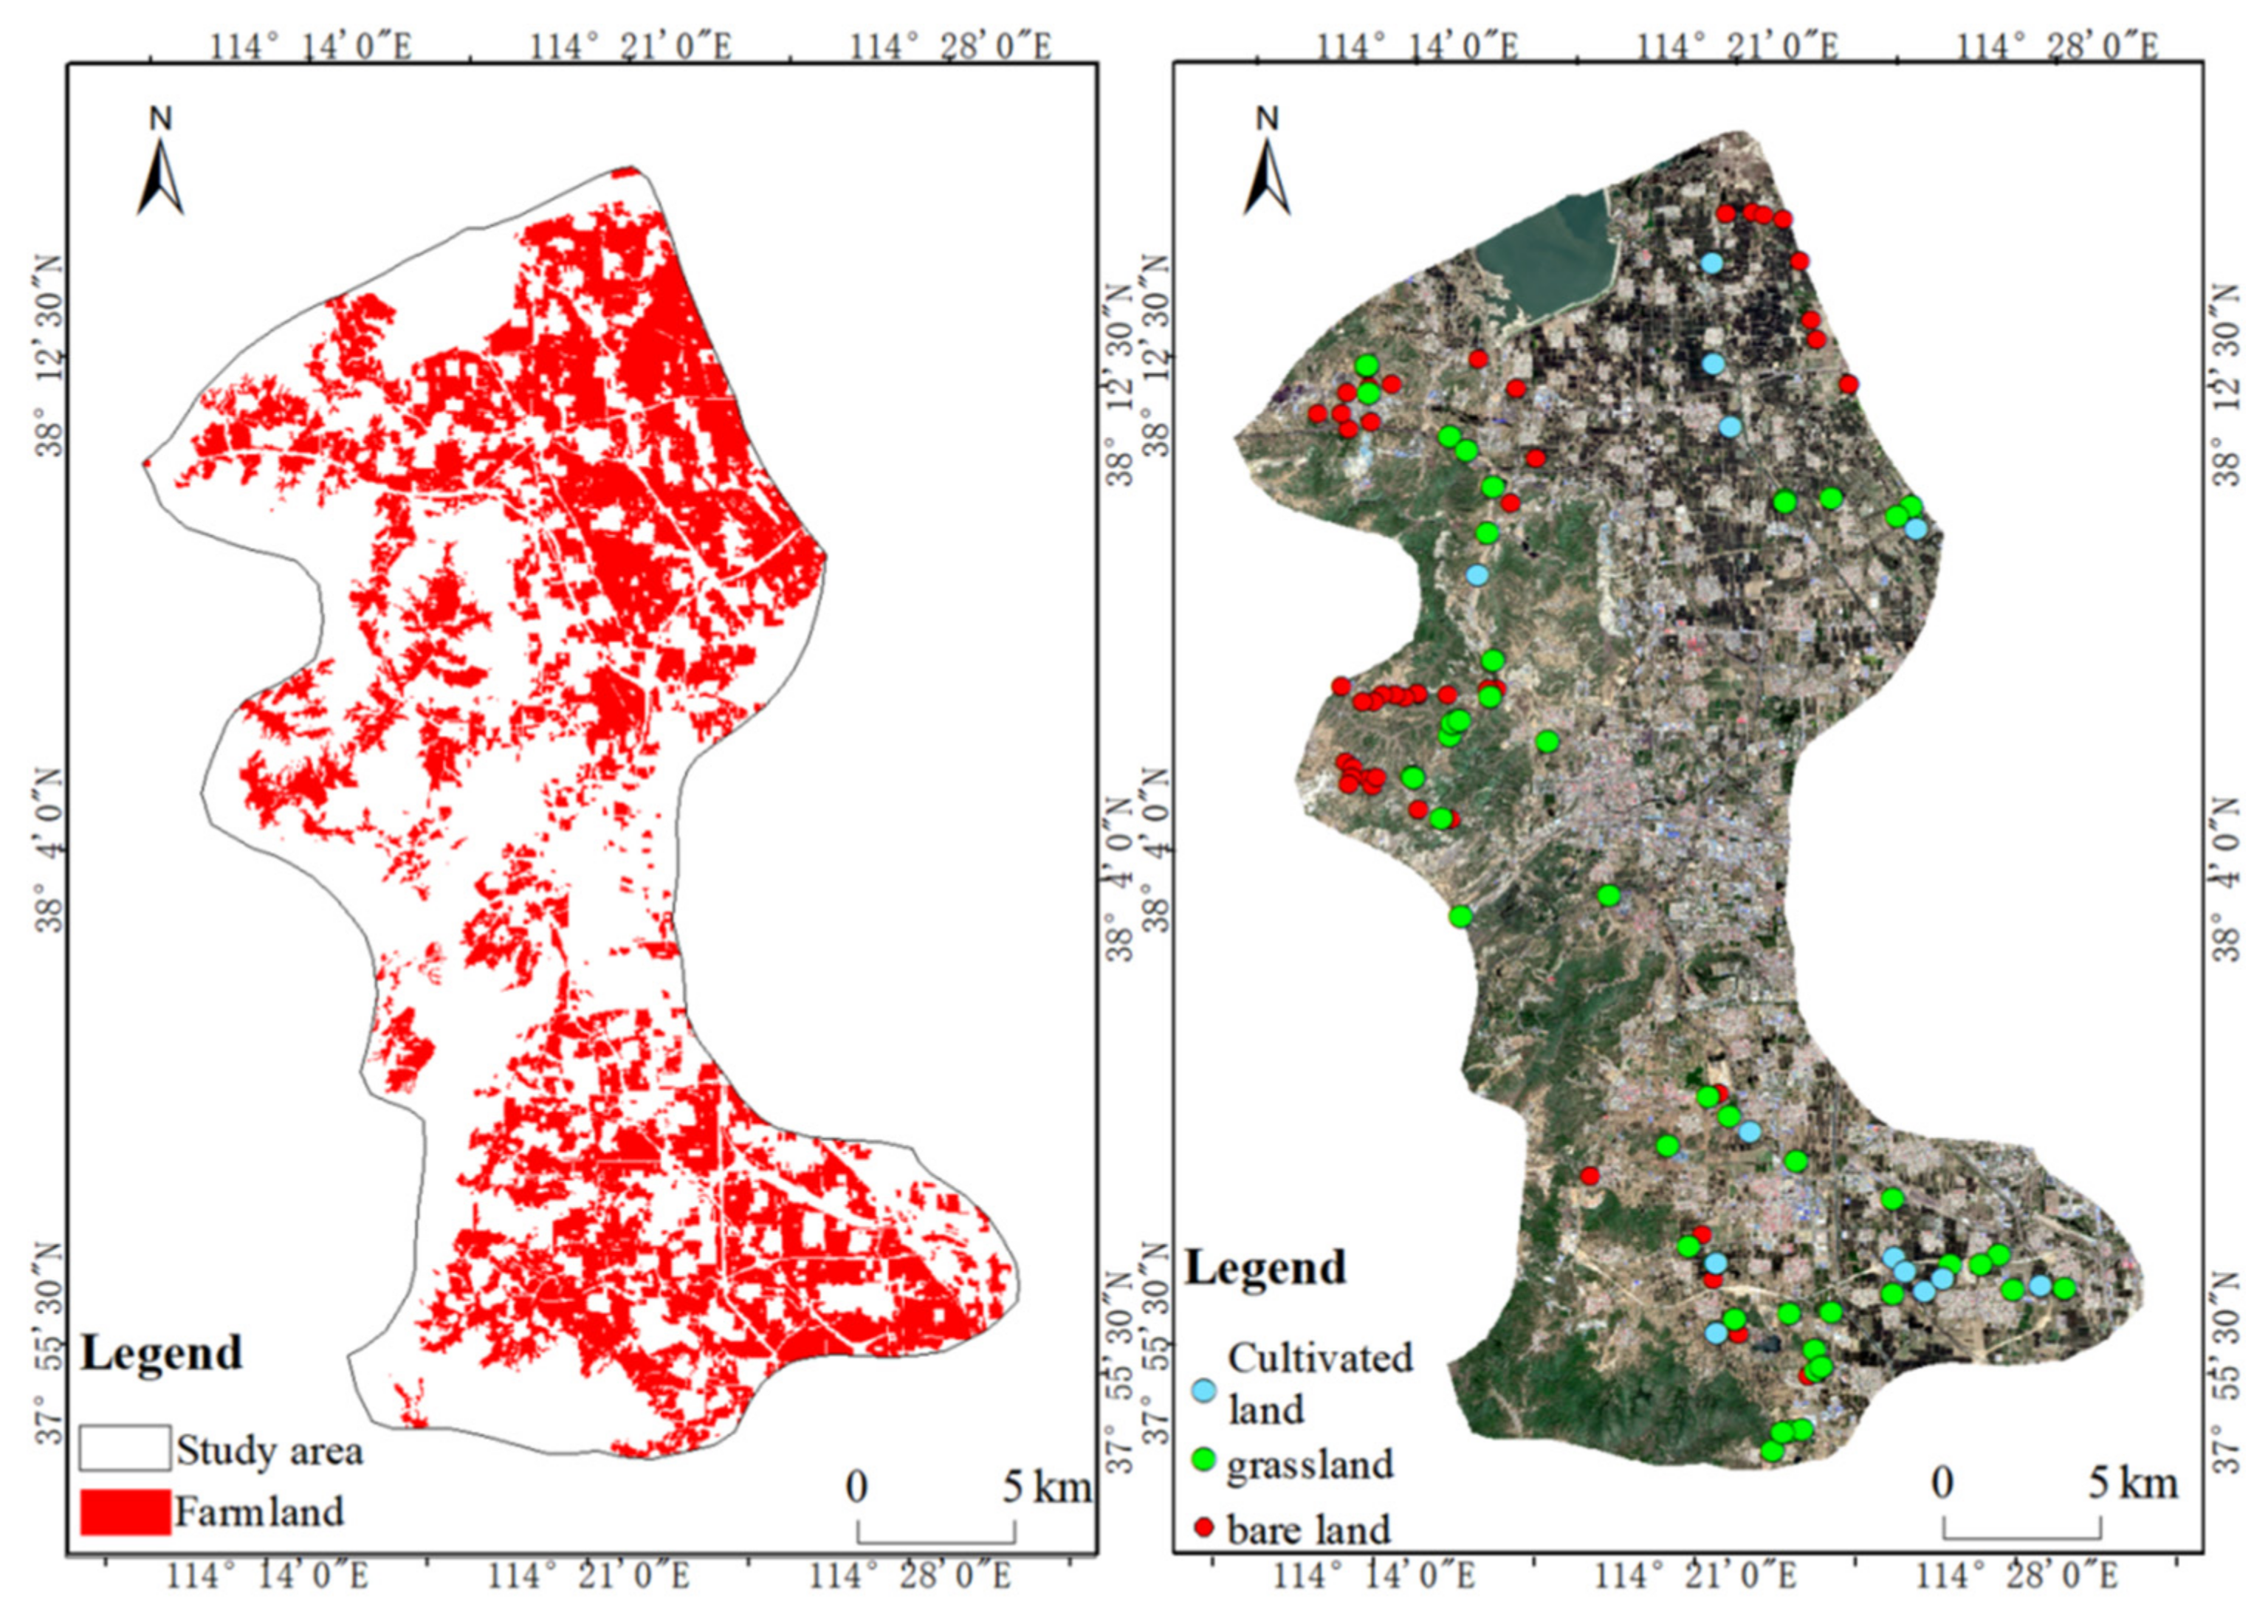
Figure 3.
ASTER GDEM data in the study area.
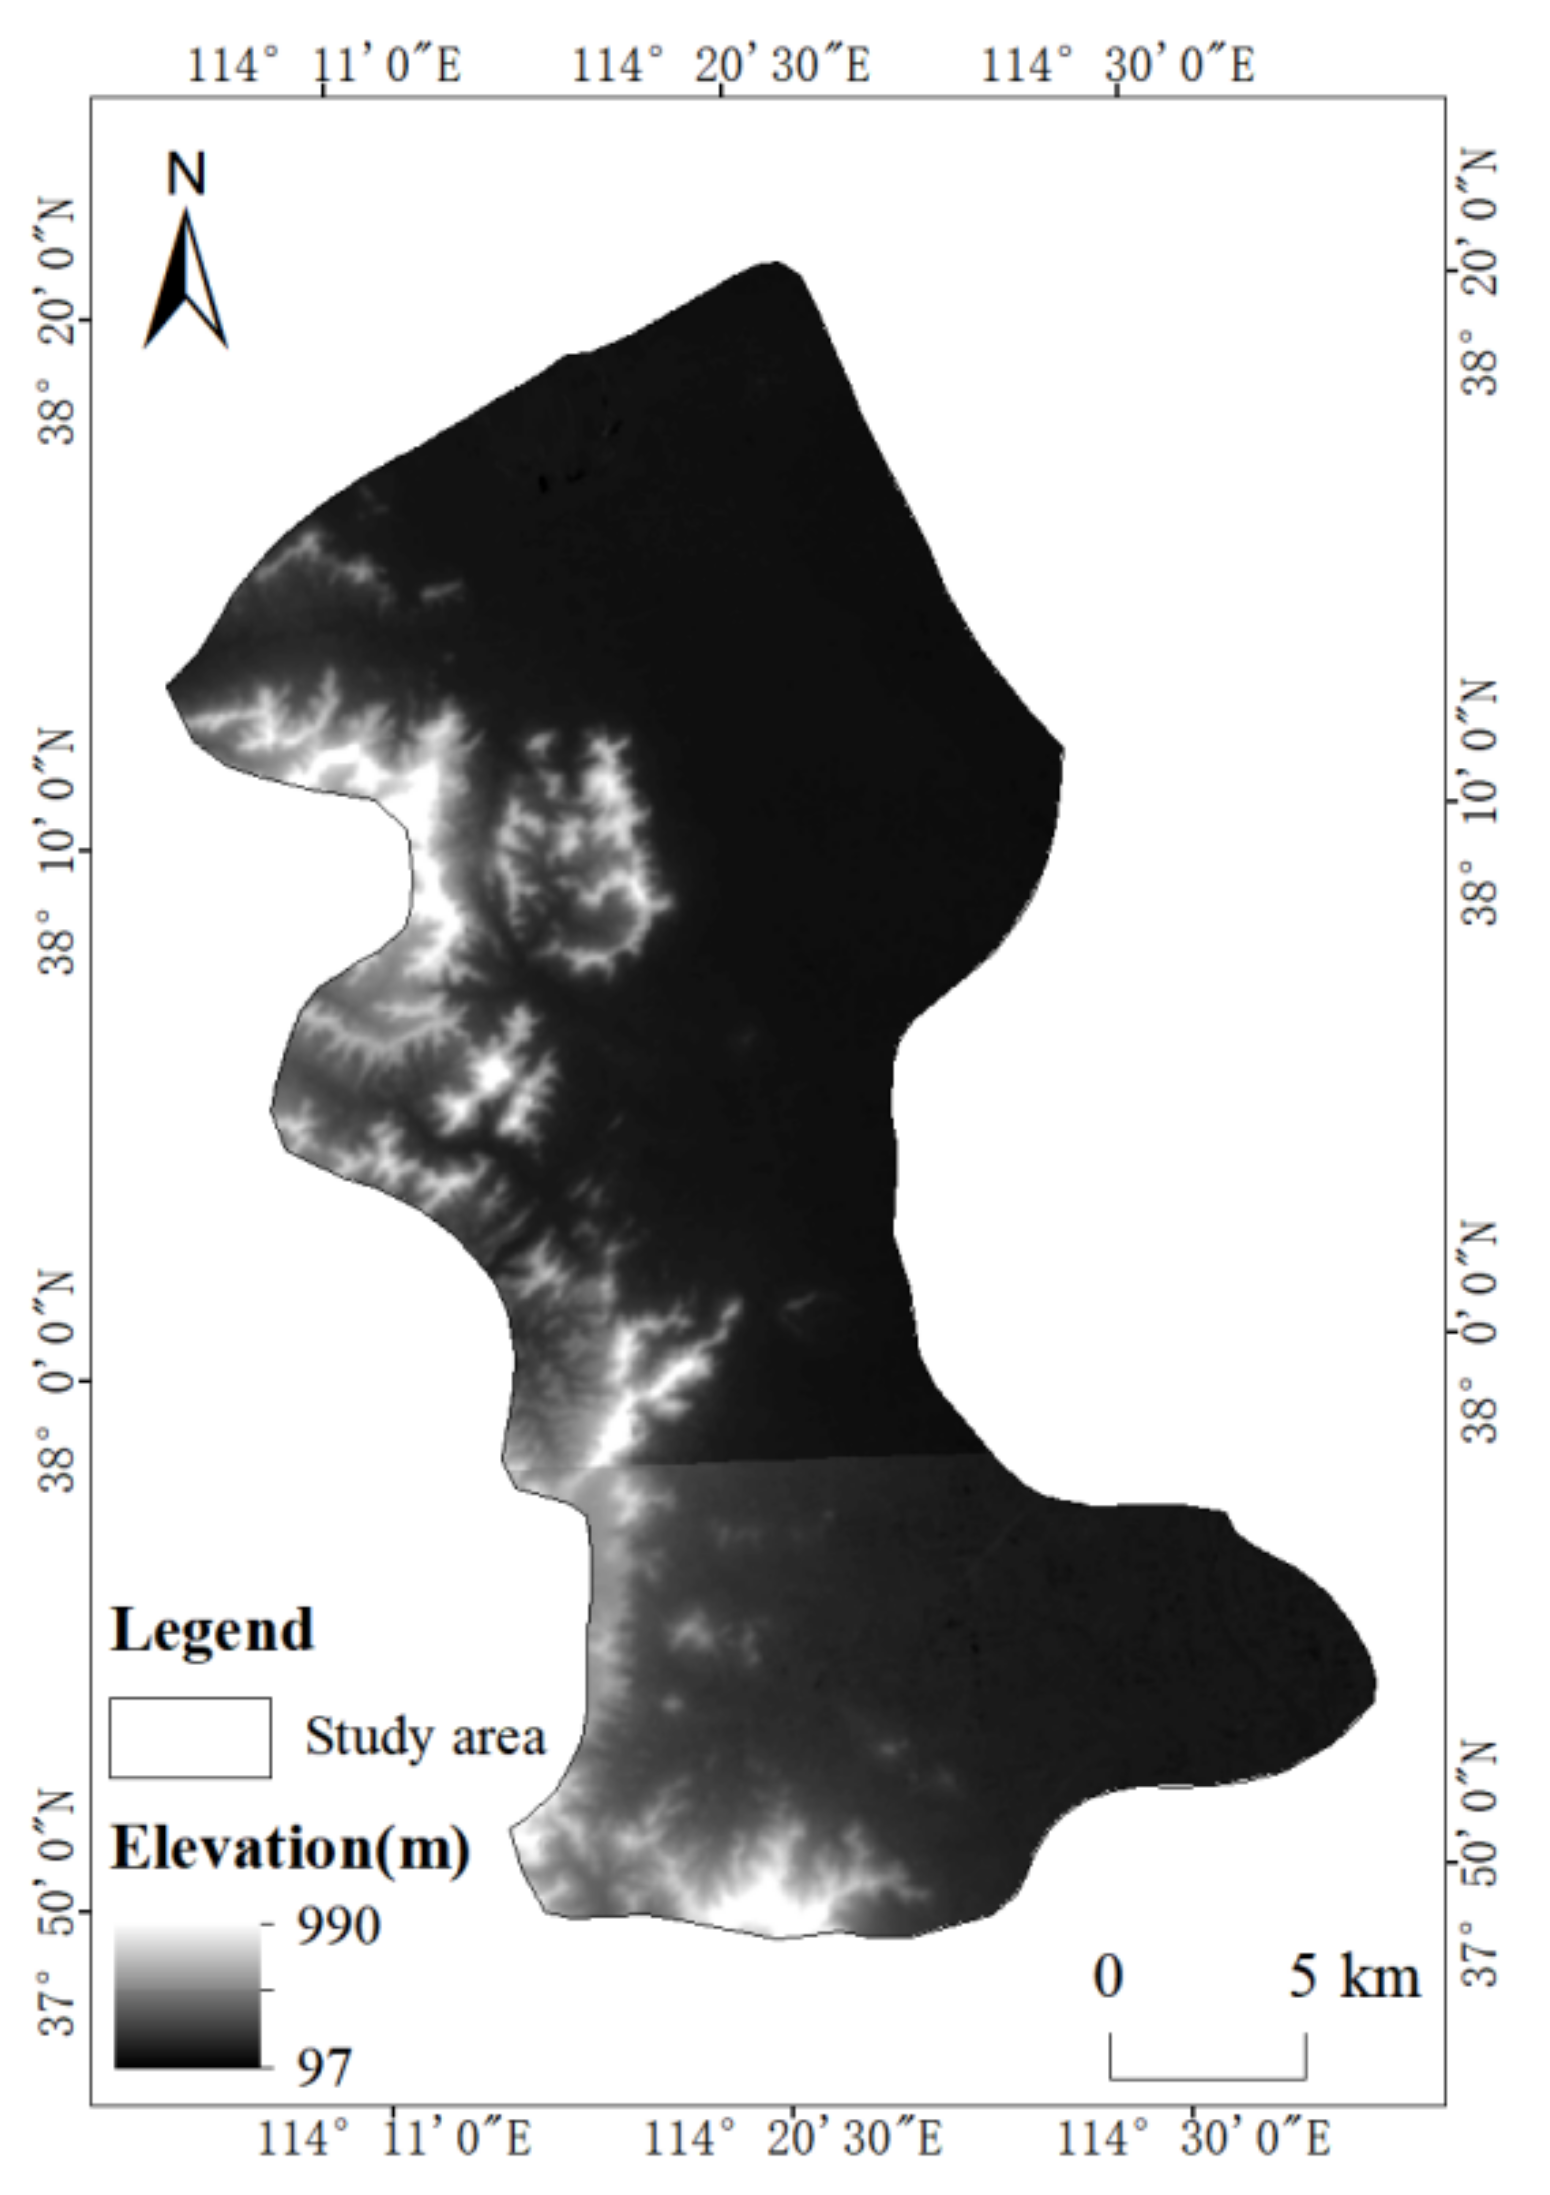
Figure 4.
Flowchart of the methods for this study.

Figure 5.
Land-use time-series map of Luquan from 2010 to 2020.

Figure 6.
Abandonment time-series distribution map in Luquan for the period of 2011–2020.
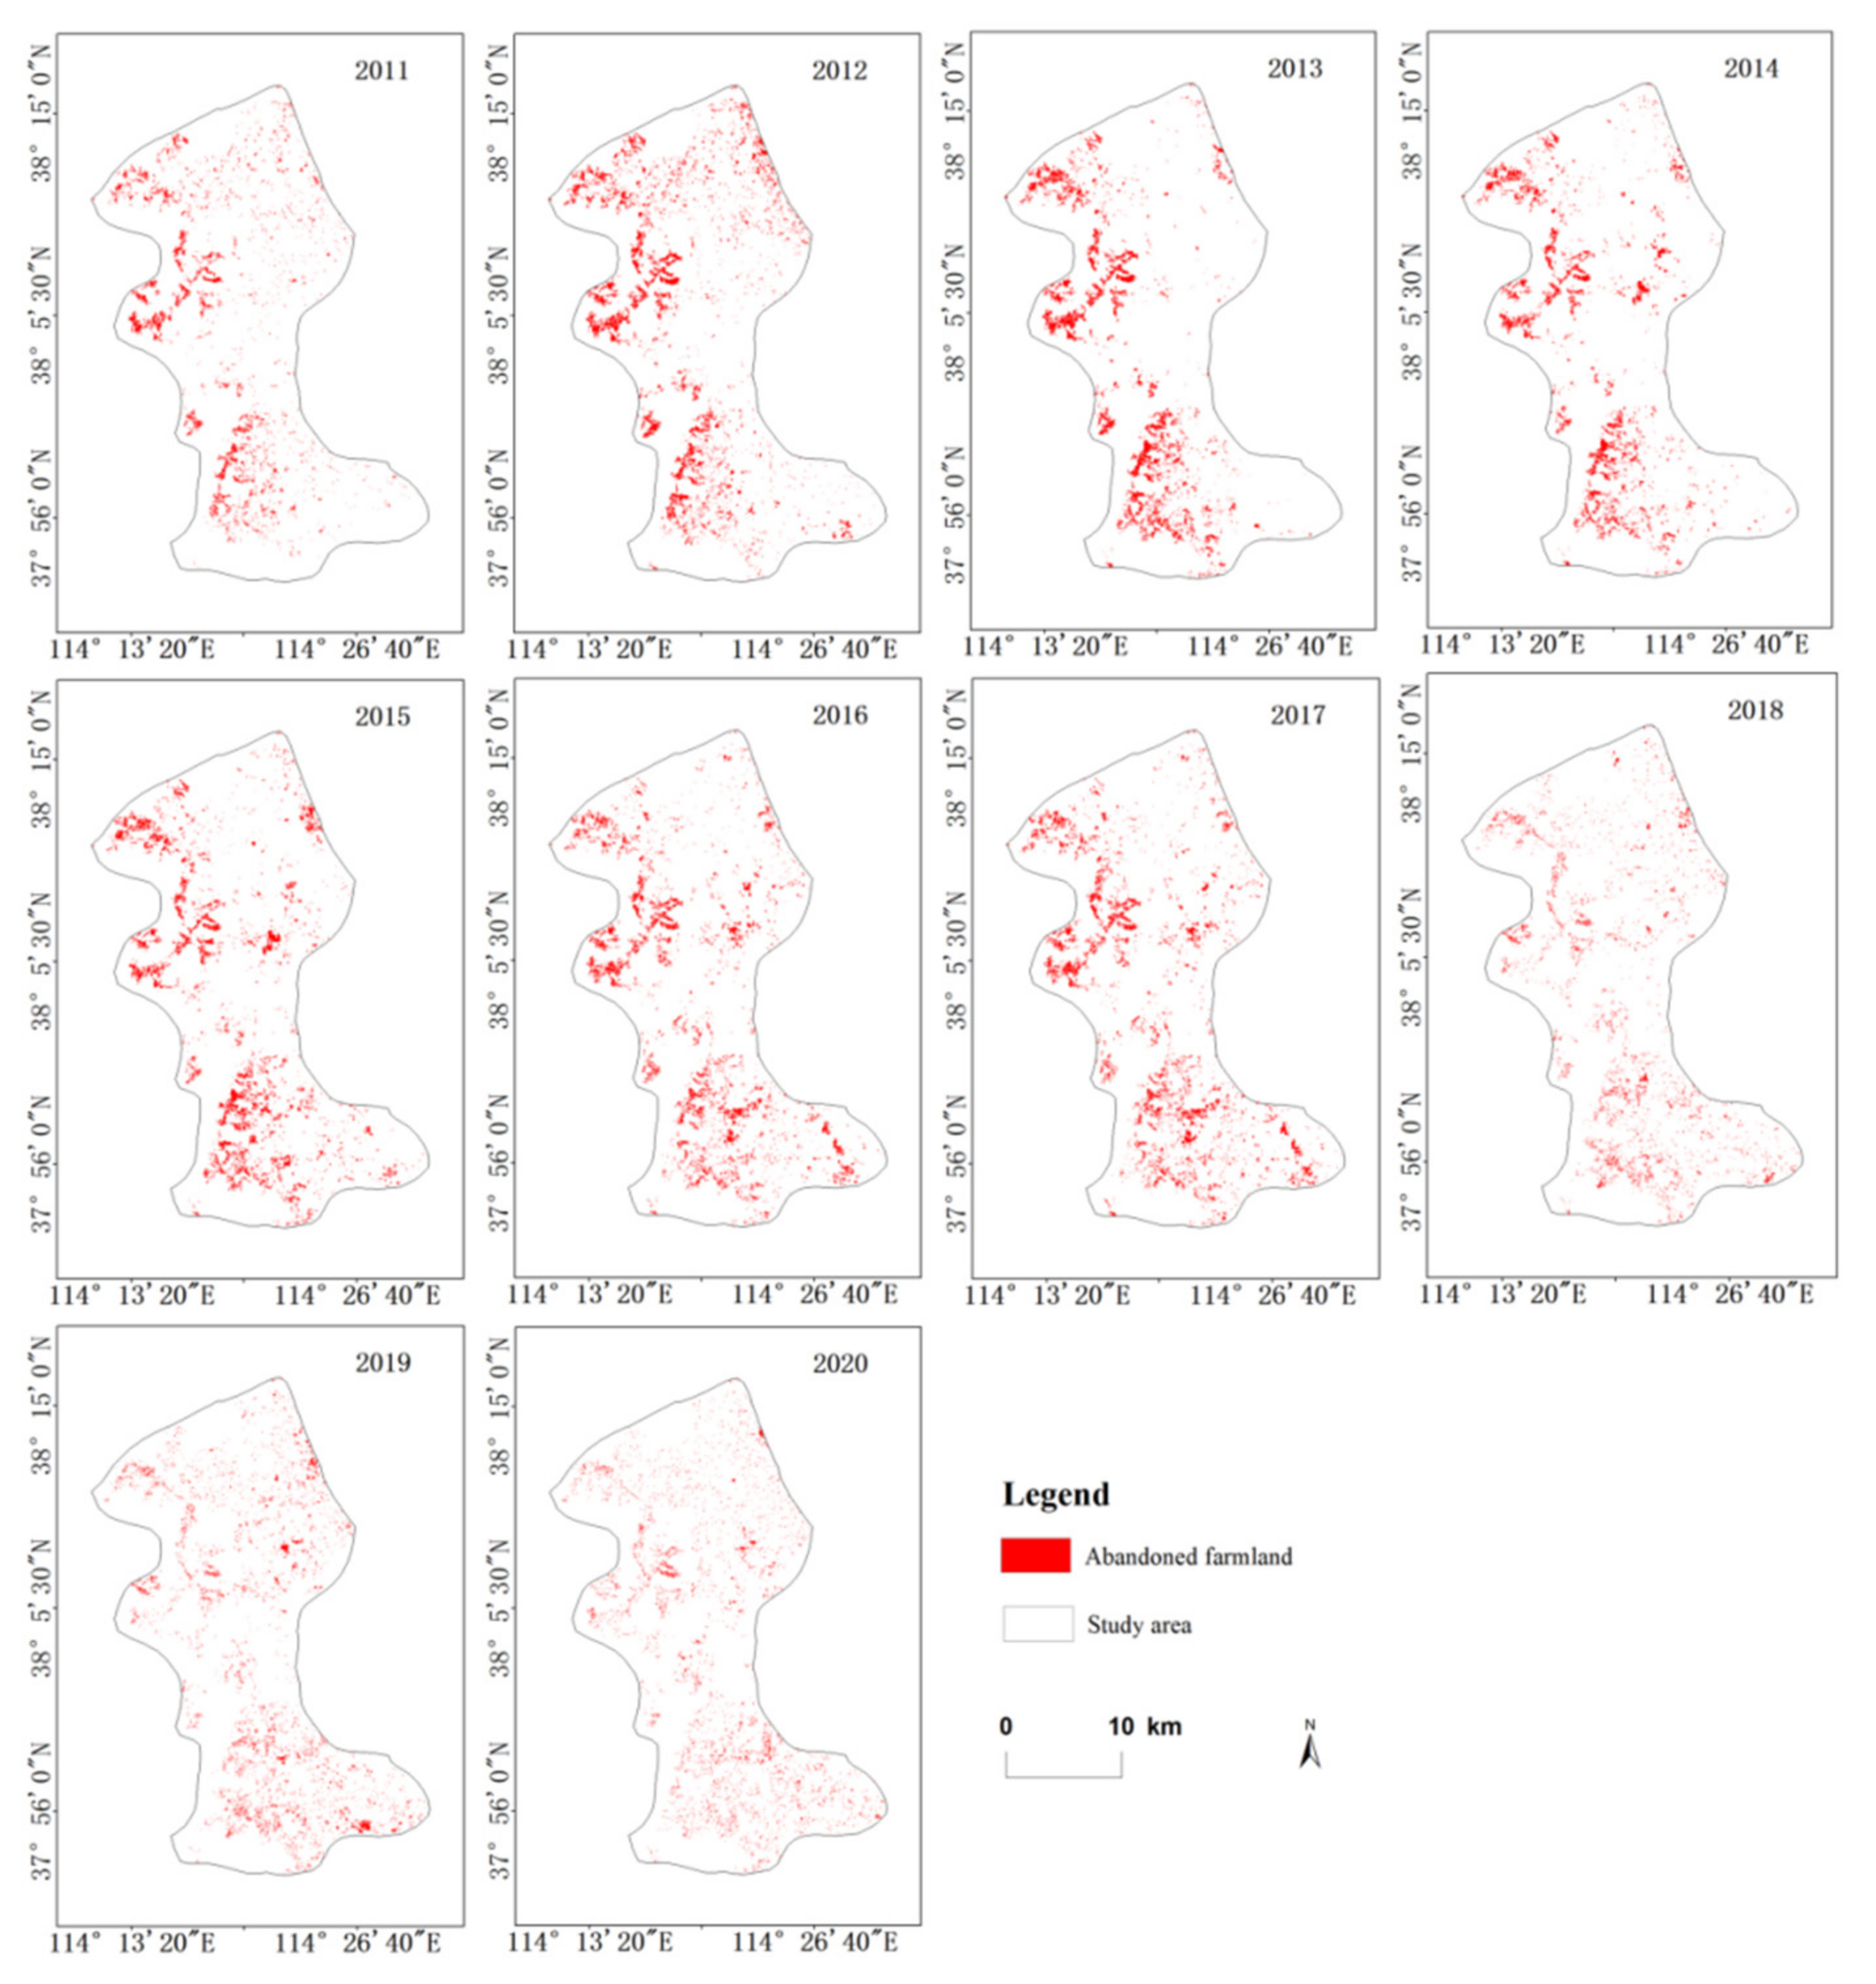
Figure 7.
Abandoned farmland area and abandonment rate in Luquan for the period 2011–2020.

Figure 8.
Re-cultivation time-series distribution map in Luquan for the period of 2012–2020.
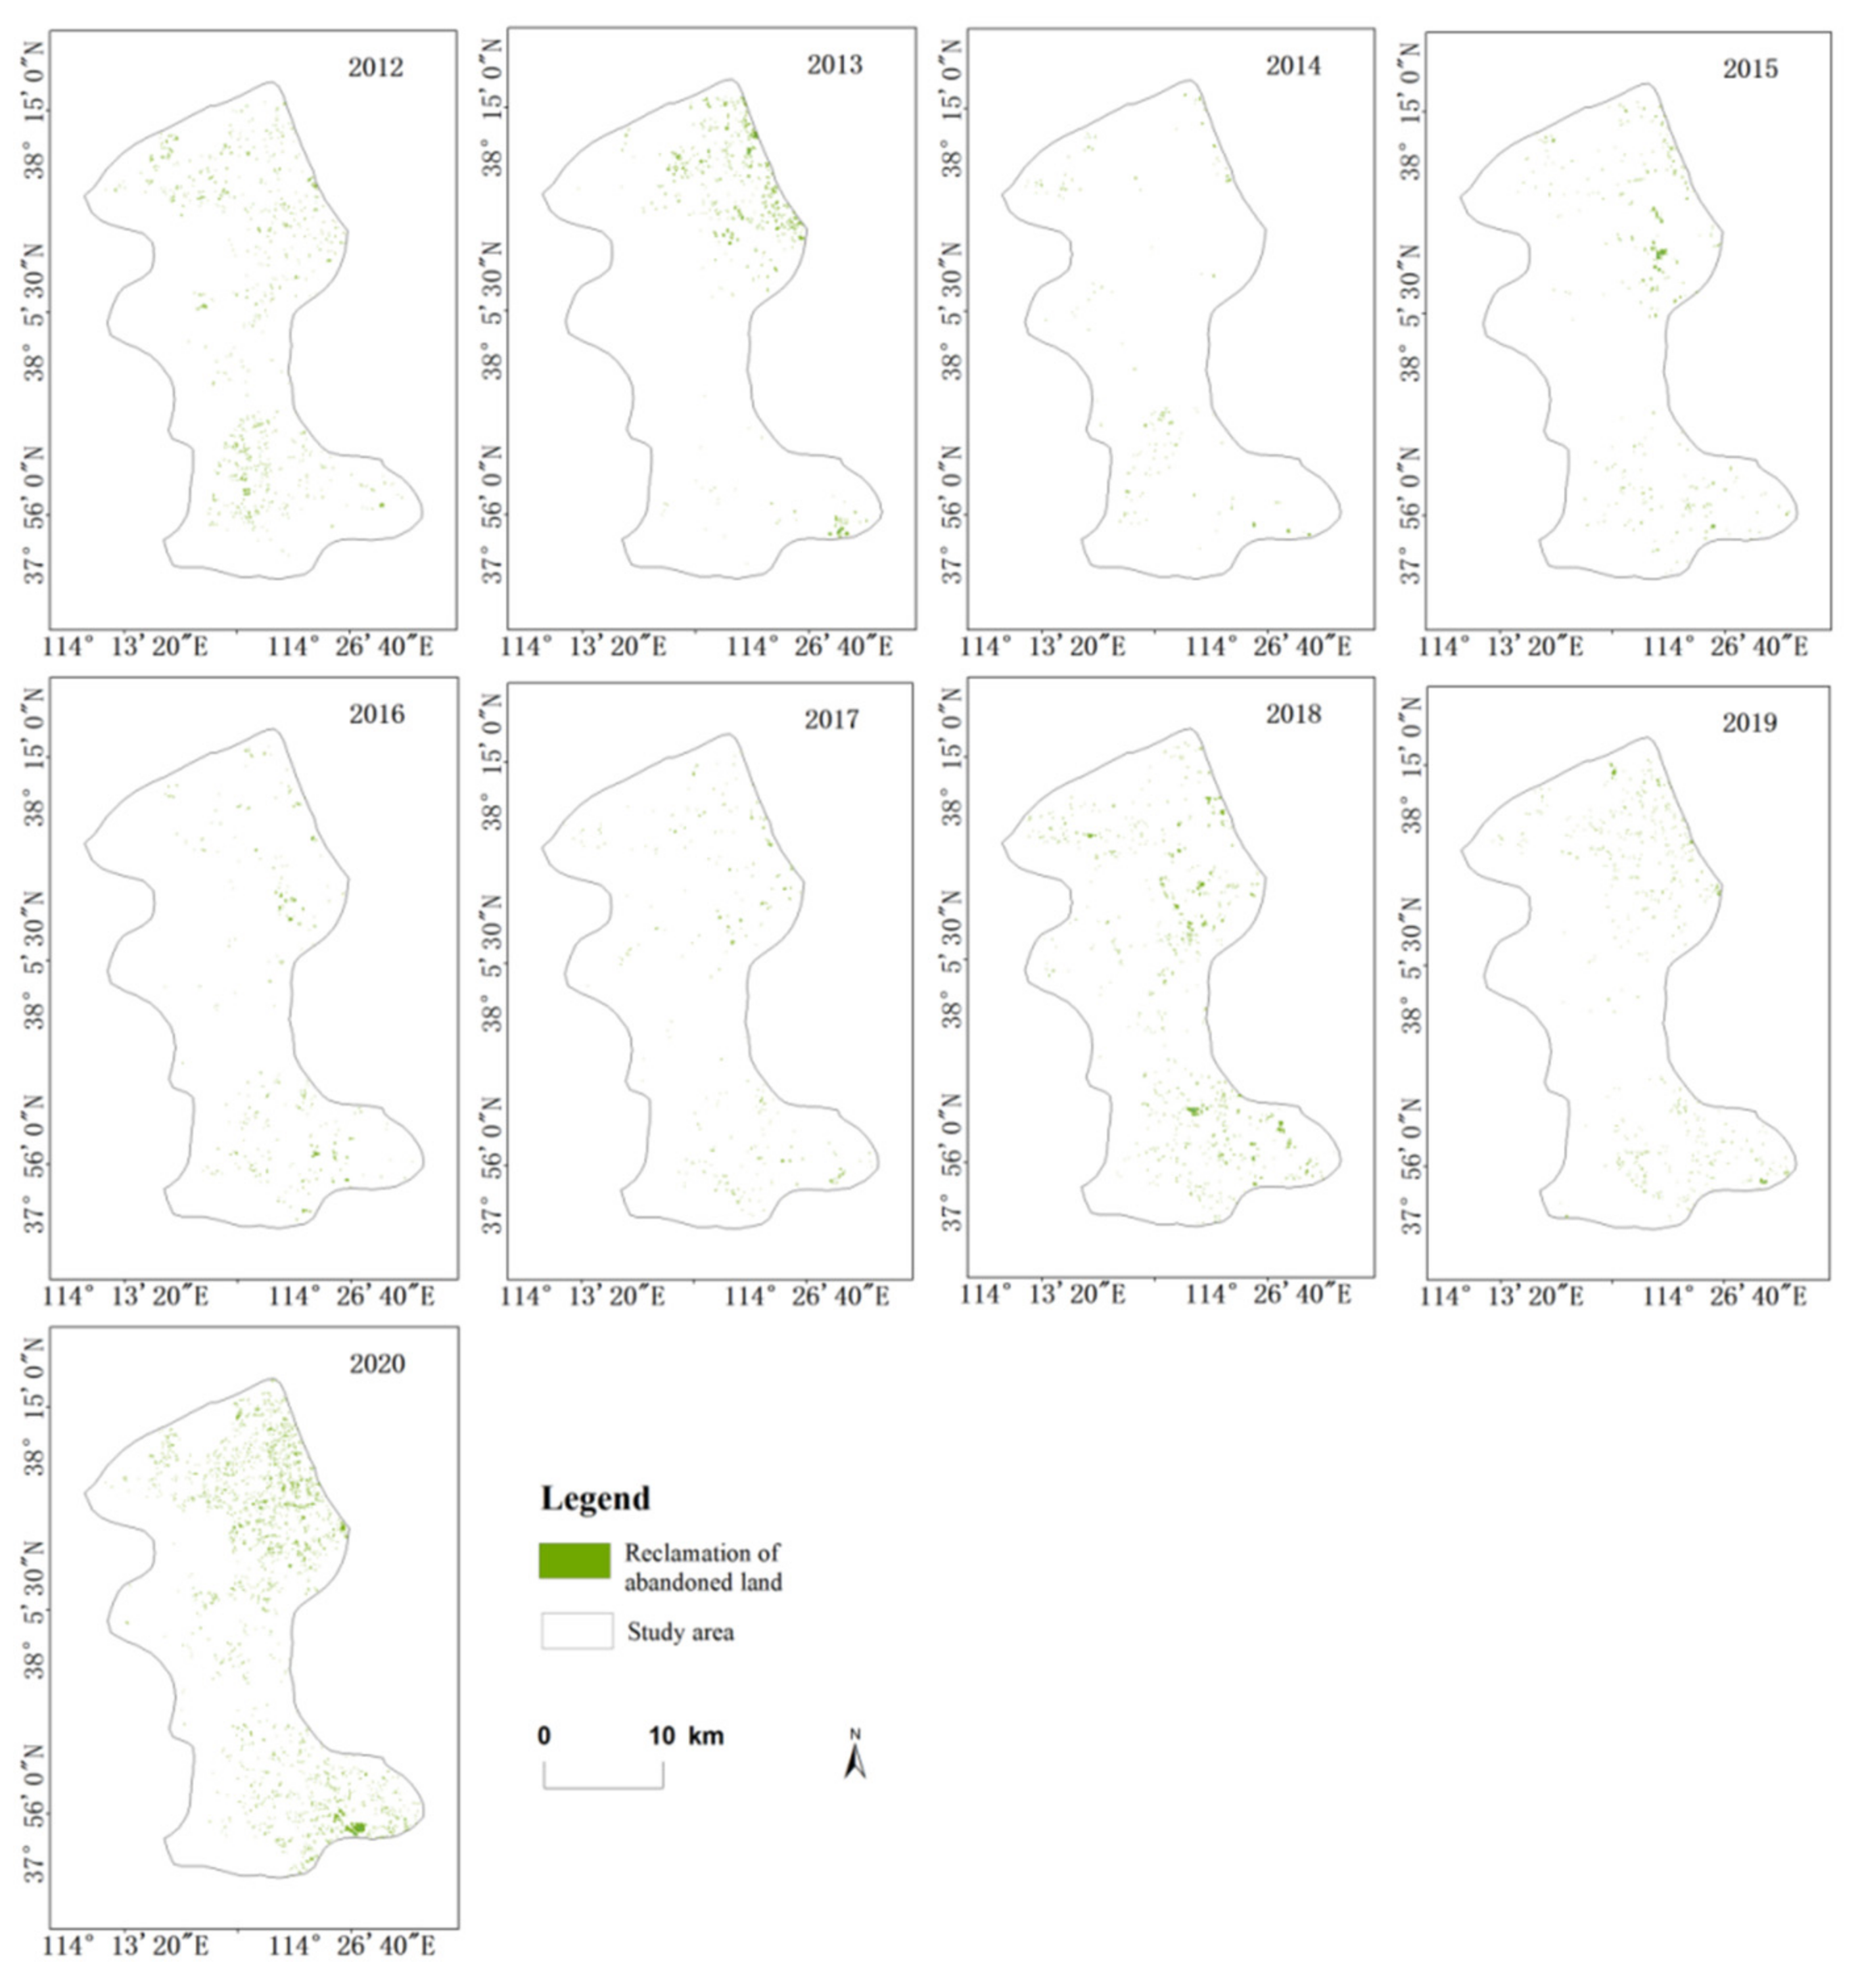
Figure 9.
Area and rate of re-cultivation of abandoned farmland in Luquan for the period of 2012–2020.
Figure 9.
Area and rate of re-cultivation of abandoned farmland in Luquan for the period of 2012–2020.
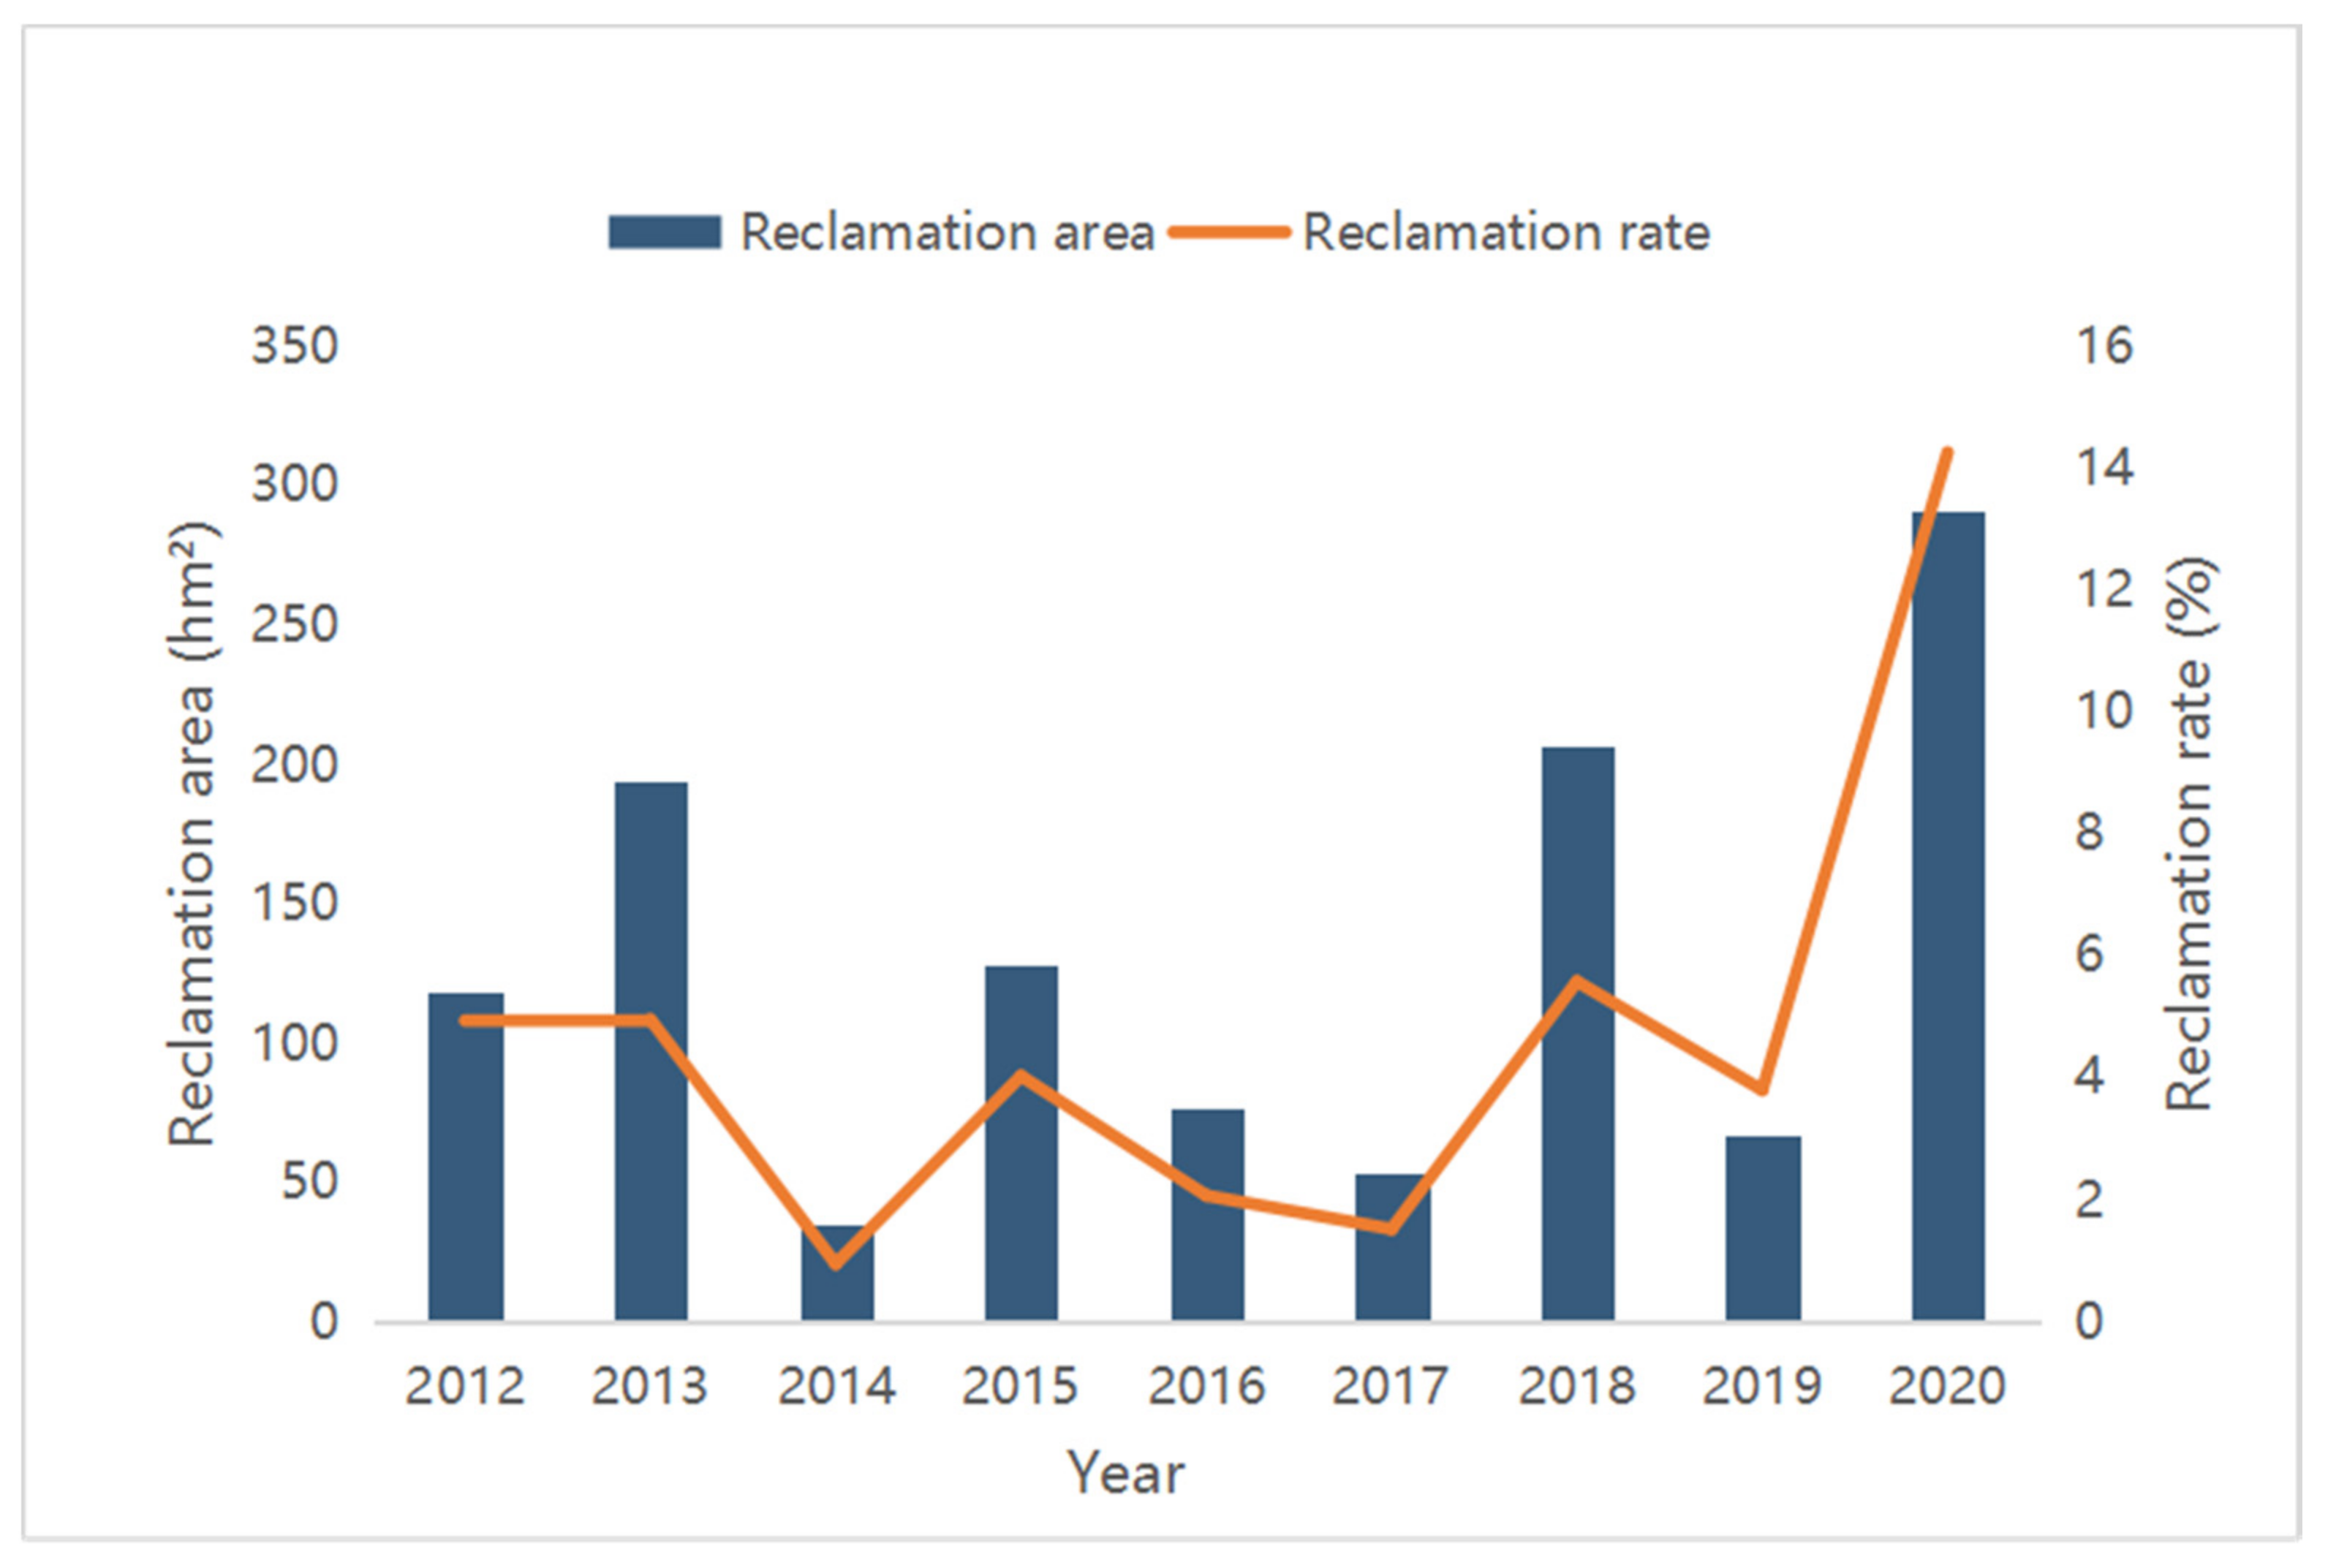
Figure 10.
Distribution of the farmland abandonment frequency in Luquan for the period of 2011–2020.
Figure 10.
Distribution of the farmland abandonment frequency in Luquan for the period of 2011–2020.
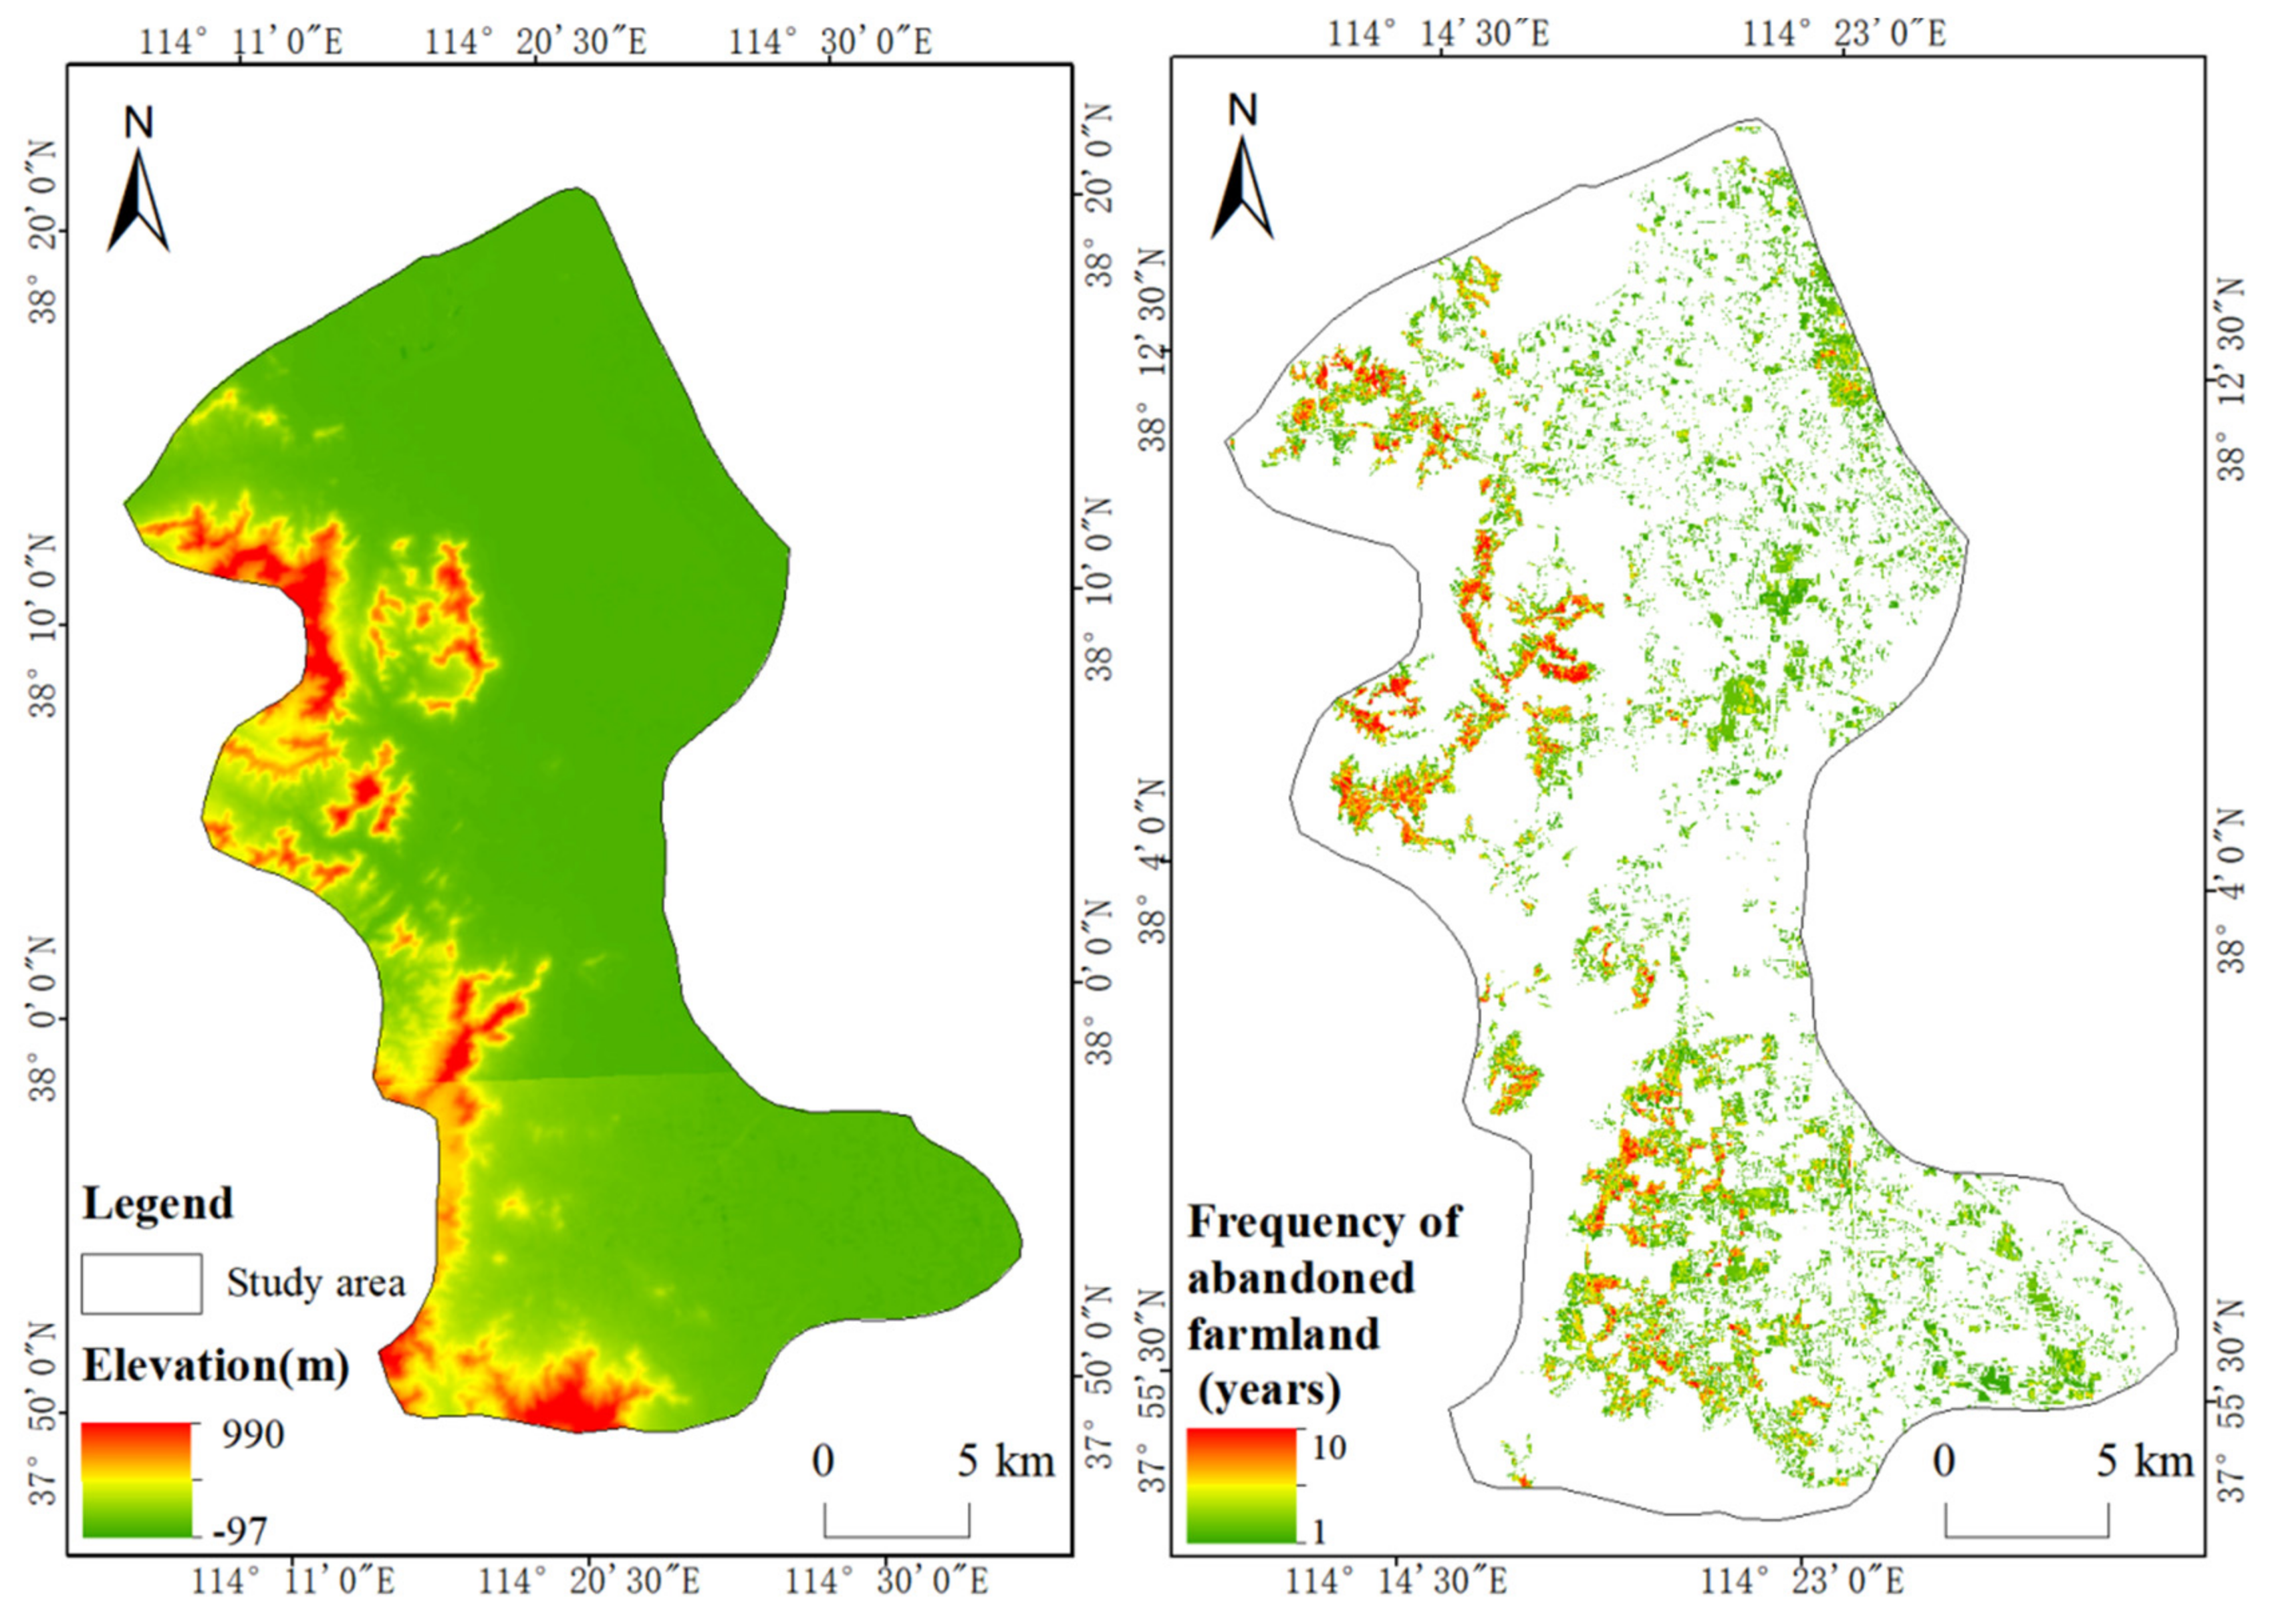
Figure 11.
Farmland abandonment frequency in Luquan for the period of 2011–2020.


Table 1.
Acquisition dates and cloud coverage of the remote sensing images.
| Year | Satellite | Period | Cloud Coverage | ||
|---|---|---|---|---|---|
| Period 1 | Period 2 | Period 1 | Period 2 | ||
| 2010 | Landsat-7 | 19th May | 6th July | 0% | 1.58% |
| 2011 | Landsat-7 | 6th May | 25th July | 0.37% | 0.71% |
| 2012 | Landsat-7 | 6th April | 9th June | 0.03% | 1.83% |
| 2013 | Landsat-8 | 19th May | 6th July | 0.07% | 0.47% |
| 2014 | Landsat-8 | 22nd May | 6th July | 0.16% | 0.19% |
| 2015 | Landsat-8 | 25th May | 12th July | 0.84% | 0.36% |
| 2016 | Landsat-8 | 25th April | 12th June | 0.04% | 0.02% |
| 2017 | Sentinel-2 | 28th May | 27th June | 0.89% | 0.01% |
| 2018 | Sentinel-2 | 28th May | 12th June | 0.28% | 0% |
| 2019 | Sentinel-2 | 28th May | 12th July | 1.97% | 2.31% |
| 2020 | Sentinel-2 | 27th May | 6th July | 0.56% | 0.40% |
Table 2.
Classification accuracy.
| Year | Random Forest Classification | Random Forest Classification (Superimposed Change Detection Results) | ||
|---|---|---|---|---|
| Overall Accuracy | Kappa Coefficient | Overall Accuracy | Kappa Coefficient | |
| 2010 | 87.12% | 0.8300 | 92.82% | 0.91 |
| 2011 | 87.24% | 0.8349 | 95.35% | 0.93 |
| 2012 | 90.98% | 0.8837 | 95.93% | 0.94 |
| 2013 | 94.31% | 0.9178 | 96.92% | 0.96 |
| 2014 | 87.53% | 0.8435 | 92.70% | 0.91 |
| 2015 | 89.53% | 0.8667 | 90.20% | 0.87 |
| 2016 | 84.84% | 0.8053 | 93.66% | 0.91 |
| 2017 | 84.68% | 0.8092 | 95.59% | 0.93 |
| 2018 | 81.69% | 0.7714 | 96.68% | 0.95 |
| 2019 | 81.18% | 0.7647 | 92.62% | 0.90 |
| 2020 | 81.53% | 0.7687 | 91.81% | 0.89 |
Table 3.
Statistical results of the abandoned farmland in the study area from 2011 to 2020.
| Year | Abandoned Area (hm2) | Abandonment Rate (%) | Year | Abandoned Area (hm2) | Abandonment Rate (%) |
|---|---|---|---|---|---|
| 2011 | 2402.24 | 8.66 | 2016 | 3522.90 | 12.70 |
| 2012 | 3906.02 | 14.09 | 2017 | 3708.16 | 13.37 |
| 2013 | 3648.46 | 13.16 | 2018 | 1752.55 | 6.32 |
| 2014 | 3170.35 | 11.43 | 2019 | 2043.91 | 7.37 |
| 2015 | 3693.50 | 13.32 | 2020 | 1618.74 | 5.83 |
Table 4.
Statistical results for the reclamation of abandoned farmland for the period of 2012–2020.
| Year | Reclamation Area (hm2) | Reclamation Rate (%) | Year | Reclamation Area (hm2) | Reclamation Rate (%) |
|---|---|---|---|---|---|
| 2012 | 118.87 | 4.94 | 2017 | 53.81 | 1.52 |
| 2013 | 193.95 | 4.96 | 2018 | 207.06 | 5.58 |
| 2014 | 34.94 | 0.95 | 2019 | 66.61 | 3.80 |
| 2015 | 127.95 | 4.03 | 2020 | 291.49 | 14.26 |
| 2016 | 76.36 | 2.07 |
Table 5.
Statistics of the farmland abandonment frequency in Luquan for the period of 2011–2020.
| Abandonment Frequency (Years/Years) | Abandoned Area (hm2) | Abandonment Frequency (Years/Years) | Abandoned Area (hm2) |
|---|---|---|---|
| 1/10 | 4261.07 | 6/10 | 575.10 |
| 2/10 | 2556.94 | 7/10 | 534.56 |
| 3/10 | 1375.72 | 8/10 | 173.80 |
| 4/10 | 880.57 | 9/10 | 109.74 |
| 5/10 | 755.49 | 10/10 | 33.04 |
Publisher’s Note: MDPI stays neutral with regard to jurisdictional claims in published maps and institutional affiliations. |
© 2021 by the authors. Licensee MDPI, Basel, Switzerland. This article is an open access article distributed under the terms and conditions of the Creative Commons Attribution (CC BY) license (https://creativecommons.org/licenses/by/4.0/).
Share and Cite
MDPI and ACS Style
Wei, Z.; Gu, X.; Sun, Q.; Hu, X.; Gao, Y. Analysis of the Spatial and Temporal Pattern of Changes in Abandoned Farmland Based on Long Time Series of Remote Sensing Data. Remote Sens. 2021, 13, 2549. https://doi.org/10.3390/rs13132549
AMA Style
Wei Z, Gu X, Sun Q, Hu X, Gao Y. Analysis of the Spatial and Temporal Pattern of Changes in Abandoned Farmland Based on Long Time Series of Remote Sensing Data. Remote Sensing. 2021; 13(13):2549. https://doi.org/10.3390/rs13132549
Chicago/Turabian StyleWei, Zhonghui, Xiaohe Gu, Qian Sun, Xueqian Hu, and Yunbing Gao. 2021. "Analysis of the Spatial and Temporal Pattern of Changes in Abandoned Farmland Based on Long Time Series of Remote Sensing Data" Remote Sensing 13, no. 13: 2549. https://doi.org/10.3390/rs13132549
Note that from the first issue of 2016, this journal uses article numbers instead of page numbers. See further details here.