Article

Assessment of Poplar Looper (Apocheima cinerarius Erschoff) Infestation on Euphrates (Populus euphratica) Using Time-Series MODIS NDVI Data Based on the Wavelet Transform and Discriminant Analysis

1
Beijing Key Laboratory of Precision Forestry, Forestry College, Beijing Forestry University, Beijing 100083, China
2
College of Geographical Science and Tourism, Xinjiang Normal University, Urumqi 830054, China
3
School of Earth, Atmosphere and Environment, Clayton Campus, Monash University, Clayton 3800, Australia
*
Author to whom correspondence should be addressed.
Remote Sens. 2021, 13(12), 2345; https://doi.org/10.3390/rs13122345
Submission received: 14 March 2021 / Revised: 7 June 2021 / Accepted: 12 June 2021 / Published: 15 June 2021

Abstract

:
Poplar looper (Apocheima cinerarius Erschoff) is a destructive insect infesting Euphrates or desert poplars (Populus euphratica) in Xinjiang, China. Since the late 1950s, it has been plaguing desert poplars in the Tarim Basin in Xinjiang and caused widespread damages. This paper presents an approach to the detection of poplar looper infestations on desert poplars and the assessment of the severity of the infestations using time-series MODIS NDVI data via the wavelet transform and discriminant analysis, using the middle and lower reaches of the Yerqiang River as a case study. We first applied the wavelet transform to the NDVI time series data in the period of 2009–2014 for the study area, which decomposed the data into a representation that shows detailed NDVI changes and trends as a function of time. This representation captures both intra- and inter-annual changes in the data, some of which characterise transient events. The decomposed components were then used to filter out details of the changes to create a smoothed NDVI time series that represent the phenology of healthy desert poplars. Next the subset of the original NDVI time series spanning the time period when the pest was active was extracted and added to the smoothed time series to generate a blended time series. The wavelet transform was applied again to decompose the blended time series to enhance and identify the changes in the data that may represent the signals of the pest infestations. Based on the amplitude of the enhanced pest infestation signals, a predictive model was developed via discriminant analysis to detect the pest infestation and assess its severity. The predictive model achieved a severity classification accuracy of 91.7% and 94.37% accuracy in detecting the time of the outbreak. The methodology presented in this paper provides a fast, precise, and practical method for monitoring pest outbreak in dense desert poplar forests, which can be used to support the surveillance and control of poplar looper infestations on desert poplars. It is of great significance to the conservation of the desert ecological environment.

Graphical Abstract

1. Introduction

Euphrates or desert poplars (Populus euphratica) are medium-sized deciduous trees mainly found in fluvial and floodplain areas in arid and semi-arid regions, where the groundwater is close to the surface. Their unique physiological traits make them tolerant of saline and brackish water and resistant to droughts and sand storms. They form the near top-level natural arbor community in the desert environment and are a significant component of Tugai floodplain ecosystems in arid climates. Desert poplars play an important role in maintaining ecological balance, establishing windbreaks for the protection from wind and the encroachment of sands, fixing shifting sands, regulating the climate and improving the health of ecosystems [1,2]. However, poplar plantations in China have been constantly threatened by defoliating insects, particularly the poplar looper Apocheima cinerarius Erschoff (Lepidoptera: Geometridae). In recent years, there are widespread outbreaks of insect pests in desert poplar plantations in northwest China due to the weakened resistance of water-stressed poplars to pests and diseases resulted from excessive unregulated water diversion and climate change. Poplar looper is the most serious insect pest affecting desert poplars in the Tarim Basin, Xinjiang, China, which now starts to spread to the oases. According to [3,4], the desert poplar growing area infested by poplar looper in Xinjiang reached 1.4 million hectares in 2006, about 31.56% of the total pest-infested forest area in Xinjiang; and the infested desert poplar forest area in the Tarim Basin accounted for 73.6%, covering nearly 1 million hectares. The occurrence of poplar looper causes the weakening of poplar trees, which in turn led to the rampant occurrence of tree borers. Severe attacks by the pest often resulted in the death of desert poplar trees over a large area, ultimately reducing biodiversity in the affected area. The invasion of the pest from deserts into oases with dust storms also poses a tremendous threat to the living environment of human beings. Therefore, it is important to understand the level of its infestation and spatial and temporal patterns of its outbreaks to provide information for developing strategies to protect desert poplars.
Poplar looper is a geometrid moth, distributed in the arid climate zone in the East Asia monsoon region, including the entire area of northern China [5]. A lot of studies have been done on this moth species, including its habitat, physiology, life cycle, evolutionary history, geographical distribution, population dynamics, the nature of its attack and damage it caused, as well as forecasts and control of its outbreaks [6,7,8,9,10,11,12]. However, Euphrates are distributed in deserts, which are usually remote and poorly accessible by transport. It is difficult to carry out large-scale and in-depth studies on the pest infestation using traditional field survey techniques. So far, there has been a lack of information on the extent and damage level of the poplar looper infestation in Euphrates forests in China.
Remote sensing is a proven technology for pest monitoring and damage assessment over large areas. Many studies have used remotely sensed data with various spatial resolutions to detect and assess forest insect infestations, based on the analysis of spectral responses of trees to the biophysical phenomena such as water stress caused by insect attack [13,14,15,16,17,18,19]. Over the years, a number of spectral indices (such as the Normalised Difference Vegetation Index or NDVI, the Normalised Burn Ratio or NBR, the Moisture Stress Index or MSI, the Enhanced Wetness Difference Index or EWDI, and the Leave Area Index or LAI) have been used for the detection and differentiation of insects and diseases using multispectral and hyperspectral data with different spatial resolutions. According to a recent review by Senf et al. [20], medium and coarse spatial resolution remote sensing data and NDVI were most often used for mapping insect induced broadleaved defoliation, and intra-annual time series analysis was frequently applied in the analysis of these data sets. As many insects are active for a short period when an outbreak is detectable, most studies used very dense time series of remote sensing data such as the Advanced Very High Resolution Radiometer (AVHRR), the Moderate Resolution Imaging Spectroradiometer (MODIS), and SPOT VEGETATION to achieve daily temporal resolution. MODIS data have both high spectral and temporal resolutions, and have been more frequently employed [21]. For example, they have been used to detect forest defoliation induced by the European gypsy moth in North America [22], the autumnal moth and winter moth in northern Sweden [23], the European pine sawfly in southeastern Norway [24], and by the bark beetle in North America [25]. These studies achieved various levels of success. For example, Olsson et al. [26] reported that with MODIS data only 50% of damaged Scots pine forest stands caused by pine sawfly in eastern Finland were detected and 22% of healthy stands were misclassified, while in northern Sweden 75% of damaged birch forest stands were detected and 19% of healthy birch forest stands were misclassified. However, these applications have shown potential of MODIS data for large area monitoring and early detection [27]. Our research used MODIS NDVI data to detect defoliation of poplar trees induced by poplar looper and assess the severity of the insect outbreak.
In recent years, for large-scale pest infestation monitoring, Landsat and Sentinel-2 data with a higher spatial resolution have been widely used [28,29,30,31]. Since poplar forests are most vulnerable to poplar looper attacks in less than two months [32], it requires monitoring data to be updated daily to quickly monitor the status of poplar forests damaged by the insect. Although the spatial resolution of MODIS data is coarser than Landsat and sentinel-2, its long timespan and high temporal resolution are more suitable for this monitoring task. With the temporal resolution of 16 days, Landsat images could miss the foliation peak starting of defoliation, reducing the information about the pest infestation. Though Sentinel-2 data have higher spatial and temporal resolutions, hence a higher monitoring accuracy than Landsat 8 [33,34], the data with a 5-day temporal resolution only started to become available in 2017, which limits their use in the analysis and modelling of the long-term trend. Although the spatial resolution of MODIS data is coarser than Landsat and Sentinel-2, its long timespan and high temporal resolution are more suitable for the monitoring of poplar looper attacks on poplar forests.
Time series fitting techniques have been used to analyse MODIS time series data to detect insect disturbance [20]. For example, TIMESAT, a computer program for time series analysis of satellite sensor data, fits smoothed functions (including Savitzky-Golay fitering, least-squares fitted asymmetric Gaussian functions and double logistic functions) to time series data and extracts seasonality parameters [35], which was applied in the studies by Eklundh et al. [24], Anees and Aryal [25] and Olsson et al. [23,26]. Jia [36], Huang [37] and Wang [38] used the S-G method to filter the MODIS NDVI time series and combined it with the data on the poplar phenology and poplar looper life history to extract the poplar looper hazard information in a poplar forest area using a change detection method. The wavelet transform is a signal processing tool for analysing both the local frequency and temporal behaviour of signals by decomposing a signal into frequency components and then studying each component with a resolution matched to its scale [39]. Wavelet analysis has the merit of decomposing the signal into components of different scales (or frequencies) thus facilitating the detection of subtle signals. An NDVI time series can be considered as a signal. The wavelet transform was used in this study to decompose the NDVI time series into components of different scales, facilitating the detection of trends and subtle signals. Discriminant analysis is a statistical technique for analysing a data set with individuals classified into particular groups, and then using the results to classify new individuals that are not included in the above data set [40].
In this paper, we present an innovative and effective method for detecting and monitoring the poplar looper infestation of dense desert poplar forests using MODIS time series data through the wavelet transform and discriminant analysis. The objectives of this study can be formulated as the following:
(1)
Proposing a method of decomposition of mixed signals from the NDVI time series to isolate and enhance the pest infestation signals; and
(2)
Building a predictive model for identifying severity levels and dates of pest outbreaks.

2. Materials and Methods
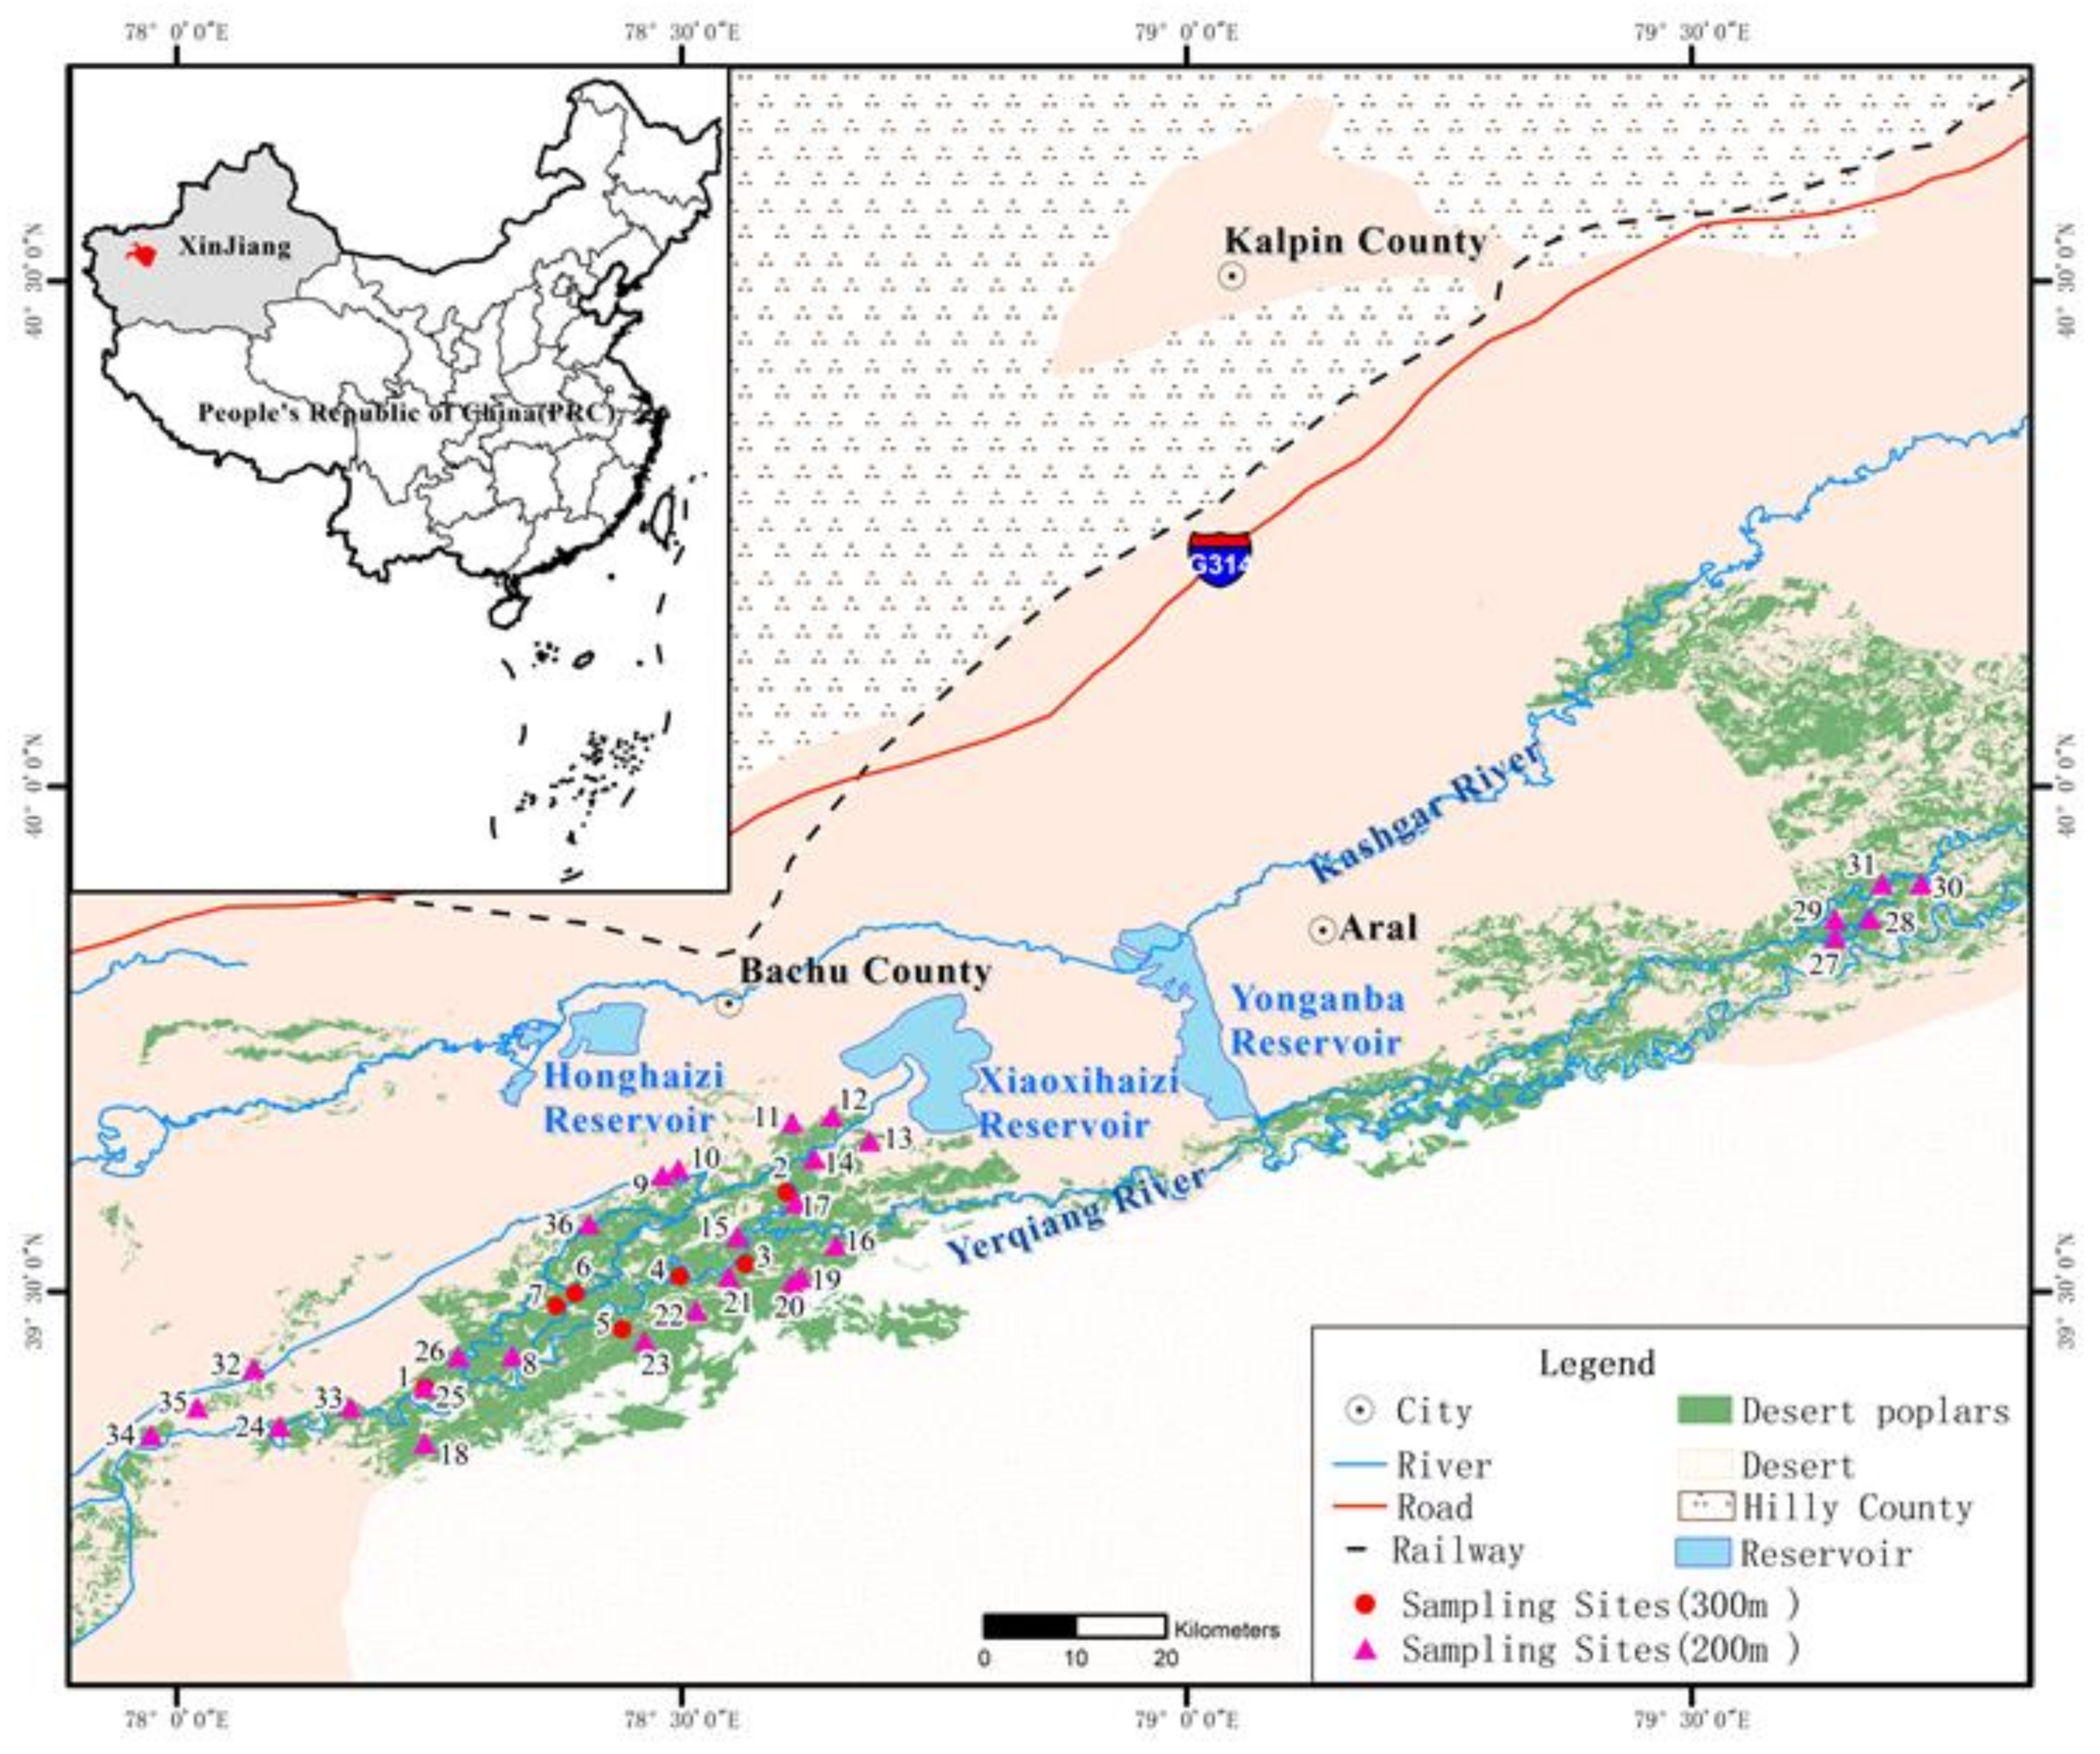
2.1. Study Area

The study area is located in Xiahe and Chamalle forest farms on the alluvial plain of the Yerqiang River in the south of the Tianshan Mountains in Xinjiang, between 77°22′30″ to 79°56′15″E and 38°47′30″ to 40°17′30″N (Figure 1), the average altitude is 1100 m. It covers an area of 21,741 km2, extending 218 km from the east to the west and 134 km from the north to the south.
The Yerqiang River is the major tributary of the Tarim River. Its middle and lower reaches are one of the regions in the world having a high density of desert poplars. The desert poplar forests occupy an area of 2043 km2 in the study area, mainly distributed along the riverbanks of the Yerqiang River and in the periphery of the artificial oases. The main species of understory vegetation include: Tamarix chinensis Lour., Phragmites australis, Calamagrostis epigeios (L.) Roth., Glycyrrhizainflata and Poacymun hendersonii. Closer to the river, poplars are denser and have better growth [41]. The extent of the poplar distribution increases gradually from the southwest to the northeast in the study area. This is because the northeast part of the study area is a floodplain adjacent to the lower reach of the river, which is characterised by periodically flooding, numerous meandering courses and weakened river flows, and provides better conditions for desert poplar growth. The riparian forests along the river have been included in the forestry protection zone since 2000, where felling and destruction of trees are prohibited. Figure 2 shows examples of poplar trees in their leaf development stage in the study area.

2.2. Life Cycle of Poplar Looper

Poplar looper is a leaf-eating pest or defoliator of poplar trees. It was first found in the poplar forests in the Tarim River basin in March 1958 [42]. Since then, it has spread quickly at an alarming rate and has now infested all desert poplar forests in the entire basin. According to the field investigations carried out by the authors from 2009 to 2014, poplar looper lies dormant as pupae in the soil over the summer and winter for up to 10 months. When the average temperature rises to above 1 °C between the late February and the early March, the moth emerges from pupae. The females are wingless. After mating, they lay eggs. In early March, the larvae hatch and feed on buds and leaves of poplar trees. The period of late March to middle or late April sees a dramatic increase in the number of larvae, which causes destructive and widespread defoliation and mortality of poplars. Generally, there are more insects at the top of a poplar tree than in the lower parts of the tree. The larvae complete their growth in late April or early May, when they enter the ground to pupate, starting a new life cycle.
Under the harsh climate conditions in the Tarim Basin, poplar looper has only one generation a year. Most adults live for approximately one year. A small number of adults may survive for two years. In general, the pest infestation starts in late March and ends in middle or late April. After that, the infested desert poplars start re-foliation until the flood season, and then grow normally again. According to the life cycle of poplar looper, by constructing a NDVI time series representing the growth of desert poplars we can extract information about the poplar looper infestation.

2.3. Data Acquisition

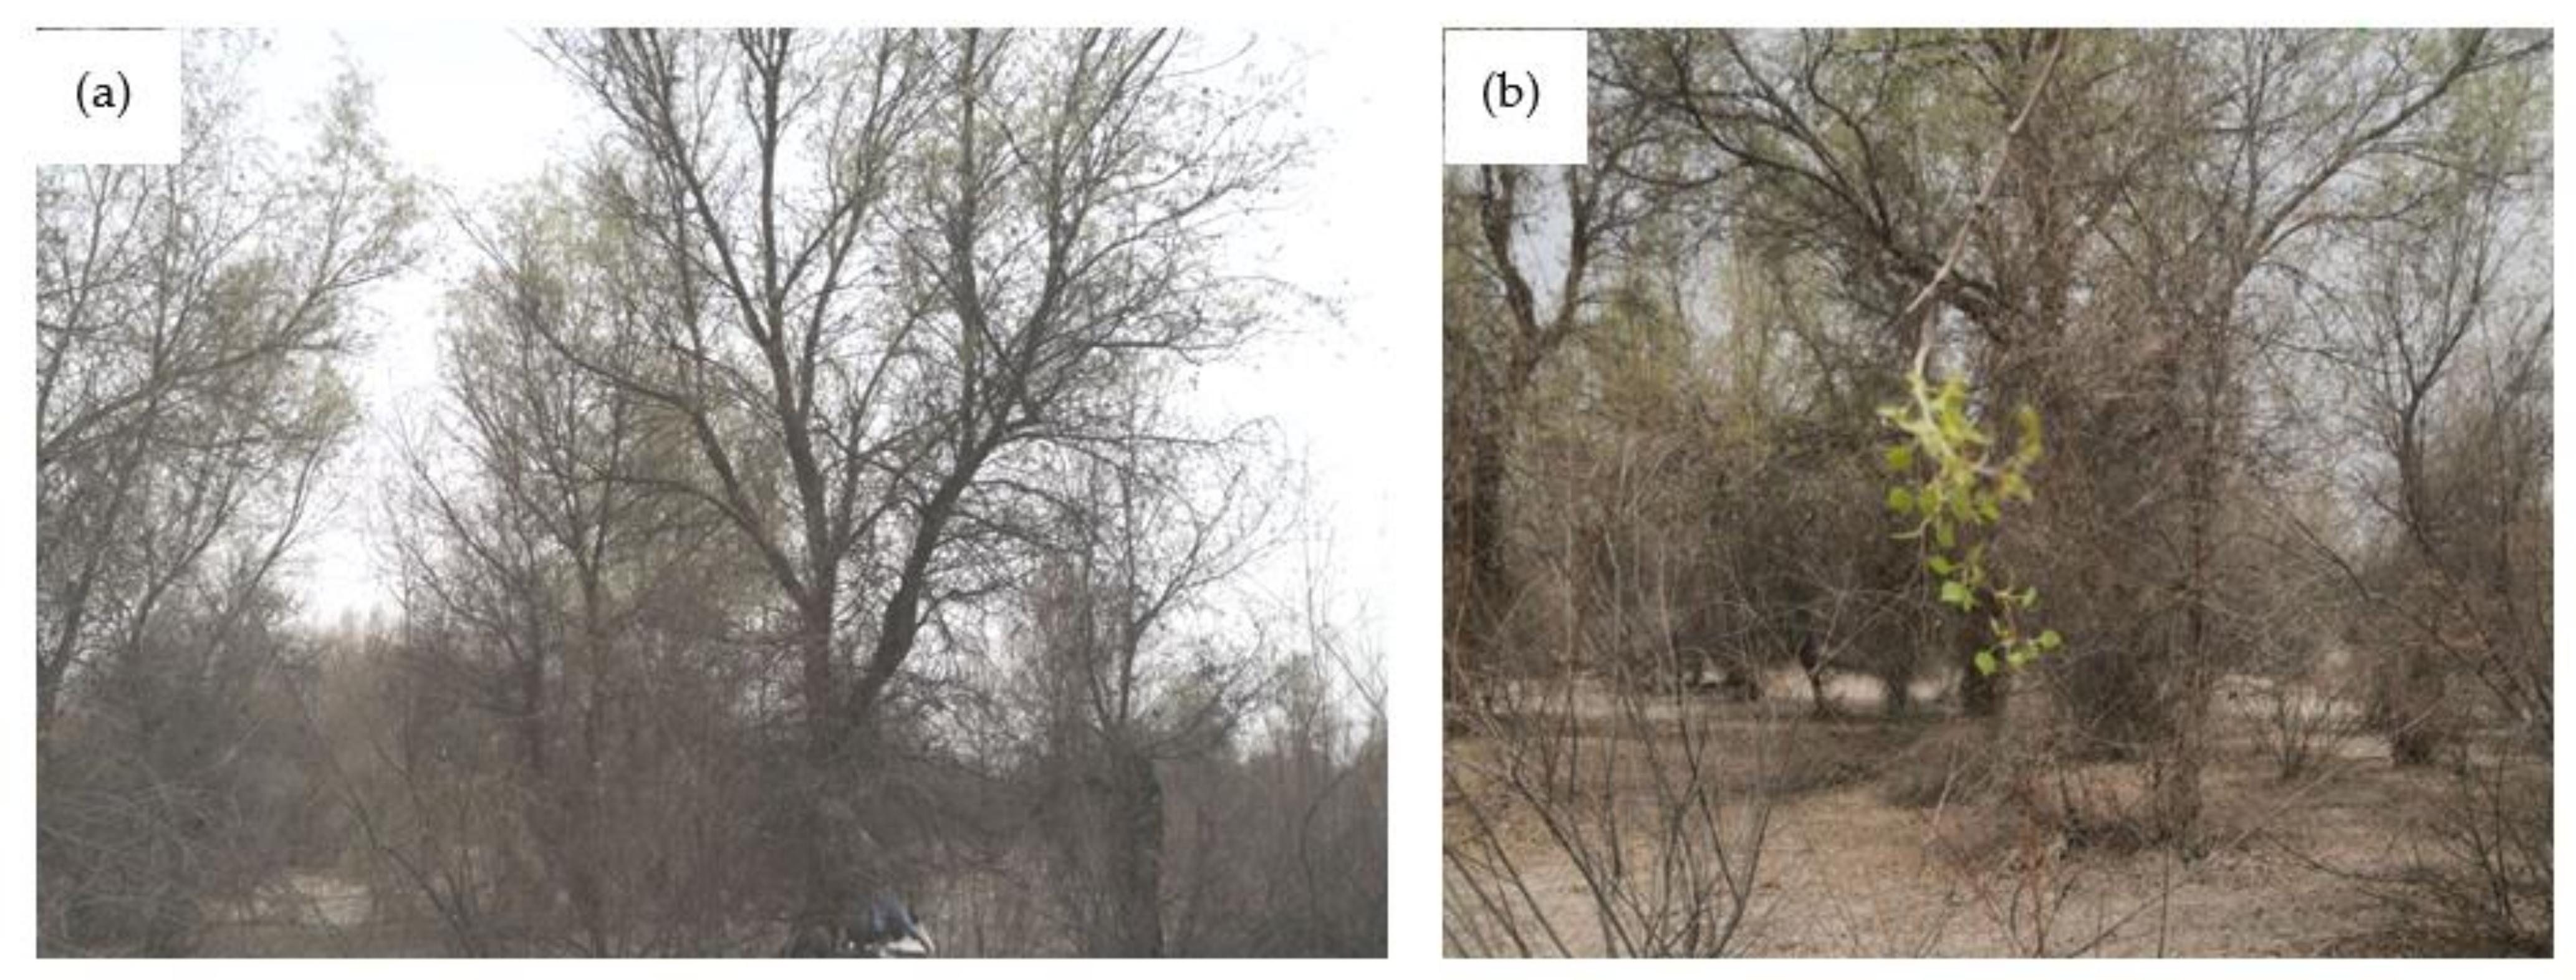
2.3.1. Field Sampling

Based on the characteristics of the terrain and poplar tree distribution, two groups of sampling sites were selected. The first group consists of seven sampling sites, each of which is 300 m × 300 m in size and has continuous observations of poplar tree health and poplar looper infestation over the period of 2009 to 2014. The second group is composed of twenty-nine sampling sites, which were set up in 2014 for aerial surveillance of poplar looper infestation and treatment effects. Each site in the second group covers an area of 200 m × 200 m. Therefore, a total of thirty-six sites were sampled in this study as shown in Figure 1. All the sites are located in the densely distributed areas of desert poplar within 3 km from the river. During the observation periods, no logging and fire occurred at these sites.
Each of the 300 m × 300 m sampling sites was divided into one hundred 30 m × 30 m plots. Each plot contains 10 to 30 poplar trees. At each site, forty-five plots were randomly chosen for sampling. Within each sample plot, the numbers of larvae of poplar looper were counted, and the land surface temperature was recorded on a daily basis in the period of 24 February to 10 May every year from 2009 to 2014. To measure the average number of insects on a poplar tree in a sample plot, twelve branches of 50 cm long were selected respectively in the east, south, west and north direction from the upper, middle and lower part of the tree. Each selected branch was tapped with pruning shears to make the larvae to fall on a 1 m2 white cloth. The number of larvae from each branch was counted, and the average number was taken as the insect population density of this sample plot. The average amount of crown dieback of the forty-five plots at each sampling site was used to represent the level of severity of insect infestation at that site, which was visually assessed. Table 1 lists the criteria for the classification of the severity of insect infestation according to the Forestry Pest Occurrence and Disaster Criteria issued by the State Forestry Administration (SAF).
At the sampling sites of the second group, 15% of poplar trees in each 200 m × 200 m sample plot were randomly selected. The insect population density and severity of infestation of each plot were estimated and assessed in the field in the same way as that used for the first group of sample plots as described above. The data from the two groups were combined to form a big sample, which was used to establish the infestation dynamics of poplar looper, interpret the wavelet transformed data, estimate the level of defoliation induced by the pest, build the predictive model, and to validate the analysis and modelling results.

2.3.2. Satellite Data

Poplar looper causes defoliation of desert poplar trees, hence a reduction in the leaf area and aboveground biomass. The NDVI is a useful indicator for assessing the health and density of vegetation, and has been proven to highly correlate with green-leaf density [43]. We used the Terra/MODIS NDVI products (MOD13Q1) at 16-day temporal resolution and 250 m spatial resolution for the six-year period 2009–2014. The 16-day NDVI composites were produced from daily 250 m MODIS red and near infrared surface reflectance images based on data quality and the maximum NDVI for the compositing period, which used only the high quality, cloud-free and filtered MODIS data. Therefore, these NDVI data contain the minimum level of noises such as clouds and sand storms.
Most of the poplar forests in the Tarim Basin have a low density, and the MODIS data with a low spatial resolution of 250 m will have a large number of mixed pixels, but the sample sites in this study are in the dense forest area close to the river as described in the previous section, and the forest coverage of the sample sites was 70–90%, which can remove the influence of mixed pixels in this study to the greatest extent. In addition, because the poplar looper attack mainly occurs in March-April, when the poplar is in the leaf spreading stage and has not yet reached the peak growth period, it will not cause the problem of spectral saturation.
Our study area is covered by four scenes of MODIS NDVI data with the tile numbers of h23v04, h23v05, h24v04, and h24v05. A total of 552 scenes were collected for the whole period of the study. All the images were pre-processed through mosaicking, re-projection and re-sampling. The vector map of the desert poplar forests in the study area was used to mask the NDVI data series to identify the pixels in the forests.

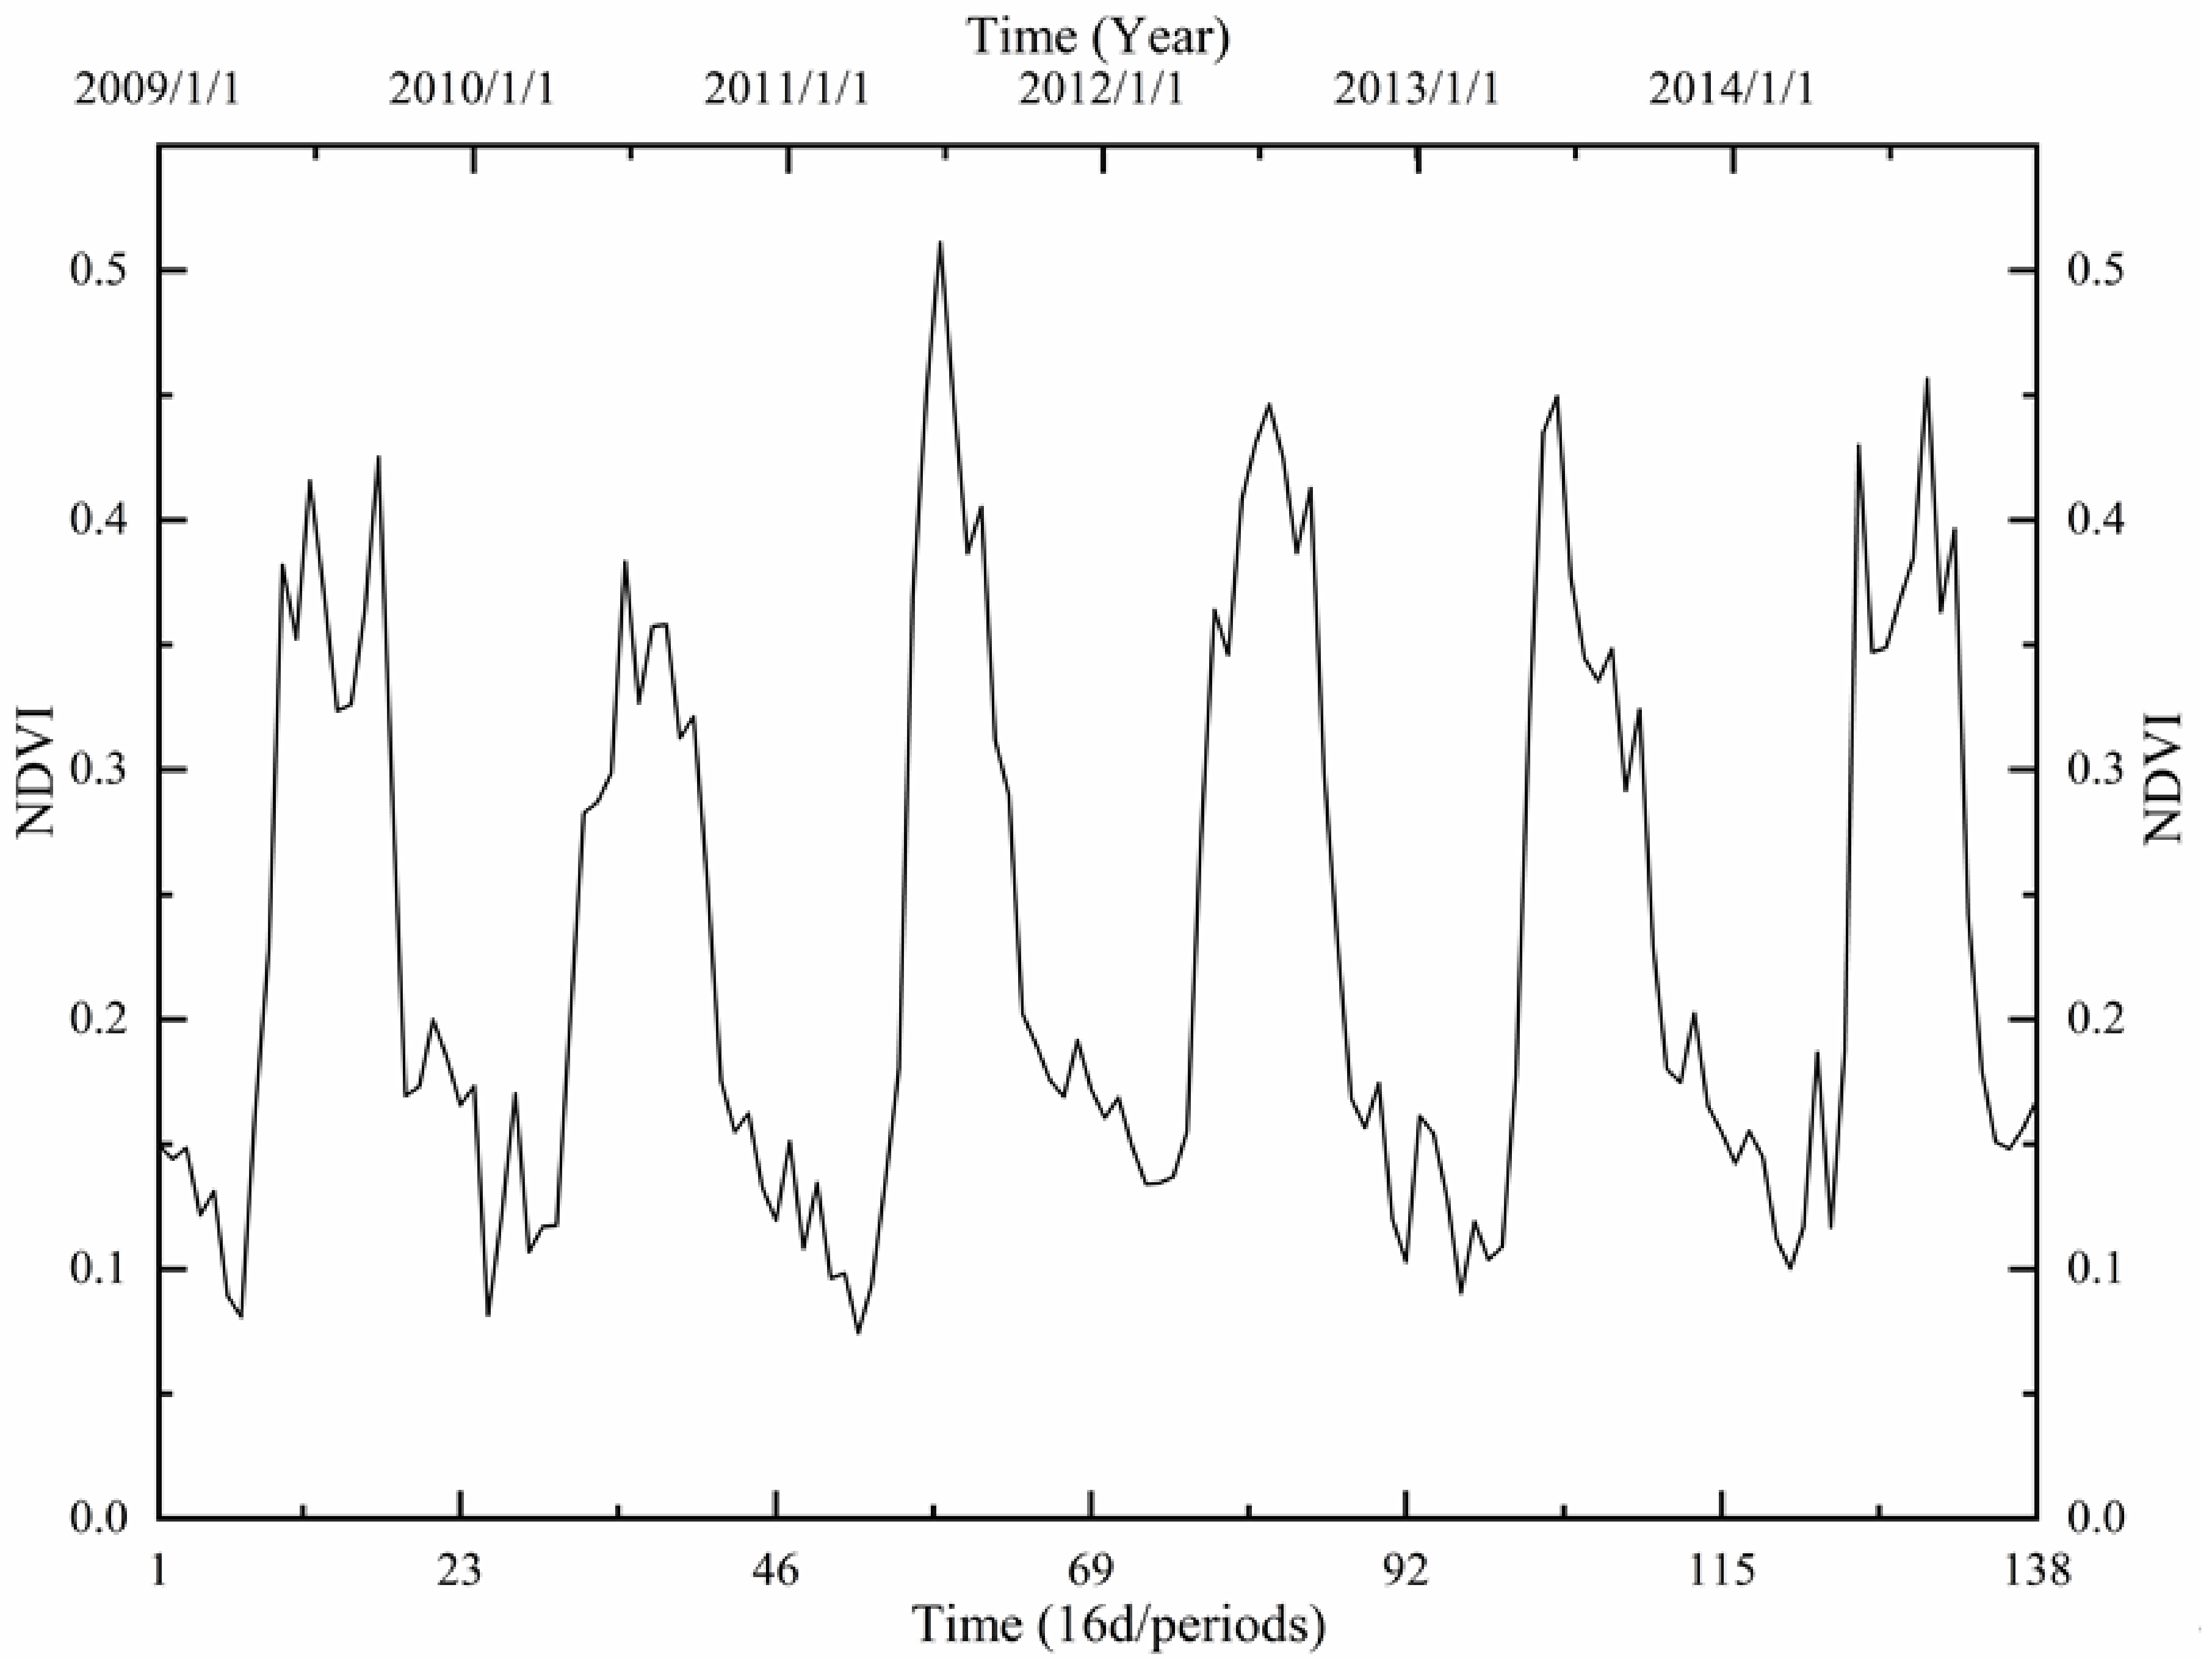
2.4. Poplar Canopy NDVI Time Series
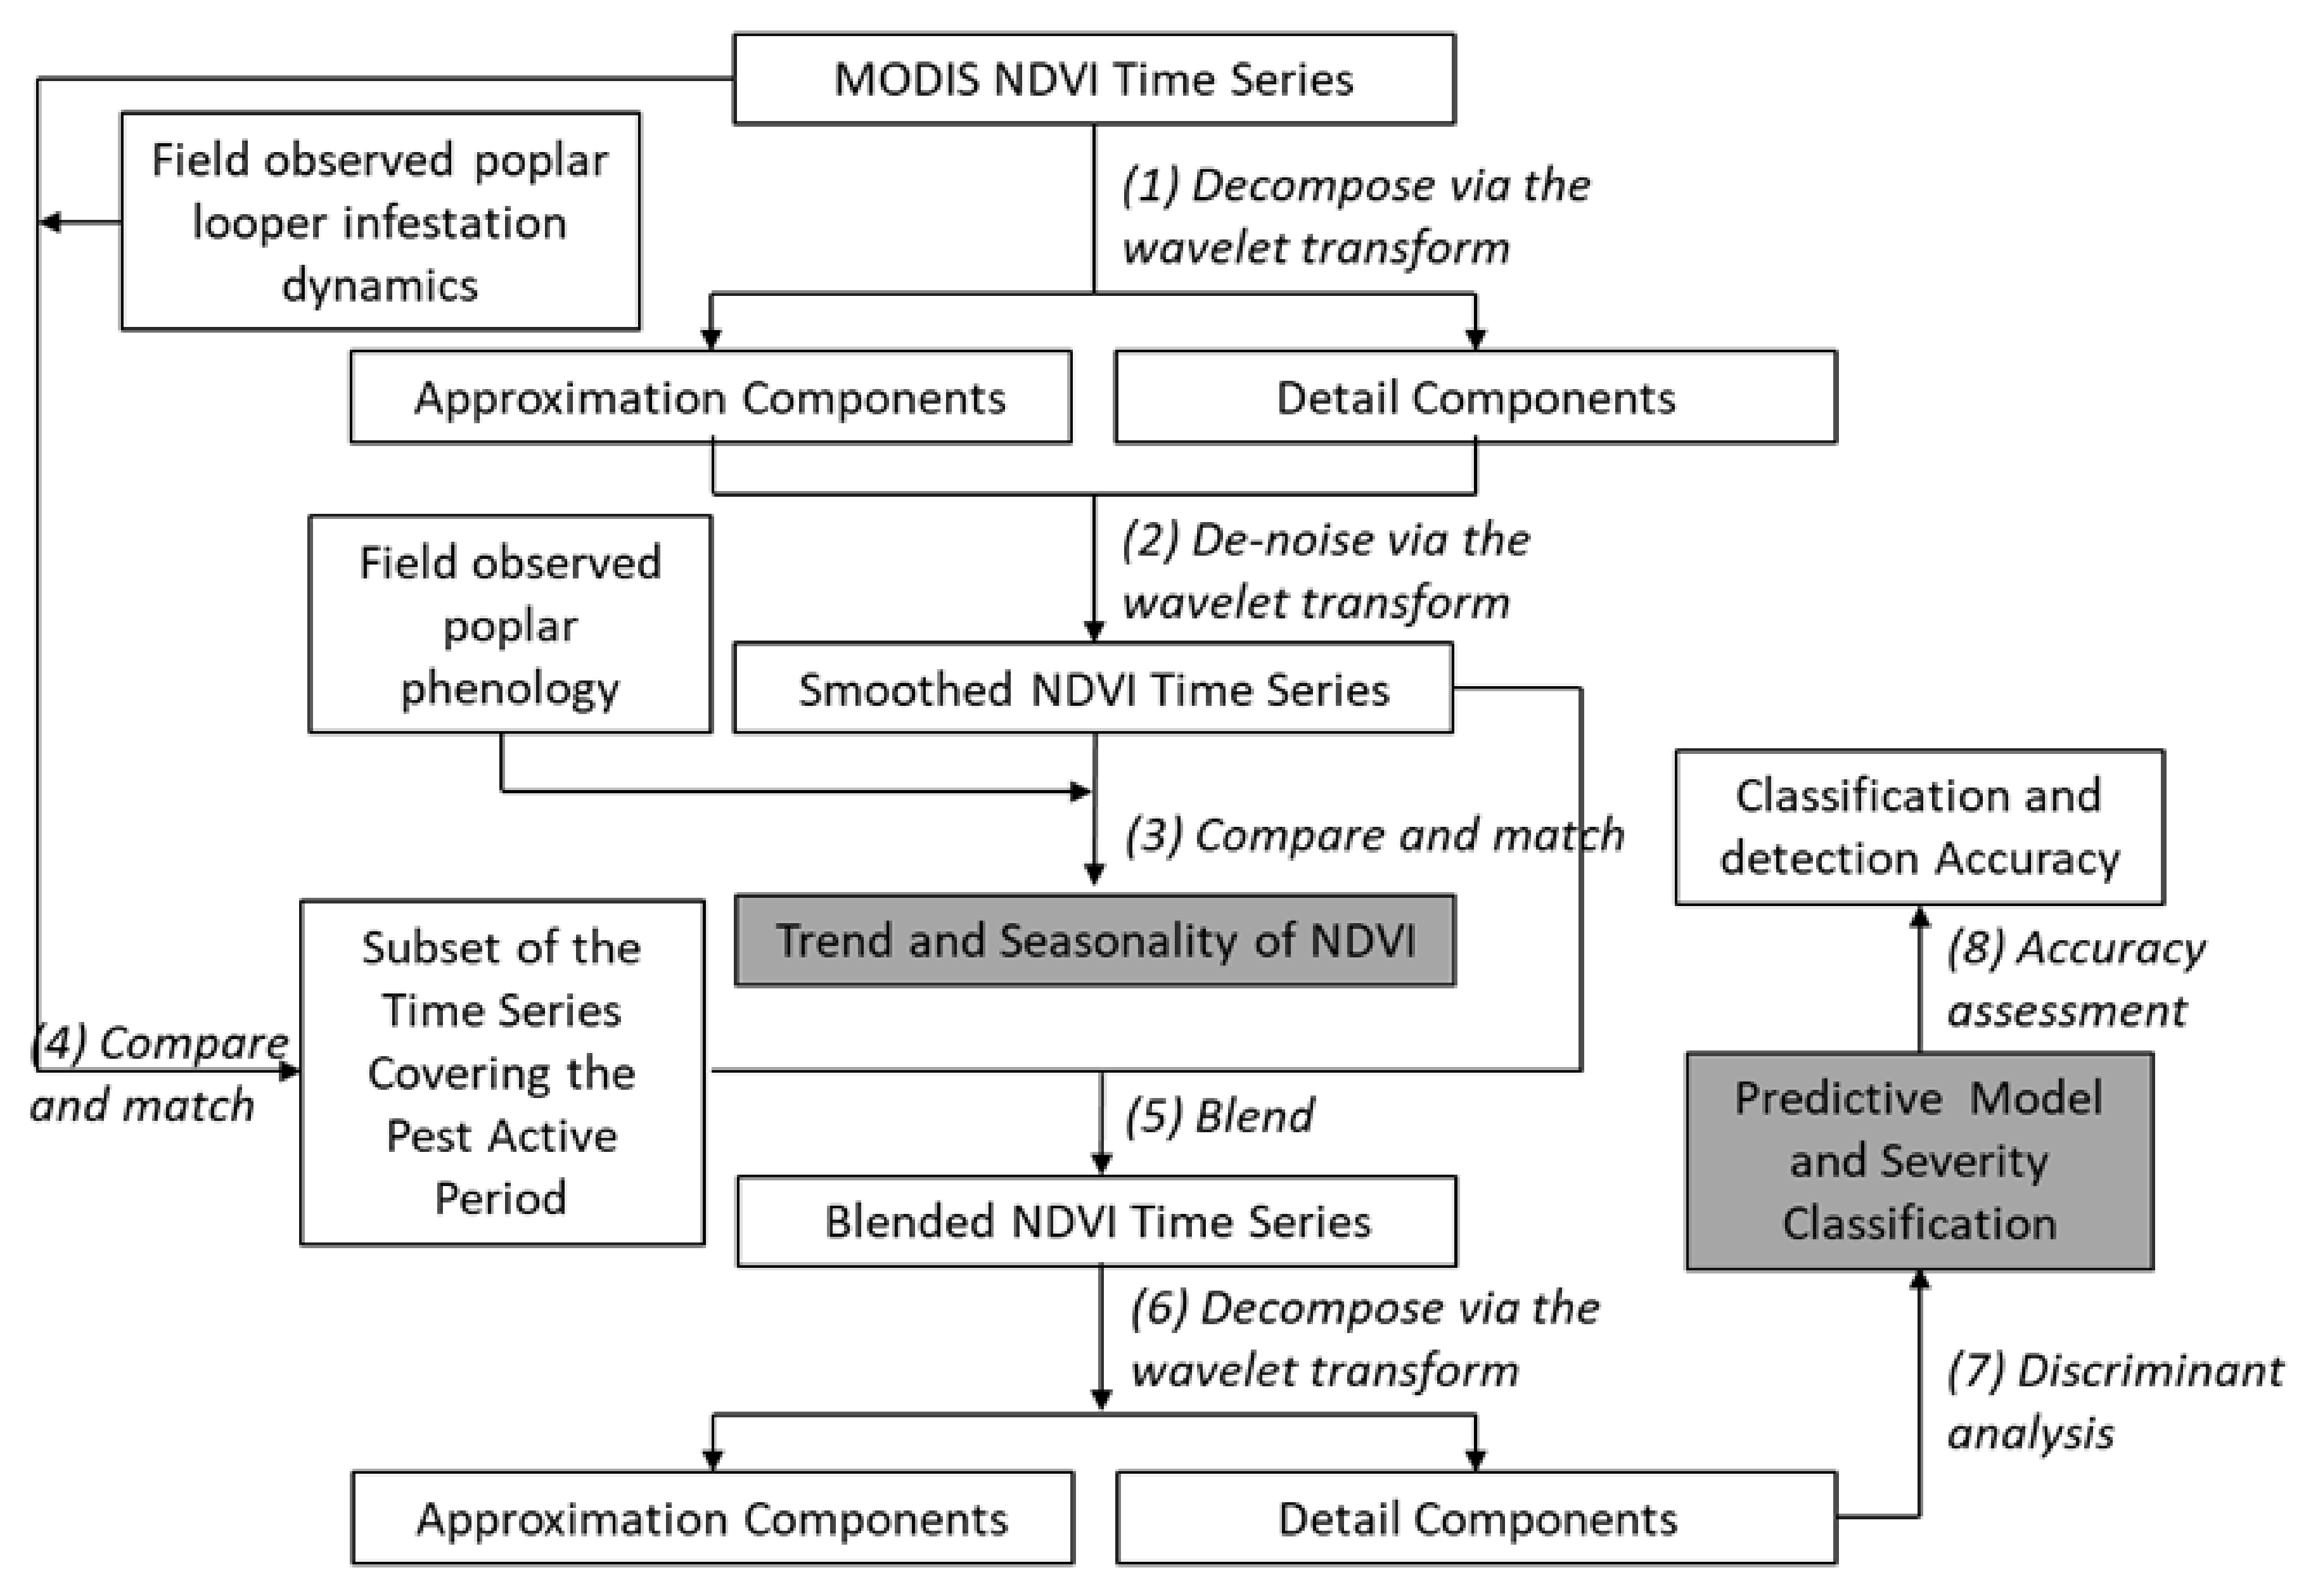
The NDVI values were extracted from MODIS MOD13Q1 product at each poplar sample site for the period 2009–2014 and their values were used to construct a poplar canopy NDVI time series. Figure 3. shows the time series of poplar canopy NDVI values at Sampling Site 2 (see Figure 1), in which the x-axis represents time increments (one increment represents 16 days) and the y-axis represents NDVI values. Each time increment is called a time point. There are 138 time points in the time series. The time series graph illustrates the temporal changes in the poplar canopy NDVI for 6 poplar plant life cycles. It reveals intra- and inter-annual variations of NDVI, including seasonal variations, short-term and long-term fluctuations.
In general, the NDVI time series graph for healthy poplars should show a smooth curve. Along with seasonal changes in climate, poplar trees start the growing season with budburst and leaf unfolding in spring and their NDVI values begin to rise accordingly. When the leaves reach full expansion, poplars are at the stage of active growth, the NDVI achieves the maximum. Then, leaf senescence takes place in autumn, when the NDVI decreases. After poplars enter dormancy in late autumn and winter, they are defoliated and the NDVI reduces to the minimum. The phenological cycle makes a NDVI time series appear approximate to a sine or cosine wave as shown in Figure 3. However, Figure 3 also shows many localised abrupt changes or discontinuities, which are deviations from the normal poplar growth curve. These may be caused by water vapour, clouds, snows, droughts, fires, pests, reaping, land surface reflectance, atmospheric interference, and influence of other types of noise.

2.5. Methodology

NDVI time series are non-stationary and usually characterised by long term trends, seasonal variations, and localised abrupt changes resulting from disturbance events (such as insect outbreaks, droughts and sand storms) as shown in Figure 3. They allow for the analysis of the inter-annual and intra-annual changes in the vegetation canopy. Smoothing functions and curve-fitting algorithms have been used to analyse the variability of vegetation using MODIS time series [35]. Their limitations were discussed in Galford et al. [44]. In this study, we adopted the wavelet transform to analyse the MODIS NDVI time series in order to extract information about poplar looper infestation. Our approach involved using the wavelet transform to:
(1)
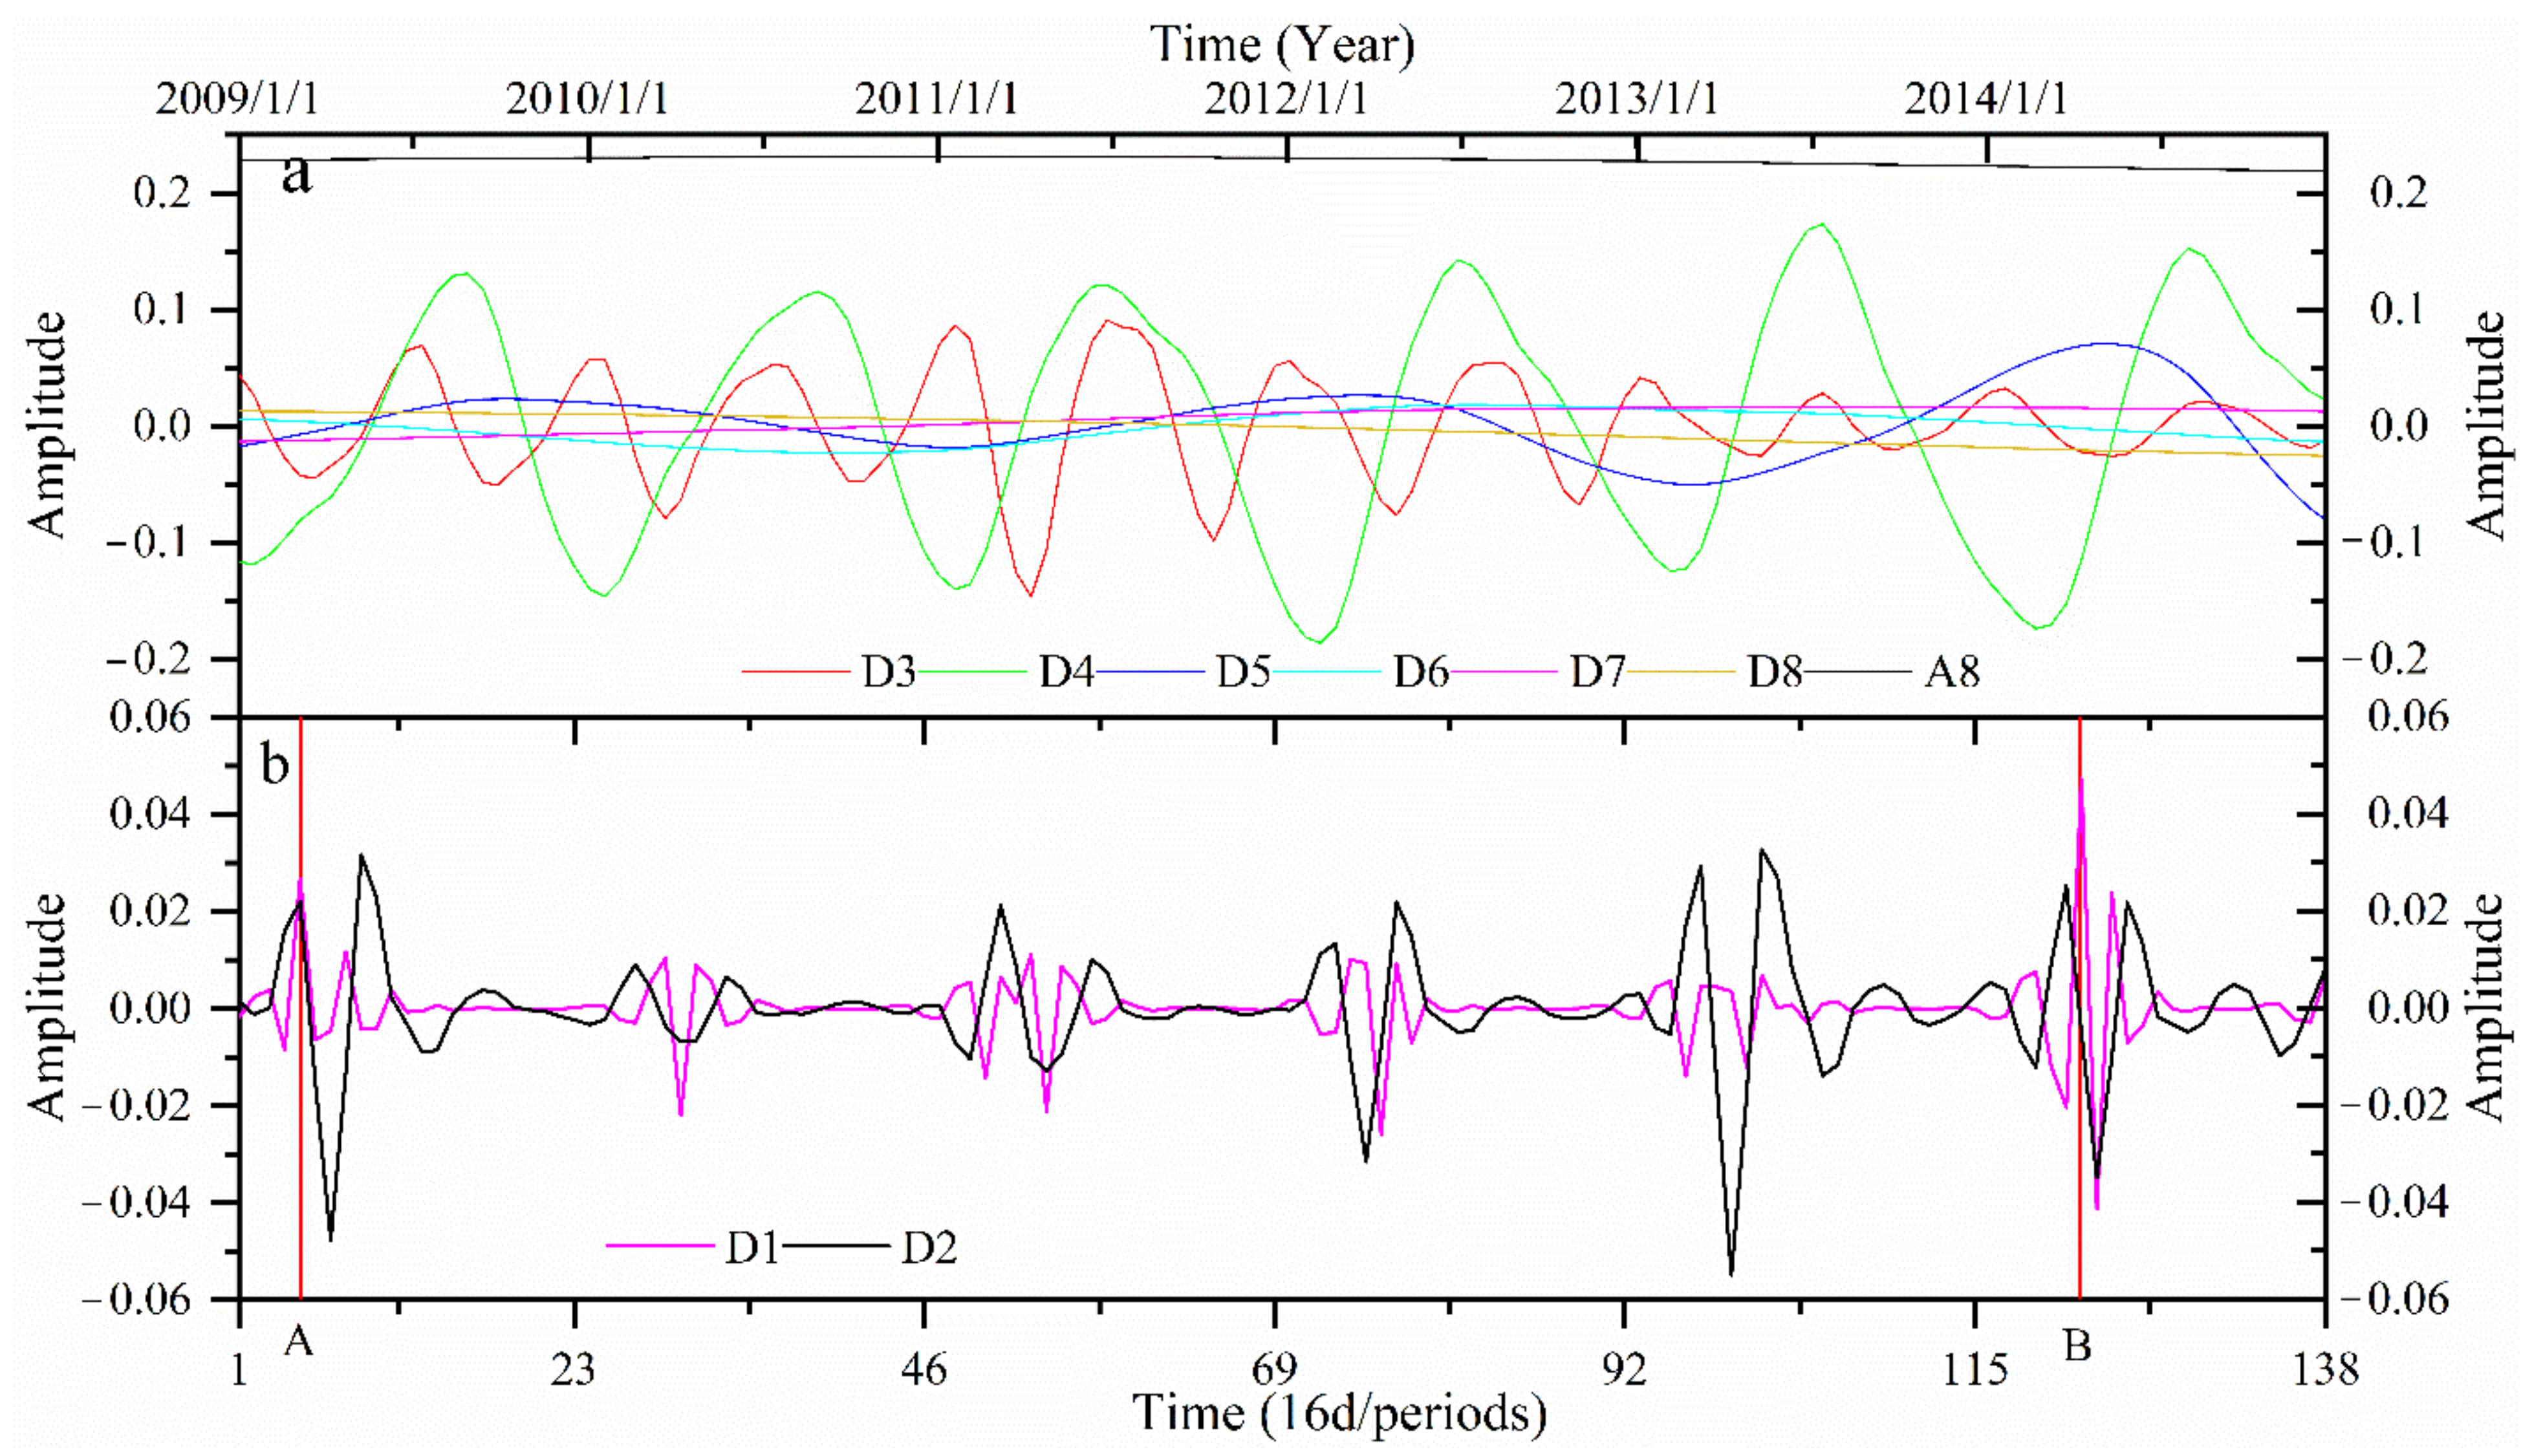
decompose the NDVI time series into approximation (low-frequency) components representing trends and detail (high-frequency) components representing localised changes or details at multiple temporal scales;
(2)
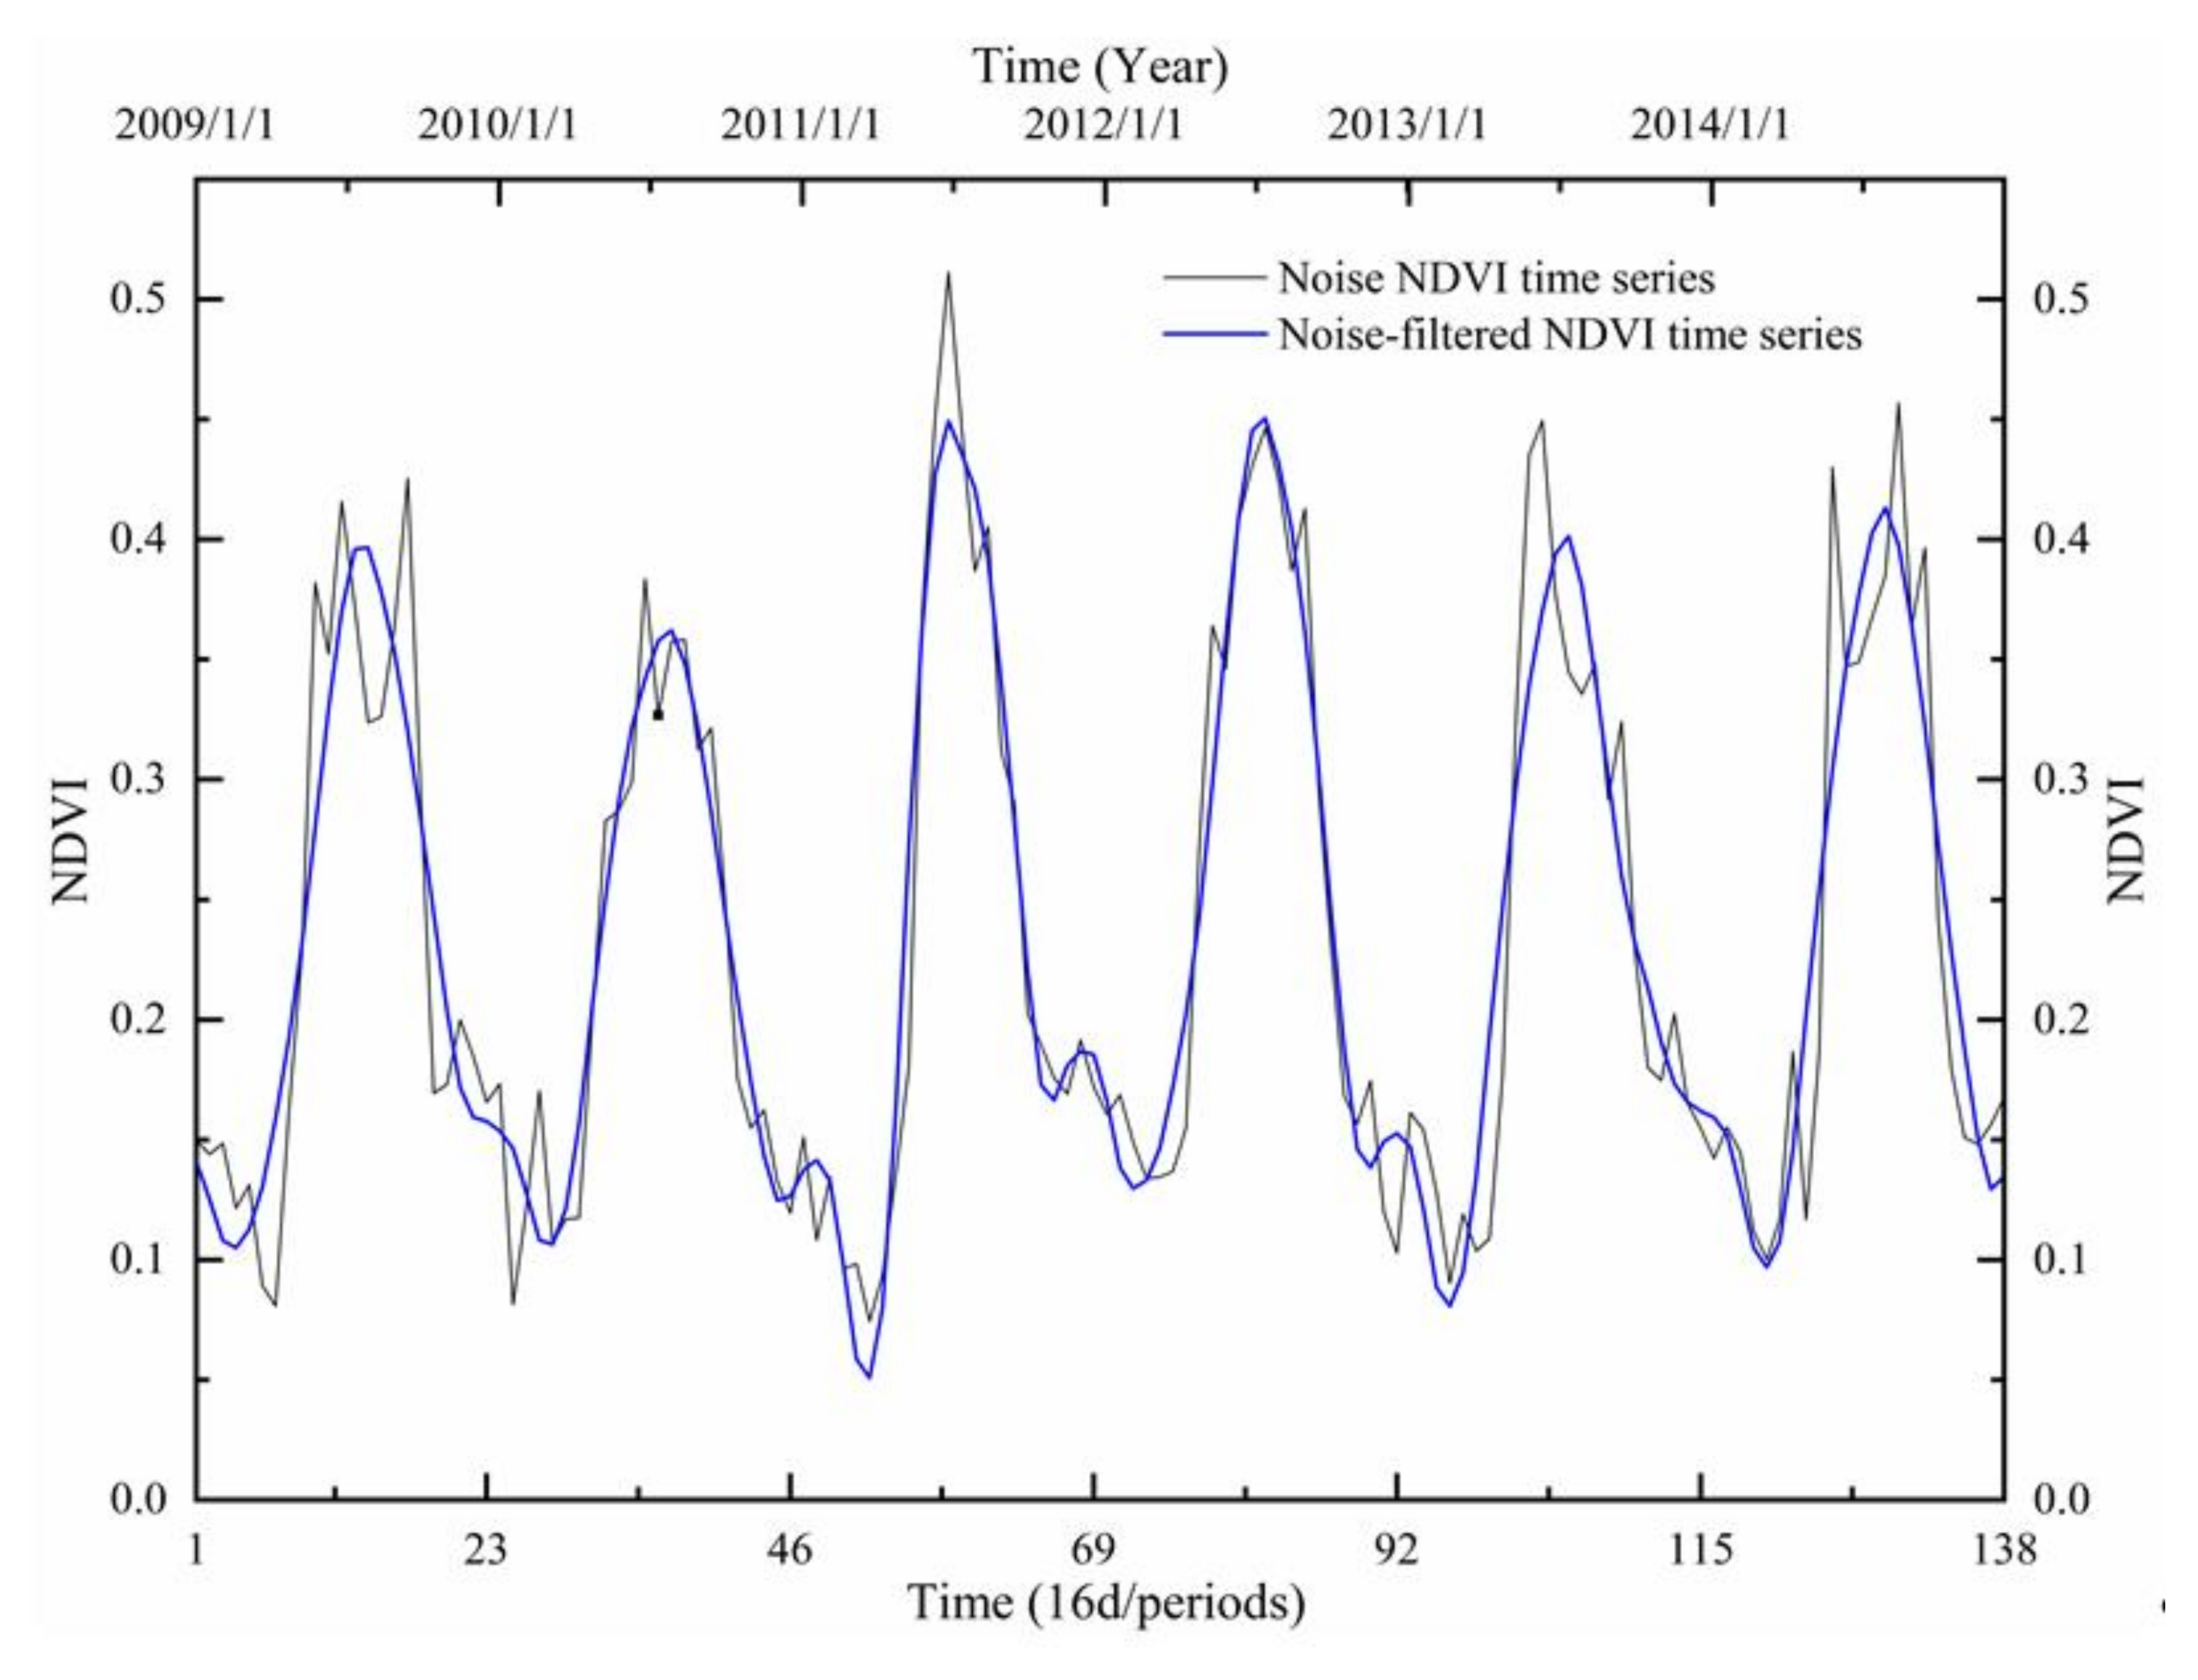
de-noise the NDVI time series using the decomposed time series components from 1) to remove all sorts of noises and create a new NDVI time series representing the intra- and inter-annual variations in the NDVI for healthy poplar tree canopy;
(3)
compare and match the field observed leaf phenology of desert poplars with the de-noised or smoothed time series derived from (2) to identify the overall trend, seasonality and periodicity of the NDVI of poplar tree canopy;
(4)
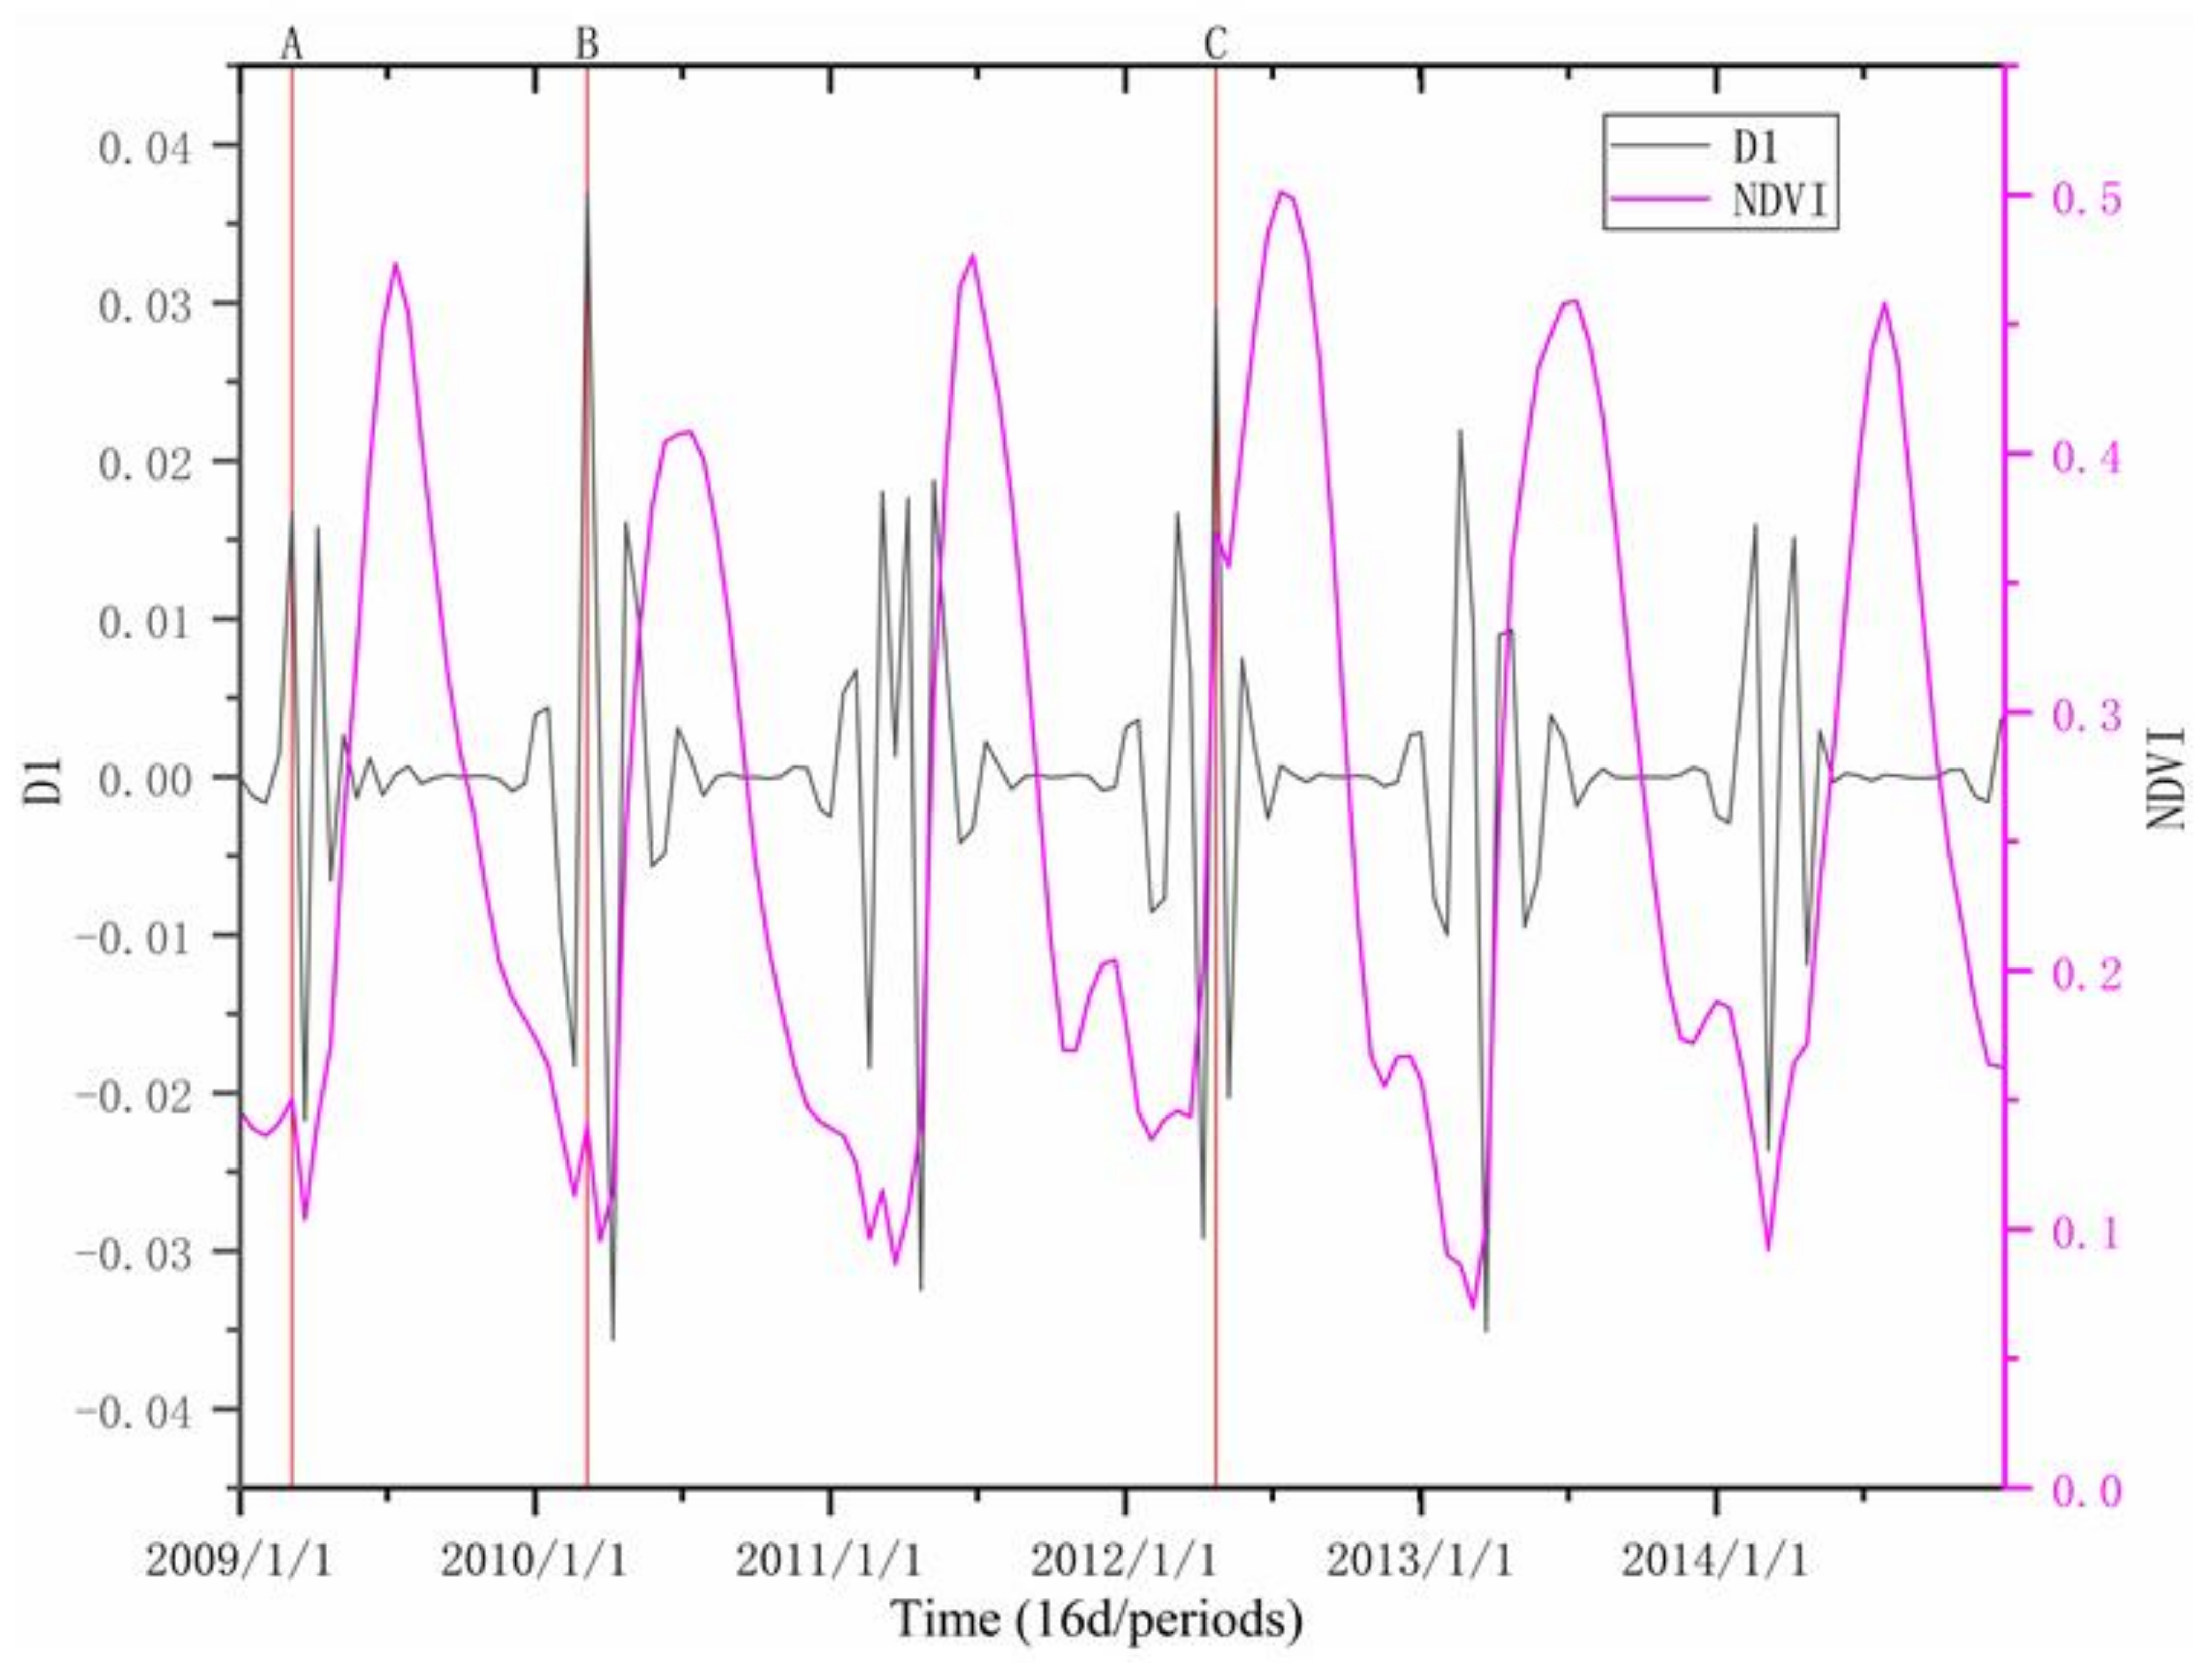
compare and match the field observed poplar looper infestation dynamics with the decomposed time series components derived from (1) and information from (3) to extract signals of defoliation (abrupt changes in the NDVI) caused by the pest infestation;
(5)
reconstruct the NDVI time series by blending the extracted insect infestation signals from (4) to the de-noised NDVI time series from (2), which preserves the signals of the insect infestation, but removes other noises;
(6)
decompose the reconstructed NDVI time series from (5) to enhance the signals of the pest infestation;
(7)
build a predictive model via discriminant analysis using the information generated from (6) to detect pest infestation and classify the level of severity of infestation;
(8)
assess the detection and severity classification accuracy.
Figure 4 shows the process.

2.5.1. Wavelet Transforms

Basically, the wavelet transform is to decompose a time series into different components to determine various modes of variability and how those modes change in time, which allows for a full representation of the localised and transient events occurring at different temporal scales [45,46,47,48,49,50,51]. It transforms a time series using a set of basis functions, called wavelets. There are two types of wavelet transforms: continuous wavelet transform (CWT) and discrete wavelet transform (DWT).
The DWT provides an efficient alternative. It can be considered as a sequence of pairs of high-pass and low-pass filters, known as a filter bank, applied to a time series. Low-pass filters remove details or high-frequency components, smoothing the data series and producing approximation coefficients, whereas high-pass filters enhance details, producing detail coefficients. The DWT transforms a time series by sub-band coding where the series is passed through filters with different cutoff frequencies at different scales, and typically the half-band filters down-sample the series by a factor of two at each level of decomposition, which is called dyadic sampling [52]. Mathematically, the basis function used in the DWT is defined as [53]:
ψ j , k ( t ) = 1 a 0 j ψ ( t a 0 j b 0 j a 0 j )
where a0 and b0 are constants, j is the decomposition level or scale, and k is the time translation factor. For dyadic sampling of DWT, a0 = 2 and b0 = 1; and Level j approximation coefficients are decomposed into Level j + 1 approximation coefficients and Level j + 1 detail coefficients with the same length. The information of the original time series is retained in wavelet coefficients.
The original time series can be reconstructed from the approximation and detail coefficients at each level by up-sampling, passing through high- and low-pass synthesis filters and adding them. This process is also called multi-resolution analysis (MRA). Martinez and Gilabert [48] offered a detailed discussion on MRA. NDVI time series are discrete in nature. Therefore, we applied MRA with the dyadic DWT to the analysis of poplar canopy NDVI time series.
The choices of the mother wavelet ψ ( t ) , the number of vanishing moments and the decomposition level are three key issues in applying a DWT to the NDVI time series. As a wavelet used for the DWT must meet the regularity condition, i.e.,
R t κ ψ ( t ) d t = 0 κ = 1 , , K
where K is the number or order of vanishing moments, we used the Harr, Daubechies and Meyer wavelets to conduct a number of experiments. The Daubechies wavelet produced the best outcome and was selected for the DWT in this study.
The vanishing moment is a criterion about how a wavelet function decays toward infinity. When the wavelet has K-order vanishing moments, the wavelet coefficients of all polynomials are zero, that is, the high-frequency component of the wavelet decomposition is 0 [54]. A Daubechies wavelet with K vanishing moments should have the minimum filter size of 2K. In order to quickly detect the sudden changes, a higher number of vanishing moments is required. We selected six vanishing moments after several experiments when applying the Daubechies wavelet to our NDVI time series.
The highest decomposition level can be calculated as l o g 2 n where denotes taking the integer part of the real value in the bracket and n is the number of observations or time points in the time series [39]. In our study, the time series have 138 time points, therefore, we can decompose the time series up to eight levels. As the decomposition level increases, more subsets of the time series and detailed information contained in the series at a larger temporal scale would appear.
More information could contribute to better performance, but it may reduce the computing efficiency. Therefore, choosing a suitable decomposition level in DWT is of paramount importance to its performance and efficiency. We conducted experiments with the decomposition levels from one to eight, and found that eight is the optimum number of decomposition levels for the poplar canopy NDVI time series data as it produced the smallest standard error, and reserved key information and removed significant amount of noise in the time series.
Essentially, the DWT generates separate time series or components from the original one. The original information will be distributed into these different components in the form of wavelet coefficients. Therefore, it allows for reconstruction. Component xj(t) at the decomposition level j can be reconstructed by the following equation [53]:
x j ( t ) = κ W x ( j , k ) ψ ( t a 0 j b 0 j a 0 j )
The wavelet transform was implemented in MATLAB 2015b.

2.5.2. De-Noising of the NDVI Time Series

There are many techniques available for filtering noises in time series data, including the mean-value iteration filters (MVI), Savitzky-Golay filters, Fourier analysis, Harmonic Analysis of Time Series (HANTS), and wavelet transform [55,56,57,58,59]. We created an NDVI time series that represents the phenology of healthy desert poplars by removing noise (including the insect disturbance) in the original NDVI time series via wavelet de-noising. Wavelet de-noising is to remove the low amplitude noise from a time series [53] It involves first decomposing the original NDVI time series, then selecting an appropriate threshold limit at each decomposition level and removing all wavelet coefficients that are smaller than the threshold limit by setting them to zero, and finally reconstructing the time series from thresholded wavelet coefficients using Equation (3). Figure 5. shows the noise-filtered NDVI time series compared with the original one shown in Figure 3, in which the noise has been almost entirely suppressed and can be considered as the normal growth curve of desert poplars free of disturbance caused by insects, forest fires, droughts, harvesting, clouds and snows.

2.5.3. Detection of the Pest Infestation Signals

As discussed in Section 2.2, the poplar forest disturbance by poplar looper occurred in March and April in the study area. According to our field observations, the sudden changes in the original NDVI time series in the two months were mainly caused by poplar looper defoliation. When the pest infestation occurred, the NDVI value dropped sharply. At the end of the outbreak, the second foliation occurred [60] and, as a result, the NDVI value increased again. In order to identify exactly when pest infestations happened and assess how severe they were, we replaced the NDVI values at the time points in March and April each year from 2009 to 2014 in the noise-filtered NDVI time series with their original values from Figure 3 and created a blended NDVI time series. Figure 6 shows the blended time series created based on the smoothed time series in Figure 5. The blended time series contains only noise made by the pest disturbance.
The blended NDVI time series was then decomposed into eight levels using the DWT to accentuate the abrupt changes representing the pest disturbance in the time series. By analysing the detail components, we detected the time points of the insect disturbance.

2.5.4. Discriminant Analysis and Accuracy Assessment

Discriminant analysis is to determine class membership using one or several discriminant functions based on linear combinations of the predictor variables that provide the best discrimination between the classes [61]. A general form of a discriminant function can be written as
y = b 0 + b 1 x 1 + b 2 x 2 + + b n x n
where y is the categorical dependent variable or grouping variable used for classifying into two or more groups, xi (i = 1, 2, …, n) is the predictor variable, and bi (i = 0, 1, 2, …, n) is the discriminant function coefficient. The coefficients are derived from a sample of cases for which class membership is known. Once the function is generated, it can be applied to new cases of unknown classes that have measurements for the predictor variables. In our case, we only have one discriminant function where the y value is a severity discriminant score, and one predictor variable x is the amplitude of the changes in the NDVI between two time points extracted from detail components derived from the blended NDVI time series. There are several discriminant rules for predicting class membership based on discriminant scores, including the maximum likelihood rule, Bayes discriminant rule and Fisher’s linear discriminant rule [62]. We used the Bayes discriminant rule. SPSS was used to conduct the discriminant analysis.
The predictive model built through discriminant analysis was used for severity classification of the pest disturbance. The prediction accuracy of the model was assessed using the Press Q statistic. The Press Q is a statistical test for the discriminatory power of the classification matrix resulted from discriminant analysis when compared with the chance model. It is expressed as:
P r e s s   Q = N l L 2 N ( L 1 )
where N is the total sample size, l is the number of correctly classified cases, and L is the number of classes. The critical value of Press Q is 6.63 at the 0.01 significance level, and 3.84 at the 0.05 significance level (subject to a chi-square distribution with a degree of freedom of 1).

3. Results

3.1. Trend and Seasonality of Poplar Canopy NDVI

The poplar canopy NDVI time series at each sampling site were analysed to understand the trend and seasonality of poplar canopy NDVI. For example, the NDVI time series curve shown in Figure 3 indicates that at Sampling Site 2, the maximum NDVI is 0.53, the minimum NDVI is 0.03 and the average is 0.23.
The NDVI time series was decomposed into eight levels through the DWT. Figure 7 shows eight reconstructed detail components (D1 to D8) and the level eight approximation component (A8) derived from the blended time series shown in Figure 6. Lower detail levels have higher frequencies, which represent the rapidly changing components of the dataset, whereas the higher detail levels have lower frequencies, which represent the slowly changing component of the dataset. The approximation component (A8) represents the slowest changing component of the dataset. It depicts the long-term trend of the poplar canopy NDVI, which exhibits a stable upward trend from 2009 to 2012, and then a slight decreasing trend after 2012. It indicates that the climate condition was generally improved to favour the growth of desert poplars, leading to the rise of NDVI. According to Liu et al. [63] and Liu et al. [64], in the Yerqiang River Catchment, the climate has been clearly becoming warmer and more humid in recent years, which promotes the plant growth. The trend of the poplar canopy NDVI coincides with the trend of the climate change. Therefore, the trend component of the NDVI time series reflects the climate change in the region to some extent.
The noise-filtered NDVI time series as shown in Figure 5 presents the seasonality of the NDVI time series. The growing season of poplars is observed every year. The maximum NDVI values occurred in the period of mid-June to mid-July every year, while the minimum values appeared in every late December to early February in the following year. This temporal pattern corresponds to the phenological cycles of poplar trees in the middle and lower reaches of the Yerqiang River.

3.2. Poplar Forest Defoliation Caused by Poplar Loopers

The detail component D1 shown in Figure 7b represents 32-day periodicity (two time points) of the original time series. It contains detail features that clearly describe the sudden changes and peaks or spikes in the observed NDVI time series. These sudden changes had various peak amplitudes and occurred at different time points. Those with a large peak amplitude can be considered as “resonance” points at which a sudden change in the NDVI was driven by an external force. By analysing these resonance points, we found that the sudden changes in the NDVI at the twotime points 5, and 122 appeared corresponding to the seasons when poplar loopers hatched and fed on the buds and leaves of poplars, therefore may be caused by defoliation due to the pest. These time points areearly March of 2009 and early April of 2014 respectively.
Generally, the average temperature in March determined when the resonance points occurred. According to the meteorological records available in the study area from 2009 to 2014, the average temperature in early March in 2014 was relatively low as shown in Figure 8, which delayed the poplar’s leaf unfolding and the poplar looper’s hatching. The growing season of desert poplars usually began at the Mid-February and ended in late November. The pupae of poplar looper hatched in early March. Mid-March to April is the peak period of its outbreak. But the temperature in late February 2009 was higher than usual, which resulted in earlier hatching of the pupae of poplar looper, thus an earlier outbreak of the insect. By examining the original NDVI time series and the detail component D1 in Figure 7b, we found that the NDVI value of poplar canopy increased rapidly when the growth period started each year, and then decreased sharply in early March of 2009, and in early April of 2014. According to our field observations, these sharp drops in the NDVI were all a direct result of poplar looper caused defoliation. From the detail component D1, the peak amplitudes of the sudden changes in the NDVI at the resonance points were 0.0269 in early March of 2009 and 0.0473 in early April of 2014. Larger the drop in the NDVI, severer the infestation. The NDVI started to increase in April after the insect-induced defoliation due to the second foliation.

3.3. Prediction Model of Infestation Severity

The discriminant analysis produced four classification functions to classify the infestation severity of the insect infestation, which are
y ( 0 ) = 3.145 + 366.557 x
y ( 1 ) = 10.734 + 845.094 x
y ( 2 ) = 34.494 + 1590.440 x
y ( 3 ) = 59.798 + 212.522 x
where x is the amplitude of the NDVI change from the detail component D1 in Figure 7b and y ( 0 ) , y ( 1 ) , y ( 2 ) and y ( 3 ) are the discriminant scores of severity classification of the insect infestation. Substituting the existing x value into Equations (6)–(9) for calculation, the one which gets the highest score will be classified into that category. Thirty-six sample cases of 2014 were used to build the discriminant functions. Table 2 lists the class statistics, which presents the distribution, amplitudes of change, and standard errors of observations/sample cases in each class. We used the default weight of 1 for each observation. The eigenvalue is 7.36 > 1, the Wilks’ Lambda is 0.12 < 0.5 and p-value is less than 0.001, hence the classes are statistically distinct. Table 3 lists the classification results. 91.7% of the observations/cases were correctly classified. According to Equation (5), the Press Q statistic is 85.3 > 6.63, the critical value at the significant level of 0.01. Therefore, the model has a very good predictive power and the classification was significantly better than chance.
Excluding the 2014 sample plots that participated in the establishment of the discriminant model, the thirty-five D1 values of the seven sample plots from 2009 to 2013 were substituted into the Equations (6)–(9) for hazard prediction, and the results were compared with the field observations. Table 4 shows the classification or confusion matrix, which gives an overall accuracy of 77.14%. It means that the model can effectively predict the severity of the insect infestation.

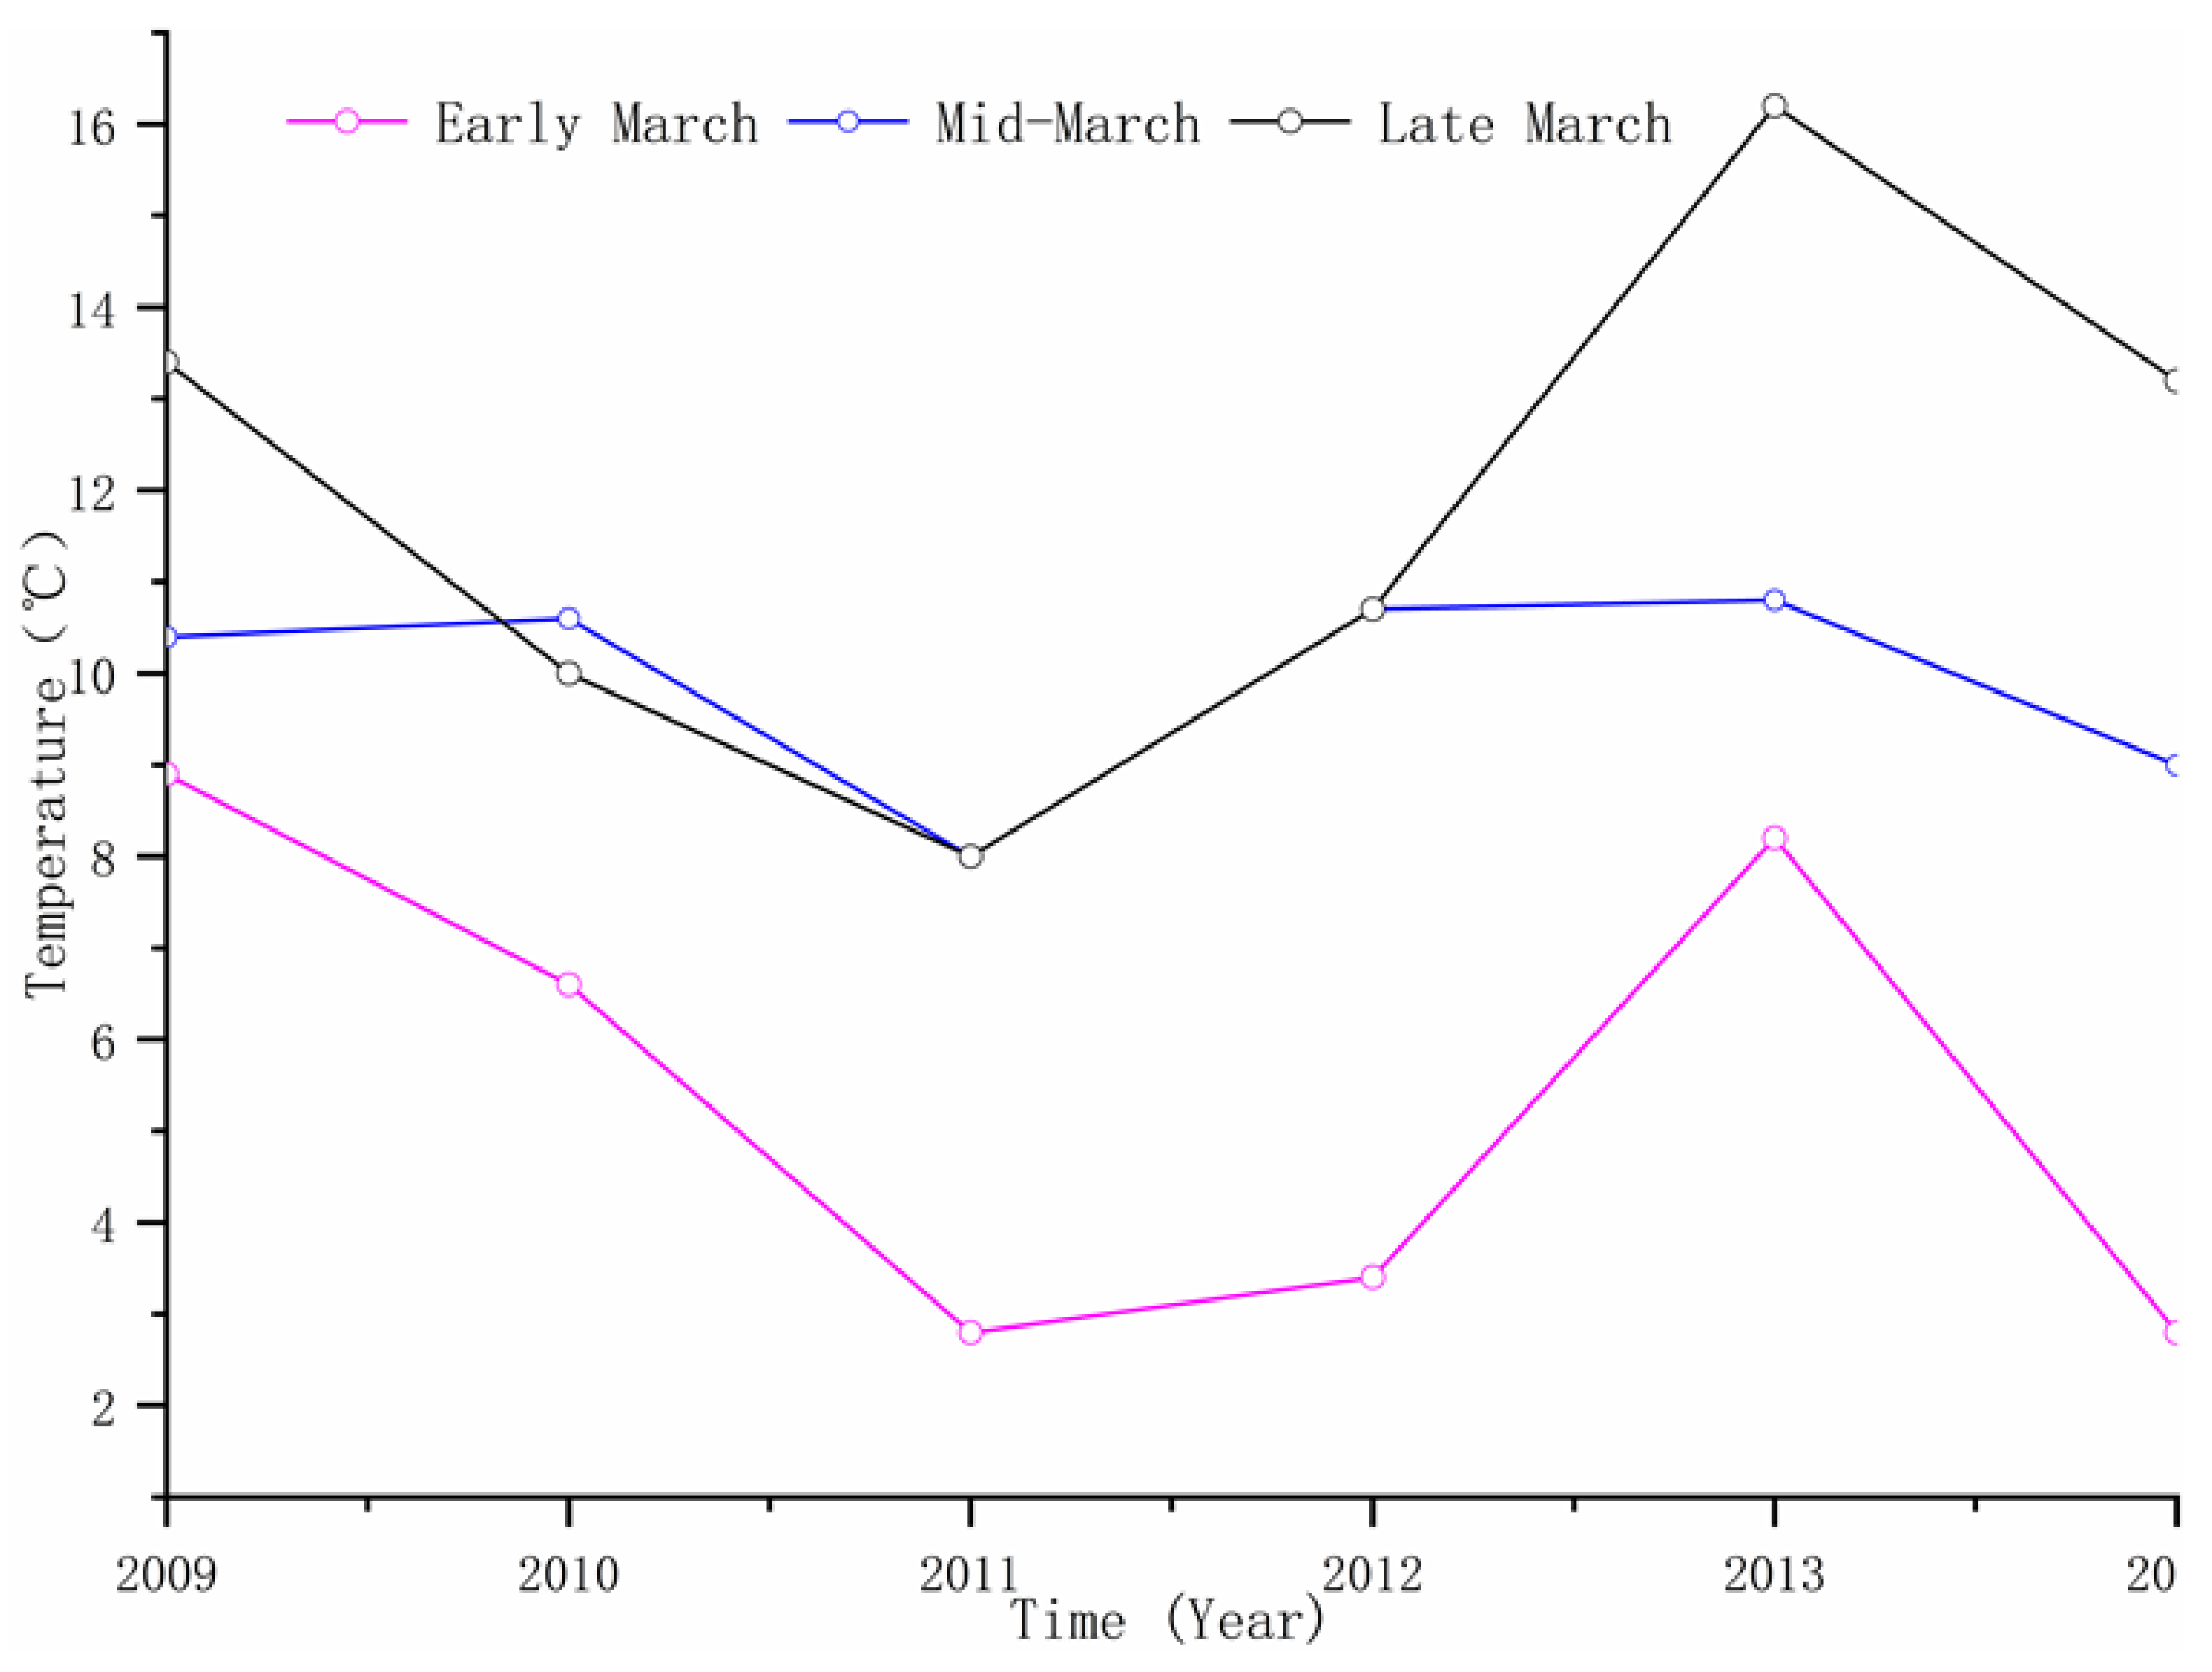
3.4. Insect Outbreak Date Prediction

Traditionally pest outbreak is monitored through on-site surveys, while the outbreak time is predicted using meteorological data, especially temperature data, combined with the pest life history [65]. In this study, the maximum amplitude of the detail component D1 from March to April each year indicates the pest outbreak, thus its corresponding date is the predicted outbreak date. By obtaining the pest outbreak dates from the detail component D1 from March to April each year from 2009–2014 at each sampling site, a confusion matrix was formed to evaluate the accuracy of the method for predicting pest outbreak dates, which is shown in Table 5. This confusion matrix gives an overall accuracy of 94.37%, which means 94.37% of the dates of insect outbreaks are correctly predicted. Errors mainly occurred in late April. Therefore, the detected dates of insect outbreaks are considered to match the observed dates well.

4. Discussion

4.1. Poplar Looper Pest Monitoring

Remote sensing allows non-contact and spatially continuous monitoring of forest pest infestation [66]. In this paper, we presented an approach to the detection and severity classification of the infestation of poplar looper on desert poplars using MODIS NDVI time series through the wavelet transform and discriminant analysis. Gärtner et al. [67] did a similar research. They combined RapidEye high-resolution and Landsat 8 medium resolution data to produce synthetic images using the enhanced spatial and temporal adaptive reflectance fusion model (ESRARFM) [67] to detect poplar forest disturbance caused by poplar looper in a riparian Tugai forest at the Arghan forest station in Xinjiang. Their purpose was to assess whether the synthetic images could achieve a better disturbance detection accuracy than that achieved by using RapidEye data alone. They used the relative NDVI difference to measure forest defoliation and recovery, and classify the severity of defoliation based on the ratio of defoliation and recovery [68]. Eight RapidEye images (5 m resolution) and ten Landsat 8 images were acquired in the 2003 growing season from the end of March to mid-September with large time windows. One limitation with the study is that the acquisition dates for the high resolution images could miss the foliation peak starting of defoliation, reducing the information about the disturbance. The second limitation is that the relative NDVI differences might not capture defoliation caused by insects. The third limitation is the high cost of high resolution image acquisition, which would prevent the use of the method for real-time monitoring of forest insect infestation and for studying insect dynamics over a long term. MODIS data can overcome these limitations and allow for analysing long time series to capture the natural fluctuations that are inherent to insect dynamics [21,22,23,25,26]. Huang [32], Wang [38] and Qiu [69] used MOD13Q1 and satellite HJ A/B data to study poplar looper infestation. The main limitation of their research is that they only studied whether an infestation had occurred using very short time series data and did not assess the severity of pest infestation and detect the time of its occurrence. Jia [36] and Huang [37] used the same method as that used in Huang [32] to obtain poplar looper infestation information in different years in our study area, simulated the spatial spread of insect infestation, and identified the factors affecting the poplar looper outbreaks. Liu [70] used the MODLT1D temperature product to study the response of the poplar looper in the desert poplar forests to surface temperature in this area. These studies including ours analysed and modelled the infestation of poplar looper in desert poplar forests using remote sensing data from different perspectives, and provided new tools for future large-scale remote sensing monitoring of poplar looper infestation.

4.2. Identification of Outbreaks of Pests

Remote sensing images can capture the changes in vegetation canopy caused by pest infestation [71]. In this study, we applied the wavelet transform to filter the noise and graft the original NDVI values from March to April. The D1 detail component of an NDVI time series obtained after decomposition and reconstruction can highlight the sudden changes in NDVI values. As shown in Figure 9, when the NDVI time series curve suddenly increases or decreases, the D1 curve also fluctuates strongly. Because the poplar looper infestation starts in late March and ends in middle or late April in the study area, the maximum value on the D1 curve from March to April each year can be used to determine whether the poplar looper infestation occurred. For example, substituting the maximum values of D1 in March and April of 2009, 2010 and 2012 respectively (reference lines A, B, C in Figure 9) into the Equations (6)–(9) to determine the severity level of pest infestation at Sampling Site 4 (see Figure 1), the results show that poplar looper infestation occurred at this site in early March 2009, 2010 and late April 2012, which correspond to our field observations.
The outbreak time determined by the method and the outbreak time observed through field surveys match with an accuracy of 94.37%, which shows that the methodology is able to reliably determine the outbreak time.

4.3. Wavelet Analysis

Wavelet analysis has been applied in the field of radio [72] (such as noise reduction for acoustic or video signals), meteorological [73,74,75] and hydrological information analysis [76,77]., image enhancement [78] and image fusion [79]. Hyperspectral images have a very high spectral resolution with hundreds of bands forming an approximately continuous spectral curve [80]. Some scholars have tried to use continuous wavelet analysis for monitoring wheat yellow rust and powdery mildew for winter wheat based on hyperspectral images [81,82,83]. They expanded the spectral data of each pixel in a single hyperspectral image to form a spectral curve, which is similar to an acoustic audio signal, and then applied wavelet analysis to detect or extract specific information about the outbreaks of the fungal diseases in the crops.
In this study, we modelled the numerical curve of each image element of the long time series of NDVI images as a special signal curve based on the characteristics of the periodic and regular changes of the vegetation canopy NDVI, which contains information about the seasonality and trends of the poplar tree growth, as well as localized abrupt changes caused by disturbance events such as droughts, fires, pests, diseases, and leave and timber harvesting or caused by clouds and snows; decomposed NDVI time series data over multiple levels via the wavelet transform; and constructed a smoothed NDVI time series to represent the poplar tree growth under normal conditions. We then added the March and April NDVI data to the smoothed NDVI time series to extract the high-frequency components. The level 1 detail components of the blended time series provide the best indicators of the pest infestation. The result shows that we have successfully detected the pest information. This is a new attempt to apply the wavelet analysis method.

4.4. Limitations

Although the research focused on the poplar looper infestation on desert poplars, the proposed approach can be used to detect and assess forest insect disturbances in general. However, our approach has its limitations.
As we blended the smoothed NDVI time series with the subset of the original time series containing the pest infestation signals, other noises such as those created by clouds and dust storms in the same period remained in the blended time series, which may reduce the detection and severity classification accuracy. It is necessary to identify and remove those noises not caused by pest induced forest disturbances by comparing the original time series and the detail components of the blended time series.
In addition, MODIS NDVI data have a moderate temporal resolution of 16 days and a coarse spatial resolution of 250 m. The presented approach works well in dense poplar forests. But both temporal and spatial resolutions may not be sufficient for accurately determine when and where pest infestations occurred in the areas where poplars are sparsely distributed. Further research will be conducted to fuse MODIS NDVI time series data with other remote sensing data with higher temporal and spatial resolutions to improve the accuracy.
Poplar looper has one generation a year in the Tarim Basin. Its outbreak occurs in March and April. Our approach can be applied directly to an area with the similar natural environment and pest infestation dynamics. Tests are required to verify whether it is applicable to other regions where pests may live for more than one generation, such as the areas south to the Yangtze River in China where pests may have three generations a year and the areas north to the Yangtze River where pests may have two generations a year.
Detection and monitoring of poplar looper infestations on desert poplars by means of remote sensing is still in the stage of exploration and development. Further studies will be conducted to improve the proposed approach with the aim to more accurately detect the poplar looper infestation signals from remote sensing data and enable early detections of poplar forest pest-induced disturbance, which can provide timely information and early warning for effective poplar forest pest prevention and control. Without the disturbance of pests, the growth of desert poplars will be getting better, thereby improving the ecological conditions of its habitat in the Taklimakan Desert.

5. Conclusions

In this paper, we presented an approach to the detection and severity classification of the infestation of poplar looper on desert poplars using MODIS NDVI time series through the wavelet transform and discriminant analysis. Our research proves the potential of wavelet analysis technology based on MODIS NDVI time series in monitoring pests and diseases in dense desert poplar forests. Our method achieved 91.7% accuracy in detecting the poplar looper outbreaks in the middle and lower reaches of the Yerqiang River. Therefore, in the future, we can extend the application of the approach to monitoring the defoliation of trees caused by insect pests or diseases.

Author Contributions

Conceptualization, T.H., X.D., X.Z. (Xuan Zhu), S.C., and; X.Z. (Xiaoli Zhang); Formal analysis, T.H., X.D., X.Z. (Xuan Zhu), S.C. and X.J.; Investigation, X.D., M.C., X.J. and F.L.; Methodology, T.H. and X.D.; Software, X.Z. (Xiaoli Zhang); Writing—original draft preparation, T.H., X.D., X.Z. (Xuan Zhu) and S.C.; Writing—review and editing, T.H., X.D., X.Z (Xuan Zhu)., S.C., and; X.Z. (Xiaoli Zhang) All authors have read and agree to the published version of the manuscript.

Funding

This research was funded by National Natural Science Foundation of China (Fund No.: 31460167) and National Key Research and Development Program of China project, Ministry of Science and Technology (Fund No.: 2016YFC0501500).

Data Availability Statement

The data presented in this study are available on request from the corresponding author. The data are not publicly available due to privacy.

Conflicts of Interest

The authors declare no conflict of interest.

References

  1. Wang, S.J. The status, conservation and recovery of global resources of Populus euphradica. World For. Res. 1996, 6, 38–45. [Google Scholar]
  2. Chen, C.Q. Discussion on populus evolution and ecological protection countermeasures of Yeerqiang River Watershed. Environ. Prot. Xinjiang 2011, 33, 41–44. [Google Scholar] [CrossRef]
  3. Bai, B.; Chen, S.J.; Geng, Q.L.; Zeng, Y.J. A study on the relationships between the spatial distribution of Apocheima cinerarius Erschoff and its living environment. Acta Agric. Jiangxi 2008, 20, 56–58. [Google Scholar]
  4. Li, F. Occurrence and control of Poplar looper. Mod. Agric. Technol. 2013, 4, 152. [Google Scholar]
  5. Liu, S.; Jiang, N.; Xue, D.; Cheng, R.; Qu, Y.; Li, X.; Lei, F.; Han, H. Evolutionary history of Apocheima cinerarius (Lepidoptera: Geometridae), a female flightless moth in northern China. Zool. Scr. 2016, 45, 160–174. [Google Scholar] [CrossRef]
  6. Chu, H.F. Geometridae. Iconogr. Heterocerorum Sin. 1981, 1, 112–131. [Google Scholar]
  7. Feng, H.Z.; Wang, L.; Hu, W.J.; Wei, H.B.; Song, L.X. Occurrence and aerial control of Apocheima cinerarius in the natural Euphrates poplar forests in Shaya county. For. Pest Dis. 2005, 24, 22–24. [Google Scholar]
  8. Luo, L.; Wang, L.; Gao, Y.; Liu, Z.; Liu, P. Spatial distribution and emergence regularity of Apocheima cinerarius overwintering pupa. For. Pest Dis. 2016, 35, 17–20. [Google Scholar]
  9. Sattler, K. A review of wing reduction in Lepidoptera. Bulletin of the British Museum, Natural History. Entomology 1991, 60, 243–288. [Google Scholar]
  10. Yu, H.; Shao, Q.; Bing, W.Y.; Wang, D.Y. Analysis on the dynamics of spatial pattern of Apocheima cinerarius Erschoff population in Hetian, Xinjiang. Chin. Agric. Sci. Bull. 2005, 21, 334–338. [Google Scholar]
  11. Yu, H.; Wang, D.Y.; Wang, Y.B.; Lu, W.Y. Geostatistical analysis of the spatial pattern of Apocheima cinerarius Erschoff. J. Yunnan Agric. Univ. 2006, 21, 303–306.319. [Google Scholar] [CrossRef]
  12. Chen, M.; Jia, X.; Chen, S.; Hou, B.; Liu, Y.; Huang, T.; Yan, Z. The prediction of the occurrence period of Populus euphratica Apocheima cinerius Erschoff in the Yarkant River Basin based on remote sensing. Ecol. Sci. 2020, 39, 145–156. [Google Scholar]
  13. Zhang, J.; Huang, Y.; Pu, R.; Gonzalez-Moreno, P.; Yuan, L.; Wu, K.; Huang, W. Monitoring plant diseases and pests through remote sensing technology: A review. Comput. Electron. Agric. 2019, 165, 104943. [Google Scholar] [CrossRef]
  14. Abd El-Ghany, N.M.; Abd El-Aziz, S.E.; Marei, S.S. A review: Application of remote sensing as a promising strategy for insect pests and diseases management. Environ. Sci. Pollut. Res. 2020, 27, 33503–33515. [Google Scholar] [CrossRef]
  15. Huo, L.; Persson, H.J.; Lindberg, E. Early detection of forest stress from European spruce bark beetle attack, and a new vegetation index: Normalized distance red & SWIR (NDRS). Remote Sens. Environ. 2021, 255, 112240. [Google Scholar] [CrossRef]
  16. Donovan, S.D.; MacLean, D.A.; Zhang, Y.; Lavigne, M.B.; Kershaw, J.A. Evaluating annual spruce budworm defoliation using change detection of vegetation indices calculated from satellite hyperspectral imagery. Remote Sens. Environ. 2021, 253, 112204. [Google Scholar] [CrossRef]
  17. Duarte, A.; Acevedo-Munoz, L.; Goncalves, C.I.; Mota, L.; Sarmento, A.; Silva, M.; Fabres, S.; Borralho, N.; Valente, C. Detection of Longhorned Borer Attack and Assessment in Eucalyptus Plantations Using UAV Imagery. Remote Sens. Basel 2020, 12, 3153. [Google Scholar] [CrossRef]
  18. Fernandez-Carrillo, A.; Patocka, Z.; Dobrovolny, L.; Franco-Nieto, A.; Revilla-Romero, B. Monitoring Bark Beetle Forest Damage in Central Europe. A Remote Sensing Approach Validated with Field Data. Remote Sens. Basel 2020, 12, 3634. [Google Scholar] [CrossRef]
  19. Minarik, R.; Langhammer, J.; Lendzioch, T. Automatic Tree Crown Extraction from UAS Multispectral Imagery for the Detection of Bark Beetle Disturbance in Mixed Forests. Remote Sens. Basel 2020, 12, 4081. [Google Scholar] [CrossRef]
  20. Senf, C.; Seidl, R.; Hostert, P. Remote sensing of forest insect disturbances: Current state and future directions. Int. J. Appl. Earth Obs. 2017, 60, 49–60. [Google Scholar] [CrossRef] [Green Version]
  21. Shi, H.; Wang, X.; Xue, J.H.; Li, Y.; Xu, Y.N.; Wu, Y.B. A rapid assessment method for forest disaster based on MODIS/NDVI time series: A case study from Guizhou province. Acta Ecol. Sin. 2012, 32, 3359–3367. [Google Scholar] [CrossRef] [Green Version]
  22. Spruce, J.P.; Sader, S.; Ryan, R.E.; Smoot, J.; Kuper, P.; Ross, K.; Prados, D.; Russell, J.; Gasser, G.; McKellip, R. Assessment of MODIS NDVI time series data products for detecting forest defoliation by gypsy moth outbreaks. Remote Sens. Environ. 2011, 115, 427–437. [Google Scholar] [CrossRef]
  23. Olsson, P.; Lindström, J.; Eklundh, L. Near real-time monitoring of insect induced defoliation in subalpine birch forests with MODIS derived NDVI. Remote Sens. Environ. 2016, 181, 42–53. [Google Scholar] [CrossRef]
  24. Eklundh, L.; Johansson, T.; Solberg, S. Mapping insect defoliation in Scots pine with MODIS time-series data. Remote Sens. Environ. 2009, 113, 1566–1573. [Google Scholar] [CrossRef]
  25. Anees, A.; Aryal, J. Near-real time detection of beetle infestation in pine forests using MODIS data. IEEE J. Stars 2014, 7, 3713–3723. [Google Scholar] [CrossRef]
  26. Olsson, P.; Kantola, T.; Lyytikäinen-Saarenmaa, P.; Jönsson, A.M.; Eklundh, L. Development of a method for monitoring of insect induced forest defoliation-limitation of MODIS data in Fennoscandian forest landscapes. Silva Fenn. 2016, 50, 1495. [Google Scholar] [CrossRef] [Green Version]
  27. Rullan-Silva, C.D.; Olthoff, A.E.; Delgado De La Mata, J.A.; Pajares-Alonso, J.A. Remote monitoring of forest insect defoliation. A review. For. Syst. 2013, 22, 377–391. [Google Scholar] [CrossRef] [Green Version]
  28. Zheng, Q.; Huang, W.; Cui, X.; Shi, Y.; Liu, L. New Spectral Index for Detecting Wheat Yellow Rust Using Sentinel-2 Multispectral Imagery. Sensors Basel 2018, 18, 868. [Google Scholar] [CrossRef] [Green Version]
  29. Rahimzadeh-Bajgiran, P.; Weiskittel, A.R.; Kneeshaw, D.; MacLean, D.A. Detection of Annual Spruce Budworm Defoliation and Severity Classification Using Landsat Imagery. Forests 2018, 9, 357. [Google Scholar] [CrossRef] [Green Version]
  30. Bhattarai, R.; Rahimzadeh-Bajgiran, P.; Weiskittel, A.; MacLean, D.A. Sentinel-2 based prediction of spruce budworm defoliation using red-edge spectral vegetation indices. Remote Sens. Lett. 2020, 11, 777–786. [Google Scholar] [CrossRef]
  31. Otsu, K.; Pla, M.; Vayreda, J.; Brotons, L. Calibrating the Severity of Forest Defoliation by Pine Processionary Moth with Landsat and UAV Imagery. Sensors Basel 2018, 18, 3278. [Google Scholar] [CrossRef] [PubMed] [Green Version]
  32. Huang, T.C. Assessment of Poplar Looper (Apocheima cinerarius Erschoff) Infestation on Euphrates (Populus euphratica) in the Tarim River Basin in Xinjiang. Master’s Thesis, Xinjiang Normal University, Urumqi, China, 2012. [Google Scholar]
  33. Abdullah, H.; Skidmore, A.K.; Darvishzadeh, R.; Heurich, M. Sentinel-2 accurately maps green-attack stage of European spruce bark beetle (Ips typographus, L.) compared with Landsat-8. Remote Sens. Ecol. Conserv. 2019, 5, 87–106. [Google Scholar] [CrossRef] [Green Version]
  34. Hornero, A.; Hernandez-Clemente, R.; North, P.R.J.; Beck, P.S.A.; Boscia, D.; Navas-Cortes, J.A.; Zarco-Tejada, P.J. Monitoring the incidence of Xylella fastidiosa infection in olive orchards using ground-based evaluations, airborne imaging spectroscopy and Sentinel-2 time series through 3-D radiative transfer modelling. Remote Sens. Environ. 2020, 236, 111480. [Google Scholar] [CrossRef]
  35. Jönsson, P.; Eklundh, L. TIMESAT: A program for analyzing time-series of satellite sensor data. Comput. Geosci. 2004, 30, 833–845. [Google Scholar] [CrossRef] [Green Version]
  36. Jia, X.; Chen, S.; Yin, X.; Chen, M.; Huang, T.; Yan, Z. Simulation of the propagation process of mulberry looper Apocheima cinerarius based on the CLUE-S model. J. Plant Prot. 2019, 46, 1018–1028. [Google Scholar] [CrossRef]
  37. Huang, T.; Zhang, X.; Chen, S.; Yin, X.; Jia, X.; Chen, M. An analysis on the driving factors of Apochemia cineraius Erschoft spread of Populus euphratica forest in the middle and lower Yeerqiang River Basin. J. Yunnan Univ. Nat. Sci. Ed. 2020, 42, 352–363. [Google Scholar] [CrossRef]
  38. Wang, H.; Shi, Z.; Wang, Y.; He, G.; Wang, J.; Zhang, Z.; Yin, R.; Zhao, J. A Method for Detecting the Damage of Apocheima CinerariusErschoff based on MODIS Time Series: Case Studies in Bachu Populus Euphratica Forest of Xinjiang Province. Remote Sens. Technol. Appl. 2018, 33, 686–695. [Google Scholar] [CrossRef]
  39. Daubechies, I. Ten Lectures on Wavelets; SIAM: Philadelphia, PA, USA, 1992. [Google Scholar]
  40. Adachi, K. Matrix-Based Introduction to Multivariate Data Analysis; Springer: Singapore, 2016. [Google Scholar]
  41. Lin, J.; Huang, T.; Lai, F.; CHen, M.; Chen, S.; Jia, X. The height-diameter coefficient of Populus euphratica and its indicative significance to the habitat in the middle reaches of the Tarim River. Acta Ecol. Sin. 2017, 37, 3355–3364. [Google Scholar]
  42. Wang, S.; Chen, B.; Li, H. Populus euphratica; China Environmental Science Press: Beijing, China, 1995. [Google Scholar]
  43. Running, S.W.; Nemani, R.R. Relating seasonal patterns of the AVHRR vegetation index to simulated photosynthesis and transpiration of forests in different climates. Remote Sens. Environ. 1988, 24, 347–367. [Google Scholar] [CrossRef]
  44. Galford, G.L.; Mustard, J.F.; Melillo, J.; Gendrin, A.; Cerri, C.C.; Cerri, C.E. Wavelet analysis of MODIS time series to detect expansion and intensification of row-crop agriculture in Brazil. Remote Sens. Environ. 2008, 112, 576–587. [Google Scholar] [CrossRef]
  45. Shao, X.; Xu, Y.; Yan, C. Wavelet analysis of rainfall variation in the Yellow River Basin. Acta Sci. Nat. Univ. Pekin. 2006, 42, 503–509. [Google Scholar]
  46. Steel, E.A.; Lange, I.A. Using wavelet analysis to detect changes in water temperature regimes at multiple scales: Effects of multi-purpose dams in the Willamette River basin. River Res. Appl. 2007, 23, 351–359. [Google Scholar] [CrossRef]
  47. Jiang, Y.X.; Liu, S.H.; Ma, M.M.; Zhang, J.; Song, J. A wavelet analysis of the precipitation time series in Northeast China during the last 100 years. Geogr. Res. 2009, 28, 354–362. [Google Scholar]
  48. Martínez, B.; Gilabert, M.A. Vegetation dynamics from NDVI time series analysis using the wavelet transform. Remote Sens. Environ. 2009, 113, 1823–1842. [Google Scholar] [CrossRef]
  49. Chen, J.; Deng, M.; Xiao, P.; Yang, M.; Mei, X.; Liu, H. Multi-scale watershed segmentation of high-resolution multi-spectral remote sensing image using wavelet transform. J. Remote Sens. 2011, 15, 908–926. [Google Scholar]
  50. Li, M.; Xia, J.; Chen, S.M.; Meng, D.J. Wavelet analysis on annual precipitation around 300 years in Beijing Area. J. Nat. Resour. 2011, 26, 1001–1011. [Google Scholar] [CrossRef]
  51. Liu, Y.F.; Sun, H.; Yuan, Z.H. Multi-time scale features of runoff and sediment discharge on wavelet analysis at Hejin Station of Fenhe River Basin. Sci. Geogr. Sin. 2012, 32, 764–770. [Google Scholar]
  52. Mather, P.M. Computer Processing of Remotely-Sensed Images; John Wiley & Sons: Chichester, UK, 2004. [Google Scholar]
  53. Percival, D.B.; Walden, A.T. Wavelet Methods for Time Series Analysis; Cambridge University Press: New York, NY, USA, 2000. [Google Scholar]
  54. Burrus, C.S.; Gopinath, R.A.; Guo, H.T. Introduction to Wavelets and Wavelet Transforms; A Primer; Prentice Hall: Upper Saddle River, NJ, USA, 1998. [Google Scholar]
  55. Guo, G.; Wang, H.; Bell, D. Data Reduction and Noise Filtering for Predicting Times Series. In Proceedings of the International Conference on Web-Age Information Management, Beijing, China, 11–13 August 2002; Springer: Berlin/Heidelberg, Germany; pp. 421–429. [Google Scholar]
  56. Gu, J.; Li, X.; Huang, C.; Okin, G.S. A simplified data assimilation method for reconstructing time-series MODIS NDVI data. Adv. Space Res. 2009, 44, 501–509. [Google Scholar] [CrossRef]
  57. Li, H.Y. Study on the Reconstruction of Time-Series NDVI Data Set. Master’s Thesis, Lanzhou University, Lanzhou, China, 2010. [Google Scholar]
  58. Atkinson, P.M.; Jeganathan, C.; Dash, J.; Atzberger, C. Inter-comparison of four models for smoothing satellite sensor time-series data to estimate vegetation phenology. Remote Sens. Environ. 2012, 123, 400–417. [Google Scholar] [CrossRef]
  59. Geng, L.Y.; Ma, M.G. Advance in method comparison of reconstructing remote sensing time series data sets. Remote Sens. Technol. Appl. 2014, 29, 362–368. [Google Scholar]
  60. Maryamgul, A.; Alishir, K.; Adil, A.; Rahmitulla, A.; Duan, H.; Abdimijit, A.; Umut, H. Study on Phenological Characters of Populus euphratica Oliv. in the Lower Reaches of the Tarin River. Arid Zone Res. 2008, 25, 525–530. [Google Scholar]
  61. McLachlan, G.J. Discriminant Analysis and Statistical Pattern Recognition; John Wiley & Sons: Hoboken, NJ, USA, 2004. [Google Scholar]
  62. Hastie, T.; Tibshirani, R.; Friedman, J. The Elements of Statistical Learning: Data Mining, Inference, and Prediction; Springer Science & Business Media: New York, NY, USA, 2009. [Google Scholar]
  63. Liu, T.L.; Yang, Q.; Qin, R.; He, Y.P.; Liu, R. Climate change towards warming-wetting trend and its effects on runoff at the headwater region of the Yarkant River in Xinjiang. J. Arid Land Resour. Environ. 2008, 22, 49–53. [Google Scholar]
  64. Liu, X.M.; Min, J.Z.; Liu, T.L. Wavelet analysis of temperature and precipitation variation in the Yarkant River Basin, Xinjiang. J. Desert Res. 2009, 29, 566–570. [Google Scholar]
  65. You, Y. Forecast and Control of Fruit Tree Diseases and Insect Pests; China Agriculture Press: Beijing, China, 1996. [Google Scholar]
  66. Ali, M.M.; Bachik, N.A.; Muhadi, N.A.; Tuan Yusof, T.N.; Gomes, C. Non-destructive techniques of detecting plant diseases: A review. Physiol. Mol. Plant P. 2019, 108, 101426. [Google Scholar] [CrossRef]
  67. Gärtner, P.; Förster, M.; Kleinschmit, B. The benefit of synthetically generated RapidEye and Landsat 8 data fusion time series for riparian forest disturbance monitoring. Remote Sens. Environ. 2016, 177, 237–247. [Google Scholar] [CrossRef] [Green Version]
  68. Zhu, X.; Chen, J.; Gao, F.; Chen, X.; Masek, J.G. An enhanced spatial and temporal adaptive reflectance fusion model for complex heterogeneous regions. Remote Sens. Environ. 2010, 114, 2610–2623. [Google Scholar] [CrossRef]
  69. Qiu, L.; Wang, L.; Luo, L.; Zheng, J. Study of Remote Sensing Monitoring for the Damage of Apocheima cinerarius on Tugai forest in Middle Reaches Area of the Tarim River Based on Time Series. Xinjiang Agric. Sci. 2018, 55, 518–527. [Google Scholar] [CrossRef]
  70. Liu, Y.; Jia, X.; Hou, B.; Chen, S.; Huang, T.; Lai, F. The response of developmental rhythm of Populus euphratica Apocheima Cinerius. Ecol. Sci. 2019, 38, 119–129. [Google Scholar]
  71. Chávez, R.; Rocco, R.; Gutiérrez, Á.; Dörner, M.; Estay, S. A Self-Calibrated Non-Parametric Time Series Analysis Approach for Assessing Insect Defoliation of Broad-Leaved Deciduous Nothofagus pumilio Forests. Remote Sens. Basel 2019, 11, 204. [Google Scholar] [CrossRef] [Green Version]
  72. Basilede, L.; Navarro, F.; Olivier, B.; Basilede, L.; Navarro, F.; Olivier, B. Data-driven thresholding in denoising with Spectral Graph Wavelet Transform. J. Comput. Appl. Math. 2021, 389, 250–255. [Google Scholar] [CrossRef]
  73. Khan, M.M.H.; Muhammad, N.S.; El-Shafie, A. Wavelet based hybrid ANN-ARIMA models for meteorological drought forecasting. J. Hydrol. 2020, 590, 125380. [Google Scholar] [CrossRef]
  74. Drago, A.F.; Boxall, S.R. Use of the wavelet transform on hydro-meteorological data. Phys. Chem. Earth A/B/C 2002, 27, 1387–1399. [Google Scholar] [CrossRef]
  75. Adarsh, S.; Reddy, M.J. Trend analysis of rainfall in four meteorological subdivisions of southern India using nonparametric methods and discrete wavelet transforms. Int. J. Climatol. 2015, 35, 1107–1124. [Google Scholar] [CrossRef]
  76. Sang, Y. A review on the applications of wavelet transform in hydrology time series analysis. Atmos. Res. 2013, 122, 8–15. [Google Scholar] [CrossRef]
  77. Labat, D.; Ronchail, J.; Callede, J.; Guyot, J.L.; De Oliveira, E.; Guimaraes, W. Wavelet analysis of Amazon hydrological regime variability. Geophys. Res. Lett. 2004, 31, 2. [Google Scholar] [CrossRef] [Green Version]
  78. Sharma, R.; Yadav, A.K. Contrast Image Enhancement Using Luminance Component based on wavelet transform. International J. Recent Trends Eng. Res. 2020, 6, 22–29. [Google Scholar] [CrossRef]
  79. Yehia, A.; Safy, M.; Amein, A.S. Fusion of High-Resolution SAR and Optical Imageries Based on a Wavelet Transform and IHS Integrated Algorithm. Int. J. Eng. Res. Afr. 2021, 52, 62–72. [Google Scholar] [CrossRef]
  80. Dalponte, M.; Bruzzone, L.; Vescovo, L.; Gianelle, D. The role of spectral resolution and classifier complexity in the analysis of hyperspectral images of forest areas. Remote Sens. Environ. 2009, 113, 2345–2355. [Google Scholar] [CrossRef]
  81. Zhang, J.Y.L.W. Spectroscopic Leaf Level Detection of Powdery Mildew for Winter Wheat Using Continuous Wavelet Analysis. J. Integr. Agric. 2012, 11, 1474–1484. [Google Scholar] [CrossRef]
  82. Cheng, T.; Rivard, B.; Sanchez-Azofeifa, G.A.; Feng, J.; Calvo-Polanco, M. Continuous wavelet analysis for the detection of green attack damage due to mountain pine beetle infestation. Remote Sens. Environ. 2010, 114, 899–910. [Google Scholar] [CrossRef]
  83. Zheng, Q.; Huang, W.; Ye, H.; Dong, T.; Shi, Y.; Chen, S. Using continous wavelet analysis for monitoring wheat yellow rust in different infestation stages based on unmanned aerial vehicle hyperspectral images. Appl. Opt. 2020, 59, 8003–8013. [Google Scholar] [CrossRef]
Figure 1. Location of the study area.
Remotesensing 13 02345 g001
Figure 2. Populus in the leaf development stage, when poplar looper has not yet started chewing on the leaves: (a) 23 February 2014, (b) 1 March 2014.
Remotesensing 13 02345 g002
Figure 3. Time series of poplar canopy NDVI at Sampling Site 2 from 2009 to 2014.
Remotesensing 13 02345 g003
Figure 4. Methodology for the detection and severity assessment of poplar looper infestation.
Remotesensing 13 02345 g004
Figure 5. Noise-filtered NDVI time series.
Remotesensing 13 02345 g005
Figure 6. NDVI time series blended with pest disturbance signals.
Remotesensing 13 02345 g006
Figure 7. Results of wavelet decomposition of the blended NDVI time series: (a) D3 to D8 and A8 components and (b) D1 and D2 components. Reference lines A and, B are in early March 2009 and early April 2014 respectively.
Remotesensing 13 02345 g007
Figure 8. Average temperature in March from 2009 to 2014.
Remotesensing 13 02345 g008
Figure 9. The D1 response to NDVI at Sampling Site 4. The left Y-axis is the value of the detail component D1, and the right Y-axis is the NDVI value. Reference lines A and B are in early March 2009 and 2010 respectively, C is in late April 2012.
Remotesensing 13 02345 g009
Table 1. The classification of the severity of insect infestation.
Damage DegreePopulation Density (Insects/50 cm Standard Branch)Leaf Loss Rate (%)Severity
0<2<5no infestation
12–45–30light infestation
25–831–50moderate infestation
3>9>50severe infestation
Table 2. Class statistics.
ClassificationAverageStandard DeviationValid N (list Status)
UnweightedWeighted
00.00960.00522222.00
10.02210.005299.00
20.04160.005333.00
30.05530.000022.00
Total0.01790.01413636.00
Table 3. Classification matrix.
ObservedPredicted
0123
020200
11800
20030
30002
Table 4. Confusion matrix of the severity of insect infestation.
ObservedPredicted
0123
01231
1211
2 24
30002
Table 5. Confusion matrix of pest outbreak date from 2009 to 2014.
ObservedPredicted
No Insect InfestationEarly MarchLate MarchEarly AprilLate April
no insect infestation350003
early March016010
late March00000
early April000130
late April00003
Publisher’s Note: MDPI stays neutral with regard to jurisdictional claims in published maps and institutional affiliations.

