
The Bistatic Radar as an Effective Tool for Detecting and Monitoring the Presence of Phytoplankton on the Ocean Surface


1
Planetary Radar and Radio Sciences Group, Jet Propulsion Laboratory/California Institute of Technology, Pasadena, CA 91109, USA
2
Communication Architectures and Research Section, Jet Propulsion Laboratory/California Institute of Technology, Pasadena, CA 91109, USA
*
Author to whom correspondence should be addressed.
Remote Sens. 2021, 13(12), 2248; https://doi.org/10.3390/rs13122248
Submission received: 16 April 2021
/
Revised: 2 June 2021
/
Accepted: 4 June 2021
/
Published: 9 June 2021
(This article belongs to the Special Issue Applications of GNSS Reflectometry for Earth Observation II)
Abstract
:A massive dust storm formed over the Sahara Desert in June 2020. The African dust cloud, which traveled over the tropical Atlantic’s main development region for hurricanes, resulted in the highest aerosol optical thickness (AOT) for the past two decades. Dust particles contained in dust clouds are at some point deposited on the ocean surface, impacting the ocean biogeochemistry through the supply of nutrients. Although there are remote sensing systems that can map the AOT, the locations of the aerosol particles deposited on the ocean surface remain unknown quantities with remote sensing measurements. In addition, the supplied nutrients are not static and are displaced by ocean currents. Nutrients trigger the phytoplankton (algae) blooms, which form a film on the ocean surface and affect the ocean surface tension. The change in ocean surface tension causes a local decrease of ocean surface roughness over the areas covered with phytoplankton. Bistatic radar data from the CYclone Global Navigation Satellite System (CYGNSS) mission can detect changes in the ocean surface roughness, expressed as an increase in reflectivity when the surface becomes smoother. Therefore, decreased ocean surface roughness correlated with a recent dust storm represents a key indicator of the presence of phytoplankton. In this paper, we present for the first time the capability of bistatic radar measurements to provide an effective tool to map information of areas covered with phytoplankton, establishing bistatic radar as the most reliable remote sensing tool for detecting phytoplankton blooms and monitoring their presence across the ocean surface. We present the analysis of low ocean roughness signatures in the bistatic radar measurements from the CYGNSS mission observed in the Gulf of Mexico after the Sahara’s dust storm circulation from Africa to the American continent from May to July 2020. CYGNSS data offer an unprecedented spatial and temporal coverage that allows for the analysis of those signatures at time scales of 1-day, robust to the presence of clouds and dust clouds. The described capability benefits the improvement of models, promoting a better constraint of the supply of dust into the ocean surface and a better understanding of the excess of nutrients that triggers the phytoplankton blooms. This new bistatic radar application enhances our understanding on the role of dust storms on ocean biogeochemistry and the global carbon cycle.
1. Introduction
Every year, winds carry about millions of metric tons of desert dust from North Africa to the Atlantic Ocean. Often, the dust clouds are visible from space during the months of April to September. This phenomenon is known as the Saharan Air Layer (SAL) and consists of plumes of dry dusty air [1]. During May 2020, a massive dust storm took place in the Sahara Desert causing an increase of aerosol particles being transported from Africa to the American continent. Records show that the aerosol optical thickness (AOT) on 20-Jun-2020 was over 46% higher than the previous record on 31-Jul-2013 and the highest maximum daily value for the last 17 years. The 2020 Saharan dust reached the southern U.S. coast, the Gulf of Mexico, the Caribbean, and the northern part of South America continent. Being able to remotely detect a signature of aerosol particles deposited on the ocean surface and understanding the evolution of those depositions into the ocean surface would help quantify the supply of nutrients into the ocean. Dust deposition is not necessarily correlated with optical properties [2], which makes it difficult to identify the location and the extension of the ocean surface that is being supplied with the nutrients from the dust. In addition, nutrients are not necessarily static as ocean currents can displace those particles thousands of kilometers [3]. Direct measurements of dust depositions are very limited to measurements in some remote islands and for limited periods of time. The uncertainty in the knowledge of dust deposition translates into an uncertainty in oceanic iron concentration. Models can predict ocean nutrient deposition, but those models are evaluated against available concentration from direct measurements and optical thickness data. The uncertainty across all available models is at least a factor of four [4], which indicates that, in order to have a better understanding of the role of dust deposition in ocean biogeochemistry and the global carbon cycle, there is still a need to better understand the supply of dust into the ocean. Having remote sensing measurements that provide information on the location, extension, and motion of the nutrients is key information to marine biology as it helps assess the role of dust as a source of iron. The iron abundance influences rates and geophysical patterns of photosynthesis and nitrogen fixation [5,6]. Ocean productivity is a relevant component of the global carbon cycle, and the inclusion of dust deposition in the biogeochemical models is key to improving our knowledge of iron concentrations [5].
A phytoplankton bloom is triggered by an excess of nutrients supplied to the ocean, which, in combination with sunlight, make the plants grow and reproduce [7] to a point that they form a film on the ocean surface. Those blooms can begin within days from the initial supply through dust depositions and last for several weeks [7]. In addition, they can occur at small scales or cover hundreds of square kilometers of the ocean surface [7]. The effect of oil slicks impacts the ocean surface tension [8] and reduces the ocean surface roughness [9,10]. Similarly, the presence of phytoplankton represents a film on the ocean surface that also affects the ocean surface tension [11], thus reducing the ocean surface roughness. If the resulting decrease in ocean surface roughness is minimal, its detection from space may be challenging, but, if the presence of phytoplankton is abundant enough to significantly affect the ocean surface tension and consequently the ocean surface roughness, the change would be detectable through bistatic radar data from the CYclone Global Navigation Satellite System (CYGNSS) mission, which retrieves wind speed from the ocean surface roughness variability. The main objective of CYGNSS was to improve the detection and monitoring of tropical cyclones [12,13,14] over the ocean. CYGNSS has brought to the community increased sensing capabilities over tropical areas (~ from 37° S to 37° N), providing measurements with higher spatial resolution and temporal repeat thanks to the constellation of eight satellites. Each spacecraft measures the signal from four Global Positioning System (GPS) satellites simultaneously. The 1 millisecond samples are incoherently integrated at 1 s, producing a total of 32 measurements per second with global coverage every 90 min. Such satellite configuration provides good coverage of the areas of interest at a rate of <1 day of measurements, which positions CYGNSS as the best bistatic radar tool to observe the phytoplankton phenomena. In addition, the L-band measurements are robust to the presence of clouds and dust clouds.
In this study, we demonstrate CYGNSS data capability to detect and monitor phytoplankton blooms, a consequence of the excess of nutrient supply derived from the dust depositions that originated from the 2020 Sahara Dust Storm. In addition, we monitor the displacement of those phytoplankton areas as they move across the ocean surface due to the effect of ocean currents. We present bistatic radar measurements as a new input to models in order to constrain and better understand the supply of dust onto the ocean surface which causes these blooms, becoming a unique source of remote sensing information that will also improve our understanding of the role of dust storms on ocean biogeochemistry and the global carbon cycle.
Section 2 provides a review of the main agents playing a role on the phytoplankton blooms. In particular, we describe the Sahara Desert dust storm in 2020 in terms of: AOT data, aerosol deposition and nutrient supply into the ocean from dust depositions, and ocean currents. Section 3 defines the bistatic radar observations employed in this study by defining CYGNSS data and describing the observed signatures. Section 4 includes the analysis of the detected areas of bistatic radar high-reflectivity, probing that the event is a singularity that correlates with the dust storm, showing a delay between the peak AOT and the presence of this high-reflectivity signatures as well. This delay supports the hypothesis of the phytoplankton blooms as those will happen days or even weeks after the nutrient supply occurs. This hypothesis is explained through the nature of the bistatic radar measurements, which link high-reflectivity to low ocean surface roughness, demonstrated by looking into the change in the scattering regime from incoherent to a more coherent reflected signal. Section 5 discusses the potential role of bistatic radar on a dust deposition/nutrient supply global monitoring system through detection and monitoring of phytoplankton areas and its primary benefit towards developing better models to understand ocean biogeochemistry and the global carbon cycle. Conclusions are provided in Section 6.
2. The Sahara Desert Dust Storm in 2020
The Sahara dust storms occur every year and represent the world’s largest source of aeolian soil dust [15]. The largest event in the last 17 years occurred in 2020, with dust clouds’ optical thickness 46% higher than the event in 2013, 66% higher than the event in 2015, and 68% higher than the event in 2018. The dust storms in 2013, 2015, and 2018 all presented similar optical thickness, 2013 being the previous highest concentration observed. The rest of the years since 2013 were at least 32% lower than the 2013 event and 95% lower than the 2020 event. We focus our study on the 2020 Sahara dust storm event as the most evident, but an extended research study can be conducted on past years where weaker signals could still be detected by applying background subtraction techniques for anomaly detection. Future work will include such analysis that will ultimately help understand the limitations on the sensitivity of the signatures observed, as well as the development of a phytoplankton density algorithm based on reflectivity levels. Such study must take into consideration ocean wind speed as it increases the ocean surface roughness, and therefore represents a source of error for a phytoplankton detection, limiting the detection in the most extreme cases.
The Sahara dust storm carried an extraordinary amount of dust particles. Those dust particles are deposited on the ocean surface, providing considerable quantities of nutrients to ocean surface waters and the seabed, particularly in the North Atlantic Ocean. Moreover, because of the thousands of kilometers over which the dust is transported, it also influences the marine primary productivity of the Caribbean and the Gulf of Mexico. A visual example on how large quantities of Saharan dust can trigger the phytoplankton blooms is shown in [16], where there is an article containing an image showing both events (dust plume and phytoplankton) obtained from the Visible Infrared Imaging Radiometer Suite (VIIRS) on the NOAA-20. NOAA STAR Ocean Color team [17,18] that generates a daily product that provides chlorophyll a levels on the ocean. Chlorophyll a is a color pigment linked to the presence of phytoplankton. An example of this product is given in Figure 1.
As it can be seen in Figure 1, the presence of clouds and dust in the image limits the chlorophyll a estimation, some high chlorophyll a levels can be observed over the South Carolina and North Carolina coast. Since chlorophyll a is the most readily available ocean color product, models use it as the main index to determine phytoplankton biomass [19]. Bistatic radar measures change in the ocean surface roughness. The sensitivity of bistatic radar to the phytoplankton biomass is therefore based on forward scattering principles, rather than to the pigmentation of the ocean surface used by current methods, and can therefore bring independent information at a different scale.
The capability of using bistatic radar to remotely detect phytoplankton blooms and monitor their extension and path over the ocean represents a new application to the bistatic radar field. It supposes that an asset that will add value to current ocean color products as bistatic radar is not affected by cloud or dust coverage. In addition, it represents an asset towards improving models and better understanding the supply of dust/nutrients into the ocean helping towards ocean biogeochemistry and the global carbon cycle.
In the following sub-sections, we describe the different factors playing a role in the phytoplankton bloom posterior to the Sahara Desert dust storm that occurred in 2020, i.e., we present AOT maps during the dust storm, we provide some background on dust deposition and consequent dust nutrient supply into the ocean, and we describe the dynamics of ocean currents. We explain the rationale for the most plausible explanation to the bistatic radar signatures observed on the ocean surface, linking those signatures to the presence of phytoplankton.
2.1. Aerosol Optical Thickness
The AOT is a measure of the solid and liquid particles suspended in the atmosphere, which change the way the atmosphere reflects and absorbs the visible and infrared light. Remote sensing observations are performed with the Moderate Resolution Imaging Spectroradiometer (MODIS) on NASA’s Aqua and Terra satellites [20,21]. High aerosol amounts are yearly observed between the North Africa west coast and the Atlantic Ocean. During the Sahara Desert dust storm in 2020, an increase in the AOT was observed from space. The MODIS Aerosol Product monitors the ambient AOT over the oceans globally and over a portion of the continents. The MODIS aerosol level 2 product is produced at 10 × 10 1-km pixel array spatial resolution, Figure 2.
Figure 2 shows a set of plots obtained from the data available at the NASA Earth Observations website [22], where an AOT product is made available to the scientific community. The imagery is obtained by Reto Stockli, NASA’s Earth Observatory, using data provided by the MODIS Atmosphere Science Team, NASA Goddard Space Flight Center. The data were processed based on [23]. We have chosen to present only NASA Aqua/MODIS AOT data. Figure 2 shows 8-day composited maps of the AOT during the Sahara’s dust storm. As it can be seen, the dust storm formed over the Sahara in Africa, and then moved across the Atlantic Ocean, reaching the Caribbean and the Gulf of Mexico towards the end of June and the beginning of July. The maps show a very high concentration of aerosols in the atmosphere with AOT values of 1 for most of the area, during 18-Jun-2020 to 25-Jun-2020. Understanding the link between AOT and dust deposition/nutrient supply is key information for the field of biogeochemistry.
2.2. Aerosol Deposition and Nutrient Supply into the Ocean
The atmospheric aerosol is composed of particles suspended in the atmosphere. These particles are deposited onto the land or ocean, impacting biochemical cycles as sources of nutrients and as pollutants. Depending, therefore, on the composition of those aerosols, the deposition can be beneficial or detrimental. The solubility of deposited aerosols varies significantly in time and in space and their residence time in the water column varies with primary production [24]. For those deposited aerosols with longer residence times, currents can cause the displacement of surface waters by considerable distances, distributing the nutrients across the ocean [24].
As nutrients are supplied into the ocean, the chances for phytoplankton blooms increase. Detecting a signature of the presence of areas covered in phytoplankton on the ocean surface would help better characterize the extension and the displacement due to ocean currents, better understanding the impact of the supply of nutrients derived from the dust storm. As dust deposition is not necessarily correlated with optical properties [2], tracing the location of those nutrient depositions on the ocean surface is difficult from a remote sensing perspective. As remote sensing observations of nutrient deposition are not available, models are used to estimate it, and to assess the impact on marine biochemical cycles [2,25]. Many models have been developed, but these show inconsistencies among them and also among in situ observations [3,4,26,27], limiting their use [3].
Quantifying the dust deposition into the ocean surface has not yet been accomplished through remote sensing, and, therefore, there is no information of such events being globally mapped on a regular basis. There are a number of sites spread around the globe, at certain distances from the Sahara, that provide a sense of how much deposition has occurred. These are reported by different publications from 1982 to 1996 and provide annual deposition values in g/m2. A summary of those can be found in [15]. Figure 3 provides a visual summary of those locations and deposition amounts, in a logarithmic scale for a better visual representation.
However, given the absence of long-term direct measurements of dust deposition over large areas, particularly over the oceans, dust deposition estimates have been produced using models. An example of these estimations is shown in Figure 4, which has been obtained from data derived from the modeled dust depositions in [28], in a logarithmic scale for a better visual representation.
Even though many models exist, the discrepancy among them is too big to consider them an accurate source of information [4]. The existence of a remote sensing tool capability that enables a better understanding of dust depositions and nutrient supply into the ocean, providing information on these time varying events, will allow for perfecting and validating models, and will be an asset to the fields of ocean biogeochemistry and the global carbon cycle. The phytoplankton blooms occur in areas where an excess of nutrients exist, powered by sunlight. Therefore, detecting and monitoring these blooms as well as the magnitude of phytoplankton layers provide indirect information on how much nutrients were supplied into the ocean.
2.3. Ocean Currents
After dust is deposited on the surface and nutrients are supplied, their location is not necessarily static as ocean currents can displace them by thousands of kilometers. Figure 5 shows global ocean surface currents map. Focusing on the area of interest, between the Northwest coast of Africa and the whole Caribbean area, including the Gulf of Mexico, deposited particles from the Sahara Desert dust storm should travel following the North Equator current into the Caribbean and the Gulf of Mexico, and then travel outside the Gulf to the open Atlantic Ocean following the Gulf Stream towards the North Atlantic current.
Therefore, looking at the map in Figure 5, once the nutrients are absorbed, they will potentially be re-distributed following the major ocean currents. Consequently, phytoplankton blooms will also spread over larger or decorrelated areas from those where actual dust depositions occurred. Once the phytoplankton bloom occurs, ocean currents still play a role in displacing the phytoplankton layers, making the monitoring of those layers important to the field of ocean biogeochemistry.
2.4. Conclusions
Taking the elevated AOT concentration as the trigger for the signatures observed in the bistatic radar measurements, there are two possible scenarios that can explain them.
One possible explanation could be in the lines of the study in [29]. This study concludes that aerosol particles, directly and through their enhancement of clouds, may reduce near-surface wind speeds below them by up to 8% locally, therefore reducing the ocean surface roughness. The authors in [29] conclude that aerosol particles and aerosol-enhanced clouds reduce wind speeds below them by stabilizing the air, reducing the vertical transport of horizontal momentum. Looking at the AOT maps for 4-Jul-2020 in Figure 2f, it does not appear to be a dust cloud present coincident with the area of high-reflectivity in CYGNSS data in the Gulf of Mexico; therefore, the high-reflectivity signature does not correlate with the dust cloud. Indeed, the results in Section 3 prove a temporal and spatial decorrelation between AOT cloud and bistatic radar signatures.
The second plausible explanation is the local presence of a film on the ocean surface that is changing the surface tension, thus reducing the ocean surface roughness. This explanation aligns with the presence on the sea surface of surfactant films such as oil, or floating phytoplankton (algae), which is known to affect the surface tension [8,11] and reduces the surface wind-generated roughness leading to the appearance of so-called slicks. Supporting this explanation is the fact that the bloom does not happen immediately after depositing the nutrients, and it can take several days or even weeks, which, added to the action of ocean currents, explains the degree of separation between the dust clouds and areas covered with phytoplankton both spatially and temporally. Therefore, bistatic radar measurements should be able, not only to detect formations of phytoplankton, but also to monitor their displacement, which should be consistent with ocean currents. In particular, bistatic radar measurements would detect a local increase in the reflectivity in certain areas on the ocean surface, i.e., a decrease in ocean surface roughness, which will move across the ocean surface following the main current systems. This is demonstrated in Section 3.
On this regard, we are setting the basis for an innovative method for detecting the location of phytoplankton blooms through bistatic radar signatures and for mapping their displacements both globally and remotely in a daily basis. Information on these time varying events allow for perfecting and validating models and provide a better understanding of the role of dust storms in the supply of nutrients into the ocean, improving our knowledge of ocean biogeochemistry and the global carbon cycle.
3. Bistatic Radar Observations
We present bistatic radar using signals of opportunity from the Global Positioning System (GPS) as a tool to detect and monitor anomalies in the reflectivity measured from the ocean surface. More precisely, we look for a decrease in local ocean surface roughness after the 2020 Sahara’s dust storm events. The CYGNSS mission, a constellation of eight satellites, represents a unique dataset with very high sensitivity to variations on the ocean surface roughness that is capable of providing global maps at a 1-day revisit time with enough resolution to depict areas of potential phytoplankton blooms on the ocean surface from dust storms.
In the previous sections, we made two hypotheses:
- Deposited aerosol particles from a dust storm event, as the one from the 2020 Sahara Dust storm, will supply nutrients into the ocean, which will benefit the phytoplankton bloom, forming a film on the ocean surface and affecting its tension, therefore decreasing the local ocean surface roughness. Previous studies have proven the use of bistatic radar data for oil slick detections as those reduce the ocean surface roughness, therefore increasing the coherency of the scattering and the reflectivity [9,10]. Basically, the ocean surface roughness decrease needed in order to be able to detect it with CYGNSS must be greater than the sensitivity of the instruments. In terms of ocean wind, CYGNSS sensitivity is below 2 m/s for ocean winds under 20 m/s and 17% for winds over 20 m/s. In terms of mean square slopes (mss) of the ocean surface, following models of Cox and Munk [30], this translates to a change over 0.01 for sea state below 20 m/s and 0.035 for sea state about 30 m/s.
- Nutrients, and then areas covered by phytoplankton, will be displaced by ocean currents, and will therefore be decorrelated both temporally and spatially from the presence of dust clouds. This displacement shall promote phytoplankton blooms over areas of potential accumulation and, once bloomed, phytoplankton will be moved following the patterns of ocean currents. The displacement shall be observed in CYGNSS data because the detected local increase in reflectivity (ocean roughness reduction) will move along the North Equatorial current, to the Gulf of Mexico, and/or to the Gulf Stream and North Atlantic current.
In the following two sections, we will describe the CYGNSS dataset and then analyze the signatures observed in CYGNSS data towards their potential relationship with phytoplankton layers.
3.1. CYGNSS Data
CYGNSS is based on Global Navigation Satellite System—Reflectometry (GNSS-R), i.e., the measurement of GPS signals, a source of opportunity, in bistatic radar configuration. The main objective of CYGNSS mission was to improve the detection and monitoring of tropical cyclones [14] over the ocean. CYGNSS has brought to the community increased sensing capabilities over tropical areas (~ from 37 S to 37 N) providing measurements with higher spatial resolution and temporal repeat thanks to the constellation of eight satellites that gathers 32 GPS measurements per second and provides full coverage every 90 min. The GNSS-R measurement is the delay Doppler map (DDM) [31,32]. The CYGNSS mission provides a number of documents describing the calibration products. The peak SNR of a DDM ( corresponds to the maximum value of the reflectivity and is related to both the roughness and the dielectric properties of the ocean surface. As a first approximation, since the goal of the study is to determine whether or not CYGNSS can detect local areas of reflectivity changes, we will simply analyze anomalies. A variable peak SNR is provided in CYGNSS datasets, and it is computed from raw counts. The signatures expected from phytoplankton-covered areas would define areas of low surface roughness; these shapes are robust to calibration effects, which would show enough change on the data. In future studies and in order to accurately relate the level of to the density of particles deposited, will either need to be properly calibrated or use the normalized bistatic radar cross-section (NBRCS). can be calibrated by simply taking into account the transmitted power, transmitter and receiver antenna gains, and geometrical paths between the transmitter, the receiver and the specular point [33]:
where corresponds to the peak SNR in dB, is the path loss—with the distance between the transmitter and the specular point and the distance between the specular point and the receiver, is the gain of the receiver antenna in the specular direction, is the gain of the GPS transmitter antenna in the specular direction, and is the transmitted power of the GPS satellite.
3.2. High-Reflectivity Signatures on the Ocean Surface
We have employed the CYGNSS v2.1 L1 dataset, available online in [34]. The following set of plots in Figure 6 show observed signatures before, during, and after the Sahara Desert dust storm that occurred primarily between 20-Jun-2020 and 29-Jun-2020. For this study, we focus on the Gulf of Mexico, which potentially gathered the higher concentration of nutrients due to the transportation of those particles by the ocean currents.
Initial conclusions from the plots:
- Clear signatures of increased reflectivity are observed in the sequence of plots in Figure 6. Those signatures move across the Atlantic; first, they form in the Gulf of Mexico and then move away towards the U.S. East coast, following the Gulf Stream and the North Atlantic current directions;
- If plots Figure 6a,b are taken as reference, from a background reflectivity of about 7 dB peak SNR, we observe an increase between 10 dB to 23 dB. Such an increase in peak SNR is here linked primarily to a change in roughness. The highest possible peak SNR values correspond to very smooth water, almost 0 roughness, and the lowest peak SNR corresponds to rough water. The relationship between SNR and wind speed is logarithmic, i.e., as the ocean surface roughness increases, the lower is the reflectivity but also the less the change observed in dB (or sensitivity), and therefore the biggest the uncertainty. In other words, if the change observed goes from 7 dB to 10–23 dB, this means that there is a big roughness difference between the areas where the signatures are observed and the surrounding areas. Although this includes calibration errors, the jump in reflectivity indicates a dramatic change in ocean surface roughness. In terms of mean square slopes (mss), the change goes approximately from 0.08 to 0.04–0.01. Note that, in terms of ocean surface wind speed, this change implies that, from a mean value of 20 m/s, it goes down to 15–2 m/s, well within the required sensitivity for change detection.
- The observed signatures appear delayed from the initial Sahara dust storm as the aerosol optical depth maps in Figure 2 indicate. In addition, the peak SNR signature of the area over the Gulf of Mexico grows in time and remains longer than the duration indicated by the AOT maps. As [2] indicated, dust depositions are not necessarily correlated with optical properties and cannot be directly determined from AOT information only. The bistatic radar signature shows different dynamics when compared to those observed in the AOT data, thus confirming the lack of correlation as stated in [2]. No other event happened during the timeframe we analyzed; therefore, the anomalies with the bistatic radar signatures are the result of the Sahara dust storm event, i.e., associated with dust depositions and the supply of nutrients to the ocean.
4. Analysis of CYGNSS Data
4.1. Analysis of Peak SNR within High-Reflectivity Areas
In order to select the areas of high-reflectivity, we have applied contour lines during the timeline of the Sahara dust storm, since it reached the Caribbean and the Gulf of Mexico to some days after it disappeared to account for the delay observed in our signatures, which is 24-Jun-2020 to 7-Jul-2020. Figure 7, Figure 8 and Table 1 provide information on the areas of high-reflectivity.
Figure 7 shows the contour lines for the peak SNR levels 12, 14, 17, and 19. As it can be seen, there is a signature of high-reflectivity building up around the Caribbean and Florida and entering the Gulf of Mexico. From these plots, we have analyzed the extension of those areas of high reflectivity as well as their center of mass and mean and maximum SNR for a period of 1 day. Table 1 summarizes these calculations.
The data in Table 1 have been represented in Figure 8, for a graphical understanding of the numbers computed.
As it can been seen in Figure 8, the high-reflectivity signature forms around the Caribbean and Florida, and enters the Gulf of Mexico, builds up there with a peak in the area extension of 17,825 km2 on 4-Jul-2020, and then starts decreasing again and leaves the Gulf of Mexico through the space between the Caribbean and Florida towards the Atlantic following the Gulf Stream and the North Atlantic current directions. In addition, the highest mean SNRs are observed for the days where the signature is in the Gulf of Mexico. The path of the high-reflectivity signature is represented in blue in the right corner of each plot, for a better understanding.
We consider that those high-reflectivity signatures are induced by the 2020 Sahara Dust storm, as the timeline of those events show cause and effect. Next, we look into the AOT to see what the period is where the greatest presence of aerosols occurred. The AOT during the Sahara dust storm is obtained using the imagery provided in the NASA Earth Observations website, described in Section 2.1. Table 2 shows mean and maximum AOT observed within the area under study for the 8-day period presented in Figure 2.
Taking a close look into the 8-day windows 18-Jun-2020 to 25-Jun-2020 and 26-Jun-2020 to 3-Jul-2020 at the NASA Earth Observations website, the AOT peaks over the area of interest through 23-Jun-2020 to 28-Jun-2020, reaching AOT values up to 1. Therefore, we confirm that there is a delay between the high-reflectivity signatures and the active presence of aerosol clouds. Such lack of correlation between ocean surface roughness changes and AOT levels indicates that the aerosol cover is not having a major effect on the ocean surface roughness. This temporal and spatial decorrelation aligns with the presence of phytoplankton on the ocean surface, formed from nutrients that were displaced by ocean currents. In addition, the high-reflectivity areas move again following the ocean currents pattern, confirming the local presence of slicks on the ocean surface. Therefore, we establish a link between the reduction of ocean surface roughness, the delay in the signatures with respect to AOT and the displacement observed, which all together support the hypotheses of phytoplankton formation.
In order to prove that the increase in peak SNR is a singularity, we analyze the area defined in Figure 7k for 4-Jul-2020, as it covers the biggest extension, and look into the temporal evolution of the peak SNR for this area for a period from 15-May-2020 to 15-Aug-2020. We consider three zones defined by the contour lines within this area:
- Zone 1 corresponds to SNR > 12 dB and SNR < 14 dB;
- Zone 2 corresponds to SNR > 14 dB and SNR < 17 dB;
- Zone 3 corresponds to SNR > 17 dB.
As it can be seen in Figure 9, the increase in peak SNR is sudden and rises above the typical values observed within the area under study. We have performed the analysis within the three zones defined above in order to see how local the effect is. As it can be seen, all of the three areas experience similar behavior. Figure 9 also displays the window during the biggest aerosol concentration, AOT peak, i.e., 23-Jun-2020 to 28-Jun-2020. As it can be seen also in this analysis, the increase in reflectivity is delayed from peak AOT from the Sahara dust storm, being linked to a phenomenon decorrelated from the actual presence of dust clouds. We have performed the same analysis on the previous two years to discard any annual feature for the season. This analysis is shown in Figure 10.
As it can be seen in Figure 10a,b, no feature is detected for the whole period analyzed in previous years, 2018 and 2019, respectively. Therefore, the event observed in 2020, Figure 10c, is confirmed to be a singularity of that particular year. In 2018, there was an important Sahara dust storm that occurred at the end of June and July. This Sahara dust storm did not carry as much dust as in 2020. The maximum daily average observed for the dust cover during 2018 was 35% lower than 2020. The first waves of Sahara dust arrived around 28-Jun-2018 and then another wave covered the period between 11-Jul-2018 and 16-Jul-2018, when dust from the Sahara reached Texas. In 2019, the Sahara Dust storm arrived to the Caribbean and Gulf of Mexico around 22-Jun-2019. This Sahara dust storm carried much less dust than 2020 with a maximum daily average observed for the dust cover around 65% lower than 2020. The high-reflectivity observed in 2020 is therefore a singularity, not an annual feature of that particular area, triggered by the massive dust storm. Previous dust storms may have caused depositions on other areas, not analyzed in this particular study, or may need a more accurate analysis, calibrating the data and employing background subtraction techniques to be able to detect the signatures as those may be weaker. This also aligns with the hypotheses in this study, since less supply of nutrients into the ocean will therefore translate into less formation of phytoplankton.
4.2. Analysis of the Signal Scattering Regime
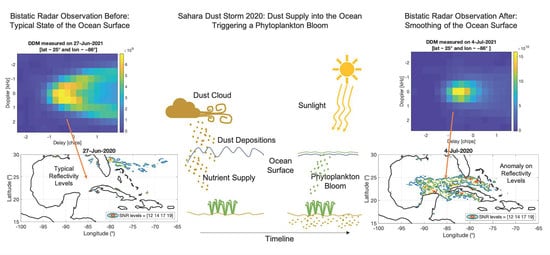
The following analysis looks into the coherence of the scattering, as final confirmation that the ocean surface roughness is reduced during the observed phenomena. Figure 11 shows the difference of the bistatic radar data measured away and within the area of low surface roughness for 4-Jul-2021.
Figure 11a shows a DDM [31] measured at latitude 29.88° and longitude −54.95°, corresponding to an area far away of the observed signatures. The DDM shows the incoherent scattering typical from the open ocean surface. Figure 11b shows a DDM measured at latitude 25.09° and longitude −85.2°, corresponding to an area within the observed signatures. The DDM shows a clear change in the scattering regime, where the coherent component starts to dominate the shape of the DDM. Figure 11c shows, for more clarity, the delay waveforms of each DDM. As expected, the signal has become more coherent changing the trailing edge slope to a more step form. The location of the two DDMs is shown in Figure 11d.
Figure 12 shows the differences of the bistatic radar data measured within the area of low surface roughness before, during, and after the event.
Figure 12a shows a DDM measured on 27-Jun-2021 at latitude ~ 25° and longitude ~ –86°, as shown in Figure 12d, within the area of the observed signatures. The DDM therefore corresponds to about one week before the phenomena occurred and is showing the incoherent scattering typical from the open ocean surface. Figure 12b shows a DDM measured at the same latitude and longitude, but, corresponding to 4-Jul-2021, when the signatures were observed. The DDM shows the clear change in the scattering regime correlated with the high-reflectivity signatures. Figure 12c shows, for more clarity, the delay waveforms of each DDM, proving the increase in the signal coherency (stepper trailing edge slope) for the time when the signatures were observed on 4-Jul-2021, compared to a week before on 27-Jun-2021.
These results demonstrate the presence of a layer on the ocean surface that is changing the surface tension, thus reducing the ocean surface roughness.
5. Discussion: The Potential of Bistatic Radar for Dust Deposition Studies
Having a tool to detect and trace phytoplankton on the ocean surface at 1-day temporal resolutions will primarily benefit the understanding of ocean biogeochemistry and the global carbon cycle. The bistatic radar measurements can be used as another layer of information to constrain models and help to better understand the supply of nutrients into the ocean from dust storms. In particular, CYGNSS data would provide information in the whole range of tropical latitudes from 37° S to 37° N providing measurements with revisit times of 1-day and will become a source of information that is currently missing in the remote sensing spectrum and that will facilitate the validation of models. Data from CYGNSS can therefore be regularly assimilated into dust deposition models improving accuracy and serving as the primary source to quantify the extension of phytoplankton based on the observed increase in reflectivity from the ocean surface background state. Therefore, extracting this information from bistatic radar measurements and using it to feed current models or/and establish a global monitoring system based on it will enable creating more accurate estimates benefiting ocean biogeochemistry and ocean global carbon cycle.
Further studies will be done at a more global scale for the years covered by the CYGNSS mission (April 2017 to present), such as other dust storms from the Sahara over the Atlantic Ocean, like the 2018 one, or the Arabian Sea, the Australian plumes into the ocean, or the recent massive dust storm in China that originated in Mongolia and inner China and reached China’s east coast. Future work will include a deeper analysis on Sahara dust storms over the whole area from Africa to the Gulf of Mexico, in order to find signatures in other parts of the Atlantic. In addition, we will include the calibration of the data, either calibrating peak SNR or using normalized bistatic radar cross section (NBRCS) values, as well as the methodology to be able to link signal levels to the density of phytoplankton. Such studies will eventually lead to a global monitoring system, which will require the combination of bistatic radar measurements, AOT measurements, wind speed information, and possibly other ancillary datasets, in order to produce global maps of phytoplankton areas, being able to monitor their location and concentration information. An increase of local wind speed in the areas will cause an increase on ocean surface roughness, and the presence of phytoplankton could be missed, or simply introduce errors in the estimations of its density. Therefore, information on wind speeds is an important variable to add into the analysis of those areas. Potentially, the algorithm to ingest all this information will be based on classification of pixels through artificial intelligence methodologies, such as decision trees based on statistical properties of the data for anomaly detection.
In addition, we will continue the research expanding our study to include the impact of dust deposition over land, as it may have implications on soil surface smoothening as well as soil moisture reduction. These two events have opposite effects in CYGNSS reflectivity, and smooth surfaces will produce an increase in reflectivity, while a decrease in soil moisture will produce a decrease in reflectivity. We will use CYGNSS data over land during the 2020 Sahara dust storm and we will investigate independently the particular areas affected such as the Caribbean, the Gulf of Mexico, the northern part of South America, and Florida.
The initial study performed in this paper opens the door to a new research area of the GNSS-Reflectometry field. The capabilities enabled by bistatic radar measurements will suppose a great leap in our knowledge in different Earth science fields. In addition to the specific application discussed in this paper contributing to ocean biogeochemistry and the global carbon cycle, we foresee additional impacts of this new tool. For example, having knowledge on phytoplankton areas over the ocean surface, their size, and their displacements due to currents as a measure of the nutrients deposited from the dust cloud on a daily basis represents an added variable that is currently not used in hurricane models and local weather models. Therefore, adding this information to the current models can bring improvements to their predictions. In addition, by being able to detect areas of dust deposition in agricultural areas, we can better understand their impact on the local soil moisture as well as the impact of the dust-derived added nutrients to the soil. Understanding the impact of dust depositions on agricultural areas is key to improving their crop yield predictions, and therefore provide better estimates on food availability.
6. Conclusions
This paper has described the high-reflectivity signatures observed in bistatic radar data from the CYGNSS mission and has discussed the evidence that those signatures correspond to phytoplankton blooms, which are triggered by the dust depositions and consequent nutrient supply originated from the 2020 Sahara Dust storm. CYGNSS high-reflectivity is naturally linked to low roughness of the ocean surface. We have established the link between the areas of low roughness and the presence of phytoplankton on the ocean surface through the impact of those slicks on the local ocean surface tension. The phytoplankton blooms are triggered by the supply of nutrients into the ocean from the deposition of dust particles originated by the Sahara dust storm. Extension and location of those areas are key sources of information towards models. We have performed an analysis on the singularity of CYGNSS data high-reflectivity signatures over the area under study and the movement of those signatures following the ocean currents across the Atlantic Ocean, proving the ability of CYGNSS measurements to detect and monitor those local formations of phytoplankton. In addition, the different levels observed in the reflectivity can be linked to the concentration or density of phytoplankton, which is also key information for models. Therefore, bistatic radar is presented as a new tool to improve current models, and, consequently, as a new tool to better understand ocean biogeochemistry and the global carbon cycle. This paper has presented a completely new application of bistatic radar.
Author Contributions
Conceptualization, N.R.-A. and K.O.; methodology, N.R.-A. and K.O.; software, N.R.-A.; validation, N.R.-A. and K.O.; formal analysis, N.R.-A. and K.O.; investigation, N.R.-A. and K.O.; writing—original draft preparation, N.R.-A.; writing—review and editing, N.R.-A. and K.O.; visualization, N.R.-A. Both authors have read and agreed to the published version of the manuscript.
Funding
This research was funded by Jet Propulsion Laboratory/California Institute of Technology through Engineering & Science directorate operations funds.
Data Availability Statement
Publicly available datasets were analyzed in this study. Those datasets were processed to generate the figures here presented: (1) AOT dataset (Figure 2). This data can be found here: https://eospso.nasa.gov/sites/default/files/atbd/atbd_mod02.pdf (accessed on 7 June 2021), and (2) CYGNSS dataset (Figure 6, Figure 7, Figure 8, Figure 9, Figure 10, Figure 11 and Figure 12). This data can be found here: https://podaac.jpl.nasa.gov/dataset/CYGNSS_L1_V2.1 (accessed on 7 June 2021). In addition, we have presented an ocean color map image showing chlorophyll a levels (Figure 1) that is freely available at: https://www.star.nesdis.noaa.gov/socd/mecb/color/ (accessed on 7 June 2021).
Acknowledgments
This work was carried out at the Jet Propulsion Laboratory, California Institute of Technology, under a contract with the National Aeronautics and Space Administration © 2021 California Institute of Technology. Government sponsorship is acknowledged.
Conflicts of Interest
The authors declare no conflict of interest.
References
- Dunion, P.J.; Velden, C.S. The Impact of the Saharan Air Layer on Atlantic Tropical Cyclone Activity. Bull. Am. Meteorol. Soc. 2004, 85, 353–366. [Google Scholar] [CrossRef] [Green Version]
- Mahowald, N.M.; Engelstaedter, S.; Luo, C.; Sealy, A.; Artaxo, P.; Benitez-Nelson, C.; Bonnet, S.; Chen, Y.; Chuang, P.Y.; Cohen, D.; et al. Atmospheric iron deposition: Global distribution, variability, and human perturbations. Annu. Rev. Mar. Sci. 2009, 1, 245–278. [Google Scholar] [CrossRef] [PubMed] [Green Version]
- Anderson, R.F.; Cheng, H.; Edwards, R.L.; Fleisher, M.Q.; Hayes, C.T.; Huang, K.-F.; Kadko, D.; Lam, P.J.; Landing, W.M.; Lao, Y.; et al. How well can we quantify dust deposition to the ocean? Philosophical transactions. Ser. A Math. Phys. Eng. Sci. 2016, 374, 2081. [Google Scholar] [CrossRef] [Green Version]
- Huneeus, N.; Schulz, M.; Balkanski, Y.; Griesfeller, J.; Prospero, J.; Kinne, S.; Bauer, S.; Boucher, O.; Chin, M.; Dentener, F.; et al. Global dust model intercomparison in AeroCom phase I. Atmos. Chem. Phys. 2011, 11, 7781–7816. [Google Scholar] [CrossRef] [Green Version]
- Moore, J.K.; Doney, S.C.; Glover, D.M.; Fung, I.Y. Iron cycling and nutrient-limitation patterns in surface waters of the World Ocean. Deep. Sea Res. Part II Top. Stud. Oceanogr. 2001, 49, 463–507. [Google Scholar] [CrossRef] [Green Version]
- Moore, C.M.; Mills, M.M.; Achterberg, E.P.; Geider, R.J.; LaRoche, J.; Lucas, M.I.; McDonagh, E.L.; Pan, X.; Poulton, A.J.; Rijkenberg, M.J.A.; et al. Large-scale distribution of Atlantic nitrogen fixation controlled by iron availability. Nat. Geosci. 2009, 2, 867–871. [Google Scholar] [CrossRef]
- Garrison, T. Oceanography: An Invitation to Marine Science; Brooks/Cole: Belmont, CA, USA, 2005. [Google Scholar]
- Soloviev, A.V.; Haus, B.K.; McGauley, M.G.; Dean, C.W.; Ortiz-Suslow, D.G.; Laxague, N.J.M.; Özgökmen, T.M. Surface dynamics of crude and weathered oil in the presence of dispersants: Laboratory experiment and numerical simulation. J. Geophys. Res. Ocean. 2016, 121, 3502–3516. [Google Scholar] [CrossRef]
- Chen, L. Sea Surface Oil Slick Detection and Wind Field Measurement Using Global Navigation Satellite System Reflectometry. Master’s Thesis, Department of Electrical Engineering, Faculty of Engineering and Applied Science, Memorial University of Newfoundland, St. John’s, NL, Canada, May 2014. [Google Scholar]
- Valencia, E.; Camps, A.; Park, H.; Rodriguez-Alvarez, N.; Bosch-Lluis, X.; Ramos-Perez, I. Oil slicks detection using GNSS-R. In Proceedings of the IGARSS, Vancouver, BC, Canada, 24–29 July 2011; p. 4383. [Google Scholar]
- Lee, H.D.; Morris, H.S.; Laskina, O.; Sultana, C.M.; Lee, C.; Jayarathne, T.; Cox, J.L.; Wang, X.; Hasenecz, E.S.; DeMott, P.J.; et al. Organic Enrichment, Physical Phase State, and Surface Tension Depression of Nascent Core–Shell Sea Spray Aerosols during Two Phytoplankton Blooms. ACS Earth Space Chem. 2020, 4, 650–660. [Google Scholar] [CrossRef]
- Ruf, C.S.; Gleason, S.; Jelenak, Z.; Katzberg, S.; Ridley, A.; Rose, R.; Scherrer, J.; Zavorotny, V. The CYGNSS nanosatellite constellation hurricane mission. In Proceedings of the 2012 IEEE International Geoscience and Remote Sensing Symposium, Munich, Germany, 22–27 July 2012; pp. 214–216. [Google Scholar]
- Ruf, C.; Unwin, M.; Dickinson, J.; Rose, R.; Rose, D.; Vincent, M.; Lyons, A. CYGNSS: Enabling the Future of Hurricane Prediction Remote Sensing Satellites. IEEE Geosci. Remote Sens. Mag. 2013, 1, 52–67. [Google Scholar] [CrossRef]
- Clarizia, P.M.; Ruf, C.S. Wind Speed Retrieval Algorithm for the Cyclone Global Navigation Satellite System (CYGNSS) Mission. IEEE Trans Geosci. Remote Sens. 2016, 54. [Google Scholar] [CrossRef]
- Goudie, A.S.; Middleton, N.J. Saharan dust storms: Nature and consequences. Earth Sci. Rev. 2001, 56, 179–204. [Google Scholar] [CrossRef]
- Paolillo, Z.; Smail, E. Saharan Dust and Its Impacts. Available online: https://coastwatch.noaa.gov/cw/node/127.html (accessed on 7 June 2021).
- National Oceanic and Atmospheric Administration/National Environmental Satellite, Data, and Information Service (NOAA/NESDIS) Center for Satellite Applications and Research. Available online: https://www.nesdis.noaa.gov/ (accessed on 7 June 2021).
- NOAA STAR Ocean Color Imagery. Available online: https://www.star.nesdis.noaa.gov/socd/mecb/color/ (accessed on 27 May 2021).
- Huot, Y.; Babin, M.; Bruyant, F.; Grob, C.; Twardowski, M.S. Claustre, H. Does chlorophyll a provide the best index of phytoplankton biomass for primary productivity studies? Biogeosciences Discussions. Eur. Geosci. Union 2007, 4, 707–745. [Google Scholar]
- NASA Aqua Mission Information. Available online: https://aqua.nasa.gov (accessed on 7 June 2021).
- NASA Terra Mission Information. Available online: https://terra.nasa.gov (accessed on 7 June 2021).
- NASA Earth Observations Website. Available online: https://neo.sci.gsfc.nasa.gov/view.php?datasetId=MODAL2_M_AER_OD (accessed on 9 August 2020).
- Remer, L.A.; Tanré, D.; Kaufman, Y.J. Algorithm for Remote Sensing of Tropospheric Aerosol from MODIS: Collection 5. Available online: https://eospso.nasa.gov/sites/default/files/atbd/atbd_mod02.pdf. (accessed on 9 March 2020).
- Andreas, E.L. Spray stress revisited. J. Phys. Oceanogr. 2004, 34, 1429–1440. [Google Scholar] [CrossRef]
- Okin, G.S.; Baker, A.R.; Tegen, I.; Mahowald, N.M.; Dentener, F.J.; Duce, R.A.; Galloway, J.N.; Hunter, K.; Kanakidou, M.; Kubilay, N.; et al. Impacts of atmospheric nutrient deposition on marine productivity: Roles of nitrogen, phosphorus, and iron. Glob. Biogeochem. 2011, 25, GB2022. [Google Scholar] [CrossRef]
- Kim, D.; Chin, M.; Yu, H.; Diehl, T.; Tan, Q.; Kahn, R.A.; Tsigaridis, K.; Bauer, S.E.; Takemura, T.; Pozzoli, L.; et al. Sources, sinks, and transatlantic transport of North African dust aerosol: A multimodel analysis and comparison with remote sensing data. J. Geophys. Res. Atmos. 2014, 119, 6259–6277. [Google Scholar] [CrossRef] [Green Version]
- Trujillo, A.P.; Thurman, V.H. Essentials of Oceanography, 10th ed.; Prentice Hall: Hoboken, NJ, USA, 2011. [Google Scholar]
- Prospero, J.M. Saharan dust transport over the North Atlantic Ocean and Mediterranean: An overview. In The Impact of Desert Dust Across the Mediterranean; Guerzoni, S., Chester, R., Eds.; Kluwer Academic Publishing: Dordrecht, Germany, 1996; pp. 133–151. [Google Scholar]
- Jacobson, M.Z.; Kaufman, Y.J. Wind reduction by aerosol particles. Geophys. Res. Lett. 2006, 33. [Google Scholar] [CrossRef] [Green Version]
- Cox, C.; Munk, W. Measurement of the Roughness of the Sea Surface from Photographs of the Sun’s Glitter. J. Opt. Soc. Am. 1954, 44, 838–850. [Google Scholar] [CrossRef]
- Zavorotny, V.U.; Voronovich, A.G. Scattering of GPS signals from the ocean with wind remote sensing application. IEEE TGRS. 2000, 38, 951–964. [Google Scholar] [CrossRef] [Green Version]
- Voronovich, A.G.; Zavorotny, V.U. Bistatic radar equation for signals of opportunity revisited. IEEE TGRS. 2018, 56, 1959–1968. [Google Scholar] [CrossRef]
- Ruf, C.; Scherrer, J.; Rose, R.; Provost, D. Algorithm Theoretical Basis Document Level 1B DDM Calibration. Tech. Rep. 2014. Available online: https://clasp-research.engin.umich.edu/missions/cygnss/reference/148-0137_ATBD%20L1B%20DDM%20Calibration_R3_release.pdf (accessed on 7 June 2021).
- CYGNSS Dataset v2.1 PODAAC. Available online: https://podaac.jpl.nasa.gov/dataset/CYGNSS_L1_V2.1 (accessed on 9 August 2020).
Figure 1.
NOAA STAR Ocean color and true color map obtained from [17,18], showing chlorophyll levels for the areas where it can be obtained and ocean images for the areas covered with dust and clouds.

Figure 2.
Composite of 8-day aerosol optical thickness (AOT) generated from AQUA/MODIS observations from 25-May-2020 to 27-Jul-2020, periods indicated under each individual from (a) to (h). Dark red represents higher optical thickness values and pale yellow represents lower optical thickness values. Imagery by Reto Stockli, NASA’s Earth Observatory, using data provided by the MODIS Atmosphere Science Team, NASA Goddard Space Flight Center. These maps are obtained from [22].

Figure 3.
Annual concentration of dust depositions from the Sahara measured at different locations over several years, data obtained from [15].
Figure 3.
Annual concentration of dust depositions from the Sahara measured at different locations over several years, data obtained from [15].

Figure 4.
Modeled dust deposition estimated using the model in [15] for 1996.
Figure 4.
Modeled dust deposition estimated using the model in [15] for 1996.

Figure 5.
Major wind-driven surface currents of Earth’s oceans. (Copyright© 2005 Pearson Prentice Hall, Inc.).
Figure 5.
Major wind-driven surface currents of Earth’s oceans. (Copyright© 2005 Pearson Prentice Hall, Inc.).

Figure 6.
Series of peak SNR measured from CYGNSS mission gridded at 25 km resolution: before the Sahara Desert dust storm (a) about one month before on 21-May-2020 and (b) about 20 days before on 6-Jun-2020; during the Sahara Desert dust storm in 2020 on (c) 24-Jun-2020; (d) 25-Jun-2020; (e) 27-Jun-2020; (f) 28-Jun-2020; (g) 30-Jun-2020; and (h) 1-Jul-2020; and right after the Sahara Desert dust storm in 2020 on (i) 3-Jul-2020; (j) 4-Jul-2020; (k) 5-Jul-2020; and (l) 7-Jul-2020.


Figure 7.
Daily time series of contour lines of peak SNR measured from CYGNSS mission for the SNR levels 12, 14, 17, and 19 dB in blue, green, orange, and red, respectively, for (a) 24-Jun-2020 to (n) 7-Jul-2020.
Figure 7.
Daily time series of contour lines of peak SNR measured from CYGNSS mission for the SNR levels 12, 14, 17, and 19 dB in blue, green, orange, and red, respectively, for (a) 24-Jun-2020 to (n) 7-Jul-2020.

Figure 8.
Time series of the high-reflectivity signatures representing: (a) the mean SNR in dB, (b) the maximum SNR in dB, and (c) the total extension in km2. Each plot includes a graphical representation in blue of the center of mass path for the detected signatures.
Figure 8.
Time series of the high-reflectivity signatures representing: (a) the mean SNR in dB, (b) the maximum SNR in dB, and (c) the total extension in km2. Each plot includes a graphical representation in blue of the center of mass path for the detected signatures.

Figure 9.
Time series of the high-reflectivity signatures representing the mean peak SNR in dB within the area defined by the contour lines in Figure 7k.
Figure 9.
Time series of the high-reflectivity signatures representing the mean peak SNR in dB within the area defined by the contour lines in Figure 7k.
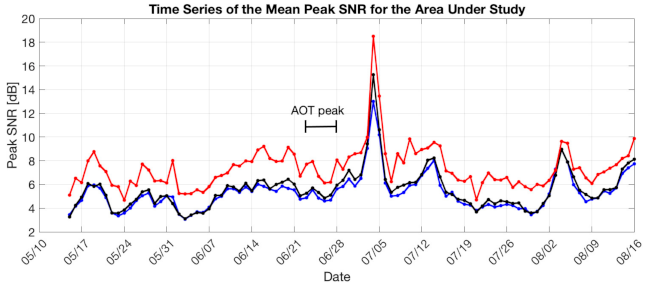
Figure 10.
Time series of the reflectivity signatures representing the mean peak SNR in dB within the area defined by the contour lines of higher SNR in Figure 7k for (a) 2018; (b) 2019; and (c) 2020. In addition, SNR levels chosen in Figure 7 are marked with dashed lines.


Figure 11.
Differences in measurements located (a) away from the signatures of high-reflectivity at [lat = 29.8°, lon = −54.95°], and (b) within the signatures of high-reflectivity at [lat = 25.0°, lon = −85.2°].
Figure 11.
Differences in measurements located (a) away from the signatures of high-reflectivity at [lat = 29.8°, lon = −54.95°], and (b) within the signatures of high-reflectivity at [lat = 25.0°, lon = −85.2°].


Figure 12.
Differences in measurements located within the signatures of high-reflectivity at [lat ~ 25°, lon ~ –86°] for (a) 27-Jun-2021 (before the event) and (b) 4-Jul-2021 (during the event).
Figure 12.
Differences in measurements located within the signatures of high-reflectivity at [lat ~ 25°, lon ~ –86°] for (a) 27-Jun-2021 (before the event) and (b) 4-Jul-2021 (during the event).


Table 1.
Summary of data for the high-reflectivity areas observed in Figure 7.
Table 1.
Summary of data for the high-reflectivity areas observed in Figure 7.
| Date | Area Extension (km2) | Center: [Lat, Lon] (degrees) | Mean SNR (dB) | Highest SNR (dB) |
|---|---|---|---|---|
| 24-Jun-2020 | 3725 | [24.50, −81.73] | 14.77 | 23.84 |
| 25-Jun-2020 | 2350 | [26.51, −84.24] | 14.43 | 20.39 |
| 26-Jun-2020 | 1350 | [25.93, −83.08] | 15.40 | 22.84 |
| 27-Jun-2020 | 4525 | [26.88, −79.00] | 14.06 | 21.24 |
| 28-Jun-2020 | 6975 | [26.49, −80.52] | 14.53 | 22.07 |
| 29-Jun-2020 | 6100 | [25.65, −80.70] | 14.71 | 21.67 |
| 30-Jun-2020 | 9750 | [26.18, −83.78] | 15.65 | 21.73 |
| 01-Jul-2020 | 7050 | [25.51, −84.52] | 15.19 | 21.34 |
| 02-Jul-2020 | 5850 | [24.73, −83.99] | 14.81 | 21.79 |
| 03-Jul-2020 | 8150 | [24.11, −84.65] | 14.78 | 23.58 |
| 04-Jul-2020 | 17825 | [23.17, −84.56] | 14.73 | 22.29 |
| 05-Jul-2020 | 11000 | [23.04, −82.35] | 15.07 | 25.12 |
| 06-Jul-2020 | 3300 | [24.02, −80.92] | 14.78 | 22.17 |
| 07-Jul-2020 | 2925 | [26.55, −78.22] | 14.43 | 21.26 |
Table 2.
Summary of mean and max AOT values obtained from the images on NASA Earth Observation website.
Table 2.
Summary of mean and max AOT values obtained from the images on NASA Earth Observation website.
| Period | Mean AOT | Max AOT |
|---|---|---|
| 25-May-2020 to 1-Jun-2020 | 0.271 | 0.630 |
| 2-Jun-2020 to 9-Jun-2020 | 0.180 | 0.362 |
| 10-Jun-2020 to 17-Jun-2020 | 0.134 | 0.339 |
| 18-Jun-2020 to 25-Jun-2020 | 0.299 | 1.000 |
| 26-Jun-2020 to 3-Jul-2020 | 0.320 | 1.000 |
| 4-Jul-2020 to 11-Jul-2020 | 0.200 | 0.583 |
| 12-Jul-2020 to 19-Jul-2020 | 0.250 | 0.689 |
| 20-Jul-2020 to 27-Jul-2020 | 0.166 | 0.524 |
Publisher’s Note: MDPI stays neutral with regard to jurisdictional claims in published maps and institutional affiliations. |
© 2021 by the authors. Licensee MDPI, Basel, Switzerland. This article is an open access article distributed under the terms and conditions of the Creative Commons Attribution (CC BY) license (https://creativecommons.org/licenses/by/4.0/).
Share and Cite
MDPI and ACS Style
Rodriguez-Alvarez, N.; Oudrhiri, K. The Bistatic Radar as an Effective Tool for Detecting and Monitoring the Presence of Phytoplankton on the Ocean Surface. Remote Sens. 2021, 13, 2248. https://doi.org/10.3390/rs13122248
AMA Style
Rodriguez-Alvarez N, Oudrhiri K. The Bistatic Radar as an Effective Tool for Detecting and Monitoring the Presence of Phytoplankton on the Ocean Surface. Remote Sensing. 2021; 13(12):2248. https://doi.org/10.3390/rs13122248
Chicago/Turabian StyleRodriguez-Alvarez, Nereida, and Kamal Oudrhiri. 2021. "The Bistatic Radar as an Effective Tool for Detecting and Monitoring the Presence of Phytoplankton on the Ocean Surface" Remote Sensing 13, no. 12: 2248. https://doi.org/10.3390/rs13122248
Note that from the first issue of 2016, this journal uses article numbers instead of page numbers. See further details here.