Article

Ozone Continues to Increase in East Asia Despite Decreasing NO2: Causes and Abatements

1
Institute of Environmental Studies, Pusan National University, Busan 46241, Korea
2
Climate & Air Quality Research Department, National Institute of Environmental Research, Incheon 22689, Korea
3
School of STEM, University of Washington Bothell, Bothell, WA 98011, USA
4
Harvard-Smithsonian Center for Astrophysics, Cambridge, MA 02138, USA
5
Department of Atmospheric Sciences, Pusan National University, Busan 46241, Korea
*
Author to whom correspondence should be addressed.
Remote Sens. 2021, 13(11), 2177; https://doi.org/10.3390/rs13112177
Submission received: 16 April 2021 / Revised: 22 May 2021 / Accepted: 29 May 2021 / Published: 2 June 2021

Abstract

:
Space-borne ozone (O3) measurements have indicated consistent positive trends across the entire Asia–Pacific region despite the considerable reduction of NOx since 2000s. The rate of increase in O3 derived from lower free tropospheric column measurements was observed to be 0.21 ± 0.05 DU/decade during 2005–2018. Our space-borne-based diagnosis of the nonlinear photochemical formation regimes, NOx-limited and NOx-saturated, show that O3 chemistry is undergoing a transitional process to the NOx-limited regime throughout most of the Asian region. Nevertheless, NOx-saturated conditions persist at present in and over eight major megacities. These NOx-saturated conditions in megacities contribute to the increased O3 due to NOx reduction, which could also affect the enhanced O3 concentrations throughout the Asia–Pacific region via long-range transport. This indicates that VOC limits along with NOx reductions are needed in megacities in the short term to reduce O3 levels. Moreover, NOx saturation in major megacities will continue until 2025, according to the forecast emission scenarios from the Intergovernmental Panel on Climate Change (IPCC). These scenarios gradually shift nearly all cities to the NOx-limited regime by 2050 with the exception of few cities under IPCC RCP8.5. Thus, continued reductions in NOx will be a key factor in reducing O3 in the long term.

1. Introduction

Surface ozone (O3) is harmful to humans [1] and ecosystems [2] at elevated concentrations, whereas O3 present in the upper troposphere acts as a greenhouse gas [1,3]. It is produced by the photochemical reaction of directly emitted nitrogen oxide precursors (NOx = NO + NO2) and volatile organic compounds (VOCs). Long-range transport of tropospheric O3 is possible such that it can reach the United States (U.S.) from East Asia [4,5,6,7,8,9,10,11,12,13,14,15]. In the 2000s, major East Asian countries began actively regulating air pollutants. South Korea and Japan have been enforcing stringent regulations on NOx emissions since the early 2000s [16,17,18]. In China, NOx emissions have also been on a downward trend since mid-2010s due to tougher restrictions on automobile emissions.
The O3 formation mechanism is based on the O3–NOx–VOC photochemical reaction chain, identified as either NOx-limited or NOx-saturated (VOC-limited) depending on the VOC/NOx ratio, and is relevant to O3 reduction policies focused on the NOx or VOC emission control priority. At high VOC/NOx ratios, O3 production is NOx-limited, and at low VOC/NOx ratios, the production is VOC-limited [19,20,21]. On the global scale, O3 production is largely dominated by the NOx-limited regime, though heavily polluted urban/metropolitan areas with high NOx emissions are frequently under the NOx-saturated condition [21,22]. NOx reductions could lead to decreasing ambient O3 under the NOx-limited regime as NOx emission reductions reduce the NO2 photolysis related to primary production of free oxygen atoms reacting with O2 into O3. Under the VOC-limited regime, a reduction in NOx emissions has resulted in increased O3 [20] due to weakened NO + O3 titration. Thus, as NOx emissions decline, O3 levels will continue to increase until the regime shifts to NOx-limited. Thus, surface O3 does not respond to a linear reduction in NOx.
Numerous O3 studies have been carried out to identify the characteristics of its changing trends and precursors in East Asia, in which the focus has been on high-emission areas, including urban regions [23,24,25,26,27,28]. However, few studies have examined the O3 regime sensitivity over a large spatial scale in areas covering the Asia–Pacific region or in the many border areas of this region due to the lack of in situ measurements covering international areas or near-abroad joint data of the countries in this region [29,30,31]. Instead, studies have been limited to local measurement stations or city-scale precursor analyses [32,33,34,35]. Space-borne tropospheric O3 regime identification has been carried out over large spatial areas; however, the ability to infer surface O3 levels from these studies has been limited by the uncertainties in O3 precursors from tropospheric column integration quantities that are based on precursor distribution probabilities [36,37]. However, with the help of sophisticated satellite retrieval algorithms, it has recently become possible to extract lower free tropospheric O3 precursors from satellite signals [38,39,40,41,42], enabling large-scale spatiotemporal analysis of lower tropospheric O3 concentrations.
In this study, space-borne data were used to retrieve lower tropospheric columns of O3, NO2, and formaldehyde (HCHO) between 900 and 700 hPa, covering the height of the atmospheric boundary layer. Interdecadal-scale past and current spatiotemporal variations in near-surface O3–NO2–HCHO relations were identified over the entire Asia–Pacific region. The resultant causes of increasing O3 were diagnosed. Future abatement strategies are proposed from the perspective of NOx versus VOC emission reduction strategies in the Asia–Pacific region. In addition, the future prospect of changes in O3 levels based on the Intergovernmental Panel on Climate Change Representative Carbon Pathway (IPCC-RCP) emission scenarios were analyzed to characterize the outcomes of the proposed O3 abatement strategies. In view of the growing interest in long-range transport of O3 between East Asia and North America and the role of background O3 in the air quality of the U.S. [14], this work is relevant for both Asian and North American policymakers.

2. Materials and Methods

2.1. OMI Satellite Measurements

The Ozone Monitoring Instrument (OMI) onboard NASA’s Aura satellite has been providing global observations of key atmospheric pollutant gases since October 2004, including ozone, nitrogen dioxide, sulfur dioxide, formaldehyde, and glyoxal, as well as aerosols [43]. The OMI is the first of a new generation of space-borne imaging spectrometers, with the capabilities of the unprecedented spatial resolution of 13 × 24–48 km2 at nadir and near-daily global coverage at an equator crossing time of 1:45 pm local time. Compared to other similar space-borne UV instruments, the OMI has maintained long-term stability over its mission with low optical degradation (1–2% in radiance, 3–8% in irradiance) and high wavelength stability (0.005–0.020 nm).
However, there has been concern over row anomaly effects that appeared in 2007 and became serious in early 2009, damaging the global coverage that is currently obtained in approximately two days [44]. Therefore, in this study, for the purpose of improvement of the OMI product analysis, we excluded row anomaly-affected pixels, as well as cloudy pixels (cloud fraction >0.3) where the retrievals of the tropospheric gases were not convincing, and derived monthly gridded data from the OMI level 2 product to fill data gaps and smooth out noise errors for individual measurements.

2.1.1. OMI Tropospheric O3 Partial Columns

Monthly gridded tropospheric ozone data at the 1° × 1° resolution were derived from the OMI Ozone Profile (OMPROFOZ) research product publicly available from the Aura Validation Data Center at the NASA Goddard Space Flight Center (https://avdc.gsfc.nasa.gov/pub/data/satellite/Aura/OMI/V03/L2/OMPROFOZ/: last accessed on 1 June 2021). The OMPROFOZ is based on the retrieval of the partial ozone columns (DU) for a 24-layer atmosphere (~2.5 km-thick) from the surface to 65 km based on the Smithsonian Astrophysical Observatory’s (SAO) algorithm using an optimal estimation as an inverse method [45] and the vector linearized discrete ordinate radiative transfer model (VLIDORT) as a forward model [46], with a spectral range of 270–310 nm in the UV1 channel and 310–330 nm in the UV2 channel.
This algorithm was initially reported by Liu et al. (2010) [47] and several modifications were made by Kim et al. (2013) [48] to produce the OMPROFOZ. OMI measurements were spatially coadded to match the different spatial resolutions between UV1 and UV2, as well as to meet computational costs. As a result, the OMPROFOZ dataset was produced at a spatial resolution of 52 × 48 km2 at nadir. The retrieval errors due to precision (instrument random noise) and smoothing errors (insufficient vertical resolution) ranged from 6 to 35% in the troposphere and from 1 to 6% in the stratosphere [47]. In this inversion, zonal mean climatological a priori information was used to complement insufficient measurement information, especially in the lower troposphere, due to reduced retrieval sensitivity. Therefore, OMI retrievals are more influenced by a priori information in the lower troposphere. Despite greater a prior influence, several studies have demonstrated that the retrievals can observe lower tropospheric ozone enhancement over East Asia [37,38]. However, our comparisons of the O3 retrievals and a priori climatological partial columns (shown in Figure S1) demonstrate that the transported pattern of the ozone amount is extracted from the OMI measurements based on the fact that the latitudinal variation can only be observed in the corresponding a priori map. The retrieval of ozone profiles near the surface can also be strongly constrained toward a priori information due to less photon penetration into the lower atmosphere. Therefore, the partial columns were integrated from 900 to 700 hPa for use in this study. In spite of the overall long-term stability of the OMI, ozone retrievals are susceptible to instrument degradation, but the magnitude of trend errors is relatively smaller in the lower troposphere (~0.5%/year) compared to the upper troposphere and lower stratosphere (~2%/year) [49]. Furthermore, the trend of OMI retrieval errors is opposite to increasing trends of lower tropospheric ozone, affected by increasing emission or ineffective emission controls which induce the sensitivity of ozone production to VOCs analyzed in this paper and in the referenced literature.
OMI observations are performed in the early afternoon (~1:45 p.m.) when photochemical reactions peak and O3 concentrations are typically near their peak near the surface. Moreover, the altitude of the atmospheric boundary layer is also characterized by strong vertical mixing processes during the passage of the Aura satellite, as well as the observation of transported O3 over downwind areas.

2.1.2. Tropospheric NO2 and HCHO Columns

The tropospheric NO2 data are taken from the NASA OMI standard product (version 4.0) which is available from the NASA Goddard Earth Sciences Data and Information Services Center (https://aura.gesdisc.eosdis.nasa.gov/data/Aura_OMI_Level2/OMNO2.003/: last accessed on 1 June 2021) [50]. The NASA standard product retrieval algorithm derives NO2 slant columns from the OMI reflectance spectra in the 402–465 nm window using the differential optical absorption spectroscopy (DOAS) method [51,52].
The separation between the stratospheric and tropospheric slant columns is calculated by assimilating OMI observations into a global chemical transport model, i.e., the GMI with the spatial resolution of 1° × 1.25°. Then, the vertical NO2 column is taken from the tropospheric slant column applied with an air mass factor (AMF). The tropospheric AMF is derived to be a function of the GMI model-based monthly a priori NO2 profile shapes and single scattering weight (SW) calculated using a forward radiative transfer model (TOMRAD). We used the monthly mean tropospheric NO2 column, which is calculated from the daily values at a 0.25° × 0.25° grid spacing, to investigate spatial and temporal variability of ozone precursors.
The spatial and temporal variations in the tropospheric HCHO columns for our analysis are based on the OMI HCHO level 2 product (Collection 3) retrievals [53] from the SAO (OMI-SAO HCHO column data acquired from https://aura.gesdisc.eosdis.nasa.gov/data/Aura_OMI_Level2/OMHCHO.003/: last accessed on 1 June 2021). The HCHO slant column densities were obtained using backscattered solar radiation within the spectral window of 328.5–356.5 nm. In the SAO algorithm, the AMF is computed using the LIDORT radiative transfer model and vertical profile information from the HCHO and aerosols simulated by the GEOS-Chem model. Then, tropospheric HCHO columns are calculated with the air mass factors and slant columns. We re-gridded the monthly tropospheric HCHO column data with a 0.1° × 0.1° horizontal resolution in this study.

2.1.3. HCHO-to-NO2 Ratio (FNR) Analysis

The photochemical O3 formation regime is investigated by the VOC/NOx ratio [19,20,21]. In order to examine the long-term variations of the O3 formation regimes for wide areas over East Asia, we employed the satellite measurements of tropospheric NO2 and HCHO columns to calculate the HCHO-to-NO2 ratio. HCHO, a short-lived oxidation product of many VOCs, is approximately proportional to the summed rate of reactions of VOCs with peroxy radicals [21,54,55] and is detected by satellites. NOx can be approximated from satellite-observed NO2 columns due to short chemical lifetime of NOx [56]. The FNR is only calculated for the summer peak O3 season (June–July–August) when both VOCs and NOx have relatively short lifetimes (approximately a few hours) [57,58,59].

2.2. In Situ Ground Observation Data

NO2 and O3 in situ measurement data in Seoul and Ganghwa Island were obtained from the publicly available Air Korea website (https://www.airkorea.or.kr/web: last accessed on 1 June 2021) based on the National Ambient Air Monitoring Information System (NAMIS) operated by the Korea Environment Corporation. Surface NOx and O3 levels at Oki and Ogasawara were obtained from a ground-based surface monitoring system operated by the Acid Deposition Monitoring Network in East Asia (EANET) (https://www.eanet.asia/: last accessed on 1 June 2021). Since the EANET provides NOx concentrations, we analyzed the long-term trends for surface NOx instead of NO2 in Japan. Air concentrations of gaseous species by both automatic monitors were calculated from the calibration factor obtained by the span/zero gas measurement of each constituent. Both EANET and NAMIS provided NO2 and NOx concentrations detected by commercial NOx chemiluminescence instruments with a molybdenum converter. Its use in urban sites near emission sources may be acceptable for NO2 measurements since the major components of NOx are NO2 and NO in urban areas. For rural and remote sites, these instruments measure total NOy since its NOx mode also responds to HNO3 and other organic nitrates non-specifically.

2.3. Climate and Air Quality Modeling Based on RCP Scenarios

In this study, the Integrated Climate and Air Quality Modeling System (ICAMS/NIER–SNU) [60] was employed for investigating behavior of future ozone and its precursors. ICAMS/NIER–SNU is developed by the National Institute of Environmental Research (NIER) and Seoul National University (SNU) for high-resolution climate information needed for an assessment of climate change impacts and adaptation measures and consists of four sub-model systems including the Hadley Centre Global Environment Model (HadGEM2-AO, v2.0) as the general circulation model (GCM), the Goddard Earth Observing System with Chemistry Model (GEOS-Chem, v8.3.1) as the global chemistry transport model (GCTM), the Fifth-Generation Penn State/NCAR Mesoscale Model (MM5, v3.7.4) as the regional climate model (RCM), and the EPA Models-3 Community Multiscale Air Quality Model (CMAQ, v4.6) as the regional chemistry transport model (RCTM).
Simulations of future air quality over East Asia with high spatial resolution were conducted using RCP emission scenarios as input information for the ICAMS/NIER–SNU model system. The RCPs are named according to the radiative forcing target level in 2100. In this study, we employed three RCPs—a mitigation scenario leading to a very low forcing level with the lowest emissions based on the most stringent climate policy (RCP2.6), medium stabilization scenarios (RCP4.5), and very high baseline emission scenarios without any climate policy (RCP8.5). Figure S2 shows NOx and total VOC emissions derived from the three RCP scenarios during the periods of 2025–2100. The ICAMS/NIER–SNU model results with 54 km × 54 km spatial resolution using RCP emissions over East Asia have been validated in many previous studies [61,62], and simulated surface O3, NO2, and HCHO concentrations were used to analyze the future HCHO/NO2 ratio in 2025 and 2050. Furthermore, future FNRs were also obtained by extracting the simulation results. In order to follow the consistent data selection method with that applied to the OMI satellite observation data, we applied the identical time window of the OMI overpass time to the hourly atmospheric concentration dataset that was simulated using the ICAMS/NIER–SNU model.

3. Results

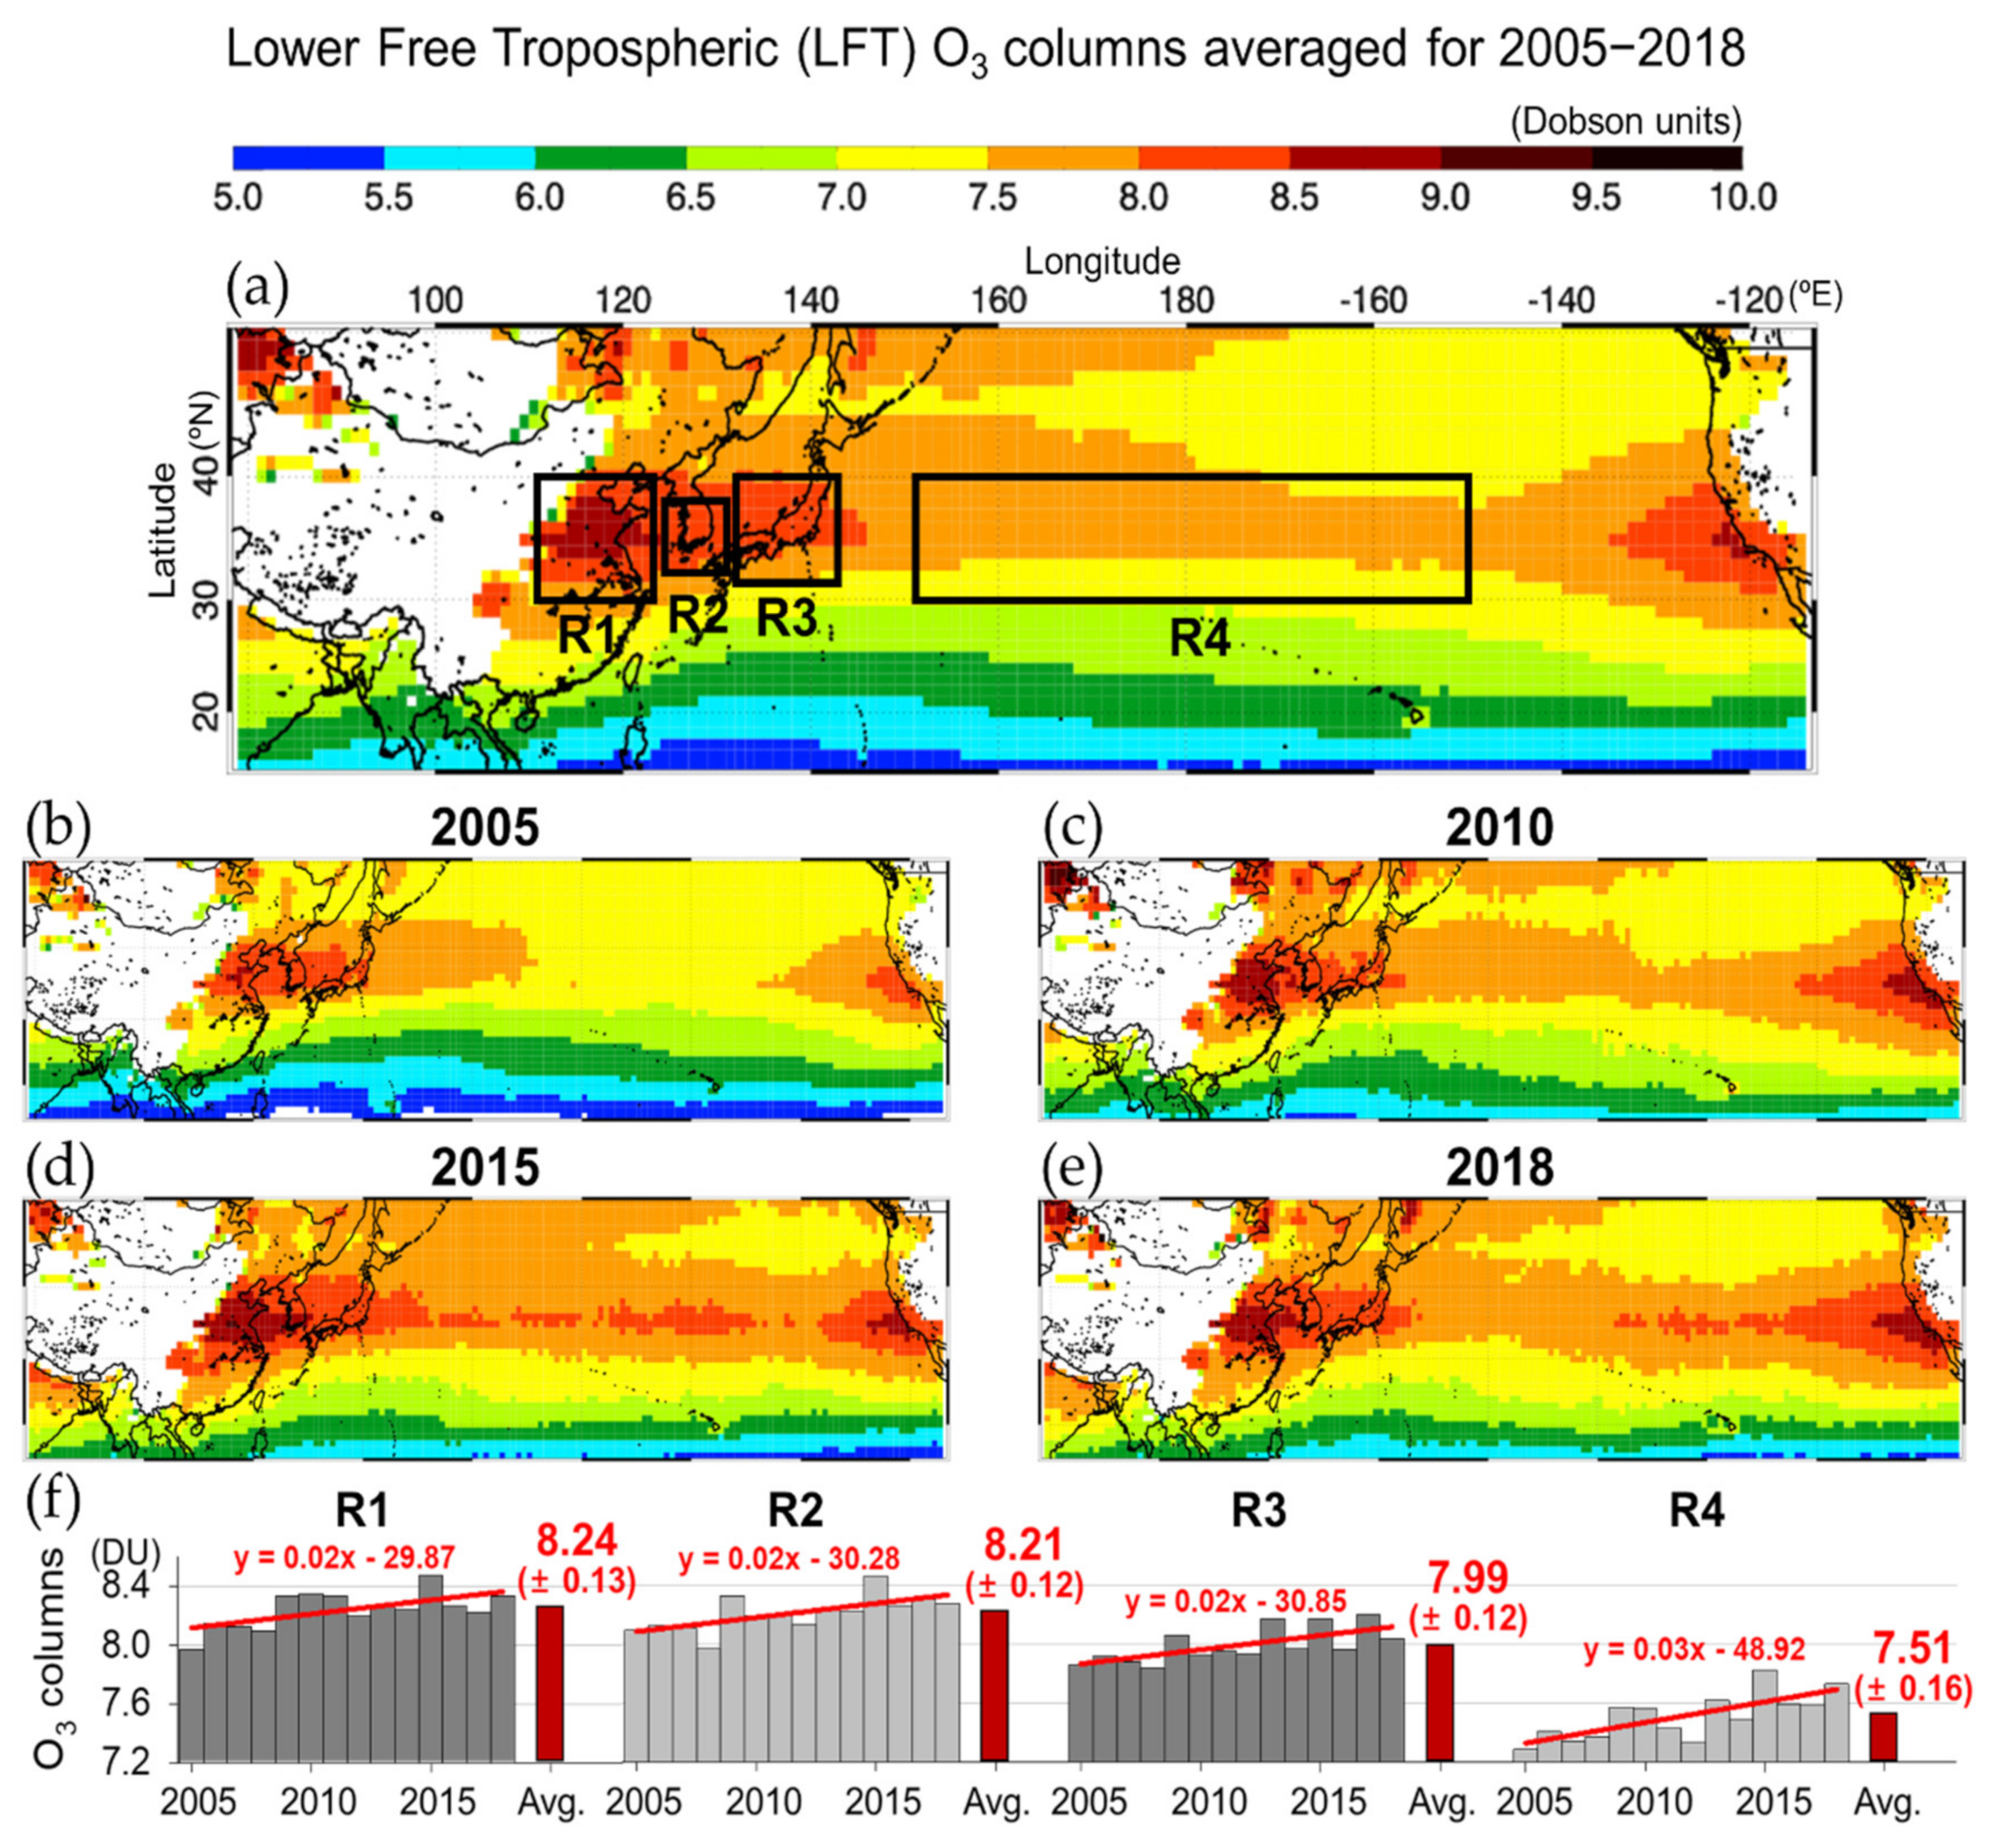
3.1. Lower Free Tropospheric O3 in the Asia–Pacific Region

Figure 1 shows the long-term variations in lower free tropospheric O3 columns (partial columns at 900–700 hPa) retrieved from space-borne measurements over the Asia–Pacific region between 2005 and 2018. Hereinafter, “lower free tropospheric at the 900–700 hPa depth” is referred to as simply “LFT.” In this study, the highest O3 zone of the Asia–Pacific region was subdivided into four areas: region 1, East China; region 2, South Korea; region 3, Japan; and region 4, ocean/west coast of the U.S. These four subdivided study regions included the three major countries (China, Japan, and South Korea) in Northeast Asia [59,63,64], and we added the Pacific Ocean region (region 4) as an exit area and background area for Asian air pollutants. The entire domain-averaged LFT O3 was about 8.0 DU (Dobson units) and was higher over the four denoted subdivided areas. Relatively higher LFT O3 (>7.5 DU) appeared over the belt zone (30–40° N) from East Asia to the Western Pacific where the westerly winds prevail, which was attributed to the transpacific transport of Asian O3. The domain average of O3 levels in the ocean area (region 4) was >6.0 DU, implying a high probability of long-range transport of O3 to the East Pacific Rim from East Asia in this belt zone. Numerous studies have revealed the transpacific processes across the Asia–Pacific Rim from region 1 to region 4. Steady transport of O3 can increase background and ground-level concentrations across the Western and Central U.S. [8,11,13,14]. Additionally, East Asian O3 can affect and enhance O3 concentrations in the Western U.S. by large- or synoptic-scale meteorological patterns, such as warm conveyor belts [6,12].
Annual trends in LFT O3 average values showed a 3–5%/decade increase in rates over all the regions (regions 1–4). The current average growth rates over individual regions (regions 1–4) are relatively low compared with levels reported in previous studies over city-scale areas: about 20–30% per decade in Japan [65] and about 15–25% per decade in 8-h O3 concentrations in China since 2013 [66]. The decade-scale increase in O3 concentrations over regions 1–4 was about 0.21 ± 0.05 DU/decade (0.57 ± 0.12 × 10¹⁶ molecules/cm2/decade), yielding similar rates of increase over the four regions, including the Pacific Ocean area. The similar rates across the four subareas (Figure 1f) demonstrate the influence of background O3 and the importance of long-range transport processes in the mid-latitude zone of the Asia–Pacific Rim.

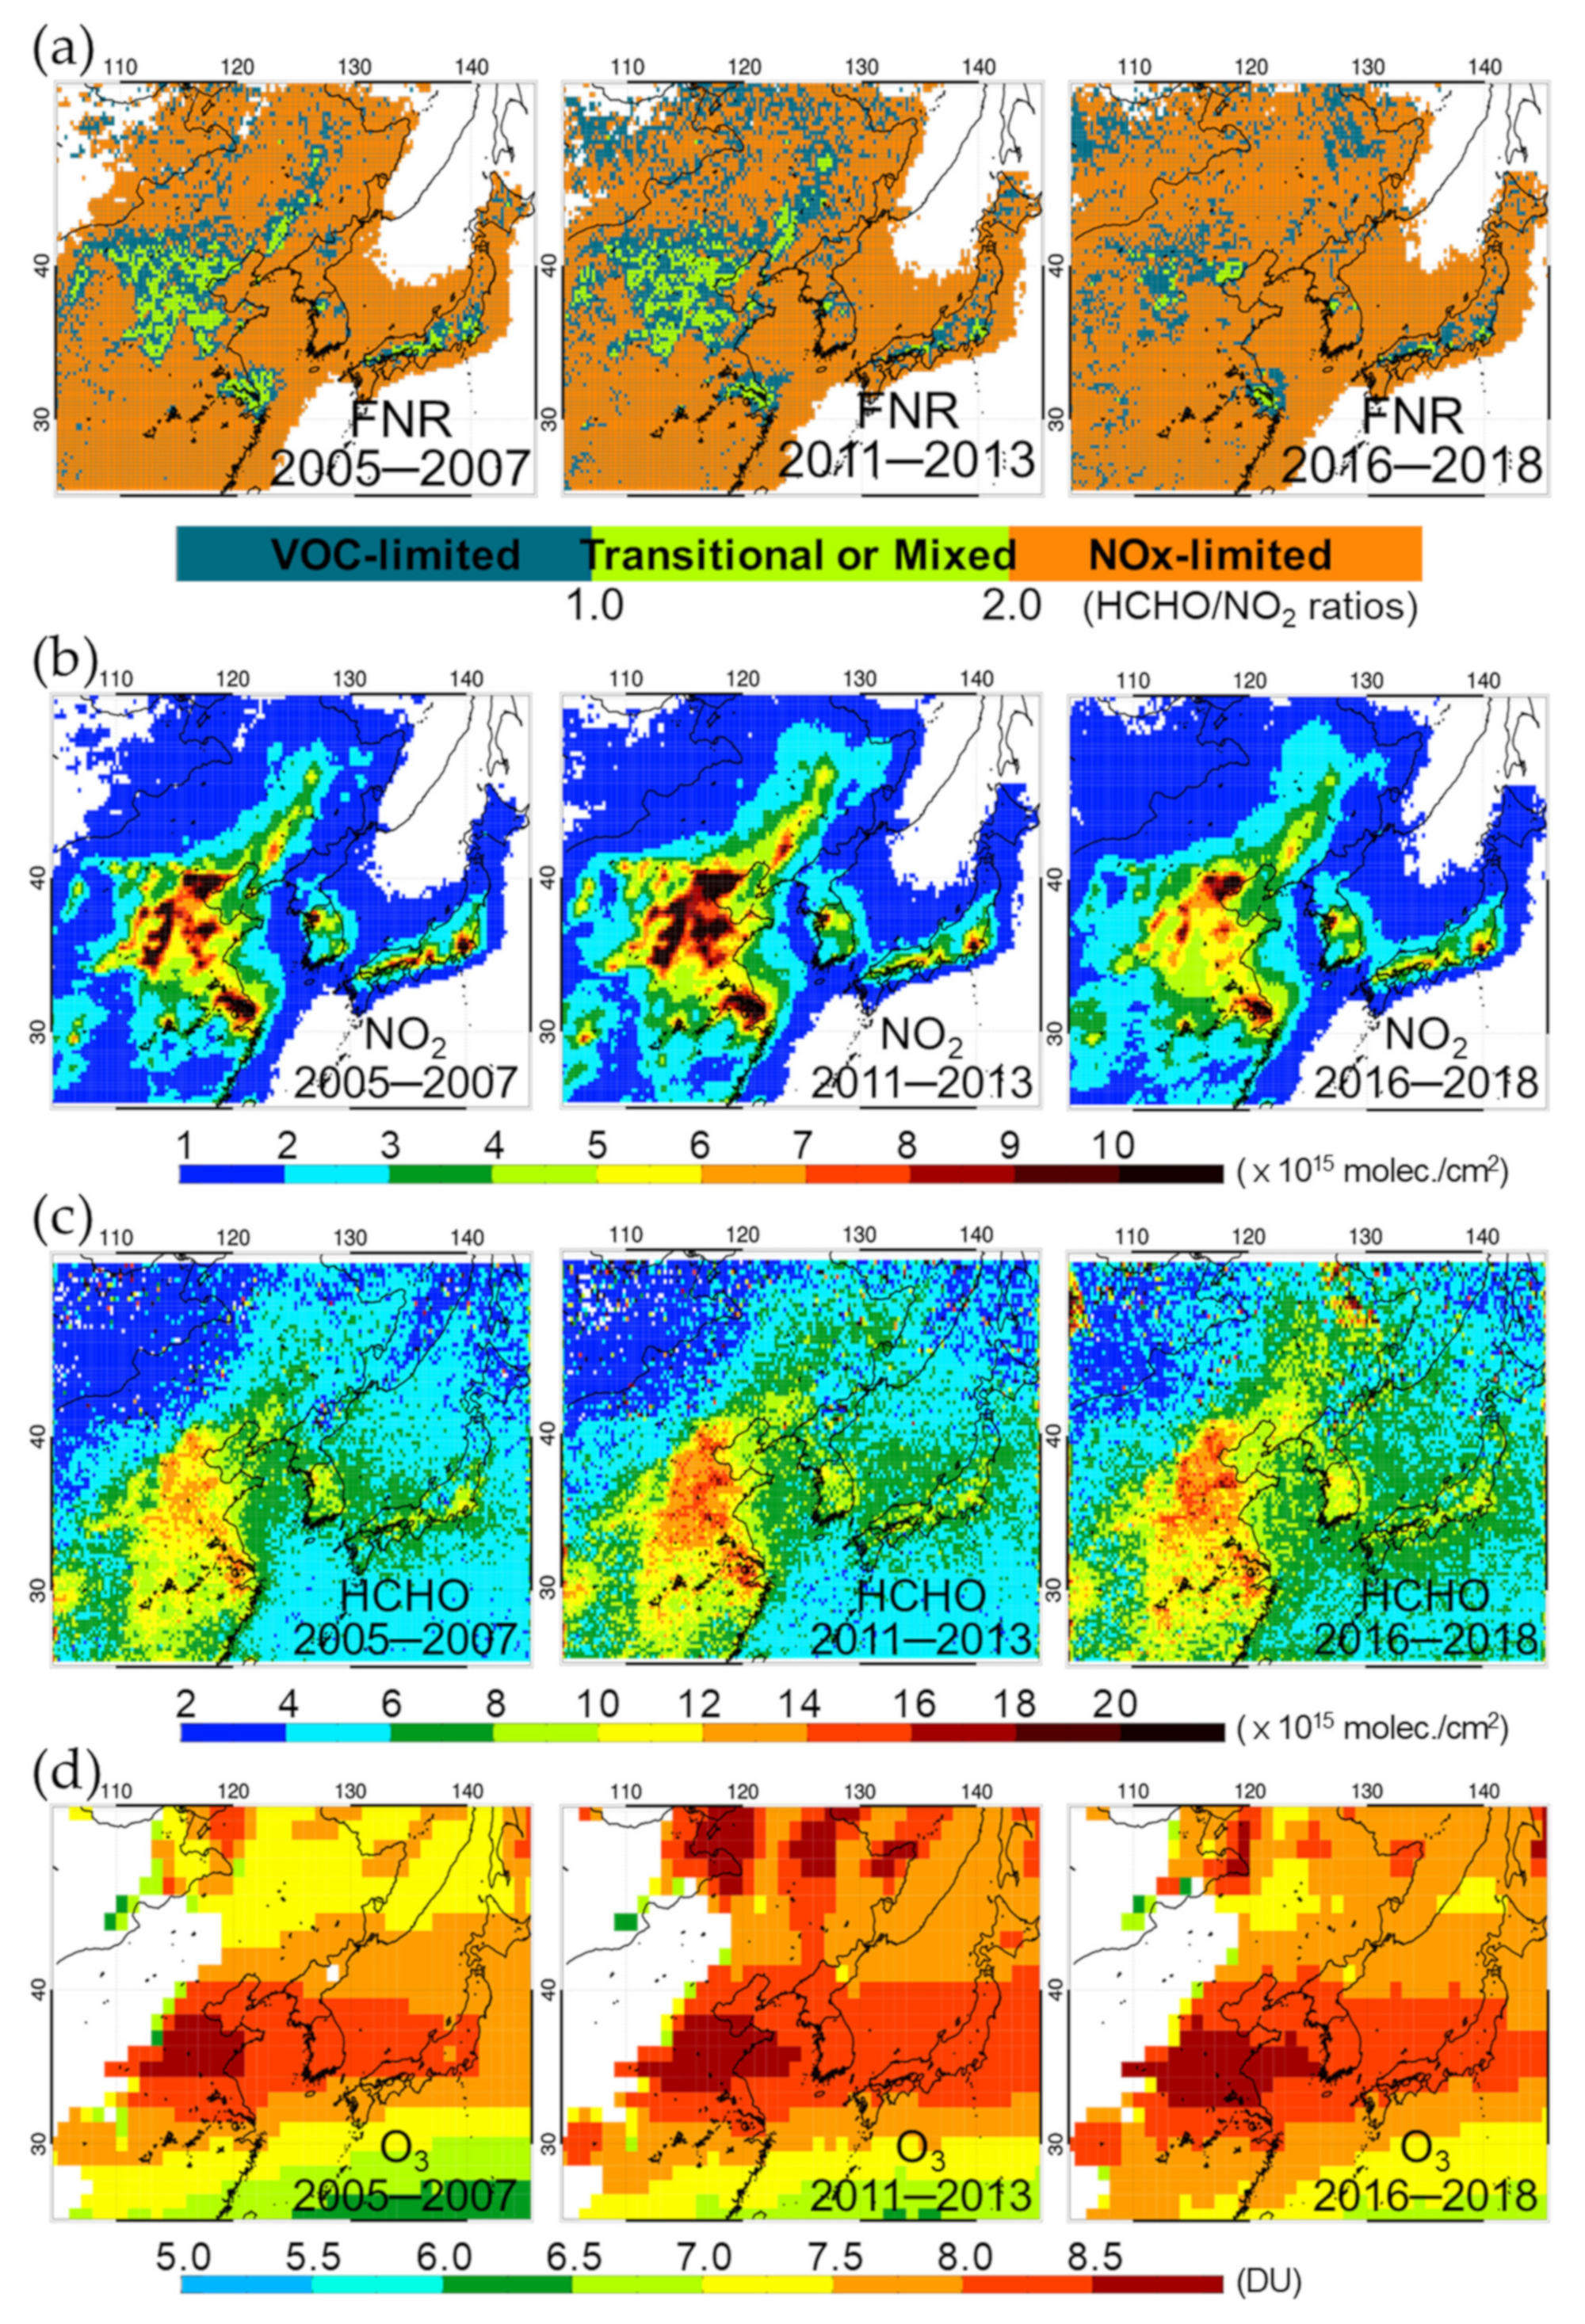
3.2. Changes in O3 Precursors: NO2 and HCHO

Via photochemical reactions, LFT O3 forms from its two precursors, NO2 and VOCs, which react in the presence of hydroxyl (OH) and hydroperoxyl (HO2) radicals. Figure 2 presents time series of tropospheric NO2 and HCHO column concentrations retrieved from space-borne measurements. In regions 1 and 2, NO2 shows an inverted U-shape variation, with a 1.5-fold increase over the period from 2005 to 2013 and the opposite trend during the period from 2011 to 2013. By contrast, region 3 shows a decreasing NO2 trend. These results are consistent with those of previous in situ ground observations [67,68] and are particularly relevant to NOx emission reduction. For example, in region 1 (East China), strict NOx regulations have been imposed on urban areas since 2012–2013 [69,70]. In regions 2 (South Korea) and 3 (Japan), stringent NO2 regulations have been enforced since the early 2000s [18,71,72]. However, HCHO levels have exhibited a slight (but detectable) rise of about 5% in all the regions (Figure 2), due mainly to the increased VOC emission strength [70,73]. The eight megacities indicated in Figure 2 (Beijing, Tianjin, Hebei (Tangshan), and Shanghai in region 1, East China; Seoul and Incheon in region 2, South Korea; and Tokyo and Osaka in region 3, Japan) showed an increasing rate of O3 production from 0.01 to 0.03 DU/year, as indicated by the angled arrows in Figure 2. This led to a rise in O3 levels over most of the region.
In situ ground measurements were consistent with the abovementioned trends. Figure 3 shows site-by-site measurements of O3 and NO2 at two locations in region 2, one in Seoul, the capital of South Korea (a typical urban area), and one in Ganghwa (a typical rural area) located in the Yellow Sea between China and South Korea, as well as at two sites in region 3, Oki and Ogasawara. Oki is a typical background reference site in the Asia–Pacific Rim region, and Ogasawara represents a true Asia–Pacific oceanic site. Prior to the analysis of long-term trends of ground measurements of O3 and NO2, we carried out comparative analysis of OMI results against ground measurement data obtained at four sites located in South Korea and Japan (see Figure S3). The results showed good agreement for both O3 and NO2 with the correlation coefficient of up to 0.89 for O3, especially over the megacity (Figure S3).
Long-term trends of in situ ground measurements indicated that, as indicated in Figure 3, NO2 concentrations decreased at all sites (Seoul: −4.7 ± 0.7 ppbv/decade; Ganghwa: −2.2 ± 0.8 ppbv/decade; Oki: −0.4 ± 0.05 ppbv/decade; Ogasawara: −0.1 ± 0.03 ppbv/decade). NO2 levels in Ganghwa decreased until 2003. Notably, NO2 levels in Seoul decreased consistently due to regulations imposed by the government of South Korea in the early 2000s. Several studies examined the reduction of NO2 levels based on in situ ground measurements taken in Seoul since the implementation of the Special Act on the Improvement of Air Quality in the Seoul Metropolitan Area [18,71]. O3 and NO2 trends in Oki and Ogasawara were similar to those in Seoul (Figure 3). Taken together, these results signify a steady increase in O3 in Seoul, Ganghwa, Oki, and Ogasawara that has persisted despite the reduction in NO2 precursor levels, especially since 2013 in regions 1 and 2. Thus, O3 transport can have a large or small impact on the entire Asia–Pacific region.

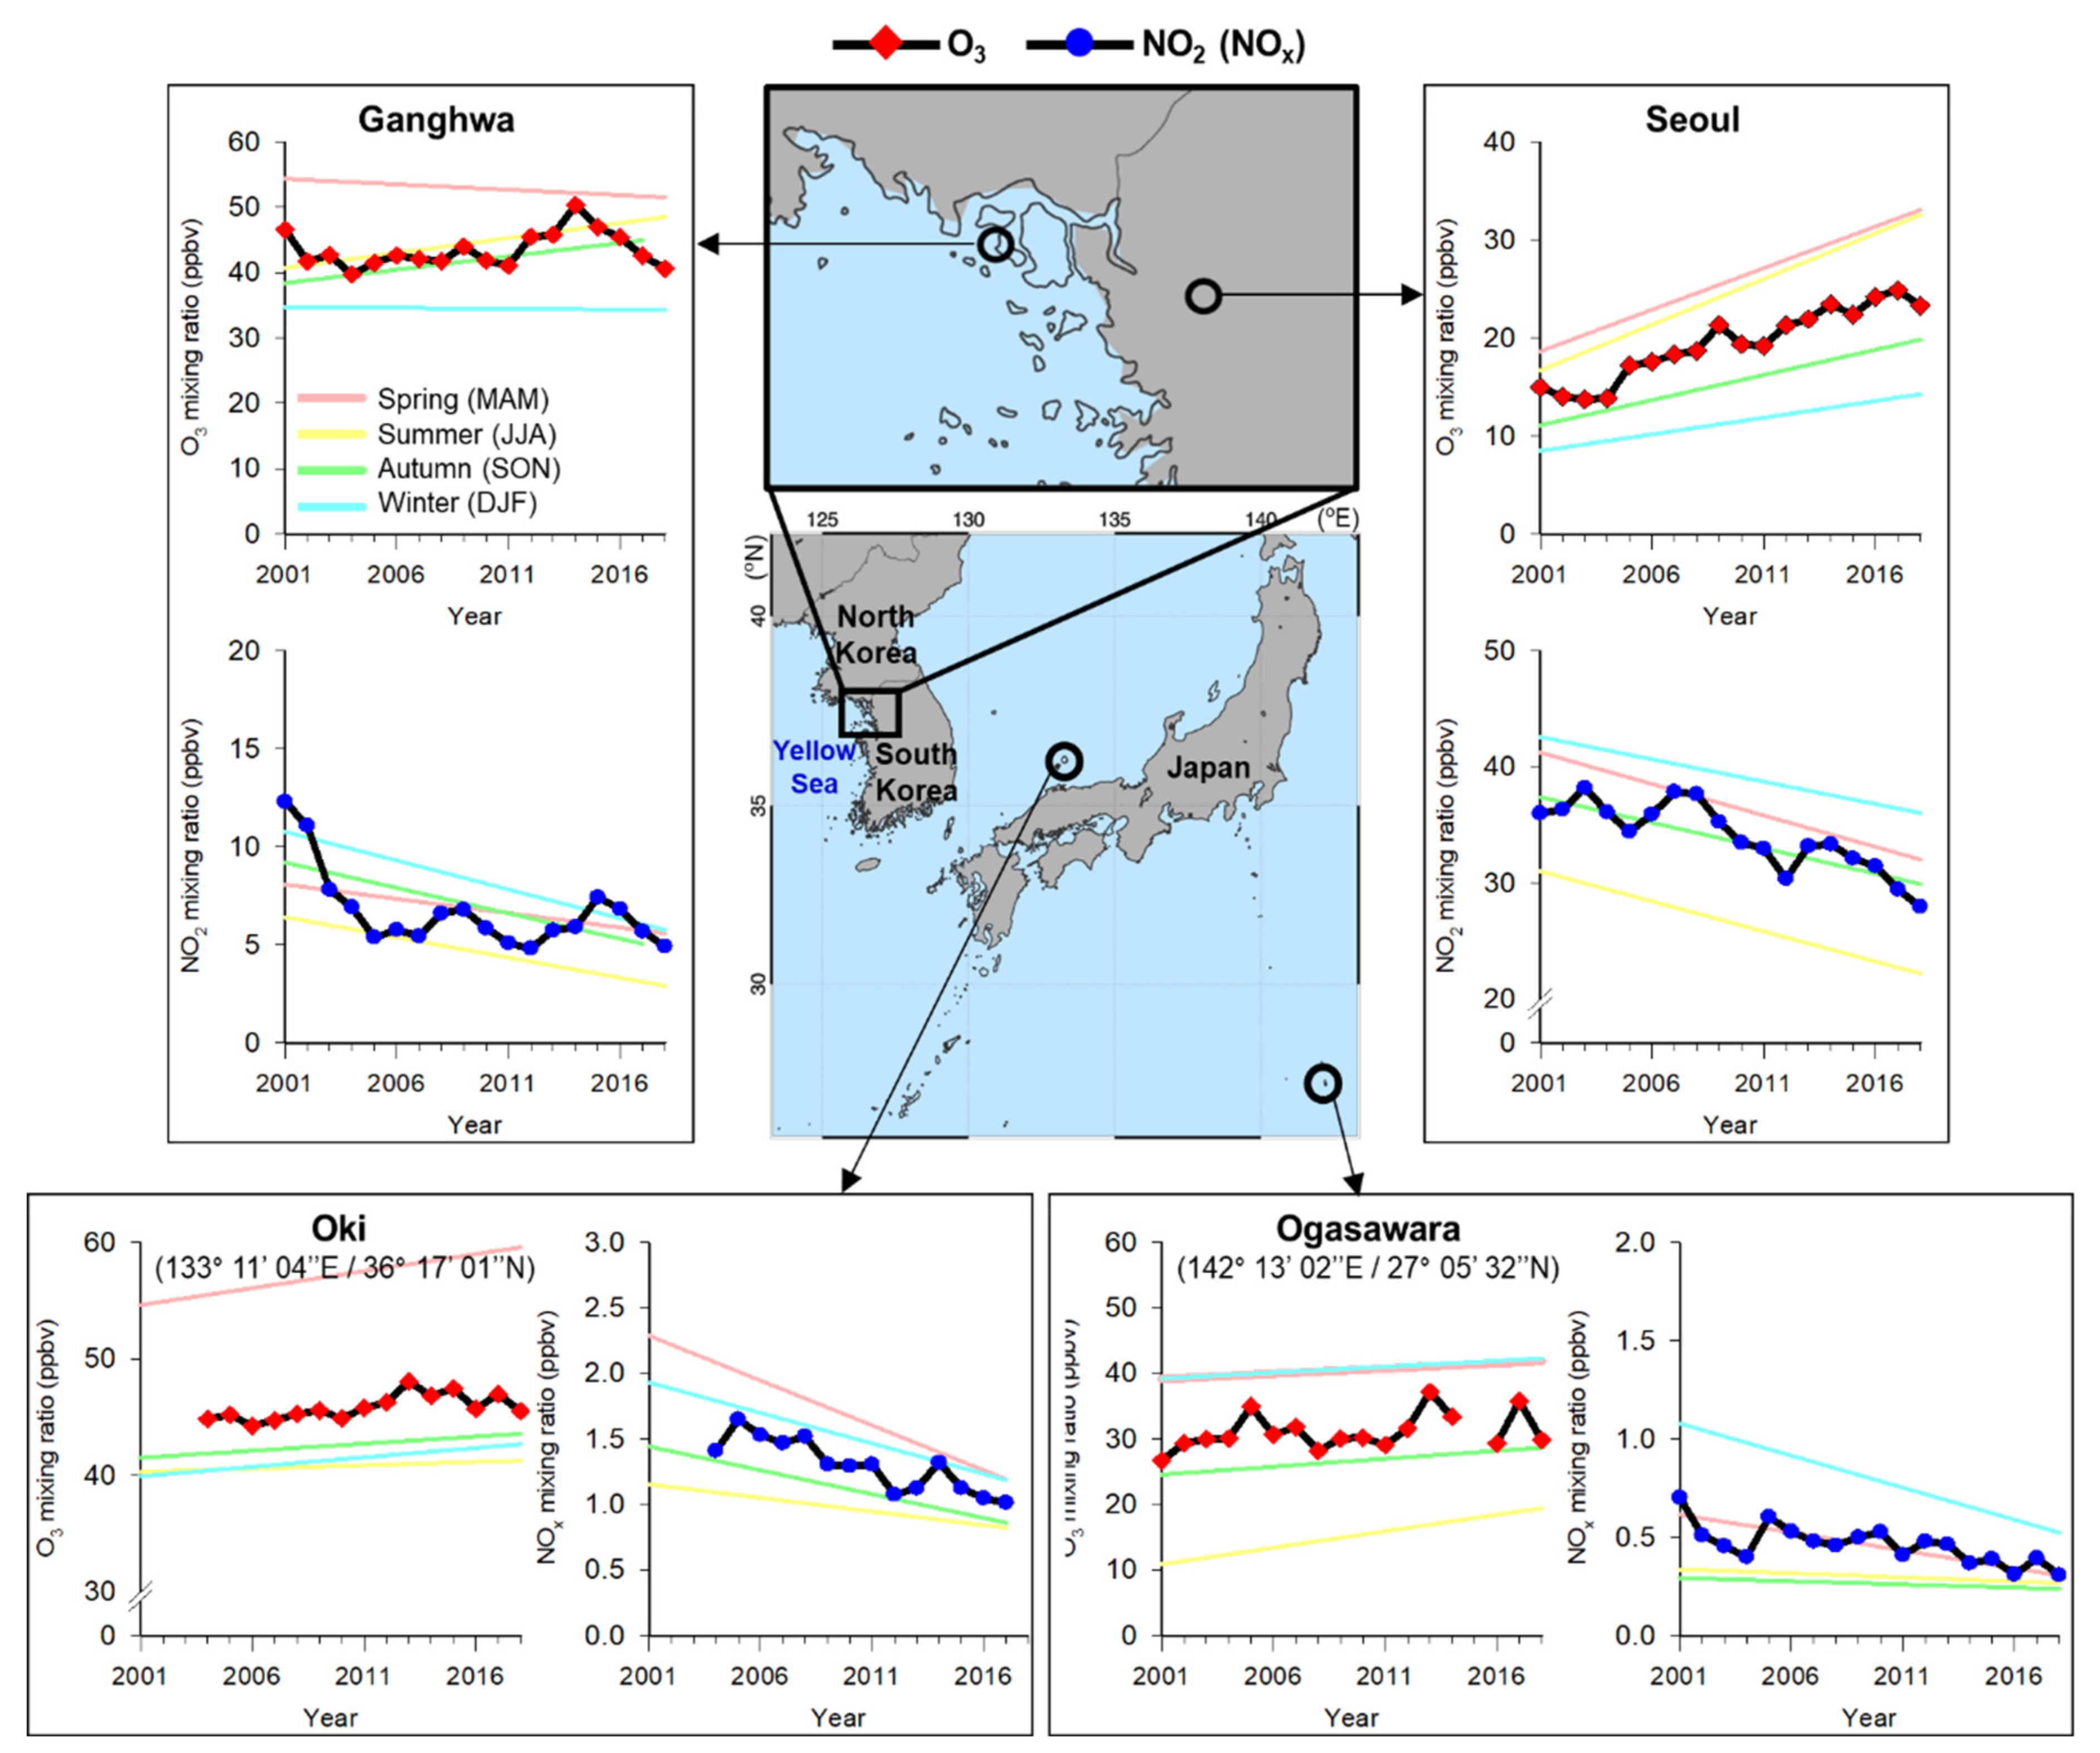
3.3. O3 Continues to Increase Despite Declining NO2 Levels

O3 formation is an example of the nonlinear nature of the O3–NOx–VOC chemical reaction. Several indicator species [54,74] of O3 can increase (or decrease), providing information on the ratio of VOCs/NOx. This ratio is widely used to diagnose O3 sensitivity regarding indications of NOx-limited or NOx-saturated (or VOC-limited) conditions. In this study, for the space-borne measurement analysis, the ratio of HCHO (a marker of VOCs) to NO2 (a marker of NOx) (FNR) was applied. Conventionally, we considered FNR <1.0, >2.0, and 1.0–2.0 to signify the NOx-saturated regime, the NOx-limited regime, and the transitional regime, respectively [21,22,55,75].
Figure 4 shows the spatiotemporal distributions of the retrieved FNR, NO2, HCHO, and O3. NO2 features similar to those shown in Figure 3 were evident in the data. An increase in NO2 was observed up to 2011, followed by a sharp decline after mid-2010 (Figure 4a). HCHO showed a rather sharp increase until 2013, especially over urban areas, followed by slower growth after 2013 (Figure 4c). The domain-averaged FNR (Figure 4a) turnarounds of regime shift for regions 1–3 overall progressed consistently from the NOx-saturated or relatively transitional regime (FNR ≤1 or slightly greater) to the NOx-limited regime (FNR > 2); specifically, the FNR progressions were 2.34→2.21→2.62 in region 1, 3.28→3.23→3.50 in region 2, and 4.83→5.24→5.45 in region 3 for the three subperiods of 2005–2007, 2011–2013, and 2016–2018, respectively (Figure 4). It should be noted that all of the FNRs were inferred from the rectangular (space) domain region averages, as indicated in Figure 1 and Figure 2. From 2016 to 2018, the rapid decrease in NOx together with a concurrent steady increase in HCHO (Figure 4b,c) accelerated the regime shift. Thus, the NOx-limited regime extended throughout most of the Asia–Pacific region (Figure 4).
In urban megacities, including the eight megacities of Beijing, Tianjin, Hebei, and Shanghai (East China), Seoul and Incheon (South Korea), and Tokyo and Osaka (Japan), the lower NOx-saturated FNR retained a value of FNR ≤ 1 (Figure 5). NOx-saturated regimes (FNR ≤ 1 or slightly greater) were found in the eight megacities before 2013; this was maintained even over the period of extensive NOx emission reduction from 2016 to 2018. The mean FNRs of the eight megacities ranged from 0.87 to 1.32 (Figure 5a): Beijing, Tenjin, Tangshan, and Shanghai in region 1 had an FNR of 0.96→1.01→1.32; Seoul and Incheon (region 2) had an FNR of 0.87→1.15→1.12; and Tokyo and Osaka (region 3) had an FNR of 0.89→1.14→1.11. The average for the three regions as a whole was 12.44 ± 2.40 (Figure 5b), due presumably to short lifetime for NO2 and also the role of biogenic VOCs over rural or suburban areas. Thus, megacity-centered NO2 emission reductions reinforced a relatively weak titration effect, deriving the increasing O3 tendencies under NOx saturation. This also indicates megacity-centered VOC emission reductions for the abatement of current O3 levels, according to the U.S. Environmental Protection Agency’s empirical kinetic modeling approach [76].

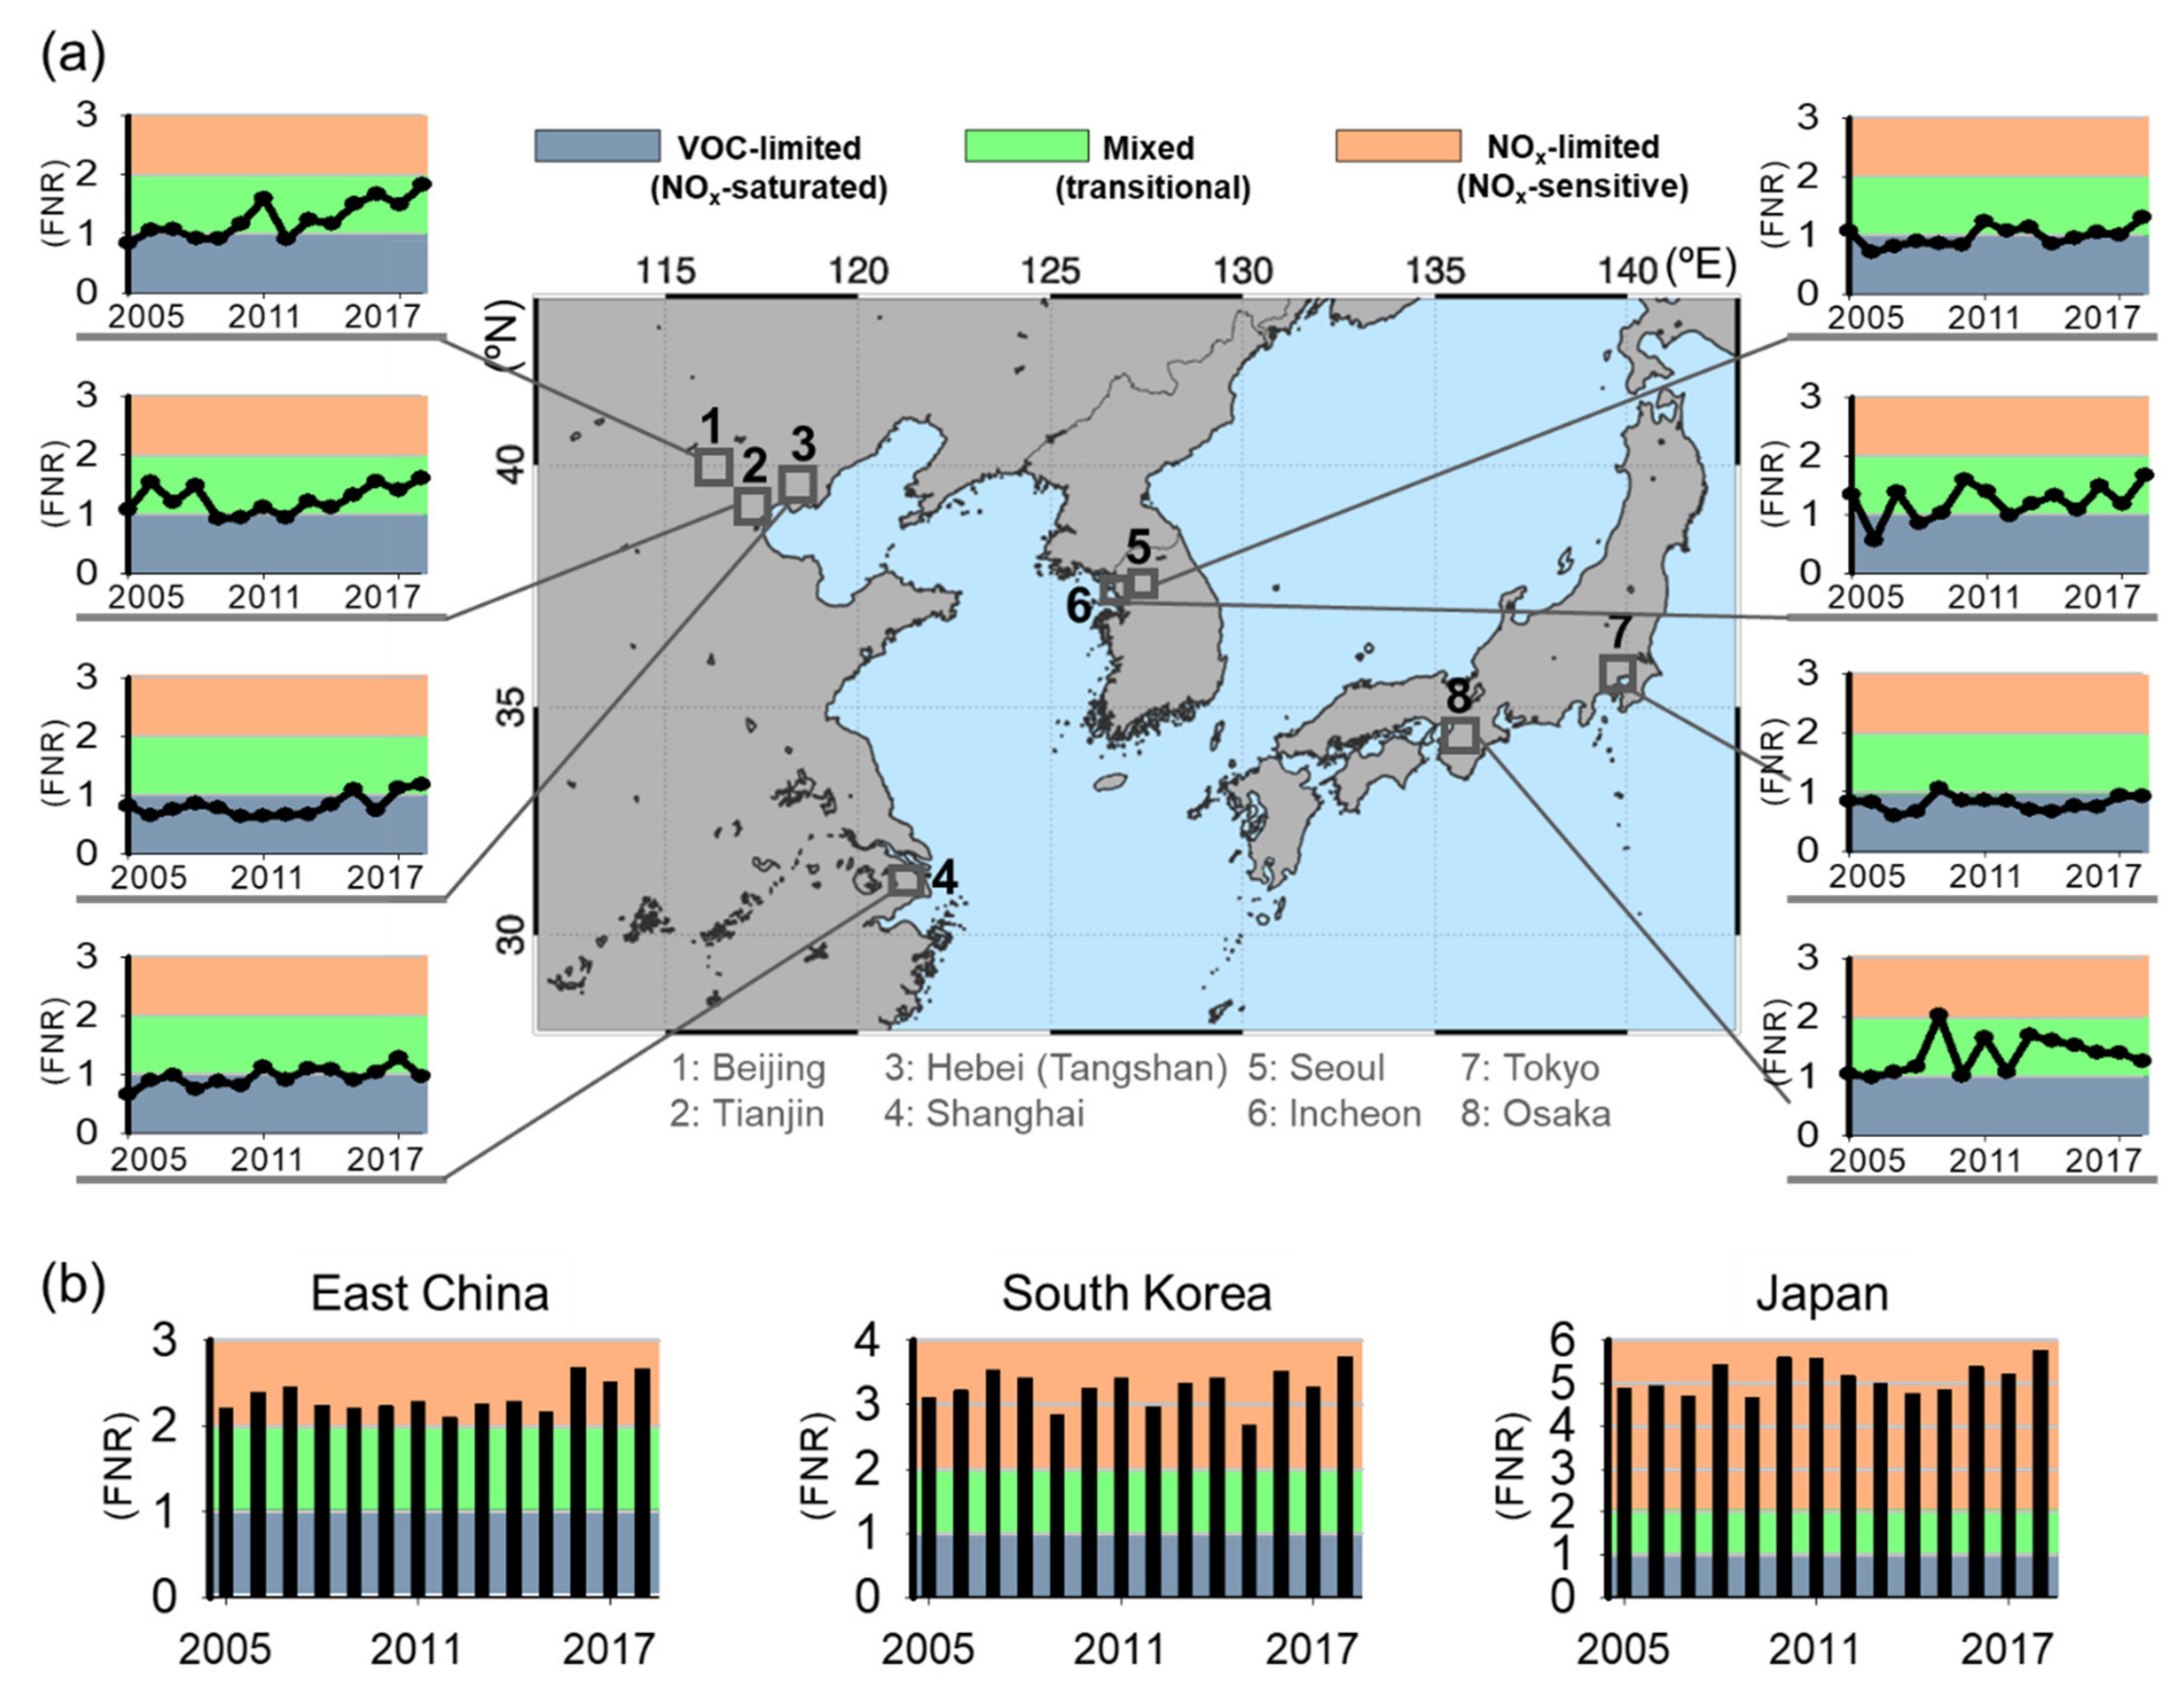
3.4. Diagnoses of Future O3 Abatements

For future O3 abatement, the emission reductions of the three IPCC-RCP scenarios, RCP2.6, RCP4.5, and RCP8.5, were projected for the years 2025 and 2050 based on future climate and emission changes (https://tntcat.iiasa.ac.at/RcpDb: last accessed on 1 June 2021) provided by the International Institute for Applied Systems Analysis. As a projected modeling platform, the Integrated Climate and Air Quality Modeling System [60] was applied over the Asia–Pacific region.
The projected future NOx emissions showed declining trends in all the regions, and the VOC emissions in region 1 are expected to slightly increase until 2030 only in RCP8.5, whereas all other regions show a decline from 2025 (Figure S2). In all three RCP scenarios, the FNRs in the eight megacities are highly likely to retain a VOC-limited regime up to 2025 (Figure S4). RCP8.5 indicates a specifically lower FNR over regions 1 and 2 in the aftermath of a relatively small NOx reduction (Figures S2 and S5). From 2025 to 2050, only region 2 in RCP8.5 retains a VOC-limited status due to the reduced HCHO levels in this region up to 2050 (Figures S2 and S6), whereas the regime transitions under RCP2.5 and RCP4.5 show NOx-limited conditions by 2050 over the entire domain (Figure S4).
Figure 6 illustrates past, present, and future FNRs for regions 1–3 in the Asia–Pacific region. During 2005–2018, the FNRs of megacities with NOx saturation were well-contrasted to the NOx-limited regime of the domain-averaged FNRs. All three future RCP scenarios show the NOx-saturated regime (i.e., FNR ≤1 or slightly greater) in all the eight megacities up to 2025; VOC reduction may be a key factor. RCP4.5 shows a tendency to change to the NOx-limited regime up to 2025 more easily by reflecting a relatively higher emission ratio of VOCs to NOx than others (Figure S2). Three scenarios then achieve prospective turnarounds to the NOx-limited (i.e., FNR ≥2) regime up to 2050 with the only exception of Seoul and Incheon in region 2 under RCP8.5.

4. Discussion

In the development of emission control policies in the Asia–Pacific region, strategies can be implemented to prioritize the control of target species (NOx or VOC) for emission reduction. In the NOx-limited regime, a decrease in NOx emissions reduces NO2 photolysis and, in turn, O3 formation. In the NOx-saturated (or VOC-limited) regime, reduced VOC emissions lead to a decrease in the production of OH, HO2, and other organic (RO2) radicals, resulting in decreased cycling with NOx and less O3 formation. However, in the NOx-saturated regime, a decrease in NOx emissions can promote O3 production via a weaker NO titration effect. In the transitional range between the two regimes, O3 formation is sensitive to both NOx and VOCs. In this study, we selected space-borne lower free tropospheric column-integrated O3 using a sophisticated retrieval algorithm and analyzed decade-scale O3 trends over the entire Asia–Pacific Rim area. FNR analysis provided information on the sensitivity of O3 to photochemical regimes regarding the efficiency of emission reduction over the Asia–Pacific region.
Our results from satellite data of the lower free tropospheric (900–700 hPa) O3 levels showed a steady increase in all the Asia–Pacific areas considered at a rate of 0.21 ± 0.05 DU/decade (0.57 ± 0.12 × 10¹⁶ molecules/cm2/decade) from 2005 to 2018 despite the reduction in NO2, especially since 2013 when China initiated its massive emission reduction strategy. The estimated FNR distributions in major cities in East China, South Korea, and Japan showed NOx saturation in megacities and transitional (or NOx-limited) levels across the Asia–Pacific region as a whole.
Our results indicate that the megacity-centered NO2 emission reductions enforced a relatively weak titration effect and derived increasing O3 tendencies under the NOx-saturated regime. Therefore, VOC reduction along with NOx reductions are needed in megacities in the immediate short term to reduce O3 levels. To date, there have been a few reports on this phenomenon for the warm season (e.g., from Beijing–Hebei and Chengdo, as well as from rural areas near the Yangtze River delta for a specific warm period) [77,78,79,80,81,82,83]. Here, warm and cold season features have also been completely characterized to explain the annual mean O3 enhancement over the Asia–Pacific region. The O3 growth rates for both summer and winter over the Asia–Pacific region are shown in Figure S5 (Supplementary Materials). The summer O3 growth rate was 3.8 ± 0.4%/decade, with a much greater increase during 2005–2011 than during 2012–2018 (Figure S7). In regions 1–2, the pronounced enhancement of summer O3 was driven mainly by increases in both HCHO and NO2 during 2005–2011, whereas a small enhancement of summer O3 was found despite lower NO2 levels during 2013–2018 (see Figure S7). However, winter O3 did not show a significant response to changes in either HCHO or NO2, mainly due to the low photochemical transformation caused by decreased photolysis rate in winter, thereby longer chemical lifetimes of both NO2 and HCHO in winter with lower photochemical O3 production. In addition, reduced retrieval sensitivity in winter due to larger solar zenith angle is also one of the reasons for this result. Only a significantly reduced NOx titration effect was expected in winter [20,83] in the aftermath of the rapid decrease in NO2, yielding a more pronounced increase in winter O3 during 2013–2018, as shown in Figure S7. These phenomena, the summer HCHO increase, especially in 2005–2012, and the winter NO2 decrease in 2013–2018, both led to an enhancement of the annual average O3 in regions 1–2, reflecting the NOx-saturated O3 sensitivity. In regions 3–4, a slight rise in summer O3 with a small decrease in NO2 was evident, whereas there was only a slight increase in the winter O3 response, due in part to a slight rise in HCHO levels, from 2013 to 2018 (Figure S7). This is attributable to the impact of O3 transport over the Asia–Pacific region, which can have a small or large effect.
As for future O3, three projected IPCC-RCP emission reduction scenarios (RCP2.6, RCP4.5, and RCP8.5) were explored and indicated that the future NOx-saturated regime in major megacities would be prolonged until 2025, but would gradually shift to NOx-limited conditions by 2050 in most of the region’s megacities where NOx emission regulation will be the key factor in controlling and reducing O3 levels in the area, except for RCP8.5 in Seoul and Incheon, South Korea. Accordingly, the short-term policy of NOx emission regulation in megacities in 2025–2050 will be the focus for controlling and reducing O3 levels over the Asia–Pacific region. The current study contains hypotheses of future emission scenarios. It will be necessary to continuously monitor the behavior of O3 and its two precursors VOC and NOx to develop a “measured” approach for the most effective O3 control over the Asia–Pacific region.

Supplementary Materials

The following are available online at https://www.mdpi.com/article/10.3390/rs13112177/s1, Figure S1: Spatial distributions of (a) SAO-retrieved OMI lower free tropospheric O3 (900–700 hPa) averaged for May 2016 and (b) a priori tropospheric O3 partial columns derived from climatological information (to compare with (a)), Figure S2: Projected emissions of VOCs and NOx from 2025 to 2100 under different IPCC-RCP/AR5 scenarios (RCP2.6, RCP4.5, and RCP8.5) for East China, South Korea, and Japan, Figure S3: Scatter plots of in situ ground measurements vs. satellite measurements for O3 (top) and NO2 (bottom), respectively. Here, satellite O3 measurements (y-axis in the top panel) denote lower free tropospheric O3 concentrations extracted from satellite column signals. Please note that surface NO2 concentration (x-axis in the bottom panel) was used in Seoul and Ganghwa, while NOx was measured in Oki and Ogasawara, Figure S4: Projected spatial distribution of the HCHO-to-NO2 ratio (FNR) in 2025 and 2050 under RCP2.6, RCP4.5, and RCP8.5, Figure S5: Projected spatial distribution of surface NO2, HCHO, and O3 in 2025 under RCP2.5, RCP4.5, and RCP8.5, Figure S6: Same as Figure S5, except in 2050, Figure S7: Long-term trends for whole year (black), summer (black), and winter (blue) in lower free tropospheric O3 columns, tropospheric HCHO and NO2 columns averaged over rectangular regions 1–4 from 2005 to 2018, measured using the OMI.

Author Contributions

Conceptualization, H.-J.L., D.A.J. and C.-H.K.; Data curation, J.B., X.L. and G.G.A.; Formal analysis, H.-Y.J. and L.-S.C.; Investigation, J.-B.L.; Methodology, L.-S.C.; Visualization, H.-Y.J. and Y.-J.J.; Writing—original draft preparation, H.-J.L.; Writing—review and editing, D.A.J. and C.-H.K. All authors have read and agreed to the published version of the manuscript.

Funding

This research was supported by the Basic Science Research Program through the National Research Foundation of Korea (NRF) funded by the Ministry of Education (2020R1A6A1A03044834 and 2019R1I1A1A01060445).

Institutional Review Board Statement

Not applicable.

Informed Consent Statement

Not applicable.

Data Availability Statement

OMI O3 satellite data are publicly available from https://avdc.gsfc.nasa.gov/pub/data/satellite/Aura/OMI/V03/L2/OMPROFOZ/ (accessed on 1 June 2021).; OMI NO2 satellite data are available from https://aura.gesdisc.eosdis.nasa.gov/data/Aura_OMI_Level2/OMNO2.003/ (accessed on 1 June 2021); OMI HCHO satellite data are available from https://aura.gesdisc.eosdis.nasa.gov/data/Aura_OMI_Level2/OMHCHO.003/ (accessed on 1 June 2021); NOx and O3 in situ measurements in Japan are available from https://www.eanet.asia/ (accessed on 1 June 2021); NO2 and O3 in situ measurements in Korea are available from https://www.airkorea.or.kr/web (accessed on 1 June 2021); RCP emission data are publicly available at RCP Database Version 2.0.5 (https://tntcat.iiasa.ac.at/RcpDb/ (accessed on 1 June 2021)); Contact Cheol-Hee Kim ([email protected]) or Hyo-Jung Lee ([email protected]) for ICAMS/NIER–SNU data requests.

Acknowledgments

We would like to express our gratitude to the OMI science team for providing their satellite data and all staff of Air Korea and EANET for in situ measurement data. The authors acknowledge the free use of RCP emission data from IIASA and its cooperation. The authors are also grateful to the anonymous reviewers for their comments.

Conflicts of Interest

The authors declare no conflict of interest.

References

  1. Solomon, S.; Qin, D.; Manning, M.; Chen, Z.; Marquis, M.; Averyt, K.B.; Tignor, M.; Miller, H.L. IPCC, Climate Change 2007: The Physical Science Basis; Contribution of Working Group I to Fourth Assessment Report of the Intergovernmental Panel on Climate Change; Cambridge University Press: Cambridge, UK, 2007; Volume 4. [Google Scholar]
  2. Arneth, A.; Harrison, S.P.; Zaehle, S.; Tsigaridis, K.; Menon, S.; Bartlein, P.J.; Feichter, J.; Korhola, A.; Kulmala, M.; O’donnell, D.; et al. Terrestrial biogeochemical feedbacks in the climate system. Nat. Geosci. 2010, 3, 525–532. [Google Scholar] [CrossRef] [Green Version]
  3. Bowman, K.; Henze, D.K. Attribution of direct ozone radiative forcing to spatially resolved emissions. Geophys. Res. Lett. 2012, 39, L22704. [Google Scholar] [CrossRef] [Green Version]
  4. Jaffe, D.A.; Parrish, D.; Goldstein, A.; Price, H.; Harris, J. Increasing background ozone during spring on the west coast of North America. Geophys. Res. Lett. 2003, 30, 1613. [Google Scholar] [CrossRef] [Green Version]
  5. Verstraeten, W.W.; Neu, J.L.; Williams, J.E.; Bowman, K.W.; Worden, J.R.; Boersma, K.F. Rapid increases in tropospheric ozone production and export from China. Nat. Geosci. 2015, 8, 690–695. [Google Scholar] [CrossRef]
  6. Cooper, O.R.; Forster, C.; Parrish, D.; Trainer, M.; Dunlea, E.; Ryerson, T.; Hubler, G.; Fehsenfeld, F.; Nicks, D.; Holloway, J.; et al. A case study of transpacific warm conveyor belt transport: Influence of merging airstreams on trace gas import to North America. J. Geophys. Res. 2004, 109, D23S08. [Google Scholar] [CrossRef]
  7. Lin, M.; Horowitz, L.W.; Payton, R.; Fiore, A.M.; Tonnesen, G. US surface ozone trends and extremes from 1980 to 2014: Quantifying the roles of rising Asian emissions, domestic controls, wildfires, and climate. Atmos. Chem. Phys. 2017, 17, 2943–2970. [Google Scholar] [CrossRef] [Green Version]
  8. Zhang, L.; Jaffe, D.A. Trends and sources of ozone and sub-micron aerosols at the Mt. Bachelor observatory (mbo) during 2004–2015. Atmos. Environ. 2017, 165, 143–154. [Google Scholar] [CrossRef]
  9. Jacob, D.J.; Logan, J.A.; Murti, P.P. Effect of rising emissions on surface ozone in the United States. Geophys. Res. Lett. 1999, 26, 2175–2178. [Google Scholar] [CrossRef]
  10. Zhang, L.; Jacob, D.J.; Boersma, K.F.; Jaffe, D.A.; Olson, J.R.; Bowman, K.W.; Worden, J.R.; Thompson, A.M.; Avery, M.A.; Cohen, R.C.; et al. Transpacific transport of ozone pollution and the effect of recent Asian emission increases on air quality in North America: An integrated analysis using satellite, aircraft, ozonesonde, and surface observations. Atmos. Chem. Phys. 2008, 8, 6117–6136. [Google Scholar] [CrossRef] [Green Version]
  11. Cooper, O.R.; Parrish, D.D.; Stohl, A.; Trainer, M.; Nédélec, P.; Thouret, V.; Cammas, J.P.; Oltmans, S.J.; Johnson, B.J.; Tarasick, D.; et al. Increasing springtime ozone mixing ratios in the free troposphere over western North America. Nature 2010, 463, 344–348. [Google Scholar] [CrossRef] [PubMed]
  12. Parrish, D.D.; Dunlea, E.J.; Atlas, E.L.; Schauffler, S.; Donnelly, S.; Stroud, V.; Goldstein, A.H.; Millet, D.B.; McKay, M.; Jaffe, D.A.; et al. Changes in the photochemical environment of the temperate North Pacific troposphere in response to increased Asian emissions. J. Geophys. Res. 2004, 109, D23S18. [Google Scholar] [CrossRef]
  13. Cooper, O.R.; Oltmans, S.J.; Johnson, B.J.; Brioude, J.; Angevine, W.; Trainer, M.; Parrish, D.D.; Ryerson, T.R.; Pollack, I.; Cullis, P.D.; et al. Measurement of western U.S. baseline ozone from the surface to the tropopause and assessment of downwind impact regions. J. Geophys. Res. 2011, 116, D00V03. [Google Scholar] [CrossRef]
  14. Jaffe, D.A.; Cooper, O.R.; Fiore, A.M.; Henderson, B.H.; Tonnesen, G.S.; Russell, A.G.; Henze, D.K.; Langford, A.O.; Lin, M.; Moore, T. Scientific assessment of background ozone over the U.S.: Implications for air quality management. Elem. Sci. Anth. 2018, 6, 56. [Google Scholar] [CrossRef] [PubMed]
  15. Gratz, L.E.; Jaffe, D.A.; Hee, J.R. Causes of increasing ozone and decreasing carbon monoxide in springtime at the Mt. Bachelor Observatory from 2004 to 2013. Atmos. Environ. 2015, 109, 323–330. [Google Scholar] [CrossRef]
  16. Hasunuma, H.; Ishimaru, Y.; Yoda, Y.; Shima, M. Decline of ambient air pollution levels due to measures to control automobile emissions and effects on the prevalence of respiratory and allergic disorders among children in Japan. Environ. Res. 2014, 131, 111–118. [Google Scholar] [CrossRef]
  17. Park, J.; Shin, M.; Lee, J.; Lee, J. Estimating the effectiveness of vehicle emission regulations for reducing NOx from light-duty vehicles in Korea using on-road measurements. Sci. Total Environ. 2021, 767, 144250. [Google Scholar] [CrossRef]
  18. Kim, Y.P.; Lee, G. Trend of Air Quality in Seoul: Policy and Science. Aerosol Air Qual. Res. 2018, 18, 2141–2156. [Google Scholar] [CrossRef] [Green Version]
  19. Milford, J.B.; Russell, A.G.; McRae, G.J. A new approach to photochemical pollution control: Implications of spatial patterns in pollutant responses to reductions in nitrogen-oxides and reactive organic gas emissions. Environ. Sci. Technol. 1989, 23, 1290–1301. [Google Scholar] [CrossRef]
  20. Kleinman, L.I. Low and high NOx tropospheric photochemistry. J. Geophys. Res. Atmos. 1994, 99, 16831–16838. [Google Scholar] [CrossRef]
  21. Jin, X.; Holloway, T. Spatial and temporal variability of ozone sensitivity over China observed from the Ozone Monitoring Instrument. J. Geophys. Res. 2015, 120, 7229–7246. [Google Scholar] [CrossRef]
  22. Jin, X.; Fiore, A.M.; Murray, L.T.; Valin, L.C.; Lamsal, L.N.; Duncan, B.; Boersma, K.F.; Smedt, I.D.; González Abad, G.; Chance, K.; et al. Evaluating a space-based indicator of surface ozone-NOx-VOC sensitivity over midlatitude source regions and application to decadal trends. J. Geophys. Res. 2017, 122, 10439–10461. [Google Scholar] [CrossRef]
  23. Kim, C.H.; Park, S.U.; Song, C.K. A simple semi-empirical photochemical model for the simulation of ozone concentration in the Seoul metropolitan area in Korea. Atmos. Environ. 2005, 39, 5597–5607. [Google Scholar] [CrossRef]
  24. Li, J.; Nagashima, T.; Kong, L.; Ge, B.; Yamaji, K.; Fu, J.S.; Wang, X.; Fan, Q.; Itahashi, S.; Lee, H.J.; et al. Model evaluation and intercomparison of surface-level ozone and relevant species in East Asia in the context of MICS-Asia Phase III—Part 1: Overview. Atmos. Chem. Phys. 2019, 19, 12993–13015. [Google Scholar] [CrossRef] [Green Version]
  25. Oak, Y.J.; Park, R.J.; Schroeder, J.R.; Crawford, J.H.; Blake, D.R.; Weinheimer, A.J.; Woo, J.H.; Kim, S.W.; Yeo, H.; Fried, A.; et al. Evaluation of simulated O3 production efficiency during the KORUS-AQ campaign: Implications for anthropogenic NOx emissions in Korea. Elem. Sci. Anthr. 2019, 7, 56. [Google Scholar] [CrossRef]
  26. Chang, L.S.; Choi, J.Y.; Son, J.; Lee, S.; Lee, D.; Jo, Y.J.; Kim, C.H. Interpretation of decadal-scale ozone production efficiency in the Seoul Metropolitan Area: Implication for ozone abatement. Atmos. Environ. 2020, 243, 117846. [Google Scholar] [CrossRef]
  27. Gaudel, A.; Cooper, O.R.; Chang, K.L.; Bourgeois, I.; Ziemke, J.R.; Strode, S.A.; Omen, L.; Sellitto, P.; Nedelec, P.; Blot, R.; et al. Aircraft observations since the 1990s reveal increases of tropospheric ozone at multiple locations across the Northern Hemisphere. Sci. Adv. 2020, 6, 1–11. [Google Scholar] [CrossRef]
  28. Kim, C.-H.; Kim, Y.-K.; Lee, H.W.; Seo, K.-H. A simple method for simulating horizontal ozone concentration fields over coastal areas: A case study of the Seoul metropolitan area, Korea. Terr. Atmos. Ocean. Sci. 2009, 20, 355–363. [Google Scholar] [CrossRef] [Green Version]
  29. Li, K.; Jacob, D.J.; Liao, H.; Shen, L.; Zhang, Q.; Bates, K.H. Anthropogenic drivers of 2013–2017 trends in summer surface ozone in China. Proc. Natl. Acad. Sci. USA 2019, 116, 422–427. [Google Scholar] [CrossRef] [Green Version]
  30. Wang, Y.; Konopka, P.; Liu, Y.; Chen, H.; Müller, R.; Plöger, F.; Riese, M.; Cai, Z.; Lu, D. Tropospheric ozone trend over Beijing from 2002–2010: Ozonesonde measurements and modeling analysis. Atmos. Chem. Phys. 2012, 12, 8389–8399. [Google Scholar] [CrossRef] [Green Version]
  31. Wang, T.; Wei, X.L.; Ding, A.J.; Poon, C.N.; Lam, K.S.; Li, Y.S.; Chan, L.Y.; Anson, M. Increasing surface ozone concentrations in the background atmosphere of southern China, 1994–2007. Atmos. Chem. Phys. 2009, 9, 6217–6227. [Google Scholar] [CrossRef] [Green Version]
  32. Zhu, S.; Li, X.; Yu, C.; Wang, H.; Wang, Y.; Miao, J. Spatiotemporal variations in satellite-based formaldehyde (HCHO) in the Beijing-Tianjin-Hebei region in China from 2005 to 2015. Atmosphere 2018, 9, 5. [Google Scholar] [CrossRef] [Green Version]
  33. Wang, Y.; Lampel, J.; Xie, P.; Beirle, S.; Li, A.; Wu, D.; Wagner, T. Ground-based MAX-DOAS observations of tropospheric aerosols, NO2, SO2 and HCHO in Wuxi, China, from 2011 to 2014. Atmos. Chem. Phys. 2017, 17, 2189–2215. [Google Scholar] [CrossRef] [Green Version]
  34. Duncan, B.N.; Lamsal, L.N.; Thompson, A.M.; Yoshida, Y.; Lu, Z.; Streets, D.G.; Hurwitz, M.M.; Pickering, K.E. A space-based, high-resolution view of notable changes in urban NOx pollution around the world (2005–2014). J. Geophys. Res. Atmos. 2016, 121, 976–996. [Google Scholar] [CrossRef] [Green Version]
  35. Liu, F.; Beirle, S.; Zhang, Q.; van der A, R.J.; Zheng, B.; Tong, D.; He, K. NOx emission trends over Chinese cities estimated from OMI observations during 2005 to 2015. Atmos. Chem. Phys. 2017, 17, 9261–9275. [Google Scholar] [CrossRef] [PubMed] [Green Version]
  36. Souri, A.H.; Nowlan, C.R.; Abad, G.G.; Zhu, L.; Blake, D.R.; Fried, A.; Weinheimer, A.J.; Wisthaler, A.; Woo, J.H.; Zhang, Q.; et al. An inversion of NOx and non-methane volatile organic compound (NMVOC) emissions using satellite observations during the KORUS-AQ campaign and implications for surface ozone over East Asia. Atmos. Chem. Phys. 2020, 20, 9837–9854. [Google Scholar] [CrossRef]
  37. Souri, A.H.; Nowlan, C.R.; Wolfe, G.M.; Lamsal, L.N.; Chan Miller, C.E.; Abad, G.G.; Janz, S.J.; Fried, A.; Blake, D.R.; Weinheimer, A.J.; et al. Revisiting the Effectiveness of HCHO/NO2 Ratios for Inferring Ozone Sensitivity to Its Precursors using High Resolution Airborne Remote Sensing Observations in a High Ozone Episode during the KORUS-AQ Campaign. Atmos. Environ. 2020, 224, 117341. [Google Scholar] [CrossRef]
  38. Hayashida, S.; Liu, X.; Ono, A.; Yang, K.; Chance, K. Observation of ozone enhancement in the lower troposphere over East Asia from a space-borne ultraviolet spectrometer. Atmos. Chem. Phys. 2015, 15, 9865–9881. [Google Scholar] [CrossRef] [Green Version]
  39. Shen, L.; Jacob, D.J.; Liu, X.; Huang, G.; Li, K.; Liao, H.; Wang, T. An evaluation of the ability of the Ozone Monitoring Instrument (OMI) to observe boundary layer ozone pollution across China: Application to 2005–2017 ozone trends. Atmos. Chem. Phys. 2019, 19, 6551–6560. [Google Scholar] [CrossRef] [Green Version]
  40. Kajino, M.; Hayashida, S.; Sekiyama, T.T.; Deushi, M.; Ito, K.; Liu, X. Detectability assessment of a satellite sensor for lower tropospheric ozone responses to its precursors emission changes in East Asian summer. Sci. Rep. 2019, 9, 19629. [Google Scholar] [CrossRef]
  41. Hayashida, S.; Kajino, M.; Deushi, M.; Sekiyama, T.T.; Liu, X. Seasonality of the lower tropospheric ozone over central China observed by the Ozone Monitoring Instrument. Atmos. Environ. 2018, 184, 244–253. [Google Scholar] [CrossRef]
  42. Hayashida, S.; Kayaba, S.; Deushi, M.; Yamaji, K.; Ono, A.; Kajino, M.; Sekiyama, T.T.; Maki, T.; Liu, X. Study of Lower Tropospheric Ozone over Central and Eastern China: Comparison of Satellite Observation with Model. Simulation; Land-Atmospheric Research Applications in South and Southeast Asia; Vadrevu, K.P., Ohara, T., Justice, C., Eds.; Springer: Berlin/Heidelberg, Germany, 2018; pp. 255–275. [Google Scholar]
  43. Levelt, P.F.; Joiner, J.; Tamminen, J.; Veefkind, J.P.; Bhartia, P.K.; Stein Zweers, D.C.; Duncan, B.N.; Streets, D.G.; Eskes, H.J.; van der A, R.J.; et al. The Ozone Monitoring Instrument: Overview of 14 years in space. Atmos. Chem. Phys. 2018, 18, 5699–5745. [Google Scholar] [CrossRef] [Green Version]
  44. Schenkeveld, V.M.E.; Jaross, G.; Marchenko, S.; Haffner, D.; Kleipool, Q.L.; Rozemeijer, N.C.; Veefkind, J.P.; Levelt, P.F. In-flight performance of the Ozone Monitoring Instrument. Atmos. Meas. Tech. 2017, 10, 1957–1986. [Google Scholar] [CrossRef] [Green Version]
  45. Rodgers, C.D. Inverse Methods for Atmospheric Sounding: Theory and Practice; World Scientific: Singapore, 2000. [Google Scholar]
  46. Spurr, R.J.D. Vlidort: A linearized pseudo-spherical vector discrete ordinate radiative transfer code for forward model and retrieval studies in multilayer multiple scattering media. J. Quant. Spectrosc. Radiat. 2006, 102, 316–342. [Google Scholar] [CrossRef]
  47. Liu, X.; Bhartia, P.K.; Chance, K.; Spurr, R.J.D.; Kurosu, T.P. Ozone profile retrievals from the Ozone Monitoring Instrument. Atmos. Chem. Phys. 2010, 10, 2521–2537. [Google Scholar] [CrossRef] [Green Version]
  48. Kim, P.S.; Jacob, D.J.; Liu, X.; Warner, J.X.; Yang, K.; Chance, K.; Thouret, V.; Nedelec, P. Global ozone–CO correlations from OMI and AIRS: Constraints on tropospheric ozone sources. Atmos. Chem. Phys. 2013, 13, 9321–9335. [Google Scholar] [CrossRef] [Green Version]
  49. Huang, G.; Liu, X.; Chance, K.; Yang, K.; Bhartia, P.K.; Cai, Z.; Allaart, M.; Ancellet, G.; Calpini, B.; Coetzee, G.J.R.; et al. Validation of 10-year SAO OMI Ozone Profile (PROFOZ) product using ozonesonde observations. Atmos. Meas. Tech. 2017, 10, 2455–2475. [Google Scholar] [CrossRef] [Green Version]
  50. Krotkov, N.A.; Lamsal, L.N.; Marchenko, S.V.; Celarier, E.A.; Bucsela, E.J.; Swartz, W.H.; Joiner, J. OMI Core Team, OMI/Aura nitrogen Dioxide (NO2) Total and Tropospheric Column 1-Orbit L2 Swath 13×24 km V003; Goddard Earth Sciences Data and Information Services Center: Greenbelt, MD, USA, 2019. Available online: https://aura.gesdisc.eosdis.nasa.gov/data/Aura_OMI_Level2/OMNO2.003/ (accessed on 1 June 2021).
  51. Bucsela, E.J.; Krotkov, N.A.; Celarier, E.A.; Lamsal, L.N.; Swartz, W.H.; Bhartia, P.K.; Boersma, K.F.; Veefkind, J.P.; Gleason, J.F.; Pickering, K.E. A new stratospheric and tropospheric NO2 retrieval algorithm for nadir-viewing satellite instruments: Applications to OMI. Atmos. Meas. Tech. 2013, 6, 2607–2626. [Google Scholar] [CrossRef] [Green Version]
  52. Lamsal, L.N.; Krotkov, N.A.; Celarier, E.A.; Swartz, W.H.; Pickering, K.E.; Bucsela, E.J.; Gleason, J.F.; Martin, R.V.; Philip, S.; Irie, H.; et al. Evaluation of OMI operational standard NO2 column retrievals using in situ and surface-based NO2 observations. Atmos. Chem. Phys. 2014, 14, 11587–11609. [Google Scholar] [CrossRef] [Green Version]
  53. González Abad, G.G.; Liu, X.; Chance, K.; Wang, H.; Kurosu, T.P.; Suleiman, R. Updated Smithsonian Astrophysical Observatory Ozone Monitoring Instrument (SAO OMI) formaldehyde retrieval. Atmos. Meas. Tech. 2015, 8, 19–32. [Google Scholar] [CrossRef] [Green Version]
  54. Sillman, S. The Use of NOy, H2O2 and HNO3 as Indicators for the ozone-NOx- hydrocarbon Sensitivity in Urban Locations. J. Geophys. Res. 1995, 100, 14175–14188. [Google Scholar] [CrossRef]
  55. Jin, X.M.; Fiore, A.; Boersma, K.F.; De Smedt, I.; Valin, L. Inferring changes in summertime surface ozone-NOx-VOC chemistry over US urban areas from two decades of satellite and ground-based observations. Environ. Sci. Technol. 2020, 54, 6518–6529. [Google Scholar] [CrossRef]
  56. Duncan, B.; Yoshida, Y.; Olson, J.; Sillman, S.; Martin, R.; Lamsal, L.; Hu, Y.; Pickering, K.; Retscher, C.; Allen, D.; et al. Application of OMI observations to a space-based indicator of NOx and VOC controls on surface O3 formation. Atmos. Environ. 2010, 44, 2213–2223. [Google Scholar] [CrossRef] [Green Version]
  57. Martin, R.V.; Jacob, D.J.; Chance, K.; Kurosu, T.P.; Palmer, P.I.; Evans, M.J. Global inventory of nitrogen oxide emissions constrained by space-based observations of NO2 columns. J. Geophys. Res. Atmos. 2003, 108, 108. [Google Scholar] [CrossRef] [Green Version]
  58. Lamsal, L.N.; Martin, R.V.; van Donkelaar, A.; Celarier, E.A.; Bucsela, E.J.; Boersma, K.F.; Dirksen, R.; Luo, C.; Wang, Y. Indirect validation of tropospheric nitrogen dioxide retrieved from the OMI satellite instrument: Insight into the seasonal variation of nitrogen oxides at northern midlatitudes. J. Geophys. Res. 2010, 115, D05302. [Google Scholar] [CrossRef]
  59. Lee, H.J.; Kim, S.W.; Brioude, J.; Cooper, O.R.; Frost, G.J.; Kim, C.H.; Park, R.J.; Trainer, M.; Woo, J.H. Transport of NOx in East Asia identified by satellite and in situ measurements and Lagrangian particle dispersion model simulations. J. Geophys. Res. Atmos. 2014, 119, 2574–2596. [Google Scholar] [CrossRef]
  60. Lee, J.-B.; Cha, J.-S.; Hong, S.-C.; Choi, J.-Y.; Myoung, J.-S.; Park, R.J.; Woo, J.-H.; Ho, C.; Han, J.-S.; Song, C.-K. Projections of summertime ozone concentration over East Asia under multiple IPCC SRES emission scenarios. Atmos. Environ. 2015, 106, 335–346. [Google Scholar] [CrossRef]
  61. Choi, J.-Y.; Kim, S.-Y.; Hong, S.-C.; Lee, J.-B.; Song, C.-K.; Lee, H.-J.; Lee, S.-J. Evaluation of temperature and precipitation on integrated climate and air quality modeling system (ICAMS) for air quality prediction. J. Korean Soc. Atmos. Environ. 2012, 28, 615–631. [Google Scholar] [CrossRef] [Green Version]
  62. National Institute of Environmental Research. Development and Operation of the Integrated System on Climate and Air Quality (III); National Institute of Environmental Research: Inchon, Korea, 2010; p. 33. [Google Scholar]
  63. Hilboll, A.; Richter, A.; Burrows, J.P. Long-term changes of tropospheric NO2 over megacities derived from multiple satellite instruments. Atmos. Chem. Phys. 2013, 13, 4145–4169. [Google Scholar] [CrossRef] [Green Version]
  64. Souri, A.H.; Choi, Y.; Jeon, W.; Woo, J.H.; Zhang, Q.; Kurokawa, J. Remote sensing evidence of decadal changes in major tropospheric ozone precursors over East Asia. J. Geophys. Res. Atmos. 2017, 122, 2474–2492. [Google Scholar] [CrossRef]
  65. Akimoto, H.; Mori, Y.; Sasaki, K.; Nakanishi, H.; Ohizumi, T.; Itano, Y. Analysis of monitoring data of ground-level ozone in Japan for long-term trend during 1990–2010: Causes of temporal and spatial variation. Atmos. Environ. 2015, 102, 302–310. [Google Scholar] [CrossRef]
  66. Wang, R.; Xu, X.; Jia, S.; Ma, R.; Ran, L.; Deng, Z.; Lin, W.; Wang, Y.; Ma, Z. Lower tropospheric distributions of O3 and aerosol over Raoyang, a rural site in the North China Plain. Atmos. Chem. Phys. 2017, 17, 3891–3903. [Google Scholar] [CrossRef] [Green Version]
  67. Krotkov, N.A.; Lamsal, L.N.; Celarier, E.A.; Swartz, W.H.; Marchenko, S.V.; Bucsela, E.J.; Chan, K.L.; Wenig, M.; Zara, M. The version 3 OMI NO2 standard product. Atmos. Meas. Tech. 2017, 10, 3133–3149. [Google Scholar] [CrossRef] [Green Version]
  68. Krotkov, N.A.; McLinden, C.A.; Li, C.; Lamsal, L.N.; Celarier, E.A.; Marchenko, S.V.; Swartz, W.H.; Bucsela, E.J.; Joiner, J.; Duncan, B.N.; et al. Aura OMI observations of regional SO2 and NO2 pollution changes from 2005 to 2015. Atmos. Chem. Phys. 2016, 16, 4605–4629. [Google Scholar] [CrossRef] [Green Version]
  69. De Foy, B.; Lu, Z.; Streets, D.G. Satellite NO2 retrievals suggest China has exceeded its NOx reduction goals from the twelfth Five-Year Plan. Sci. Rep. 2016, 6, 35912. [Google Scholar] [CrossRef] [PubMed] [Green Version]
  70. Zheng, B.; Tong, D.; Li, M.; Liu, F.; Hong, C.; Geng, G.; Li, H.; Li, X.; Peng, L.; Qi, J.; et al. Trends in China’s anthropogenic emissions since 2010 as the consequence of clean air actions. Atmos. Chem. Phys. 2018, 18, 14095–14111. [Google Scholar] [CrossRef] [Green Version]
  71. Vellingiri, K.; Kim, K.-H.; Jeon, J.Y.; Brown, R.J.C.; Jung, M.C. Changes in NOx and O3 concentrations over a decade at a central urban area of Seoul, Korea. Atmos. Environ. 2015, 112, 116–125. [Google Scholar] [CrossRef]
  72. Wakamatsu, S.; Morikawa, T.; Ito, A. Air pollution trends in japan between 1970 and 2012 and impact of urban air pollution countermeasures. Asian J. Atmos. Environ. 2013, 7, 177–190. [Google Scholar] [CrossRef] [Green Version]
  73. Zheng, C.H.; Shen, J.; Zhang, Y.; Huang, W.; Zhu, X.; Wu, X.; Chen, L.; Gao, X.; Cen, K. Quantitative assessment of industrial VOC emissions in China: Historical trend, spatial distribution, uncertainties, and projection. Atmos. Environ. 2017, 150, 116–125. [Google Scholar] [CrossRef]
  74. Zhang, J.; Wang, T.; Chameides, W.L.; Cardelino, C.; Kwok, J.; Blake, D.R.; Ding, A.; So, K.L. Ozone production and hydrocarbon reactivity in Hong Kong, Southern China. Atmos. Chem. Phys. 2017, 7, 557–573. [Google Scholar] [CrossRef] [Green Version]
  75. Lu, C.H.; Chang, J.S. On the indicator-based approach to assess ozone sensitivities and emissions features. J. Geophys. Res. 1998, 103, 3453–3462. [Google Scholar] [CrossRef]
  76. Dodge, M.C. Effect of Selected Parameters on Predictions of a Photochemical Model; EPA-600/3-77-048; U.S. Environmental Protection Agency: Research Triangle Park, NC, USA, 1977.
  77. Tang, G.; Wang, Y.; Li, X.; Ji, D.; Hsu, S.; Gao, L. Spatial-temporal variations in surface ozone in Northern China as observed during 2009–2010 and possible implications for future air quality control strategies. Atmos. Chem. Phys. 2012, 12, 2757–2776. [Google Scholar] [CrossRef] [Green Version]
  78. Ding, A.J.; Fu, C.B.; Yang, X.Q.; Sun, J.N.; Zheng, L.F.; Xie, Y.N.; Herrmann, E.; Nie, W.; Petaja, T.; Kerminen, V.-M.; et al. Ozone and fine particle in the western Yangtze River Delta: An overview of 1 yr data at the SORPES station. Atmos. Chem. Phys. 2013, 13, 5813–5830. [Google Scholar] [CrossRef] [Green Version]
  79. Tan, Z.; Lu, K.; Jiang, M.; Su, R.; Dong, H.; Zeng, L.; Xie, S.; Tan, Q.; Zhang, Y. Exploring ozone pollution in Chengdu, southwestern China: A case study from radical chemistry to O3 -VOC-NOx sensitivity. Sci. Total Environ. 2018, 636, 775–786. [Google Scholar] [CrossRef] [PubMed]
  80. Shao, M.; Lu, S.; Liu, Y.; Xie, X.; Chang, C.; Huang, S.; Chen, Z. Volatile organic compounds measured in summer in Beijing and their role in ground-level ozone formation. J. Geophys. Res. 2009, 114, D00G06. [Google Scholar] [CrossRef]
  81. Li, L.; Xie, S.; Zheng, L.; Wu, R.; Li, J. Characteristics of volatile organic compounds and their role in ground-level ozone formation in the Beijing-Tianjin-Hebei region, China. Atmos. Environ. 2015, 113, 247–254. [Google Scholar] [CrossRef]
  82. Li, K.; Jacob, D.J.; Shen, L.; Lu, X.; De Smedt, I.; Liao, H. Increases in surface ozone pollution in China from 2013 to 2019: Anthropogenic and meteorological influences. Atmos. Chem. Phys. 2020, 20, 11423–11433. [Google Scholar] [CrossRef]
  83. Li, Y.; Cheng, M.; Guo, Z.; He, Y.; Zhang, X.; Cui, X.; Chen, S. Increase in Surface Ozone over Beijing-Tianjin-Hebei and the Surrounding Areas of China Inferred from Satellite Retrievals, 2005–2018. Aerosol Air Qual. Res. 2020, 20, 2170–2184. [Google Scholar] [CrossRef] [Green Version]
Figure 1. Spatial distributions of the LFT O3 column (900–700 h Pa) measured using the Ozone Monitoring Instrument (OMI) for the following periods: (a) 2005–2018, (b) 2005, (c) 2010, (d) 2015, and (e) 2018. (f) Annual trends of O3 over region 1 (East China), region 2 (South Korea), region 3 (Japan), and region 4 (Asia–Pacific oceanic site) as described in (a). Red lines indicate the linear regressions over the four subdivided areas.
Remotesensing 13 02177 g001
Figure 2. LFT O3 column (900–700 hPa), tropospheric NO2 and HCHO were measured using the OMI for 2005–2018 in regions 1, 2, and 3 (as defined in Figure 1). Red dots (with arrows) indicate locations of the eight major cities: Beijing, Tianjin, Hebei, and Shanghai (East China); Seoul and Incheon (South Korea); and Tokyo and Osaka (Japan). Angled arrows starting from the red dots show an increasing rate of O3 in each of the eight megacities.
Remotesensing 13 02177 g002
Figure 3. Annual changes in the ground measurements of NO2 and O3 in region 2 (South Korea—Seoul and Ganghwa Island) and in region 3 (Japan—Oki, a remote area in Japan, and Ogasawara, an oceanic area). Red diamonds and blue circles indicate annual mean O3 and NO2 levels, respectively, and the four lines denote the average for each of the four seasons: spring, summer, autumn, and winter.
Remotesensing 13 02177 g003
Figure 4. Space-borne spatiotemporal distributions of the (a) HCHO-to-NO2 ratio (FNR), (b) tropospheric NO2 columns, (c) tropospheric HCHO columns, and (d) LFT O3 columns from 2005 to 2018.
Remotesensing 13 02177 g004
Figure 5. Annual variations in FNRs in eight megacities from 2005 to 2018. (a) Eight megacities are Beijing, Tianjin, Hebei, and Shanghai (East China); Seoul and Incheon (South Korea); and Tokyo and Osaka (Japan). Values are inferred from the tropospheric column measured using the OMI. (b) The domain-averaged FNR over regions 1, 2, and 3 (as defined in Figure 1) are also shown.
Remotesensing 13 02177 g005
Figure 6. Current and future FNRs in megacities and over three rectangular regions 1–3 (regions 1, 2, and 3) from 2005 to 2018 are inferred using the OMI; projected FNRs for 2025 and 2050 are from the IPCC RCP2.6, RCP4.5, and RCP8.5 scenarios.
Remotesensing 13 02177 g006
Publisher’s Note: MDPI stays neutral with regard to jurisdictional claims in published maps and institutional affiliations.

