
Mapping Mangrove Zonation Changes in Senegal with Landsat Imagery Using an OBIA Approach Combined with Linear Spectral Unmixing


1
Department of Geography, CNRS UMR Espace Campus Valrose, Université Côte d’Azur, Bâtiment L 28, Avenue de Valrose, CEDEX 2, 06108 Nice, France
2
GEOSpatial Monitoring & Information Technology (GeoSMIT) Department, French Institute of Pondicherry (IFP), UMIFRE 21 CNRS-MEAE/USR 3330, 11 St. Louis Street, P.B. 33, Pondicherry 605001, India
*
Author to whom correspondence should be addressed.
Remote Sens. 2021, 13(10), 1961; https://doi.org/10.3390/rs13101961
Submission received: 19 April 2021
/
Revised: 13 May 2021
/
Accepted: 14 May 2021
/
Published: 18 May 2021
(This article belongs to the Special Issue Remote Sensing for Agricultural, Environmental and Forestry Policies)
Abstract
:The mangrove areas in Senegal have fluctuated considerably over the last few decades, and it is therefore important to monitor the evolution of forest cover in order to orient and optimise forestry policies. This study presents a method for mapping plant formations to monitor and study changes in zonation within the mangroves of Senegal. Using Landsat ETM+ and Landsat 8 OLI images merged to a 15-m resolution with a pansharpening method, a processing chain that combines an OBIA approach and linear spectral unmixing was developed to detect changes in mangrove zonation through a diachronic analysis. The accuracy of the discriminations was evaluated with kappa indices, which were 0.8 for the Saloum delta and 0.83 for the Casamance estuary. Over the last 20 years, the mangroves of Senegal have increased in surface area. However, the dynamics of zonation differ between the two main mangrove hydrosystems of Senegal. In Casamance, a colonisation process is underway. In the Saloum, Rhizophora mangle is undergoing a process of densification in mangroves and appears to reproduce well in both regions. Furthermore, this study confirms, on a regional scale, observations in the literature noting the lack of Avicennia germinans reproduction on a local scale. In the long term, these regeneration gaps may prevent the mangrove from colonising the upper tidal zones in the Saloum. Therefore, it would be appropriate to redirect conservation policies towards reforestation efforts in the Saloum rather than in Casamance and to focus these actions on the perpetuation of Avicennia germinans rather than Rhizophora mangle, which has no difficulty in reproducing. From this perspective, it is necessary to gain a more in-depth understanding of the specific factors that promote the success of Avicennia germinans seeding.
Keywords:
mangrove; Senegal; Landsat; OBIA; unmixing; forest structure; forest management; mathematical morphology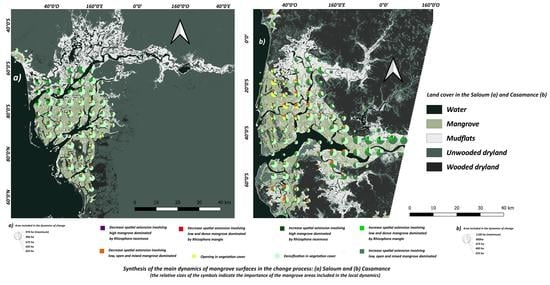
1. Introduction
Monitoring mangrove forests is essential for their management and conservation [1,2,3]. In particular, knowing the dynamics of a mangrove allows us to estimate the future status of the many ecosystem services that it provides [4,5]. For example, mangrove forests can contribute to climate change mitigation by sequestering carbon [6,7] and have therefore become a major focus of conservation efforts on a global scale [8]. More locally, mangroves provide resources directly for timber harvesting [9,10,11] and indirectly [12] through their role in the abundance of fishery resources [13,14,15] or as habitats for wildlife. However, mangroves experienced a significant global decline between 1980 and 2005 [16]. This trend has fortunately slowed down significantly in recent years [17,18] and is being reversed in some regions, particularly in West Africa [19].
In Senegal, the upper tidal zone is flooded during the high tides and is very often left drained. It is therefore subject to strong evaporation, resulting in salt precipitation in the soil. During the drought period, the saltier water did not allow mangrove to reproduce and survive in these areas. Rhizophora mangle and Avicennia germinans located in this interface have suffered the most from this climatic deterioration [20]. These mangroves have increased in area since the mid-1990s [21,22], and the rainfall recovery has led to a decrease in their salinity levels [20,23]. However, the recovery of overall annual rainfall since the mid-1990s is still associated with high interannual variability [24]. Several studies have highlighted the complexity of the response of Senegalese hydrological systems to recent climate fluctuations [23,25]. Even in the rainy season, the Saloum remains an inverse estuary, while Casamance has undergone changes in its maximum salinity due to upstream freshwater inflows [23]. Other studies have highlighted the varying responses of terrestrial vegetation to climate fluctuations in the Sahelo–Sudanian region [26,27,28]. The interface between the mangrove forest and the “tannes” (local term for salt flats) fluctuates over time in response to variations in the hydrosystem as the climate changes. Fluctuations in the mangrove–salt flats boundary therefore constitute a range of metastability and resilience [29] of the mangrove ecosystem in Senegalese estuaries [20].
This metastability, which is difficult to detect in studies at the local scale only, has probably contributed to the perception that the mangroves are degrading, whereas mapping by remote sensing has revealed an increasing trend in the area [19,21,22,30]. This perception of mangrove degradation persists in the grey literature, the media and, sometimes, the scientific literature and forms the basis of most environmental policies. In response to these reports of degradation, conservation policies in general and reforestation actions, in particular, have been implemented, mainly by NGOs but with some local initiatives. However, these actions have been seriously questioned and are considered a form of land grabbing [31]. In addition to the scientific controversies surrounding the legitimacy of mangrove reforestation in Senegal [32], there are also contradictions between the global climate change mitigation objectives of REDD+ programs and the local needs of populations. In parallel to reforestation, mangrove conservation measures have been reinforced since the 1970s [31]. These are not always accepted, preventing a consensus between government stakeholders and local populations [33], which can jeopardise the support for the sustainable management of this resource.
Moreover, the increasing trend in mangrove areas in Senegal [19,21,22,30] raises the question of the necessity of stronger conservation measures. The need for such actions is particularly uncertain in light of the increasing surface area of mangroves in Senegal due to changes in rainfall and the significant occurrence of spontaneous regeneration, as these findings testify to their resilience [20].
Furthermore, with this increase in surface area, the species that constitute mangrove plant formations have been observed to have contrasting responses [34]. These observations show different species dynamics between the Saloum delta and the Casamance estuary, raising questions about the effectiveness of an identical conservation policy for the two hydrosystems. This is currently the case with reforestation based solely on the genus Rhizophora ssp. [32].
Observations made on the local scale [20,34] indicate the lack of Avicennia germinans reproduction in the Saloum, which only participates in the dynamics of the area expansion through stump sprouting of altered but still present stumps from the last drought period [20], showing that Avicennia germinans can live but cannot reproduce in the current salinity conditions [34]. In contrast, Rhizophora mangle colonises mudflats by seeding. In Casamance, the two species have a balanced age pyramid, which suggests that they both contribute to the dynamics of surface expansion [34]. Rhizophora racemosa completes the inventory of dominant species in the Senegalese mangrove. Located at the riverine, it is a relatively stable species in the two hydrosystems. Consequently, it is essential to monitor these developments at the fine scale of estuaries. Therefore, this paper hypothesises that these fine-scale processes participate in the spatial organisation of plant formations, which can be mapped on a regional scale. This mapping should make it possible to quantify the dynamics of transitions between plant formations, which would then corroborate (or not), at the regional scale, the observations made previously at the local scale.
A simple mapping of mangrove surfaces alone is not sufficient to estimate the spatiotemporal dynamics of plant formations in Senegalese mangroves. Plant formations are an estimate of the species composition of the environment. In order to effectively adjust environmental policies, it is important to precisely characterise the dynamics specific to each region to optimise conservation strategies.
Several remote sensing methods have been developed to map mangrove species or plant formations. High-resolution images, such as those from the Landsat satellite, are mainly used to map mangroves alone [20,30,35,36]. Fewer studies have used Sentinel-2 images, although they are effective for vegetation mapping. Very-high-resolution imagery can be used to identify mangrove species [37,38,39]. However, the cost of very-high-resolution images does not allow for regional-scale mapping, and they remain financially inaccessible in low- and middle-income countries with mangroves.
In a comparison of Landsat OLI-8, Sentinel-2 and Pleiades-1 data, a previous study [37] showed that Landsat images were less effective than Sentinel-2 images for mapping mangrove plant communities, with Pleiades being the most effective. Nevertheless, the authors highlighted the high potential of Sentinel-2 images at a 10-m resolution for mapping mangrove plant communities. The mapping of three mangrove plant formations in Senegal with an OBIA approach using Sentinel-2 images [40] produced interesting results that corroborated the findings of reference [37]. The sizes of the objects that represent vegetation formations were also quantified in this study and were found to be slightly smaller than 60 m, on average. Therefore, this suggests the potential effectiveness of Landsat images merged to a 15-m resolution with an OBIA approach, where the gradient image calculations can be performed with a 3 × 3 pixels window.
Currently, only Landsat images offer a temporal resolution that allows an assessment of mangrove evolution on decadal scales, enabling the study of the resilience of mangroves since the rainfall recovery in Senegal. Furthermore, since the launch of Landsat ETM+ in 1999, the ability to obtain imagery in the panchromatic band has made it possible to achieve a resolution of 15 m using pansharpening methods. In addition, studies have shown that, following certain fusion methods, the NDVI can retain a largely acceptable spatial structure and coherence of spectral values [41], even if the NIR wavelength range does not cover the panchromatic range. NIR or the derived indices often significantly improve mangrove discrimination and are essential for detecting canopy densities [42,43,44] or different vegetation formations [40]. Therefore, the objective of this study was to assess changes in mangrove zonation from 2000 to 2018 using 15-m Landsat imagery. The results fill a current knowledge gap on this subject and can facilitate policymaking.
Several methods with high-resolution images have been used to map mangrove plant formations or species. OBIA approaches often obtain the best results [45,46]. Pixel-based approaches with Landsat imagery and the use of Tasseled Cap indices were shown to be effective in a diachronic assessment of mangrove zonation dynamics in the Mekong Delta [47]. Linear spectral unmixing was shown to be very useful for mapping the degree of mangrove canopy closure using Sentinel-2 imagery [46] and allowed for a more refined assessment of the degradation and growth dynamics of the surface. In Taureau et al. (2019) [38], Fully Constrained Linear Spectral Unmixing allowed for a standardised comparison between locations and showed a good fit with species zonation patterns in very-high-resolution images. Furthermore, this study reported that the variation in plant proportions between formations dominated by Sonneratia spp., Rhizophora spp. or Avicennia spp. could enable the assessment of the species composition of mangrove formations [38]. Gudex-Cross et al. (2017) [48] were able to improve the discrimination of mixed forest canopy using Landsat images and a combination of linear unmixing and an OBIA approach. In this way, the detection of local differences in vegetation formations, which are sometimes heterogeneous, is envisaged in this work. Therefore, this paper hypothesises that Linear Spectral Unmixing (LSU) calculated from Landsat images merged to a 15-m resolution can discriminate the degree of openness of the Senegalese mangrove canopy and, thus, enable the mapping of different patches that represent different plant formations using an OBIA approach. Ultimately, the aim of this study was to assess, on a regional scale, the changes in three plant formations resulting from processes on a finer scale, which should make it possible to understand the spatial effects of different biological processes at work for each species. Determining the dynamics could allow us to assign priorities to actions in policies and restoration programs that target particular regions (Saloum or Casamance) and species (Rhizophora spp. or Avicennia germinans).
2. Materials and Methods
2.1. Study Sites
The Saloum, located in the north, is a mangrove delta in the Sahelian zone (Figure 1). The rainfall is around 600 mm in the north and 800 mm in the south in the years that have average climate conditions over a century [49]. The river input into the delta is almost nil all year round, giving it an inverse function in which the salinity increases from downstream to upstream, even during the rainy period. Casamance is a mangrove estuary located in the Sudanian zone (Figure 1). The cumulative rainfall can reach 1300 mm in the years that have average climatic conditions over a century. Casamance also is an inverse estuary. However, during the rainy season, the river’s contribution can reverse this trend. The highest salinity values move 50–80 km downstream [23].
Three mangrove species are locally dominant in these two hydrosystems: Rhizophora racemosa resides at the lowest and most frequently flooded point of the tidal zone, Avicennia germinans occupies the middle to upper tidal zone, where the duration of flooding is the shortest, and Rhizophora mangle is located at the intermediary between these two ecological conditions. Although they vary in their respective abundance, these three species constitute the mangrove plant formations in Senegal and can be separated into three relatively homogeneous entities. The edges of channels or mudflats that are very frequently submerged are occupied by a dense, high formation made up solely of Rhizophora spp. and dominated by Rhizophora racemosa. Then, a low and dense mangrove is dominated by Rhizophora mangle. Finally, in the rarely flooded tidal zone, an open formation with a lower plant fraction contains a mixture of Rhizophora mangle and Avicennia germinans. A gradient of spectral values is regularly observed locally, which, depending on the indices, seems to reflect this zonation to some extent.
2.2. Satellite Data Acquisition and Preprocessing
The study area is covered by two Landsat image tiles obtained through the US Geological Survey (USGS) with referencing paths of 205 for both regions and rows of 50 and 51 for Saloum and Casamance, respectively. The surface reflectance images are from the USGS Collection 2 Level 2 and were produced using the LaSRC and LEDAPS algorithms for the Landsat 8 OLI and Landsat 7 ETM+ data, respectively (Table 1). Both image sets were corrected for atmospheric effects. Panchromatic images of the area were acquired on the same dates and were taken from Collection 2 Level 1, because they were not included in Collection 2 Level 2. Two Landsat 8 OLI images were acquired on 18 December 2018 for the end date of the diachronic study, and two Landsat ETM+ images were acquired on 8 December 2000 for the initial date. The month of December was chosen, because it allowed us to work with images in the absence of cloud cover and in temporal proximity to the rainy season (from June to September). There is a gradient in the reflectance of the NIR (Near infrared: 0.775–0.90 μm) from east to west, which increases as the dry season progresses and provides a finer discrimination of mangrove vegetation formations. The images were mosaicked and then cut to obtain the two distinct and complete mangrove estuaries.
2.3. Pansharpening
The mangrove vegetation formations are patches, each with its own morphological characteristics. The high and dense mangrove, often located on the edge of the channel, is a long and narrow strip of vegetation. It rarely exceeds several dozens of metres in depth on the foreshore. From this point of view, the Landsat data at a 30-m resolution are too coarse to discriminate the patches of high and dense mangrove on the edge of the channel with an OBIA approach. However, an OBIA approach using Sentinel-2 images at 10 m has shown some robustness [40]. A compromise was therefore found by using pansharpening fusion method to obtain images at a 15-m resolution.
The IHS (Intensity–Hue–Saturation) method was chosen for its speed of implementation and the good results that it generates in subsequent calculations of spectral indices, such as the NDVI [41]. In addition, it was important to use a method that incorporates spectral and spatial information by adding rather than multiplying for the calculation of normalised spectral indices [41]. Although the panchromatic band does not cover such a large spectral range, pansharpening was carried out over all spectral bands of the Landsat 7 ETM+ and Landsat 8 OLI.
2.4. Isolating the Mangrove
An OBIA approach solely on mangrove pixels was used in this study in order to maximise the spectral contrast between the mangrove formations. To this end, unsupervised classification was used to group the images into five classes: water, mangrove, mudflats, unwooded dryland and wooded dryland. Water and mudflats were designated as separate classes, because they conditioned the sampling of the segmentation regions and were used for spectral demixing. The classification of wooded and non-wooded land within the mainland made it possible to separate certain pixels that did not present a strong contrast between the mudflats and dense mangrove, respectively. Four spectral indices were created, which accelerated the classification process of the different masks due to their contrasting spectral responses to the different discriminated surface states (Figure 2). The NDVI (Normalized Difference Vegetation Index), NDWI (Normalized Difference Water Index), MNDWI (Modified Normalized Difference Water Index) and NDBI (Normalized Difference Built Index) were calculated with the following equations:
2.5. Stacked Unsupervised Classification
The mangroves in the Saloum and Casamance were mapped using unsupervised classification with the ISODATA algorithm. The discrimination of mangrove surfaces was optimised using stacked classifications [50]. The spectral index allowed a relatively precise initial classification and the extraction of the initial masks. The masks were used as the basis of principal component analysis, allowing for increased contrasts and discrimination by a second ISODATA classification of the components. These “subclasses” were also analysed with the spectral curve to confirm that they were classified into the correct land use type, and if necessary, they were reallocated in a reclassification process. The results of the classifications were used to extract a binary image (mask) of the mangrove surfaces, which was used to calculate the vegetation fraction and to implement the OBIA approach using these pixels alone.
2.6. Linear Spectral Unmixing and Plant Fraction
The spectral signatures and indices calculated for the mangrove mask highlight local differences that reflect the zonation of mangrove plant formations. The NDVI proved to be efficient way to represent this distribution. Beyond its local structure, a longitudinal regional structure was observed. Locally, for each plant formation, the NDVI decreased along the tidal zones. The physiognomy of the vegetation changed from east to west and influenced the NDVI values. Therefore, two different vegetation formations can have the same NDVI value depending on their location within the estuary. Furthermore, as mentioned by references [38,46], the NDVI is strongly dependent on atmospheric and weather conditions prior to imaging, which can bias the discrimination of plant formations. These two studies obtained the best correlation of the vegetation fraction by performing linear spectral unmixing (LSU) and canopy closure calculation. The vegetation fraction is derived from the decomposition of the pixels and their fractional cover of each extremity member. The typology of the mangrove plant formations chosen here has a component that depends on the degree of closure and justifies the choice for LSU. Furthermore, the values obtained for the vegetation fraction are less dependent on the environmental conditions and allow for greater reproducibility over time.
To obtain the plant fraction and quantify the degree of mangrove canopy closure, two steps were necessary. First, representative pure spectra were selected as endmembers e.g., non-turbid dark water, salt flats with maximum moisture characteristics and mangrove areas of maximum photosynthetic activity. Then, the reflectance of the pixels was decomposed according to these spectra to quantify the proportion of endmembers in each pixel.
2.7. Endmember Selection
Through endmember selection, the LSU assumes that the values of pixels can be modelled by the linear combination of different land cover spectra. Here, it is assumed that a vegetation formation can be discriminated by its vegetation fraction, which, in mangroves, is related to its water and mud fractions. Three endmembers were therefore retained: water, mangrove and mudflats. Two difficulties had to be considered in their selection. First, the endmembers must have radiometric characteristics at the extremes of the pure spectra, and second, the indicators used to select them must be simple in order to ensure their reproducibility over time. From this point of view, the pure spectra of vegetation were identified according to the maximum NDVI value of the mangrove pixels. The maximum NDWI value, calculated for the mask, was obtained for the pure mudflat spectra. The gradient of NDWI values on mudflats is closely related to their submersion duration [51]. Finally, a six-class classification of the water mask was performed, and pixels with spectral signatures with the lowest mean reflectance were extracted for the pure water spectrum. These pixels correspond to very deep water with no signs of turbidity.
2.8. OBIA
The use of an OBIA approach is therefore necessary to discriminate the three mangrove plant formations: zonation of the three formations is present in the east and west of the Saloum and Casamance, whereas the local gradients are not always as pronounced along the longitudinal axis. These slight local variations cannot be discriminated by pixel approaches, whereas OBIA approaches using image segmentation methods can distinguish between these different objects.
The Watershed algorithm of Terrset 18.21 software was chosen to perform segmentation for two reasons. First, mangrove vegetation varies along the tidal zone and environmental gradients. Therefore, a contour-based approach can be used to quantify these transitions via a gradient image and to thereby obtain data that inform the choice of region merging thresholds. Second, region-based approaches are very effective for highly textured, high-resolution images in which transitions in luminance values are very progressive, which is not the case with images at a resolution of 15 m.
The images from the LSU vegetation fraction calculation show much more pronounced local contrasts than the NDVI. This leads to very little change in the number of segments generated at different scale parameters. The Watershed algorithm first calculates the gradient image (the variance image in the case of IDRISI Terrset) and then delineates the regions from the local minima, where the dividing line is formed by high variance values. The algorithm makes it possible to merge the regions by applying a tolerance criterion. Here, no merging was carried out because the contrasts made it possible to obtain objects that were sufficiently dissimilar to reveal distinct vegetation formations, thus limiting the constraints imposed by a resolution of 15 m.
The regions were then selected to train a supervised classification algorithm. The KNN (k-nearest neighbour algorithm) was used in this work. KNN obtained better kappa than Random Forest or Maximum Likelihood classifiers. It was therefore chosen for the classification.
The classification of plant formations was evaluated by selecting regions and comparing them with very-high-resolution Google Earth (GE) image.
In this work, we identified mangrove plant formations as follows:
- -
- High riverine mangrove dominated by Rhizophora racemose: High mangrove.
- -
- Low and dense mangrove dominated by Rhizophora mangle: Low and dense mangrove.
- -
- Low and open mangrove with mixed Rhizophora mangle and Avicennia germinans: Low and open mangrove.
Mangrove plant formations have different characteristics, mainly related to the height, degree of canopy closure and heterogeneity of plant cover and colour. These attributes are identifiable in a very-high-resolution image and allow for photointerpretation (Figure 3). However, the lack of very-high-resolution images for the year 2000 prevented the comparison and validation of the 2000 maps. The kappa index could only be calculated for images of 2018 for comparison with Google Earth (GE) image.
To overcome this obstacle and select training plots for the supervised image classification for the year 2000, stable regions between 2000 and 2018 were selected. The advantage of the LSU is that it is less sensitive to phenology than the NDVI [52]. Although few studies have tested the seasonal effect of the vegetation fraction index at a single site, we assumed that if a region has not experienced any change in its vegetation cover density, then it is highly unlikely that the vegetation formation had changed. First, the segments with same spatial shape and extension on both scenes need to be found. Second, these areas should not have undergone significant changes in their vegetation cover. Therefore, the difference in the vegetation fraction was calculated to highlight areas of stability that have neither opened nor closed canopies. Segments with a difference in vegetation fraction between −0.10 (negligible decrease) and 0.10 (negligible increase) were retained. They can therefore be considered the stable vegetation formations between 2000 and 2018. Finally, within such segments, a random selection was led, but only within those whose vegetation remained identifiable in the 2018 very-high-resolution imagery (Figure 4). We performed a random partition for the training and validation segments of the classification (Table 2).
The flowchart in Figure 5 compiles the different steps of the methodological chain.
2.9. Mapping of Spatiotemporal Trajectories
The different changes mapped remained difficult to read on a regional-scale map and did not reveal the dynamic processes at work in the mangrove. Consequently, a mapping based on the local frequency and the relative share of each important change in local dynamics was undertaken. Thus, within a 5-km resolution grid, the pixel density of each transition class, as well as its percentage contribution, was calculated.
3. Results
3.1. Accuracy Assessment
The accuracies for the Saloum (Table 3) and Casamance (Table 4) mangroves are 80% and 83%, respectively (Table 5). According to reference [53], these values indicate good discrimination. The classifications are therefore acceptable in the Saloum and Casamance. These Kappa indices were calculated only on the 2018 validation plots identified on Google Earth (GE) as very-high-resolution images. Nevertheless, the contributions of the vegetation formations to the overall accuracy are different between these two areas. In both cases, the low and dense mangrove accounts for most of the errors. There are 27% errors of omission in Saloum and 13% in Casamance. The errors of commission are 13% for Saloum and 9% for Casamance. Its interface, in the mid tidal zone, is probably the cause. In Saloum, the major confusion is at its interface with the high and dense mangrove of the shore. However, the low and dense mangrove is mainly confused not with the high mangrove of the channel edge in the Saloum but with the low open and mixed mangrove in Casamance. In Casamance, the errors are equally divided between the two plant formations at the interface. In addition, the open and mixed lowland mangrove obtains almost equivalent discrimination scores on the two maps.
The plots of the ground truths of the changes could hardly be inventoried. In this work, the ground truth plots were collected only in 2018 by the photo interpretation of Google Earth (GE) images. Ground truth plots are derived from the objects detected with the OBIA approach. These are of variable sizes, making it difficult to partition them by proportions. We have chosen to randomly select the objects used for training and validation. The partitioning of the dataset was also done randomly. The purpose of Table 6 is to assess the uncertainty of the results due to the sampling. We followed the recommendations of Olosfon et al. (2014) [54] to evaluate the accuracy and confidence intervals of the map classes.
The margins of uncertainty are large for the high and dense mangrove class but remain smaller for the low and dense mangrove class and the low and open mangrove class. The smallest margins of uncertainty are for the classes that are most involved in the change maps developed in this study.
3.2. Contribution of Each Formation to Overall Change
3.2.1. Reorganisation of Surfaces
Since the 2000s, mangrove areas have increased in the two main hydrosystems of Senegal. There has been an increase of 5330 hectares of mangrove area in the Saloum delta and 11,614 hectares in the Casamance estuary. These increases are the result of the difference between surface area gains and losses. The Saloum mangrove has experienced a loss of 2996 hectares of its surface area. In Casamance, the loss amounts to 5118 hectares. The rates of change in mangrove surface area between 2000 and 2018 reached 8.4% for the Saloum and 17.25% for Casamance. Of these changes, the colonisation of mudflats between the two dates represented 87% of the increase in surface area in Saloum (Figure 6), while the closure of bolongs, new sedimentations and flooded mudflats contributed to 10% of the new mangrove gains. In Casamance, the proportion of spatial expansion on stable mudflats was calculated to be 56% and 34% for the closure of bolongs (saltwater channel, characteristic of the mangrove areas of Senegal or Gambia) or the colonisation of new sedimentations and flooded mudflats (Figure 6).
The Saloum mangrove is therefore experiencing a significant increasing trend in mudflats at the interface with the salt flats. This is also the case in Casamance but to a lesser extent. In fact, the colonisation on mudflats located at the lower tidal zone represents a significant proportion of the increase.
Moreover, within the mangroves of Senegal, the modalities of the increases differ. Indeed, the mangrove plant formations do not contribute to the same degree to the changes observed in Casamance and the Saloum (Figure 7). The low and dense mangrove is undergoing major gain in the Saloum. It occupied one-third of the mangrove area in 2000 and now occupies half of it. Conversely, low and open mangrove was the main plant formation in 2000 (51%) and is currently 25% of the mangrove area in the Saloum. In Casamance, the low and dense mangrove has undergone a moderate increase, from 36% to 40% of the mangrove surface.
3.2.2. Conversion of Surfaces
The matrix of changes provides a more detailed understanding of this spatial reorganisation. The results indicate that the densification of low and open mangrove patches is one of the main factors (Table 7 and Table 8) that explain the overall dynamics of change in the regeneration process in both regions. However, this densification is more prevalent in the Saloum, accounting for more than 20% of the observed changes, whereas it amounts to 15% in Casamance. However, the latter also shows much greater gains in low and open mangrove (13.5%) compared to Saloum (6.5%). The opening of the canopy remains low and relatively similar between the mangrove plant formations of the two regions. The opening of the low and dense mangrove is more important in Casamance. A final difference between the two regions involves the stable surface areas of the low and open mangrove. In the mapping of the changes, they are around 15% in Saloum compared to a little more than 20% in Casamance. It is thus necessary to understand the extent to which these stable nuclei have contributed to the dynamics of the spatial expansion of the mangroves in the hydrosystems.
3.3. Spatial Analysis of Changes
3.3.1. Summary Maps of Regeneration
The quantitative analysis shows contrasting dynamics between Saloum and Casamance. First, the colonisation of the high mangrove is uniform in Casamance, whereas it only concentrated in the north-western part of Saloum (Supplementary Materials). This colonisation seems to be taking place on the mudflats available at the edge of the channels. Lower Casamance seems to have available mudflats with moderate salinity throughout its estuary. Saloum appears to have newly viable mudflats only in the region that has experienced marine water intrusion and sedimentary inputs related to the break-up of the Sangomar spit.
The spatial expansion of the low and open mangrove has had an increasingly important contribution to a south–north gradient in Saloum and to a downstream–upstream gradient for Casamance (Figure 8). The low and open mangrove constitutes an indicator of mangrove fronts at the interface with the salt flats, because it has a low degree of canopy closure, which may be indicative of a young mangrove or one at the limits of its habitat. North of Saloum appears to be a suitable place for mangrove colonisation. The mangroves present in the south of Sine–Saloum are becoming denser and are colonising very few new mudflats. Low and open mangrove often occupies the largest proportion of the plant formations contributing to the spatial expansion of the mangrove in the upstream areas of the estuary.
Finally, the densification of the mangrove, i.e., the transition from low and open mangrove to low, dense mangrove, intensifies along an upstream–downstream gradient in the Casamance estuary, unlike in Saloum, where densification has a uniform distribution and substantially contributes to the resilience of the mangrove.
3.3.2. Path Dependence
In this paper, the spatiotemporal dynamics of the mangrove was assessed by a transition matrix but, also, by spatial analysis and mathematical morphology. In addition to quantitative changes, treatments sought to measure the extent to which the previous spatial structure of the mangrove conditioned the dynamics of plant formations: the path dependency effect. On the one hand, we measured the percentage of spatial extension of plant formations in contiguity with already present plant formations. On the other hand, we also analysed and quantified through geodetic reconstructions the proportion of each gain in contiguity with pixels where reorganisations in the mangrove were detected. The assumption is made here that the dynamics at work in stable mangrove areas may eventually condition the spatial extension of the mangrove.
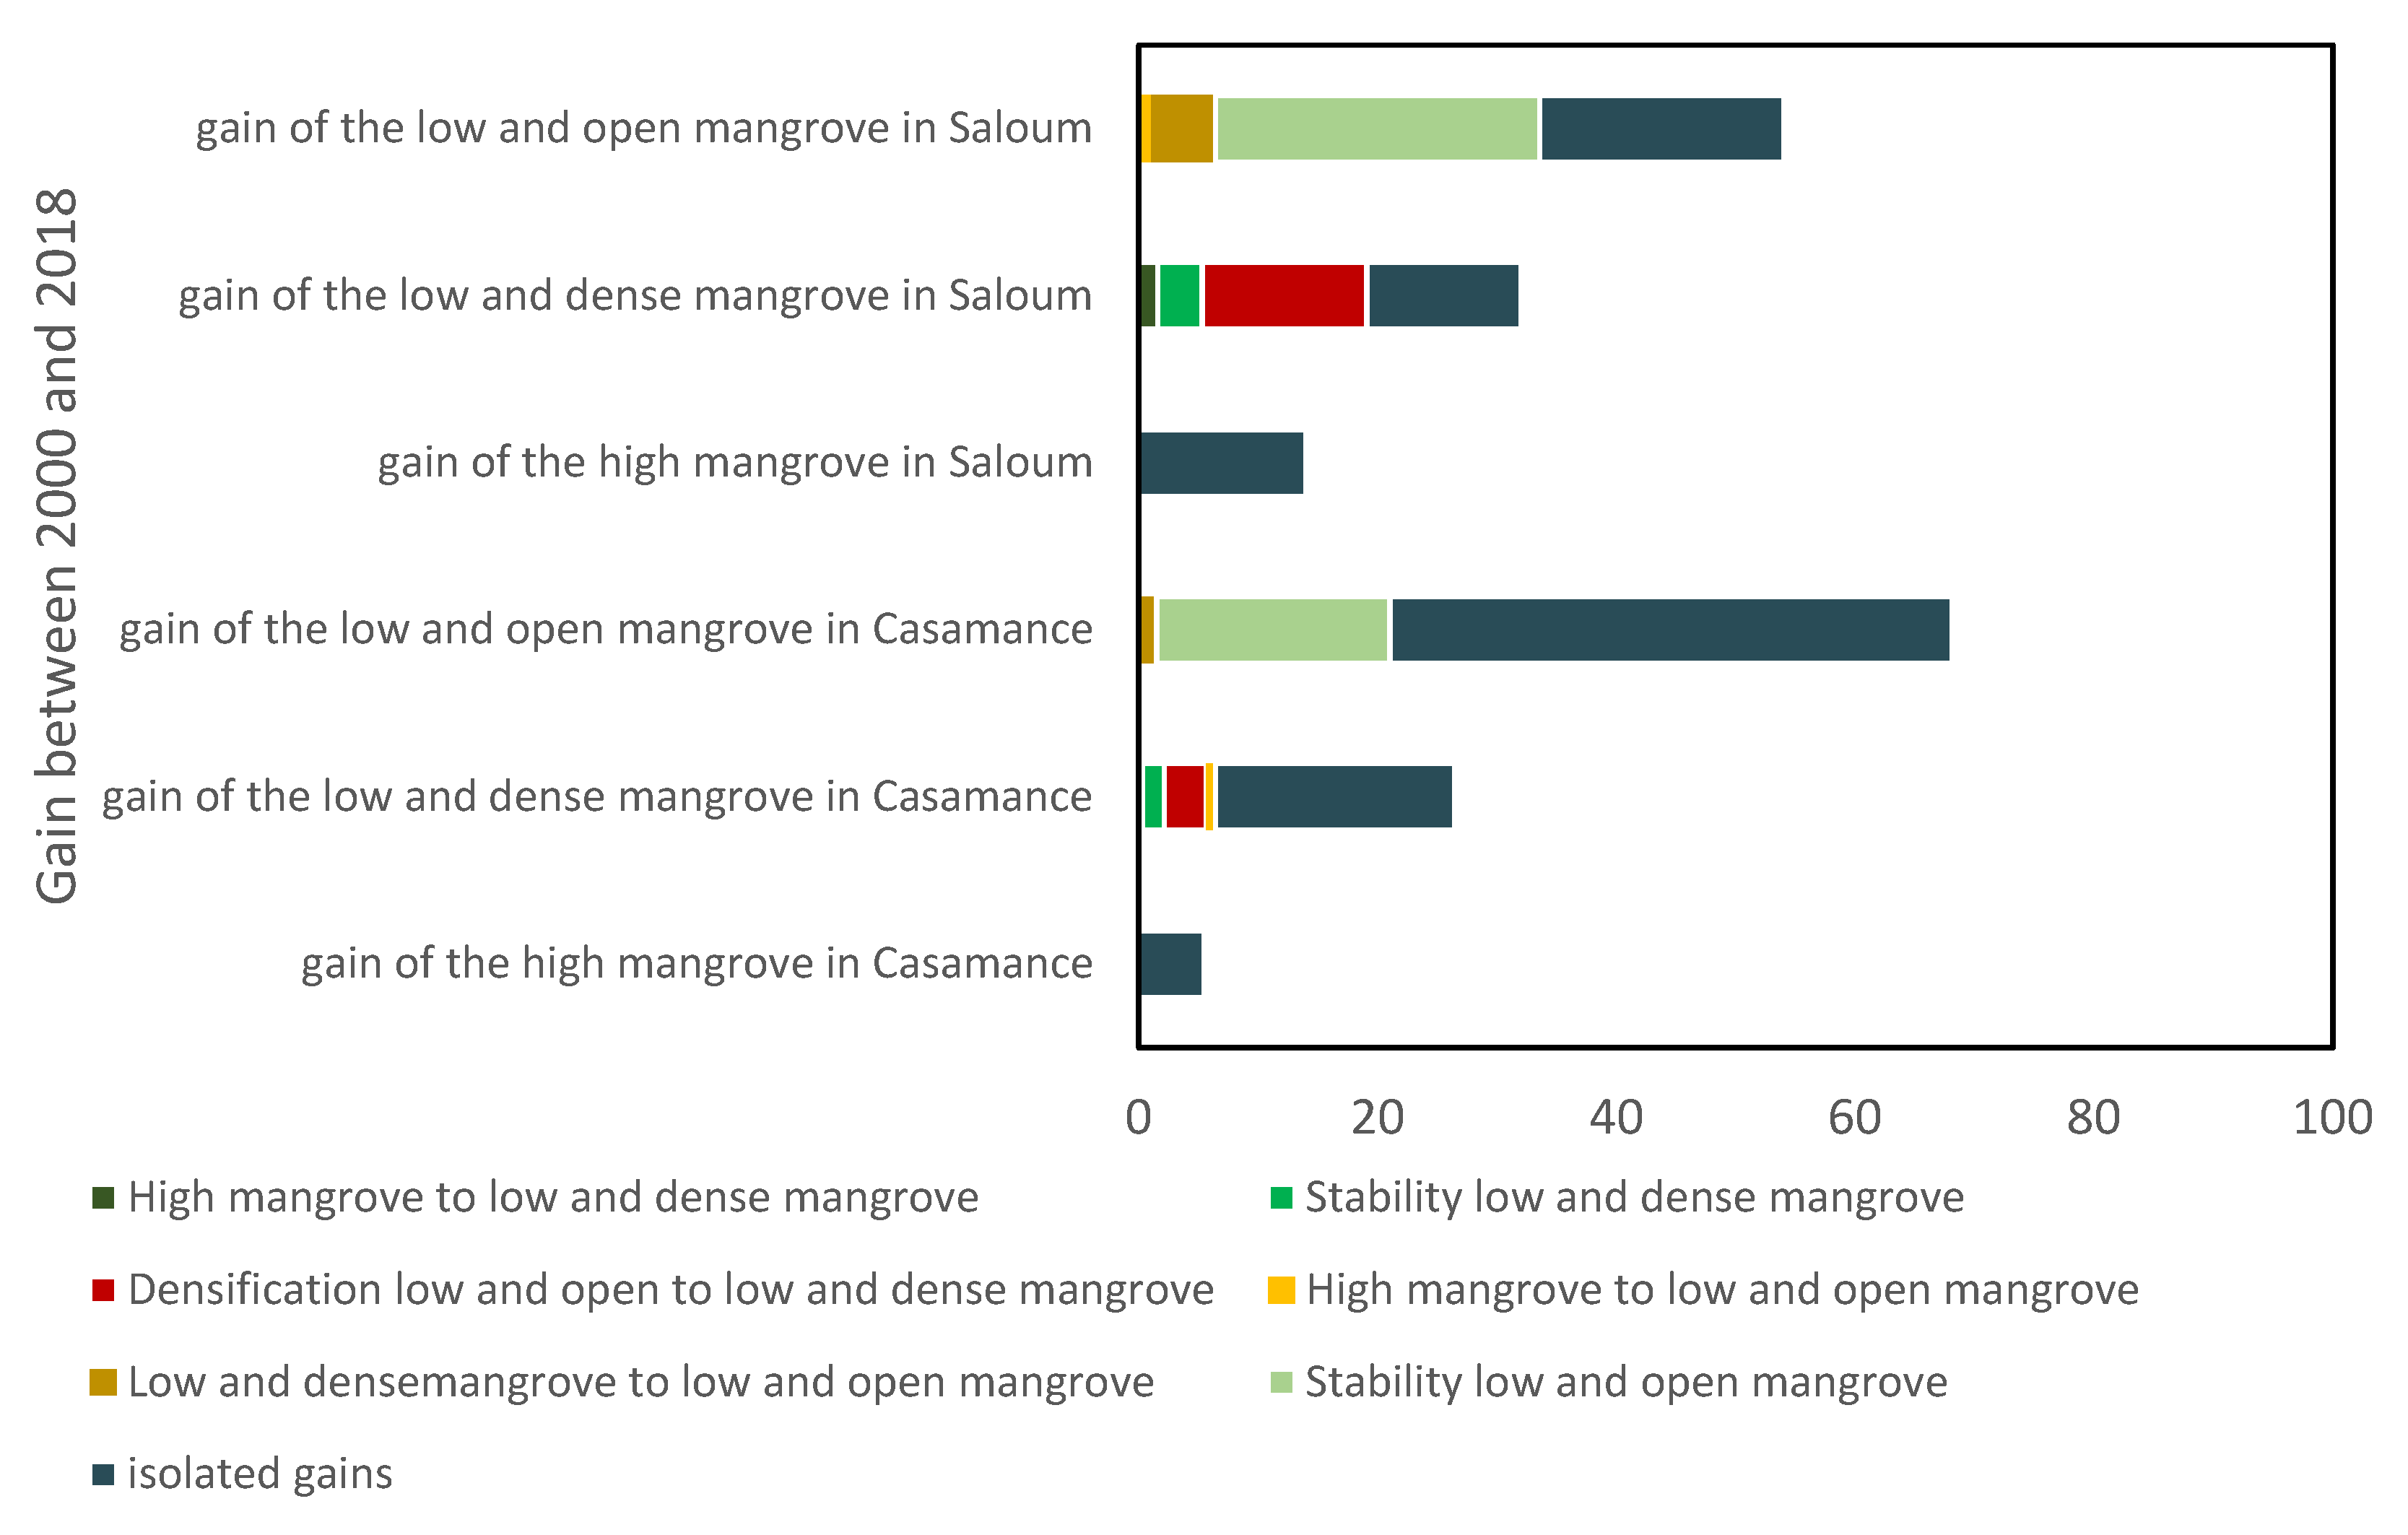
In the majority of cases, the new increase of plant formations is not contiguous with pre-existing plant formations (Figure 9), except for the low and open mangrove in Saloum, which grows essentially in contact with its stable nuclei. The proportion of isolated gains in Casamance (72.5%) is much greater than that in Saloum (47%). Densification has played an important role in the expansion of low and dense mangrove in Saloum (13.75%), whereas it is not the main driving force behind the increase in this same class in Casamance (3.5%). The stable nuclei of the low and open mangrove class seem to significantly constrain the spatial distribution of this class in both Saloum (27.2%) and Casamance (19.50%). The increase in the mangrove area in the latter is therefore mainly conditioned by isolated colonisation or by the propagation of the low and open mangrove front. Saloum is distinguished by similar proportions of isolated and contiguous new gains.
4. Discussion
4.1. Accuracy and Uncertainty Margin
The previous applications of the same method of stacked unsupervised classification using Landsat images resulted in Kappa indices of more than 0.95 for binary mangrove/non-mangrove mapping for Casamance and Saloum [19]. The application of OBIA using merged Landsat images for plant formations mapping resulted in Kappa indices of 0.83 and 0.80 for Casamance and Saloum. These values are satisfactory compared to the results reported in the literature. Indeed, maps of mangrove vegetation formations obtained by supervised or unsupervised pixel classification with images with similar or higher spatial resolutions had lower Kappa indices [37,46]. According to reference [46], OBIA also perform well (Kappa = 0.83) with RapidEye images (6.5 m/RGB + Rededge + Near infrared) and Pleiades MS images (2 m/RGB + Near infrared). OBIA approaches with Landsat images previously produced Kappa indices ranging from 0.54 to 0.67 [47]. In a study using Sentinel-2 images, Lombard et al. [40] obtained Kappa indices around 0.9 to map plant formations over the same region. The Sentinel-2 images seemed to reduce the margin of error by almost 10% compared to the pansharpened Landsat images. Therefore, the Sentinel-2 satellite could be of great help in the future in monitoring mangroves to guide management policies in mangrove countries.
Based on the contrasts that it generates, the vegetation fraction index appears to increase the ability to discriminate vegetation formations in merged Landsat images. Nevertheless, there is a 20% margin of error that requires the qualification of certain classification results. In Saloum, the confusion between high mangrove dominated by Rhizophora racemosa and low, dense mangrove dominated by Rhizophora mangle accounts for 19% of the commission errors for the high mangrove class dominated by Rhizophora racemosa and 27% of the omission errors for the low, dense mangrove class dominated by Rhizophora mangle. Therefore, the densification of Rhizophora mangle, which appears to be the main driver of change in the Saloum, may have been underestimated. However, the misclassification rates remain relatively low for the most dynamic plant formations within the two mangrove regions of Senegal. Indeed, the frequencies of confusion between the low and dense mangrove dominated by Rhizophora mangle and the low and open mangrove remain in the acceptable range. The major finding of this study is the confirmation of mangrove dynamics in upper tidal zone. On the other hand, the results do not eliminate uncertainties linked to the discrimination of the canopy height, which is the basis of the separation of the high mangrove dominated by Rhizophora racemosa and the low and dense mangrove dominated by Rhizophora mangle, particularly in the west of the two regions. However, conclusions about the transitions of these two plant formations are not included in this paper. A way to ensure even more robustness and reduce such inaccuracies could have consisted of a time series analysis, but such method differs significantly from the one used here.
4.2. Summary of Trajectories in the Mangrove Regeneration Process: Densification in the Saloum and Colonisation in Casamance
The mangroves in Senegal experienced undeniable spatial expansion between 2000 and 2018. These results confirm previous findings for both Saloum [20,21,22,54,55] and Casamance [22,30,56,57]. The method implemented in this work was able to quantify changes in mangrove area at a finer level of detail. This mapping revealed contrasting trajectories between Saloum and Casamance.
Vegetation formations do not equally contribute to the increase in surface area in the two hydrosystems: a densification process is mainly observed in Saloum, whereas colonisation plays an important role in Casamance. First, the low and dense mangrove class is characterised by quasi-monospecific coverage by Rhizophora mangle. This plant formation has a high density of individuals and a dense and closed canopy. Conversely, the low and open mangrove class is characterised by a lower density of individuals. Consequently, the transitions observed in this study point to an increase in the density of individuals in Saloum, since the pixels detected as low and open mangrove in 2000 were converted into low and dense mangrove in 2018. This can also be observed in Casamance but to a lesser extent. The reproduction and colonisation of Rhizophora mangle thus appear to be important. The proportion of plant formation in mangrove areas has reversed in Saloum, demonstrating the vitality of Rhizophora mangle, which now occupies most of the delta. This observation is consistent with population dynamics analyses [20]. In Casamance, a densification process is also underway. However, unlike in Saloum, the low and open mangrove remains stable in these proportions, thus demonstrating an active colonisation process.
In Casamance, the contributions of the changes in densification and mangrove increases are almost identical. On the other hand, the contribution of densification to the observed changes is three times higher in Saloum than in Casamance. Therefore, it appears that the conditions in Saloum are favourable to the reproduction of mangroves, since they are able to densify and grow on mudflats. Nevertheless, these much lower proportions of new gain in Saloum raise questions about the degree to which different species contribute to the dynamics of the low and open mangrove class. Indeed, a previous study [34] identified several gaps between sites in the regeneration of Avicennia germinans in Saloum. The only trace of regeneration of the species was stump sprouting. The remote sensing results presented here corroborate these observations on a regional scale. Although Rhizophora mangle is the only species to participate in the progression dynamics in Saloum, it is less active than in Casamance, where two species participate in the surface expansion. Moreover, a large proportion of the increase of low and dense mangrove in Saloum (13.75%) is in contact with the densification nuclei that already occupy about 20% of the mangrove surface area. In Saloum, Rhizophora mangle occupied at least twice as many viable mudflats as Avicennia germinans between 2000 and 2018.
In sum, the results suggest that, in the absence of Avicennia germinans reproduction in Saloum, the low and open mangrove class is experiencing a progressive densification of Rhizophora mangle. This induces a positive feedback loop in which this dense monospecific stand also drives the monospecific colonisation of the mudflats in the absence of sufficient numbers of Avicennia germinans. Furthermore, the significant presence of Avicennia germinans stump sprouting in Saloum [20,34] could explain the significant stability of the low and open mangrove in this region. The mapping of these dynamics supports previous observations at the local and regional scales [20,34]. Consequently, the plant formations mapped in this study can be regarded as the spatial representation of the biological processes at work in the ecosystem. Efforts must now be directed towards understanding these resilience factors, which lead to contrasting trajectories between Saloum and Casamance.
In summary, two differences can be observed in the dynamics that participate in the spatial expansion of the mangroves in Senegal. The first is the proportion of gain of the low and dense mangrove class and, thus, of Rhizophora mangle. In Saloum, the species colonises the mudflats near places where they become dense. In Casamance, the species spreads to places where mangroves were not necessarily present before or grows sporadically, leaving some small discontinuities in the plant cover. The second difference is observed in the respective proportions of isolated new increase in the regions. It is much higher in Casamance than in Saloum.
4.3. Factors in the Dynamics of Plant Formations
The proportion of isolated gain reflects the opportunism of the mangrove or the presence of assisted regeneration. Geodetic reconstructions do not tolerate any pixel discontinuity. Therefore, a gap of 15 m between an existing plant formation and a colonisation causes this increase of surface to be classified as isolated. However, the expansion of mangroves includes not only barochores but, also, hydrochores [58]. The tides can carry propagules to higher positions within tidal zone mudflats, considerably distancing them from the individuals from which they originate [58]. This can explain new gain that is not contiguous with pre-existing plant formations, resulting in the observed discontinuities. These isolated areas of gain can also be an indication of the effects of reforestation programmes. Indeed, in 2000, these practices were common on mudflats devoid of mangroves or in the absence of plant formation [21,59]. In all cases, this progress shows that these areas present viable ecological conditions for the species. Moreover, the colonisation of mudflats occurs by different mechanisms between the two hydrosystems. In Saloum, the mangrove–salt flats interface is the preferred place for the development of mangroves. The absence of fluvial input could explain the low occurrence of accretion zones in the Saloum delta [60,61,62]. Therefore, mangrove area gains can only be made on the available mudflats located precisely at the mangrove-salt flats interface in Saloum. In Casamance, a non-negligible part of the new gain can be observed on mudflats detected as water on one of the two dates. This corroborates the hypothesis that, on the one hand, these mudflats are in the lower tidal zone and, on the other hand, that Casamance is more prone to sedimentary accretion [61,62,63] due to more substantial fluvial input compared to Saloum. The annual mean discharge has been recorded at 24.07 m3 s−1 for Saloum against 71.4 m3 s−1 for Casamance [23].
The great drought period in West Africa caused an increase in salinities, particularly in the mangrove hydrosystems of Senegal [23,63,64]. A lowering of salinities has been observed in recent years in Saloum and Casamance [23]. Nevertheless, higher salinity values have been measured during the rainy season in Saloum in the absence of significant river input [23]. A strong statistical relationship between salinity levels and the deposition capacity of Avicennia germinans propagules in Saloum has been reported [34]. The period of drought [24] led to an opening of the plant cover in the mangrove by the death of certain individuals. On the other hand, the rainfall recovery led to a recolonisation of the mudflats [20] or a filling in of the interstitial spaces, thus causing both a densification of the plant cover and a spatial extension of mangroves. The decrease in the proportions of the low and open mangrove class dominated by Rhizophora mangle and Avicennia germinans in Saloum seems to coincide with the lack of Avicennia germinans reproduction. Moreover, the densification observed by remote sensing supports the hypothesis of a monospecific stand dynamic for Rhizophora mangle, which is apparently able to reproduce as suggested [20] in Saloum by a botanical study of progression sites identified by remote sensing. The lack of Avicennia germinans regeneration allows a more competitive species to colonise environments with high salinity levels, which are lower than those during the drought period but higher than those in Casamance. The colonisation observed in Casamance by remote sensing is in line with field observations that showed a balanced age pyramid. It would therefore seem that the lower salinity levels in Casamance, since the rainfall recovery in the mid-1990s has enabled the reproduction of Avicennia germinans and Rhizophora mangle, which could explain the colonisation mapped in this study. In Saloum, our results show the emergence of a different regional dynamic that prompts further analysis of the biological processes in the delta. Furthermore, the significant densification of Rhizophora mangle, as well as its considerably restricted spatial expansion in Saloum compared to that in Casamance, supports the hypothesis of an absence of satisfactory environmental conditions for the reproduction of Avicennia germinans on a regional scale [20,34]. It is therefore necessary to gain a more detailed understanding of the links between fluctuating environmental conditions and the success (or lack thereof) of the seedling processes that underlie the population dynamics of mangrove species.
5. Conclusions
The objective of this study was to monitor mangrove plant formations in Senegal between 2000 and 2018. Using an OBIA approach with images of the vegetation fraction resulting from linear demixing, a more detailed quantification of the dynamics at work in Senegalese mangroves was carried out. These mangroves have experienced an increase in their surface area. Nevertheless, the trajectory of Senegalese mangroves differs between areas. The results suggest that the different species making up these formations have disparate successes of reproduction and diffusion. A clear increase in low and dense mangrove and substantial changes from low and open mangrove to low and dense mangrove demonstrate that the mangrove densification of Rhizophora mangle is due, in part, to the failure of Avicennia germinans to reproduce. This process shows that, despite the absence of Avicennia germinans reproduction, the Saloum mangrove exhibits significant resilience, which, moreover, does not seem to benefit from significant regeneration, which had an estimated contribution of 4% [20]. However, the frequency of stable cores of low and open mangrove remains low in the northern three-quarters of Saloum. The hypothesis verified in this work and emanating from field observations [20,34] is corroborated by this remote sensing study at the regional scale. The biological processes at the local scale seem to cause a reorganisation of the mangrove at the regional scale. This suggests that gaps in Avicennia germinans regeneration may eventually prevent the mangrove from continuing its progression on the upper tidal zone in Saloum. The regeneration gaps of Avicennia germinans impact the expansion of the Saloum mangrove, which raises the question of the relevance of reforestation policies that are based mainly on the genus Rhizophora spp. and that are mainly undertaken in Casamance. It would therefore seem appropriate to reassess conservation policies in Senegalese mangroves. First, reforestation in Saloum does not seem to be effective and should target Avicennia germinans as a priority. Second, as the mangroves are showing resilience and have increased in surface areas, optimising reforestation policies could eventually lead to sustainable forestry in the Senegalese mangrove instead of the current restrictive policy. Although strict conservation and wilderness reserve approaches have proven their worth in many regions, it is still useful to explore other paths to achieving conservation through sustainable management of the resources. The diachronic mapping established in this work could be used to monitor the evolution of plant formations corresponding to landscape elements that are perceived and managed as resources by local societies.
Supplementary Materials
The following are available online at https://www.mdpi.com/article/10.3390/rs13101961/s1, KML vector files.
Author Contributions
Conceptualization, F.L. and J.A.; methodology, F.L.; writing—original draft preparation, F.L. and J.A.; writing—review and editing, J.A and F.L.; visualization, F.L and J.A. and supervision, J.A. All authors have read and agreed to the published version of the manuscript.
Funding
This research received no external funding.
Institutional Review Board Statement
Not applicable.
Informed Consent Statement
Not applicable.
Data Availability Statement
Data have been made available in Supplementary Materials.
Acknowledgments
We thank MDPI’s language editing services for grammatical, spelling and other common error corrections.
Conflicts of Interest
The authors declare that they have no known competing financial interests or personal relationships that could have appeared to influence the work reported in this paper.
References
- Friess, D.A.; Rogers, K.; Lovelock, C.E.; Krauss, K.W.; Hamilton, S.E.; Lee, S.Y.; Lucas, R.; Primavera, J.; Rajkaran, A.; Shi, S. The State of the World’s Mangrove Forests: Past, Present, and Future. Annu. Rev. Environ. Resour. 2019, 44, 89–115. [Google Scholar] [CrossRef] [Green Version]
- Lee, S.; Hamilton, S.; Barbier, E.; Primavera, J.; Lewis, R. Better restoration policies are needed to conserve mangrove ecosystems. Nat. Ecol. Evol. 2019, 3, 870–872. [Google Scholar] [CrossRef] [PubMed]
- Otero, V.; Van De Kerchove, R.; Satyanarayana, B.; Mohd-Lokman, H.; Lucas, R.; Dahdouh-Guebas, F. An analysis of the early regeneration of mangrove forests using landsat time series in the Matang mangrove forest reserve, Peninsular Malaysia. Remote Sens. 2020, 11, 774. [Google Scholar] [CrossRef] [Green Version]
- Duke, N.C.; Meynecke, J.-O.; Dittmann, S.; Ellison, A.M.; Anger, K.; Berger, U.; Cannicci, S.; Diele, K.; Ewel, K.C.; Field, C.D.; et al. A World Without Mangroves? Science 2007, 317, 41–42. [Google Scholar] [CrossRef] [PubMed] [Green Version]
- IPBES. Global Assessment Report on Biodiversity and Ecosystem Services of the Intergovernmental Science-Policy Platform on Biodiversity and Ecosystem Services; Brondizio, E.S., Settele, J., Díaz, S., Ngo, H.T., Eds.; IPBES secretariat: Bonn, Germany, 2019. [Google Scholar]
- Donato, D.C.; Kauffman, J.B.; Murdiyarso, D.; Kurnianto, S.; Stidham, M.; Kanninen, M. Mangroves among the most carbon-rich forests in the tropics. Nat. Geosci. 2011, 4, 293–297. [Google Scholar] [CrossRef]
- Alongi, D.M. Introduction in the Energetics of Mangrove Forests; Springer Science and Business Media BV: New York, NY, USA, 2012. [Google Scholar]
- Friess, D.A.; Yando, E.S.; Abuchahla, G.M.O.; Adams, J.B.; Cannicci, S.; Canty, S.W.J.; Wee, A.K.S. Mangroves give cause for conservation optimism, for now. Curr. Biol. 2020, 30, R153–R154. [Google Scholar] [CrossRef] [Green Version]
- Saenger, P. Mangrove Ecology, Silviculture and Conservation; Kluwer Academic Publishers: Dordrecht, Netherlands, 2002; pp. 11–18. [Google Scholar]
- Spalding, M.; Kainuma, M.; Collins, L. World Atlas of Mangroves; A Collaborative Project of ITTO, ISME, FAO, UNEP-WCMC, UNESCO-MAB, UNU-INWEH and TNC. 2010; Earthscan: London, UK, 2010; p. 319. [Google Scholar]
- Gallup, L.; Sonnenfeld, D.A.; Dahdouh-Guebas, F. Mangrove use and management within the Sine-Saloum Delta, Senegal. Ocean Coast. Manag. 2020, 185, 105001. [Google Scholar] [CrossRef] [Green Version]
- Walters, B.B.; Rönnbäck, P.; Kovacs, J.M.; Crona, B.; Hussain, S.A.; Badola, R.; Primavera, J.H.; Barbier, E.; Dahdouh-Guebas, F. Ethnobiology, socio-economics and management of mangrove forests: A review. Aquat. Bot. 2008, 89, 220–236. [Google Scholar] [CrossRef] [Green Version]
- Cormier-Salem, M. Dynamique et Usages de la Mangrove Dans les Pays des Rivières du Sud, du Sénégal à la Sierra Leone; IRD Éditions: Marseille, France, 1991. [Google Scholar] [CrossRef]
- Dahdouh-Guebas, F.; Collin, S.; Seen, D.L.; Rönnbäck, P.; Depommier, D.; Ravishankar, T.; Koedam, N. Analysing ethnobotanical and fishery-related importance of mangroves of East-Godavari Delta (Andhra Pradesh, India) for conservation and management purposes. J. Ethnobiol. Ethnomed. 2006, 2, 24. [Google Scholar] [CrossRef] [Green Version]
- Edwards, P. Aquaculture environment interactions: Past, present and likely future trends. Aquaculture 2015, 447, 2–14. [Google Scholar] [CrossRef]
- FAO. The World’s Mangroves 1980–2005; Étude FAO: Rome, Italy, 2007. [Google Scholar]
- Bryan-Brown, D.N.; Connolly, R.M.; Richards, D.R. Global trends in mangrove forest fragmentation. Sci. Rep. 2020, 10, 7117. [Google Scholar] [CrossRef] [PubMed]
- FAO. Global Forest Resources Assessment 2020: Main Report; FAO: Rome, Italy, 2020. [Google Scholar] [CrossRef]
- Andrieu, J. Land cover changes on the West-African coastline from the Saloum Delta (Senegal) to Rio Geba (Guinea-Bissau) between 1979 and 2015. Eur. J. Remote Sens. 2018, 51, 314–325. [Google Scholar] [CrossRef] [Green Version]
- Andrieu, J.; Lombard, F.; Fall, A.; Thior, M.; Demba Ba, B.; Ephrem, A.; Dieme, B. Botanical field-study and remote sensing to describe mangrove resilience in the Saloum Delta (Senegal) after 30 years of degradation narrative. For. Ecol. Manag. 2020, 461, 117963. [Google Scholar] [CrossRef]
- Dieye, E.H.B.; Diaw, A.T.; Sané, T.; Ndour, N.; Ndour, N. Dynamique de la mangrove de l’estuaire du Saloum (Sénégal) entre 1972 et 2010. Cybergeo Eur. J. Geogr. 2013, doc 629. [Google Scholar] [CrossRef]
- Fent, A.; Bardou, R.; Carney, J.; Cavanaugh, K. Transborder political ecology of mangroves in Senegal and The Gambia. Glob. Environ. Chang. 2019, 54, 214–226. [Google Scholar] [CrossRef]
- Descroix, L.; Sané, Y.; Thior, M.; Manga, S.-P.; Ba, B.D.; Mingou, J.; Mendy, V.; Coly, S.; Dièye, A.; Badiane, A.; et al. Inverse Estuaries in West Africa: Evidence of the Rainfall Recovery? Water 2020, 12, 647. [Google Scholar] [CrossRef] [Green Version]
- Nicholson, S.E. The West African Sahel: A review of recent studies on the rainfall regime and its interannual variability (Article ID 453521). ISRN Meteorol. 2013, 32. [Google Scholar] [CrossRef]
- Mahé, G.; Lienou, G.; Descroix, L.; Bamba, L.; Paturel, J.-E.; Laraque, A.; Meddi, M.; Habaieb, M.; Adeaga, O.; Dieulin, C.; et al. The rivers of Africa: Witness of climate change and human impact on the environment. Hydrol. Process. 2013, 27, 2105–2114. [Google Scholar] [CrossRef]
- Moreno-de las Heras, M.; Díaz-Sierra, R.; Turnbull, L.; Wainwright, J. Assessing vegetation structure and ANPP dynamics in a grassland–shrubland Chihuahuan ecotone using NDVI–rainfall relationships. Biogeosciences 2015, 12, 2907–2925. [Google Scholar] [CrossRef] [Green Version]
- Thoma, D.P.; Munson, S.M.; Irvine, K.M.; Witwicki, D.L.; Bunting, E.L. Semi-arid vegetation response to antecedent climate and water balance windows. Appl. Veg. Sci. 2016, 19, 413–429. [Google Scholar] [CrossRef]
- Zhou, J.; Jia, L.; Menenti, M.; Van Hoek, M.; Lu, J.; Zheng, C.; Wu, H.; Yuan, X. Characterizing vegetation response to rainfall at multiple temporal scales in the Sahel-Sudano-Guinean region using transfer function analysis. Remote Sens. Environ. 2021, 252, 112108. [Google Scholar] [CrossRef]
- Holling, C.S. Adaptive Environmental Assessment and Management; John Wiley and Sons: Chichester, UK, 1978. [Google Scholar]
- Conchedda, G.; Durieux, L.; Mayaux, P. An object-based method for mapping and change analysis in mangrove ecosystems. ISPRS J. Photogramm. Remote Sens. 2008, 63, 578–589. [Google Scholar] [CrossRef]
- Cormier-Salem, M.C. Mangrove Grabbing: An Exploration of Changes in Mangrove Tenure from a Political Ecology Perspective; The Sea within: Maritime Tenure and Cosmopolitical Debates; Artaud, H., Surallés, A., Eds.; IWGIA: Copenhagen, Denmark, 2017; pp. 143–162. [Google Scholar]
- Cormier-Salem, M.-C.; Panfili, J. Mangrove reforestation in question: Greening or grabbing coastal zones and deltas? Afr. J. Aquat. Sci. 2016, 41, 89–98. [Google Scholar] [CrossRef]
- Arumugam, M.; Niyomugabo, R.; Dahdouh-Guebas, F.; Hugé, J. The perceptions of stakeholders on current management of mangroves in the Sine-Saloum Delta, Senegal, Estuarine. Coast. Shelf Sci. 2021, 248, 107160. [Google Scholar] [CrossRef]
- Lombard, F.; Andrieu, J.; Descroix, L. La population d’Avicennia germinans du delta du Saloum est-elle relictuelle depuis la dernière période humide? Bois et Forêts des Trop. 2020, 346, 51–64. [Google Scholar] [CrossRef]
- Giri, C.; Ochieng, E.; Tieszen, L.L.; Zhu, Z.; Singh, A.; Loveland, T.; Masek, J.; Duke, N. Status and distribution of mangrove forests of the world using earth observation satellite data. Glob. Ecol. Biogeogr. 2011, 20, 154–159. [Google Scholar] [CrossRef]
- Kuenzer, C.; Bluemel, A.; Gebhardt, S.; Quoc, T.V.; Dech, S. Remote Sensing of Mangrove Ecosystems: A Review. Remote Sens. 2011, 3, 878–928. [Google Scholar] [CrossRef] [Green Version]
- Wang, D.; Wan, B.; Qiu, P.; Su, Y.; Guo, Q.; Wang, R.; Sun, F.; Wu, X. Evaluating the Performance of Sentinel-2, Landsat 8 and Pléiades-1 in Mapping Mangrove Extent and Species. Remote Sens. 2018, 10, 1468. [Google Scholar] [CrossRef] [Green Version]
- Taureau, F.; Robin, M.; Proisy, C.; Fromard, F.; Imbert, D.; Debaine, F. Mapping the Mangrove Forest Canopy Using Spectral Unmixing of Very High Spatial Resolution Satellite Images. Remote Sens. 2019, 11, 367. [Google Scholar] [CrossRef] [Green Version]
- Wang, L.; Sousa, W.P.; Gong, P. Integration of object-based and pixel-based classification for mapping mangroves with IKONOS imagery. Int. J. Remote Sens. 2004, 25, 5655–5668. [Google Scholar] [CrossRef]
- Lombard, F.; Andrieu, J.; Josselin, D. Object-oriented classification-based mapping of mangrove zonation in Casamance and Sine-Saloum (Senegal) using Sentinel-2 images. Geo-Spat. Inf. Sci. 2021. submitted for publication. [Google Scholar]
- Johnson, B. Effects of Pansharpening on Vegetation Indices. ISPRS Int. J. Geo-Inf. 2014, 3, 507–522. [Google Scholar] [CrossRef]
- Kasawani, I.; Kim, A.; Shah, A.; Sulong, I.; Ismail, M.H.; Jusoff, K. Coastal Change Detection using GIS in Setiu Lagoon, Terengganu, Malaysia. J. GIS Trends 2010, 1, 20–26. [Google Scholar]
- Yuvaraj, E.; Dharanirajan, K.; Saravanan, N.; Karpoorasundarapandian, N. Evaluation of Vegetation density of the Mangrove forest in South Andaman Island using Remote Sensing and GIS techniques. Int. Res. J. Environ. Sci. 2014, 3, 19–25. [Google Scholar]
- Sari, S.P.; Rosalina, D. Mapping and Monitoring of Mangrove Density Changes on tin Mining Area. Procedia Environ. Sci. 2016, 33, 436–442. [Google Scholar] [CrossRef] [Green Version]
- Myint, S.; Chandra, G.; Wang, L.; Gillette, S. Identifying Mangrove Species and Their Surrounding Land Use and Land Cover Classes Using an Object-Oriented Approach with a Lacunarity Spatial Measure. GISci. Remote Sens. 2008, 45, 188–208. [Google Scholar] [CrossRef]
- Taureau, F. Cartographie Harmonisée des Mangroves de L’outre-Mer Français. Thèse de Doctorat. Sciences de L’environnement; Université de Nantes (UNAM), Nantes, France, 2017. Doctorat Thèse, Sciences de L’environnement. Université de Nantes (UNAM), Nantes, France, 2017. [Google Scholar]
- Bullock, E.L.; Fagherazzi, S.; Nardin, W.; Vo-Luong, P.; Nguyen, P.; Woodcock, C.E. Temporal patterns in species zonation in a mangrove forest in the Mekong Delta, Vietnam, using a time series of Landsat imagery. Cont. Shelf Res. 2017, 147, 144–154. [Google Scholar] [CrossRef]
- Gudex-Cross, D.; Pontius, J.; Adams, A. Enhanced forest cover mapping using spectral unmixing and object-based classification of multi-temporal Landsat imagery. Remote Sens. Environ. 2017, 196, 193–204. [Google Scholar] [CrossRef]
- Descroix, L. Processus et Enjeux D’eau en Afrique de L’ouest Soudano-Sahélienne; EAC: Paris, France, 2018; p. 320. ISBN 978-2-8130-0314-0. [Google Scholar]
- Andrieu, J.; Cormier-Salem, M.C.; Descroix, L.; Diéye, E.H.B.; Ndour, N.; Sané, T. Correctly assessing forest change in a priority West African mangrove ecosystem: 1986–2010 An answer to Carney et al., 2014 paper “Assessing forest change in a priority West African mangrove ecosystem: 1986–2010”. Remote Sens. App. Soc. Environ. 2019, 13, 337–347. [Google Scholar] [CrossRef]
- Datta, D.; Roy, A.K.; Kundu, A.; Dutta, D.; Neogy, S. An alternative approach to delineate wetland influence zone of a tropical intertidal mudflat using geo-information technology. Estuar. Coast. Shelf Sci. 2021, 253, 107308. [Google Scholar] [CrossRef]
- Taureau, F. Evaluation des Données Sentinel Pour la Mise en Place D’un Système de Surveillance des Mangroves à Mayotte; Université de Nantes: Nantes, France, 2018; p. 116. [Google Scholar]
- Landis, J.R.; Koch, G.G. The measurement of observer agreement for categorical data. Biometrics 1977, 33, 159–174. [Google Scholar] [CrossRef] [Green Version]
- Olofsson, P.; Foody, G.M.; Herold, M.; Stehman, S.V.; Woodcock, C.E.; Wulder, M.A. Good practices for estimating area an assessing accuracy of land change. Remote Sens. Environ. 2014, 148, 42–57. [Google Scholar] [CrossRef]
- Sakho, I.; Mesnage, V.; Deloffre, J.; Lafite, R.; Niang, I.; Faye, G. The influence of natural and anthropogenic factors on mangrove dynamics over 60 years: The Somone Estuary Senegal. Estuar. Coast. Shelf Sci. 2011, 94, 93–101. [Google Scholar] [CrossRef]
- Solly, B.; Dièye, E.H.B.; Sané, T.; Diaw, A.T. Dynamique de la Mangrove de Thiobon dans l’estuaire de la Casamance (Sénégal) entre 1972 et 2017. Eur. Sci. J. 2018, 14, 118–133. [Google Scholar] [CrossRef]
- Soumaré, S.; Fall, F.; Andrieu, J.; Marega, O.; Dieme, B. Dynamique spatio-temporelle de la mangrove de Kafountine dans l’estuaire de la Basse-Casamance des années 1972 à nos jours: Approche par télédétection. IOSR J. Eng. (IOSRJEN) 2020, 10, 1–14. [Google Scholar]
- Hogarth, P.J. The Biology of Mangroves and Seagrasses; Biology of Habitats, 2 ed.; Oxford University Press: Oxford, UK, 2007; ISBN 978-0-19-856870-4. [Google Scholar]
- Bassene, O.; Cubizolle, H.; Cormier-Salem, M.C.; Sy, B.A. L’impact des changements démographiques et socio-économiques sur la perception et la gestion de la mangrove en Basse Casamance (Sénégal). Géocarrefour 2013, 88, 299–315. [Google Scholar] [CrossRef]
- Barusseau, J.-P.; Diop, E.S.; Saos, J.-L. Evidence of dynamics reversal in tropical estuaries, geomorphological and sedimentological consequences (Salum and Casamance Rivers, Senegal). Sedimentology 1985, 32, 543–552. [Google Scholar] [CrossRef]
- Diop, E.S. La Côte Ouest Africaine du Saloum (Sénégal) à la Mellacorée (République de Guinée). Ph.D. Thesis, Université Louis Pasteur, Strasbourg, France, 1990. [Google Scholar]
- Marius, C. Mangroves du Sénégal et de la Gambie. Ecologie, Pédologie, Géochimie, Mise en Valeur et Aménagement. Ph.D. Thesis, Louis Pasteur Strasbourg University, Strasbourg, France, 1985; p. 335. [Google Scholar]
- Diouf, A.C. Dynamiques Des Ressources Naturelles et Adaptations Des Sociétés Dans la Réserve de Biosphère du Delta du Saloum au Sénégal. Ph.D. Thesis, Université Gaston Bergé, Dakar, Senegal, 2019. [Google Scholar]
- Olivry, J.-C. Les conséquences durables de la sécheresse actuelle sur l’écoulement du fleuve Sénégal et l’hypersalinisation de la Basse-Casamance. In Influence of Climate Change and Climatic Variability on the Hydrologie Regime and Water Resources; IAHS Publisher: Wallingford, UK, 1987. [Google Scholar]
Figure 1.
Location of mangroves in the Saloum delta (1) and Casamance estuary (2) and areas of study. The red and black rectangles represent the spatial extent of the Landsat. The yellow rectangles represent the spatial extent of the two mangrove areas.
Figure 1.
Location of mangroves in the Saloum delta (1) and Casamance estuary (2) and areas of study. The red and black rectangles represent the spatial extent of the Landsat. The yellow rectangles represent the spatial extent of the two mangrove areas.
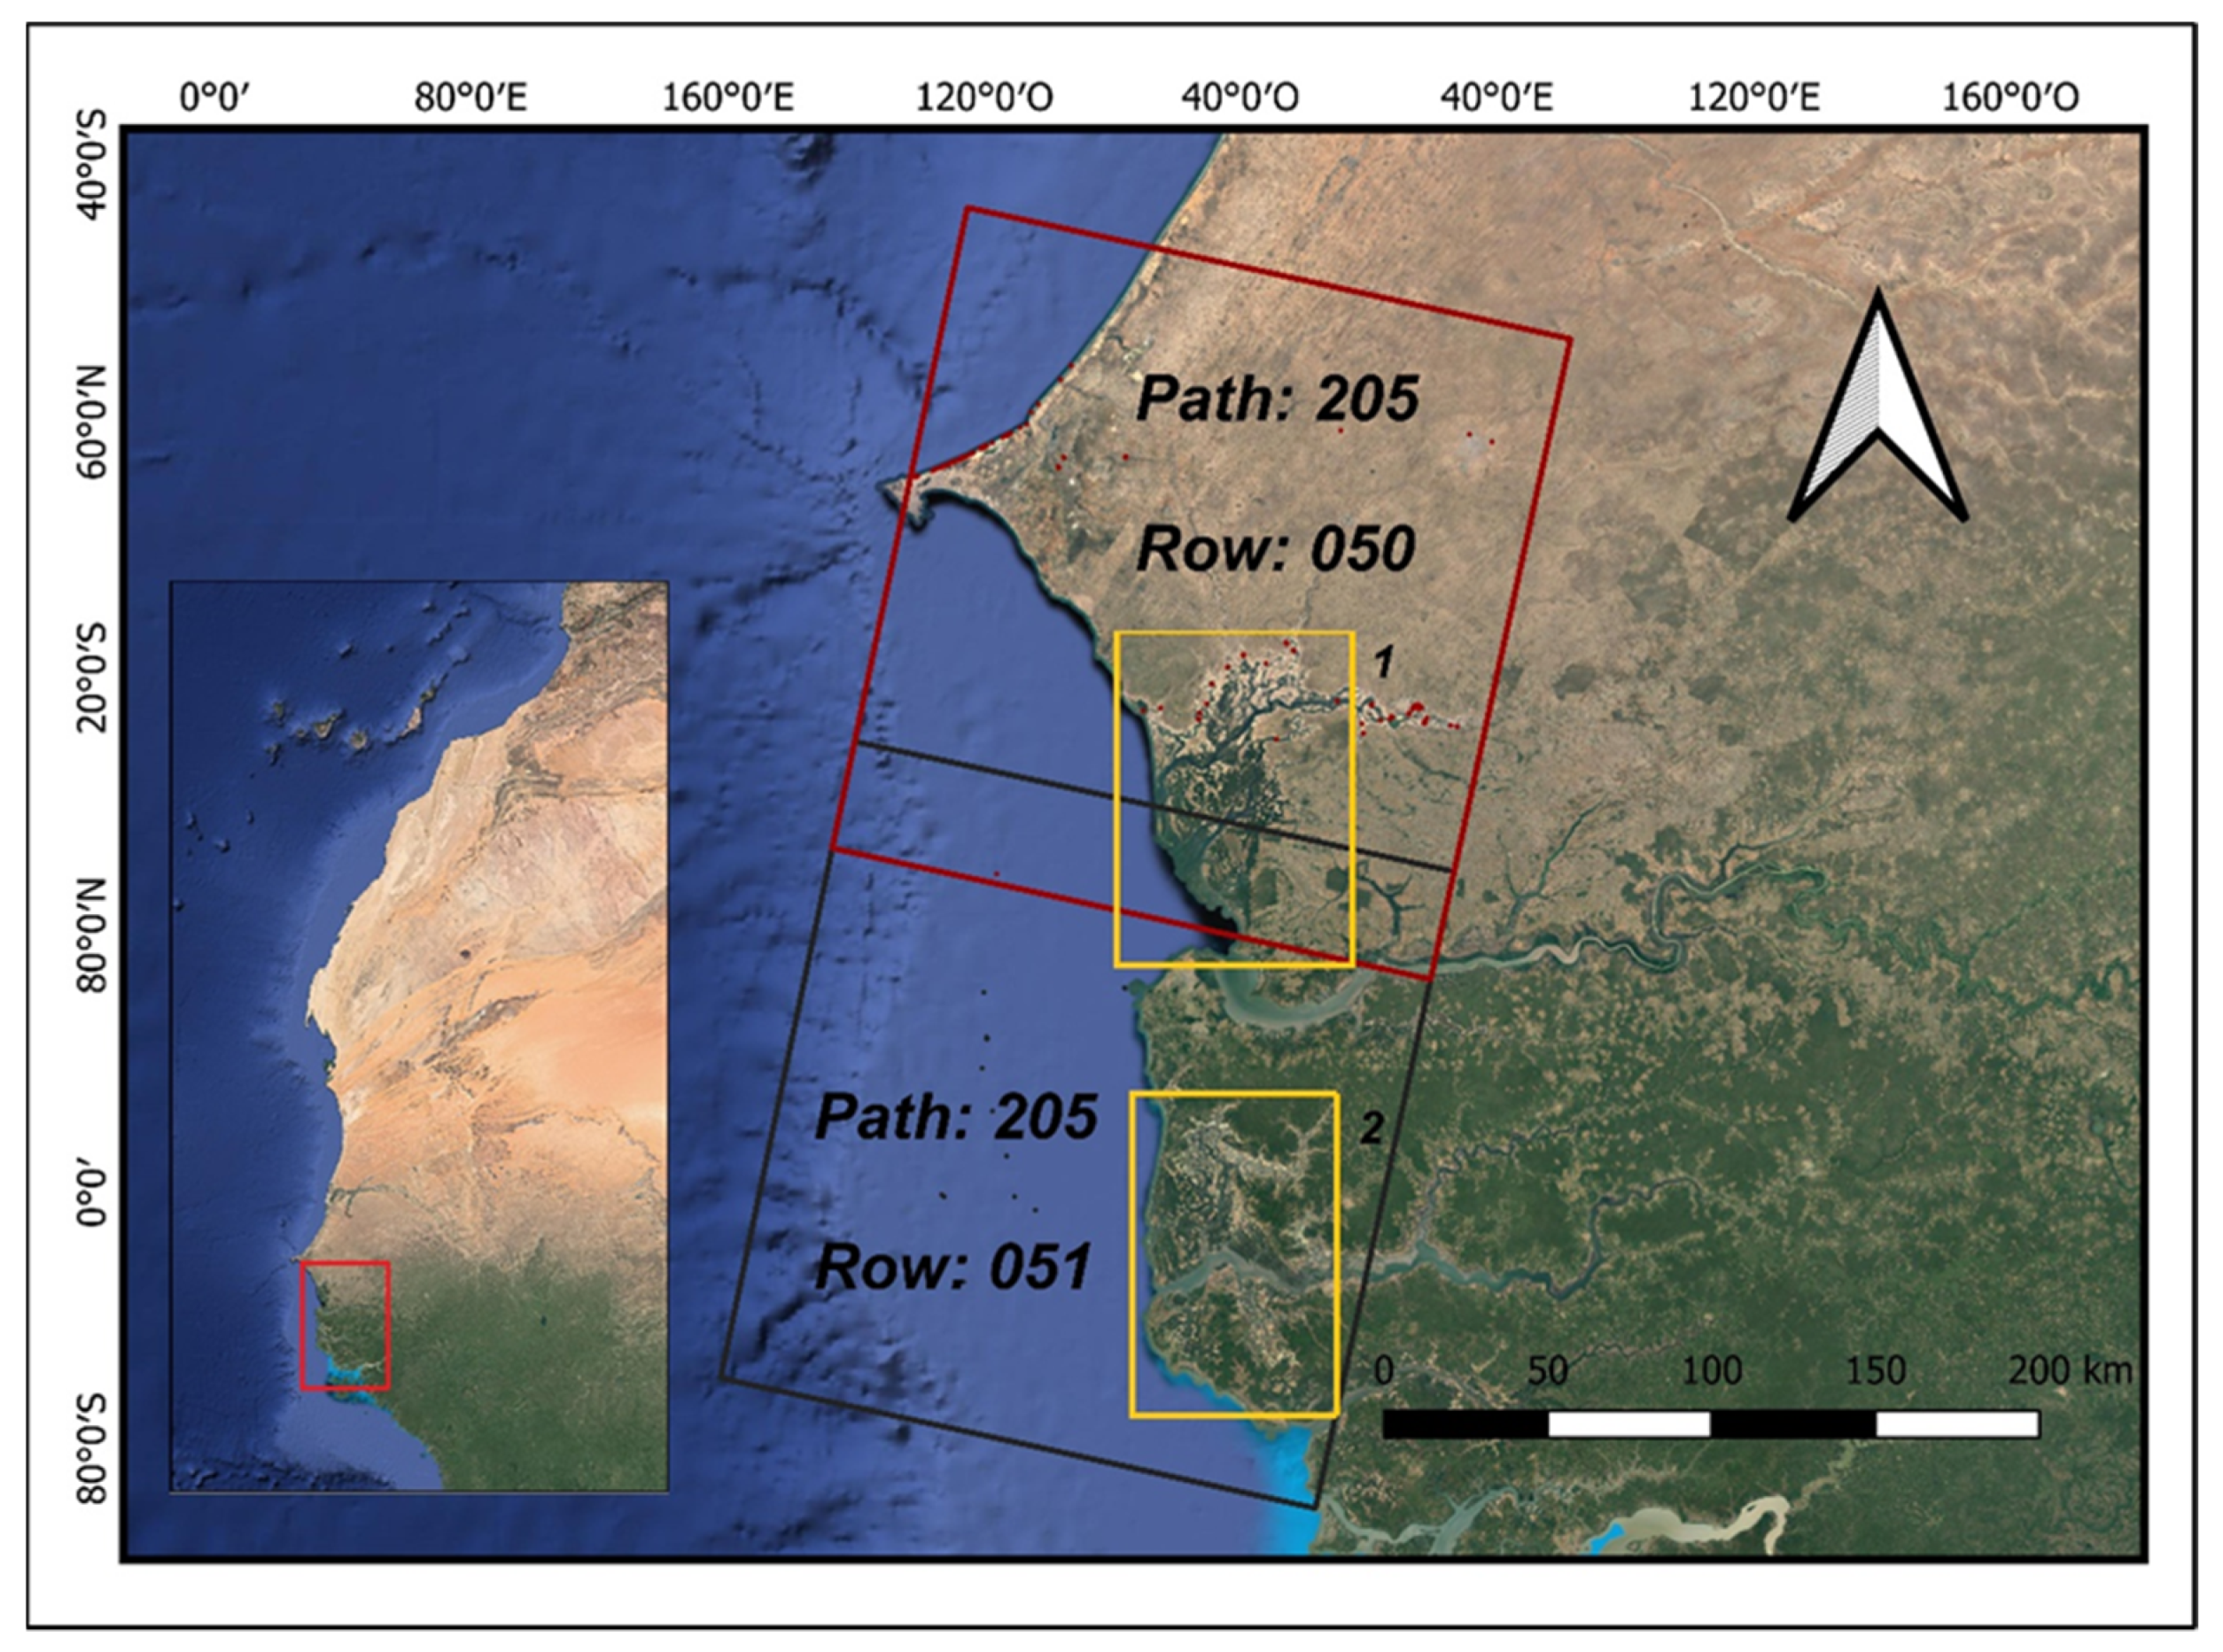
Figure 2.
Spectral signature of the five land cover classes. The spectral signatures were calculated on each Landsat scene, on both dates and on each area. The values on the y-axis represent the average reflectance for each class.
Figure 2.
Spectral signature of the five land cover classes. The spectral signatures were calculated on each Landsat scene, on both dates and on each area. The values on the y-axis represent the average reflectance for each class.
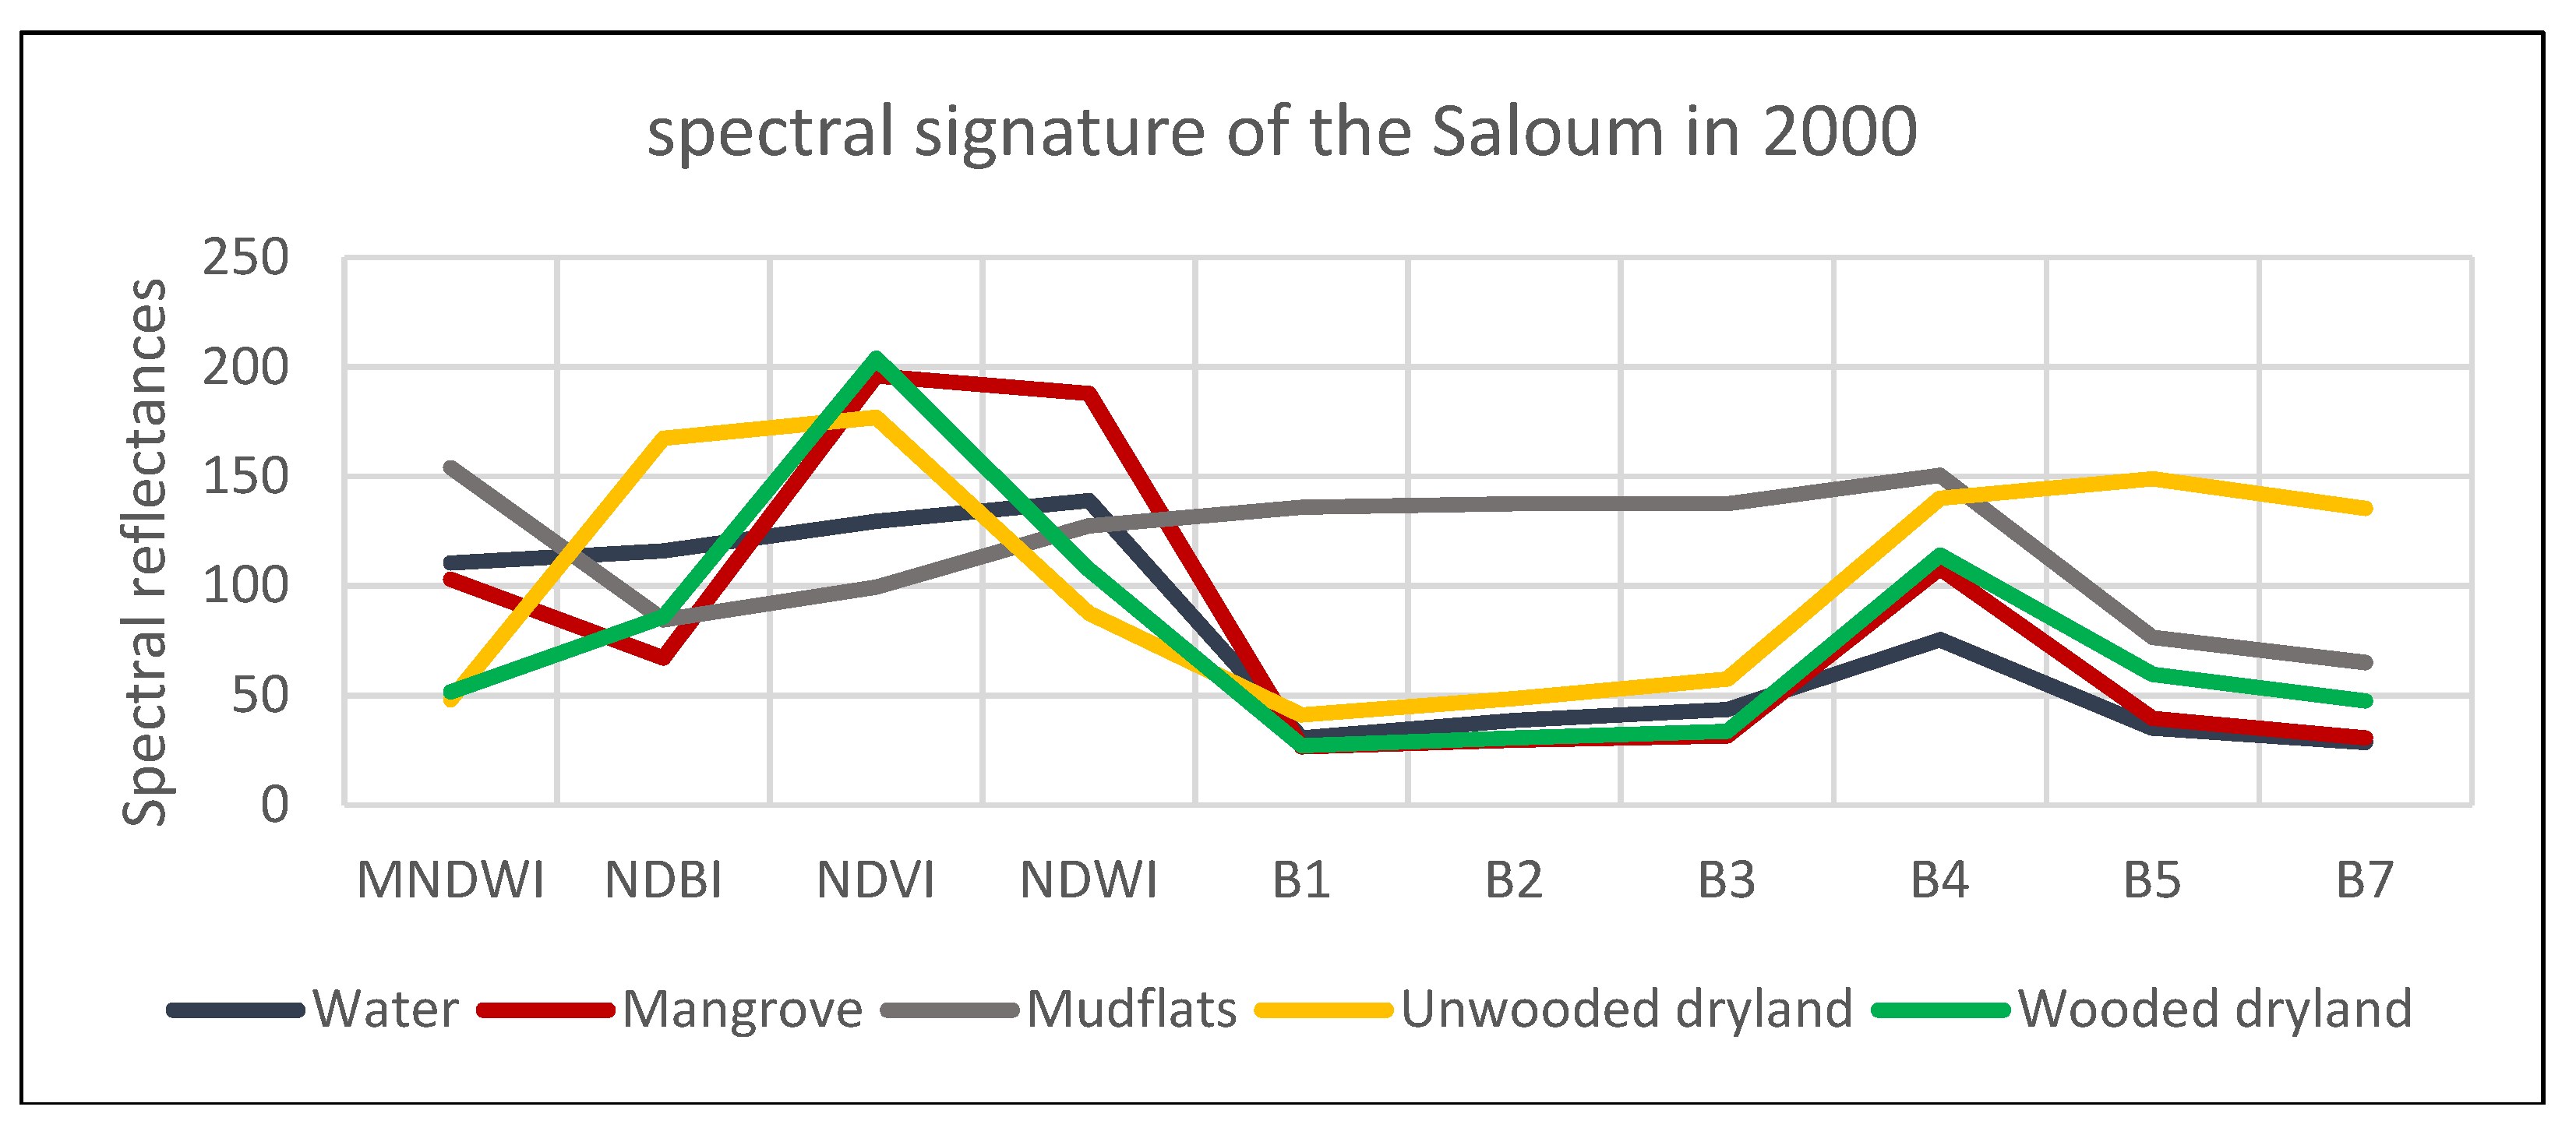
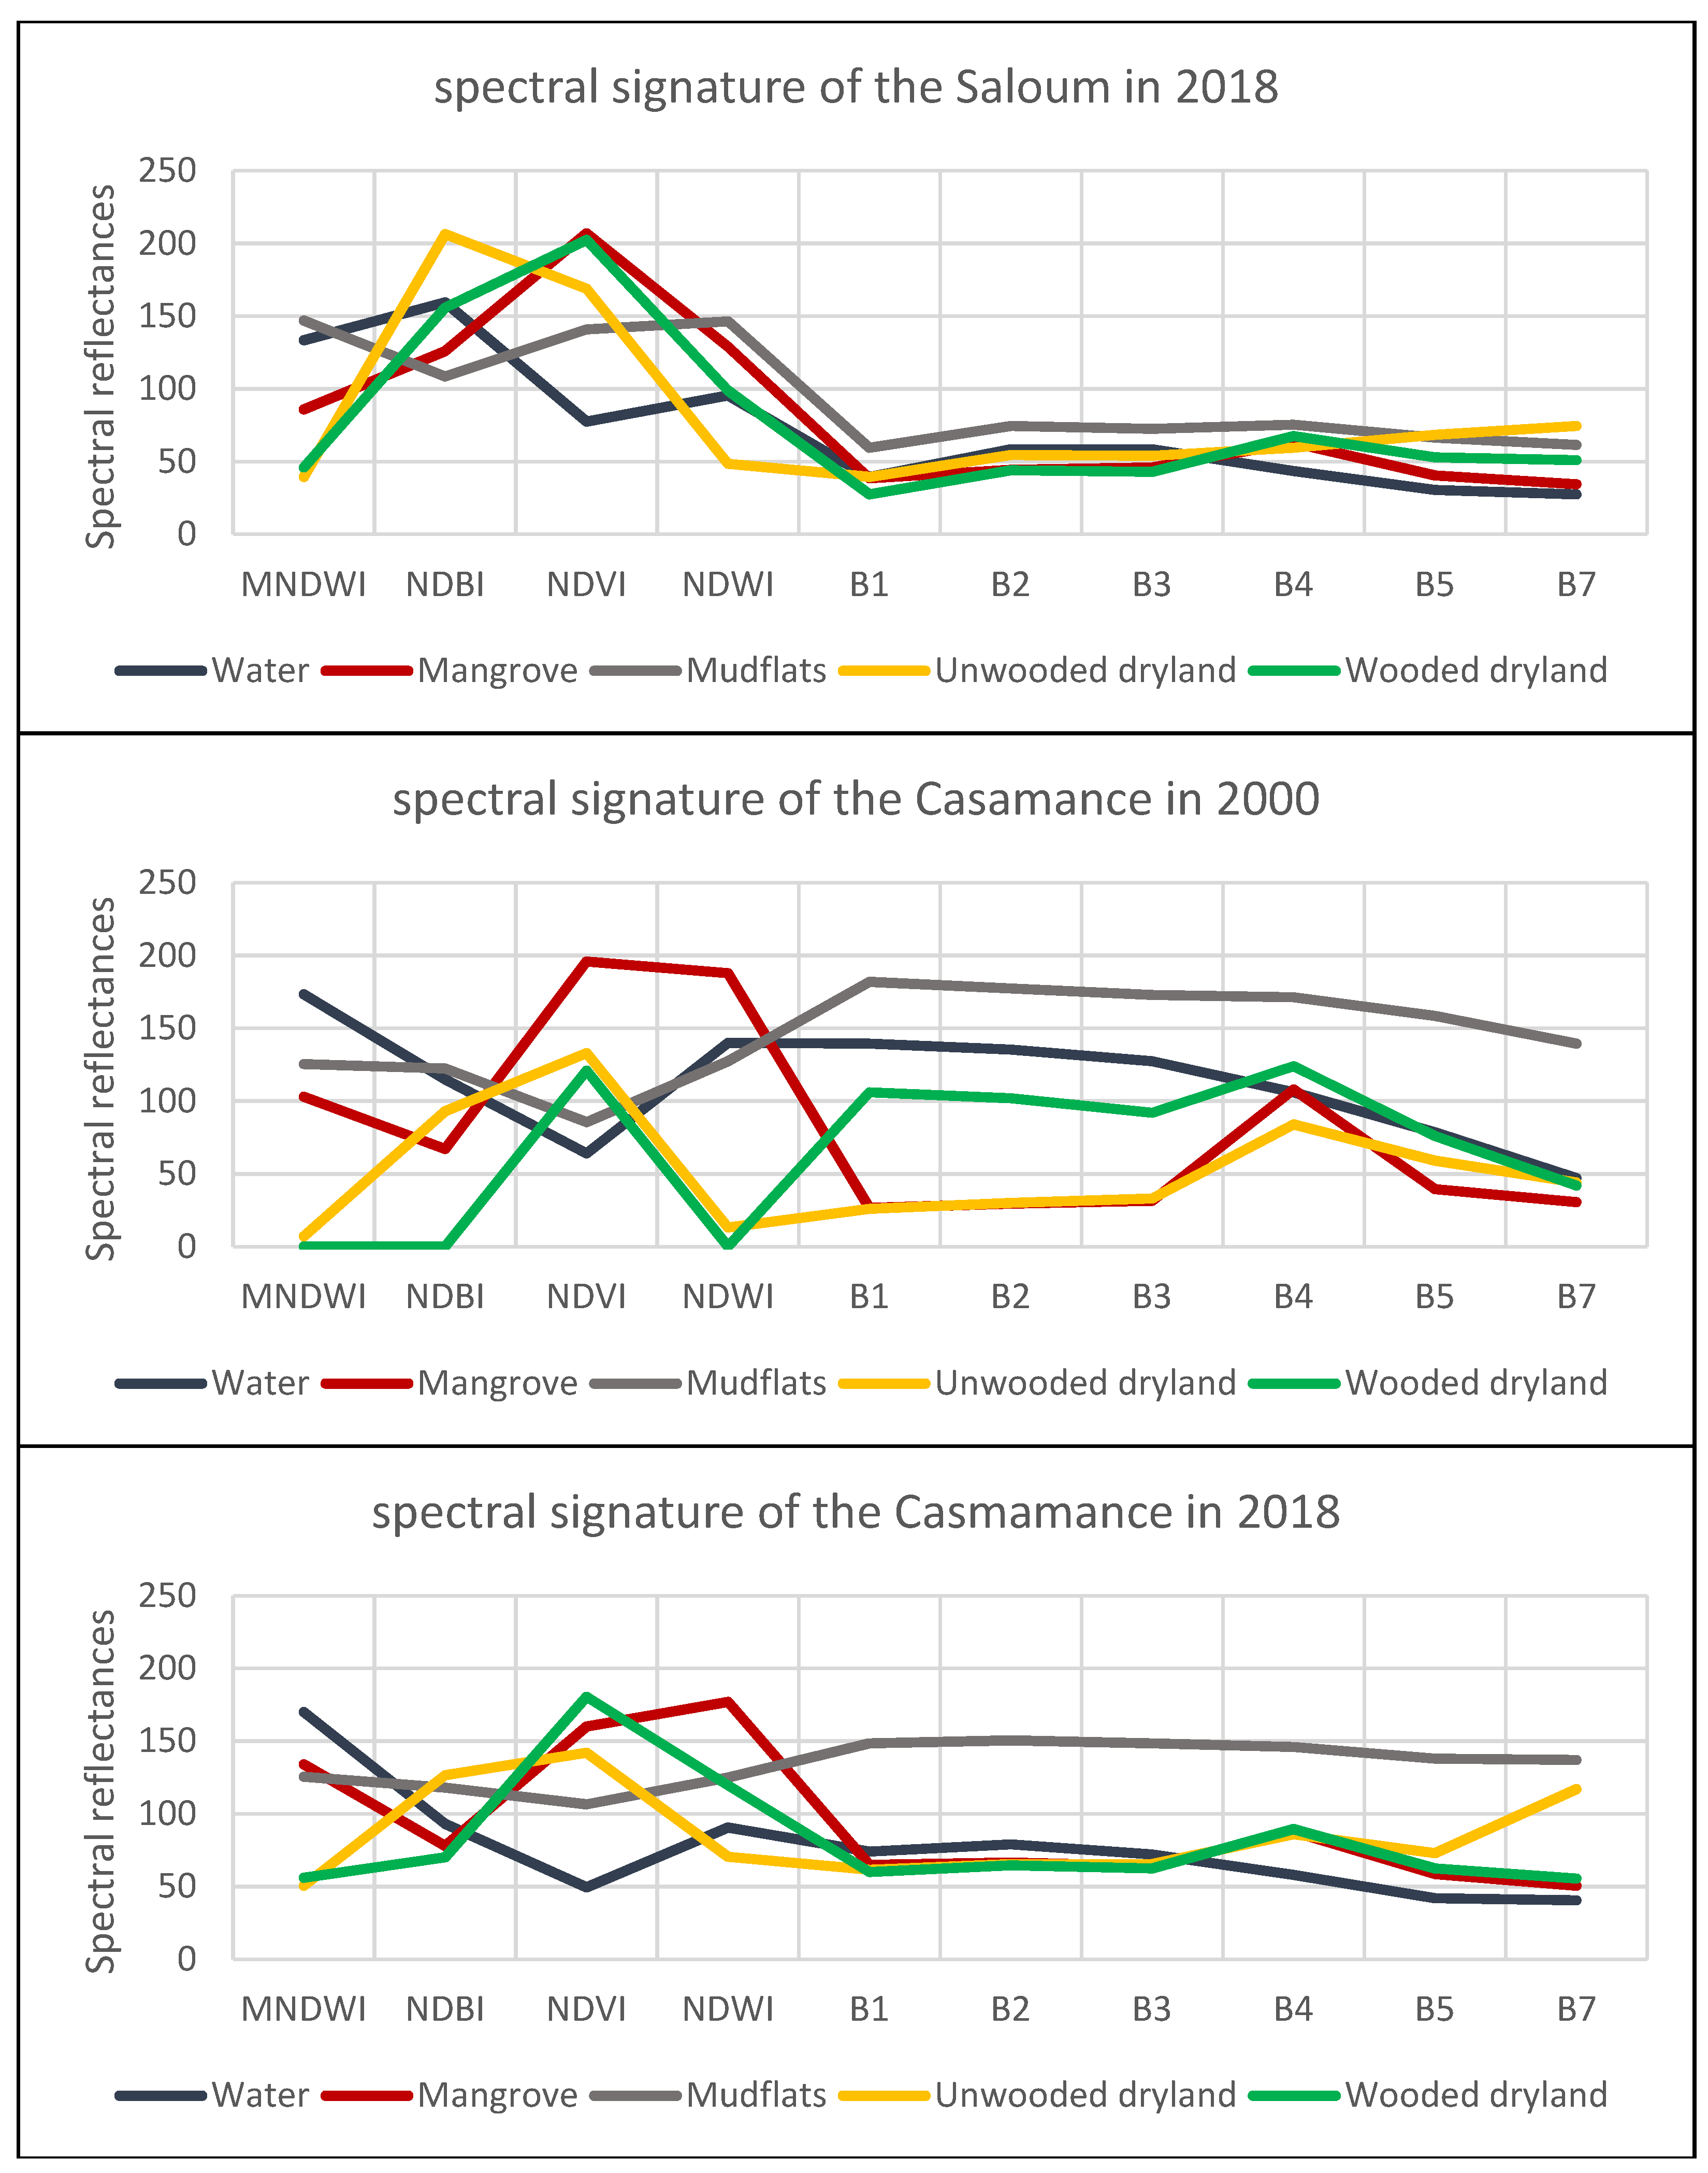
Figure 3.
Very-high-resolution Google Earth (GE) image for the photointerpretation of the three vegetation formations. The top is a zonation in the Saloum, and the bottom is in Casamance. The red line symbolizes the interface between dense high mangrove and dense low mangrove. The white line symbolizes the interface between the low and dense mangrove and the low and open mangrove.
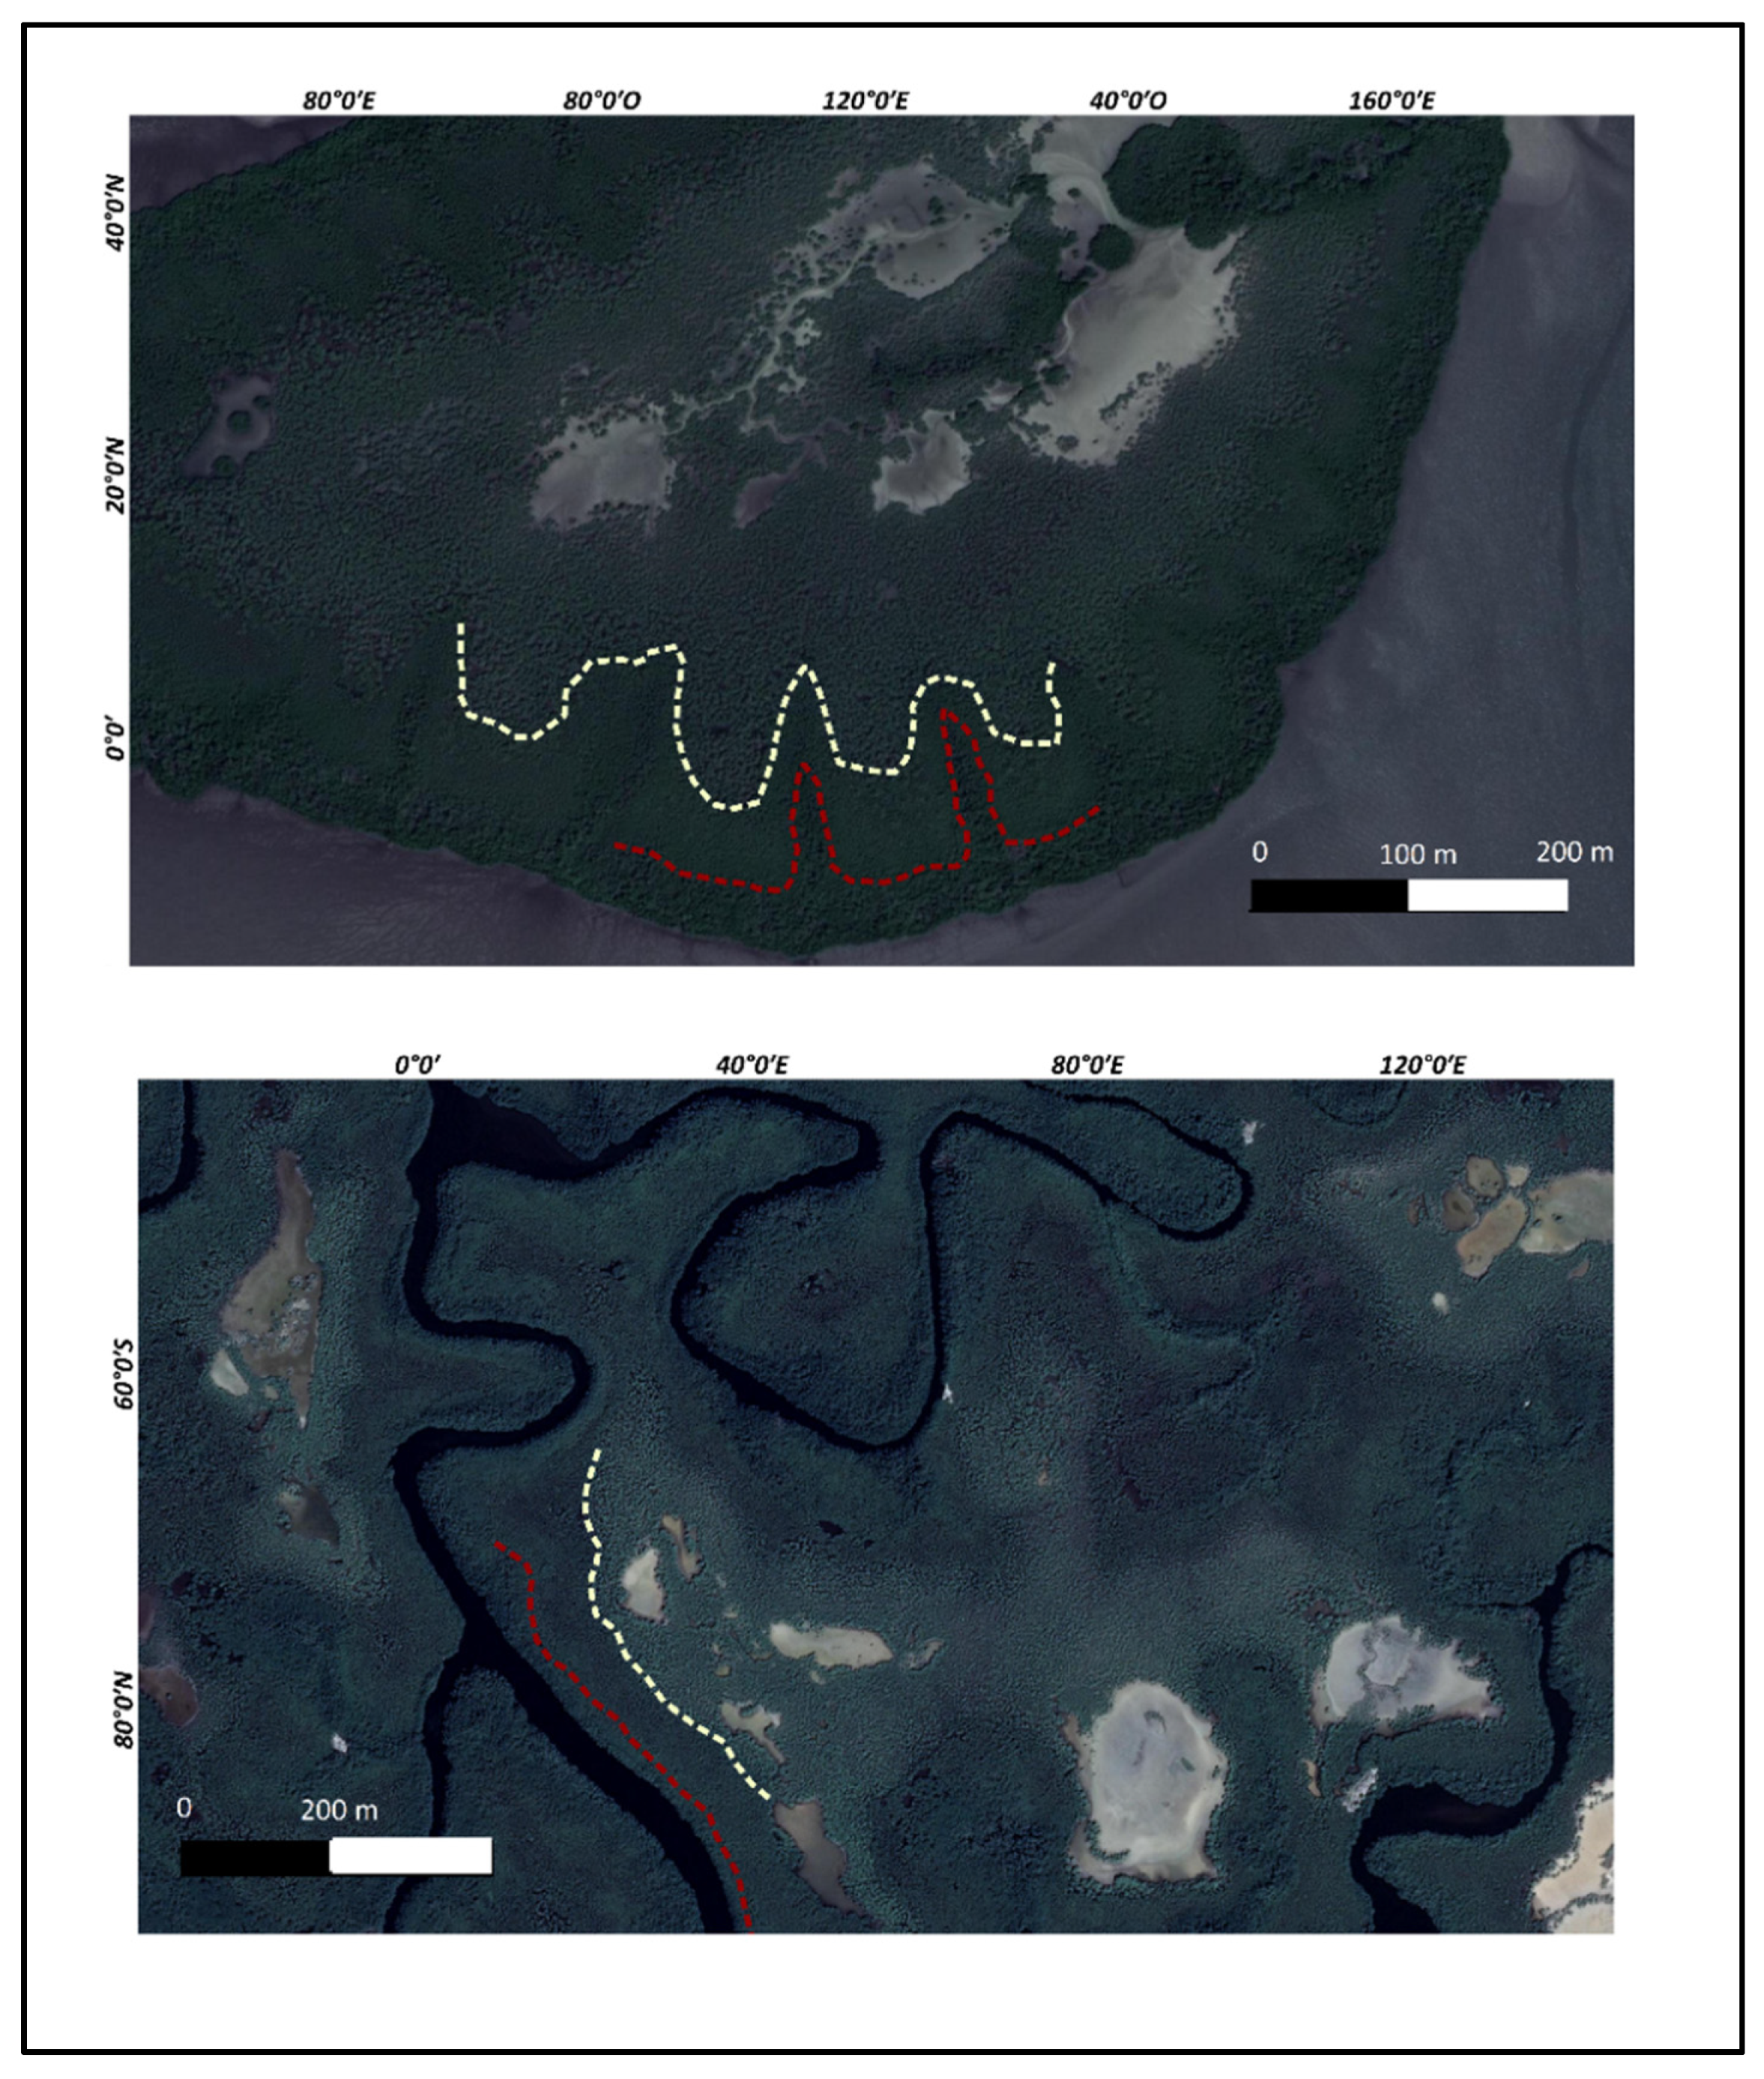
Figure 4.
Distribution of the validation samples for the mangrove zonation classification (left: Saloum; right: Casamance).
Figure 4.
Distribution of the validation samples for the mangrove zonation classification (left: Saloum; right: Casamance).
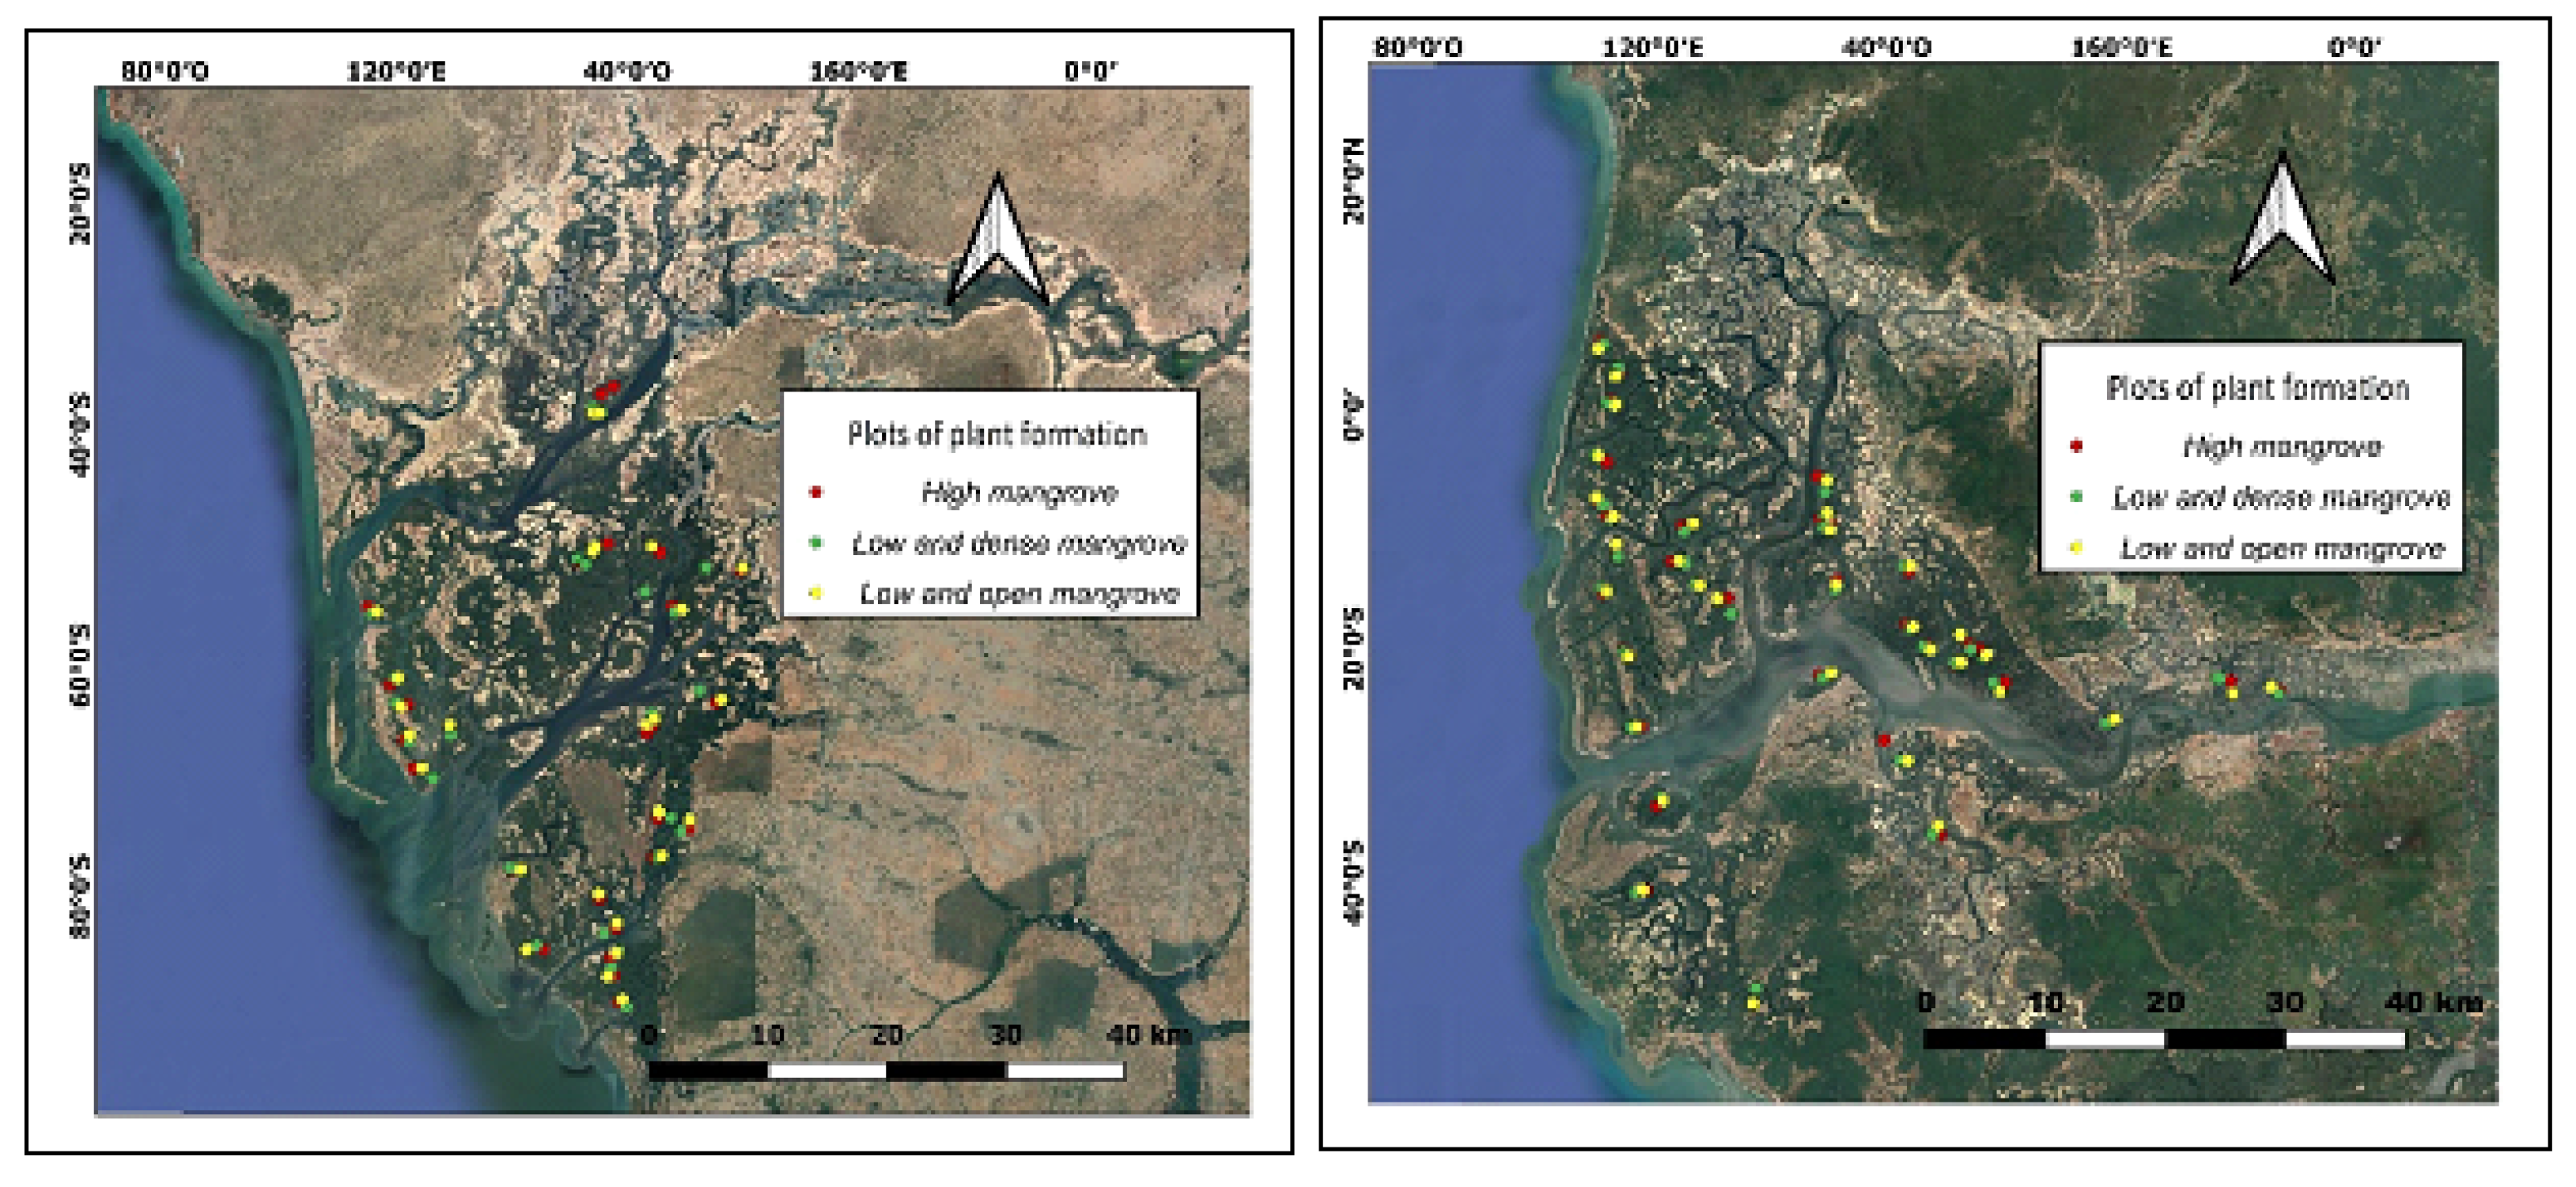
Figure 5.
Methodological flowchart for mapping the mangrove zonation changes.
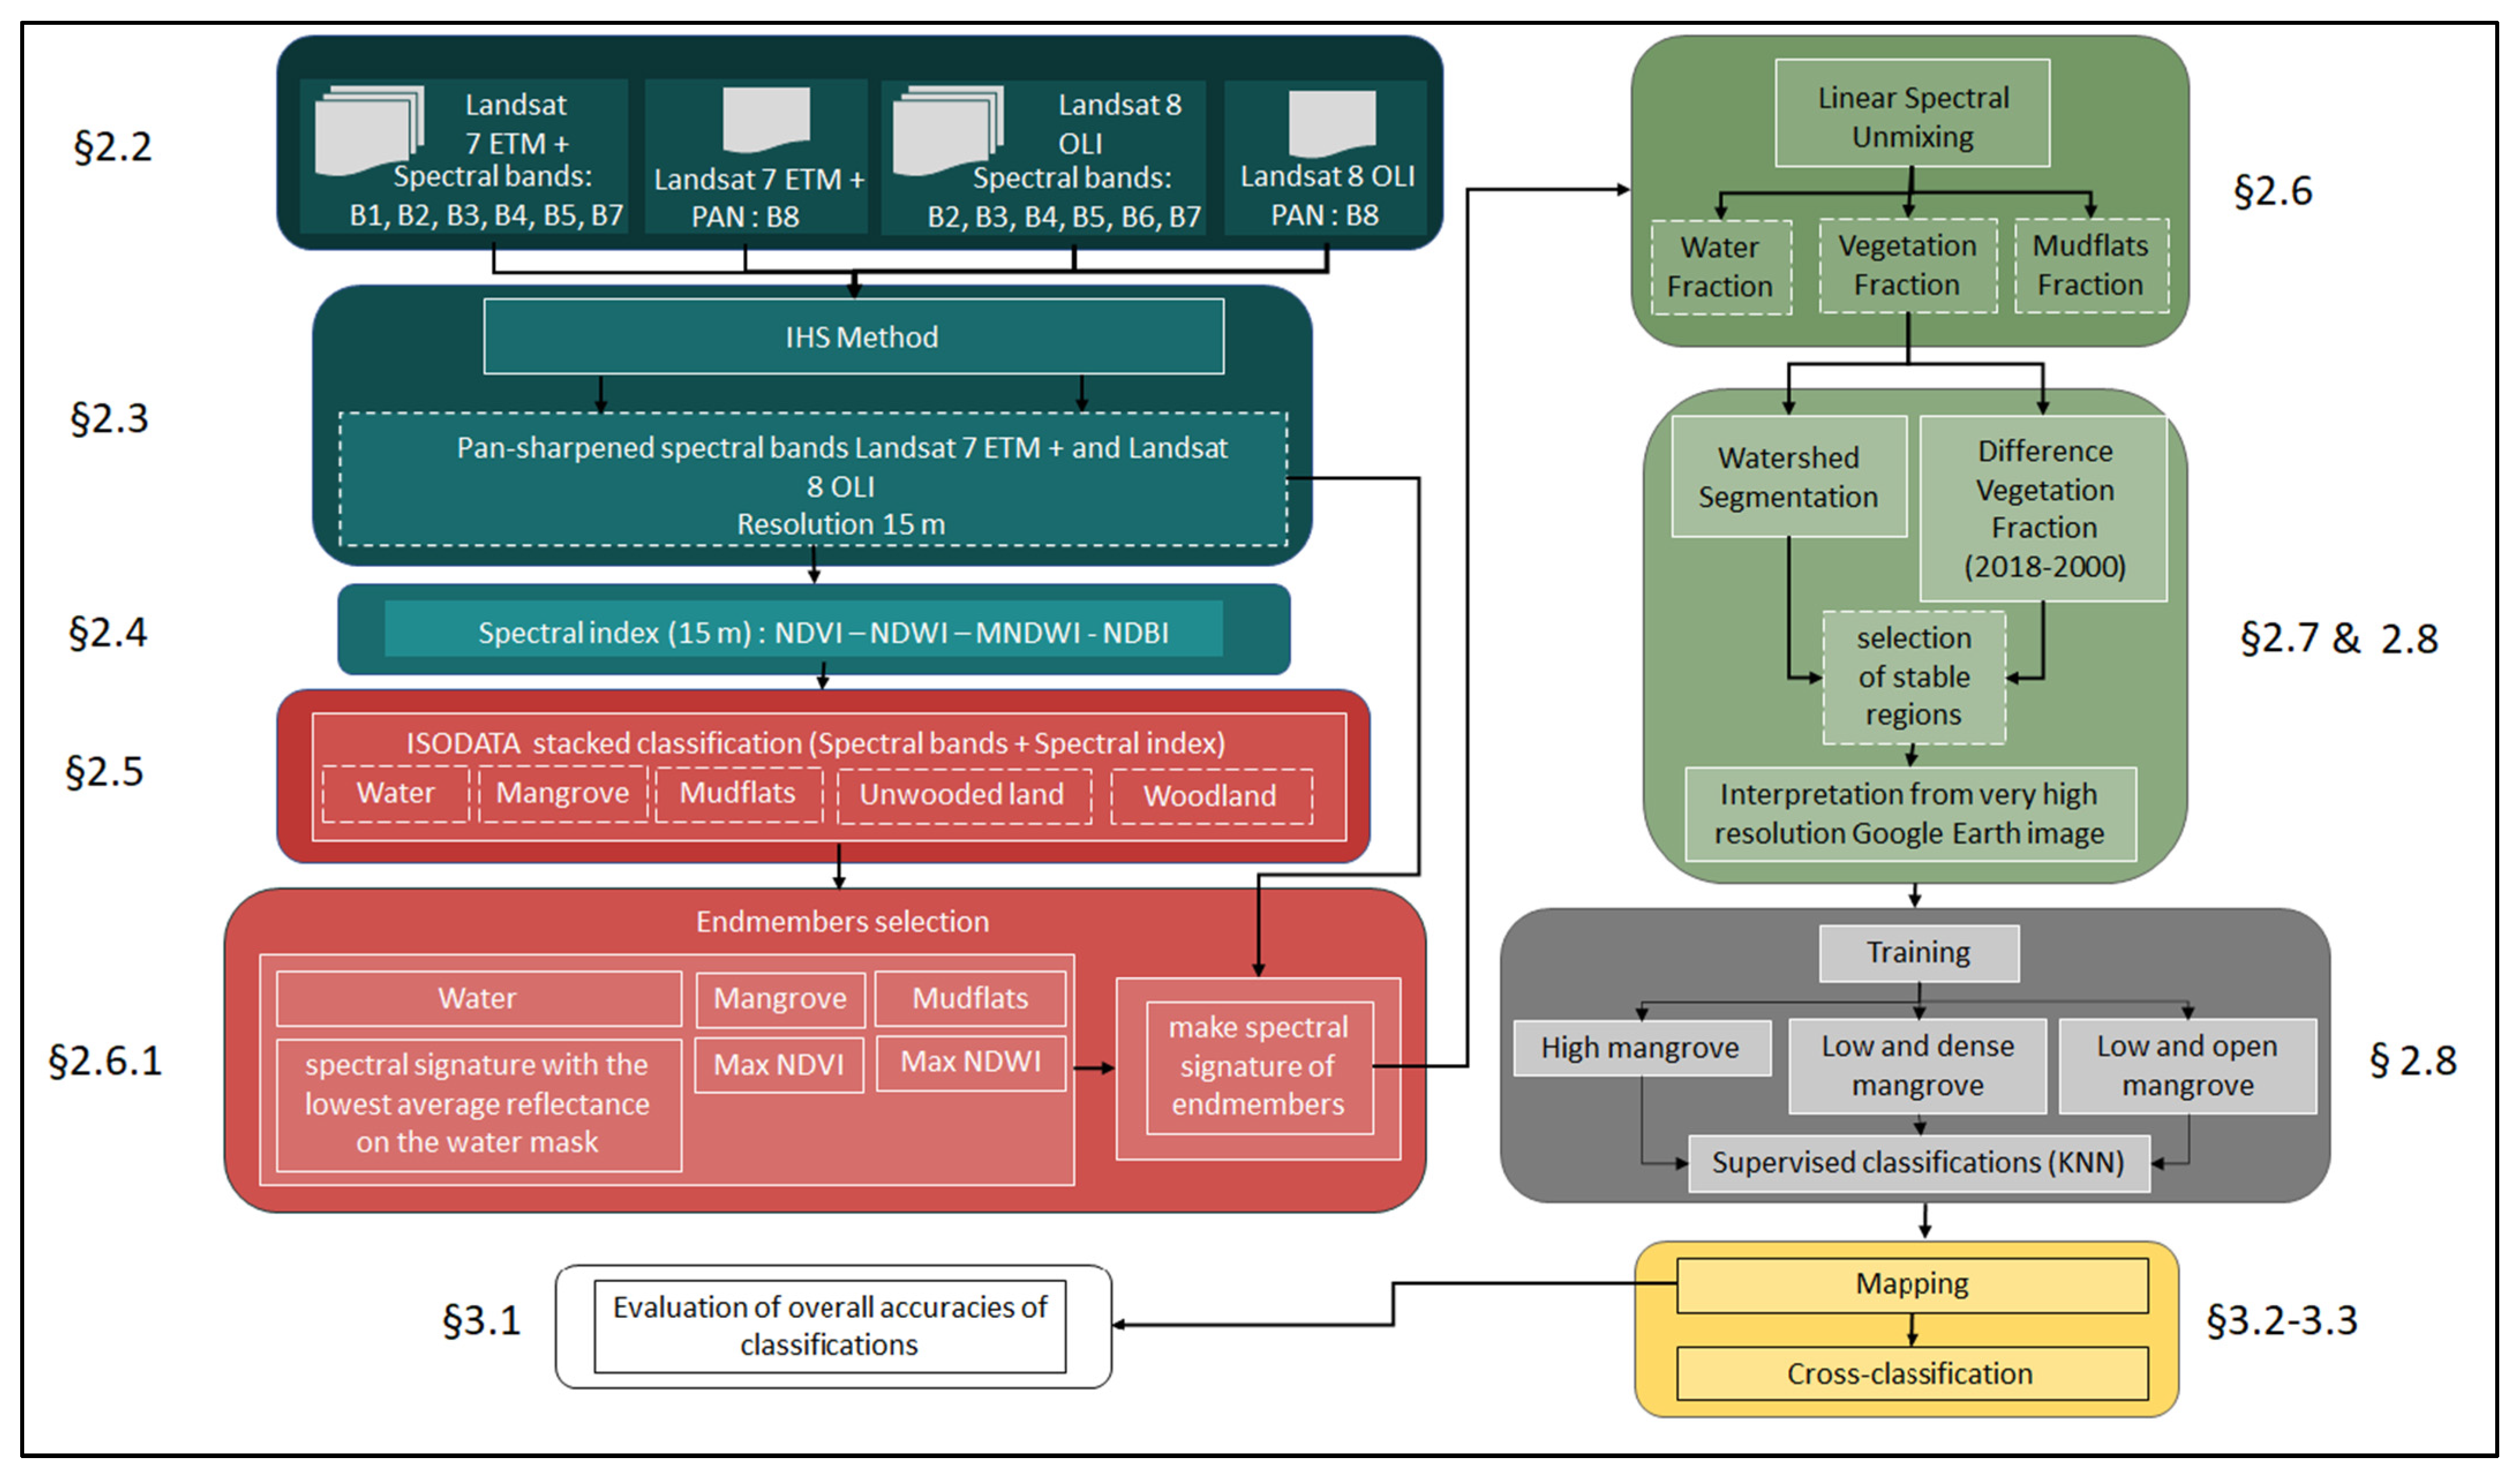
Figure 6.
Land cover change and contribution of classes to the area change between 2000 and 2018 in Saloum (a) and Casamance (b).
Figure 6.
Land cover change and contribution of classes to the area change between 2000 and 2018 in Saloum (a) and Casamance (b).

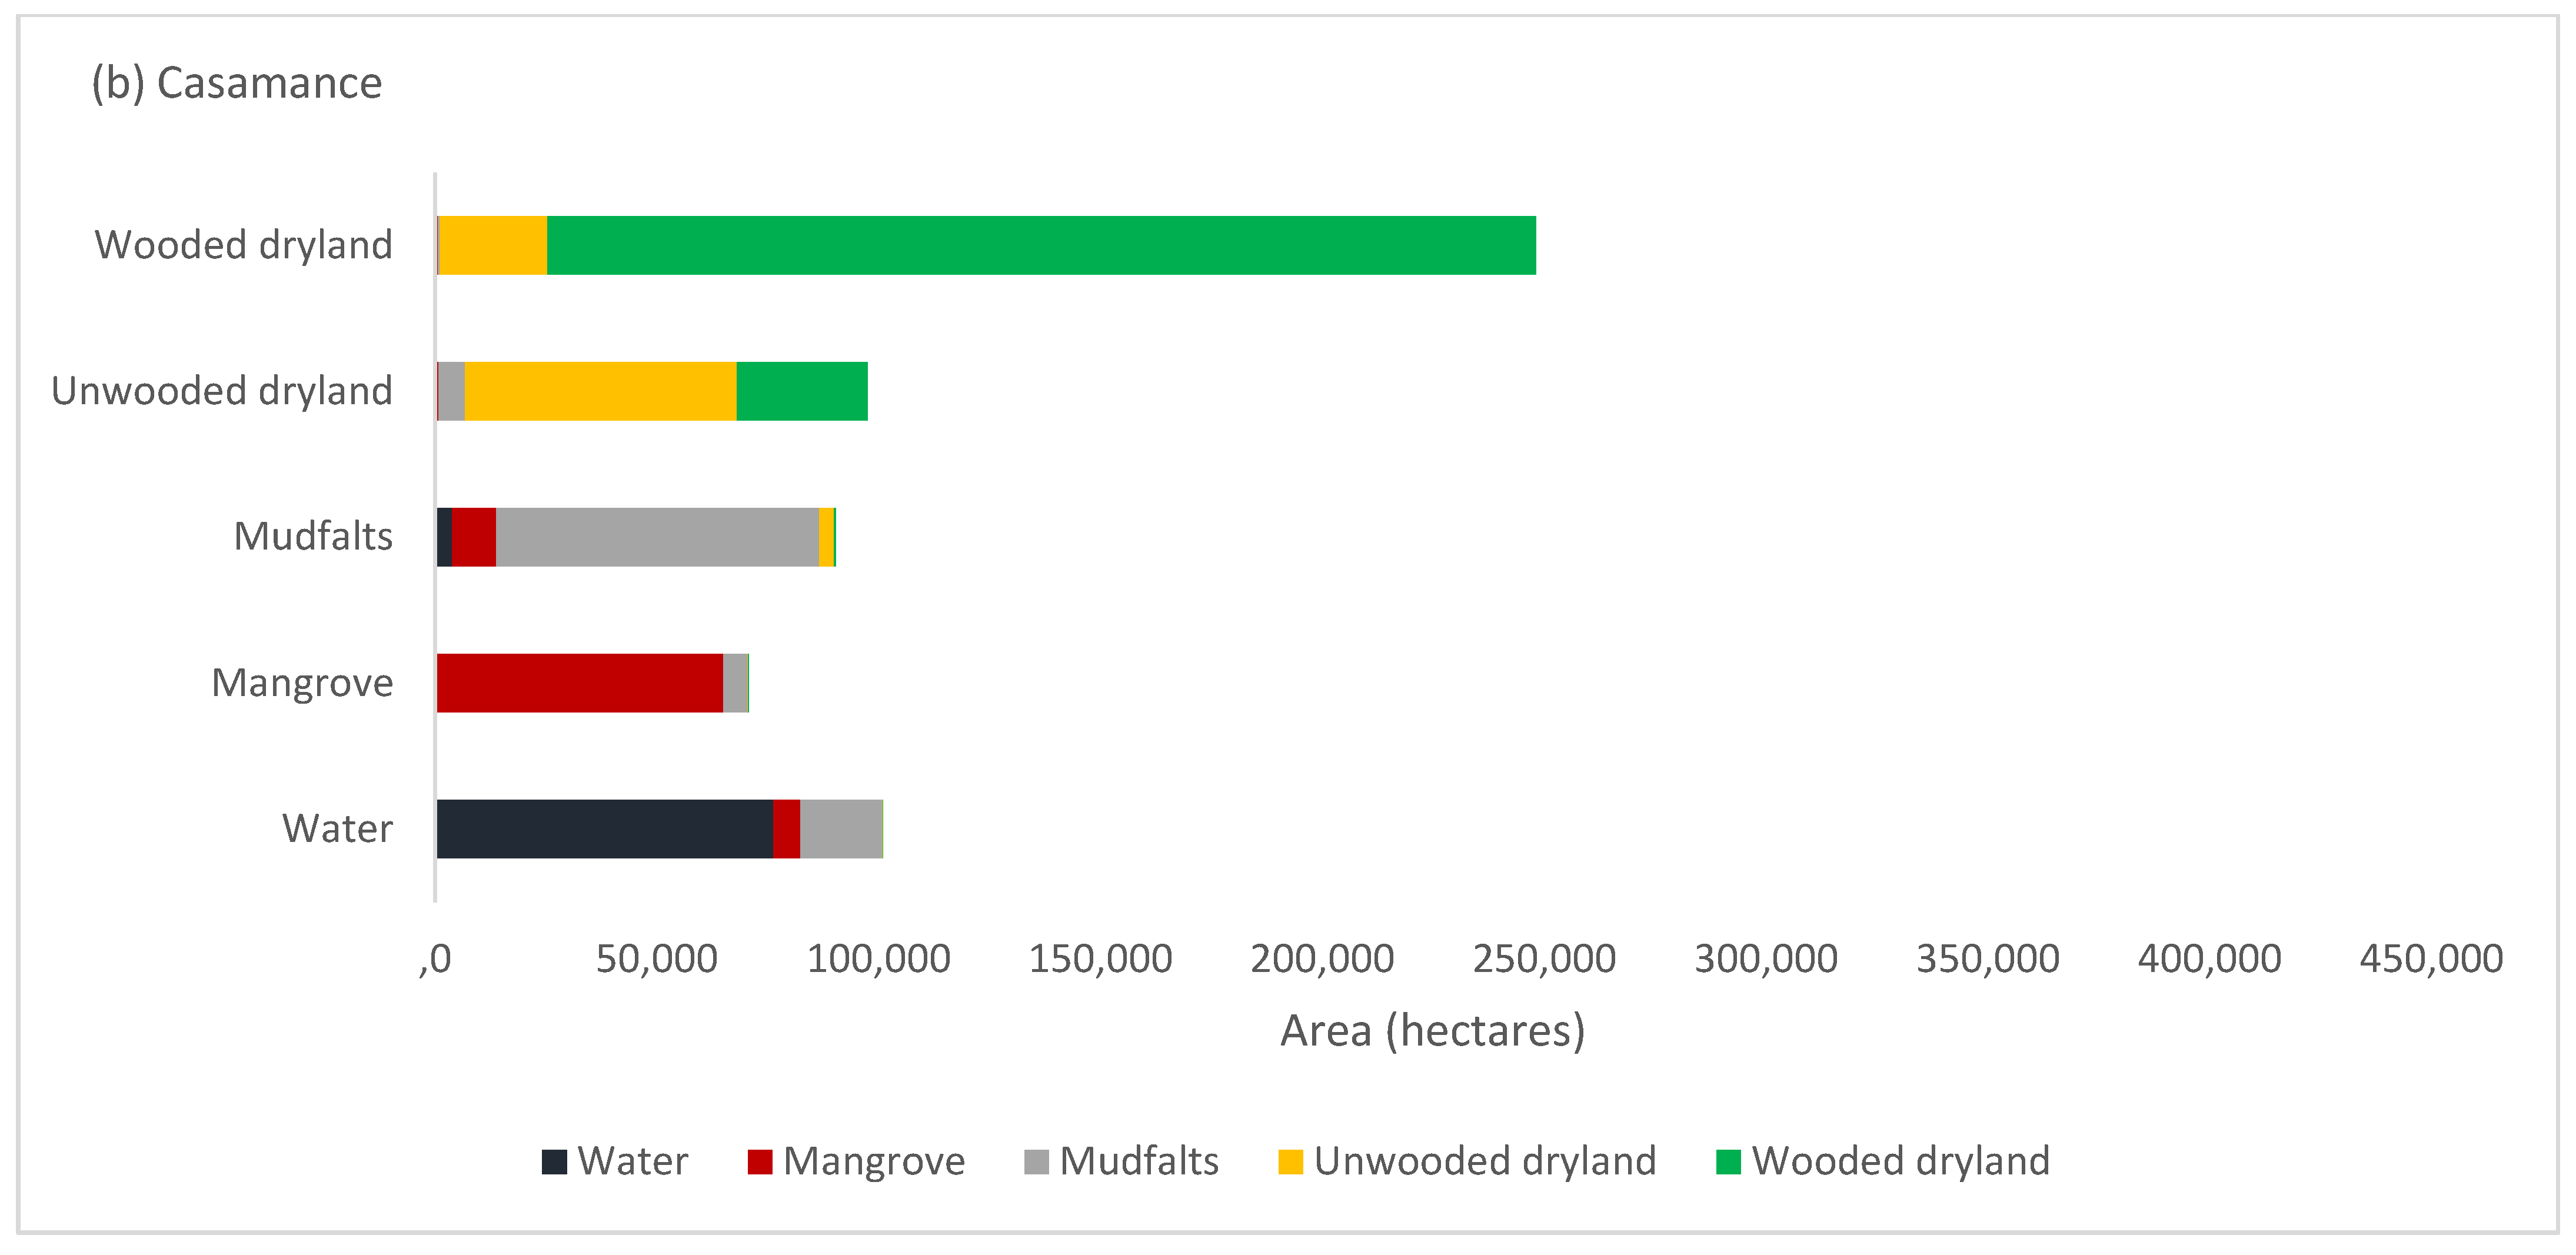
Figure 7.
Changes in the surface areas of mangrove formations between 2000 and 2018 in Saloum and Casamance.
Figure 7.
Changes in the surface areas of mangrove formations between 2000 and 2018 in Saloum and Casamance.
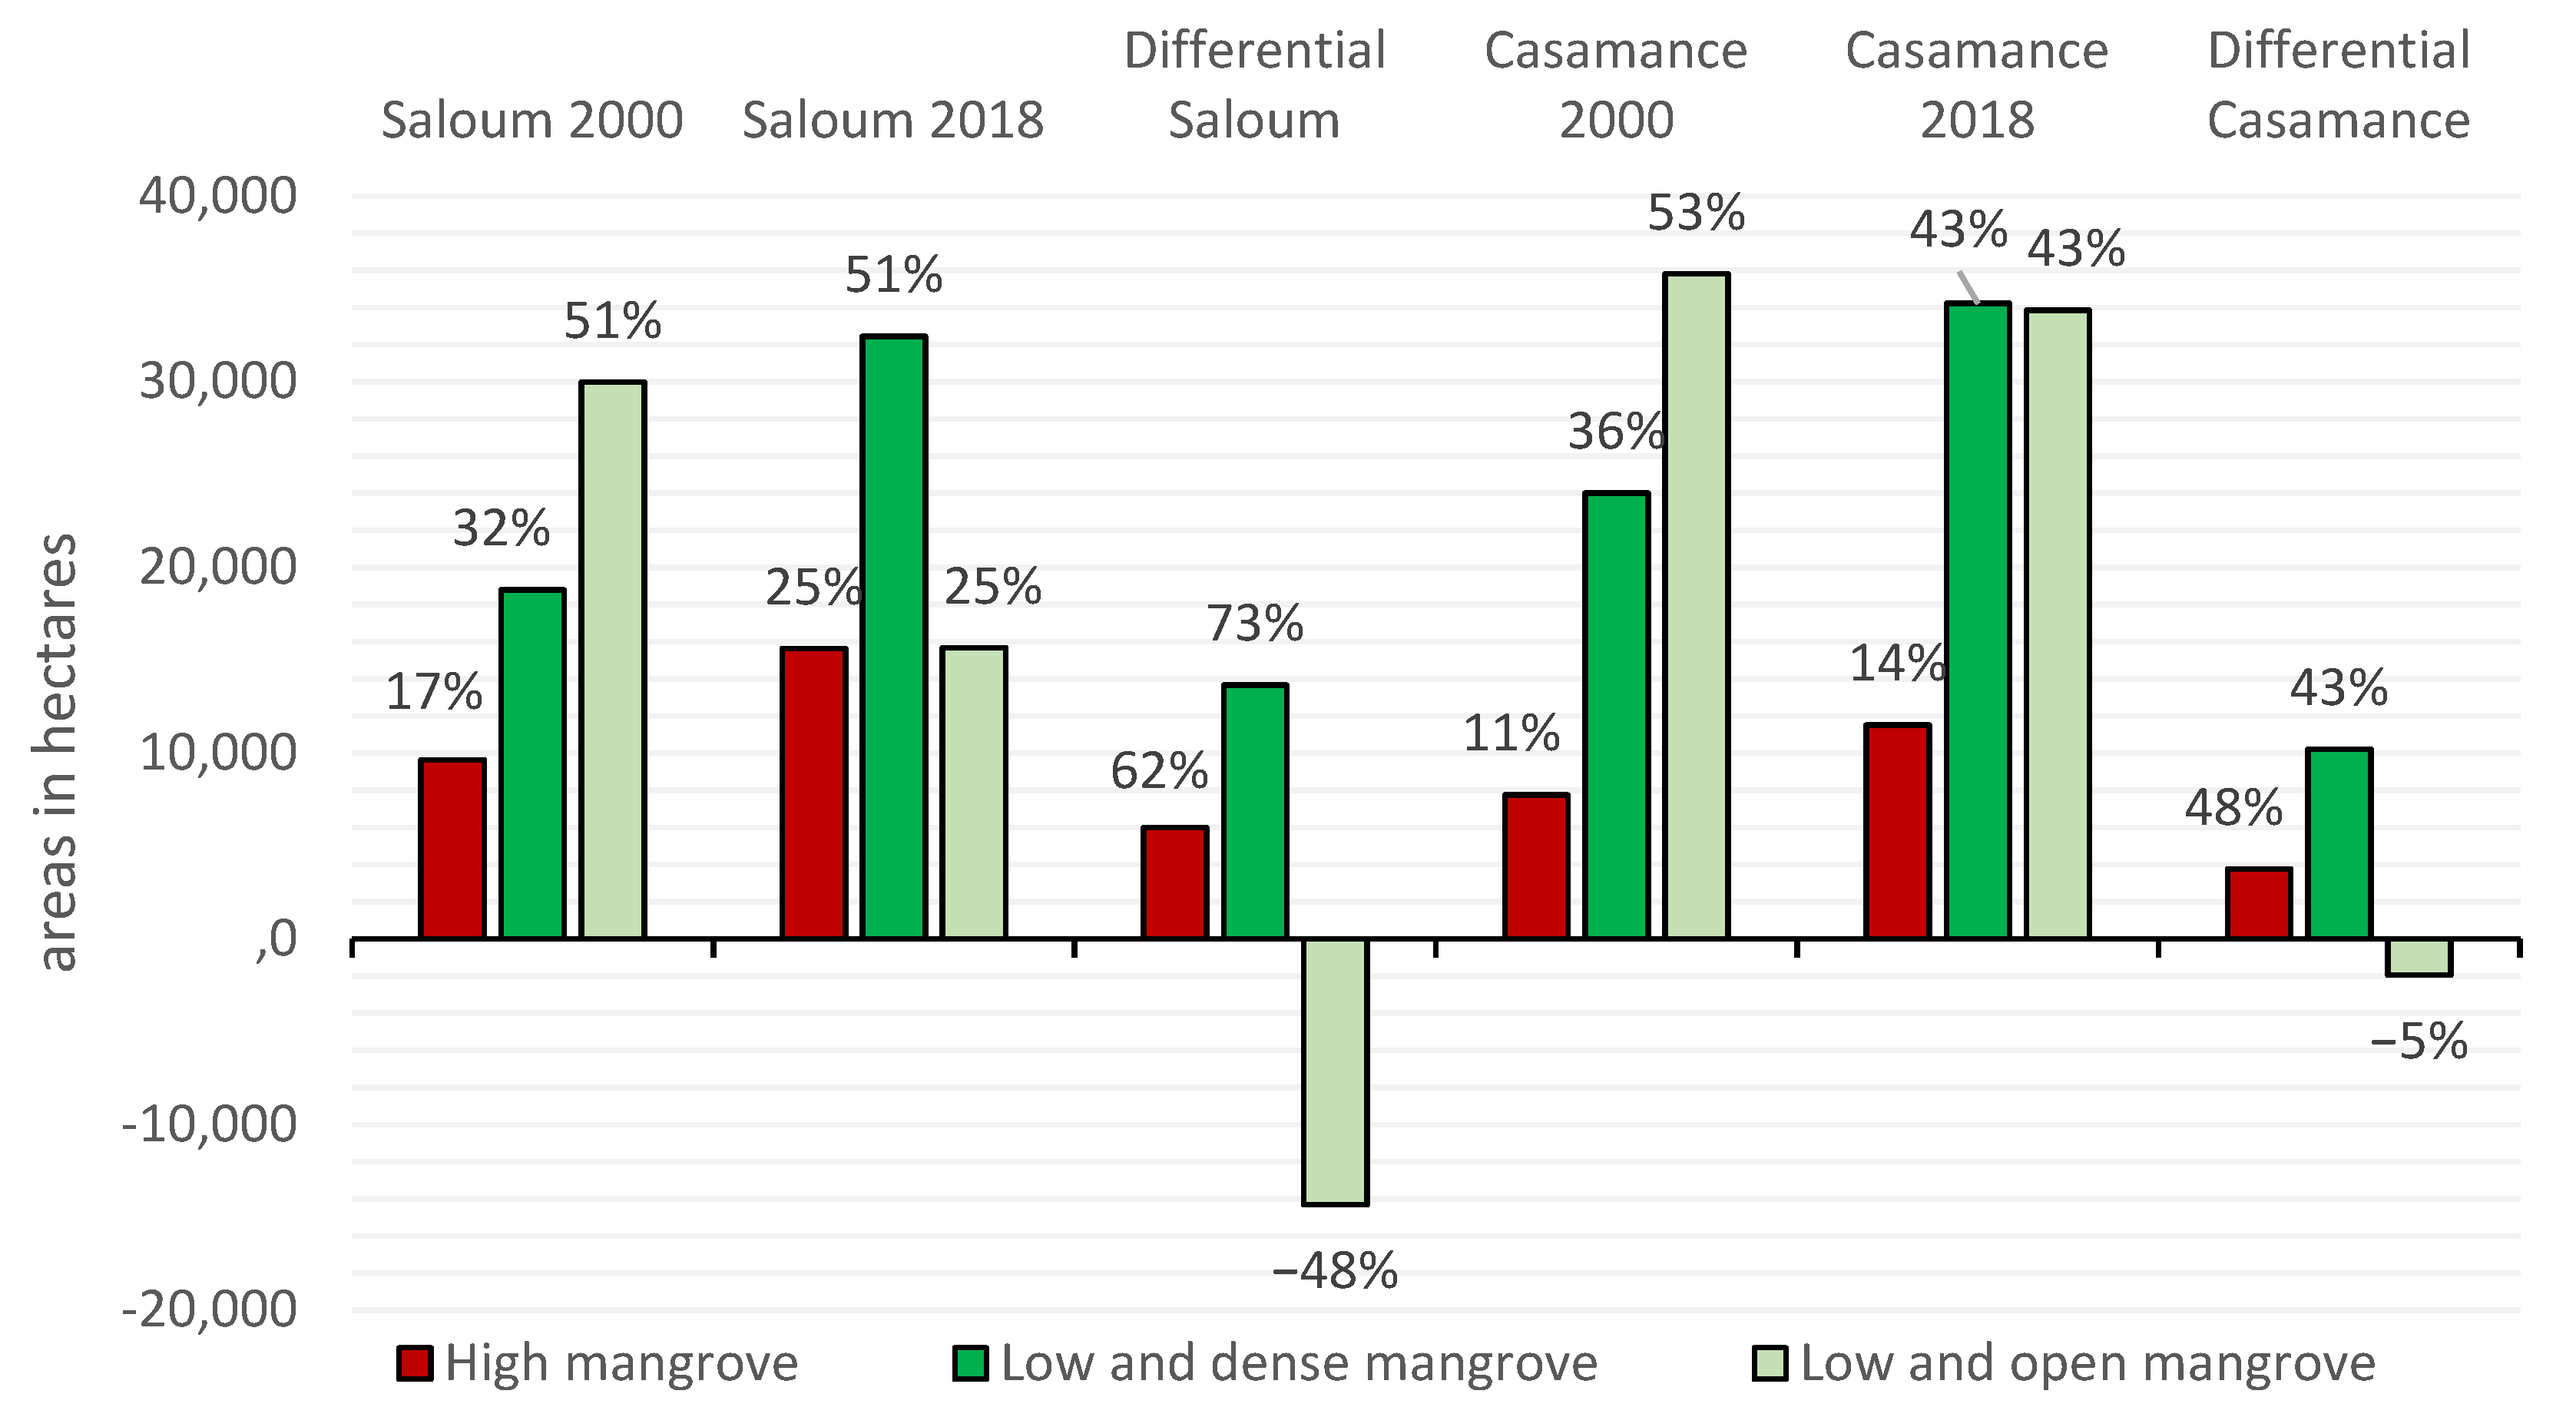
Figure 8.
Synthesis of the main dynamics of mangrove surfaces in the change process: (a) Saloum and (b) Casamance (the relative sizes of the symbols indicate the importance of the mangrove areas included in the local dynamics).
Figure 8.
Synthesis of the main dynamics of mangrove surfaces in the change process: (a) Saloum and (b) Casamance (the relative sizes of the symbols indicate the importance of the mangrove areas included in the local dynamics).
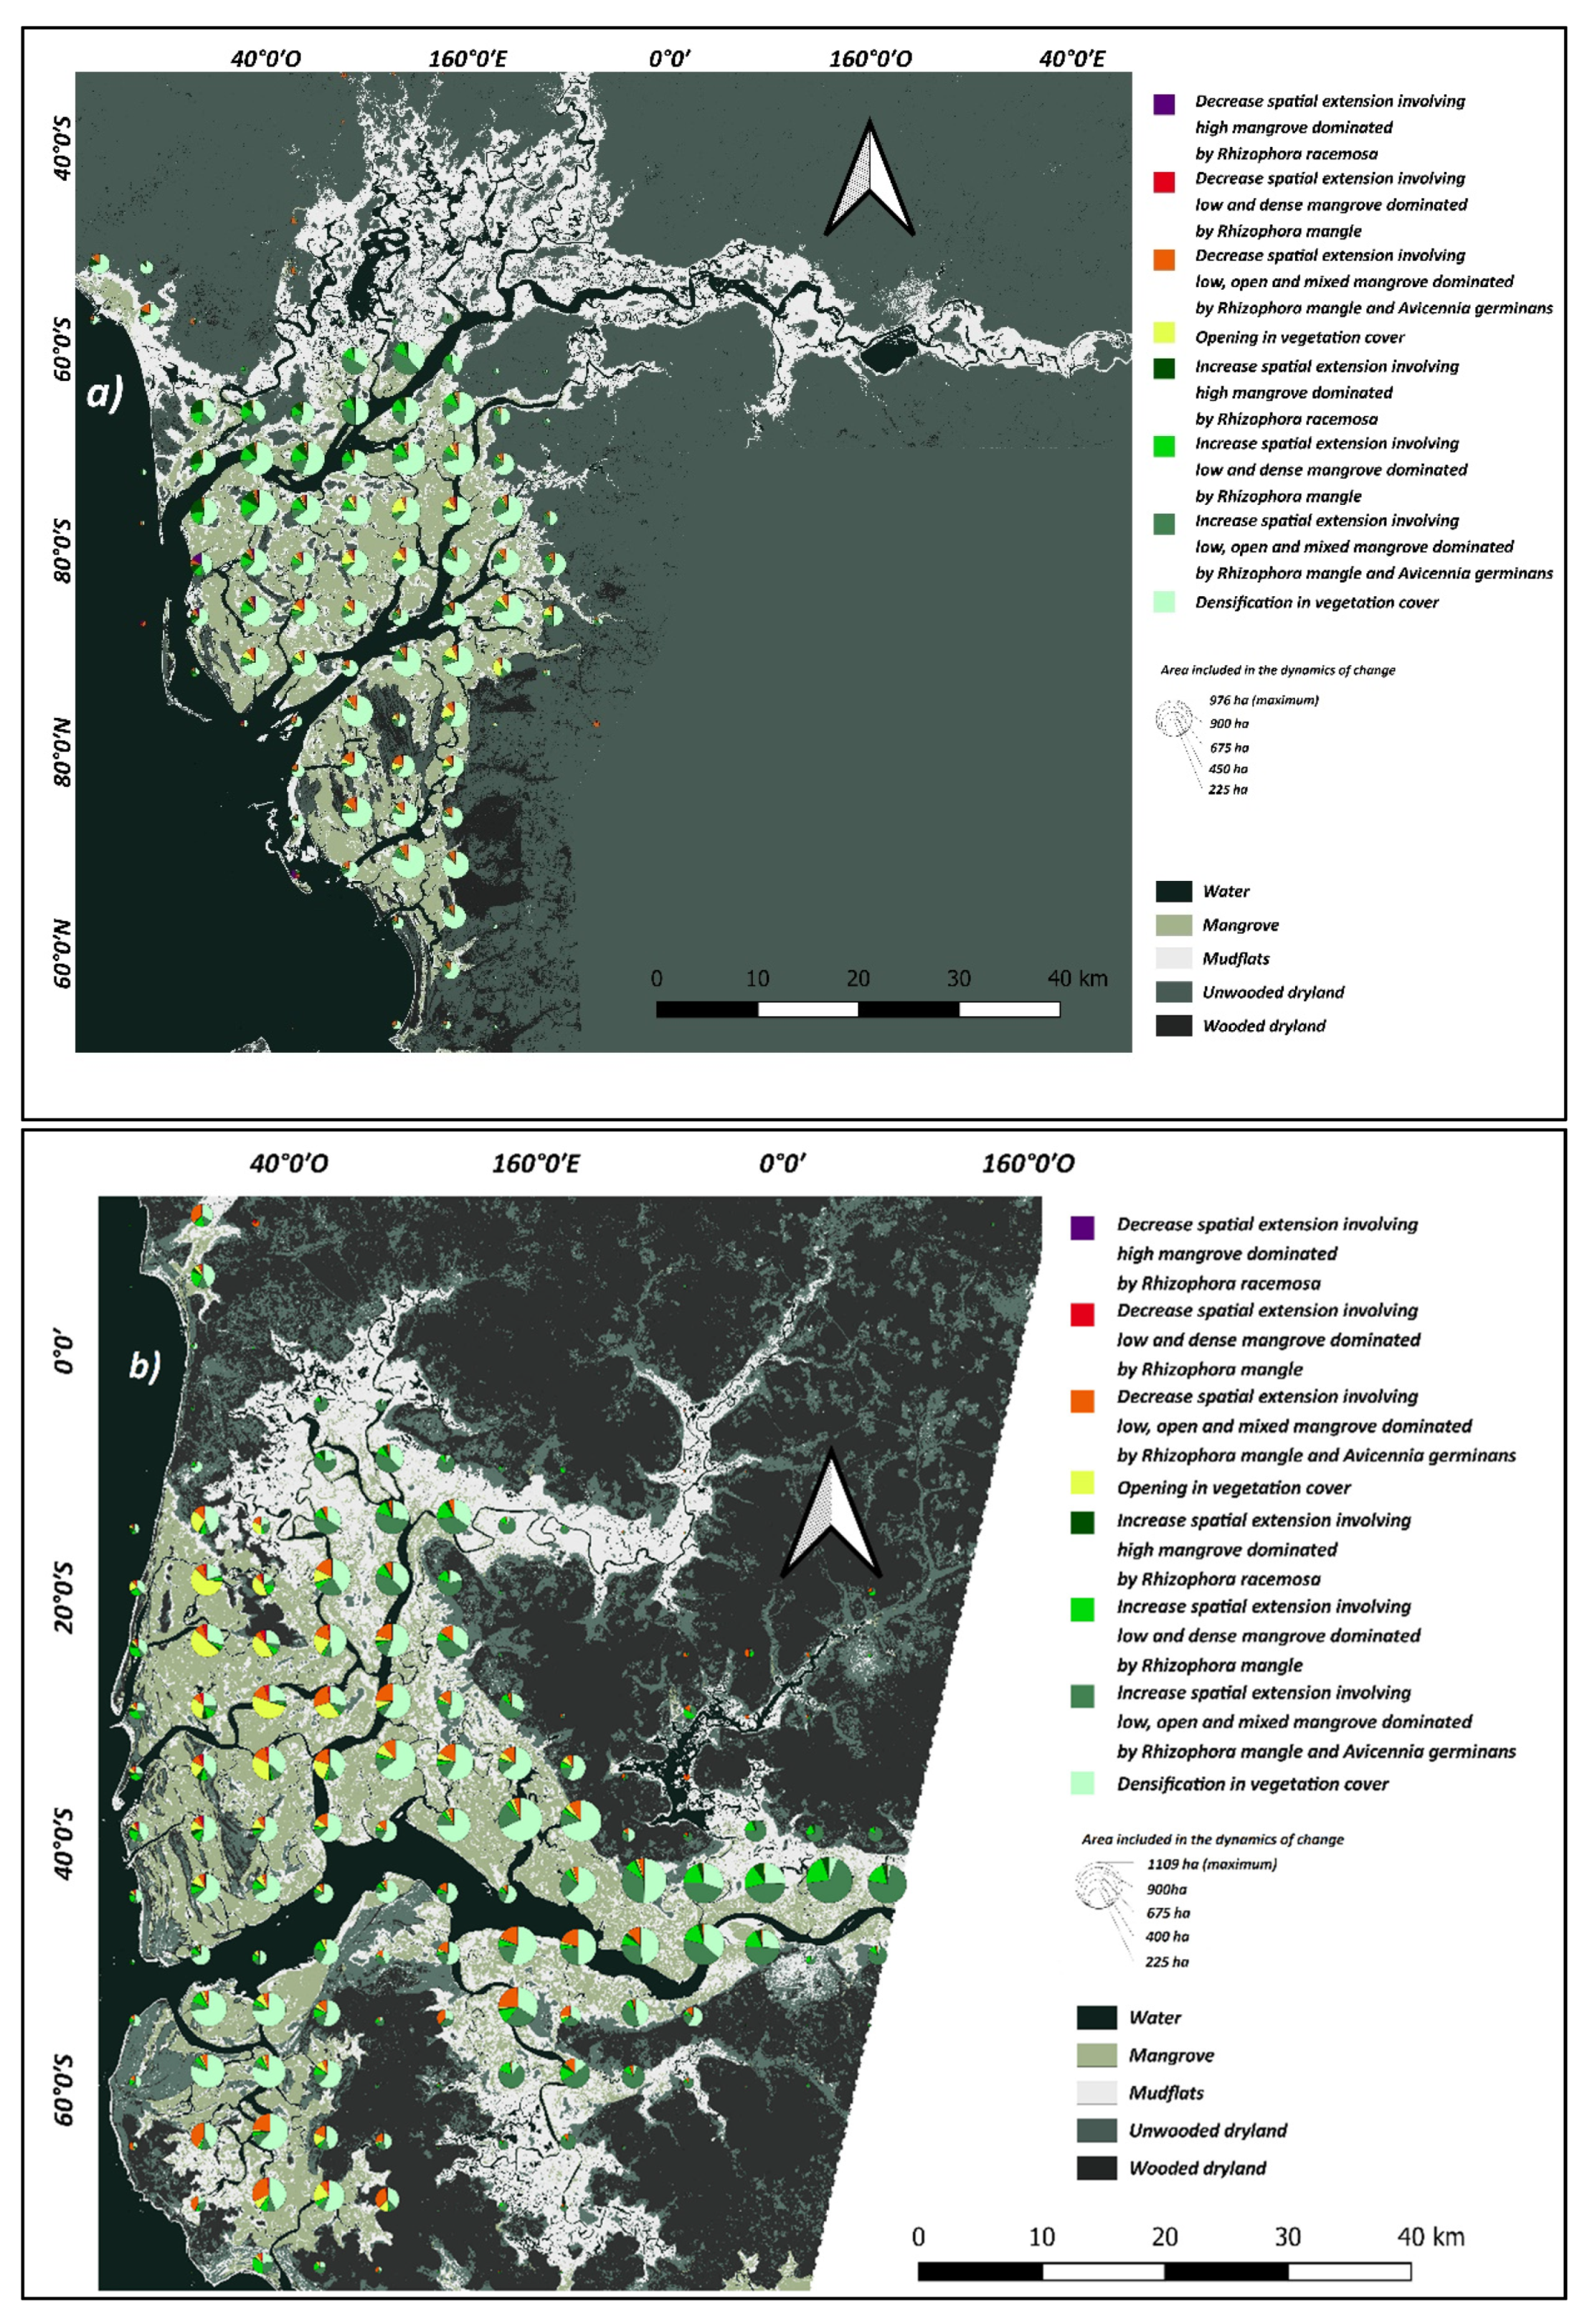
Figure 9.
Contribution of the dynamics to the contiguous diffusion of the mangrove areas (the proportions and contributions were evaluated and calculated relative to the total surface areas of the gains, respectively, in the Saloum and Casamance mangroves).
Figure 9.
Contribution of the dynamics to the contiguous diffusion of the mangrove areas (the proportions and contributions were evaluated and calculated relative to the total surface areas of the gains, respectively, in the Saloum and Casamance mangroves).

Table 1.
Summary of the sensors and products used in the study and their corresponding characteristics.
Table 1.
Summary of the sensors and products used in the study and their corresponding characteristics.
| Dates of Acquisition by Path/Row | |||||
|---|---|---|---|---|---|
| 205/50 and 205/51 | Capture | Collection and Level of Product | Spatial Resolution | Bands | Spectral Range(μm) |
| 08/12/2000 | ETM+ | C2/L2 | 30 m | 1 | 0.45–0.515 |
| C2/L2 | 30 m | 2 | 0.525–0.605 | ||
| C2/L2 | 30 m | 3 | 0.63–0.69 | ||
| C2/L2 | 30 m | 4 | 0.775–0.90 | ||
| C2/L2 | 30 m | 5 | 1.55–1.75 | ||
| C2/L2 | 30 m | 7 | 2.08–2.35 | ||
| C2/L1 | 15 m | 8 | 0.52–0.9 | ||
| 18/12/2018 | OLI | C2/L2 | 30 m | 2 | 0.45–0.515 |
| C2/L2 | 30 m | 3 | 0.525–0.600 | ||
| C2/L2 | 30 m | 4 | 0.630–0.680 | ||
| C2/L2 | 30 m | 5 | 0.845–0.885 | ||
| C2/L2 | 30 m | 6 | 1.560–1.660 | ||
| C2/L2 | 30 m | 7 | 2.100–2.300 | ||
| C2/L1 | 15 m | 8 | 0.500–0.680 |
Table 2.
Summary of the partition for the training and validation data of the classification (in pixels).
Table 2.
Summary of the partition for the training and validation data of the classification (in pixels).
| Saloum | Casamance | |||
|---|---|---|---|---|
| Training | Control | Training | Control | |
| high mangrove | 1109 | 1055 | 1812 | 1335 |
| low and dense mangrove | 1827 | 891 | 2213 | 2344 |
| Low and open mangrove | 1382 | 1002 | 2620 | 1863 |
| Total (pixel) | 7266 | 12,187 | ||
Table 3.
Confusion matrix for the mangrove zonation classification in Saloum (ground truth in the rows, and categorical images in the columns).
Table 3.
Confusion matrix for the mangrove zonation classification in Saloum (ground truth in the rows, and categorical images in the columns).
| Saloum | High Mangrove | Low and Dense Mangrove | Low and Open Mangrove | Total | Commission |
|---|---|---|---|---|---|
| High mangrove | 983 | 236 | 2 | 1221 | 0.19 |
| Low and dense mangrove | 58 | 646 | 47 | 751 | 0.13 |
| Low and open mangrove | 14 | 8 | 924 | 946 | 0.02 |
| Total | 1055 | 891 | 1002 | 2948 | |
| Omission | 0.06 | 0.27 | 0.07 | 0.13 |
Table 4.
Confusion matrix for the mangrove zonation classification in Casamance (ground truth in the rows, and categorical images in the columns).
Table 4.
Confusion matrix for the mangrove zonation classification in Casamance (ground truth in the rows, and categorical images in the columns).
| Casamance | High Mangrove | Low and Dense Mangrove | Low and Open Mangrove | Total | Commission |
|---|---|---|---|---|---|
| High mangrove | 1202 | 128 | 2 | 1332 | 0.09 |
| Low and dense mangrove | 90 | 2033 | 133 | 2256 | 0.09 |
| Low and open mangrove | 43 | 177 | 1696 | 946 | 0.11 |
| Total | 1335 | 2344 | 1863 | 5542 | |
| Omission | 0.09 | 0.13 | 0.08 | 0.11 |
Table 5.
Kappa statistics of the mangrove zonation classification.
| Overall Accuracy | Kappa |
|---|---|
| Saloum 2018 | 0.80 |
| Casamance 2018 | 0.83 |
Table 6.
Differences between the mapped areas and area estimates of the plant formation and relationship to the relative margin of error.
Table 6.
Differences between the mapped areas and area estimates of the plant formation and relationship to the relative margin of error.
| Saloum 2018 | Mapped (ha) | Estimated (ha) | Relative Difference | MoE at 95% Confidence |
|---|---|---|---|---|
| High and dense mangrove | 13,549 | 7603 | 78% | 91% |
| Low and dense mangrove | 30,962 | 16,829 | 84% | 41% |
| Low and open mangrove | 18,770 | 21,719 | −14% | 32% |
| Casamance 2018 | Mapped (ha) | Estimated (ha) | Relative Difference | MoE at 95% Confidence |
| High and dense mangrove | 10,943 | 10,941 | 0% | 61% |
| Low and dense mangrove | 33,689 | 24,450 | 38% | 27% |
| Low and open mangrove | 36,221 | 23,575 | 54% | 28% |
Table 7.
Transition matrix for the mangrove zonation class in Saloum.
| Saloum | No Mangrove | High Mangrove | Low and Dense Mangrove | Low and Open Mangrove | Total |
|---|---|---|---|---|---|
| No mangrove | 323 ha | 426 ha | 2248 ha | 2996 ha | |
| High mangrove | 1410 ha | 6246 ha | 3925 ha | 4050 ha | 15,631 ha |
| Low and dense mangrove | 2534 ha | 3000 ha | 13,148 ha | 13,764 ha | 32,446 ha |
| Low and open mangrove | 4382 ha | 73 ha | 1287 ha | 9923 ha | 15,665 ha |
| Total | 8326 ha | 9641 ha | 18,786 ha | 29,986 ha | |
| Legend | |||||
| Decrease spatial extension involving high mangrove dominated by Rhizophora racemosa | |||||
| Decrease spatial extension involving low and dense mangrove dominated by Rhizophora mangle | |||||
| Decrease spatial extension involving low, open and mixed mangrove dominated by Rhizophora mangle et Avicennia germinans | |||||
| Opening in vegetation cover | |||||
| Increase in spatial extension involving high mangrove dominated by Rhizophora racemosa | |||||
| Increase spatial extension involving low and dense mangrove dominated by Rhizophora mangle | |||||
| Increase spatial extension involving low, open and mixed mangrove dominated by Rhizophora mangle et Avicennia germinans | |||||
| Densification in vegetation cover | |||||
| Stability in vegetation cover | |||||
Table 8.
Transition matrix for the mangrove zonation class in Casamance.
| Casamance | No Mangrove | High Mangrove | Low and Dense Mangrove | Low and Open Mangrove | Total |
|---|---|---|---|---|---|
| No mangrove | 70 ha | 436 ha | 4611 ha | 5118 ha | |
| High mangrove | 984 ha | 4659 ha | 4336 ha | 2262 ha | 12,242 ha |
| Low and dense mangrove | 4284 ha | 3263 ha | 15,574 ha | 12,370 ha | 35,491 ha |
| Low and open mangrove | 11,464 ha | 124 ha | 3472 ha | 17,364 ha | 32,424 ha |
| Total | 16,732 ha | 8116 ha | 23,819 ha | 36,607 ha | |
| Legend | |||||
| Decrease spatial extension involving high mangrove dominated by Rhizophora racemosa | |||||
| Decrease spatial extension involving low and dense mangrove dominated by Rhizophora mangle | |||||
| Decrease spatial extension involving low, open and mixed mangrove dominated by Rhizophora mangle et Avicennia germinans | |||||
| Opening in vegetation cover | |||||
| Increase in spatial extension involving high mangrove dominated by Rhizophora racemosa | |||||
| Increase spatial extension involving low and dense mangrove dominated by Rhizophora mangle | |||||
| Increase spatial extension involving low, open and mixed mangrove dominated by Rhizophora mangle et Avicennia germinans | |||||
| Densification in vegetation cover | |||||
| Stability in vegetation cover | |||||
Publisher’s Note: MDPI stays neutral with regard to jurisdictional claims in published maps and institutional affiliations. |
© 2021 by the authors. Licensee MDPI, Basel, Switzerland. This article is an open access article distributed under the terms and conditions of the Creative Commons Attribution (CC BY) license (https://creativecommons.org/licenses/by/4.0/).
Share and Cite
MDPI and ACS Style
Lombard, F.; Andrieu, J. Mapping Mangrove Zonation Changes in Senegal with Landsat Imagery Using an OBIA Approach Combined with Linear Spectral Unmixing. Remote Sens. 2021, 13, 1961. https://doi.org/10.3390/rs13101961
AMA Style
Lombard F, Andrieu J. Mapping Mangrove Zonation Changes in Senegal with Landsat Imagery Using an OBIA Approach Combined with Linear Spectral Unmixing. Remote Sensing. 2021; 13(10):1961. https://doi.org/10.3390/rs13101961
Chicago/Turabian StyleLombard, Florent, and Julien Andrieu. 2021. "Mapping Mangrove Zonation Changes in Senegal with Landsat Imagery Using an OBIA Approach Combined with Linear Spectral Unmixing" Remote Sensing 13, no. 10: 1961. https://doi.org/10.3390/rs13101961
Note that from the first issue of 2016, this journal uses article numbers instead of page numbers. See further details here.