Article

Impact of Aerosol Vertical Distribution on Aerosol Optical Depth Retrieval from Passive Satellite Sensors

1
Department of Atmospheric and Oceanic Science, School of Physics, Peking University, Beijing 100871, China
2
Laboratoire d’Optique Atmosphérique, CNRS/Université Lille-1, 59655 Villeneuve d’Ascq, France
3
Division of Planetary and Geological Sciences, California Institute of Technology, Pasadena, CA 91125, USA
4
Joint Institute for Regional Earth System Science and Engineering (JIFRESSE), University of California, Los Angeles, CA 90095, USA
*
Author to whom correspondence should be addressed.
Remote Sens. 2020, 12(9), 1524; https://doi.org/10.3390/rs12091524
Submission received: 9 April 2020 / Revised: 4 May 2020 / Accepted: 5 May 2020 / Published: 11 May 2020
(This article belongs to the Special Issue Advances of Remote Sensing Inversion)

Abstract

:
When retrieving Aerosol Optical Depth (AOD) from passive satellite sensors, the vertical distribution of aerosols usually needs to be assumed, potentially causing uncertainties in the retrievals. In this study, we use the Moderate Resolution Spectroradiometer (MODIS) and Visible Infrared Imaging Radiometer Suite (VIIRS) sensors as examples to investigate the impact of aerosol vertical distribution on AOD retrievals. A series of sensitivity experiments was conducted using radiative transfer models with different aerosol profiles and surface conditions. Assuming a 0.2 AOD, we found that the AOD retrieval error is the most sensitive to the vertical distribution of absorbing aerosols; a −1 km error in aerosol scale height can lead to a ~30% AOD retrieval error. Moreover, for this aerosol type, ignoring the existence of the boundary layer can further result in a ~10% AOD retrieval error. The differences in the vertical distribution of scattering and absorbing aerosols within the same column may also cause −15% (scattering aerosols above absorbing aerosols) to 15% (scattering aerosols below absorbing aerosols) errors. Surface reflectance also plays an important role in affecting the AOD retrieval error, with higher errors over brighter surfaces in general. The physical mechanism associated with the AOD retrieval errors is also discussed. Finally, by replacing the default exponential profile with the observed aerosol vertical profile by a micro-pulse lidar at the Beijing-PKU site in the VIIRS retrieval algorithm, the retrieved AOD shows a much better agreement with surface observations, with the correlation coefficient increased from 0.63 to 0.83 and bias decreased from 0.15 to 0.03. Our study highlights the importance of aerosol vertical profile assumption in satellite AOD retrievals, and indicates that considering more realistic profiles can help reduce the uncertainties.

Graphical Abstract

1. Introduction

Aerosol observations are essential in climate and environmental studies such as quantifying Earth’s energy budget and characterizing surface air quality. In recent years, satellite remote sensing has advanced the observations of aerosol properties on both local and global scales. For example, historical sensors like the Advanced Very High Resolution Radiometer [1] on board polar-orbiting meteorological satellites measure the Earth’s reflectance in six channels. Modern sensors like the Moderate Resolution Spectroradiometer [2,3], launched on board Aqua in May 2002 and Terra in December 1999, provide aerosol information at up to seven spectral bands, ranging from visible to near-IR wavelengths, and cover the entire globe every 1 to 2 days. Another advanced satellite sensor —the Visible Infrared Imaging Radiometer Suites [4]—was launched onboard the Suomi National Polar-orbiting Partnership (S-NPP) satellite in October 2011. It collects images and measurements of land and atmosphere in 22 spectral bands, covering wavelengths from 412 to 12,050 nm, and provides routine retrievals of land, aerosol and cloud properties. Sophisticated algorithms have been developed to retrieve aerosol property, in particular, aerosol optical depth, from these various sensors. The overall accuracy of Moderate Resolution Spectroradiometer (MODIS)-retrieved Aerosol Optical Depth (AOD) is expected to be ±(0.05% + 15% × AOD) over land [3]. Although global validation proves that the current sensors largely meet these accuracy requirements, regionally, the uncertainties can still be large. For example, over China, only 50.6% of Visible Infrared Imaging Radiometer Suite (VIIRS) AOD fall within the expected accuracy interval, with an overall bias of 0.13 (or ~28%) [5]. The MODIS latest Collection 6.1 data also show unsatisfactory performance over Asia. The percentage of AOD retrievals falling within the expected error envelope is ~57% compared to 66% globally, and the root mean square error can be as large as 0.176~0.194 over different surfaces [6]. According to previous studies, the AOD errors can be attributed to several main factors, including cloud screening [3], surface reflectance parameterization [7], aerosol model assumptions [7,8,9,10], and aerosol vertical profile assumptions [10,11].
To retrieve aerosol loading from passive satellite platforms, one needs to establish the relationship between satellite observed reflected radiance and AOD. The upward radiation observed by the satellite is composed of the scattered radiance by the atmosphere and reflected radiance by the surface that transmitted through the atmosphere and can be expressed as the following equation:
ρ λ sat ( θ s , θ v , φ ) = ρ λ atm ( θ s , θ v , φ ) + F λ ( θ s ) T λ ( θ v )   ρ λ surf ( θ s , θ v , φ ) 1 S λ ρ λ surf ( θ s , θ v , φ ) ,
where θ s , θ v , φ represent the solar zenith angle, the viewing zenith angle and the relative azimuth angle, respectively; F λ ( θ s ) ,   T λ ( θ v ) are the transmissions of upward and downward radiance, respectively. S λ is the atmospheric backscattering ratios. ρ λ sat   ,   ρ λ atm   and   ρ λ surf are the TOA (Top of Atmosphere) reflectance, atmospheric path reflectance and surface reflectance at wavelength λ, respectively. Most of the satellite aerosol retrieval algorithms are built on the look-up table (LUT) strategy (i.e., MODIS, VIIRS, etc.). The LUTs contain a series of ρ λ sat calculated under a variety of geometries, aerosol types and aerosol loadings. Major aerosol properties, including AOD and aerosol model, are retrieved by comparing the satellite observed spectral reflectance with the simulated TOA reflectance stored in LUTs.
In the LUT algorithm, aerosol vertical profiles need to be assumed to calculate the TOA reflectance and all the items on the right-hand side of Equation (1) except ρ λ surf will change with the profile assumption. These are typically described using an exponential distribution or Gaussian distribution, and represented by the scale height h, the altitude below which 1–1/e (63%) of the total AOD is present. Different algorithms may assume different h values. For example, all the spherical aerosol types are assumed to be distributed below 10 km with a layer scale height of 2 km in the MISR (Multiangle Imaging Spectroradiometer) algorithm [12]. The VIIRS and MODIS C6_DT algorithms also applied the exponential distribution with a scale height of 2 km over land [13,14], whereas the Gaussian function is assumed in the MODIS Deep Blue algorithm and POLDER (POLarization and Directionality of the Earth’s Reflectances) aerosol retrieval algorithm [15,16]. However, because the real aerosol profile may differ from these assumptions in both the shape and the scale height, the retrieved AOD may be erroneous due to the incorrect aerosol vertical profile used in the algorithm. Wu et al. (2016) suggested that a negative AOD bias of 10% can be caused for elevated smoke or dust layers in the MODIS C6_DT algorithm [10], and, by parameterizing a Gaussian distribution profile with a varying mean height derived from CALIPSO (Cloud-Aerosol Lidar and Infrared Pathfinder Satellite Observation) data, the negative bias can be reduced by 3%–5% over these regions [11].
Nonetheless, there is still a lack of systematic assessment of the impact of aerosol vertical distribution on the accuracy of AOD retrieval. This includes the consideration of different aerosol types, different vertical structures and different underlying surfaces. In particular, as pointed out by previous studies [17,18], AOD retrieval over East Asia, especially China, is still less than satisfactory. It is thus necessary to investigate the aerosol vertical distribution and how this may contribute to the AOD uncertainty over this region. For this purpose, we conduct a series of sensitivity experiments to investigate the impact of aerosol vertical distribution on AOD retrieval accuracy by incorporating different aerosol types and different aerosol profiles. We also examine the effect of replacing lidar retrieved profiles with the exponential profiles. We hope that this study can provide a basis for future algorithm improvements.

2. Description of Radiative Transfer Models

The impact of aerosol vertical profile on AOD retrieval is first investigated through a series of sensitivity experiments using the 6SV and MODerate resolution atmospheric TRANsmission (MODTRAN) radiative transfer models. The two radiative transfer models will be briefly described below.

2.1. 6SV Radiative Transfer Model

The vector version of the Second Simulation of the Satellite Signal in the Solar Spectrum (6SV) is a computer code that can accurately simulate the radiative transfer process. It is capable of accounting for the polarization of radiation, elevated targets and modeling the molecular/aerosol/mixed atmosphere. 6SV calculates Rayleigh and aerosol scattering based on the Successive Orders of Scattering Method. It enables the simulation of satellite and aircraft observations and has been widely used in calculating LUTs for satellite aerosol retrieval algorithms, such as MODIS atmospheric correction algorithms and VIIRS retrieval algorithm [19]. Validation has been made against Bréon’s Monte Carlo code and Coulson’s tabulated values, which indicates agreement to better than 1% [20].

2.2. MODTRAN Radiative Transfer Model

MODerate resolution atmospheric TRANsmission (MODTRAN) [21] is a scalar radiative transfer code developed and maintained by the Air Force Research Laboratory (AFRL) and Spectral Science Inc (SSI). The MODTRAN code simulates radiative transfer processes and calculates the atmospheric transmittance and radiance for wavelengths extending from the ultraviolet to the microwave range (0.2~10,000 μm) with a spectral resolution down to 2 cm−1. Here, we use MODTRAN5.2.2 [22] with higher accuracy to perform experiments with different aerosol types located at different heights.

3. Datasets Used for the Retrieval Experiment Using Observed Profiles

3.1. VIIRS Level 1B Data

In addition to sensitivity experiments, we also perform retrieval experiments with satellite-measured TOA reflectance to test the effect of using observed aerosol vertical profiles. The satellite data used is the Level 1B TOA reflectance data from the VIIRS sensor. VIIRS Level 1B, also known as Sensor Data Records (SDRs), are produced from the Raw Data Records (RDRs), and they contain the calibrated and geolocated TOA brightness temperatures, radiance and reflectance. VIIRS has 22 SDRs, including 16 moderate-resolution bands (M-bands) products with a spatial resolution of 750 m at nadir, five imaging-resolution bands (I-bands) products with a resolution of 350 m at nadir and one Day/Night band (DNB) products with a resolution of 750 m throughout the scan. A previous study showed that the VIIRS reflective solar band radiometric uncertainties in reflectance are within 2% [23]. For simplicity, we perform a dual wavelength retrieval using the 488 and 672 nm channels.

3.2. Micro-Pulse Lidar Aerosol Extinction Profiles
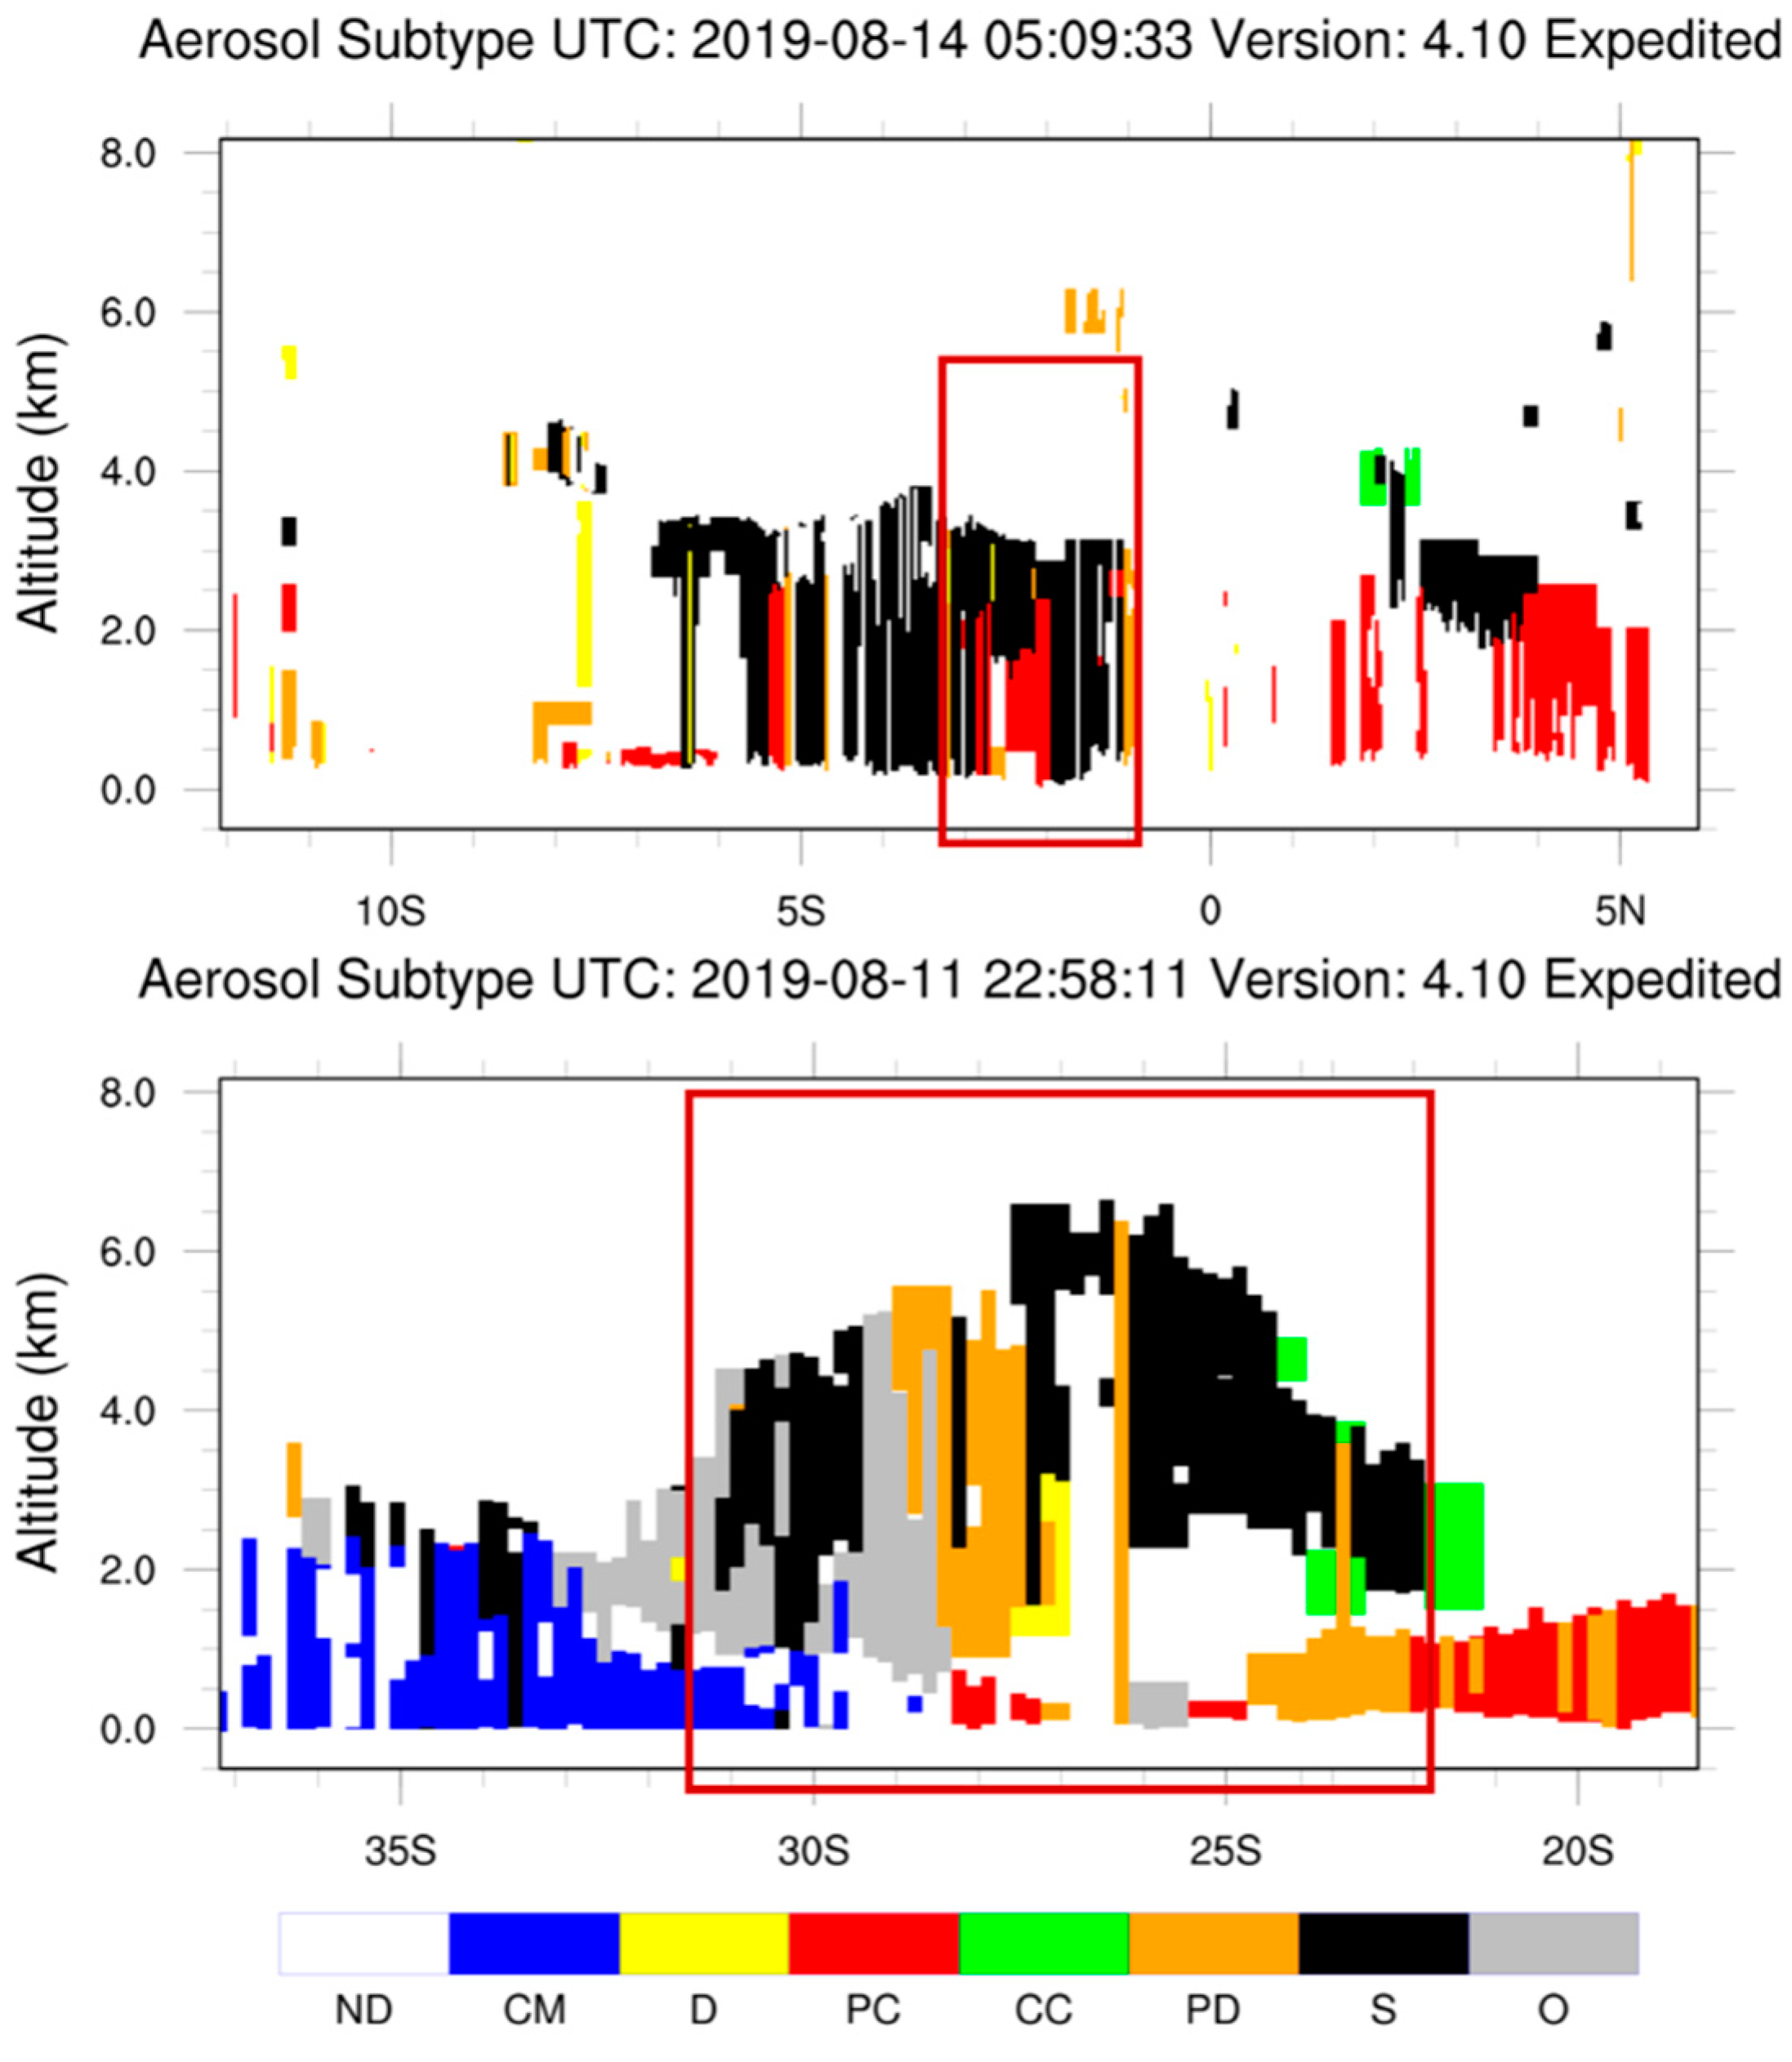
The micro-pulse lidar (MPL) is a useful tool for retrieving the vertical distribution of aerosol extinction with a high vertical and temporal resolution. An MPL device was installed and has been operated by Peking University since July 2016 in Beijing (39.99°N, 116.31°E), the largest megacity in north China. It has a temporal resolution of 15 seconds and a vertical resolution of 15 m, with a 150 m blind zone. The MPL measurements have been averaged into 30-min intervals to improve the signal-to-noise ratio. Only aerosol extinction retrievals below 5 km under no precipitation conditions are used in this study to ensure the quality of MPL data. In total, 171 days of data are selected. Detailed description on the extinction profile retrieval algorithm can be found in [24].

3.3. CALIPSO Data

CALIPSO (Cloud-Aerosol Lidar and Infrared Pathfinder Satellite Observations) is a joint environmental satellite launched in June 2006 by NASA and CNES. A key payload on board CALIPSO is a two-wavelength, polarization sensitive backscatter lidar named CALIOP (Cloud-Aerosol Lidar with Orthogonal Polarization), which can provide high-resolution vertical profiles of elastic backscatter at 532 and 1064 μ m .
In this study, we utilize the aerosol extinction coefficient profiles provided in Version 4.20 of the CALIOP Level 2 product [25]. Specifically, the extinction profiles within a 4° spatial window of the Beijing-PKU site are extracted and averaged. Moreover, basic quality screening strategies are applied. Specifically, if the extinction QC (Quality Control) Flag is greater than 1, extinction uncertainty is greater than 99.9, or, if aerosol layers whose CAD (Cloud-Aerosol Discrimination) scores are greater than −20, data will be screened out.

3.4. AERONET Data

The Aerosol Robotic Network (AERONET) is a ground-based, globally distributed network providing long-term, wide-range observations of aerosol optical, microphysical and radiative properties [26]. The AERONET measurements are used here for two purposes: (1) to provide the optical parameters used in the retrieval experiment with observed profiles and (2) to evaluate satellite retrieval results.
AERONET uses a CIMEL Electronique 318 spectral radiometer to measure direct and diffuse sun radiation to retrieve aerosol optical properties. The total uncertainty of AERONET AOD under cloud-free conditions is < ± 0.01 for λ > 440 nm [26]. We use Version 3 Level 2 quality assured data at the Beijing-PKU site, and the AOD is interpolated to 550 nm using a 2nd-order polynomial fit in logarithmic coordinates [27]. In addition to AOD, inversion products from June 2016 to December 2018, including real and imaginary parts of the complex refractive index, are used, in addition to size distribution parameters, to determine the local aerosol models used in the retrieval experiment. The ground-based parameters are calculated as the temporal averages within ±1 h from the satellite overpass time. Apart from the Beijing-PKU site, AERONET observations from other 92 sites are also used in this study to relate the global distribution of AOD and SSA (Single Scattering Albedo) values to our sensitivity results.

4. Experiments and Results

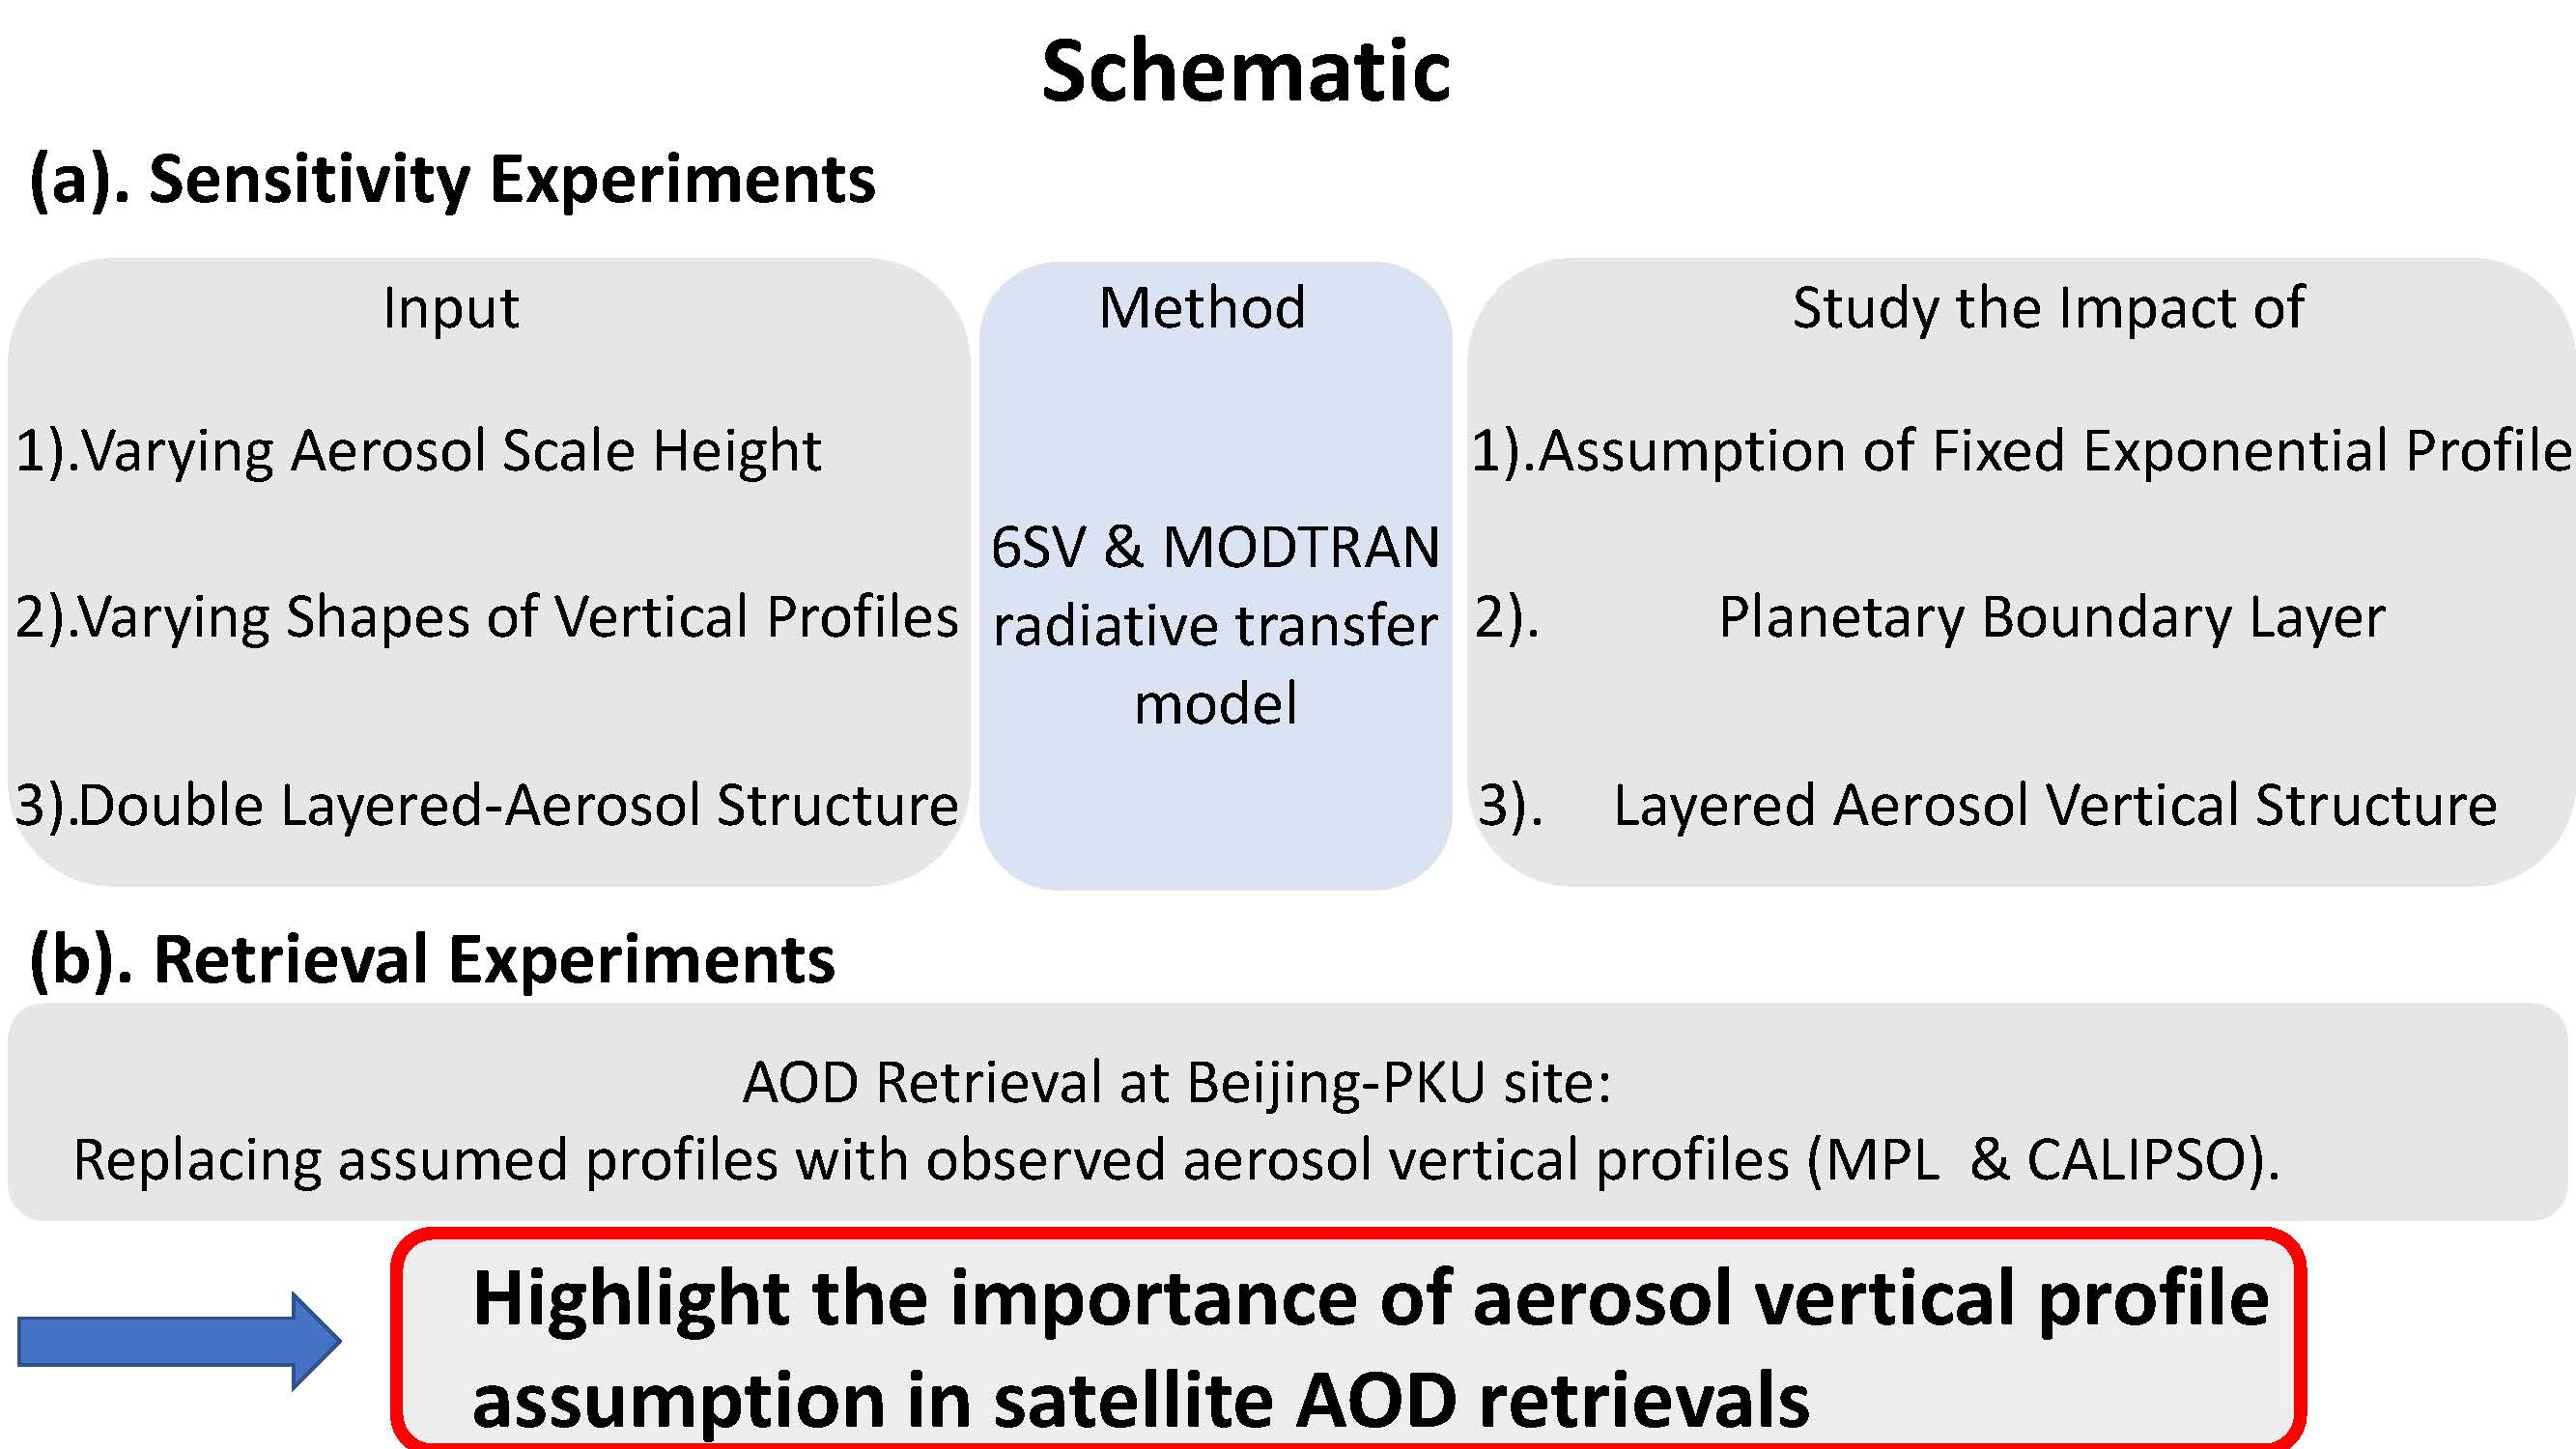
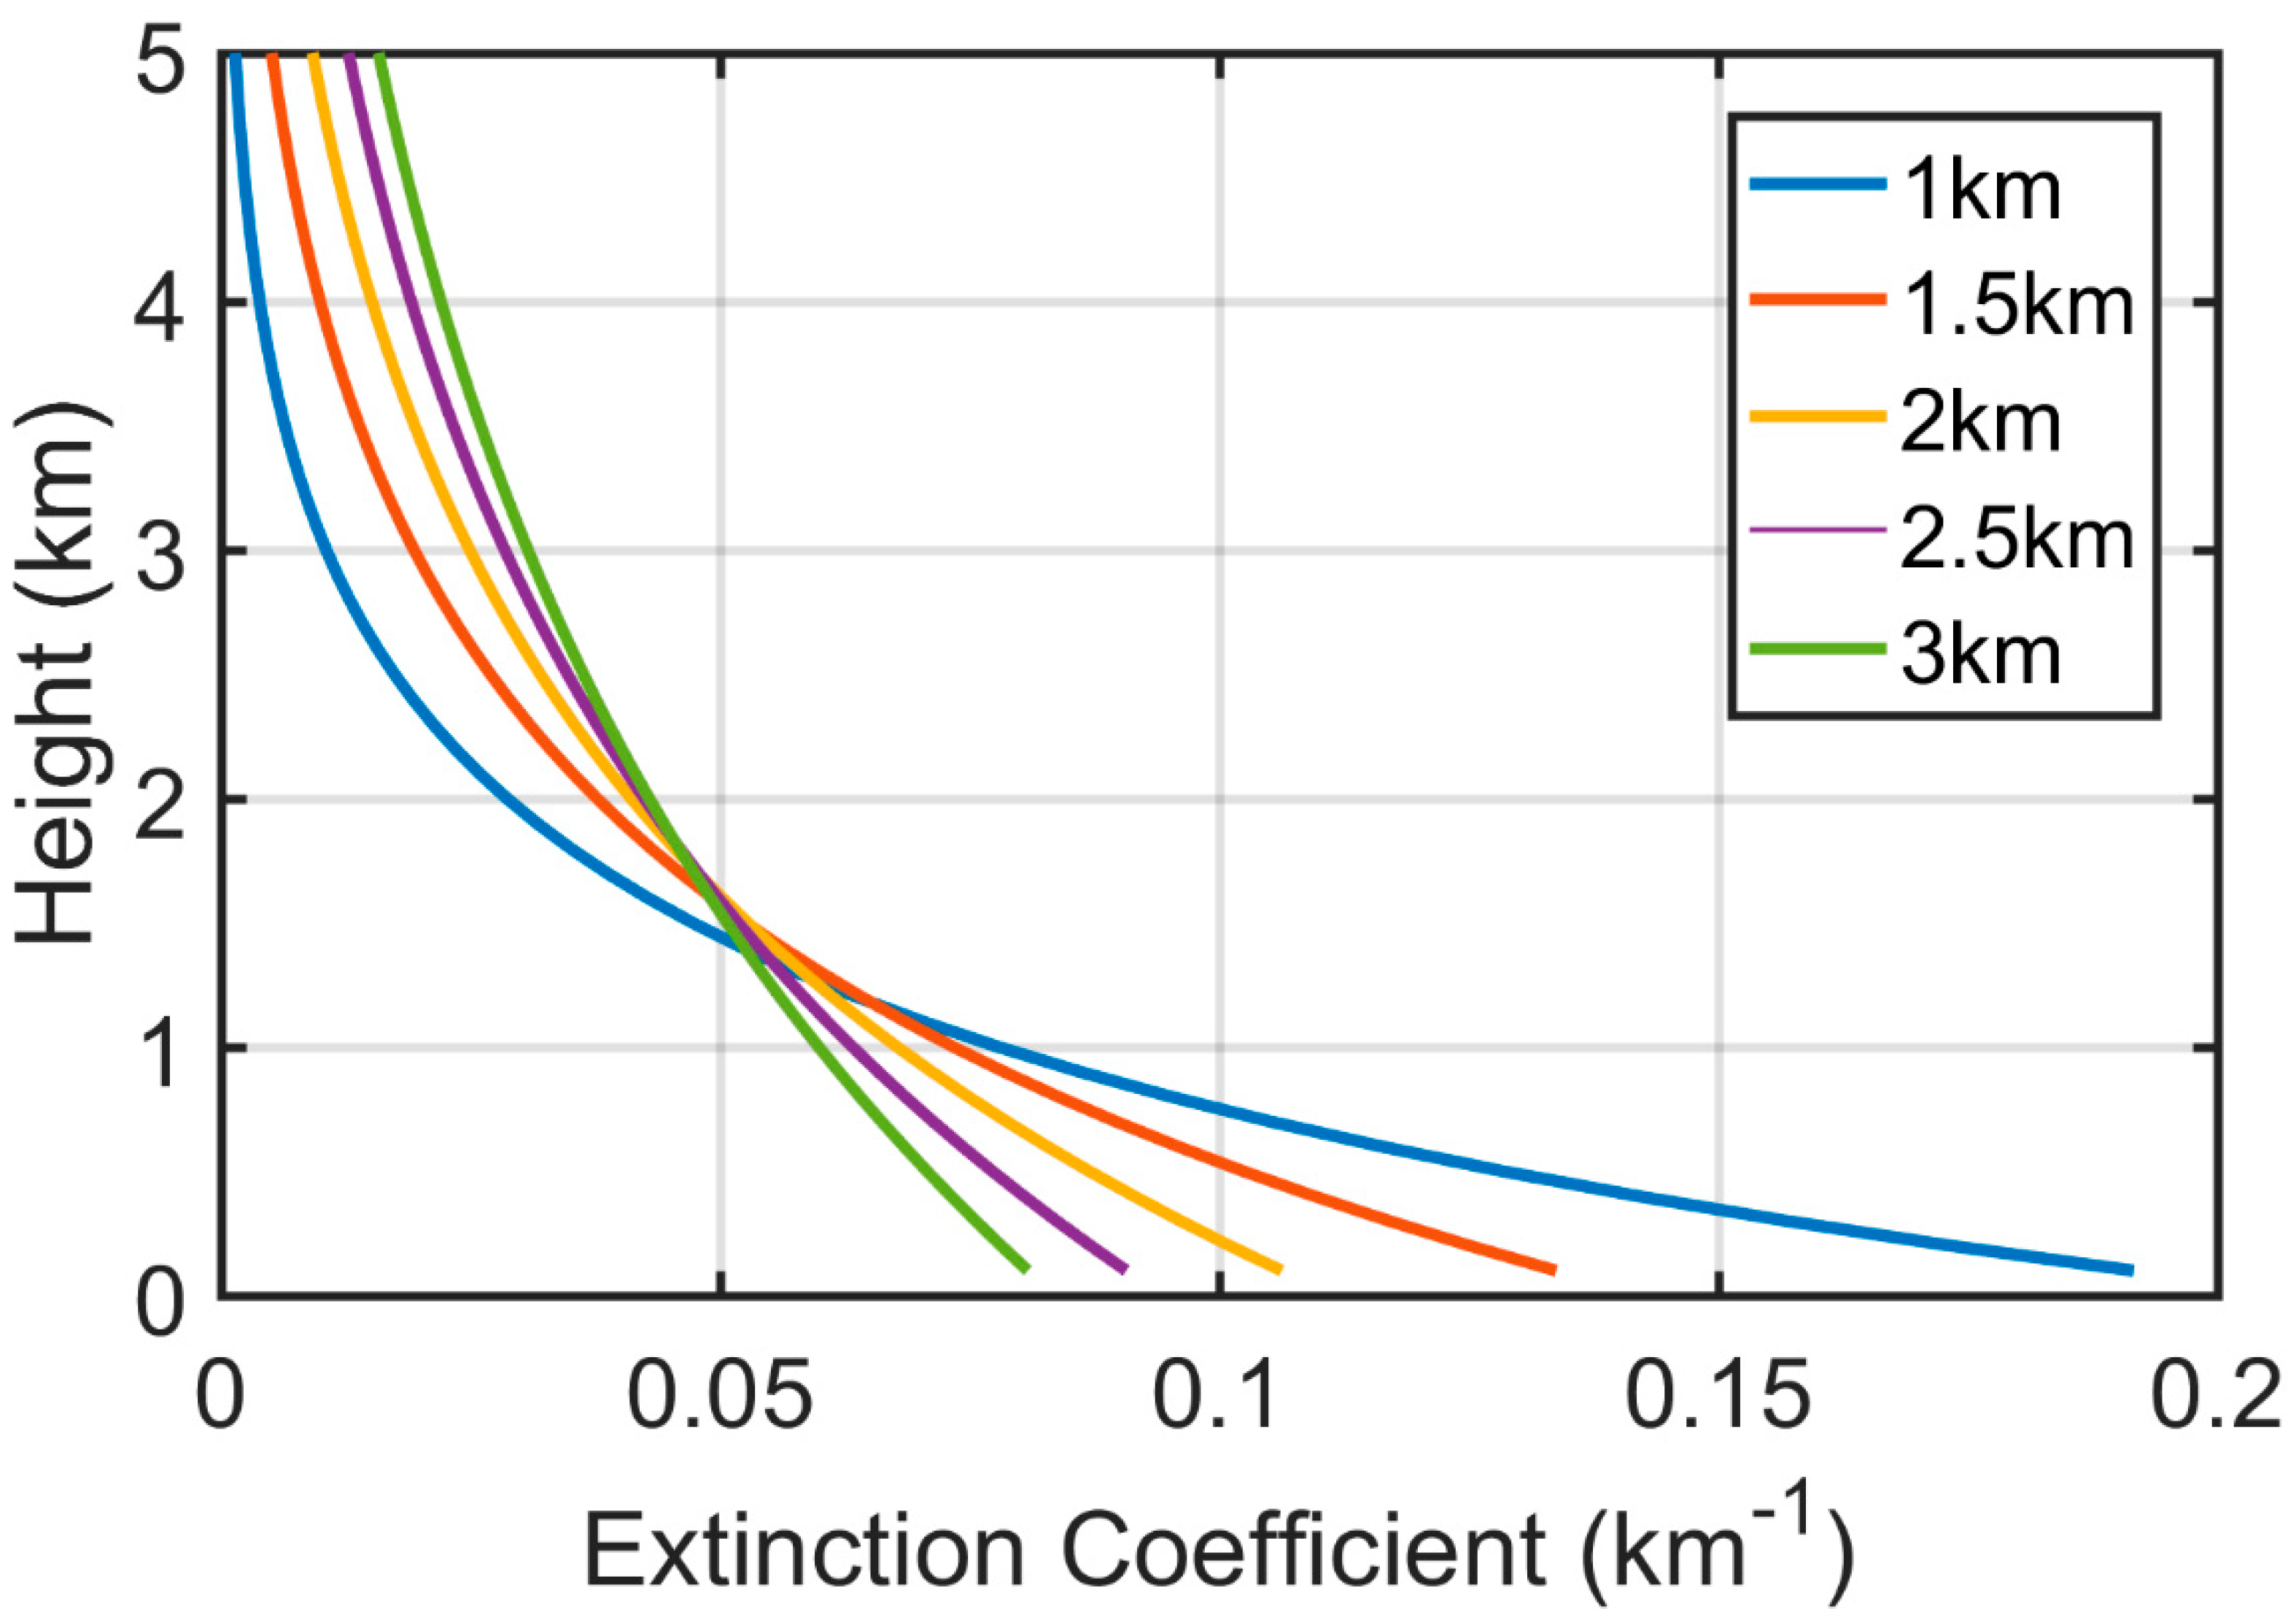
4.1. Impact of Aerosol Scale Height Assuming Exponential Profile

We first investigate the impact of aerosol scale height in retrieval experiments using a perturbation approach. Specifically, we assume that the true scale height is 2 km, and simulate the TOA reflectance at 488 and 672 μm (corresponding to the M3 and M5 channels of VIIRS, respectively) observed by satellites at nadir view with 200 aerosol loadings ranging from 0.01 to 2.00 using the 6SV radiative transfer model. We then retrieve AOD with these simulated TOA reflectances but perturb the scale height by ±1 km and calculate the retrieval error as:
relative   error ( τ ) = τ τ ref τ ref   ,
where τ ref is the reference AOD value used to simulate TOA reflectance with scale height set to 2 km, and τ is the retrieved AOD value by matching the TOA reflectance simulated with different scale heights to the reference TOA reflectance.
We consider three representative aerosol types, namely desert dust, fine scattering aerosol and fine absorbing aerosols, and four surface reflectances ranging from 0.02 to 0.2. Figure 1 shows the assumed vertical profiles with different scale heights used in the study, from which it is clearly seen that as scale height decreases, more aerosol is concentrated in the lower atmosphere. Figure 2 shows the spectral variability of single scattering albedo (SSA) and asymmetry parameter (g) for the three aerosol types embedded within the 6SV model, namely continental, urban and desert dust aerosols.
Figure 3a presents the relationship between AOD error and the aerosol scale height error for three aerosol types assuming AOD = 0.2 and surface albedo = 0.05. Note the true scale height is assumed to be 2 km and the error is defined as the difference between the scale height used in the retrieval and the true scale height. It is clearly seen that the error in the retrieved AOD increases as a function of the error in scale height, and the impact of scale height is the strongest for fine absorbing aerosols, i.e., a scale height error of 1 km can lead to an AOD error exceeding 30%. The effect of negative and positive scale height error is asymmetric, indicating the non-linear response of the AOD to the aerosol vertical distribution. Moreover, since the AOD retrieval uncertainty is usually required to be within 20% for satellite remote sensing, according to Figure 3a, the scale height uncertainty needs to be confined within ±0.8 km for absorbing aerosols. For scattering aerosols and dust, AOD is not as sensitive to scale height, and the AOD uncertainty is below 3% with ±1 km of scale height variation. The reason for the different behavior of absorbing and scattering aerosols is that, for pure scattering aerosols, their effect is an overall increase in planetary albedo and is only related to column averaged optical properties. For absorbing aerosols, the mechanism is more complicated and involves the balance between aerosol loading and the length of the absorption light path. For a certain aerosol layer at any height, the light will experience the absorption by upper aerosols, scattering and absorption by this aerosol layer, and the re-absorption by the upper aerosol layer. If the scale height is biased low, aerosol loading in the upper layers is less but the absorption light path is longer, and vice versa for high scale height bias. The effect of aerosol loading and light path cancels out at ~ Δ scale height = 0.1 km, where AOD error equals zero (Figure 3a), below or above which the wrong assumption of scale height will both introduce a high bias in the scattered radiation and thus a low bias in AOD. However, the relationship shown in Figure 3a also depends on surface albedo and will be discussed later. The absolute value of AOD also has some impact on the AOD–scale height error relationship, i.e., the relative error gradually decreases with the increase in AOD when AOD < 0.1 but remains stable when AOD further increases (Figure 3b).
The relationship in Figure 3a also depends on surface albedo. For absorbing aerosols, the error first increases when surface albedo increases from 0.02 to 0.05. Interestingly, when surface albedo further increases to 0.10, the Δ%AOD–Δscale height relationship becomes reversed, and when it reaches 0.20, the relationship turns nearly flat (Figure 4). A possible explanation of this phenomenon is that the TOA reflectance observed by satellite comprises the reflectance from both the atmosphere and surface. For lower surface albedos, the reflectance from atmosphere is the dominant component of the TOA reflectance observed by satellite. If the scale height is biased high, the absorbing aerosols are higher up in the atmosphere, hence more solar radiation will be absorbed by aerosols and more aerosol loadings are needed to compensate for the TOA reflectance observed by the satellites. However, as the surface albedo increases, the TOA reflectance will be dominated by the reflected radiation from the surface. If we assume that absorbing aerosols are located higher in the atmosphere (positive Δscale height), in the radiative transfer calculation, there will be more radiation for them to absorb and less radiation reflected back to the satellite, which means the retrieval algorithm will produce a larger AOD to compensate for the radiation loss by the extra absorption. The reverse is true for negative Δscale height. On the other hand, when surface albedo is high, the reflected radiation from the surface becomes the dominant term, and a negative Δscale height means more absorption of radiation from the surface, thus leading to a positive ΔAOD. However, when surface albedo becomes very high, the signal from aerosol will be dwarfed by the surface and the aerosol vertical distribution will make a negligible impact. The results for scattering aerosols and dust are not sensitive to surface albedo and will thus be skipped here.

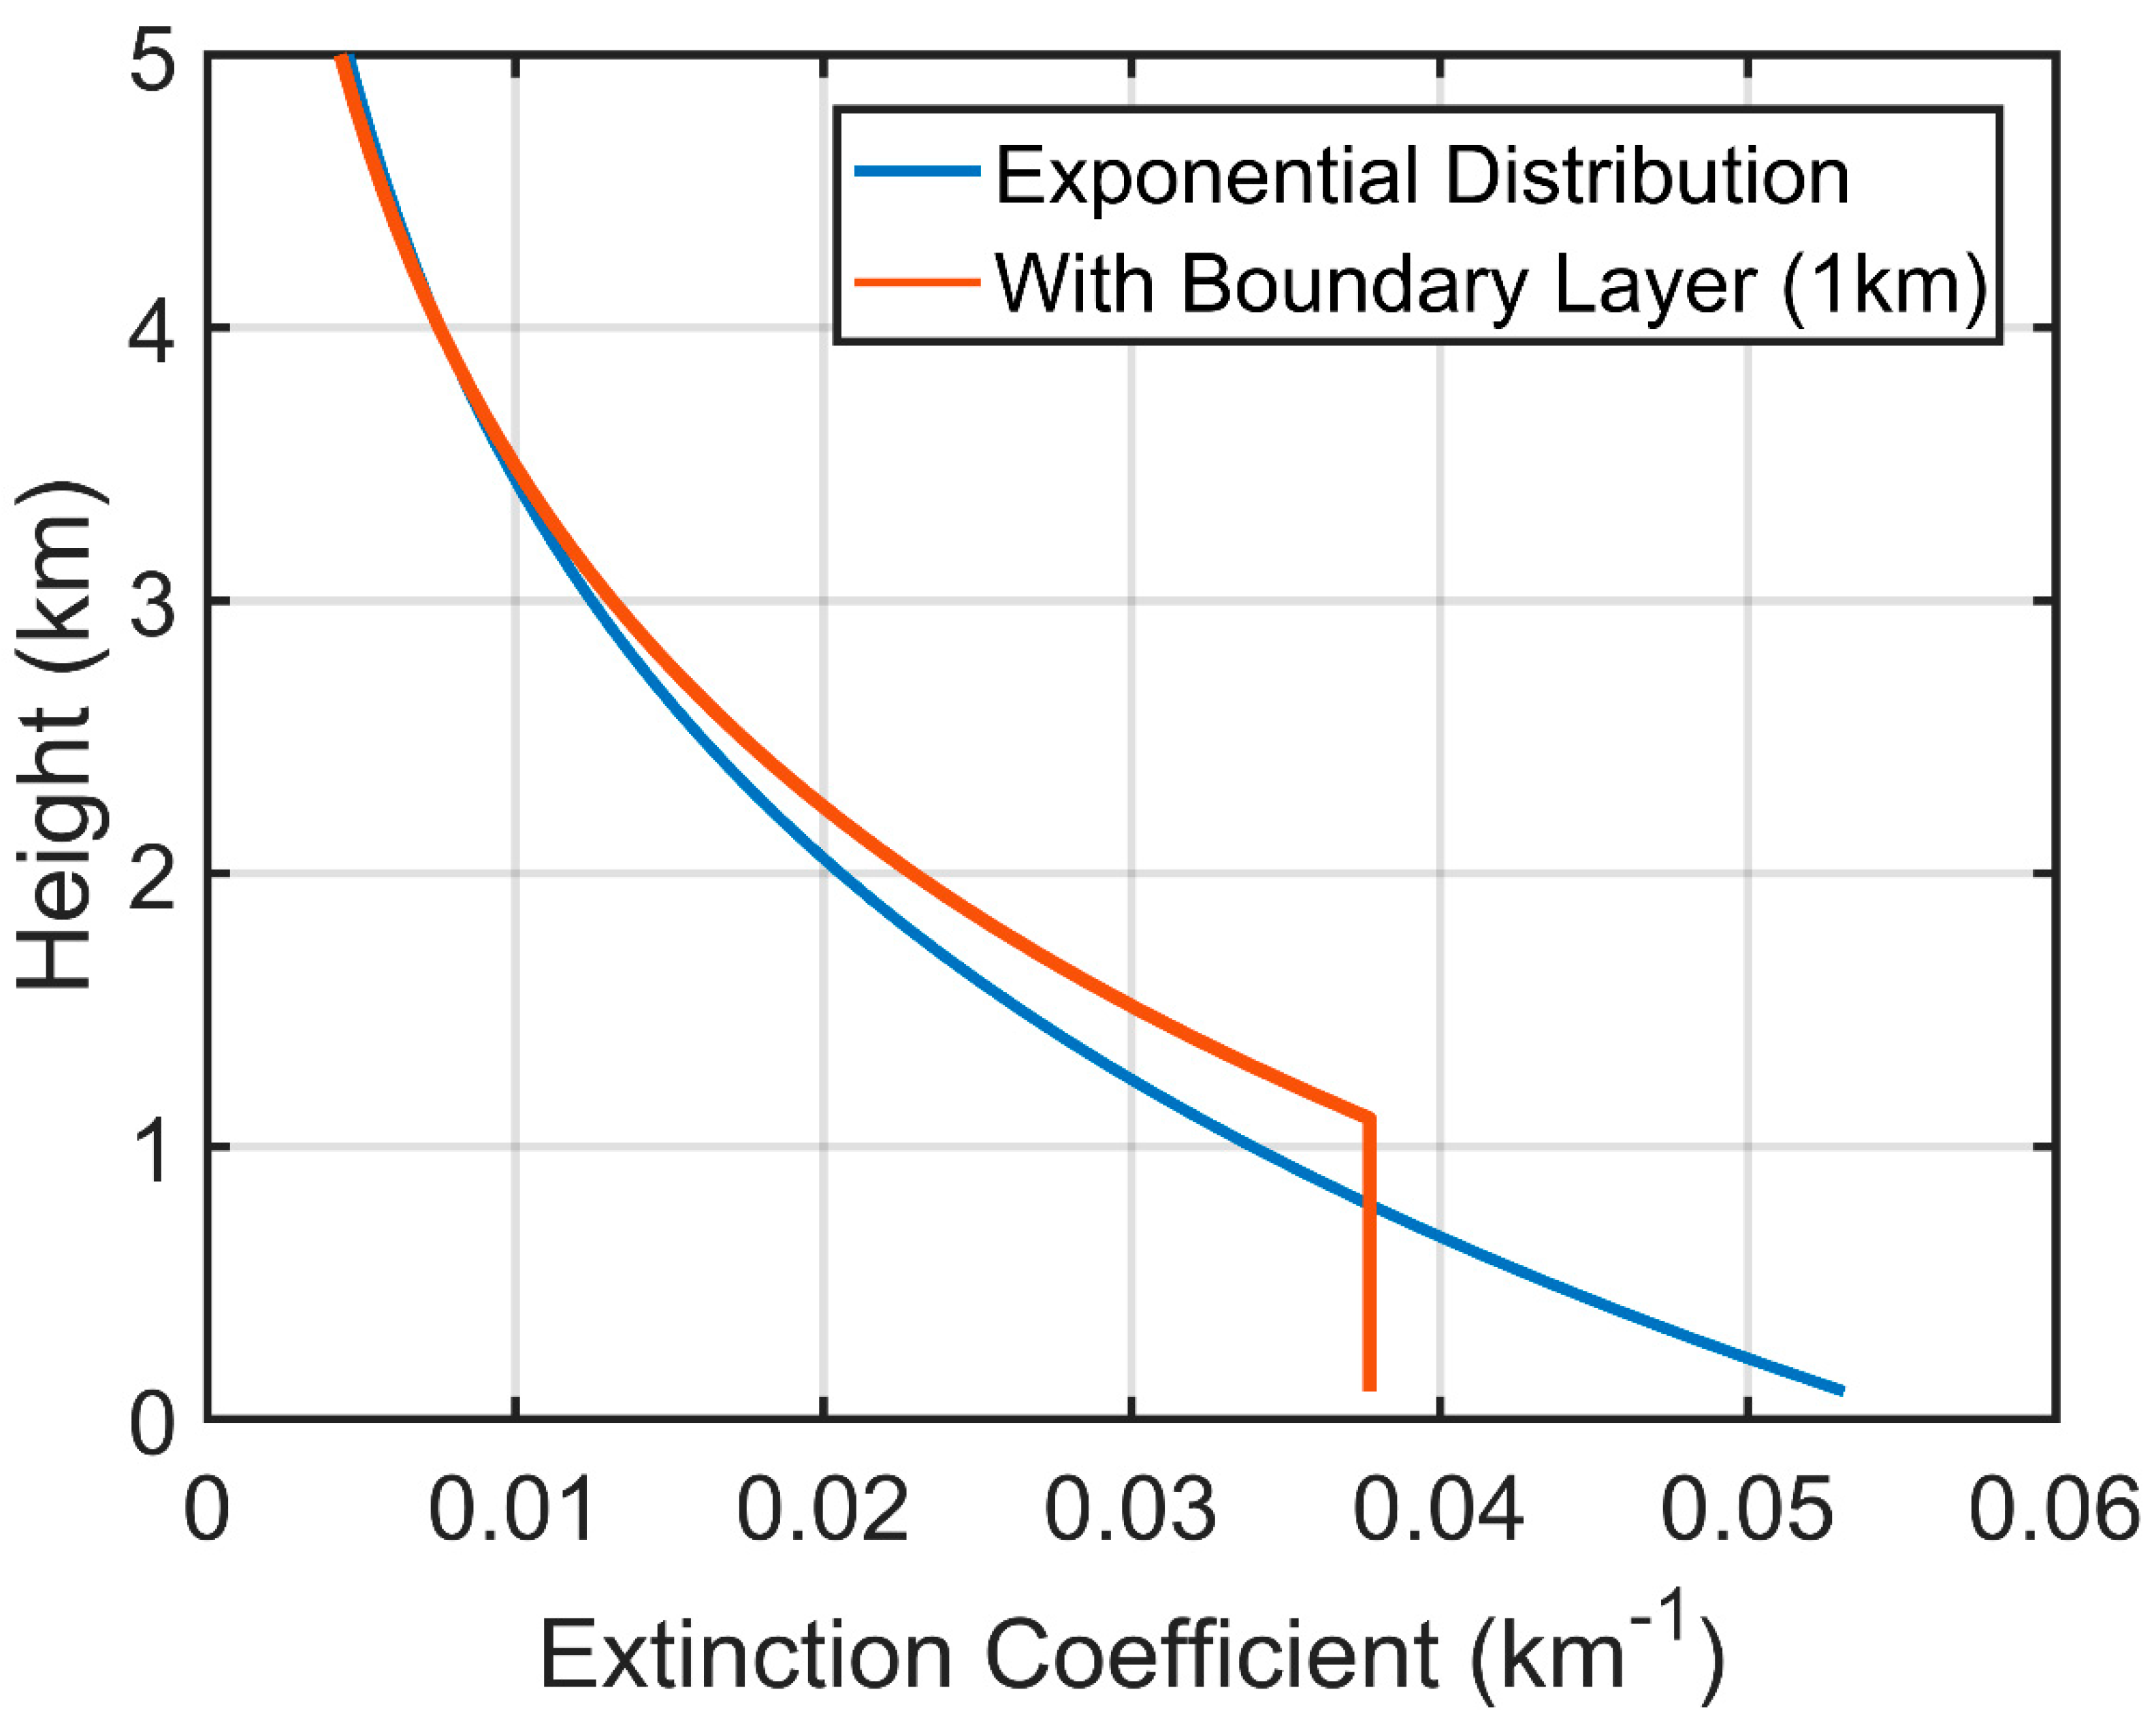
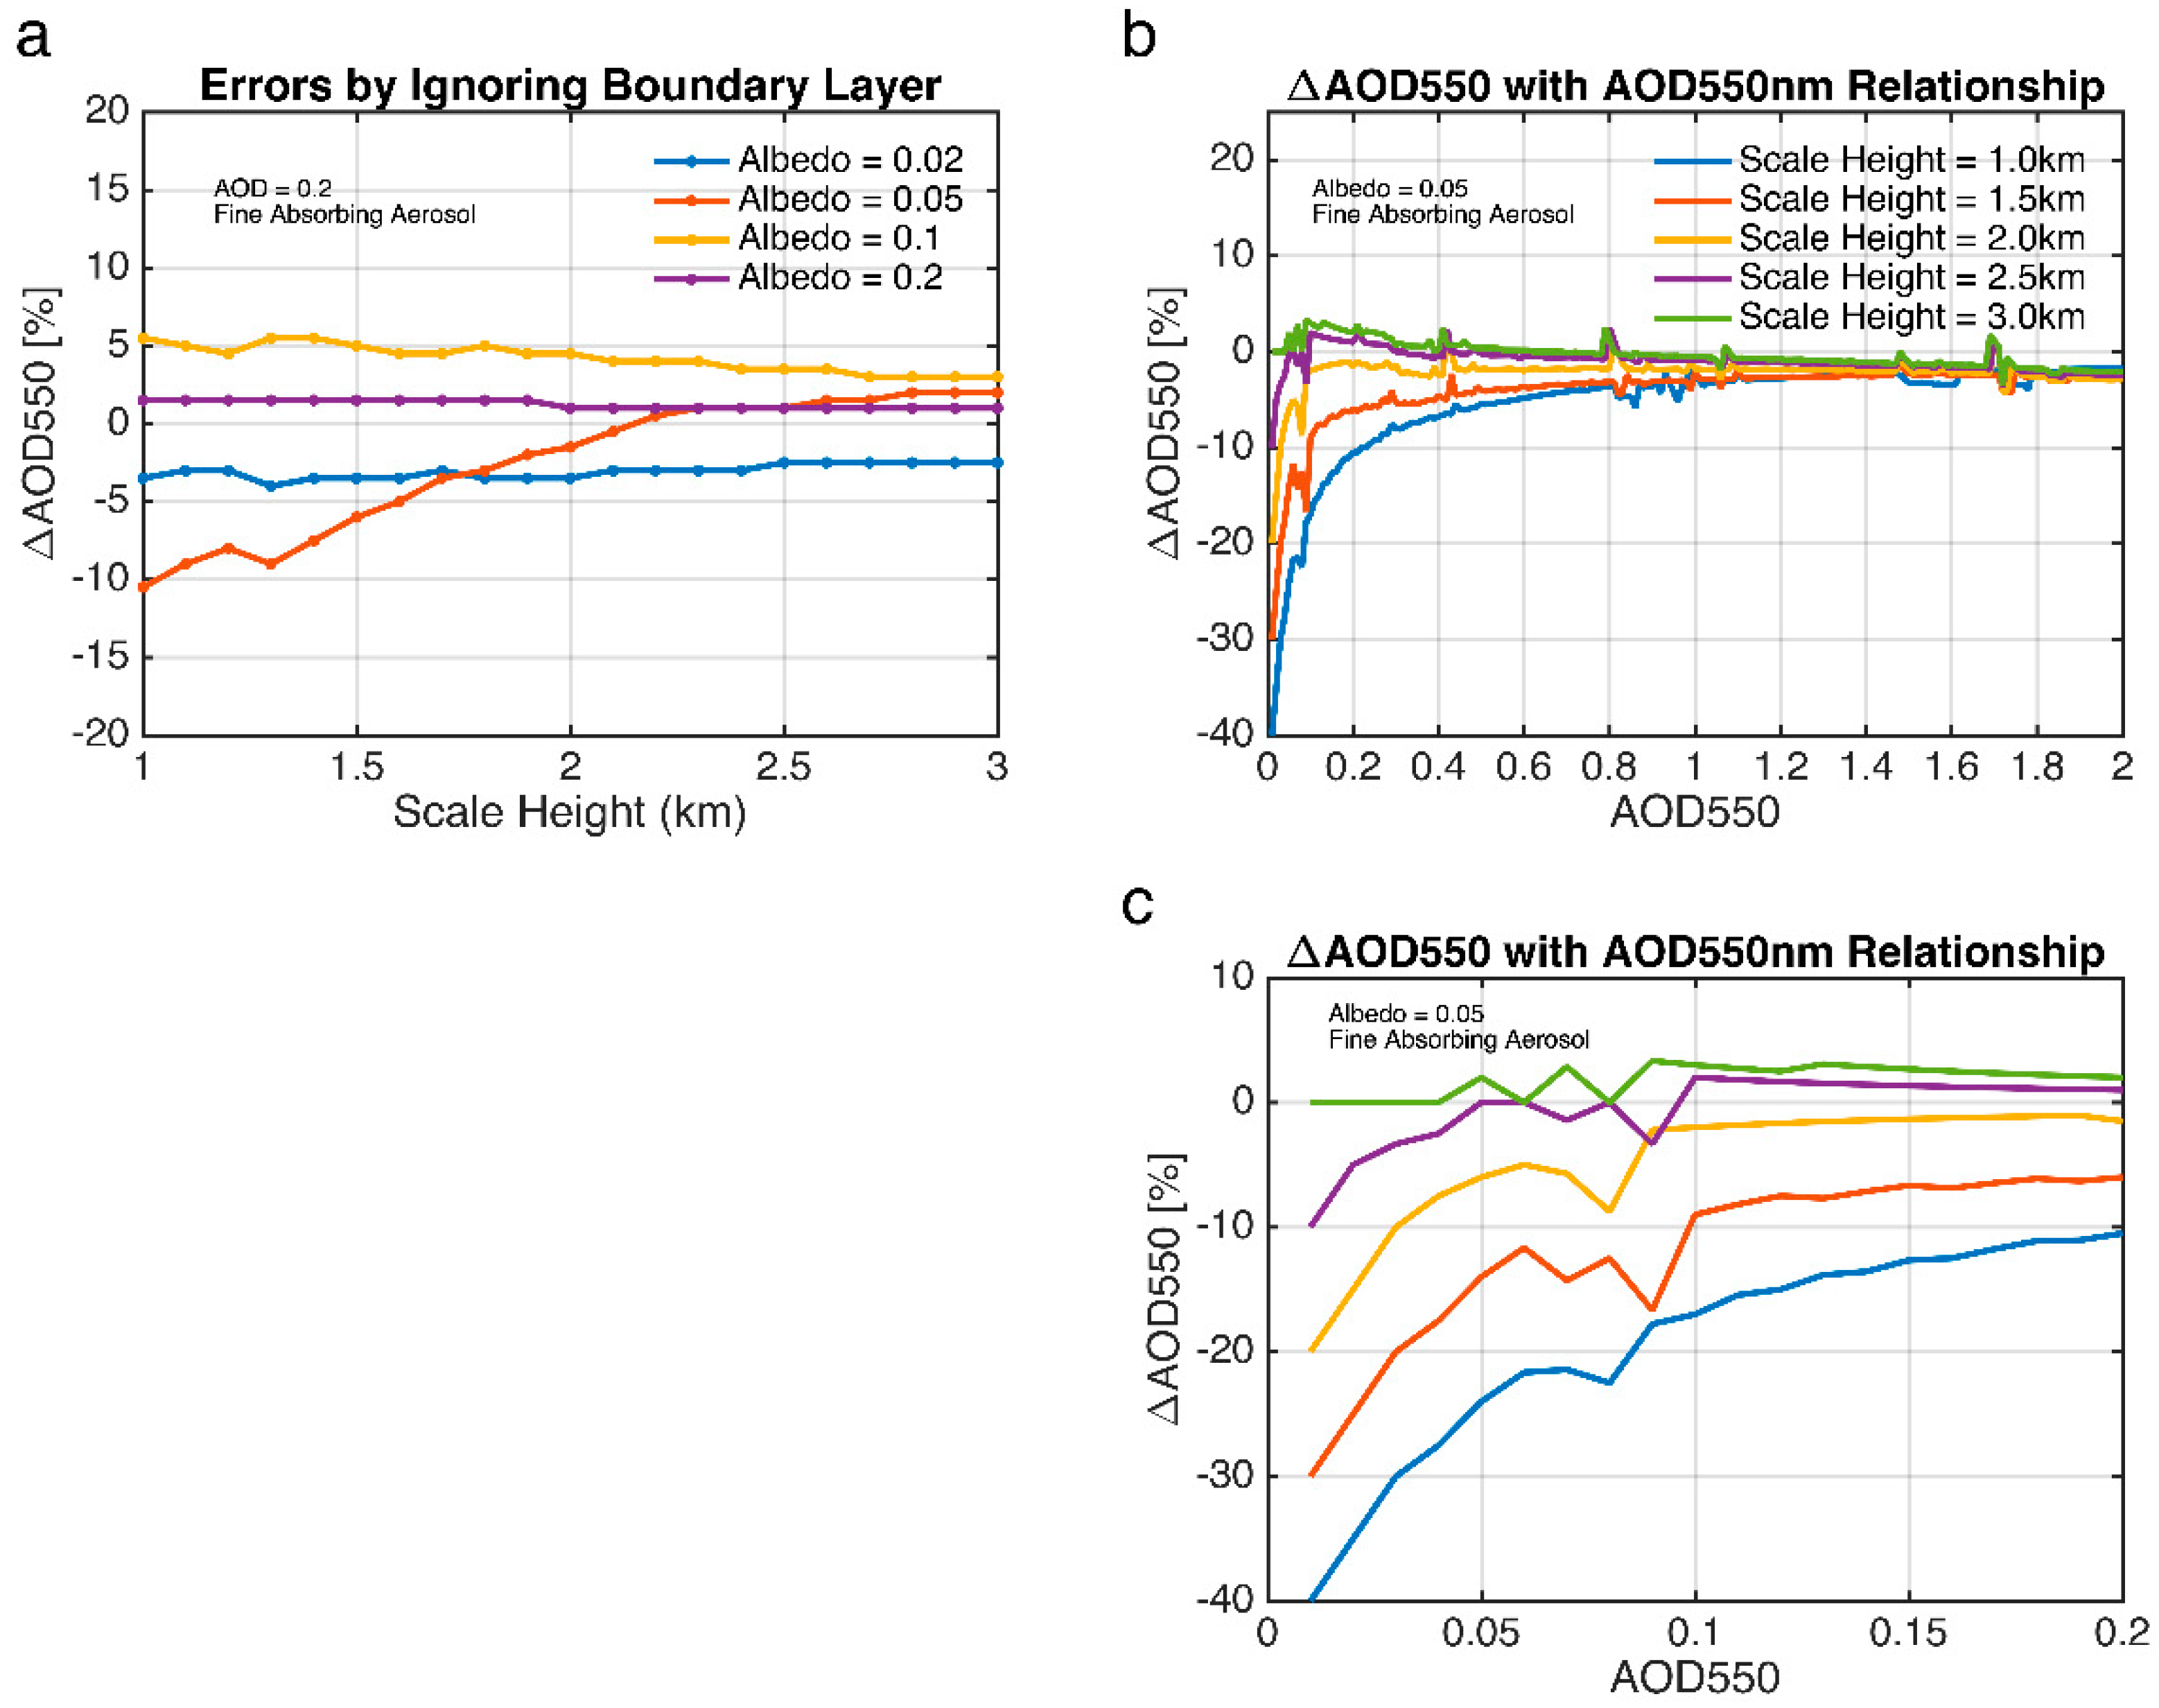
4.2. Impact of the Planetary Boundary Layer

In reality, the aerosol vertical profile may differ from the exponential shape. A typical case is the existence of a lower atmosphere planetary boundary layer (PBL). The aerosols tend to distribute relatively uniformly within the PBL, but their concentration can decrease sharply above it. This structure is frequently observed in the Beijing area, and Figure 5 gives several examples from MPL measurements, i.e., the bulk of pollutants is concentrated within the near-surface layer and decreases rapidly from the altitude of 1~2 km. Because the PBL is generally not considered in the retrieval algorithm, it is necessary to assess the impact, on AOD retrieval, of neglecting the PBL when it actually exists. We therefore perform the following experiment. Two models are assumed to characterize aerosol vertical distribution (see Figure 6). The first model (blue line) only considers an exponentially decreasing profile starting from the surface, whereas the second model (red line) includes a 1-km-thick boundary layer within which the aerosols are well mixed. We perturb the scale heights from 1~3 km with a 0.1-km step size. Errors are defined by Equation (2) as well, except that the τ ref is the reference AOD value used to simulate TOA reflectance with the boundary layer, and τ is the retrieved AOD value by matching the TOA reflectance simulated without the boundary layer to the reference TOA reflectance.
The AOD errors are shown in Figure 7 (note that Figure 7 only shows the results for fine absorbing aerosols because, for scattering aerosols and dust, AOD is not sensitive to vertical distribution assumptions). It is seen that the retrieval error can be as large as ~10% for AOD = 0.2 if ignoring the PBL in the retrieval, but will decrease to ~5% for AOD > 0.5. Similar to Figure 4, the error is also sensitive to the surface albedo, i.e., when the surface albedo is lower than 0.1, AOD errors are almost negative, but they turn to positive when surface albedo increases. When surface albedo becomes sufficiently large (0.20), the AOD errors become negligible. Even with the same scale height, considering the PBL means that the aerosols will be distributed closer to the surface (see Figure 6) than those without considering the PBL. It is thus easy to interpret the magnitude and sign change of the AOD error using the mechanism discussed in the last section. In addition, similar to Figure 3b, the error is a function of AOD loading: the relative error can reach above 20% when AOD loading is rather small (< 0.1), but it can be confined within 5% for AOD = 1. In summary, our results indicate that the PBL structures can have a nonnegligible impact on the accuracy of AOD retrievals. To constrain AOD uncertainty within 20%, it is better to incorporate a profile with PBL in the retrieval algorithm.

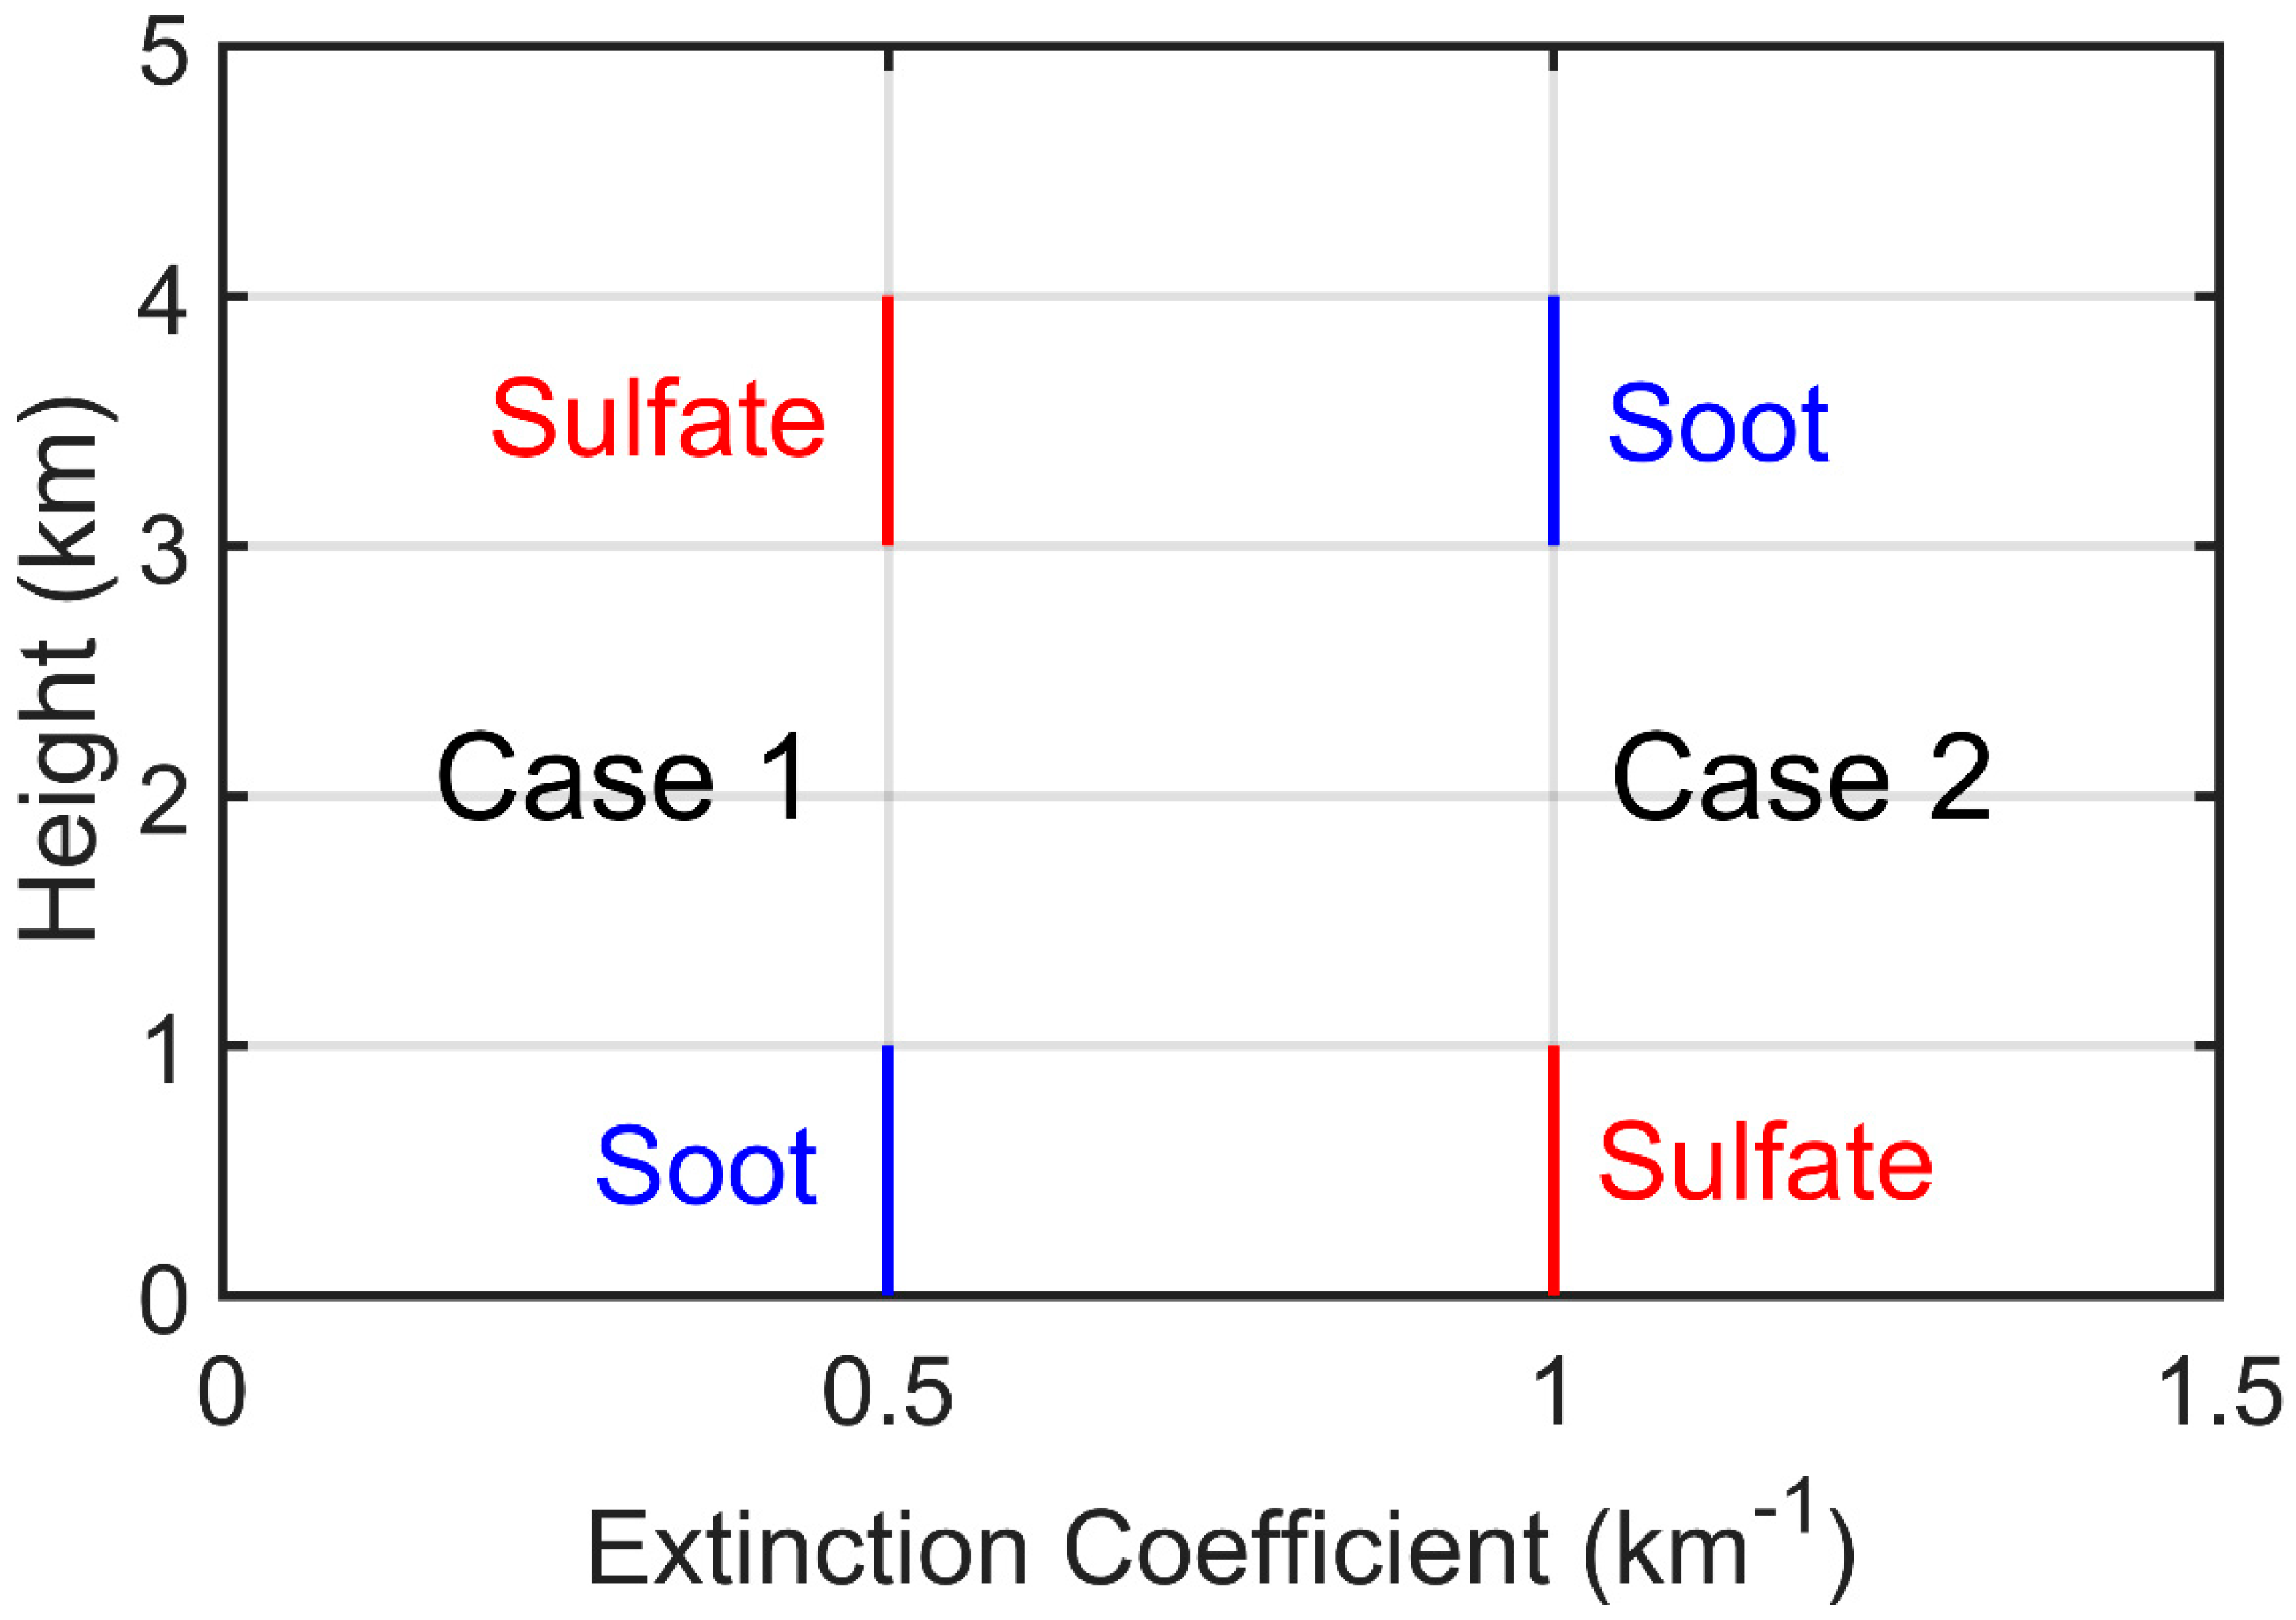
4.3. Impact of Layered Aerosol Vertical Structure

Another possible scenario of aerosol vertical distribution is the existence of two aerosol layers with different aerosol types, such as elevated smoke layer transported over polluted regions. Figure 8 shows two examples of this phenomenon from CALIPSO observations. The first is from South America, where elevated smoke aerosols at around 3 km are observed over polluted continental aerosols. The second example shows a similar structure with smoke located above polluted dust aerosols over South Africa. We thus investigate the impact of using one exponential profile when the aerosol distribution is actually layered in this section. The MODTRAN model is used for this experiment because the 6SV model does not allow prescribing two aerosol profiles.
In the experiment, we design two ideal layered aerosol structures, as depicted in Figure 9. The first structure has soot lying between 0–1 km and sulfate aerosols (under 50% relative humidity) lying between 3–4 km above the surface (case 1). The second structure is reversed with soot lying above sulfate (case 2). The optical parameters for sulfate and soot aerosols are obtained from the Optical Properties of Aerosols and Clouds (OPAC) database [28], and their SSA and g values at different wavelengths are shown in Figure 10.
In both cases, the optical depth fractions for soot and sulfate are 10% and 90%, respectively. We first calculate the TOA reflectance at nadir view for these two cases, and then use these TOA reflectances to retrieve AOD, assuming an exponential profile with a scale height of 2 km. The SSA and g used are equivalent values, assuming the external mixing of the two aerosol components.
Figure 11 shows the retrieved AOD error, assuming a mixed exponential profile relative to the two layered cases. First, it is seen that the AOD errors are reversed for the two cases, i.e., errors are positive when soot lies above sulfate and negative when soot lies below sulfate. The explanation of this phenomenon could be that in case 1, sulfate above blocks solar radiation from reaching the black carbon layer, thus reducing its absorptivity and increases TOA reflectance, whereas, for case 2, scattering aerosol underneath will act as a bright surface, which enhances black carbon absorption and thus reduces the TOA reflectance compared to the mixed case. The errors are also quite large and asymmetric, with larger errors for the soot above sulfate case. For case 2, when soot lies above, errors can reach 28% for AOD = 0.5 and exceed 85% for a heavily polluted situation (AOD = 1.0). For case 1, the error is −18% when AOD = 0.5 and reaches −40% when AOD = 1.0. These results reflect the nonlinear radiative interaction of different aerosol types within the column, and that more diversified profiles will help improve AOD retrievals.

4.4. AOD Retrieval Using Observed Aerosol Vertical Profiles

In the above discussion, we have shown that the AOD retrieval error is highly sensitive to aerosol profile, especially for absorbing aerosols. In addition to sensitivity experiments, we further explore whether the retrieved AOD will improve if we use observed aerosol profiles in the algorithm. We focus on the Beijing-PKU site, because complete aerosol optical and vertical measurements by the sun photometer and MPL lidar are available here.
AOD is retrieved using Level 1B TOA reflectance data from the VIIRS sensor onboard the Suomi-NPP satellite. The geometric conditions (solar, satellite zenith angle and relative azimuth angle) were pre-calculated for the site location and satellite overpass time. Our retrieval algorithm is based on the LUT approach: the LUT is pre-calculated for a set of geometrics, aerosol loading, aerosol model, and surface parameters using the 6SV radiative transfer code. To minimize the impact on the retrieval results by other factors such as aerosol model and surface albedo assumptions, we use aerosol optical properties and surface albedo from the AERONET inversion products. The surface is assumed to be Lambertian and the surface reflectance is obtained from sun-photometer observations. The aerosol models were re-constructed using sun-photometer measurements, spectral SSA and g values of which are shown in Figure 12.
For comparison, we generate two sets of LUTs by using the real aerosol extinction profiles retrieved by the MPL during the satellite overpass time and the exponential profiles with a scale height of 2 km, respectively. The spectral reflectance observed by Suomi-NPP is compared with the spectral reflectance from the LUT, and the retrieved AOD is determined by minimizing the residual constructed from the difference in the M3 (488 μ m ) and M5 (672 μ m ) channels. The retrieval results using these two LUTs are subsequently evaluated against AERONET AOD. In total, 111 cases are successfully retrieved for the one-year experiment (July 2017 to June 2018).
Figure 13 shows the scatter plots of retrieved AOD using the two sets of vertical profiles against AERONET AOD, and the evaluation statistics are summarized in Table 1. Overall, the results using observed profiles (red dots) exhibit better agreements with AERONET than those using the exponential profile (blue dots). The mean bias is reduced from 0.15 to 0.03, precision is reduced from 0.015 to 0.002, and correlation increased from 0.63 to 0.83. Seasonally, the improvements are the most significant in the winter season, with a greatly reduced mean bias (from 0.38 to −0.05) and RMSE (root mean square deviation) (from 0.09 to 0.01) and a greatly increased correlation (from 0.48 to 0.77) (Figure 14 and Table 1). This is because absorbing aerosols are the most frequently observed aerosol type in the winter season due to residential heating. The two outliers in the original retrieval result at the upper left corner of Figure 13 result from large differences between the observed and assumed aerosol profiles with highly absorbing aerosols present, i.e., the 440 nm SSA for these two cases are 0.89 and 0.88, respectively. As shown in Figure 15, the winter season has generally lower SSAs compared to the other seasons, with ~65% cases having SSA < 0.90. According to Section 4.1, the impact of vertical distribution is the most significant for absorbing aerosols; therefore, more improvements are seen in the winter season when using the observed profiles.
In addition, a similar one-year experiment (July 2017 to June 2018) using regionally averaged extinction profiles by CALIPSO around the Beijing-PKU site is also conducted as this dataset is globally accessible. Similar to Figure 13, the results in Figure 16 using CALIPSO profiles (red dots) more clearly agree with AERONET than those using assumed profiles (blue dots), with the mean bias reduced from 0.20 to 0.14 and correlation coefficient increased from 0.53 to 0.80. The most obvious improvements are also observed in winter, with a greatly reduced mean bias (from 0.43 to 0.01) and RMSE (from 0.14 to 0.01) and a greatly increased correlation (from −0.02 to 0.75) (Figure 17).
It should be noted that, due to the narrow footprint of CALIPSO ground track, the sample size for the CALIPSO experiment is smaller than that in Figure 13 and Figure 14. Moreover, unlike the dual-wavelength retrieval algorithm performed in the above experiment, a single-channel (532 μ m ) retrieval is performed here since only 532 and 1064 nm extinction profiles are available for CALIPSO. Nonetheless, the improvements in the winter season still imply the feasibility of applying global aerosol vertical profiles in a satellite retrieval algorithm.

5. Discussion

In the previous section, we use radiative transfer models to study the sensitivity of satellite AOD retrievals to the aerosol vertical profile assumptions, and found that the effect is the most obvious for absorbing aerosols and also depends on the total aerosol loading (i.e., AOD). To fully evaluate how aerosol profile assumption may impact on AOD retrieval spatially and temporally, it is necessary to discuss the results in a global context, i.e., using the sensitivity results to infer whether aerosol profile assumption is likely a significant source of uncertainty for different regions and different seasons.
We examine the distribution of major aerosol optical parameters for seven major regions, namely North America (NAM), South America (SAM), Europe, North Africa and the Middle East (NAME), South Africa (SAF), Asia and Oceania, whose spatial domains are shown in Figure 18. Figure 19 and Figure 20 display the probability density distributions of AOD and SSA for these seven regions from AERONET data, averaged using measurements from the sites where long-term and continuous observations are available, marked by the red dots on Figure 18. Different features are observed for different regions. In general, NAME and Asia exhibit a right-shifted AOD distribution with a longer tail than the other regions, suggesting that they tend to have a larger mean AOD and more extreme values. Oceania and NAM have the lowest overall aerosol loadings (with the most left-shifted AOD distribution), and the AOD for SAF and SAM lies in between. For regions with larger aerosol loading, the issue about vertical profile assumption has an important effect because a large absolute error can occur. This effect is not negligible even for regions with smaller AOD values because the relative error can be large, as discussed above. The highest SSA are found at the Oceania sites, especially in spring (MAM) and summer (JJA), and the lowest are found in SAF, Asia and SAM. The SSA distribution over SAF is also closely related to the seasonal biomass burning, i.e., they are flat in spring and winter (DJF) but have strong peaks in summer and fall (SON) [29]. The probability density function (PDF) of SSA also exhibits a peak in the fall for the SAM, which may be associated with the peak burning season in August and September in Brazil [29]. The shapes of SSA PDF for Asia show little seasonal variability, with slightly lower values for winter due to heating [30] and higher values for summer due to secondary aerosol production and hygroscopic growth [31,32].
According to the results in Section 4, the AOD retrieval error is most sensitive to aerosol profiles for absorbing aerosols. This means that regions with lower SSA values are more prone to aerosol profile assumptions in the retrieval process. Relating this to the aerosol properties over different regions, we can see that the vertical distribution will also have the most impact over Asia in winter, and over SAF and SAM in the fall.

6. Conclusions

In this study, we discuss the impact of aerosol vertical distribution assumption on satellite AOD retrievals through model sensitivity studies and retrieval experiments. We consider three different aerosol profile structures, including the commonly used exponentially decreasing profiles with different scale heights, the exponential profile with a 1-km-thick boundary layer, and a two-layer structure with different aerosol types. A retrieval experiment is also carried out to compare the performance of AOD retrieval using exponential aerosol profiles and those retrieved by a lidar.
Our main conclusions are:
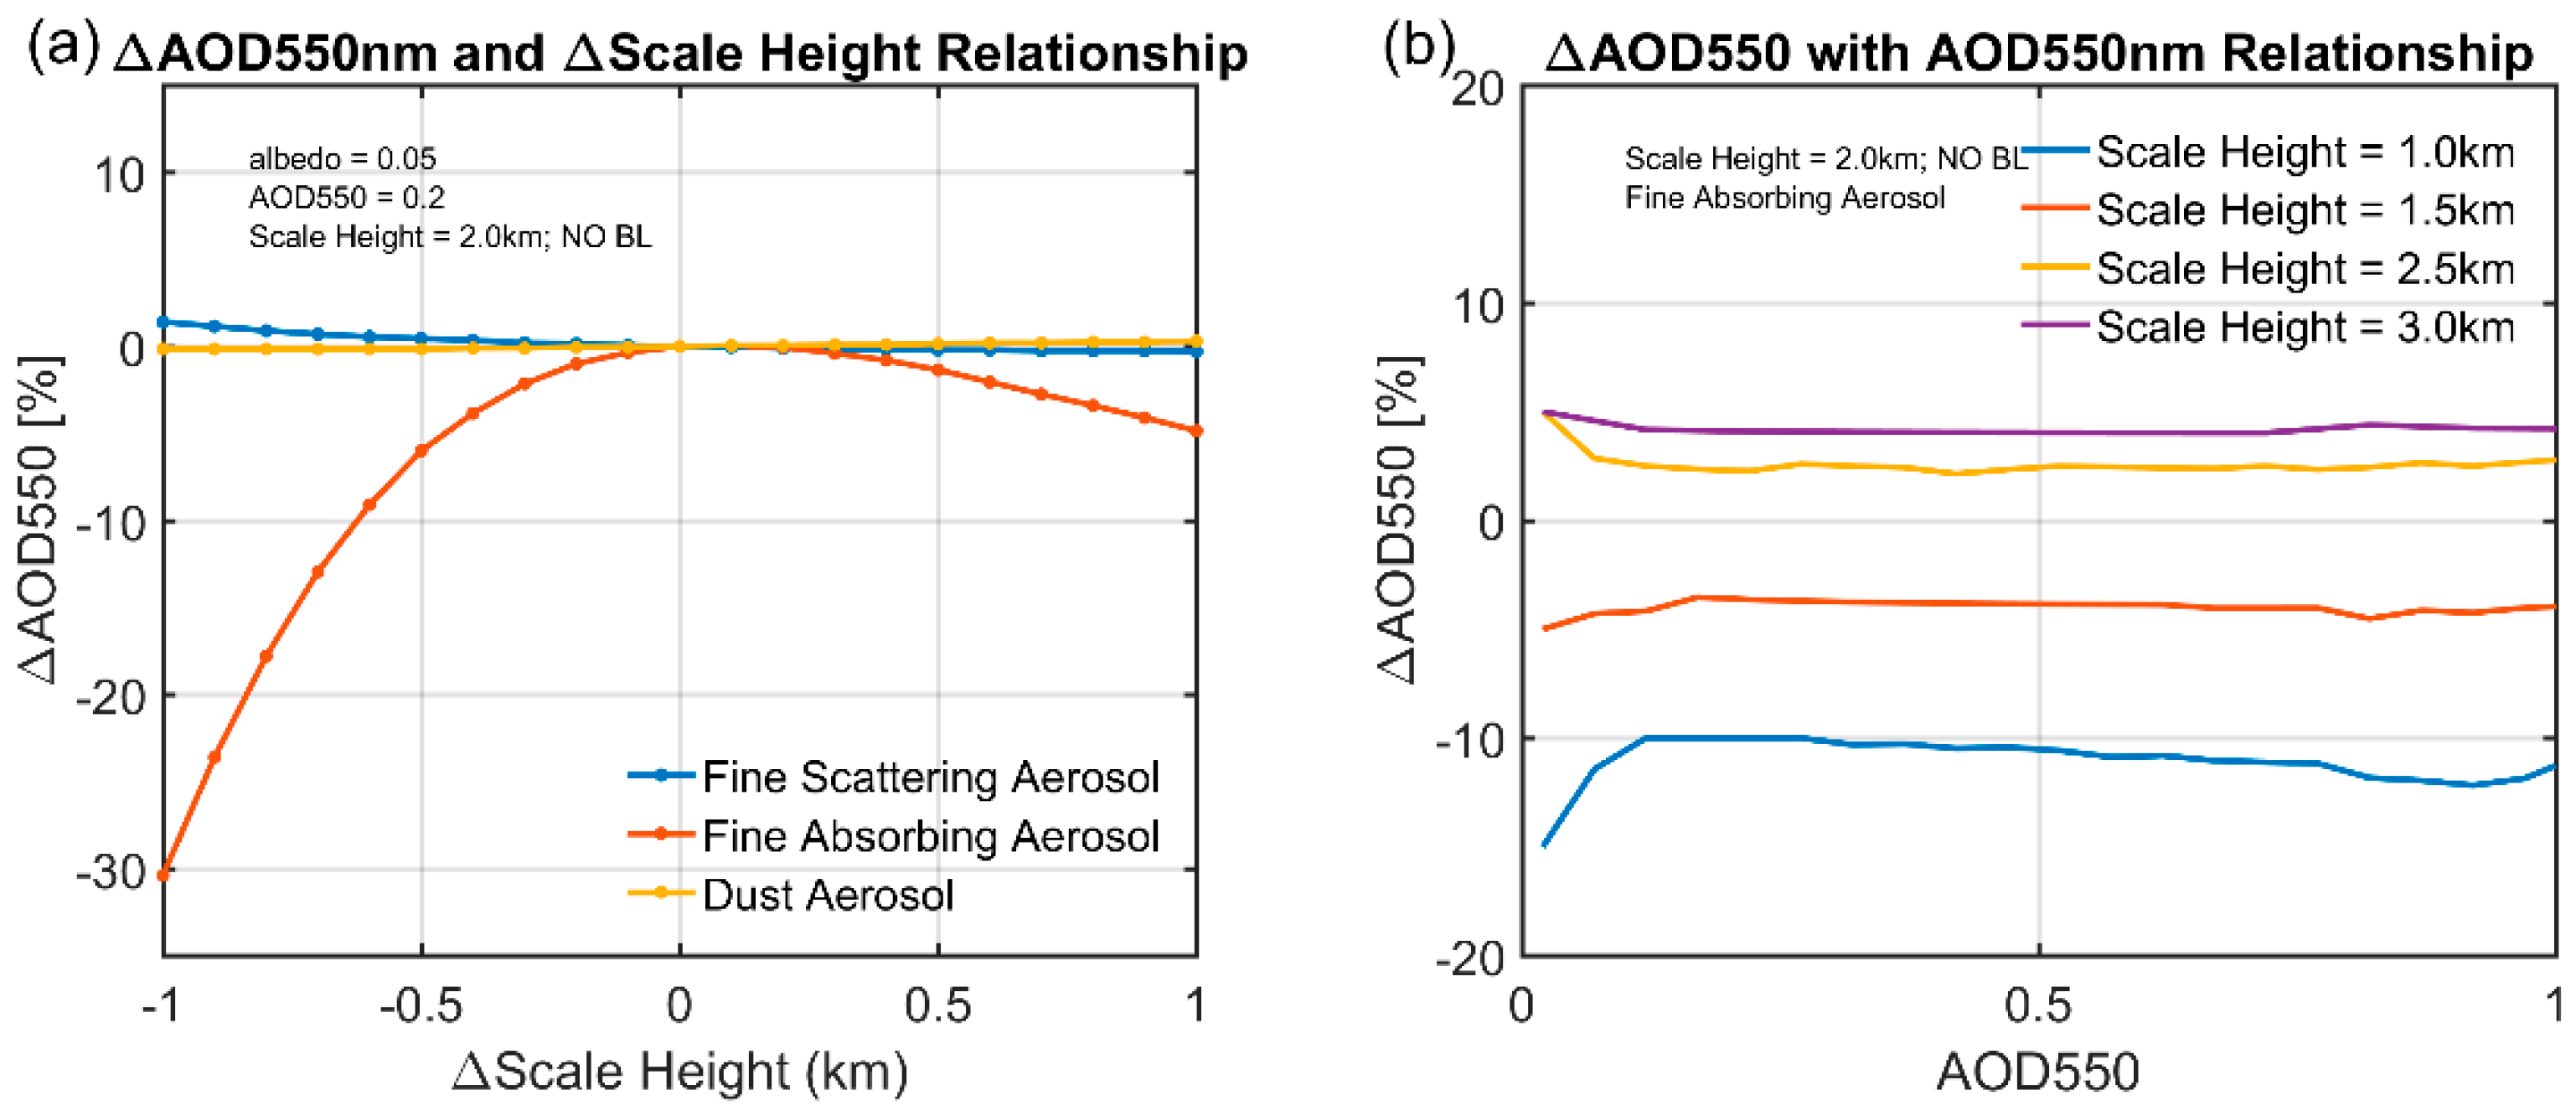
  • The retrieved AOD is the most sensitive to aerosol vertical distribution for fine absorbing aerosols. The relative errors can exceed 30% for a −1-km scale height uncertainty when AOD = 0.2.
  • The surface albedo has a large impact on the ΔAOD–Δscale height relationship. At a lower surface albedo, the AOD error varies positively with scale height error, but it shifts to negative relationships when surface albedo increases to 0.1. The AOD error becomes less sensitive to scale height error when surface albedo further increases.
  • Neglecting the boundary layer will lead to an AOD error up to ~10% for absorbing aerosols at AOD = 0.2.
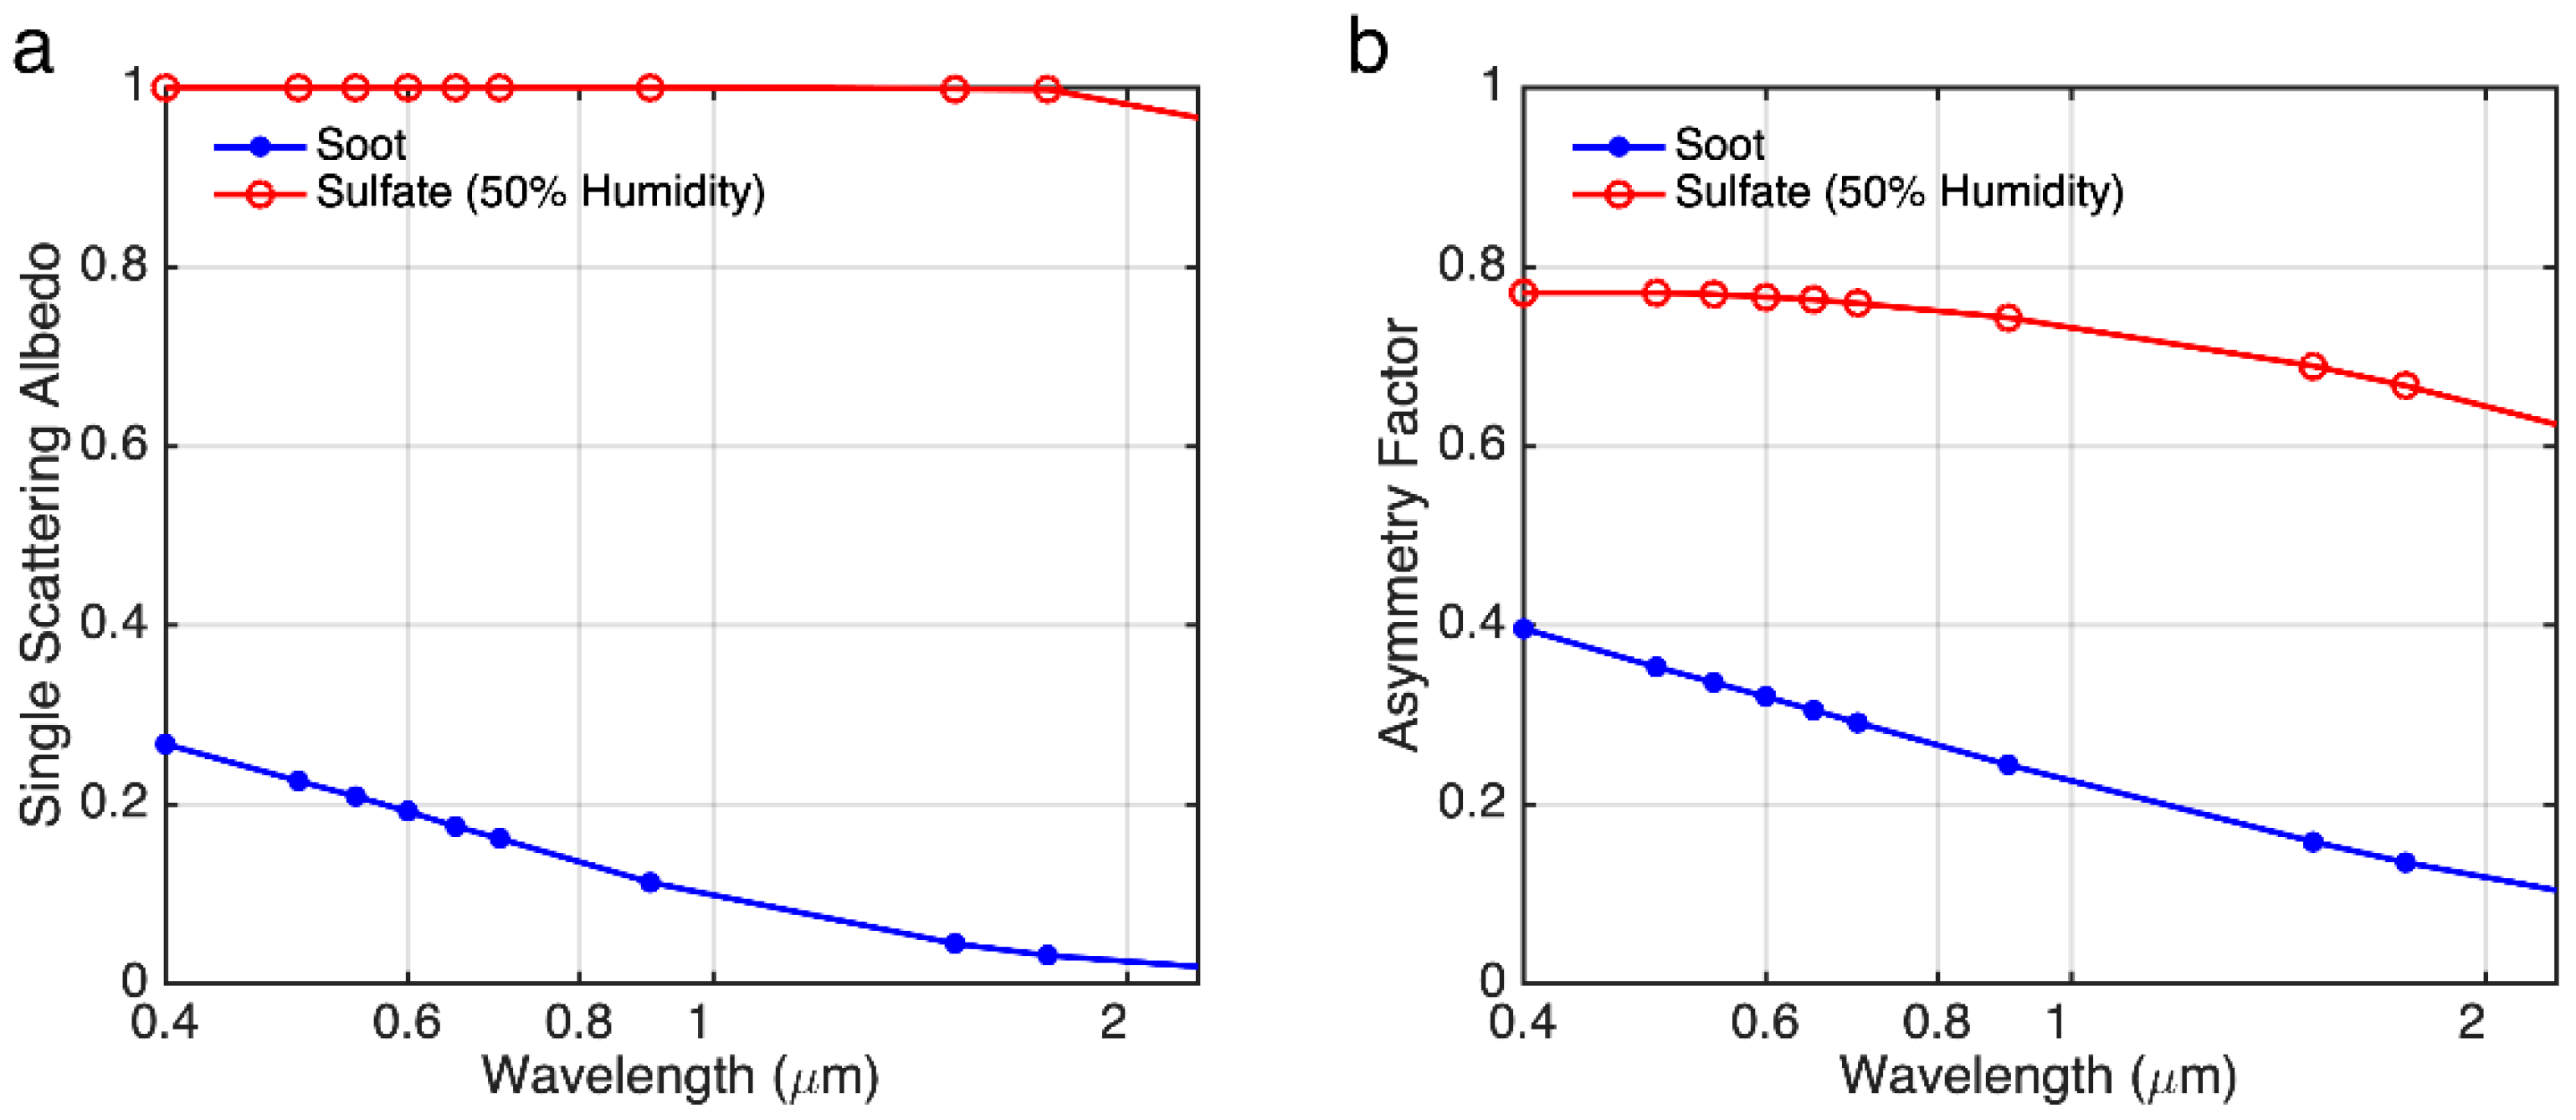
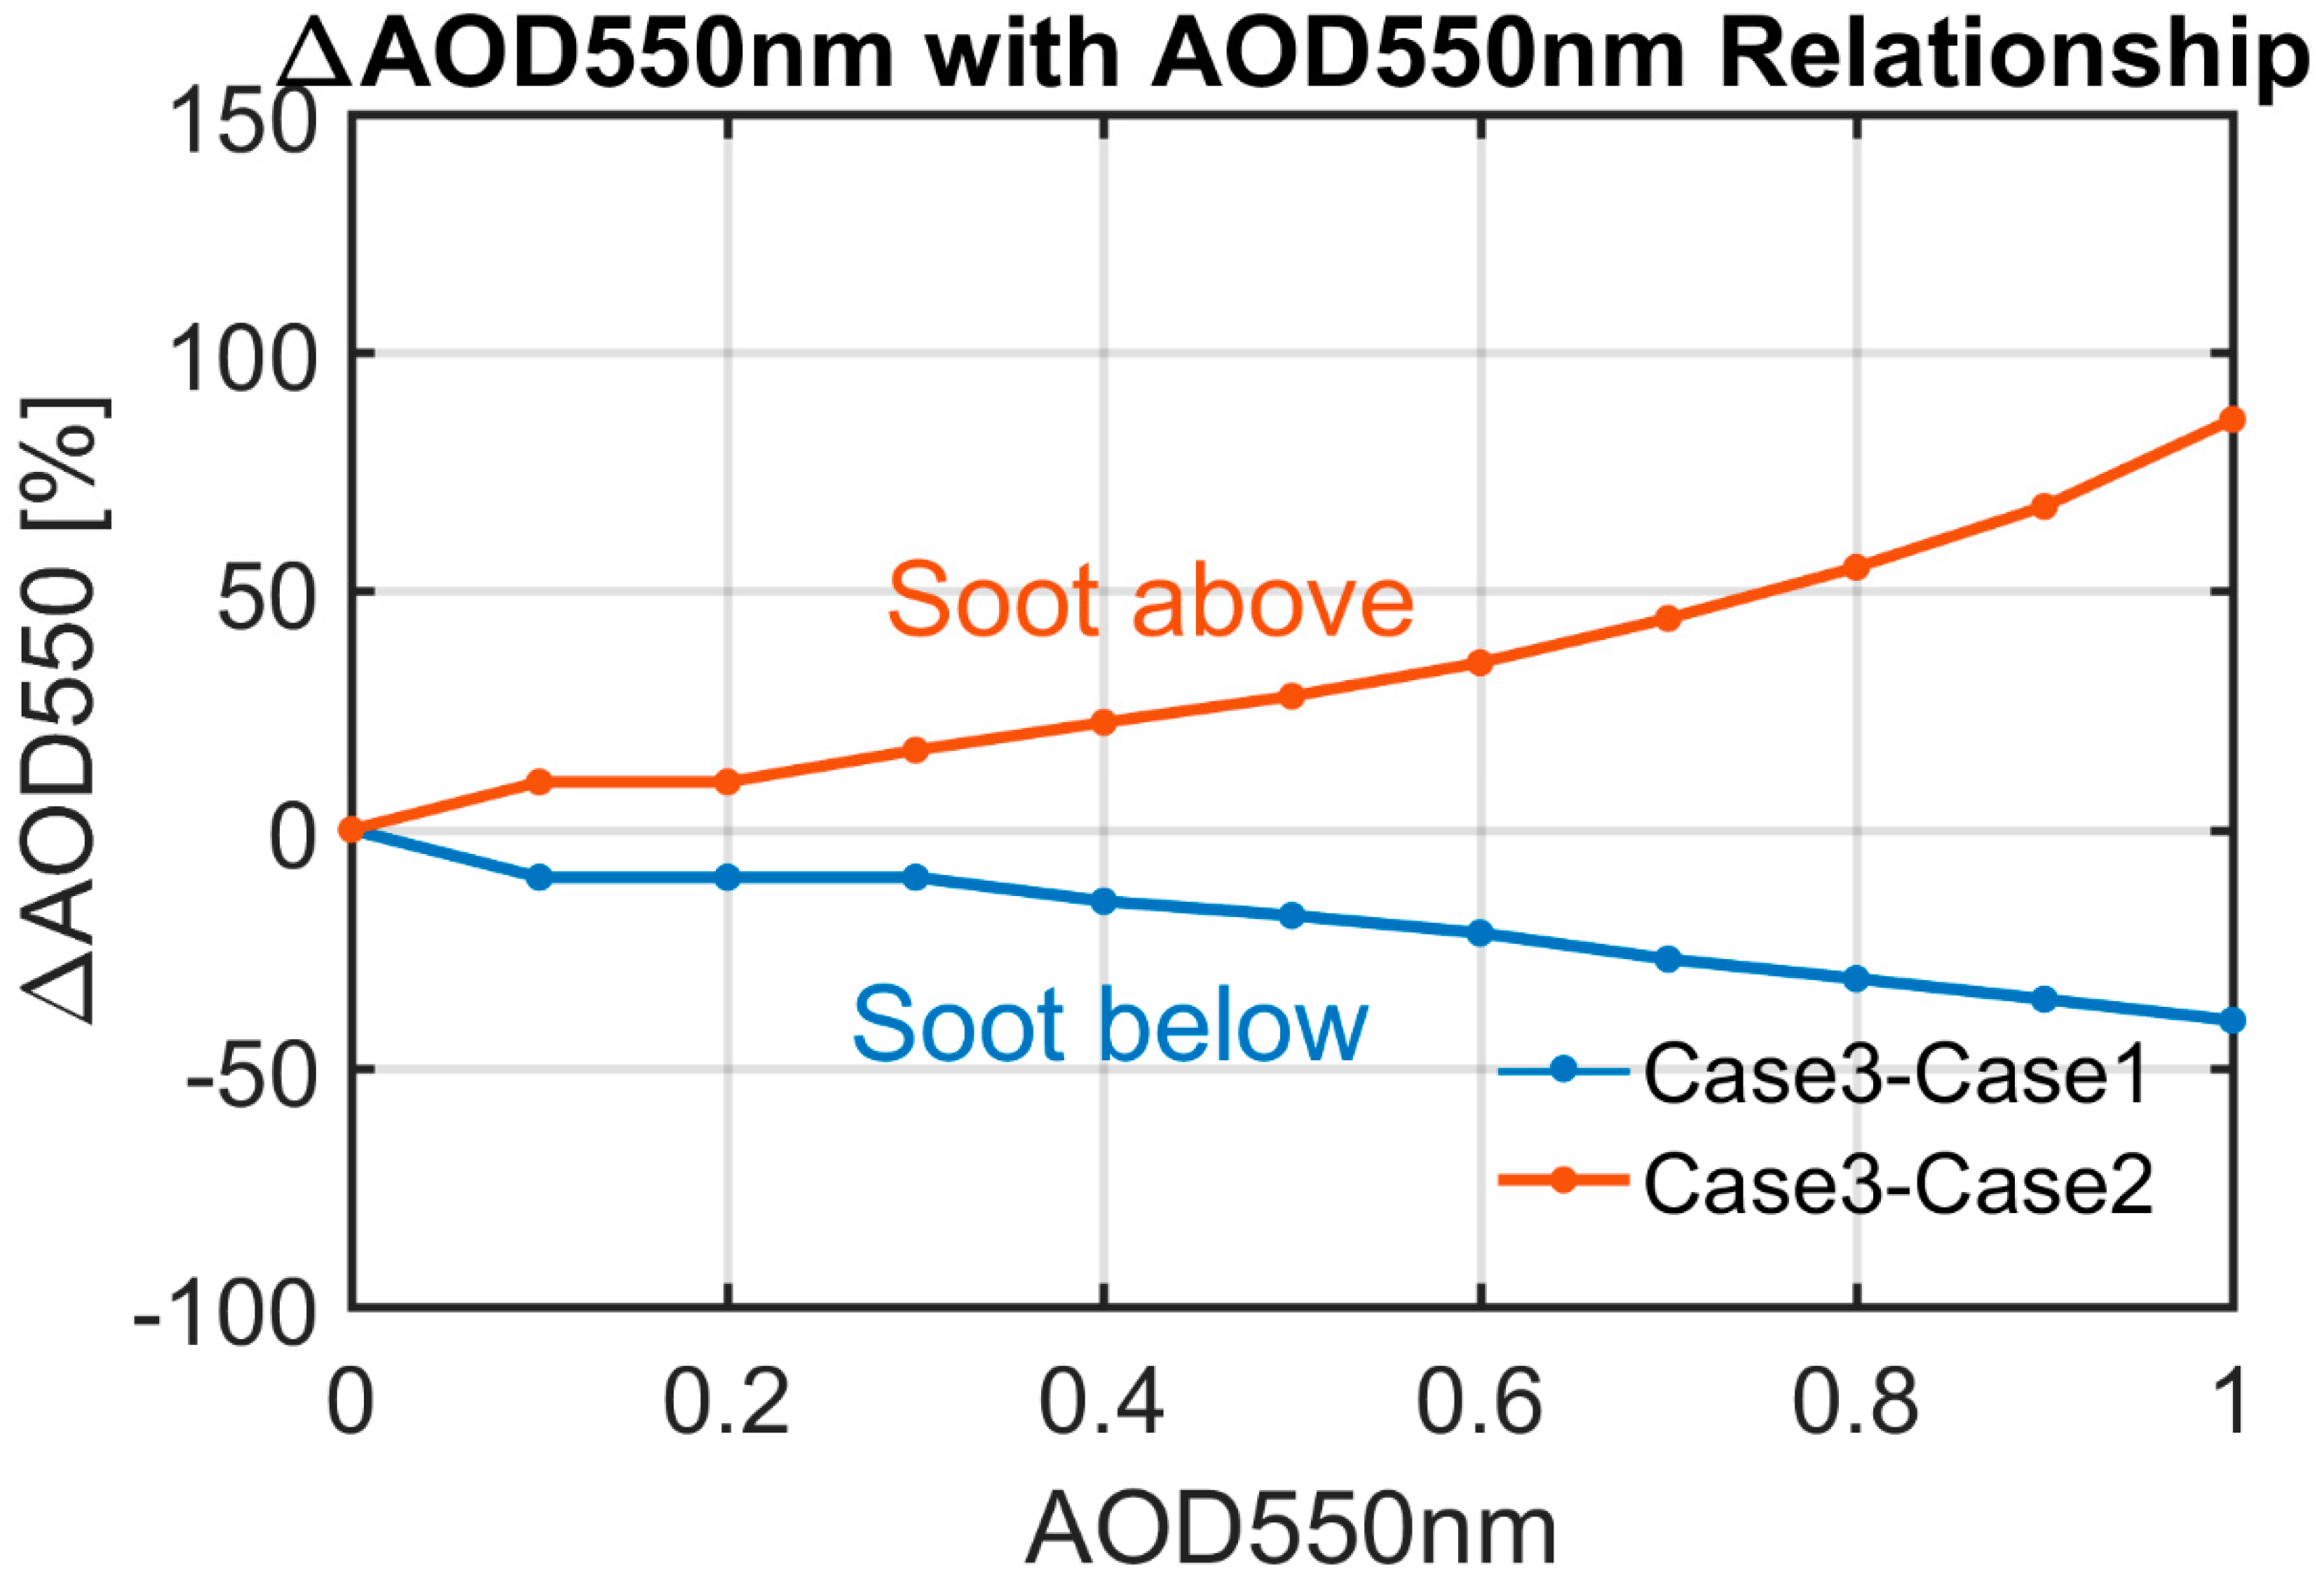
  • For layered aerosol structure, failing to consider different aerosol types at different altitudes will lead to considerably large AOD errors. At 0.5 AOD, sulfate (scattering) lying below soot (absorbing) can produce positive errors as large as 28%, and the reverse case produces negative errors of ~18%.
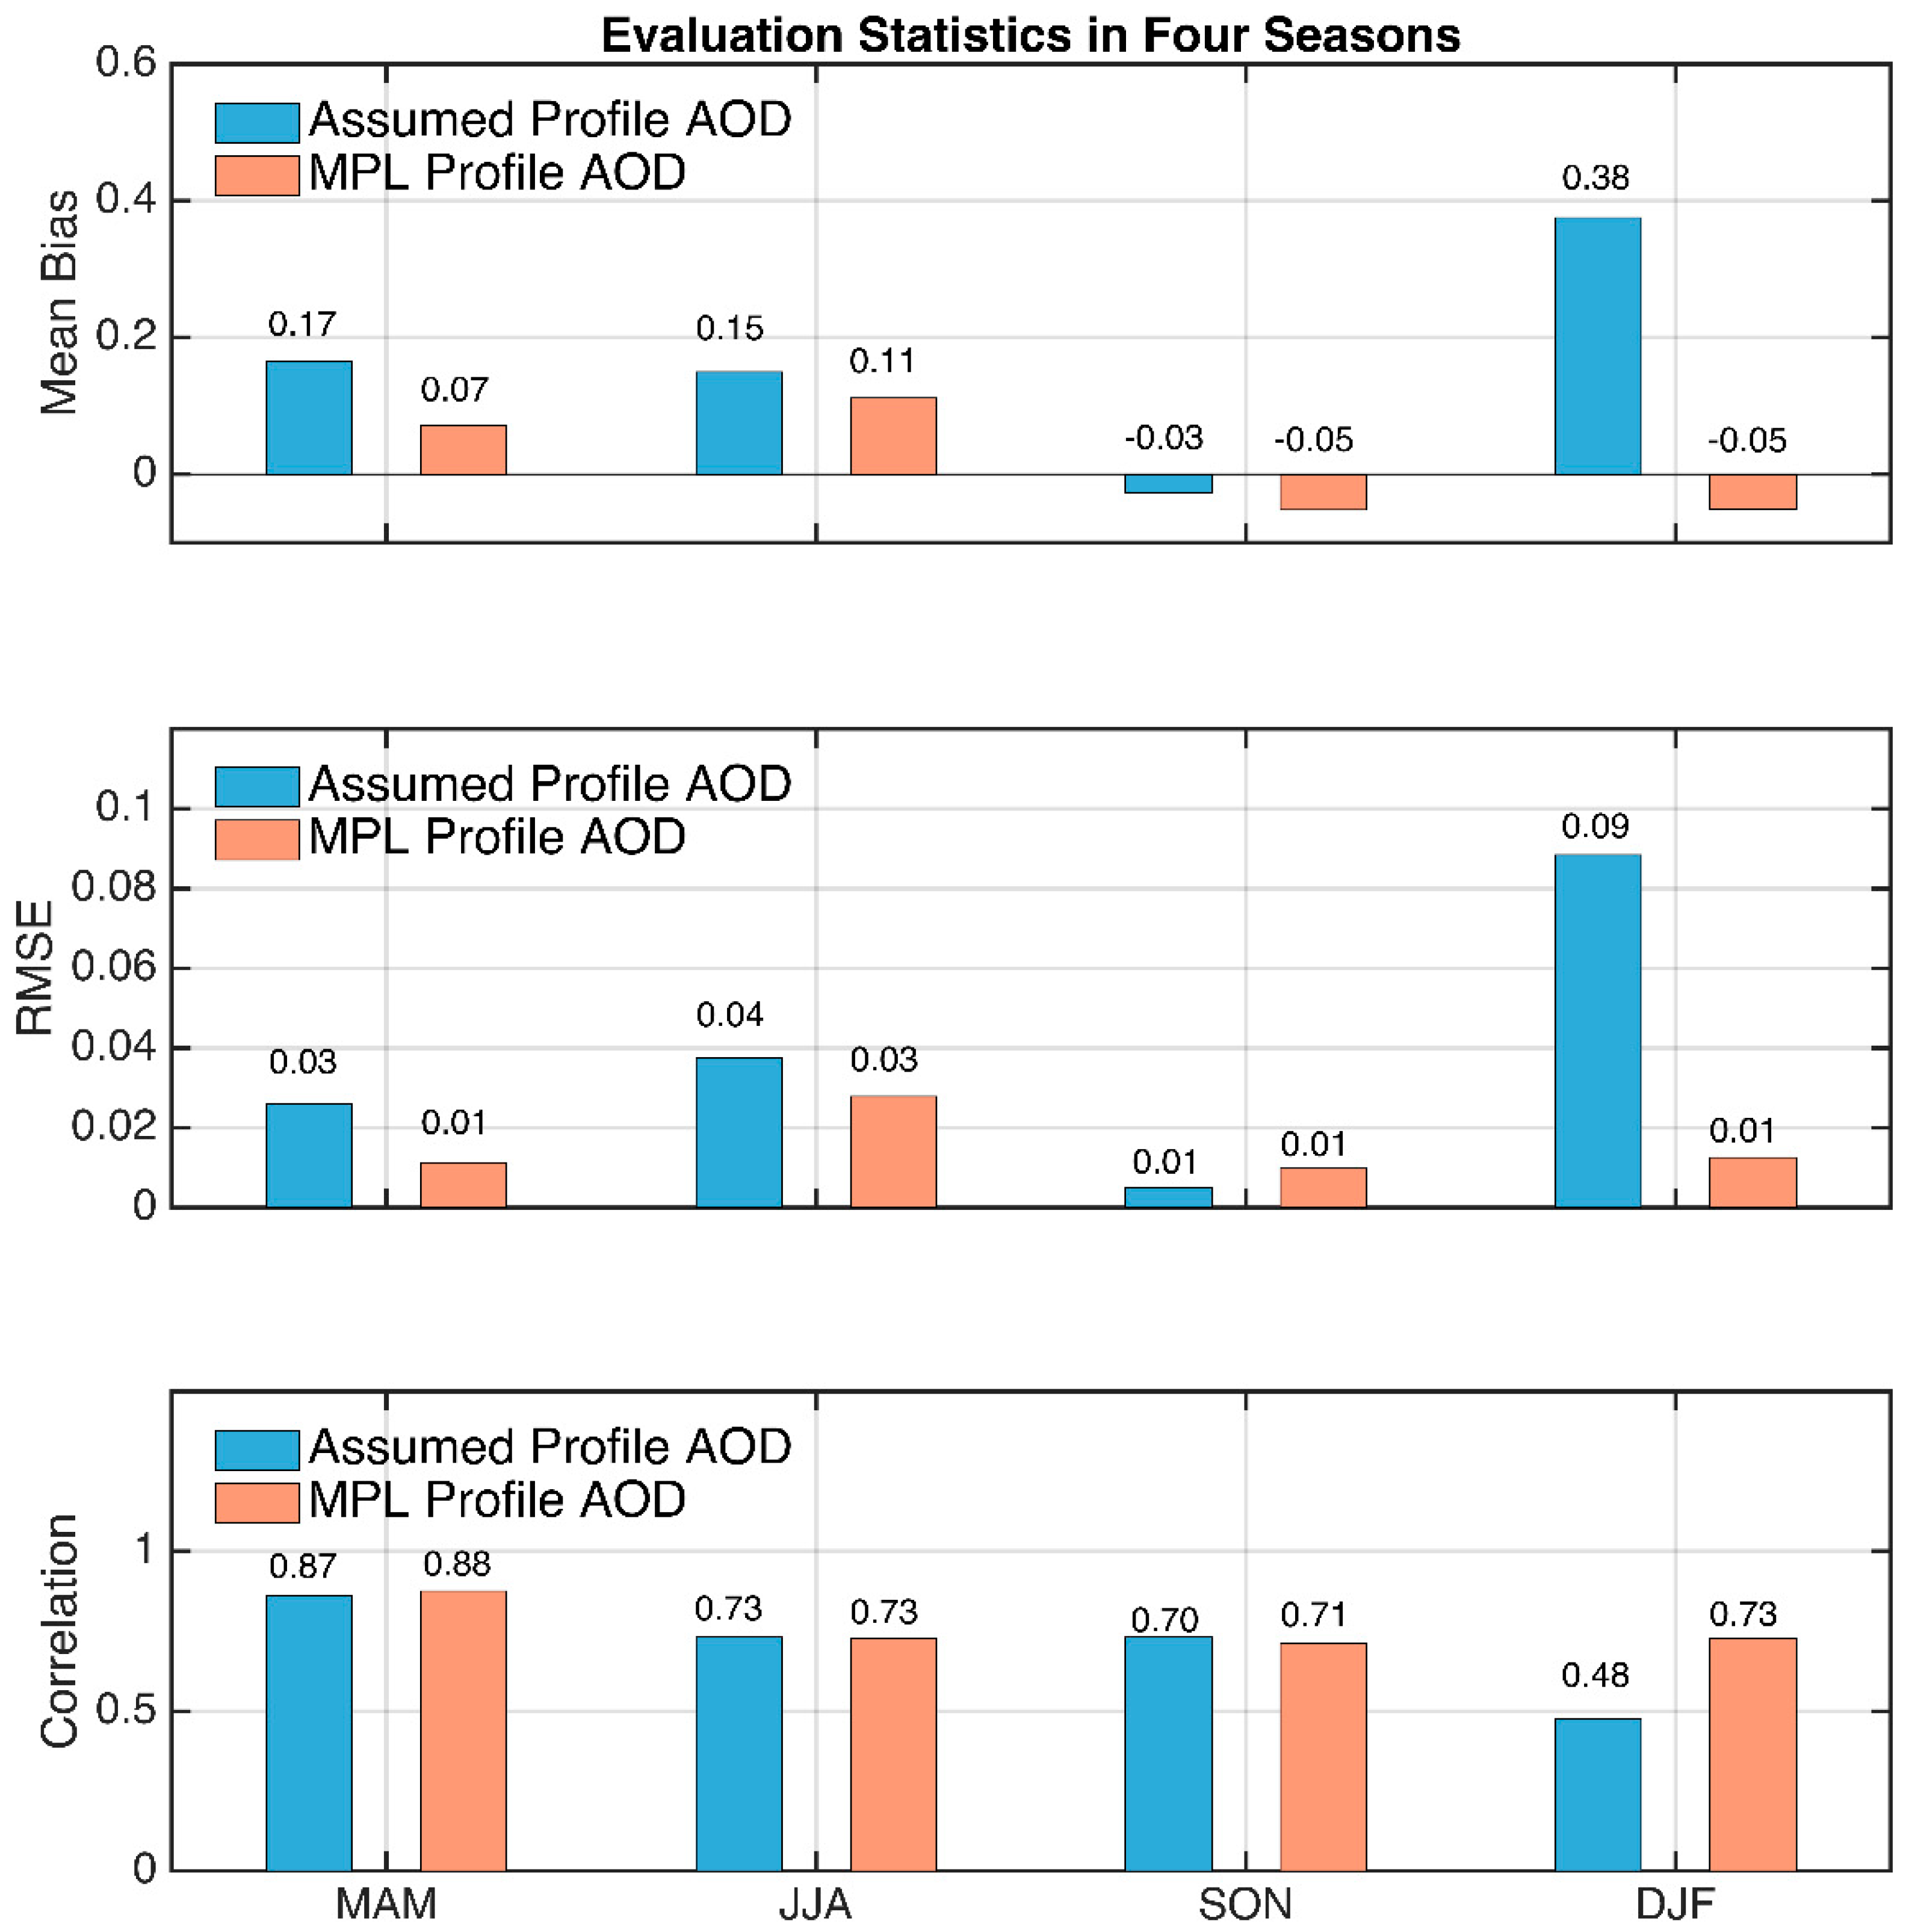
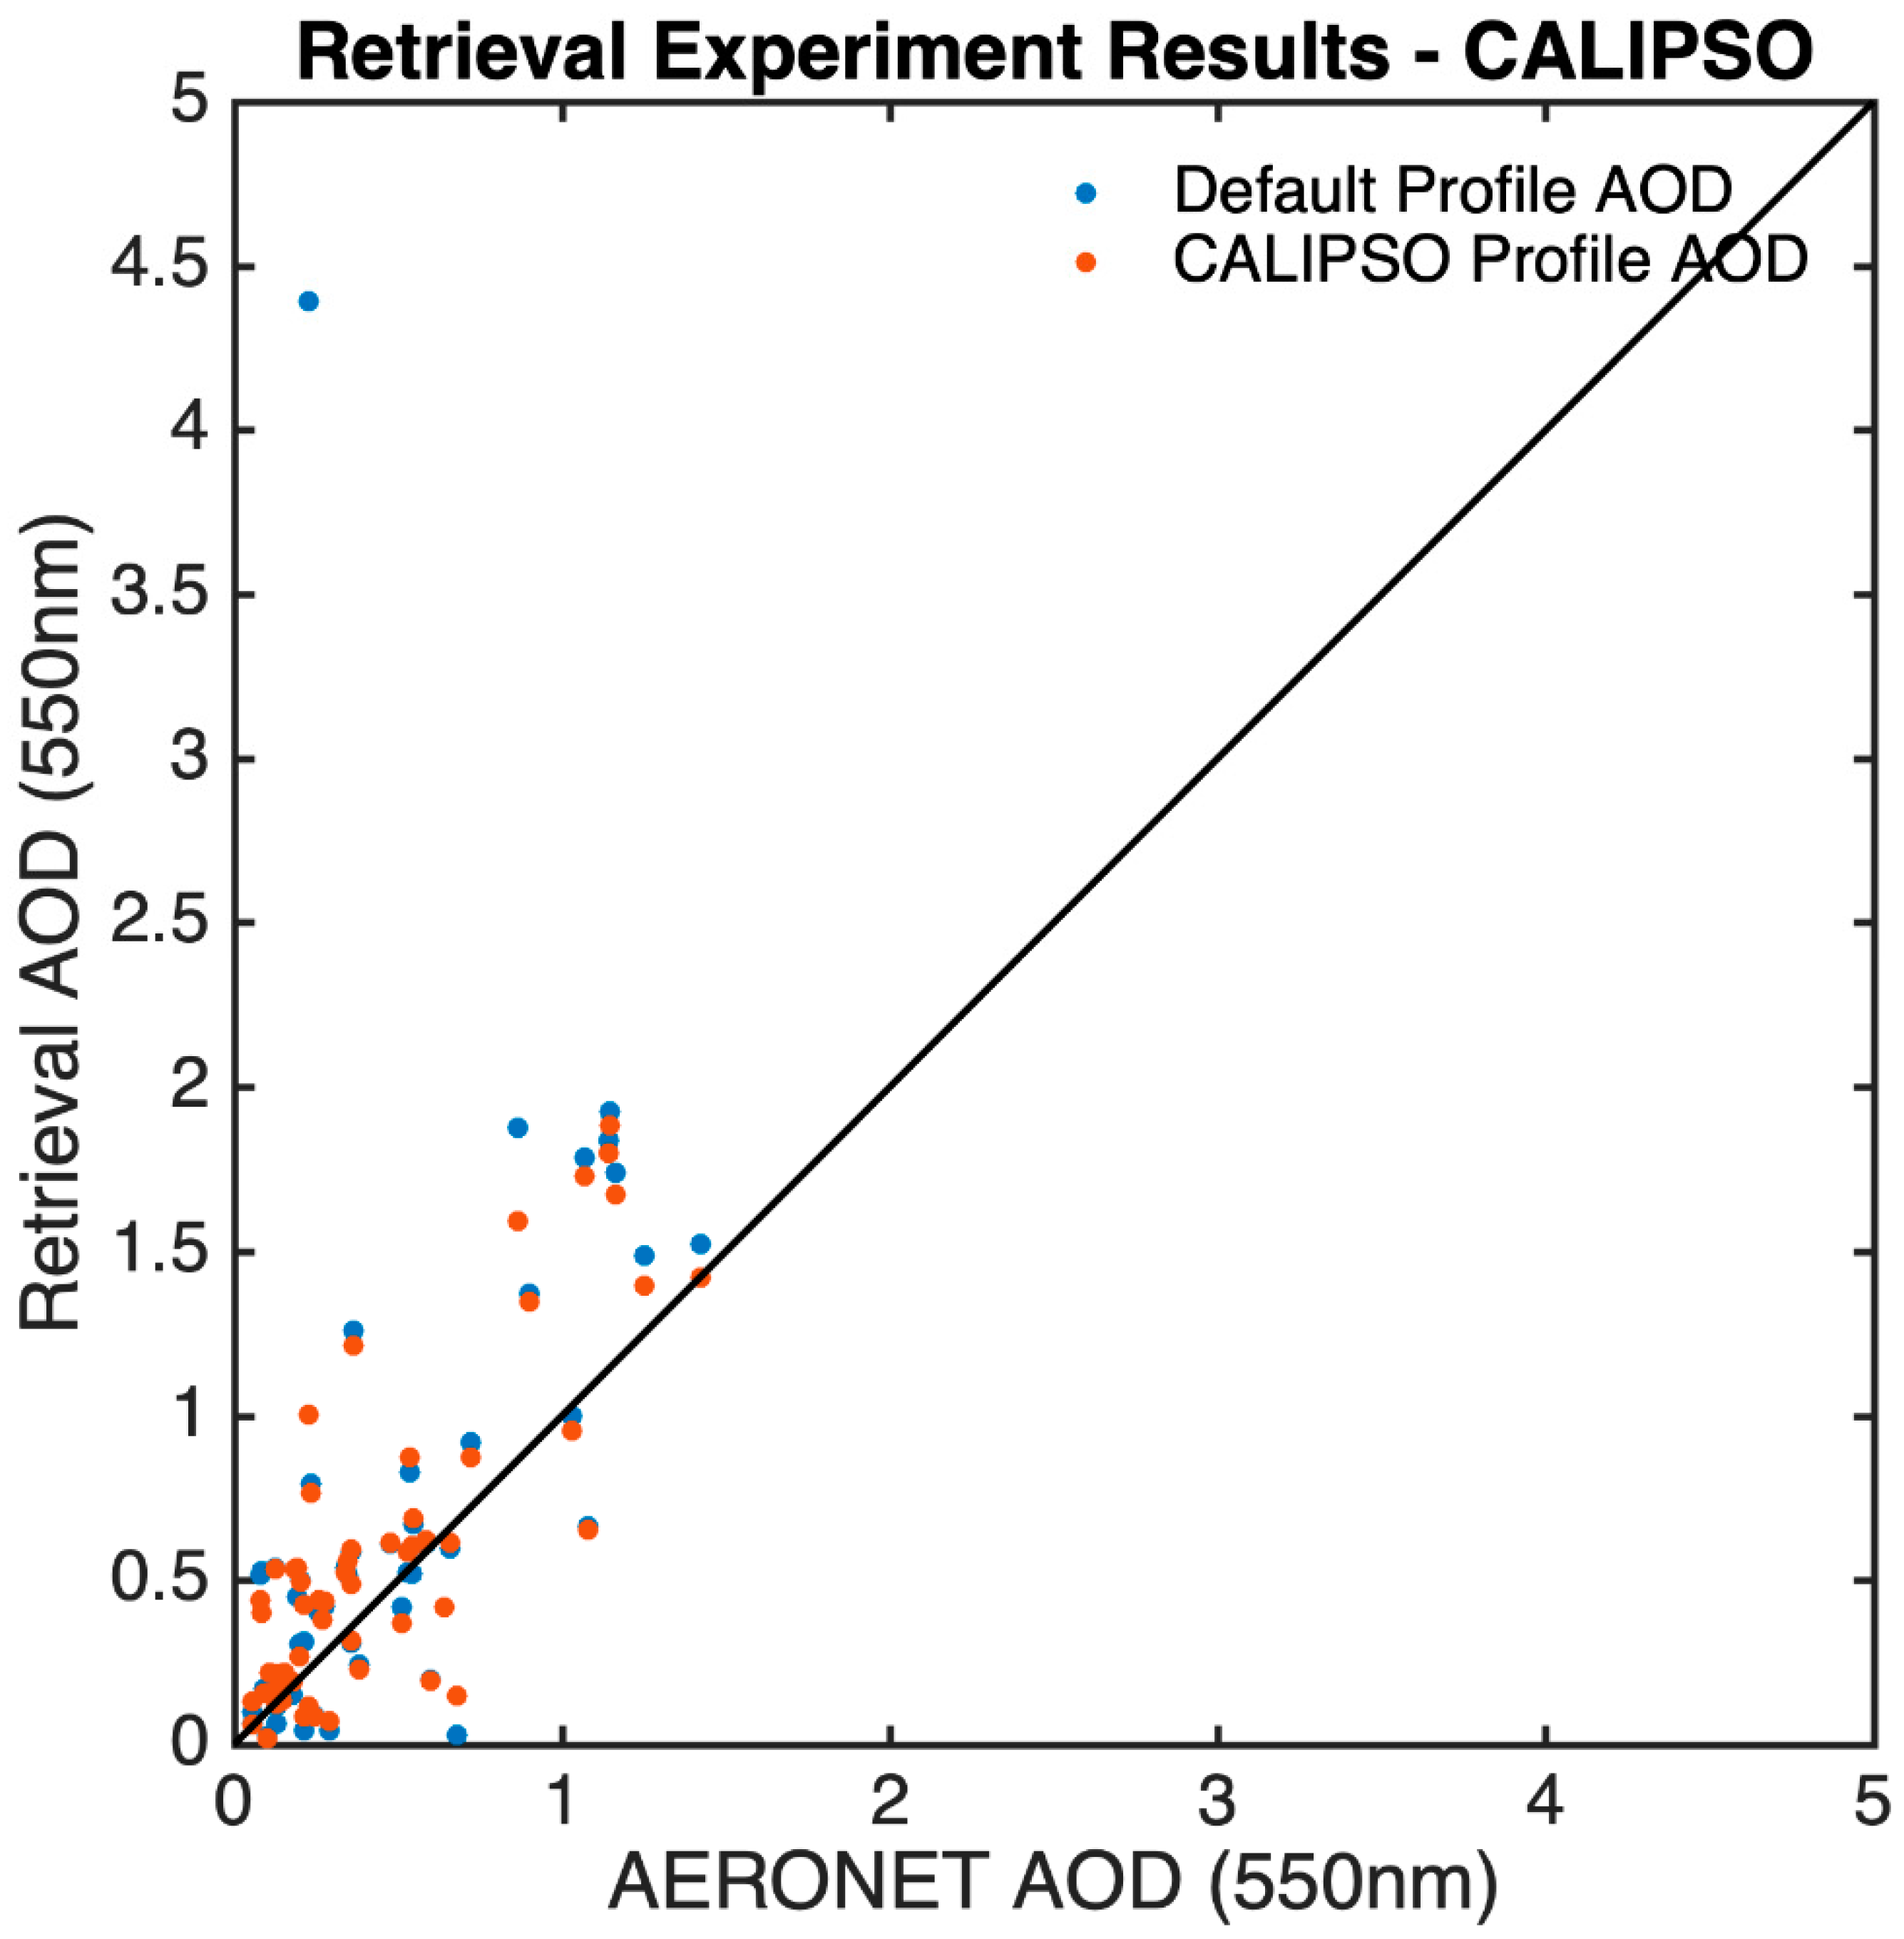
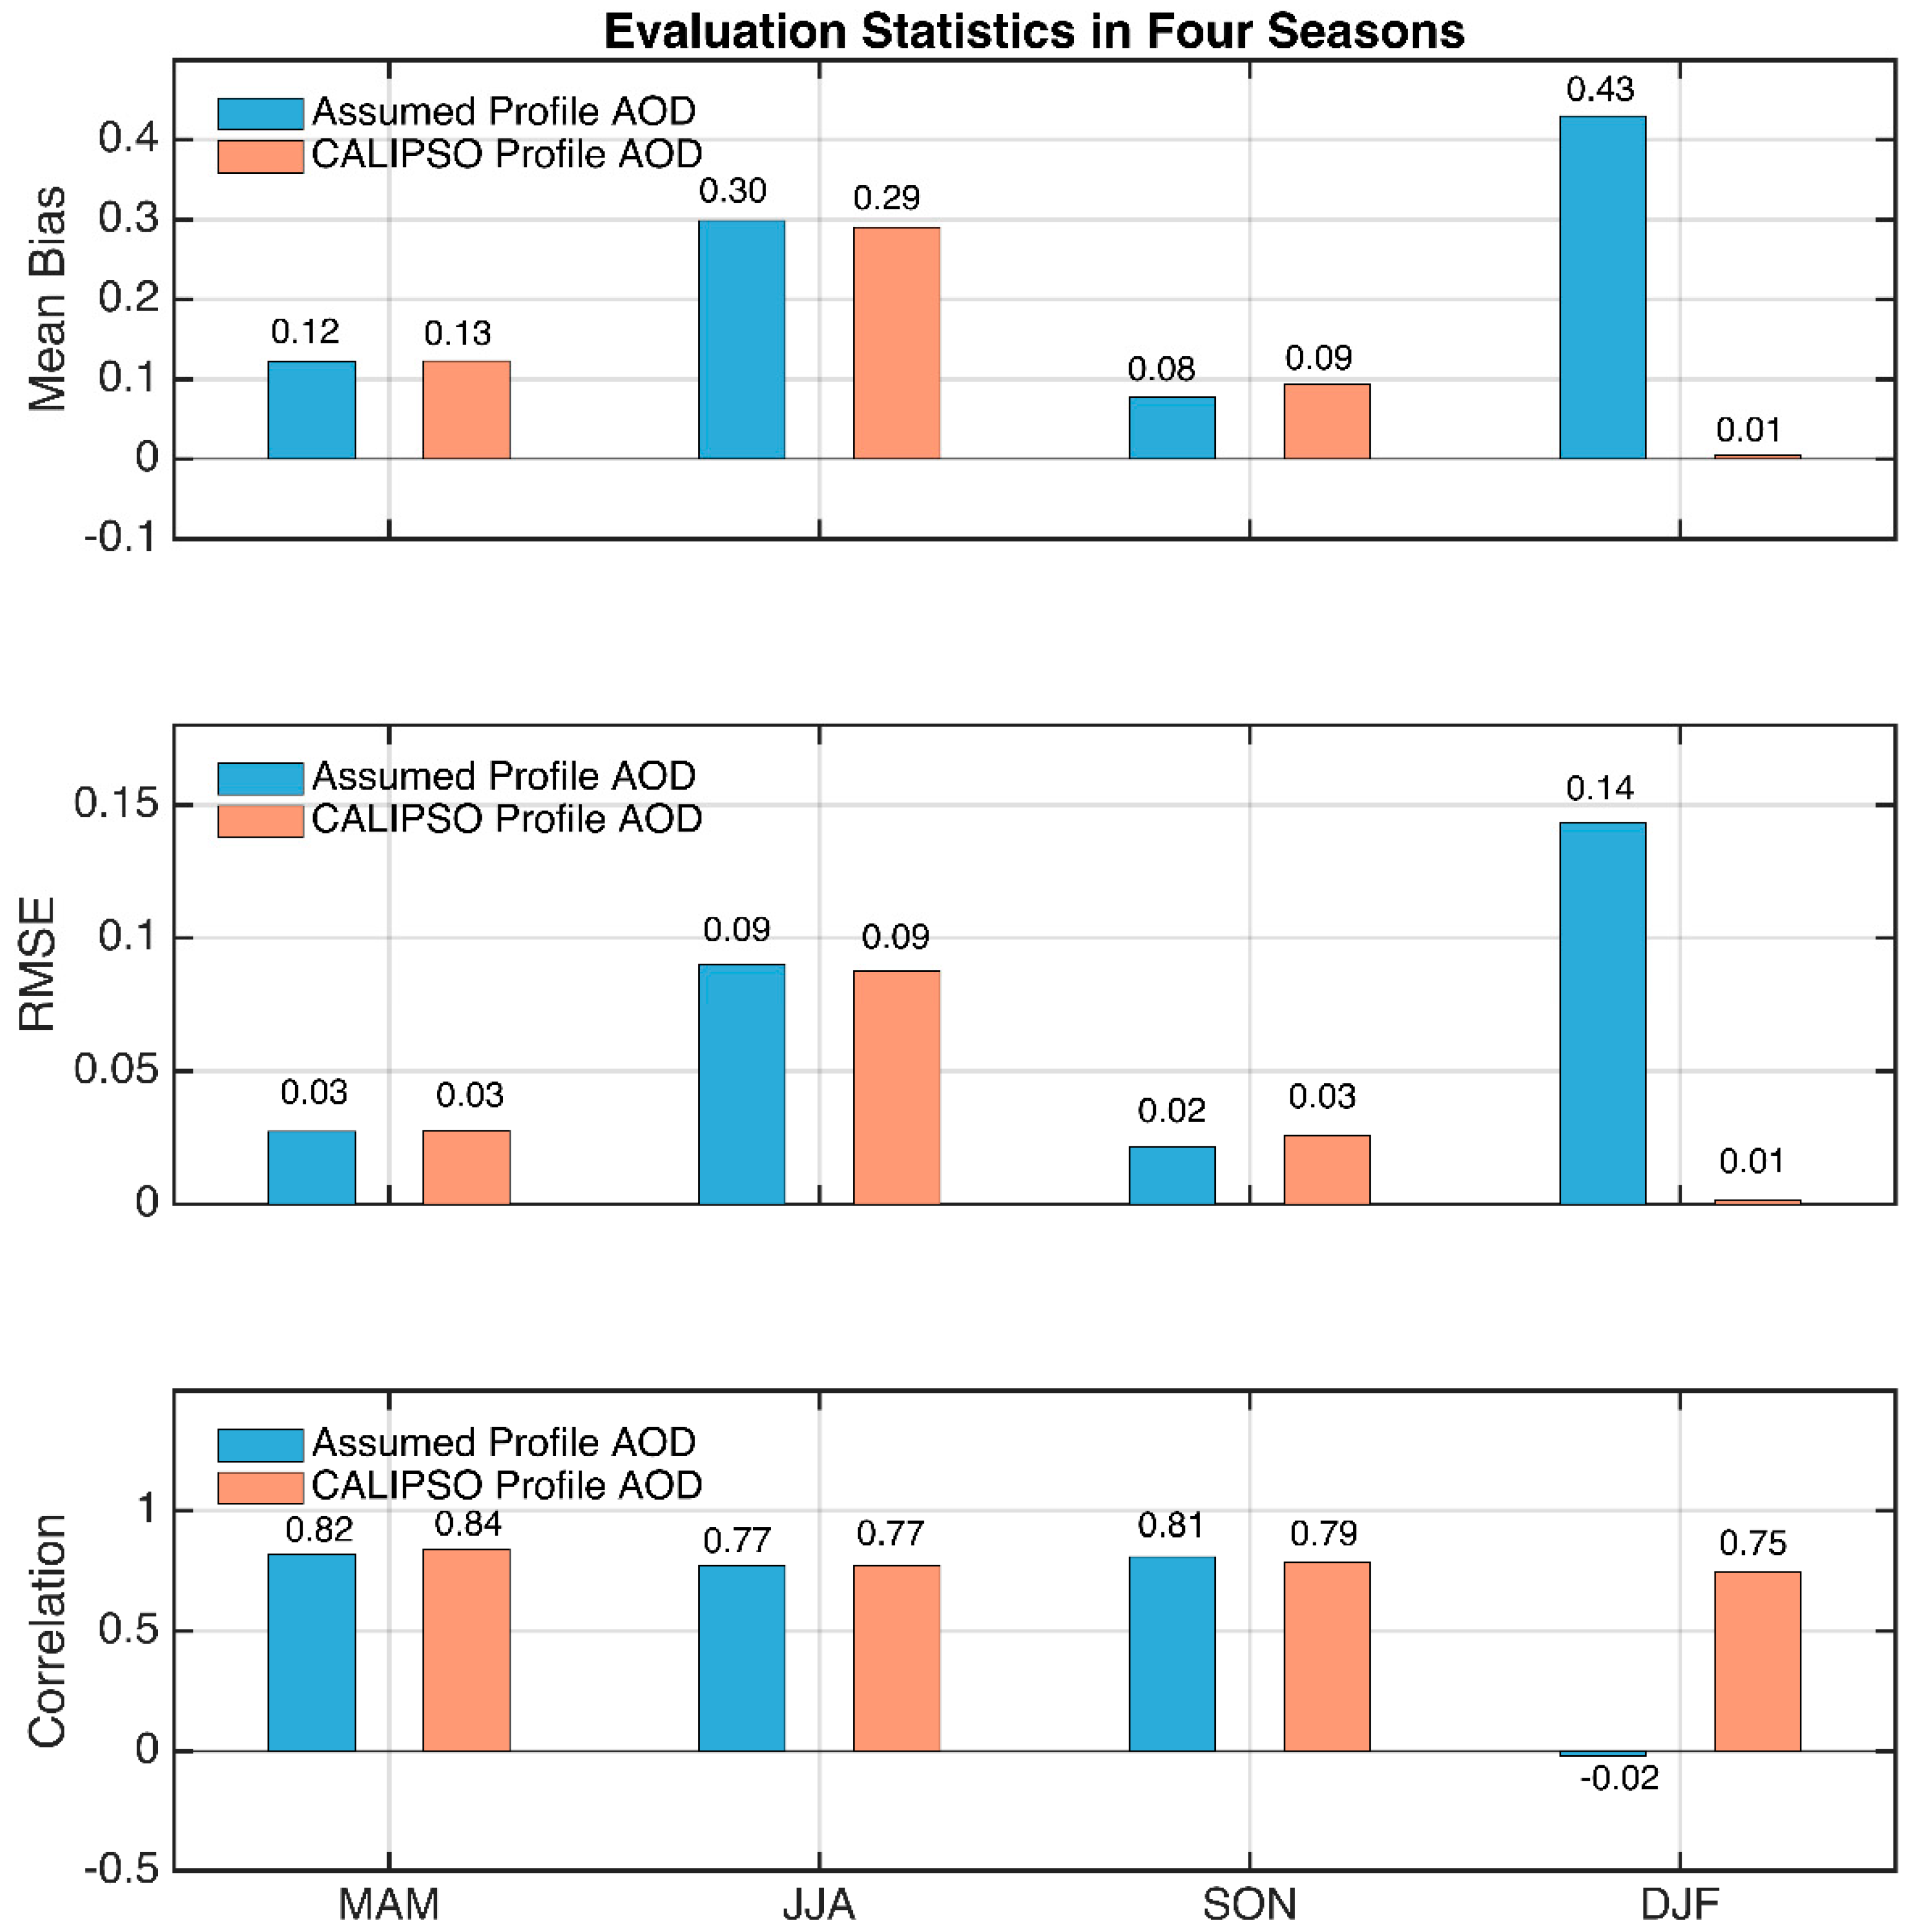
  • Replacing the exponential profile with the MPL derived aerosol extinction profiles can largely improve the accuracy of satellite retrieved AOD, especially during the winter season when aerosol absorption is strong. The overall bias can be reduced from 0.15 to 0.03 and the correlation is increased from 0.63 to 0.83. Replacing with spatial-average CALIPSO profiles also improves the AOD retrievals significantly in the winter season.
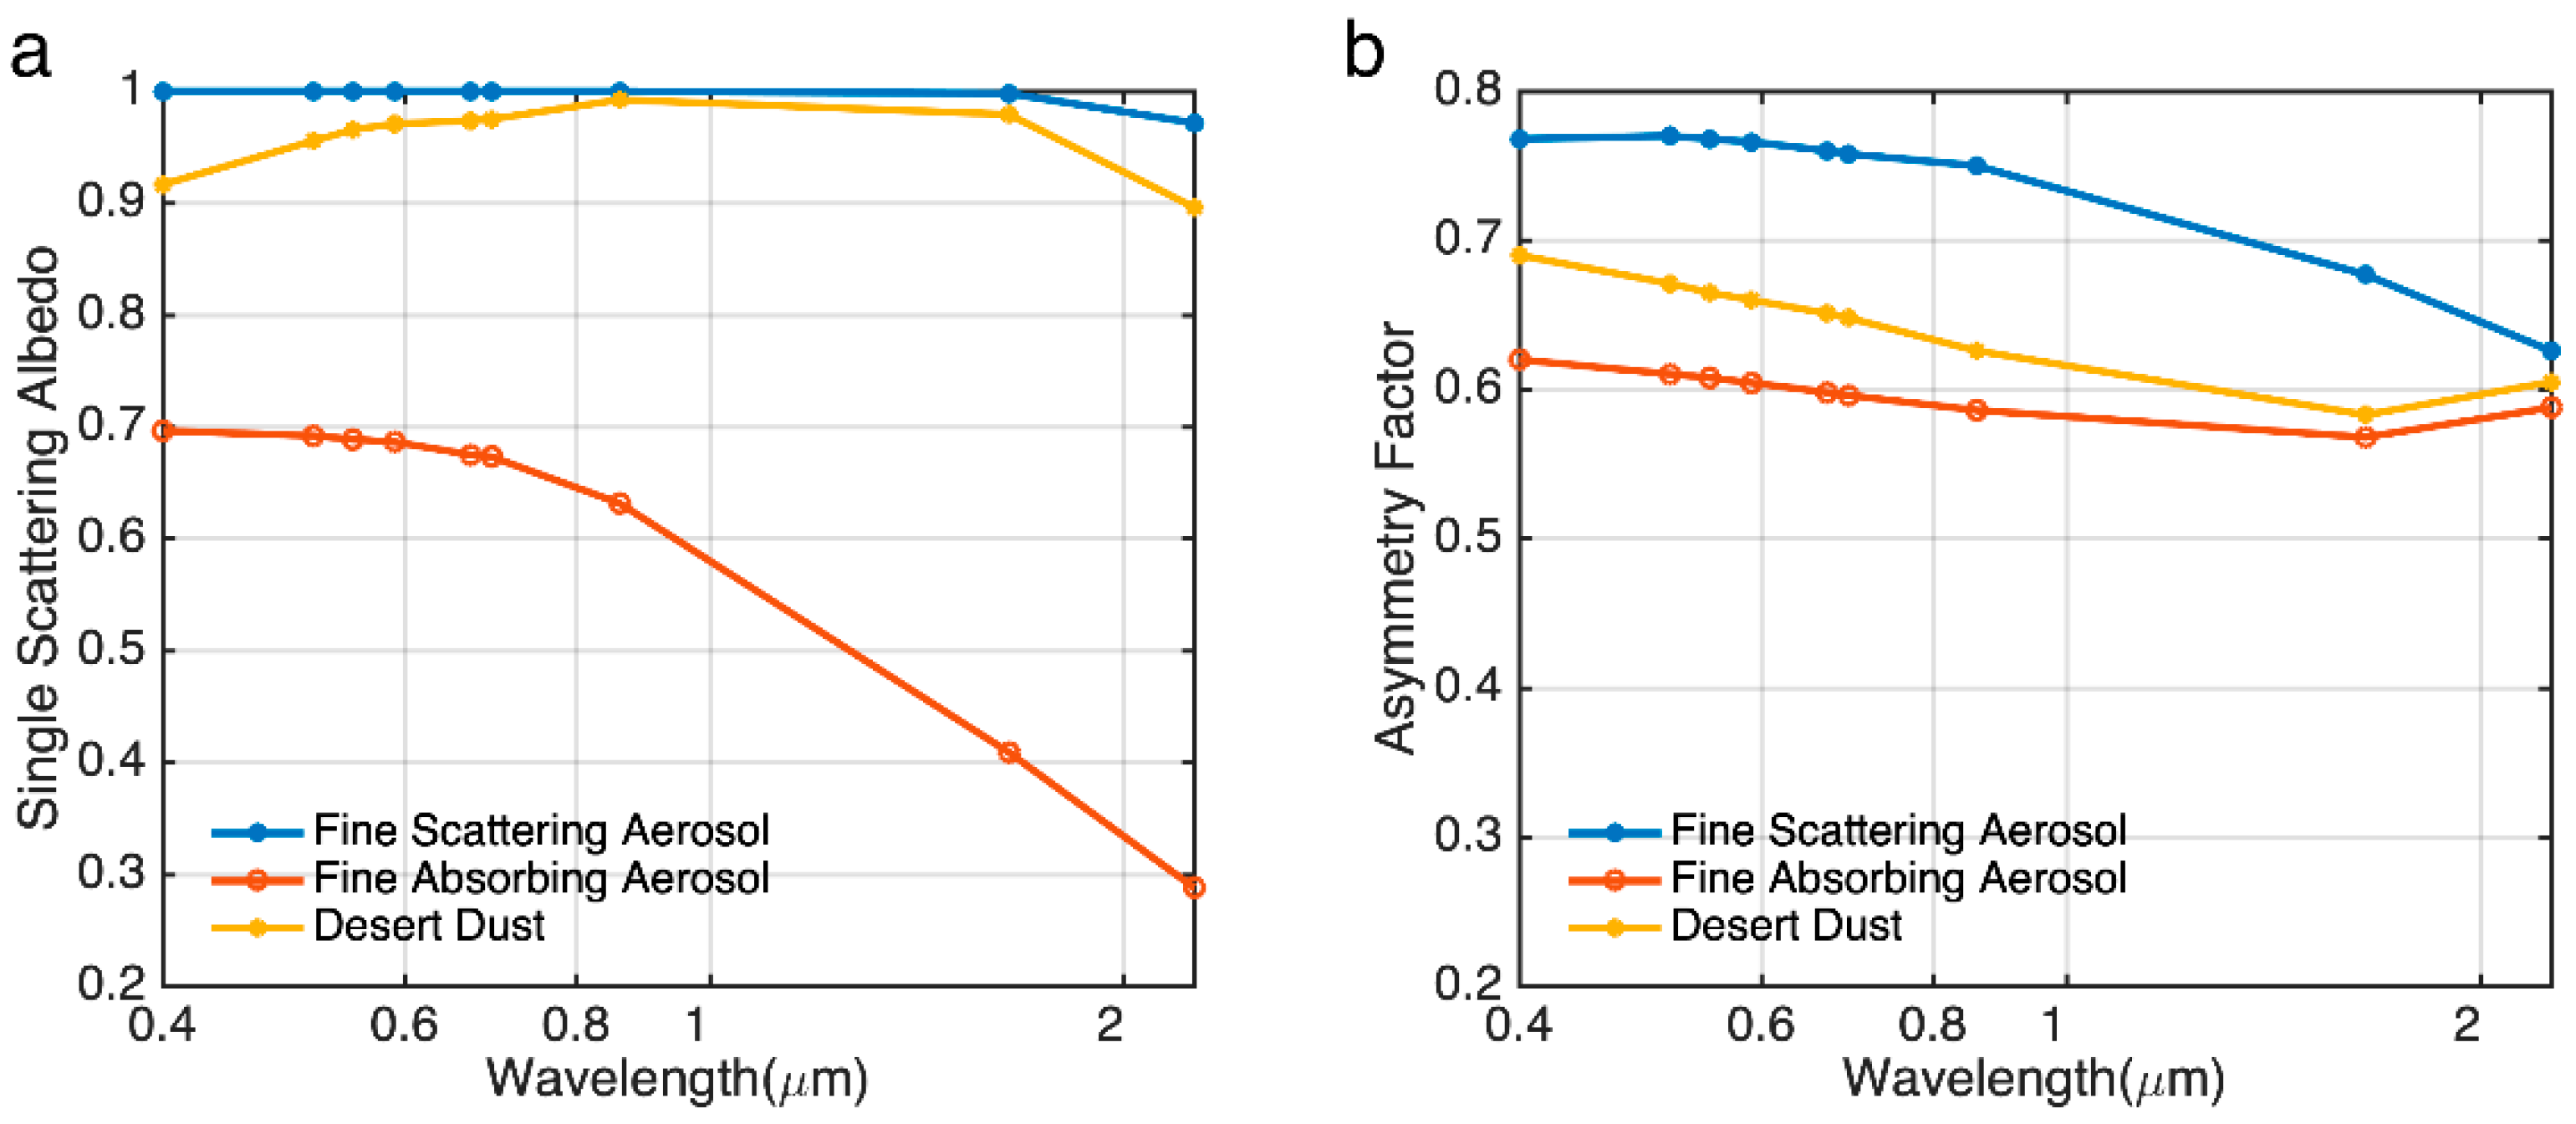
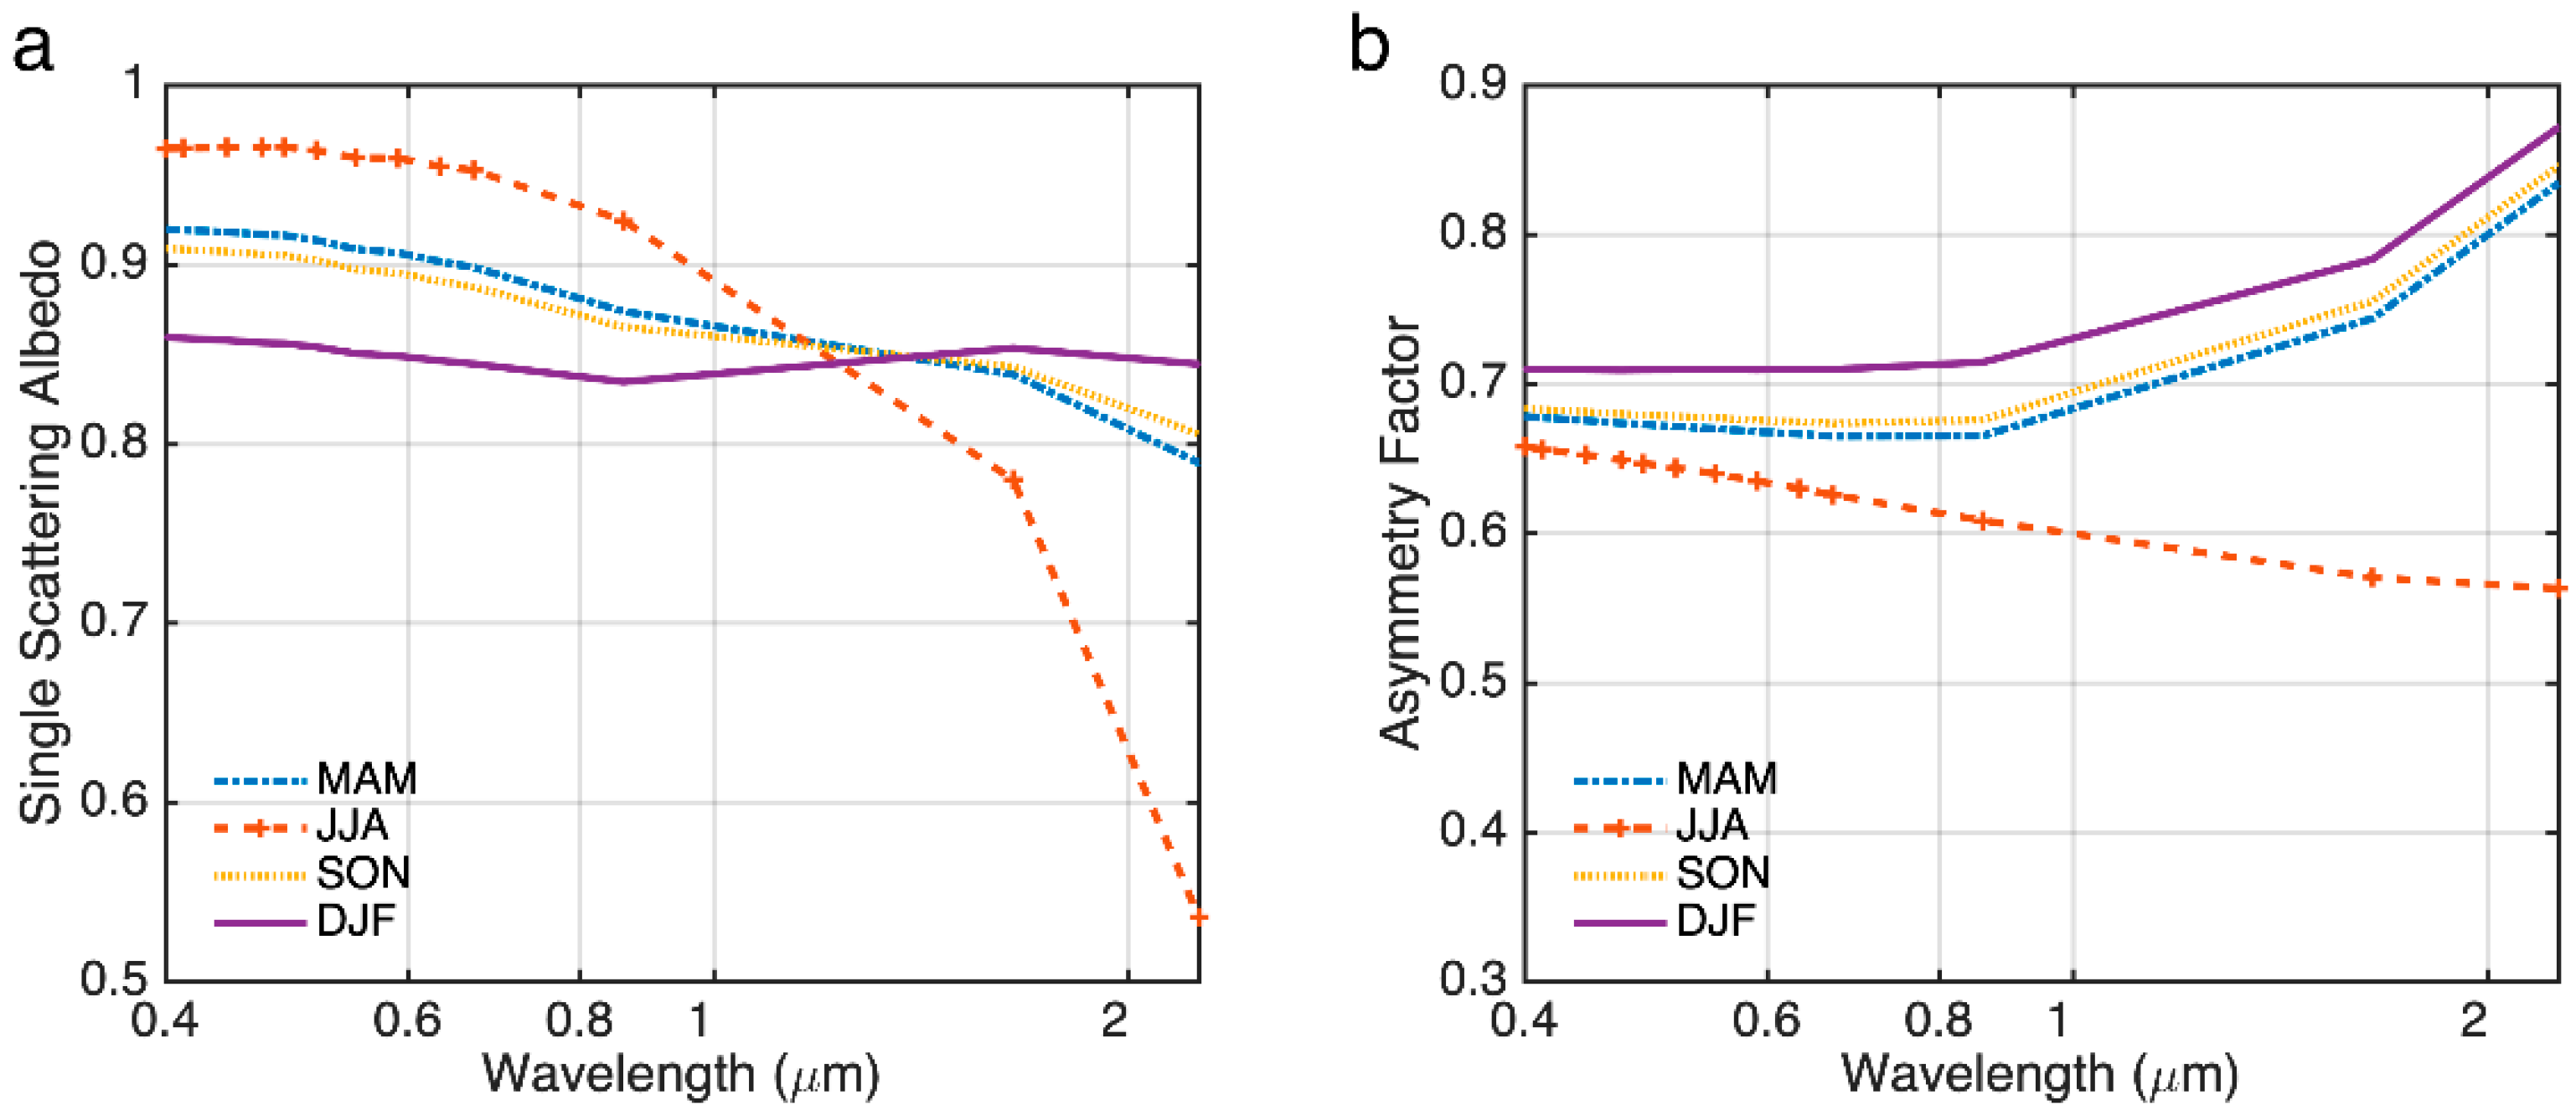
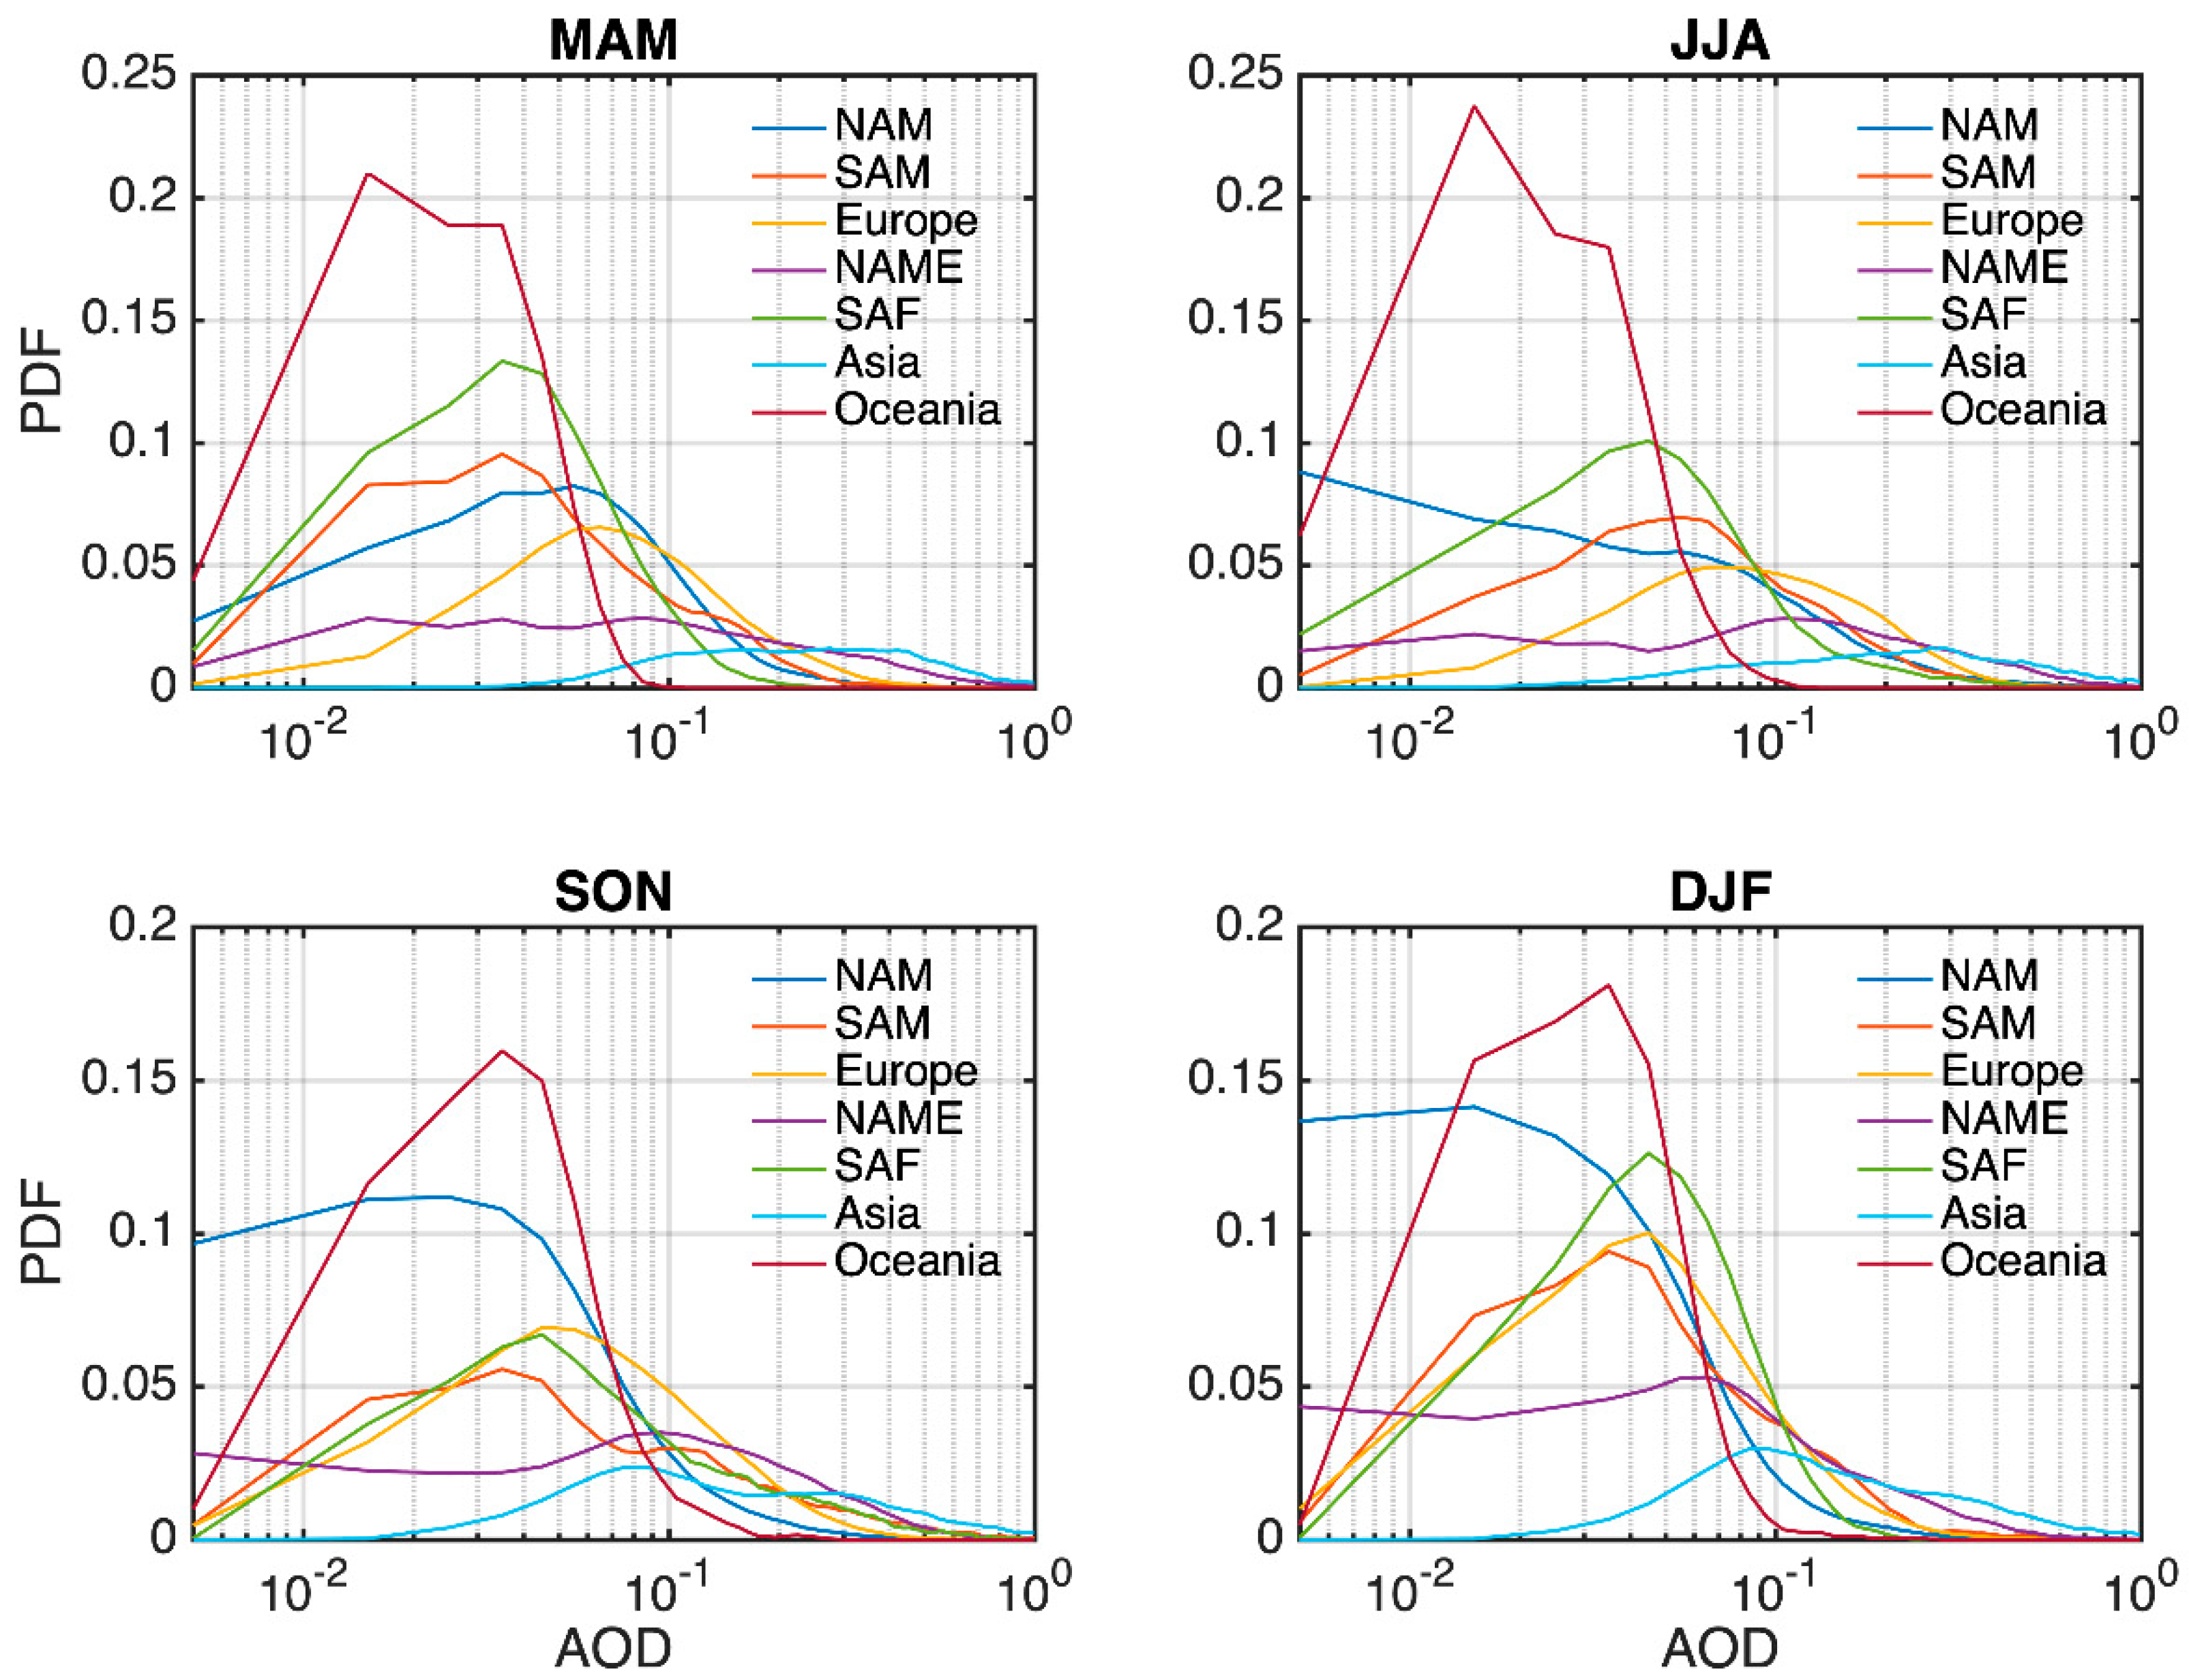
  • Based on the distribution of aerosol optical properties, satellite AOD retrieval accuracy is more prone to errors in aerosol vertical assumption for Asia in winter, and South Africa and South America in the fall.
The results of our study suggest that the inappropriate assumption of aerosol profiles in the satellite retrieval algorithm is an important source of retrieval errors. Depending on surface albedo and aerosol optical properties, it can have large impacts on the accuracy of AOD retrieval. To further improve retrieval accuracy, a better modeling of different aerosol profiles is urgently needed, especially for regions where the absorbing aerosol loading is high. In this study, we only perform retrieval using the observed aerosol profile for one site. We are currently developing a global aerosol vertical profile climatology by combining space lidar and chemical transport models, and will present the global retrieval results in a future paper. Our study also highlights the importance and urgent needs for global 3D aerosol observations by space lidars combined with passive sensors [33,34].

Author Contributions

Conceptualization, J.L.; methodology, C.L., J.L., O.D., Z.-C.Z., Y.L.Y.; investigation, C.L.; writing—original draft preparation, C.L.; writing—review and editing, J.L., O.D., Z.-C.Z., Y.L.Y.; visualization, C.L.; supervision, J.L.; All authors have read and agreed to the published version of the manuscript.

Funding

This research was funded by Nation Natural Science Foundation of China No. 41975023 and the National Key Research and Development Program of China No. 2017YFC0212803.

Acknowledgments

The authors gratefully appreciate the AERONET site principal investigators for providing and maintaining the ground-based measurements and data can be found online at http://aeronet.gsfc.nasa.gov. We’d like to acknowledge the VIIRS Team for freely distributed data which can be accessed from NOAA Comprehensive Large Array-Data Stewardship System at https://www.bou.class.noaa.gov/. We are also grateful to the developers of 6SV and MODTRAN radiative transfer models. O. Dubovik was supported by the CaPPA Project (Chemical and Physical Properties of the Atmosphere) that is funded by the French National Research Agency (ANR) through the PIA (Programme d’Investissement d’Avenir) under contract “ANR-11-LABX-0005-01” and by the Regional Council “Nord Pas de Calais-Picardie” and the European Funds for Regional Economic Development. C. Li was supported by the China Scholarship Council for 1 year study at the Université Lille-1.

Conflicts of Interest

The authors declare no conflict of interest.

References

  1. Geogdzhayev, I.V.; Mishchenko, M.I.; Rossow, W.B.; Cairns, B.; Lacis, A.A. Global two-channel AVHRR retrievals of aerosol properties over the ocean for the period of NOAA-9 observations and preliminary retrievals using NOAA-7 and NOAA-11 data. J. Atmos. Sci. 2002, 59, 262–278. [Google Scholar] [CrossRef] [Green Version]
  2. Levy, R.C.; Remer, L.A.; Dubovik, O. Global aerosol optical properties and application to Moderate Resolution Imaging Spectroradiometer aerosol retrieval over land. J. Geophys. Res. Atmos. 2007, 112. [Google Scholar] [CrossRef] [Green Version]
  3. Levy, R.C.; Mattoo, S.; Munchak, L.A.; Remer, L.A.; Sayer, A.M.; Patadia, F.; Hsu, N.C. The Collection 6 MODIS aerosol products over land and ocean. Atmos. Meas. Tech. 2013, 6, 2989–3034. [Google Scholar] [CrossRef] [Green Version]
  4. Jackson, J.M.; Liu, H.; Laszlo, I.; Kondragunta, S.; Remer, L.A.; Huang, J.; Huang, H.C. Suomi-NPP VIIRS aerosol algorithms and data products. J. Geophys. Res. Atmos. 2013, 118, 12673–12689. [Google Scholar] [CrossRef]
  5. Li, C.; Li, J.; Xu, H.; Li, Z.; Xia, X.; Che, H. Evaluating VIIRS EPS Aerosol Optical Depth in China: An intercomparison against ground-based measurements and MODIS. J. Quant. Spectrosc. Radiat. Transf. 2019, 224, 368–377. [Google Scholar] [CrossRef]
  6. Bilal, M.; Nazeer, M.; Qiu, Z.; Ding, X.; Wei, J. Global validation of MODIS C6 and C6.1 merged aerosol products over diverse vegetated surfaces. Remote Sens. 2018, 10, 475. [Google Scholar] [CrossRef] [Green Version]
  7. Mielonen, T.; Levy, R.C.; Aaltonen, V.; Komppula, M.; De Leeuw, G.; Huttunen, J.; Lihavainen, H.; Kolmonen, P.; Lehtinen, K.E.J.; Arola, A. Evaluating the assumptions of surface reflectance and aerosol type selection within the MODIS aerosol retrieval over land: The problem of dust type selection. Atmos. Meas. Tech. 2011, 4, 201–214. [Google Scholar] [CrossRef] [Green Version]
  8. Tirelli, C.; Curci, G.; Manzo, C.; Tuccella, P.; Bassani, C. Effect of the aerosol model assumption on the atmospheric correction over land: Case studies with CHRIS/PROBA hyperspectral images over Benelux. Remote Sens. 2015, 7, 8391–8415. [Google Scholar] [CrossRef] [Green Version]
  9. Wang, W.; Pan, Z.; Mao, F.; Gong, W.; Shen, L. Evaluation of VIIRS land aerosol model selection with AERONET measurements. Int. J. Environ. Res. Public Health. 2017, 14, 1016. [Google Scholar] [CrossRef] [Green Version]
  10. Wu, Y.; de Graaf, M.; Menenti, M. The sensitivity of AOD retrieval to aerosol type and vertical distribution over land with MODIS data. Remote Sens. 2016, 8, 765. [Google Scholar] [CrossRef] [Green Version]
  11. Wu, Y.; de Graaf, M.; Menenti, M. The impact of aerosol vertical distribution on aerosol optical depth retrieval using CALIPSO and MODIS data: Case study over dust and smoke regions. J. Geophys. Res. Atmos. 2017, 122, 8801–8815. [Google Scholar] [CrossRef] [Green Version]
  12. Kahn, R.A.; Gaitley, B.J. Atmospheres An analysis of global aerosol type as retrieved by MISR. J. Geophys. Res. Atmos. 2015, 12, 4248–4281. [Google Scholar] [CrossRef]
  13. Laszlo, I.; Liu, H.Q. EPS Aerosol Optical Depth (AOD) Algorithm Theoretical Basis Document; NOAA NESDIS Center for Satellite Application and Research: College Park, MD, USA, 2016.
  14. Levy, R.C.; Remer, L.A.; Mattoo, S.; Vermote, E.F.; Kaufman, Y.J. Second-generation operational algorithm: Retrieval of aerosol properties over land from inversion of Moderate Resolution Imaging Spectroradiometer spectral reflectance. J. Geophys. Res. Atmos. 2007, 112, 1–21. [Google Scholar] [CrossRef] [Green Version]
  15. Dubovik, O.; Herman, M.; Holdak, A.; Lapyonok, T.; Tanré, D.; Deuzé, J.L.; Ducos, F.; Sinyuk, A.; Lopatin, A. Statistically optimized inversion algorithm for enhanced retrieval of aerosol properties from spectral multi-angle polarimetric satellite observations. Atmos. Meas. Tech. 2011, 4, 975–1018. [Google Scholar] [CrossRef] [Green Version]
  16. Hsu, N.C.; Tsay, S.; King, M.D.; Member, S.; Herman, J.R. Aerosol Properties over Bright-Reflecting Source Regions. IEEE Trans. Geosci. Remote Sens. 2004, 42, 557–569. [Google Scholar] [CrossRef]
  17. Tao, M.; Wang, Z.; Tao, J.; Chen, L.; Wang, J.; Hou, C.; Wang, L.; Xu, X.; Zhu, H. How Do Aerosol Properties Affect the Temporal Variation of MODIS AOD Bias in Eastern China? Remote Sens. 2017, 9, 800. [Google Scholar] [CrossRef] [Green Version]
  18. Wang, W.; Mao, F.; Pan, Z.; Du, L.; Gong, W. Validation of VIIRS AOD through a Comparison with a Sun Photometer and MODIS AODs over Wuhan. Remote Sens. 2017, 9, 403. [Google Scholar] [CrossRef] [Green Version]
  19. Vermote, E.; Tanré, D.; Deuzé, J.L.; Herman, M.; Morcrette, J.J.; Kotchenova, S.Y. Second simulation of a satellite signal in the solar spectrum-vector (6SV). 6S User Guide Version 2006, 3, 1–55. [Google Scholar]
  20. Kotchenova, S.Y.; Vermote, E.F.; Levy, R.; Lyapustin, A. Radiative transfer codes for atmospheric correction and aerosol retrieval: Intercomparison study. Appl. Opt. 2008, 47, 2215–2226. [Google Scholar] [CrossRef] [Green Version]
  21. Anderson, G.P.; Berk, A.; Acharya, P.K.; Matthew, M.W.; Bernstein, L.S.; Chetwynd, J.H.J.; Dothe, H.; Adler-Golden, S.M.; Ratkowski, A.J.; Felde, G.W.; et al. MODTRAN4: Radiative transfer modeling for remote sensing. Proc. SPIE 2000, 4049, 176–183. [Google Scholar]
  22. Berk, A.; Anderson, G.P.; Acharya, P.K.; Bernstein, L.S.; Muratov, L.; Lee, J.; Fox, M.; Adler-Golden, S.M.; Chetwynd, J.H.; Hoke, M.L.; et al. MODTRAN 5: A reformulated atmospheric band model with auxiliary species and practical multiple scattering options: Update. Algorithms Technol. Multispectr. Hyperspectr. Ultraspectr. Imag. XI 2005, 5806, 662. [Google Scholar]
  23. Cao, C.; Xiong, J.; Blonski, S.; Liu, Q.; Uprety, S.; Shao, X.; Bai, Y.; Weng, F. Suomi NPP VIIRS sensor data record verification, validation, and long-term performance monitoring. J. Geophys. Res. Atmos. 2013, 118, 11664–11678. [Google Scholar] [CrossRef]
  24. Chu, Y.; Li, J.; Li, C.; Tan, W.; Su, T.; Li, J. Seasonal and diurnal variability of planetary boundary layer height in Beijing: Intercomparison between MPL and WRF results. Atmos. Res. 2019, 227, 1–13. [Google Scholar] [CrossRef]
  25. Winker, D.M.; Hostetler, C.A.; Vaughan, M.A.; Omar, A.H. CALIOP algorithm theoretical basis document, part 1: CALIOP instrument, and algorithms overview. Release 2006, 2, 29. [Google Scholar]
  26. Holben, B.N.; Eck, T.F.; Slutsker, I.; Tanré, D.; Buis, J.P.; Setzer, A.; Vermote, E.; Reagan, J.A.; Kaufman, Y.J.; Nakajima, T.; et al. AERONET—A Federated instrument network and data archive for aerosol characterization. Remote Sens. Environ. 1998, 66, 1–16. [Google Scholar] [CrossRef]
  27. Eck, T.F.; Holben, B.N.; Reid, J.S.; Dubovik, O.; Smirnov, A.; O’Neill, N.T.; Slutsker, I.; Kinne, S. Wavelength dependence of the optical depth of biomass burning, urban, and desert dust aerosols. J. Geophys. Res. Atmos. 1999, 104, 31333–31349. [Google Scholar] [CrossRef]
  28. Hess, M.; Koepke, P.; Schult, I. Optical properties of Aerosols and Clouds: The Software Package OPAC. Bull. Am. Meteorol. Soc. 1998, 79, 831–844. [Google Scholar] [CrossRef]
  29. Duncan, B.N.; Martin, R.V.; Staudt, A.C.; Yevich, R.; Logan, J.A. Interannual and seasonal variability of biomass burning emissions constrained by satellite observations. J. Geophys. Res. D Atmos. 2003, 108, ACH 1-1–ACH 1-22. [Google Scholar] [CrossRef] [Green Version]
  30. Cao, J.; Lee, S.C.; Chow, J.C.; Watson, J.G.; Ho, K.F.; Zhang, R.J.; Jin, Z.D.; Shen, Z.X.; Chen, G.C.; Kang, Y.M.; et al. Spatial and seasonal distributions of carbonaceous aerosols over China. J. Geophys. Res. Atmos. 2007, 112, 1–9. [Google Scholar] [CrossRef] [Green Version]
  31. Bian, Y.X.; Zhao, C.S.; Ma, N.; Chen, J.; Xu, W.Y. A study of aerosol liquid water content based on hygroscopicity measurements at high relative humidity in the North China Plain. Atmos. Chem. Phys. 2014, 14, 6417–6426. [Google Scholar] [CrossRef] [Green Version]
  32. Zhang, L.; Sun, J.Y.; Shen, X.J.; Zhang, Y.M.; Che, H.C.; Ma, Q.L.; Zhang, Y.; Zhang, X.; Ogren, J.A. Observations of relative humidity effects on aerosol light scattering in the Yangtze River Delta of China. Atmos. Chem. Phys. 2015, 15, 8439–8454. [Google Scholar] [CrossRef] [Green Version]
  33. Zeng, Z.-C.; Natraj, V.; Xu, F.; Pongetti, T.J.; Shia, R.-L.; Kort, E.A.; Toon, G.C.; Sander, S.P.; Yung, Y.L. Constraining aerosol vertical profile in the boundary layer using hyperspectral measurements of oxygen absorption. Geophys. Res. Lett. 2018, 45, 10710–772780. [Google Scholar] [CrossRef] [Green Version]
  34. Zeng, Z.-C.; Chen, S.; Natraj, V.; Le, T.; Xu, F.; Merrelli, A.; Crisp, D.; Sander, S.; Yung, Y. Constraining the vertical distribution of coastal dust aerosol using OCO-2 O2 A-band measurements. Remote Sens. Environ. 2020, 236, 111494. [Google Scholar] [CrossRef]
Figure 1. Examples of exponentially decreasing aerosol profiles for different scale heights, varying from 1.0 to 3.0 km with an interval of 0.5 km. Only profiles below 5 km are shown in this figure.
Remotesensing 12 01524 g001
Figure 2. Spectral dependence of single scattering albedo (a) and asymmetry factor (b) for three aerosol models embedded in the 6SV radiative transfer model.
Remotesensing 12 01524 g002
Figure 3. (a) The relative errors of AOD (Aerosol Optical Depth) 550nm with the errors of scale height for three different aerosol models. (b) The change in AOD relative error with AOD value. The true scale height is assumed to be 2 km.
Remotesensing 12 01524 g003
Figure 4. The relative errors of AOD 550 nm with the errors of scale height under four surface albedos (0.02, 0.05, 0.1, 0.2). The fine absorbing aerosol model is used in this experiment.
Remotesensing 12 01524 g004
Figure 5. Example of observed aerosol extinction profiles by MPL(micro-pulse lidar) at Beijing-PKU site. Only profiles below 5 km are shown in this figure.
Remotesensing 12 01524 g005
Figure 6. Two types of aerosol vertical distributions: exponential decreasing profile starting from the surface (blue line), and with a 1-km boundary layer near the surface (red line).
Remotesensing 12 01524 g006
Figure 7. (a) The relative errors of AOD 550 nm by ignoring the boundary layer structure, under four surface albedos (0.02, 0.05, 0.1, 0.2). (b) The change in AOD relative errors with the AOD value. The fine absorbing aerosol model is used in this experiment. (c) The expanded part of (b).
Remotesensing 12 01524 g007
Figure 8. Examples of aerosol layering from CALIPSO aerosol subtype products. (ND: not defined; CM: clean marine; D: dust; PC: polluted continental; CC: clean continental; PD: polluted dust; S: smoke; O: other). The red boxes indicate smoke above pollution aerosols.
Remotesensing 12 01524 g008
Figure 9. Assumed aerosol profile structures for the layered structure experiment, with two different aerosol types (sulfate and soot) located at different altitudes.
Remotesensing 12 01524 g009
Figure 10. Spectral dependence of single scattering albedo (a) and asymmetry factor (b) for soot and sulfate (50% humidity) obtained from the OPAC database.
Remotesensing 12 01524 g010
Figure 11. Relative errors of AOD 550 nm by ignoring the different vertical distribution of absorbing and scattering aerosols. (Case 1: soot lying between 0–1.0 km, sulfate lying between 3.0–4.0 km; Case 2: the reversed structure with case; Case 3: a mixed exponential profile).
Remotesensing 12 01524 g011
Figure 12. Spectral dependence of single scattering albedo (a) and asymmetry factor (b) for reconstructed seasonal aerosol models at the Beijing-PKU site.
Remotesensing 12 01524 g012
Figure 13. Scatterplots of AOD retrieved using the default profile (exponential decaying with scale height = 2 km) and the MPL-retrieved aerosol extinction profile.
Remotesensing 12 01524 g013
Figure 14. Comparison of the mean bias (upper panel), RMSE (middle panel) and the correlation (bottom panel) between the retrieval using the exponential profile (blue) and the MPL-retrieved aerosol profile (orange) for the four seasons.
Remotesensing 12 01524 g014
Figure 15. Histograms of the SSA(single scattering albedo) values at the Beijing-PKU site during 2016–2019.
Remotesensing 12 01524 g015
Figure 16. Scatterplots of AOD retrieved using the default profile (exponential decaying with scale height = 2 km) and the CALIPSO aerosol extinction profile.
Remotesensing 12 01524 g016
Figure 17. Comparison of the mean bias (upper panel), RMSE (middle panel) and the correlation (bottom panel) between the retrieval using the exponential profile (blue) and the CALIPSO aerosol profile (orange) for the four seasons.
Remotesensing 12 01524 g017
Figure 18. Geographical boundaries of the seven regions defined for the aerosol parameter analysis. AERONET sites are indicated by the red dots.
Remotesensing 12 01524 g018
Figure 19. Probability density function of AERONET AOD for the four seasons over the seven regions.
Remotesensing 12 01524 g019
Figure 20. Probability density function of AERONET SSA values for the four seasons over the seven regions.
Remotesensing 12 01524 g020
Table 1. Statistics of the retrieved AOD 550 nm against ground measurements using two kinds of aerosol profiles.
Real ProfilesAssumed Profiles
Mean Bias0.030.15
RMSE0.0020.015
Correlation0.830.63

