Monitoring Long-Term Lake Level Variations in Middle and Lower Yangtze Basin over 2002–2017 through Integration of Multiple Satellite Altimetry Datasets


Abstract
:
1. Introduction
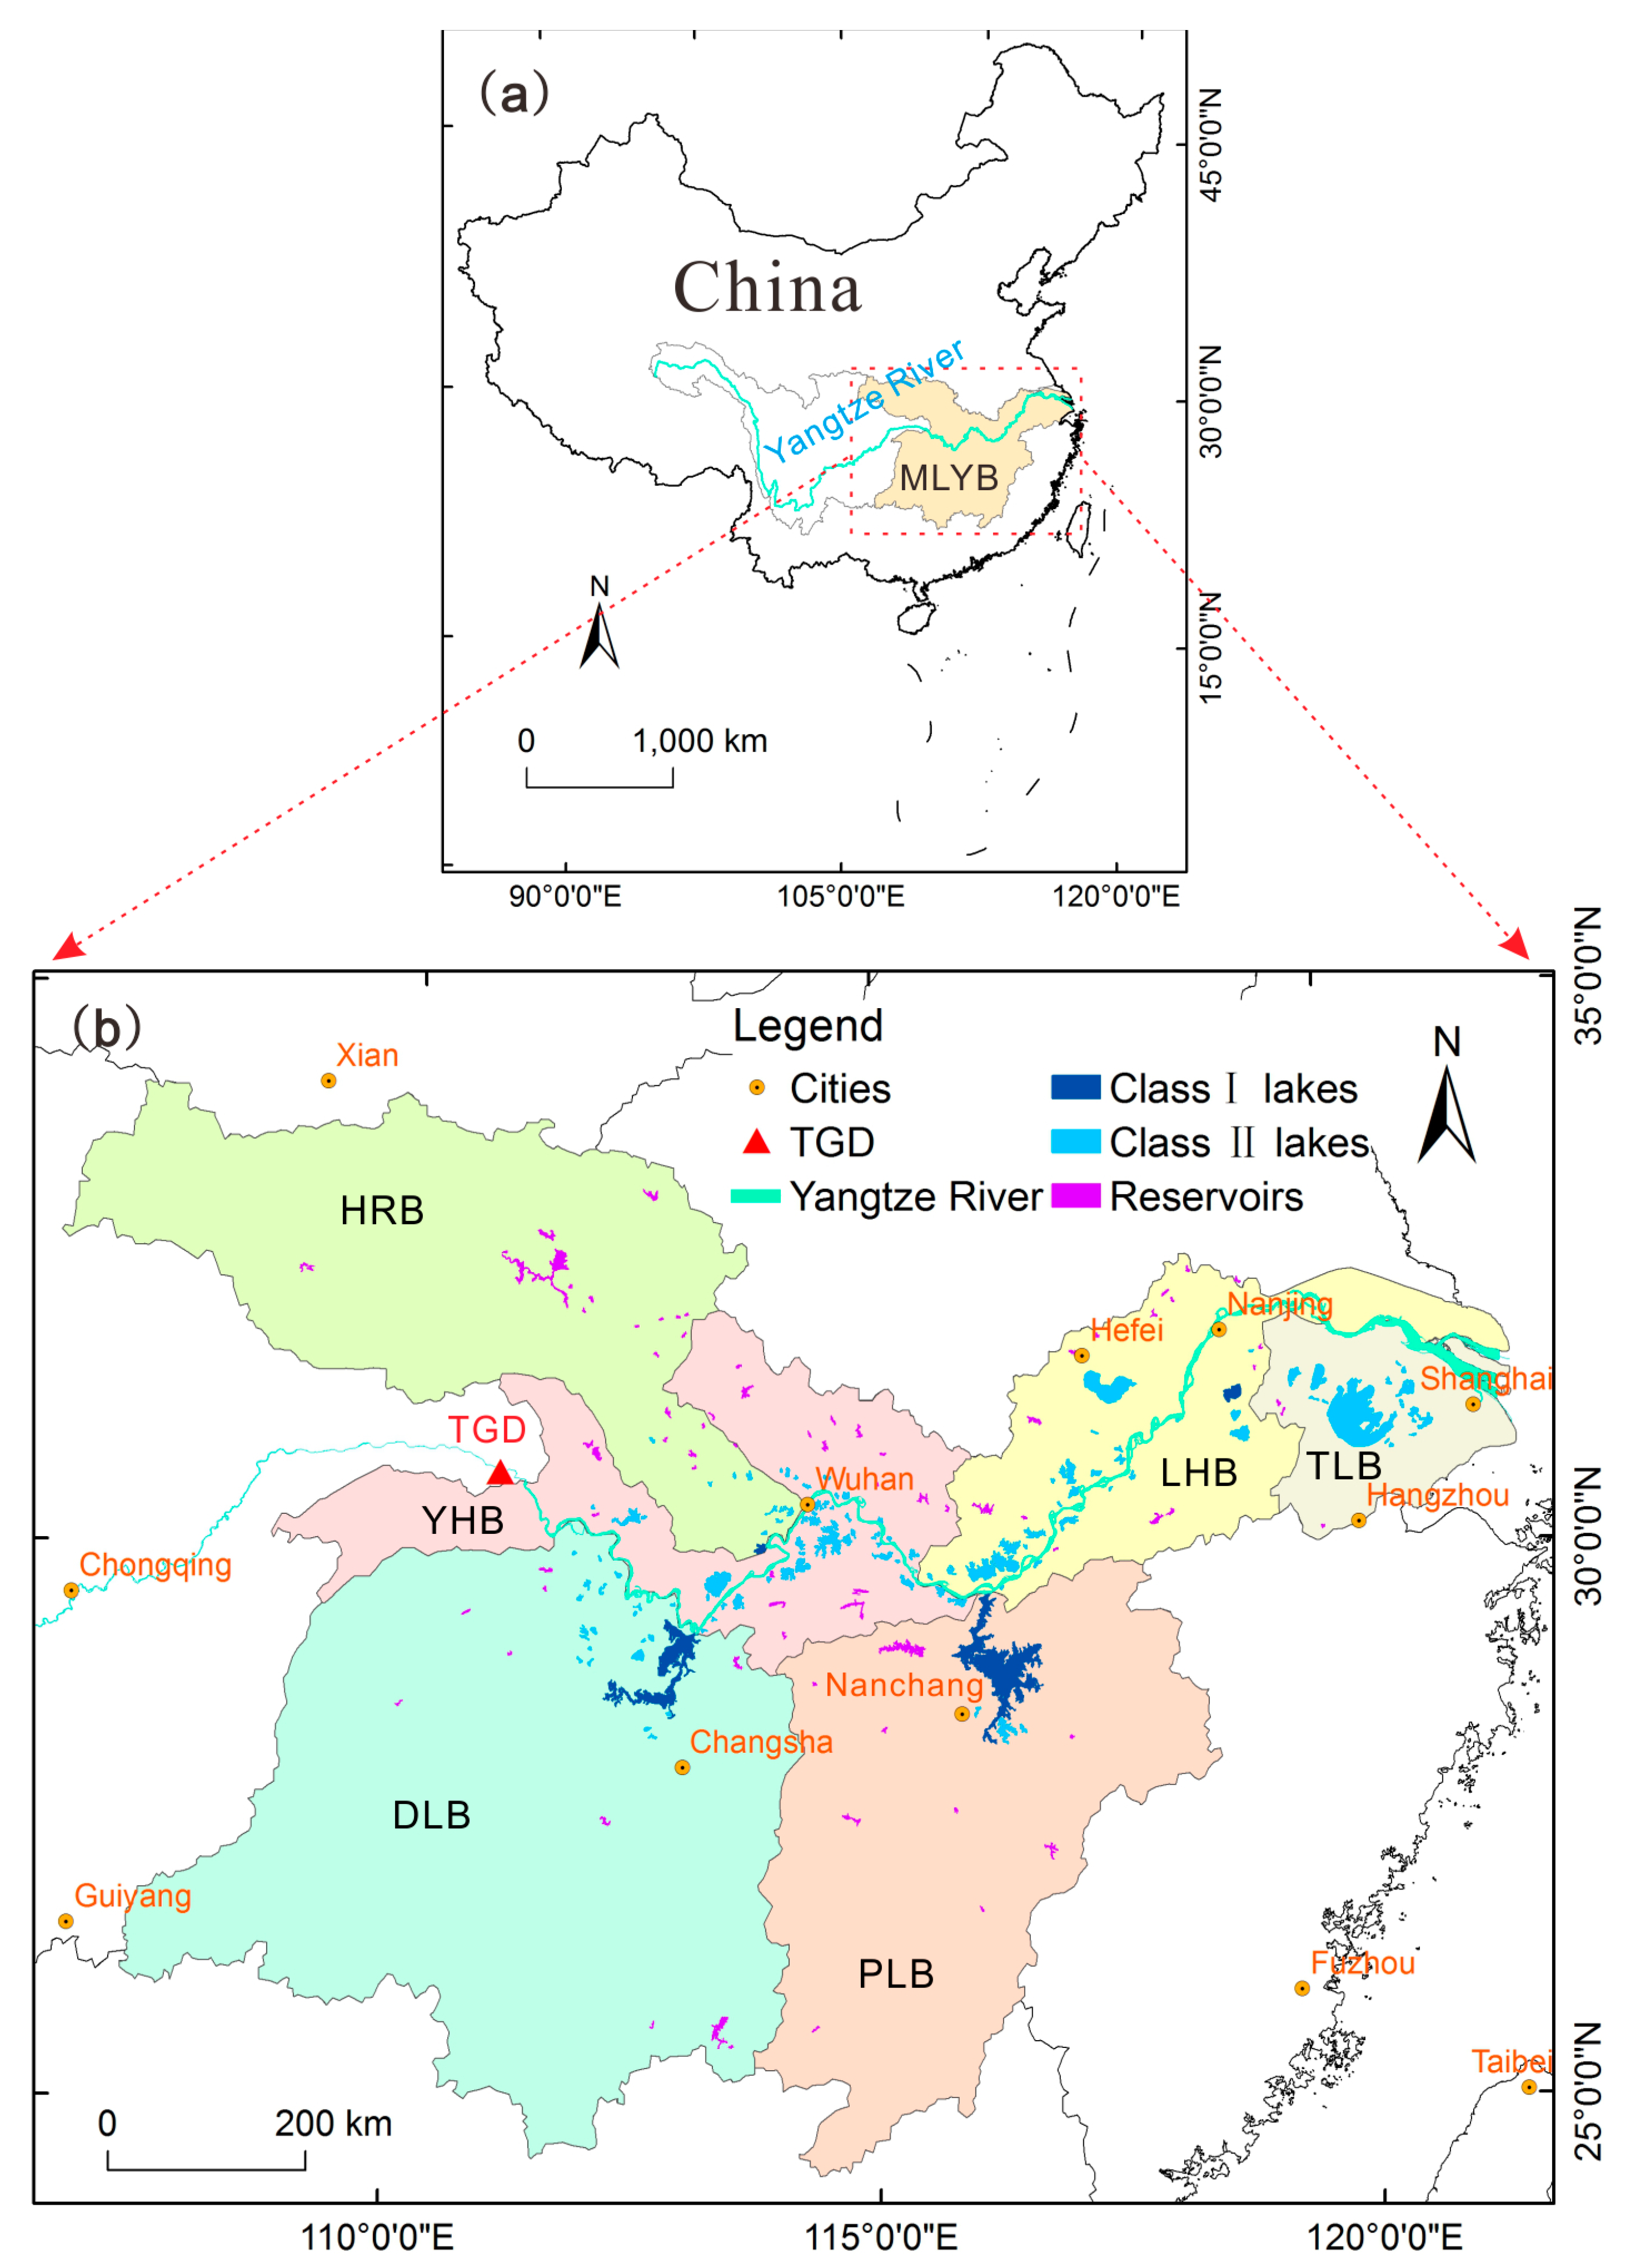
2. Study area
3. Materials and Methods
3.1. Data Sources
3.1.1. Envisat/RA-2
3.1.2. CryoSat-2/SIRAL
3.1.3. ICESat-1/GLAS
3.1.4. Auxiliary Data
3.2. Data Processing
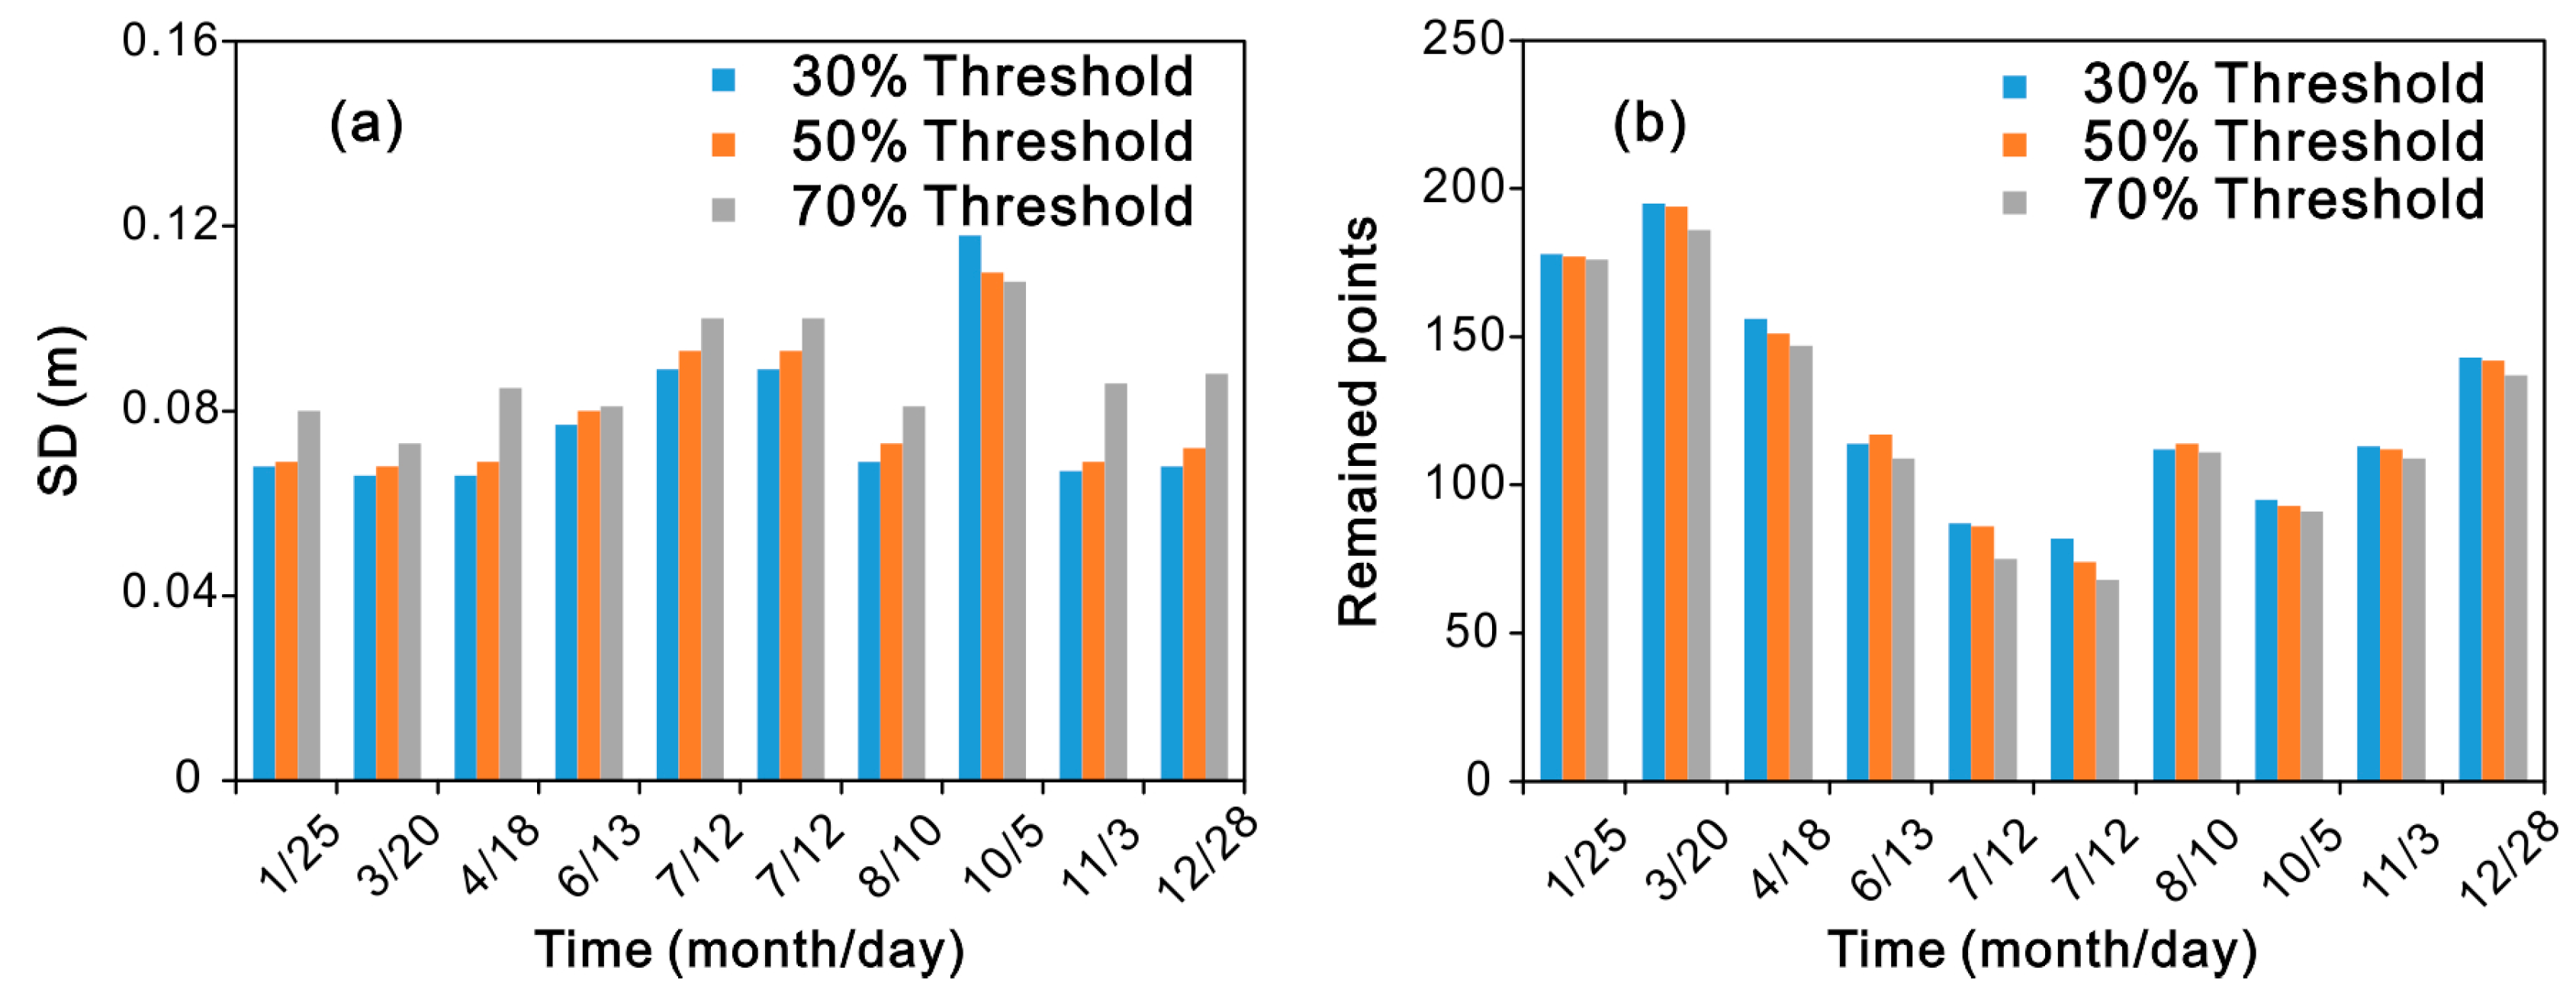
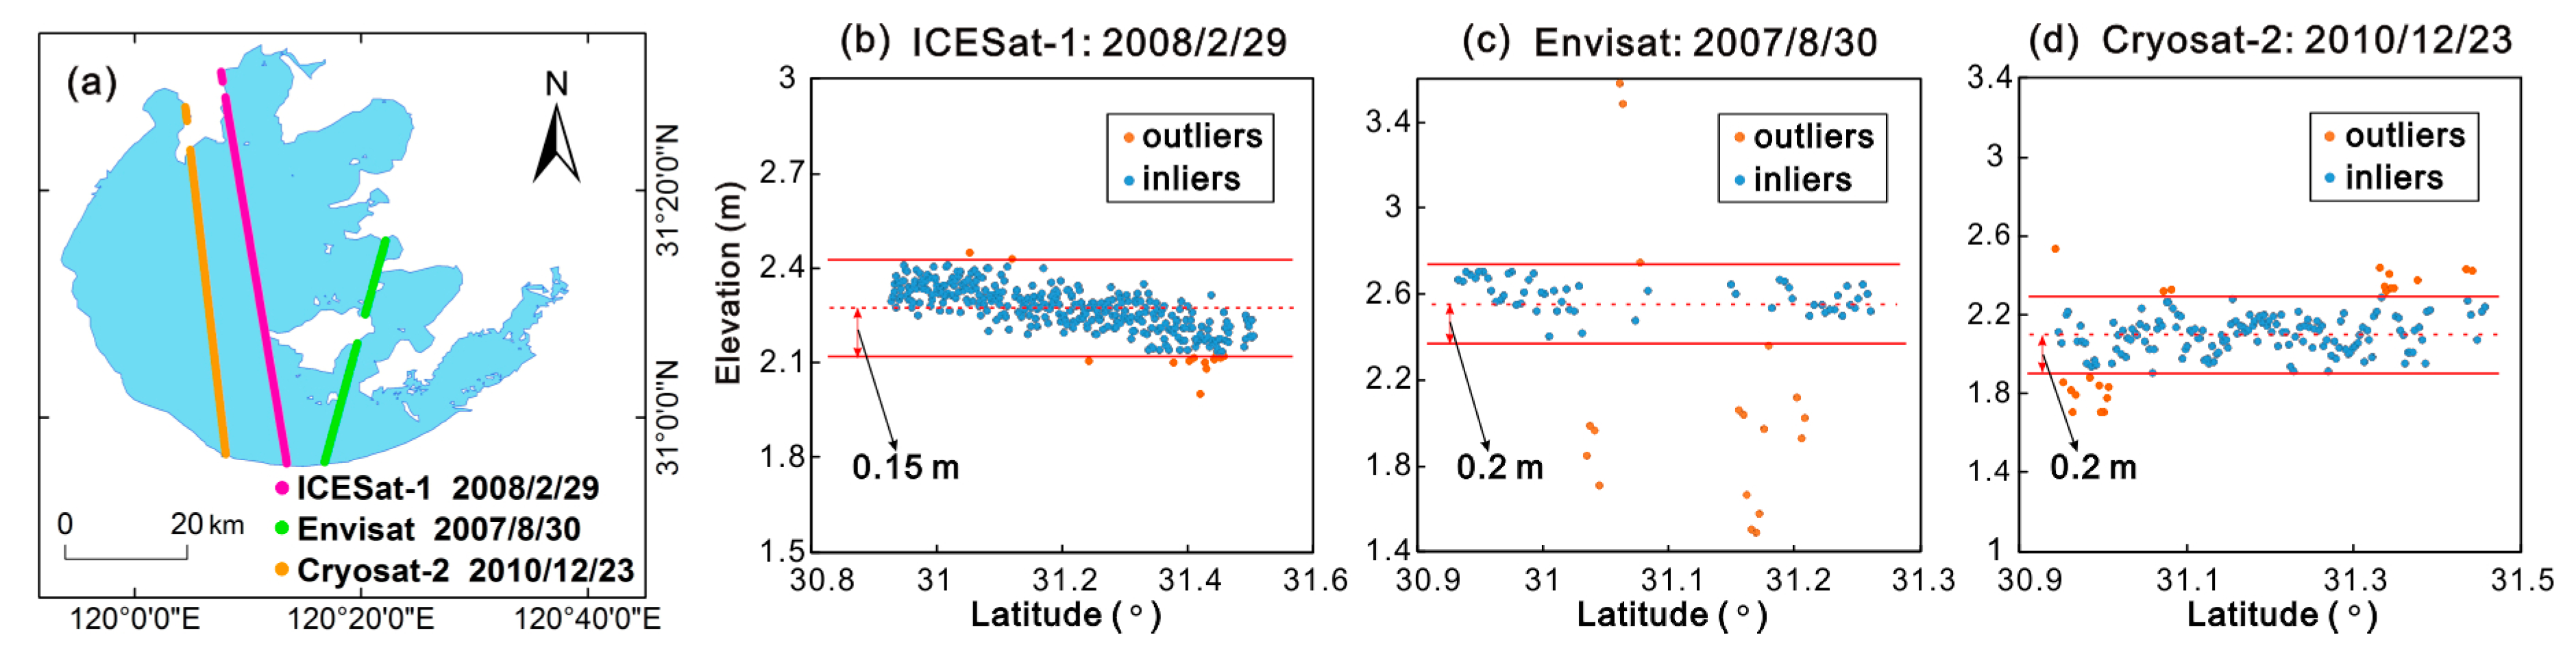
3.3. Outlier Removal
3.4. Inter-altimeter bias Adjustment and Accuracy Assessment
3.5. Lake Water Level Trend Estimation
4. Results
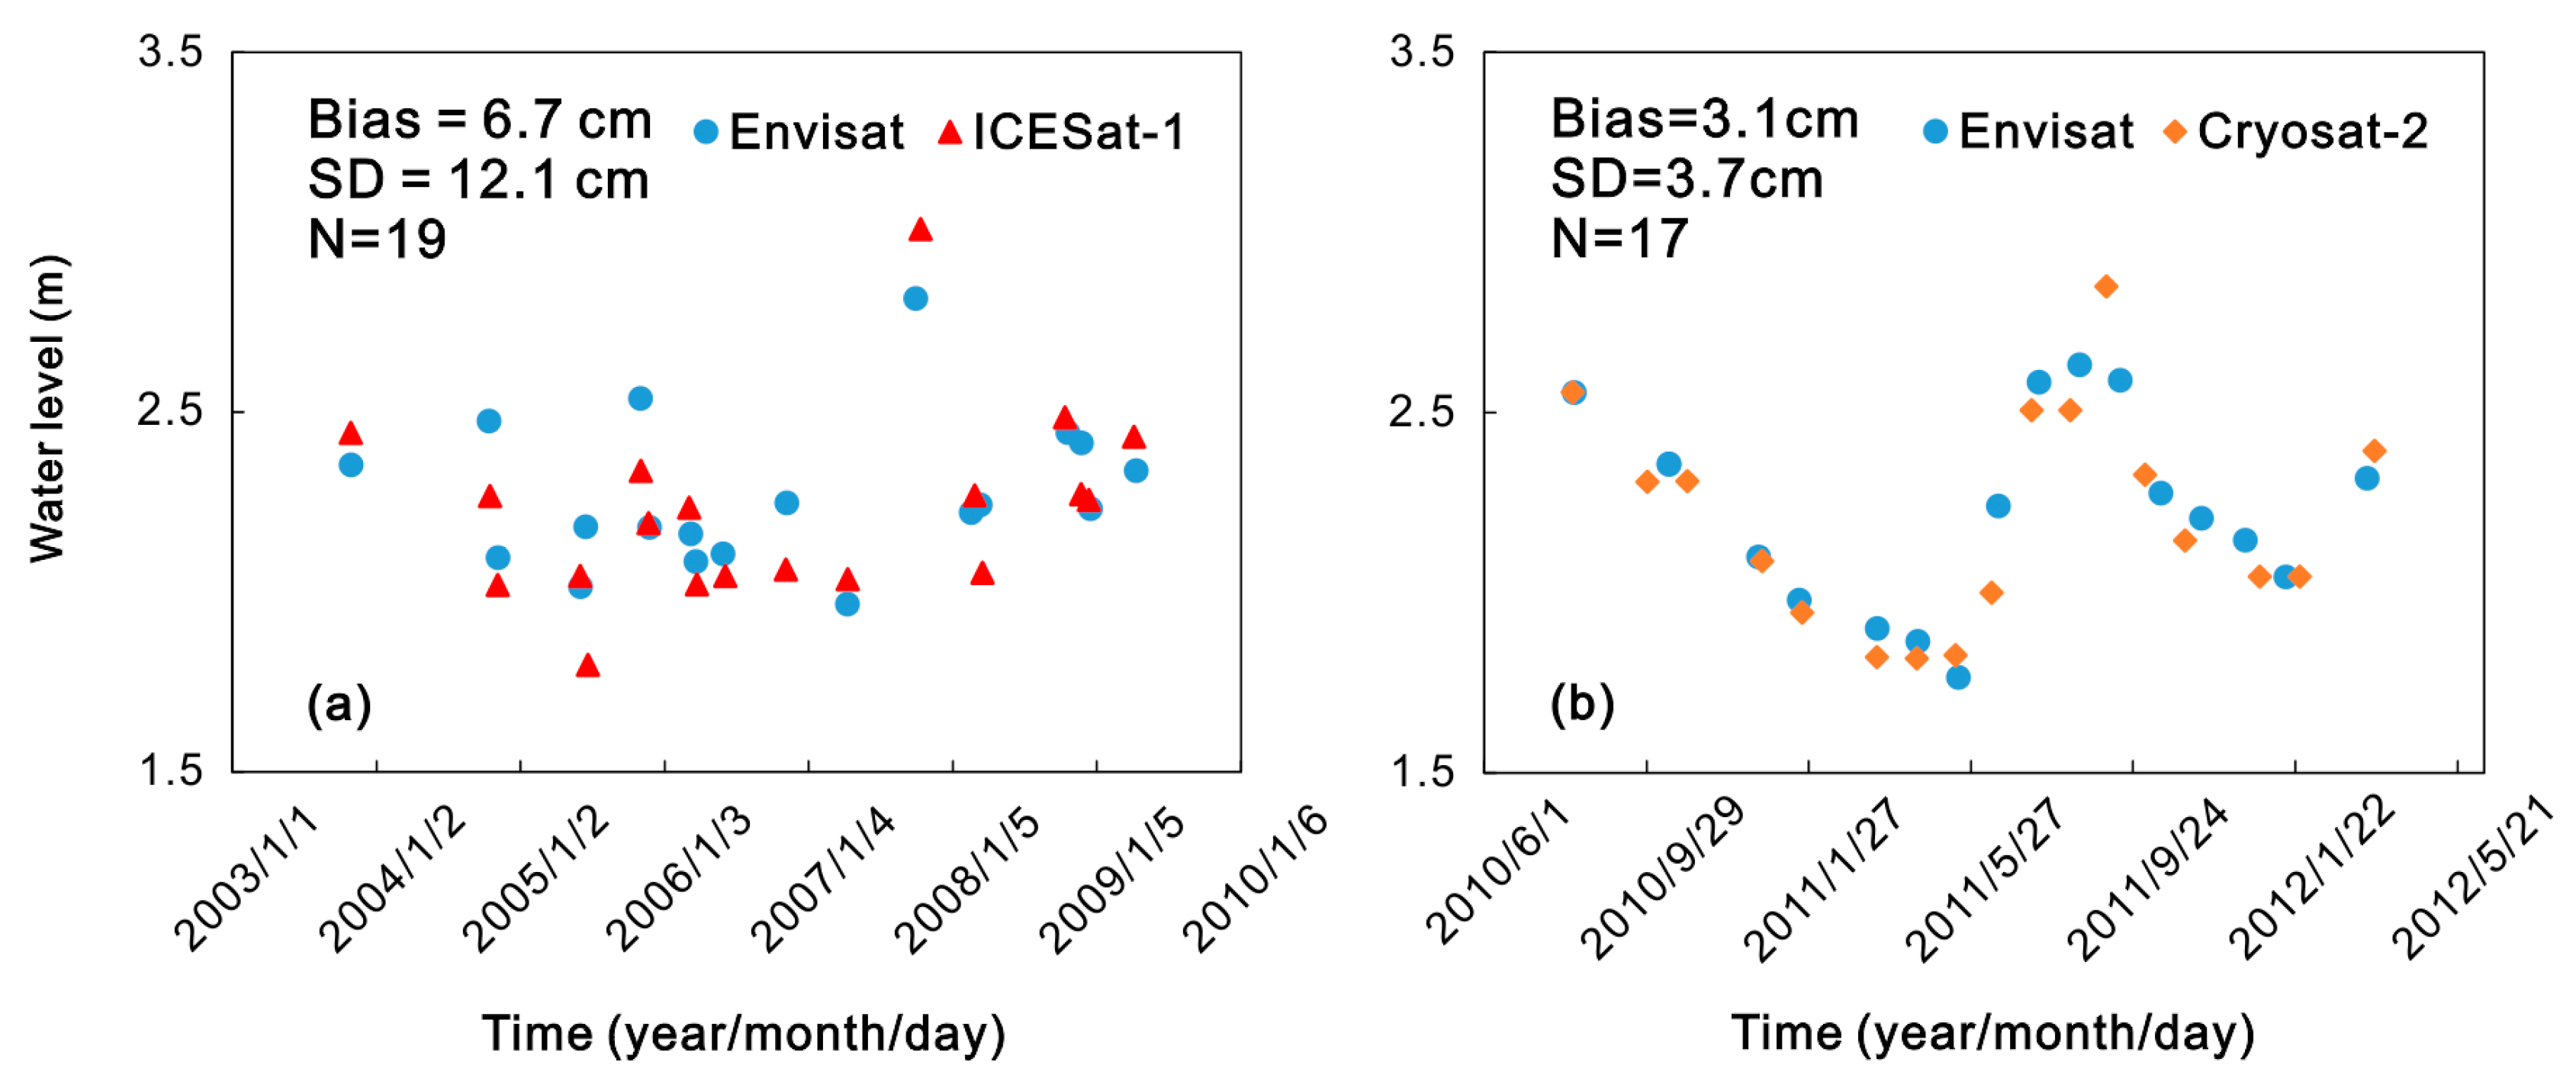
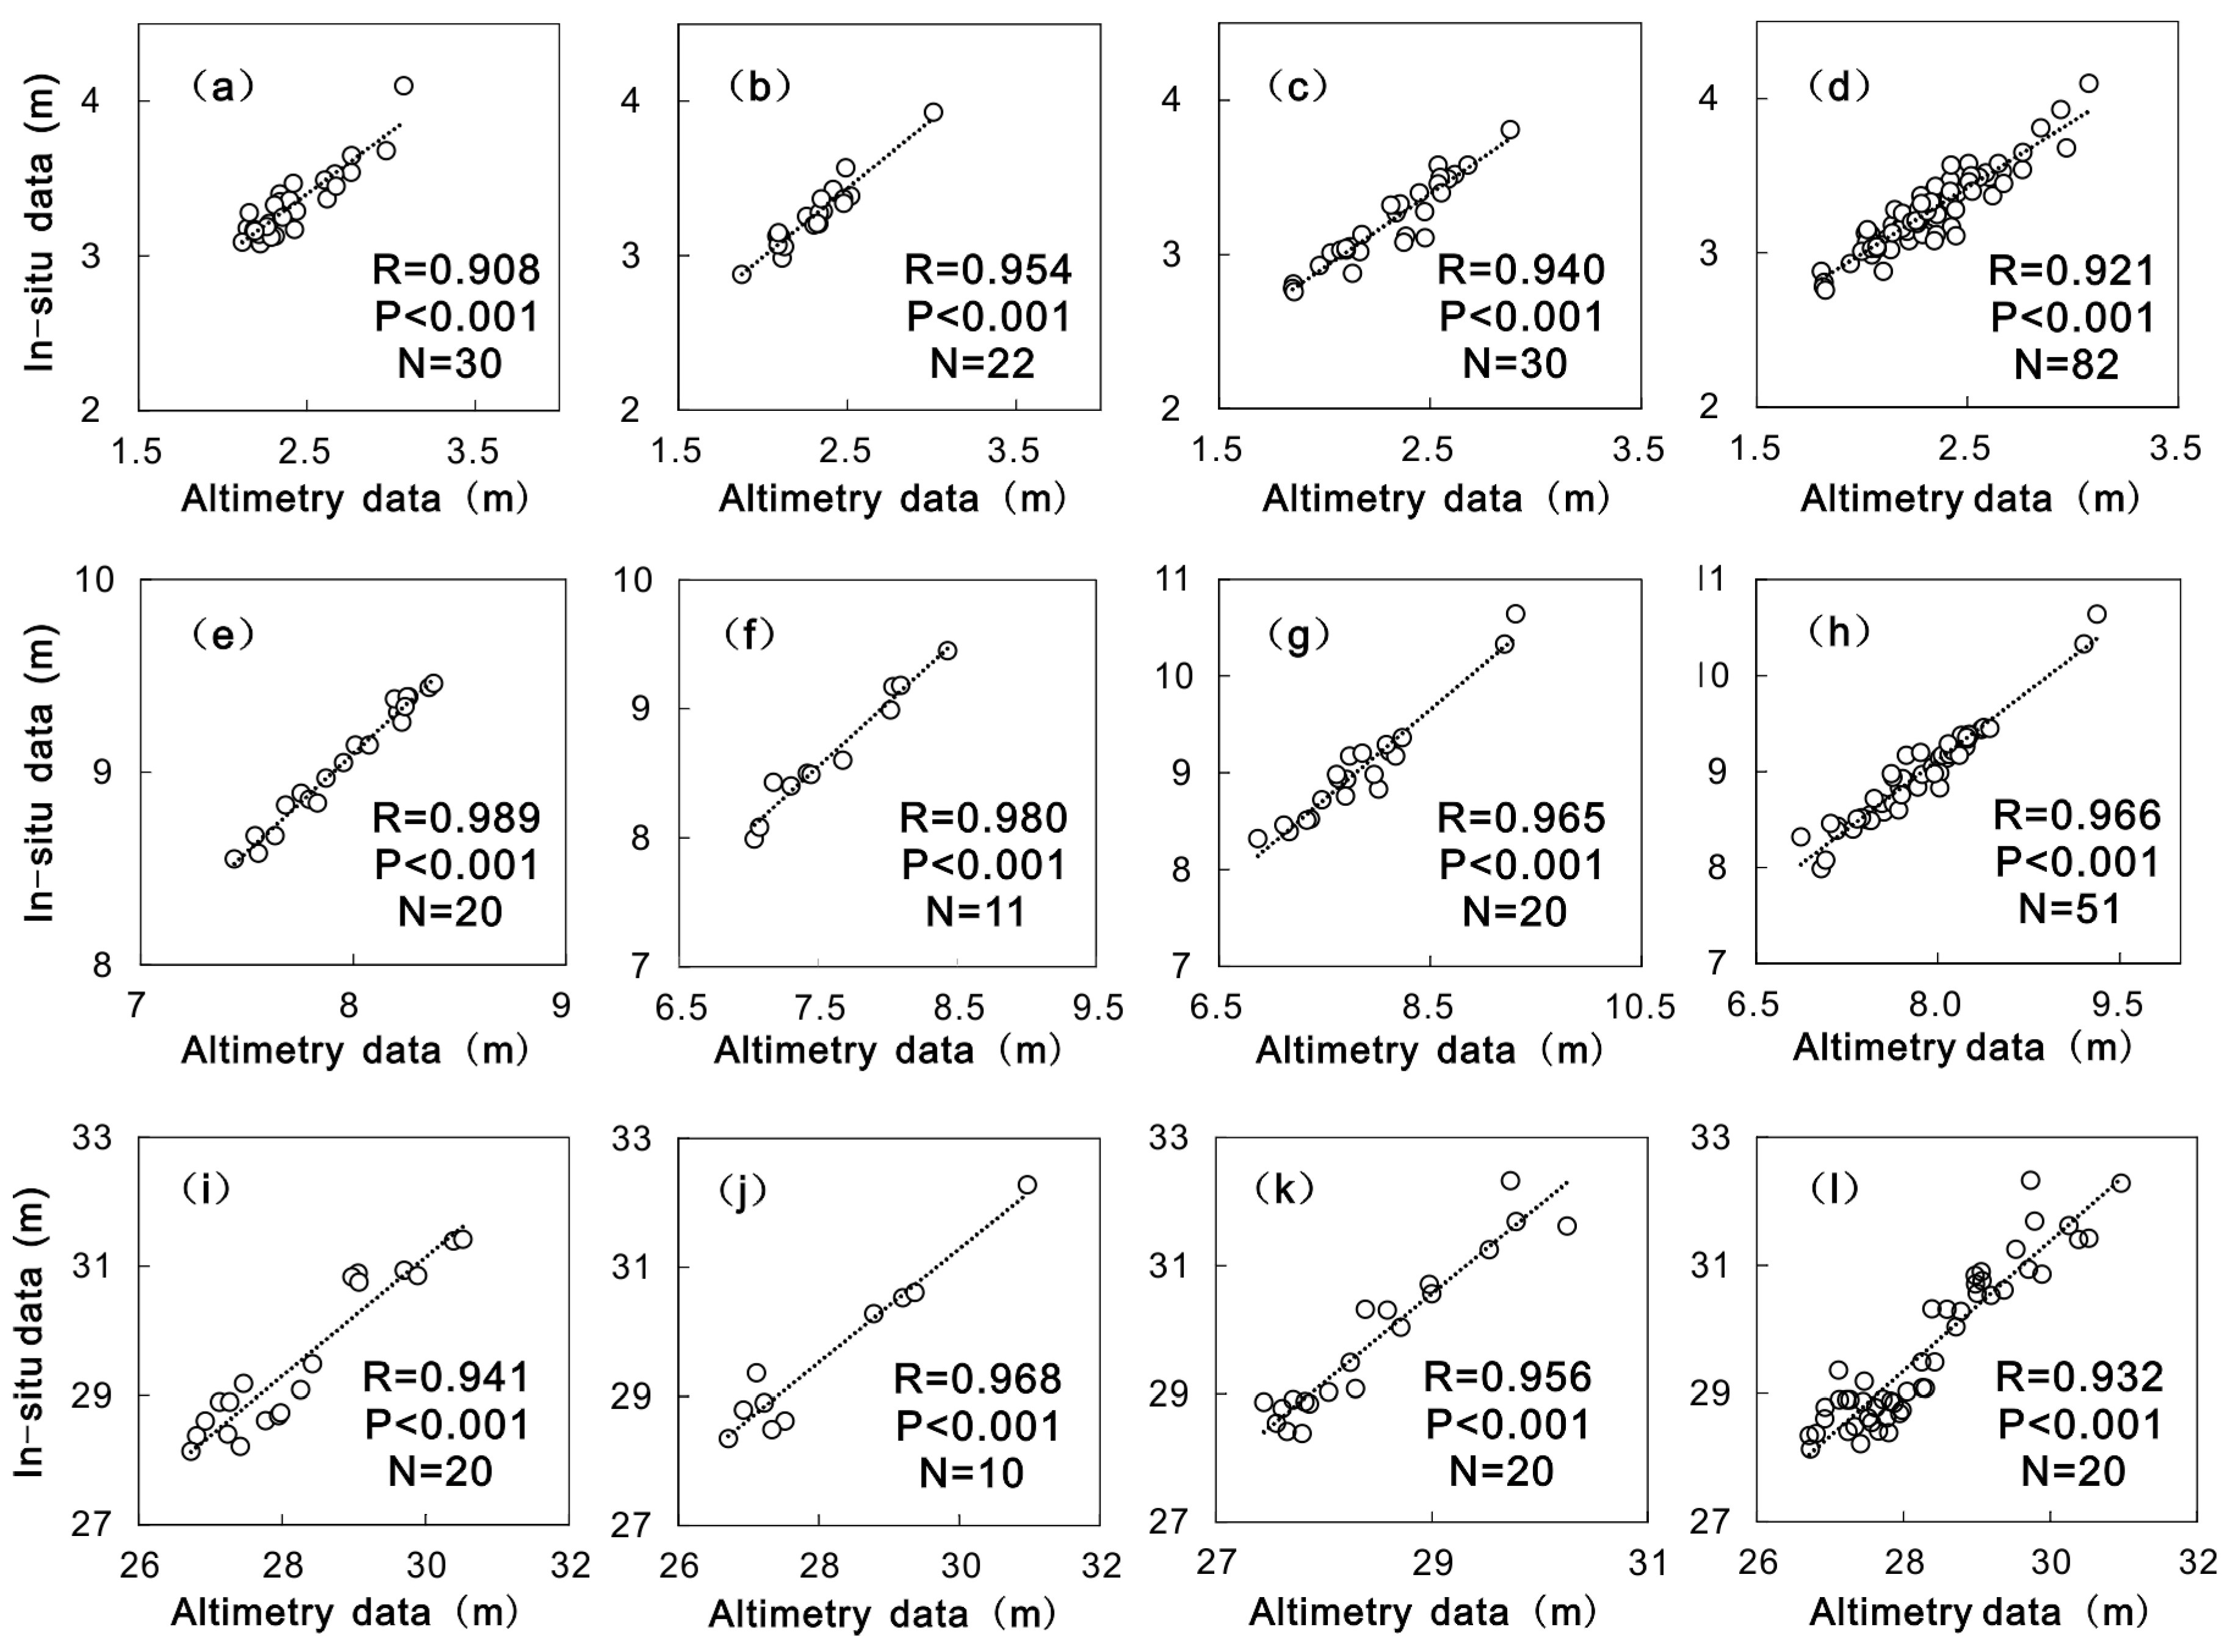
4.1. Inter-altimeter Calibration and Accuracy Assessment
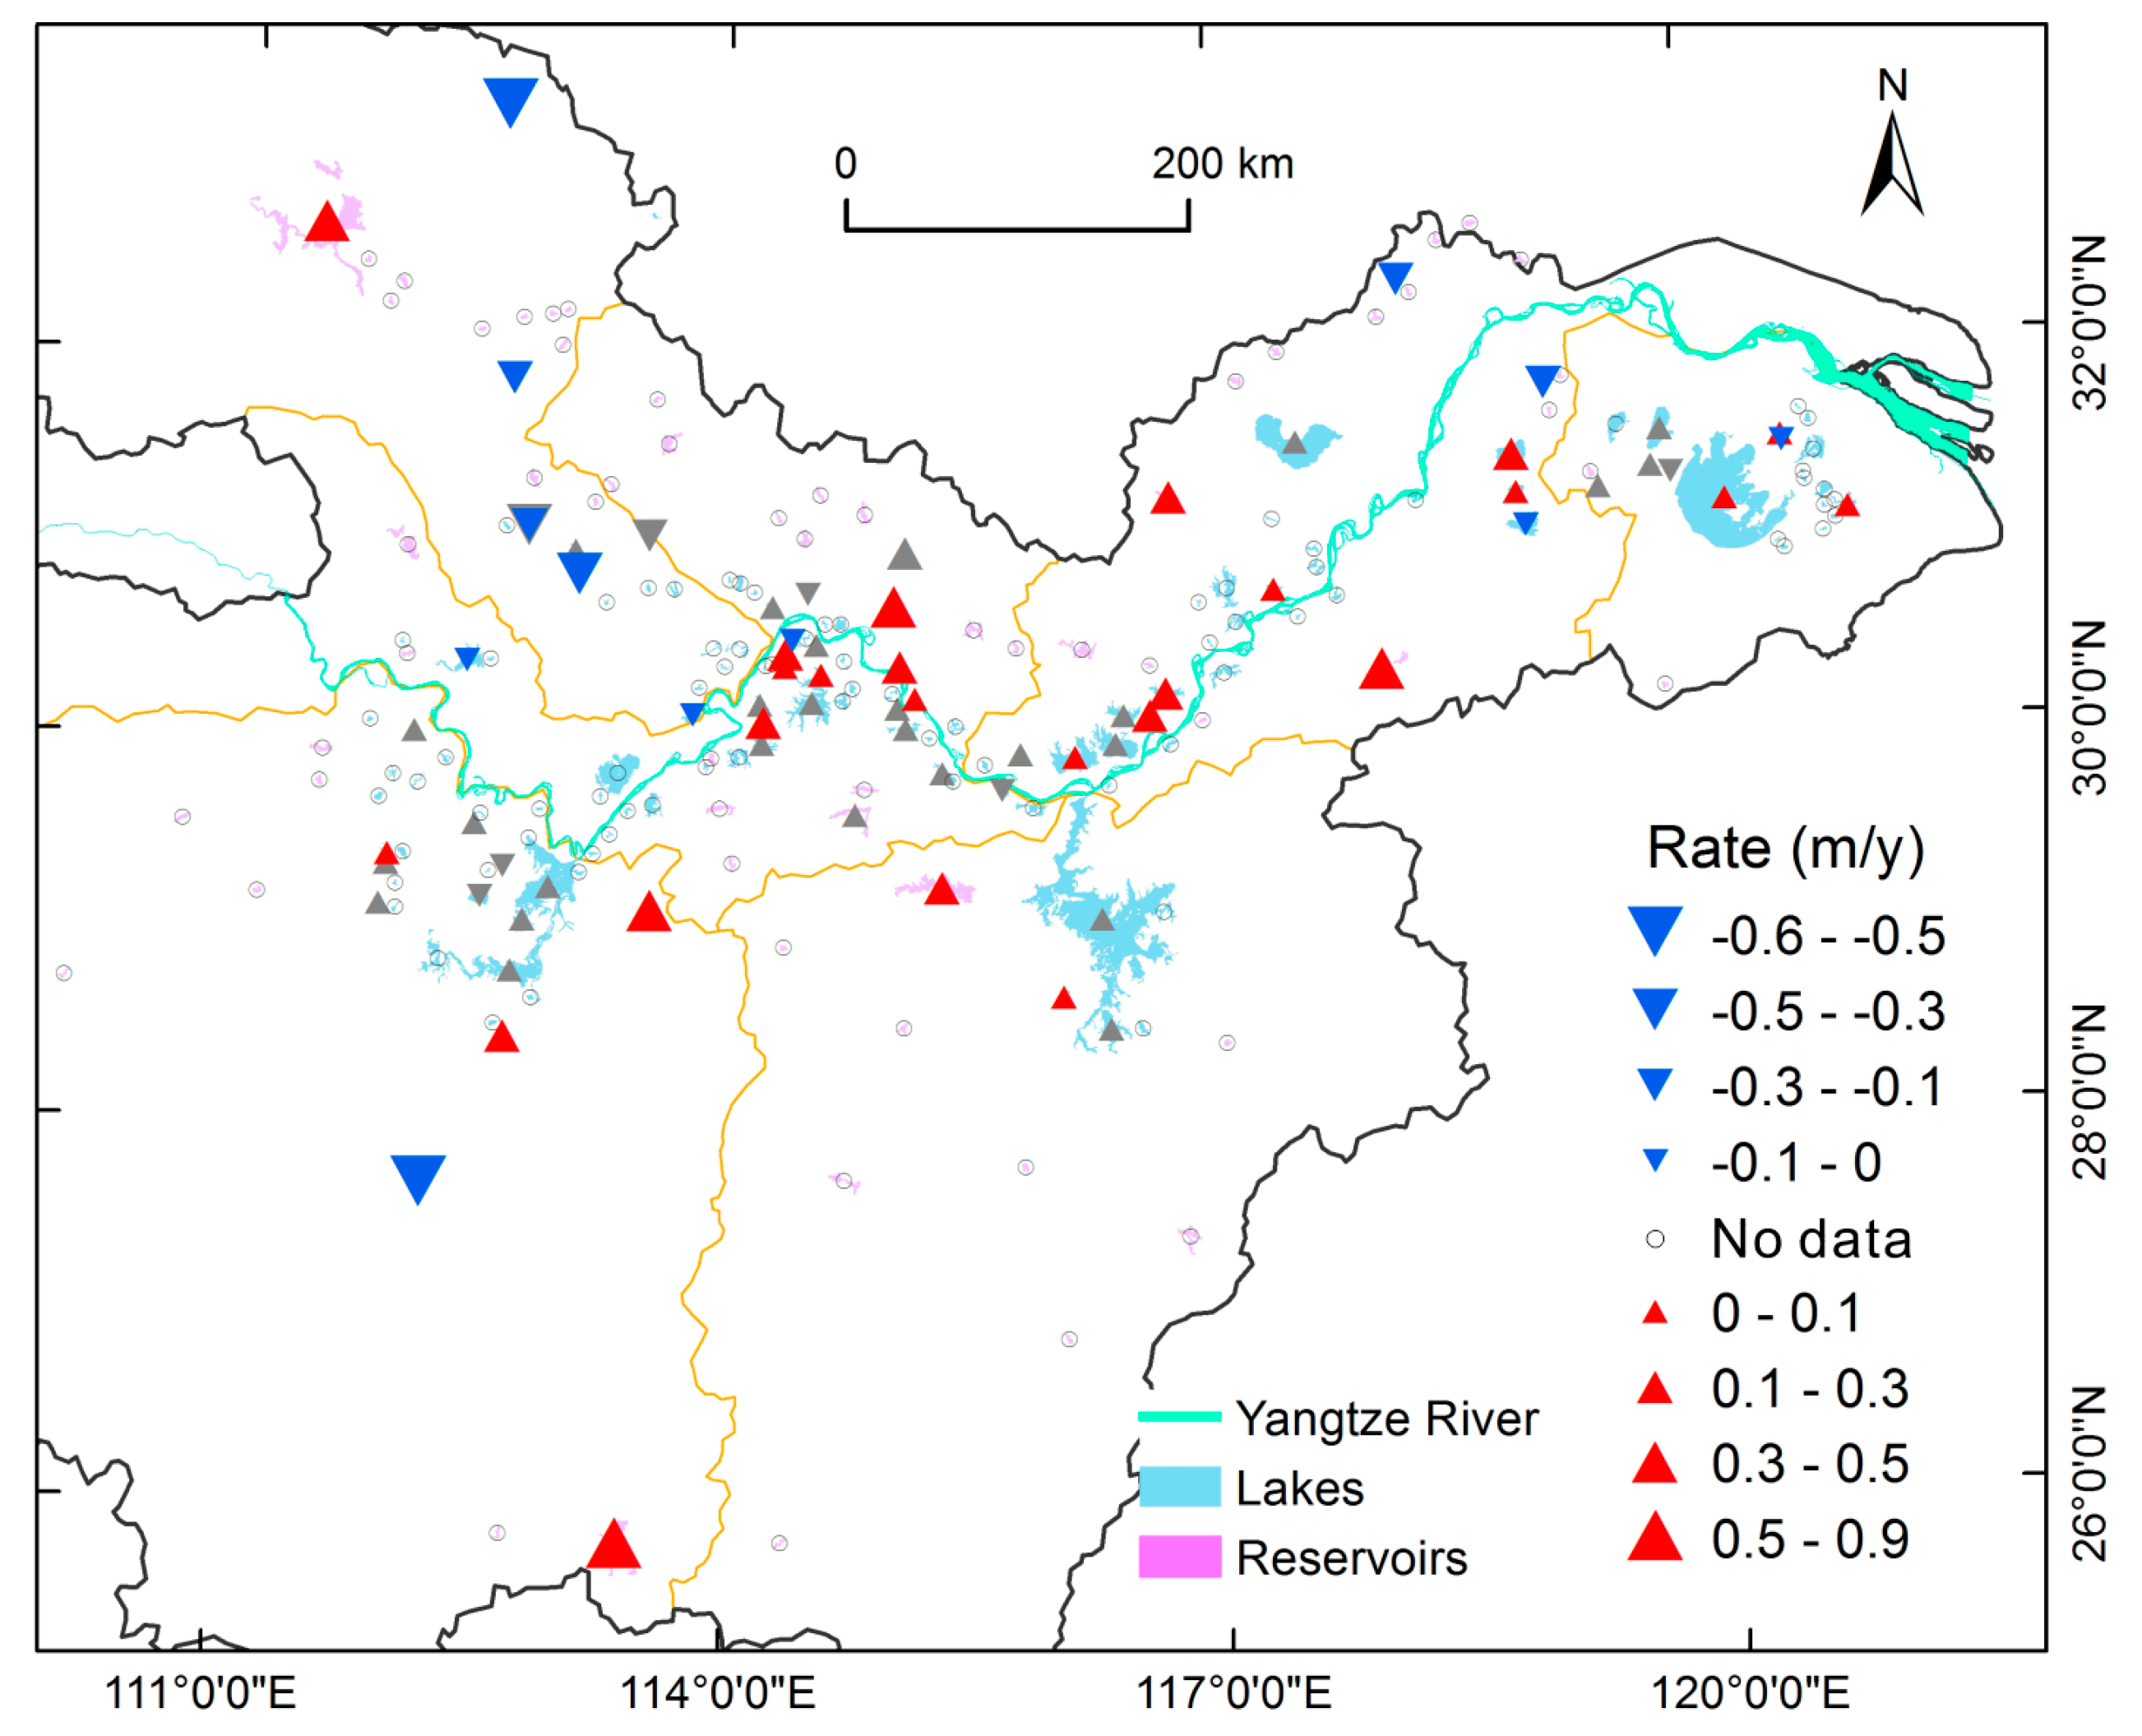
4.2. Lake Level Variation from 2002 to 2017
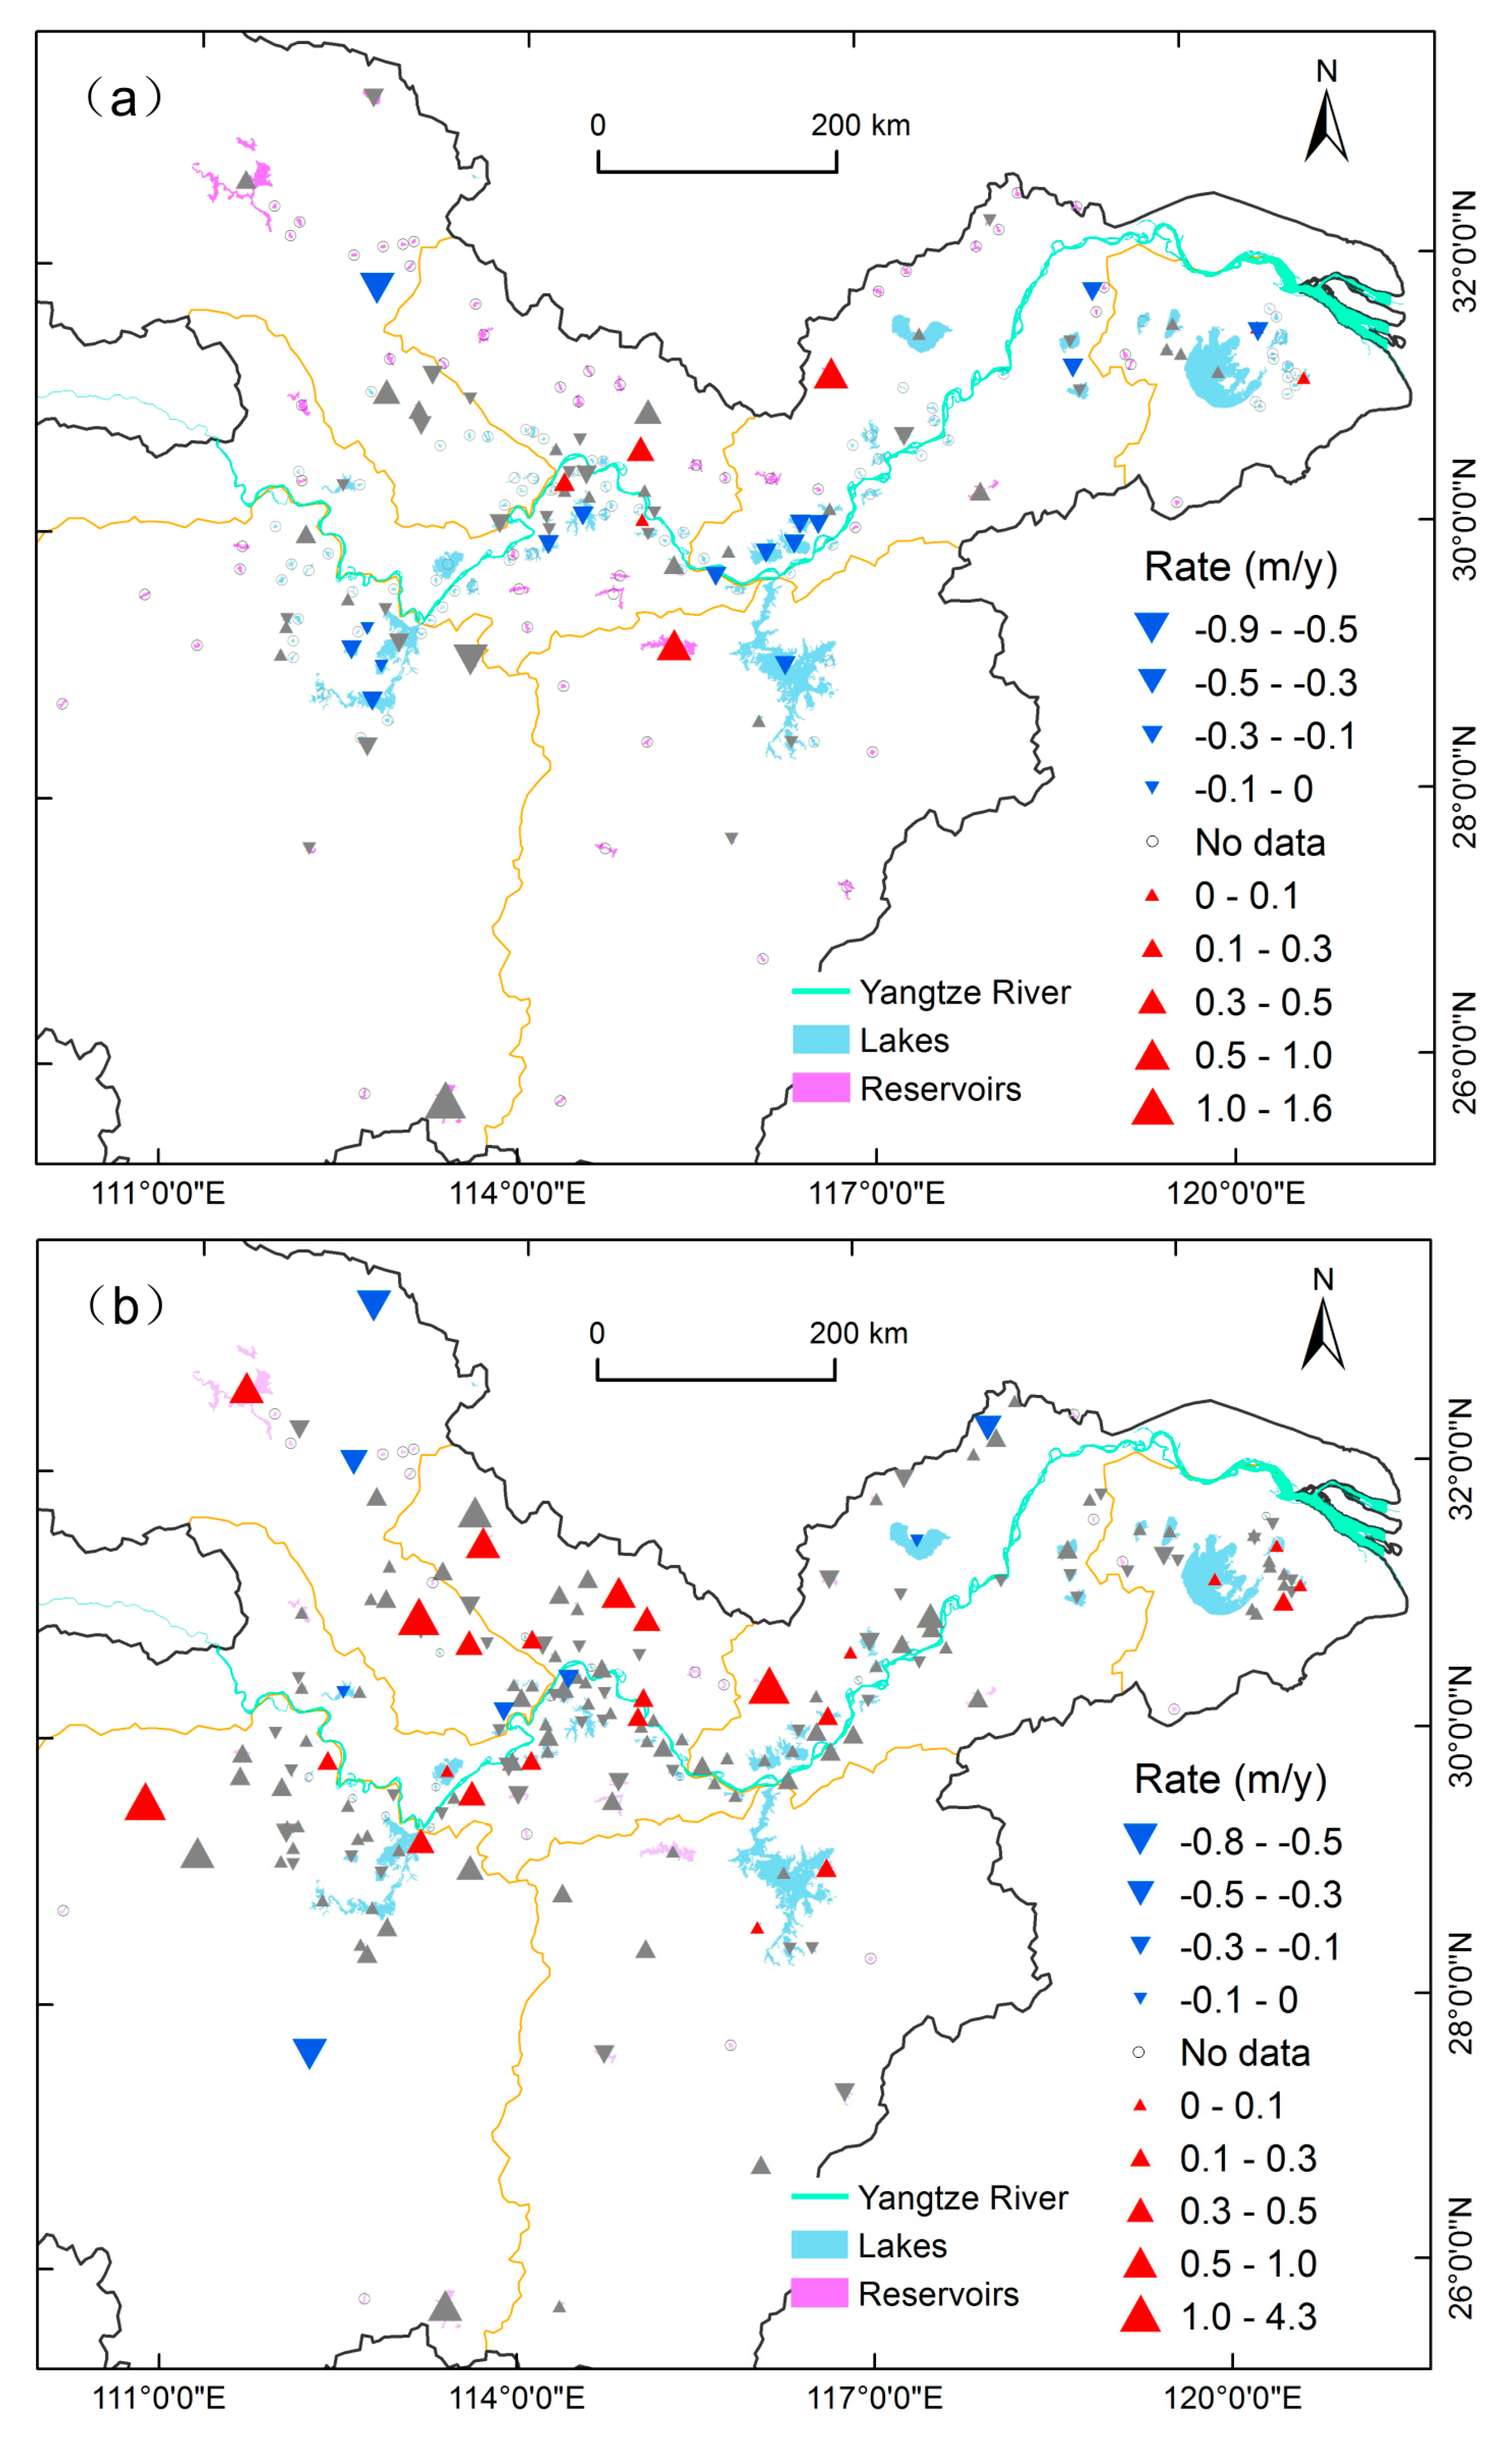
4.3. Lake Level Variation in Different Periods
5. Discussion
5.1. Performance of Multi-Satellite Altimetry
5.2. Impact Factors of Water Level Variations
6. Conclusions
Supplementary Materials
Author Contributions
Funding
Acknowledgments
Conflicts of Interest
References
- Jiang, L.; Nielsen, K.; Andersen, O.B.; Bauer-Gottwein, P. CryoSat-2 radar altimetry for monitoring freshwater resources of China. Remote Sens. Environ. 2017, 200, 125–139. [Google Scholar] [CrossRef] [Green Version]
- Vörösmarty, C.J.; Green, P.; Salisbury, J.; Lammers, R.B. Global water resources: Vulnerability from climate change and population growth. Science 2000, 5477, 284–288. [Google Scholar] [CrossRef] [Green Version]
- Adrian, R.; O’Reilly, C.M.; Zagarese, H.; Baines, S.B.; Hessen, D.O.; Keller, W.; Livingstone, D.M.; Sommaruga, R.; Straile, D.; Van Donk, E. Lakes as sentinels of climate change. Limnol. Oceanogr. 2009, 54, 2283–2297. [Google Scholar] [CrossRef]
- Williamson, C.E.; Saros, J.E.; Vincent, W.F.; Smol, J.P. Lakes and reservoirs as sentinels, integrators, and regulators of climate change. Limnol. Oceanogr. 2009, 54, 2273–2282. [Google Scholar] [CrossRef]
- Jawak, S.; Luis, A. Spectral Information Analysis for the Semiautomatic Derivation of Shallow Lake Bathymetry Using High-resolution Multispectral Imagery: A Case Study of Antarctic Coastal Oasis. Aquat. Procedia 2015, 4, 1331–1338. [Google Scholar] [CrossRef]
- Chipman, J.W.; Lillesand, T.M. Satellite based assessment of the dynamics of new lakes in Southern Egypt. Int. J. Remote. Sens. 2007, 28, 4365–4379. [Google Scholar] [CrossRef]
- Benveniste, J.; Blanc, F.; Boissier, C.; Brossier, C.; Houry, S.; Jourdin, F.; Mazzega, P.; Minster, J.; Rémy, F.; Vincent, P. Precision of regional mean sea level and continental ice sheet topography as determined by satellite altimetry. Adv. Space Res. 1991, 11, 87–92. [Google Scholar] [CrossRef]
- Jiang, L.; Nielsen, K.; Andersen, O.B.; Bauer-Gottwein, P. Monitoring recent lake level variations on the Tibetan Plateau using CryoSat-2 SARIn mode data. J. Hydrol. 2017, 544, 109–124. [Google Scholar] [CrossRef] [Green Version]
- Qi, H.; Di, L.; Mingda, D.; Chao, Z.; Xingdong, L.; Aizhong, H.; Yang, H. An improved approach to monitoring Brahmaputra River water levels using retracked altimetry data. Remote Sens. Environ. 2018, 112–128. [Google Scholar]
- Crétaux, J.F.; Abarca-del-Río, R.; Bergé-Nguyen, M.; Arsen, A.; Drolon, V.; Clos, G.; Maisongrande, P. Lake Volume Monitoring from Space. Surv. Geophys. 2016, 37, 269–305. [Google Scholar] [CrossRef] [Green Version]
- Urban, T.J.; Schutz, B.E.; Neuenschwander, A.L. A survey of ICESat coastal altimetry applications: Continental coast, open ocean island, and inland river. Terr. Atmospheric Ocean. Sci. 2008, 19, 1. [Google Scholar] [CrossRef] [Green Version]
- Abdallah, H.; Bailly, J.; Baghdadi, N.; Lemarquand, N. Improving the assessment of ICESat water altimetry accuracy accounting for autocorrelation. ISPRS J. Photogramm. Remote. Sens. 2011, 66, 833–844. [Google Scholar] [CrossRef] [Green Version]
- Phan, V.H.; Lindenbergh, R.; Menenti, M. ICESat derived elevation changes of Tibetan lakes between 2003 and 2009. Int. J. Appl. Earth Obs. Geoinf. 2012, 17, 12–22. [Google Scholar] [CrossRef]
- Santos Da Silva, J.; Calmant, S.; Seyler, F.; Rotunno Filho, O.C.; Cochonneau, G.; Mansur, W.J. Water levels in the Amazon basin derived from the ERS 2 and ENVISAT radar altimetry missions. Remote Sens. Environ. 2010, 114, 2160–2181. [Google Scholar] [CrossRef]
- Kleinherenbrink, M.; Ditmar, P.G.; Lindenbergh, R.C. Retracking Cryosat data in the SARIn mode and robust lake level extraction. Remote Sens. Environ. 2014, 152, 38–50. [Google Scholar] [CrossRef]
- Jiang, L.; Schneider, R.; Andersen, O.; Bauer-Gottwein, P. CryoSat-2 altimetry applications over rivers and lakes. Water 2017, 9, 211. [Google Scholar] [CrossRef]
- Nielsen, K.; Stenseng, L.; Andersen, O.B.; Knudsen, P. The performance and potentials of the CryoSat-2 SAR and SARIn modes for lake level estimation. Water 2017, 9, 374. [Google Scholar] [CrossRef]
- Birkett, C.; Reynolds, C.; Beckley, B.; Doorn, B. From Research to Operations: The USDA Global Reservoir and Lake Monitor. In Coastal Altimetry; Springer: Berlin/Heidelberg, Germany, 2011; pp. 19–50. [Google Scholar]
- Gao, L.; Liao, J.; Shen, G. Monitoring lake-level changes in the Qinghai-Tibetan Plateau using radar altimeter data (2002–2012). J. Appl. Remote Sens. 2013, 7, 73470. [Google Scholar] [CrossRef]
- Hwang, C.; Cheng, Y.; Han, J.; Kao, R.; Huang, C.; Wei, S.; Wang, H. Multi-decadal monitoring of lake level changes in the Qinghai-Tibet Plateau by the TOPEX/Poseidon-Family altimeters: Climate implication. Remote Sens. 2016, 8, 446. [Google Scholar] [CrossRef] [Green Version]
- Wang, H.; Chu, Y.; Huang, Z.; Hwang, C.; Chao, N. Robust, long-term lake level change from multiple satellite altimeters in Tibet: Observing the rapid rise of Ngangzi Co over a new wetland. Remote Sens. 2019, 11, 558. [Google Scholar] [CrossRef] [Green Version]
- Song, C.; Ye, Q.; Sheng, Y.; Gong, T. Combined ICESat and CryoSat-2 Altimetry for accessing water level dynamics of Tibetan lakes over 2003–2014. Water. 2015, 7, 4685–4700. [Google Scholar] [CrossRef] [Green Version]
- Boergens, E.; Dettmering, D.; Schwatke, C.; Seitz, F. Treating the Hooking Effect in Satellite Altimetry Data: A Case Study along the Mekong River and Its Tributaries. Remote Sens. 2016, 8, 91. [Google Scholar] [CrossRef] [Green Version]
- Bosch, W.; Dettmering, D.; Schwatke, C. Multi-mission cross-calibration of satellite altimeters: Constructing a long-term data record for gobal and regional sea level change studies. Remote Sens. 2014, 6, 2255–2281. [Google Scholar] [CrossRef] [Green Version]
- Yang, S.L.; Zhang, J.; Xu, X.J. Influence of the Three Gorges Dam on downstream delivery of sediment and its environmental implications, Yangtze River. Geophys. Res. Lett. 2007, 34, 34. [Google Scholar] [CrossRef]
- Du, Y.; Xue, H.; Wu, S.; Ling, F.; Xiao, F.; Wei, X. Lake area changes in the middle Yangtze region of China over the 20th century. J. Environ. Manag. 2011, 92, 1248–1255. [Google Scholar] [CrossRef]
- Ma, R.; Duan, H.; Hu, C.; Feng, X.; Li, A.; Ju, W.; Jiang, J.; Yang, G. A half-century of changes in China’s lakes: Global warming or human influence? Geophys. Res. Lett. 2010, 37, L24106. [Google Scholar] [CrossRef]
- Wang, J.; Sheng, Y.; Tong, T.S.D. Monitoring decadal lake dynamics across the Yangtze Basin downstream of Three Gorges Dam. Remote Sens. Environ. 2014, 152, 251–269. [Google Scholar] [CrossRef]
- Guo, H.; Hu, Q.; Zhang, Q.; Feng, S. Effects of the Three Gorges Dam on Yangtze River flow and river interaction with Poyang Lake, China: 2003–2008. J. Hydrol. 2012, 416, 19–27. [Google Scholar] [CrossRef]
- Wang, X.; Gong, P.; Zhao, Y.; Xu, Y.; Cheng, X.; Niu, Z.; Luo, Z.; Huang, H.; Sun, F.; Li, X. Water-level changes in China’s large lakes determined from ICESat/GLAS data. Remote Sens. Environ. 2013, 132, 131–144. [Google Scholar] [CrossRef]
- Changjiang Water Resources Commission. Changjiang and Southwest Rivers Water Resources Bulletin; Yangtze River Publishing House: Wuhan, China, 2003–2017. (In Chinese) [Google Scholar]
- Xie, C.; Huang, X.; Mu, H.; Yin, W. Impacts of Land-Use Changes on the Lakes across the Yangtze Floodplain in China. Environ. Sci. Technol. 2017, 7, 3669–3677. [Google Scholar] [CrossRef]
- Sichangi, A.W.; Wang, L.; Wang, Z.; Yang, K.; Chen, D.; Li, X.; Zhou, J.; Liu, W.; Kuria, D.; Naturvetenskapliga, F.; et al. Estimating continental river basin discharges using multiple remote sensing data sets. Remote Sens. Environ. 2016, 179, 36–53. [Google Scholar] [CrossRef] [Green Version]
- ESA; Mullar Space Science Laboratory. CryoSat Product Handbook Volume DLFE-3605. 101; European Space Agency: Paris, France, 2012. [Google Scholar]
- Zwally, H.J.; Schutz, B.; Abdalati, W.; Abshire, J.; Bentley, C.; Brenner, A.; Bufton, J.; Dezio, J.; Hancock, D.; Harding, D.; et al. ICESat’s laser measurements of polar ice, atmosphere, ocean, and land. J. Geodyn. 2002, 34, 405–445. [Google Scholar] [CrossRef] [Green Version]
- Li, D.; Christakos, G.; Ding, X.; Wu, J. Adequacy of TRMM satellite rainfall data in driving the SWAT modeling of Tiaoxi catchment (Taihu lake basin, China). J. Hydrol. 2018, 556, 1139–1152. [Google Scholar] [CrossRef]
- Huffman, G.J.; Bolvin, D.T. TRMM and Other Data Precipitation Data Set Documentation. Available online: https://pmm.nasa.gov/sites/default/files/document_files/3B42_3B43_doc_V7.pdf (accessed on 8 April 2015).
- Carroll, M.; Townshend, J.R.; DiMiceli, C.M.; Noojipady, P.; Sohlberg, R.A. A new global raster water mask at 250 m resolution. Int. J. Digit. Earth. 2009, 4, 291–308. [Google Scholar] [CrossRef]
- Boergens, E.; Nielsen, K.; Andersen, O.; Dettmering, D.; Seitz, F. River Levels Derived with CryoSat-2 SAR Data Classification—A Case Study in the Mekong River Basin. Remote Sens. 2017, 9, 1238. [Google Scholar] [CrossRef] [Green Version]
- Nielsen, K.; Stenseng, L.; Andersen, O.B.; Villadsen, H.; Knudsen, P. Validation of CryoSat-2 SAR mode based lake levels. Remote Sens. Environ. 2015, 171, 162–170. [Google Scholar] [CrossRef] [Green Version]
- Jain, M.; Andersen, O.B.; Dall, J.; Stenseng, L. Sea surface height determination in the Arctic using Cryosat-2 SAR data from primary peak empirical retrackers. Adv. Space Res. 2015, 55, 40–50. [Google Scholar] [CrossRef]
- Villadsen, H.; Andersen, O.B.; Stenseng, L.; Nielsen, K.; Knudsen, P. CryoSat-2 altimetry for river level monitoring—Evaluation in the Ganges–Brahmaputra River basin. Remote Sens. Environ. 2015, 168, 80–89. [Google Scholar] [CrossRef]
- Wingham, D.J.; Repley, C.G.; Griffiths, H. New Techniques in Satellite Altimeter Tracking Systems. In Proceedings of the IGARSS 86 Symposium; ESA Publications Division: Noordwijk, The Netherlands, 1986; pp. 1339–1344. [Google Scholar]
- Li, H.; Zhao, J. Evaluation of the newly released worldwide AW3D30 DEM over typical landforms of China using two global DEMs and ICESat/GLAS data. IEEE J.-Stars. 2018, 11, 4430–4440. [Google Scholar] [CrossRef]
- Uebbing, B.; Kusche, J.; Forootan, E. Waveform Retracking for Improving Level Estimations From TOPEX/Poseidon, Jason-1, and Jason-2 Altimetry Observations Over African Lakes. IEEE Trans. Geosci. Remote. Sens. 2014, 53, 2211–2224. [Google Scholar] [CrossRef]
- Yang, S.L.; Xu, K.H.; Milliman, J.D.; Yang, H.F.; Wu, C.S. Decline of Yangtze River water and sediment discharge: Impact from natural and anthropogenic changes. Sci. Rep. 2015, 5, 12581. [Google Scholar] [CrossRef] [PubMed]
- Lai, X.; Liang, Q.; Jiang, J.; Huang, Q. Impoundment effects of the Three-Gorges- Dam on flow regimes in two China’s largest freshwater lakes. Water Resour. Manag. 2014, 5111–5124. [Google Scholar] [CrossRef]
- Wang, J.; Sheng, Y.; Wada, Y. Little impact of the Three Gorges Dam on recent decadal lake decline across China’s Yangtze Plain. Water Resour. Res. 2017, 3854–3877. [Google Scholar] [CrossRef] [Green Version]
- Dai, M.; Wang, J.; Zhang, M.; Chen, X. Impact of the Three Gorges Project operation on the water exchange between Dongting Lake and the Yangtze River. Int. J. Sediment Res. 2017, 32, 506–514. [Google Scholar] [CrossRef]

© 2020 by the authors. Licensee MDPI, Basel, Switzerland. This article is an open access article distributed under the terms and conditions of the Creative Commons Attribution (CC BY) license (http://creativecommons.org/licenses/by/4.0/).
Share and Cite
Li, P.; Li, H.; Chen, F.; Cai, X. Monitoring Long-Term Lake Level Variations in Middle and Lower Yangtze Basin over 2002–2017 through Integration of Multiple Satellite Altimetry Datasets. Remote Sens. 2020, 12, 1448. https://doi.org/10.3390/rs12091448
Li P, Li H, Chen F, Cai X. Monitoring Long-Term Lake Level Variations in Middle and Lower Yangtze Basin over 2002–2017 through Integration of Multiple Satellite Altimetry Datasets. Remote Sensing. 2020; 12(9):1448. https://doi.org/10.3390/rs12091448
Chicago/Turabian StyleLi, Peng, Hui Li, Fang Chen, and Xiaobin Cai. 2020. "Monitoring Long-Term Lake Level Variations in Middle and Lower Yangtze Basin over 2002–2017 through Integration of Multiple Satellite Altimetry Datasets" Remote Sensing 12, no. 9: 1448. https://doi.org/10.3390/rs12091448