Article

Seasonality Analysis of Sentinel-1 and ALOS-2/PALSAR-2 Backscattered Power over Salar de Aguas Calientes Sur, Chile

by
Analia Delsouc
1,*,
Matías Barber
2,
Audrey Gallaud
3,
Francisco Grings
2,
Paulina Vidal-Páez
1,4,
Waldo Pérez-Martínez
1,4 and
Idania Briceño-De-Urbaneja
1,4
1
Magíster en Teledetección, Escuela de Ingeniería Forestal, Facultad de Ciencias, Universidad Mayor, Santiago 8340589, Chile
2
Grupo de Teledetección Cuantitativa, Instituto de Astronomía y Física del Espacio (IAFE, CONICET-UBA), Buenos Aires 1428, Argentina
3
Subgerencia de Recursos Naturales, Centro de Información de Recursos Naturales (CIREN), Santiago 7501556, Chile
4
Hémera Centro de Observación de la Tierra, Escuela de Ingeniería Forestal, Facultad de Ciencias, Universidad Mayor, Santiago 8340589, Chile
*
Author to whom correspondence should be addressed.
Remote Sens. 2020, 12(6), 941; https://doi.org/10.3390/rs12060941
Submission received: 31 December 2019 / Revised: 18 February 2020 / Accepted: 22 February 2020 / Published: 14 March 2020
(This article belongs to the Section Remote Sensing in Geology, Geomorphology and Hydrology)

Abstract

:
Seasonal changes control the development of salt crust over the Salar de Aguas Calientes Sur located in Andes Highlands, Chile. Precipitations throughout the Altiplanic winter (December to March) and austral winter (June to September) caused ponds to enlarge and surface salt crusts to dissolve driving roughness and dielectric features of the salar surface change over time. A four-year time series backscattering coefficient analysis, obtained by Sentinel 1 and ALOS-2/PALSAR-2 with 10 m of spatial resolution, demonstrated the capability of microwaves to discriminate seasonal patterns illustrated in this paper. Both sensors showed to be sensitive to changes in the surface crust due to weather conditions. Backscattered power gradually increased during the driest months as the rough salt crusts develop and decreased rapidly due to precipitations or flooding events, which lead to a smoothing appearance to radar. The high temporal frequency of acquisition in Sentinel 1 (5–13 scenes/month) allowed the discrimination among climate and annual seasonality and episodic events in the C-band backscatter coefficient. On the other hand, ALOS-2/PALSAR-2 showed subsurface changes at L-band since the salinity of the brine in the soil reduces the penetration depth of backscattered power for shorter wavelengths. Results might be useful to monitor salars with geographic and weather conditions similar to Salar de Aguas Calientes Sur.

Graphical Abstract

1. Introduction

The term “salar” refers to sediments with a detritical and evaporitic origin and whose sedimentation takes place in the most depressing part of a closed basin, where arid or semi-arid conditions develop [1]. In the case of the Salar de Aguas Calientes Sur, located in the Antofagasta region, Chile, these detrital-evaporitic sediments indicate that the development environment is a playa lake type, and its salt crusts are classified into two types [2]. The first is a hard and perennial crust, permanently dry or infrequently flooded where the minerals precipitate in nodular, rough, or granular form by evaporation of brines or by the migration of water by capillarity and subsequent evaporation. The second crust is perennial or ephemeral and is considered soft because of its moisture, either due to the presence of a surface or underground water. Surface water might appear in the form of rivers or ponds.
Salar de Aguas Calientes Sur has a special climatic and geographical feature. Located 4000 m.a.s.l. at the Andes Highlands, it has an active tectonic influence together with extreme weather conditions given by high annual evaporations rates, snowfalls, and rainfall during austral winter (June to September) and Altiplanic winter in summer (December to March). Strong solar radiation and wind speeds that reach up to 70 km/h controls the evaporites minerals formation. Unlike rocks, evaporitic minerals in the salar are sensitive to changes by wind, ponds sedimentation and evaporation followed by chemical precipitation. Besides, evaporites are also sensitive to climatic changes because the salts are dissolved either by precipitation or the rise of groundwater. In the absence of these, the evaporation processes trigger changes in the salar surface, affecting its roughness and dielectric properties due to the crystallization of evaporite minerals [3]. A recent study with multispectral sensors on the Salar de Aguas Calientes Sur reports partially seasonal changes in its ponds. However, the cause of this phenomenon remains unknown [4]. The overall information points out evident dynamics within this detritical and evaporitic sedimentary environment, where the salt crusts have a seasonal component not yet determined.
Applying Synthetic Aperture Radar (SAR) data in the study of salars allows capturing information at different depths due to its ability to penetrate dry soil layers according to the wavelength of operation. Likewise, the backscattering coefficient (σ0) is a function of the roughness of the surface (relative to the wavelength) and the dielectric constant, the latter influenced by soil moisture content and its salinity [5]. Furthermore, as long as the sensitivity of the SAR backscattered power to the physicochemical changes appears in salars, previous investigations demonstrate that the dielectric constant of saline soils plays a key role in the radar backscatter. In C-band, the approach is monitoring changes over evaporitic surfaces with ERS-1 SAR images on the Chott el Djerid (dry Salt Lake), Tunisia, at 20 m.a.s.l [6]. The authors present that backscattering power increases during dry seasons with precipitation of halite crystals. In the same sector, the researchers [7] model the response of the SAR backscattered signal based on the development of saline crust and detect that the control in the backscattered signal is due to the development of saline crust where the moisture given by brines exerts secondary control depending on the evaporation rate [8].
On the other hand, and in parallel, several experimental studies show the relation between the complex dielectric constant and salt content in the soil [9,10]. Using the RADARSAT-2 satellite over the Chott El Djerid [3] to monitor a spatiotemporal evaporitic process combining scatterometers and SAR for the monitoring of sedimentation processes. A complete wet-to-dry cycle and observed the temporal evolution of the copolarized phase difference is presented in [11]. Responses in the C-band and L-band radar signal (AIRSAR, PALSAR) are used simultaneously to study the salinity effects of evaporitic geological materials from Death Valley, USA (−86 m.a.s.l) on complex permittivity in magnitude of the backscatter coefficient [12] and subsequently, using SIR-C / X-SAR [13], proposes a backscattering coefficient of copolarization and phase difference for soil indicator affected by salinity and humidity.
Research by L-band in the Nop Nur Lake basin (780 m.a.s.l), in China [14] uses RADARSAT-2 and ALOS-PALSAR images to interpret the surface and coastline of the lacustrine tank using single band and polarimetry. Furthermore, the detection of subsurface deposits are analyzed to understand the evolution of the lake, establishing an empirical relation between the results of polarimetric decomposition and surface salinity [15]. Subsequently, comparing terrain information with polarimetry results for two ALOS PALSAR images [16], they managed to determine two layers, each with different dispersion, roughness, humidity, and salinity. Then [17] demonstrated the penetration capacity of the L band of the ALOS PALSAR sensor in saline soil, by detecting the presence of a subsurface brine layer using polarimetric decomposition. Finally, types of salt crusts are differentiated using the surface roughness parameters [18], extracted thanks to the polarimetry in ALOS PALSAR images. Notwithstanding, the research using L-band SAR in the study of salars is mainly focused on backscattering mechanisms rather than spatiotemporal monitoring.
Although previous investigations are exhaustive, it remains unexplored how the backscattered signal in C- and L-bands behaves over the salars placed in the Andes Highlands where geographical and climatic conditions are distinctive.
The main goal of this paper is to determine the seasonality in the response of the SAR backscattered power over the salar, through a four-year multitemporal analysis (2014–2018) with Sentinel 1 (C-band) and ALOS-2/PALSAR-2 (L-band) in order to qualitatively estimate the salar dynamics related to either climatic, annual or eventual weather influences.
Here we reveal that the salt pans do not appear to be stable over the time analyzed. Likewise, the backscattering coefficient seasonality also showed that surface properties could qualitatively determine the surface roughness under certain climate conditions. Based on the hypotheses of the salar surface evolution and the drying-up cycles, the dynamic processes of the Salar de Aguas Calientes Sur is being discussed.

2. Materials and Methods

2.1. Study Area

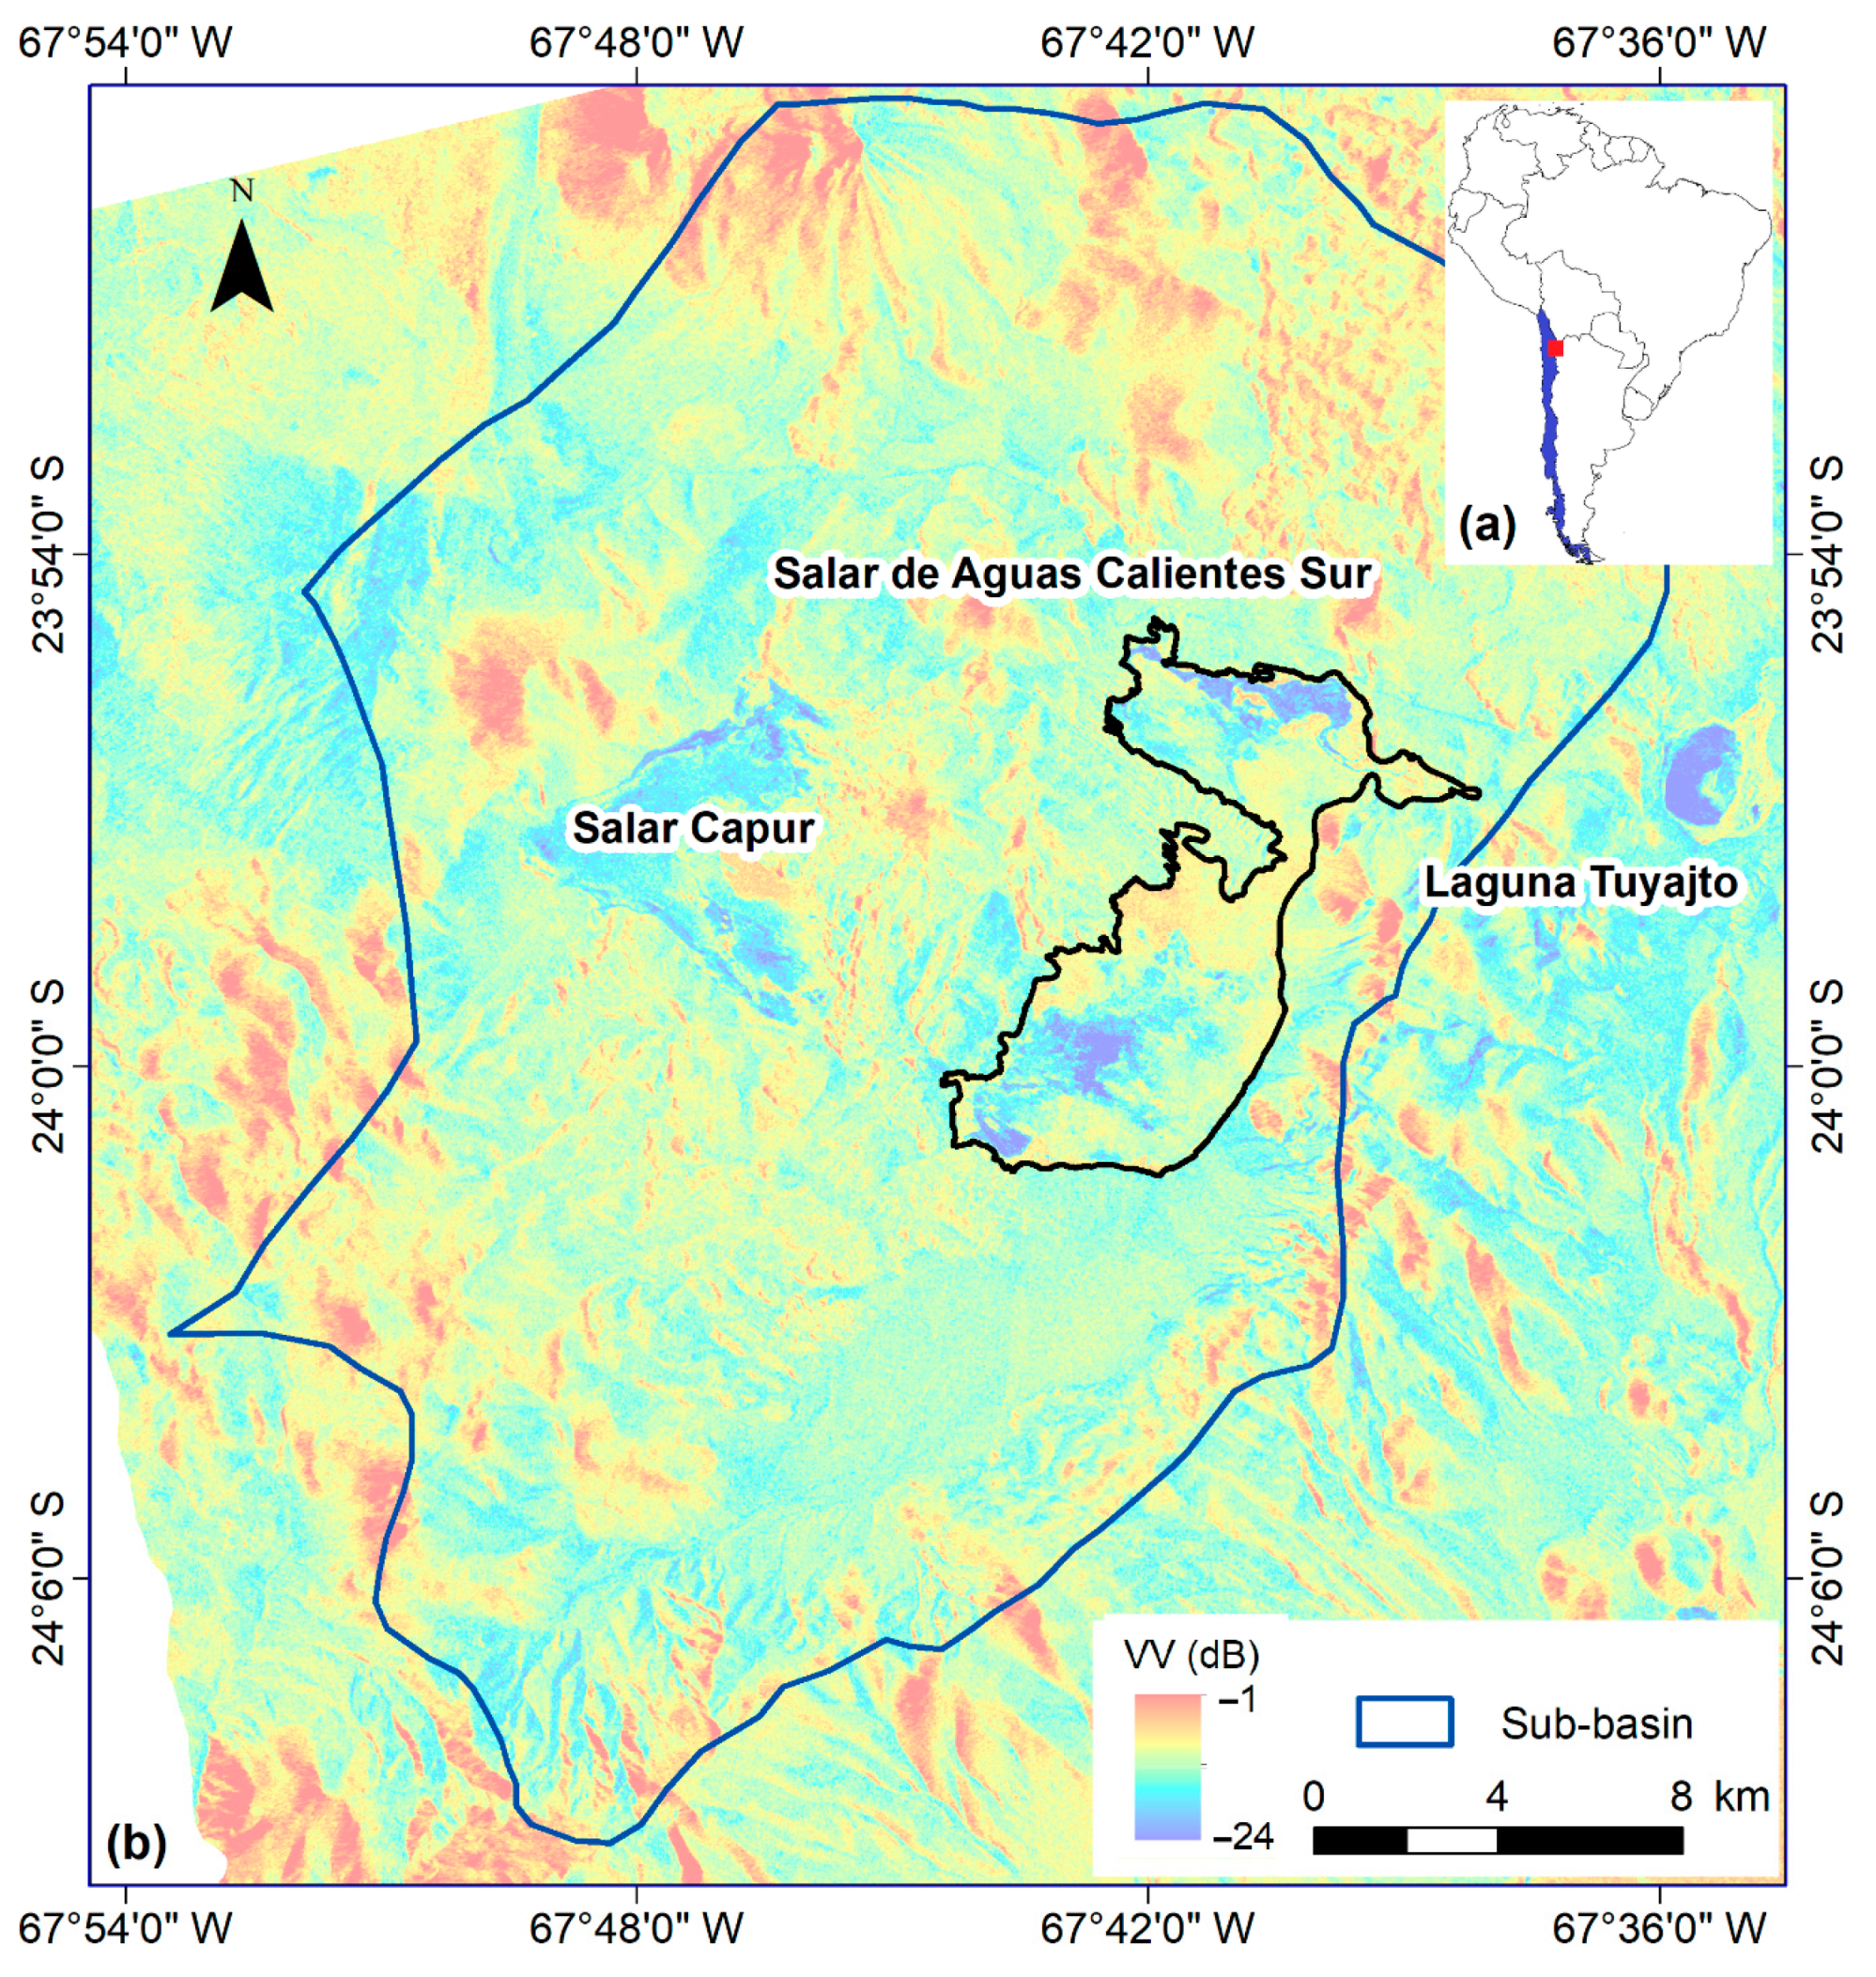
The study area is in the Andean high plateau, Antofagasta Region, Chile, at approximately 4000 m.a.s.l. southeast of the Salar de Atacama. Access to the area is from San Pedro de Atacama village taking the CH-23 route towards the International Sico Pass 148 km away. The Salar de Aguas Calientes Sur has an approximate area of 476 km2, and it is located within the Salar de Talar and the Purisunchi Sub-basin, between Salar de Capur to the west and Laguna Tuyajto to the east (Figure 1). The type of basin is endorheic and intra-volcanic.
To the north and center of the salar are some ignimbritic deposits (Patao Ignimbrite) considered as host rock of the salar from the Pliocene age [19]. In general, the pan crust surface in the center of the salar has no vegetation, whereas the northern, southern, and salar margins are sparsely covered with patchy bushes and spring-feed vegetation related to shallow lakes. The most abundant evaporitic minerals found in the salt flat are gypsum and halite.

2.2. Methodological Flowchart
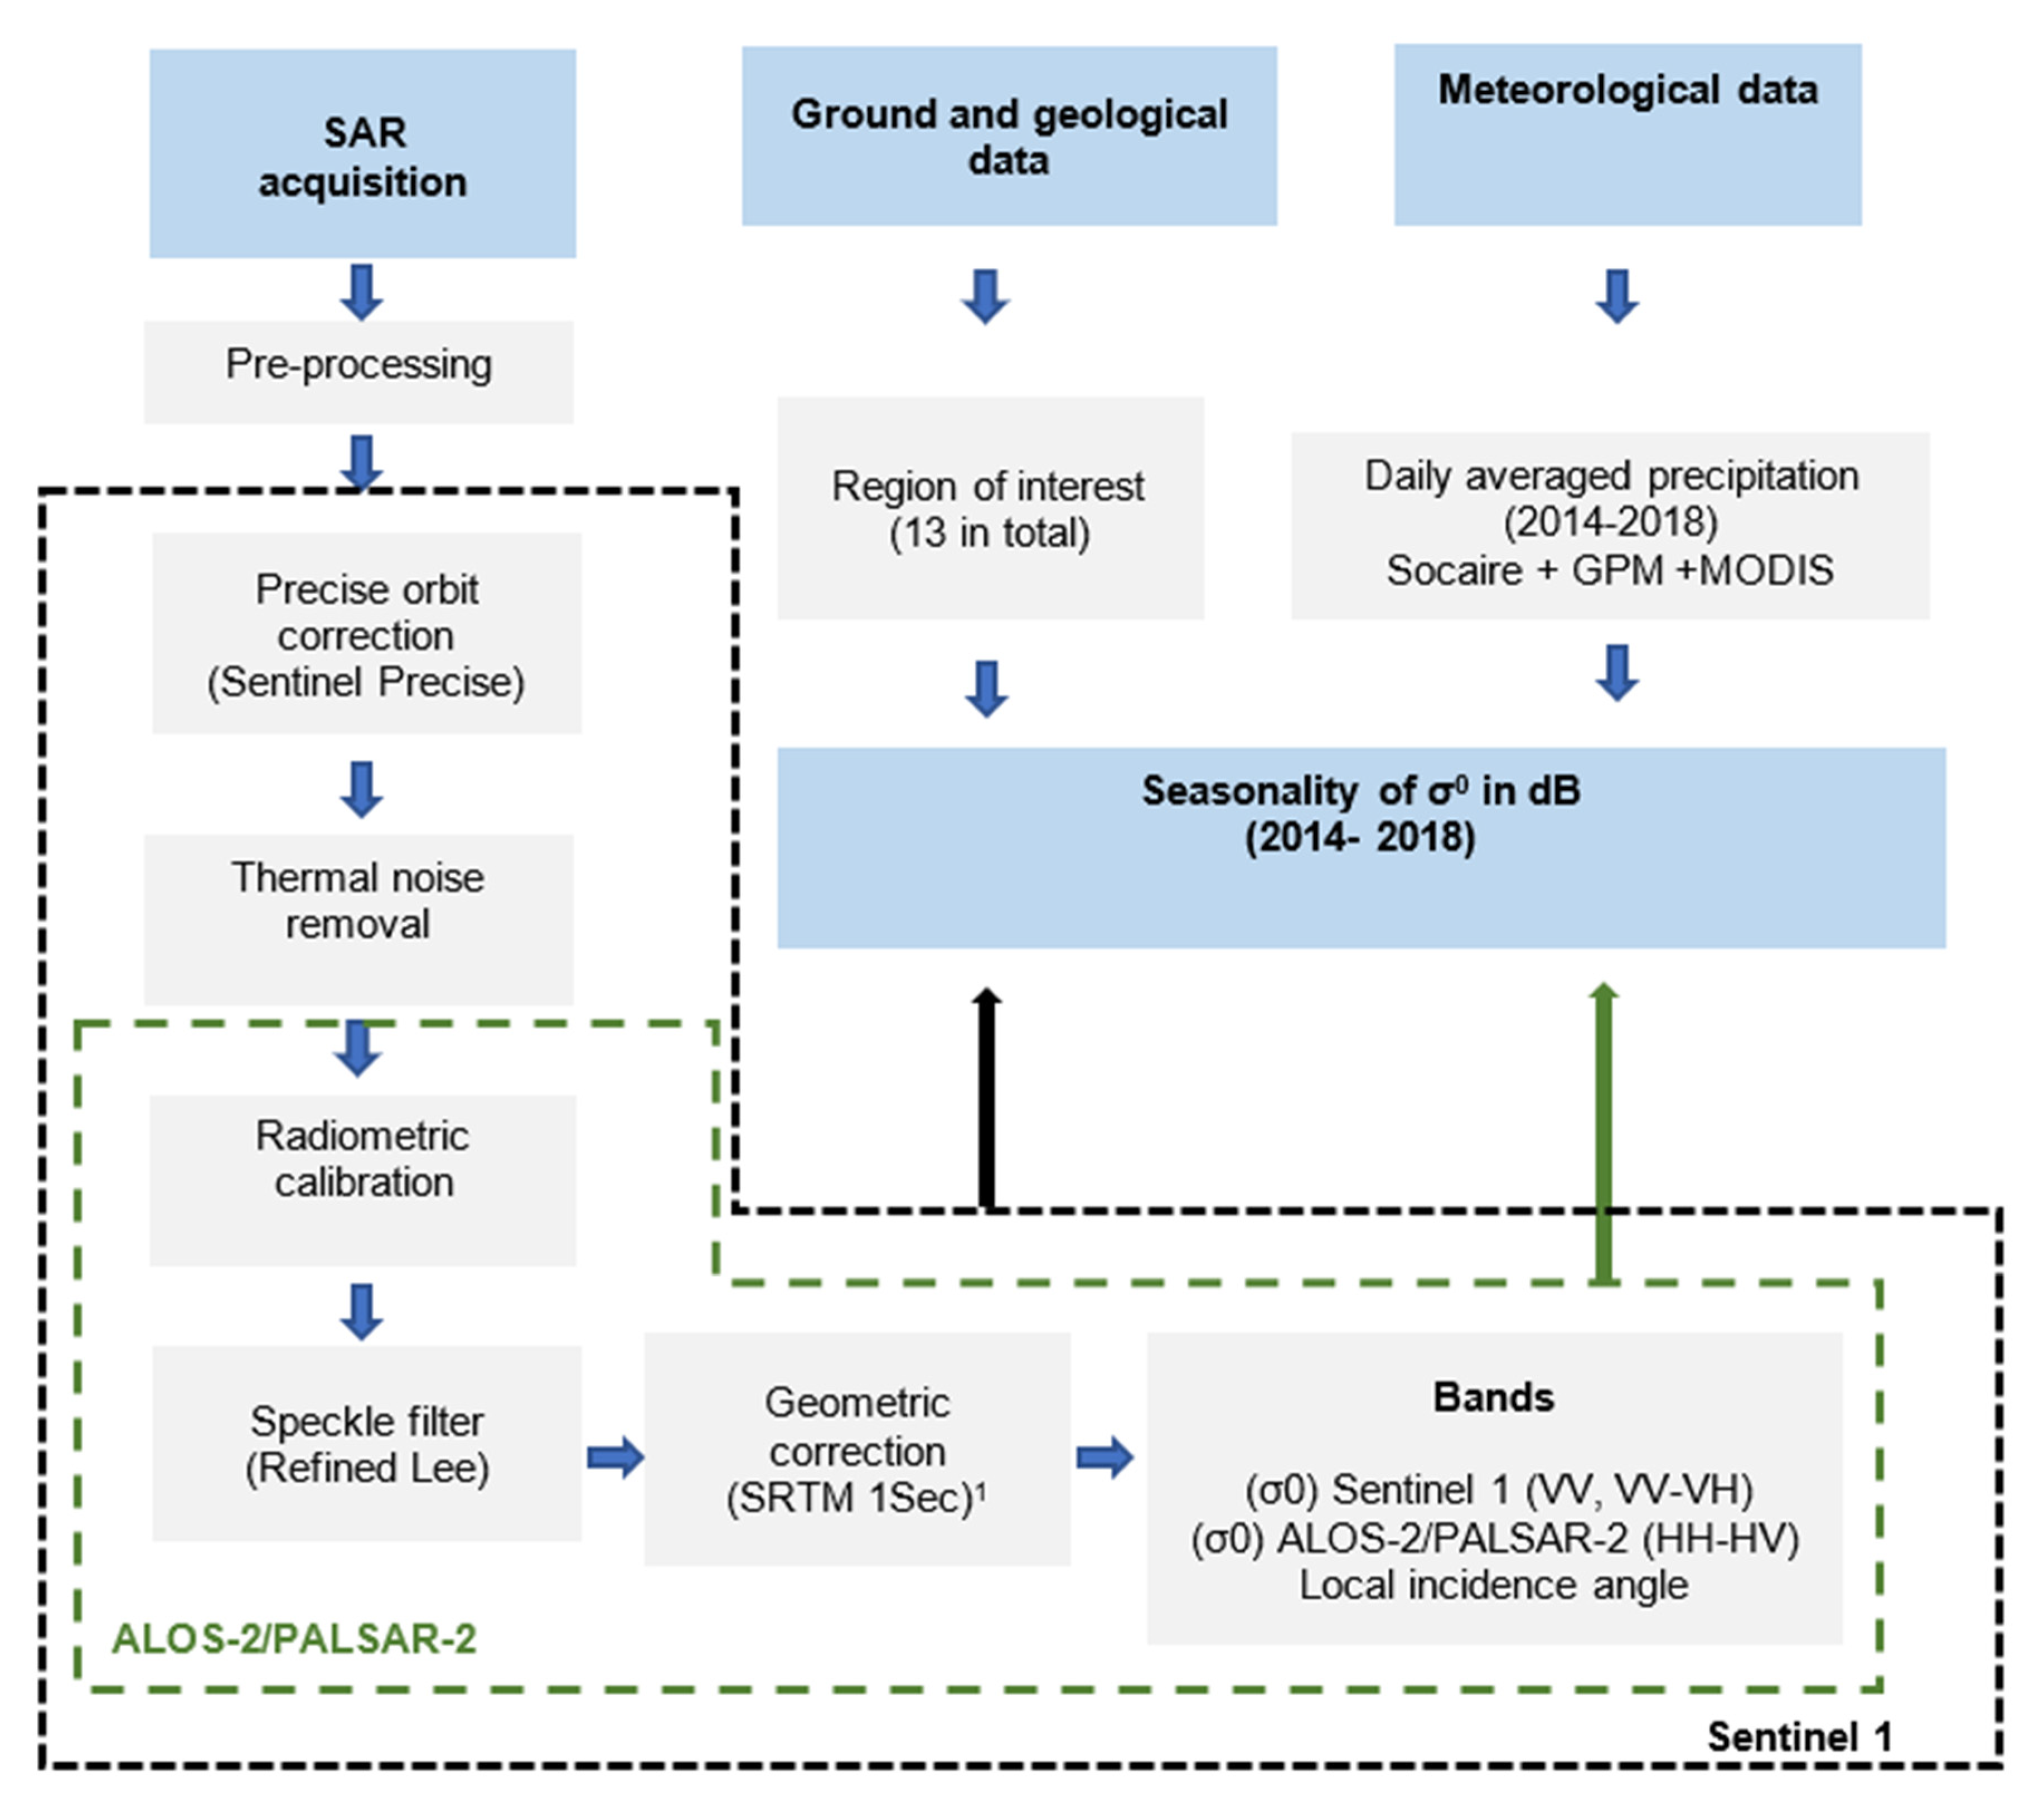
As seen in Figure 2 the methodological flowchart included the collection and analysis of meteorological information, download and pre-processing of the Sentinel 1 and ALOS-2/PALSAR-2 images, analysis of the geology and selection of regions of interest. The overall process is detailed below.
Sentinel 1A and B (C-band, 5.55 cm) and ALOS-2/PALSAR-2 (L-band, 23.4 cm) sensors provided the SAR imagery for this study. The former acquired in Interferometric Wide Swath (IW) mode, level 1 processing, and Ground Range Detected (GRD) with a spatial resolution of 20 × 22 m (range by azimuth) and a swath width of 250 km. The latter in StripMap (SM) Fine (10 m) mode through a project with the Japan Aerospace Exploration Agency (JAXA). The spatial resolution is 10 m with a 70 km-swath. The four-year Sentinel 1 dataset encompasses a total of 319 images from October 2014 to December 2018, mostly available in VV-VH polarization in ascending and descending orbits. The four-year Sentinel 1 dataset encompasses a total of 319 images from October 2014 to December 2018, mostly available in co-polarized vertical-vertical (VV) and cross-polarized vertical-horizontal (VH) polarizations in ascending and descending orbits. In the same four-year period, the ALOS-2/PALSAR-2 dataset has 16 images in horizontal-horizontal (HH) and horizontal-vertical (HV) polarizations in ascending orbit. In the same four-year period, the ALOS-2/PALSAR-2 dataset has 16 images in HH-HV polarizations in ascending orbit. The temporal coverage of these images is shown in Table 1.
Overall, the Sentinel 1A data have some gaps during January, March, and June 2017 over the salar. Among 2014 and 2017, data availability was between 3 to 4 scenes/month, further increased to 5–13 scenes/month after the release of Sentinel 1B with data available from September 2016.
The SAR Sentinel 1 and ALOS-2/PALSAR-2 datasets were pre-processed in the Sentinel Application Platform (SNAP). For Sentinel 1A-B, the chain process started with orbit correction, thermal noise removal, and radiometric calibration. Subsequently, a Refined Lee filter pixel window of 7 × 7 was used to improve the radiometric quality of the images. Finally, the geometric terrain correction was applied by assigning the digital elevation model SRTM 1Sec HTG and bilinear interpolation, resulting in an image with a nominal pixel size of 10 m × 10 m. As a final product, output bands of backscattering coefficients (σ0) for Sentinel 1 (VV, VV-VH), for ALOS-2/PALSAR-2 (HH-HV), and the Local Incidence Angle bands were generated.

2.3. Ground and Geological Data

Field observations, morphological analysis, and geological data over the Salar de Aguas Calientes Sur were conducted on 3 April 2018. Salt crust and brine samples were collected jointly with Centro de Información de Recursos Naturales and Servicio Nacional de Geología y Minería [4] for geochemistry characterization. The geochemistry of water and salt crusts was not extensively measured but is generally known from other contemporary measurements [
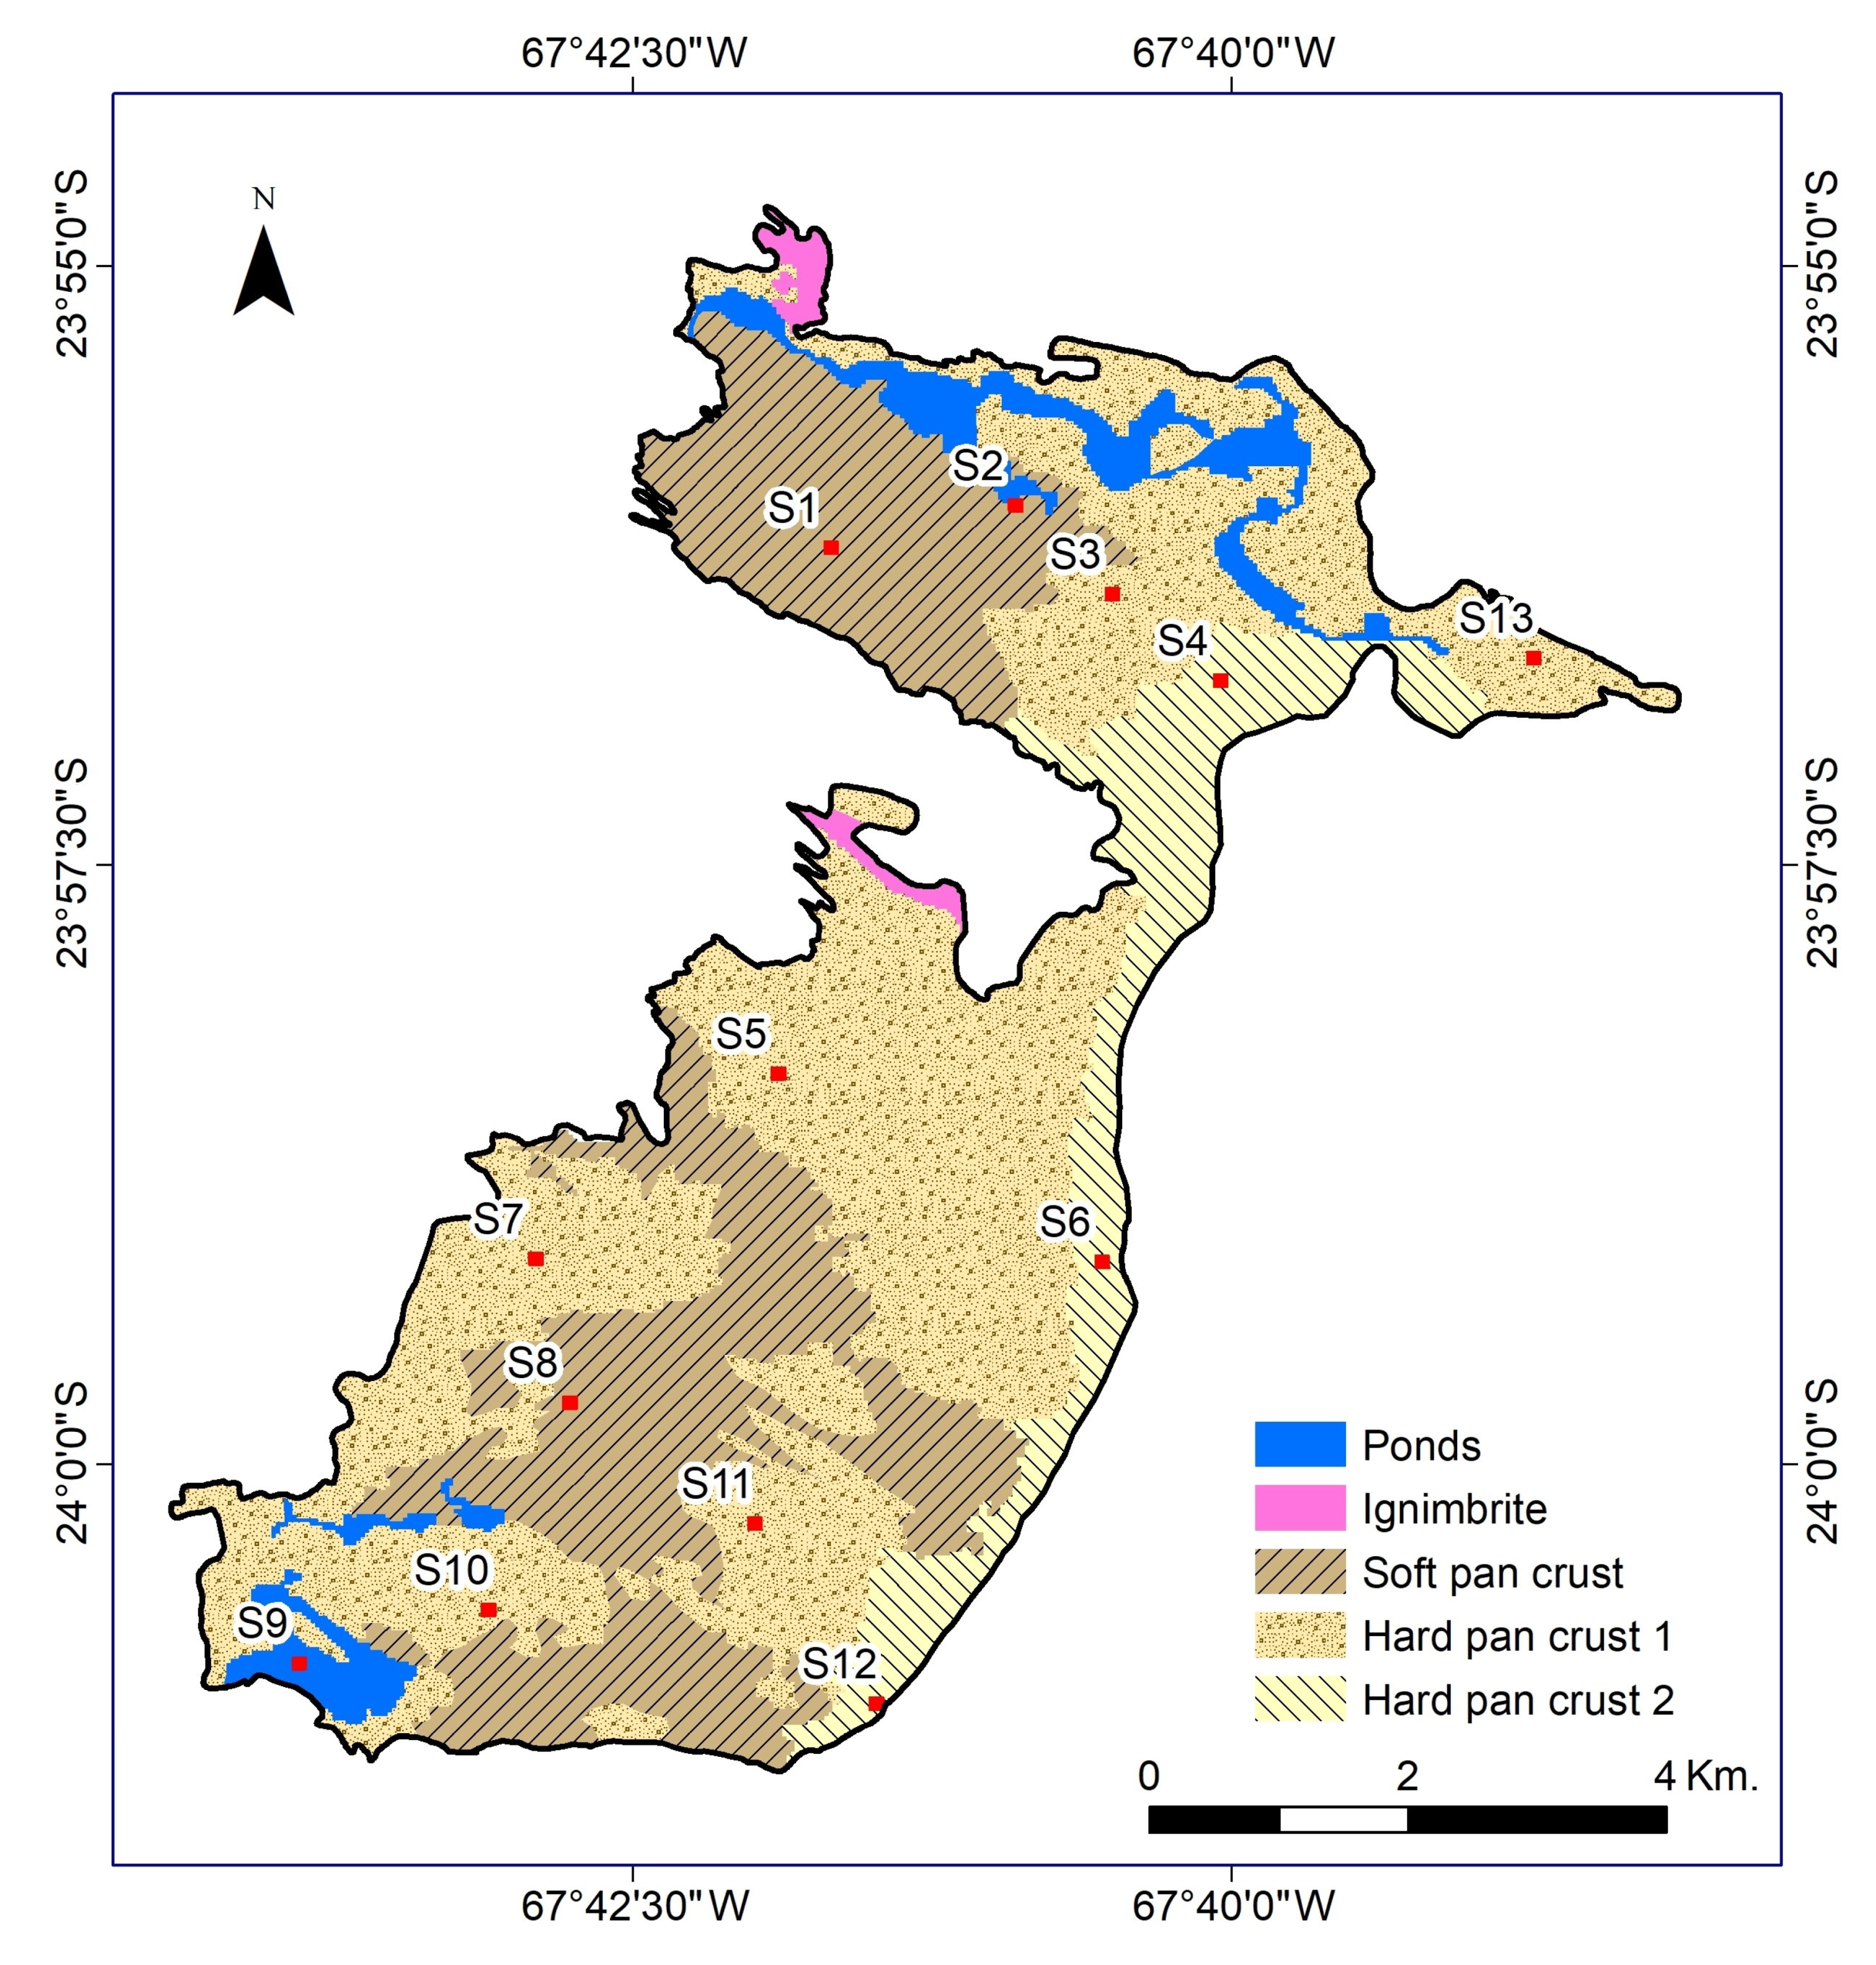
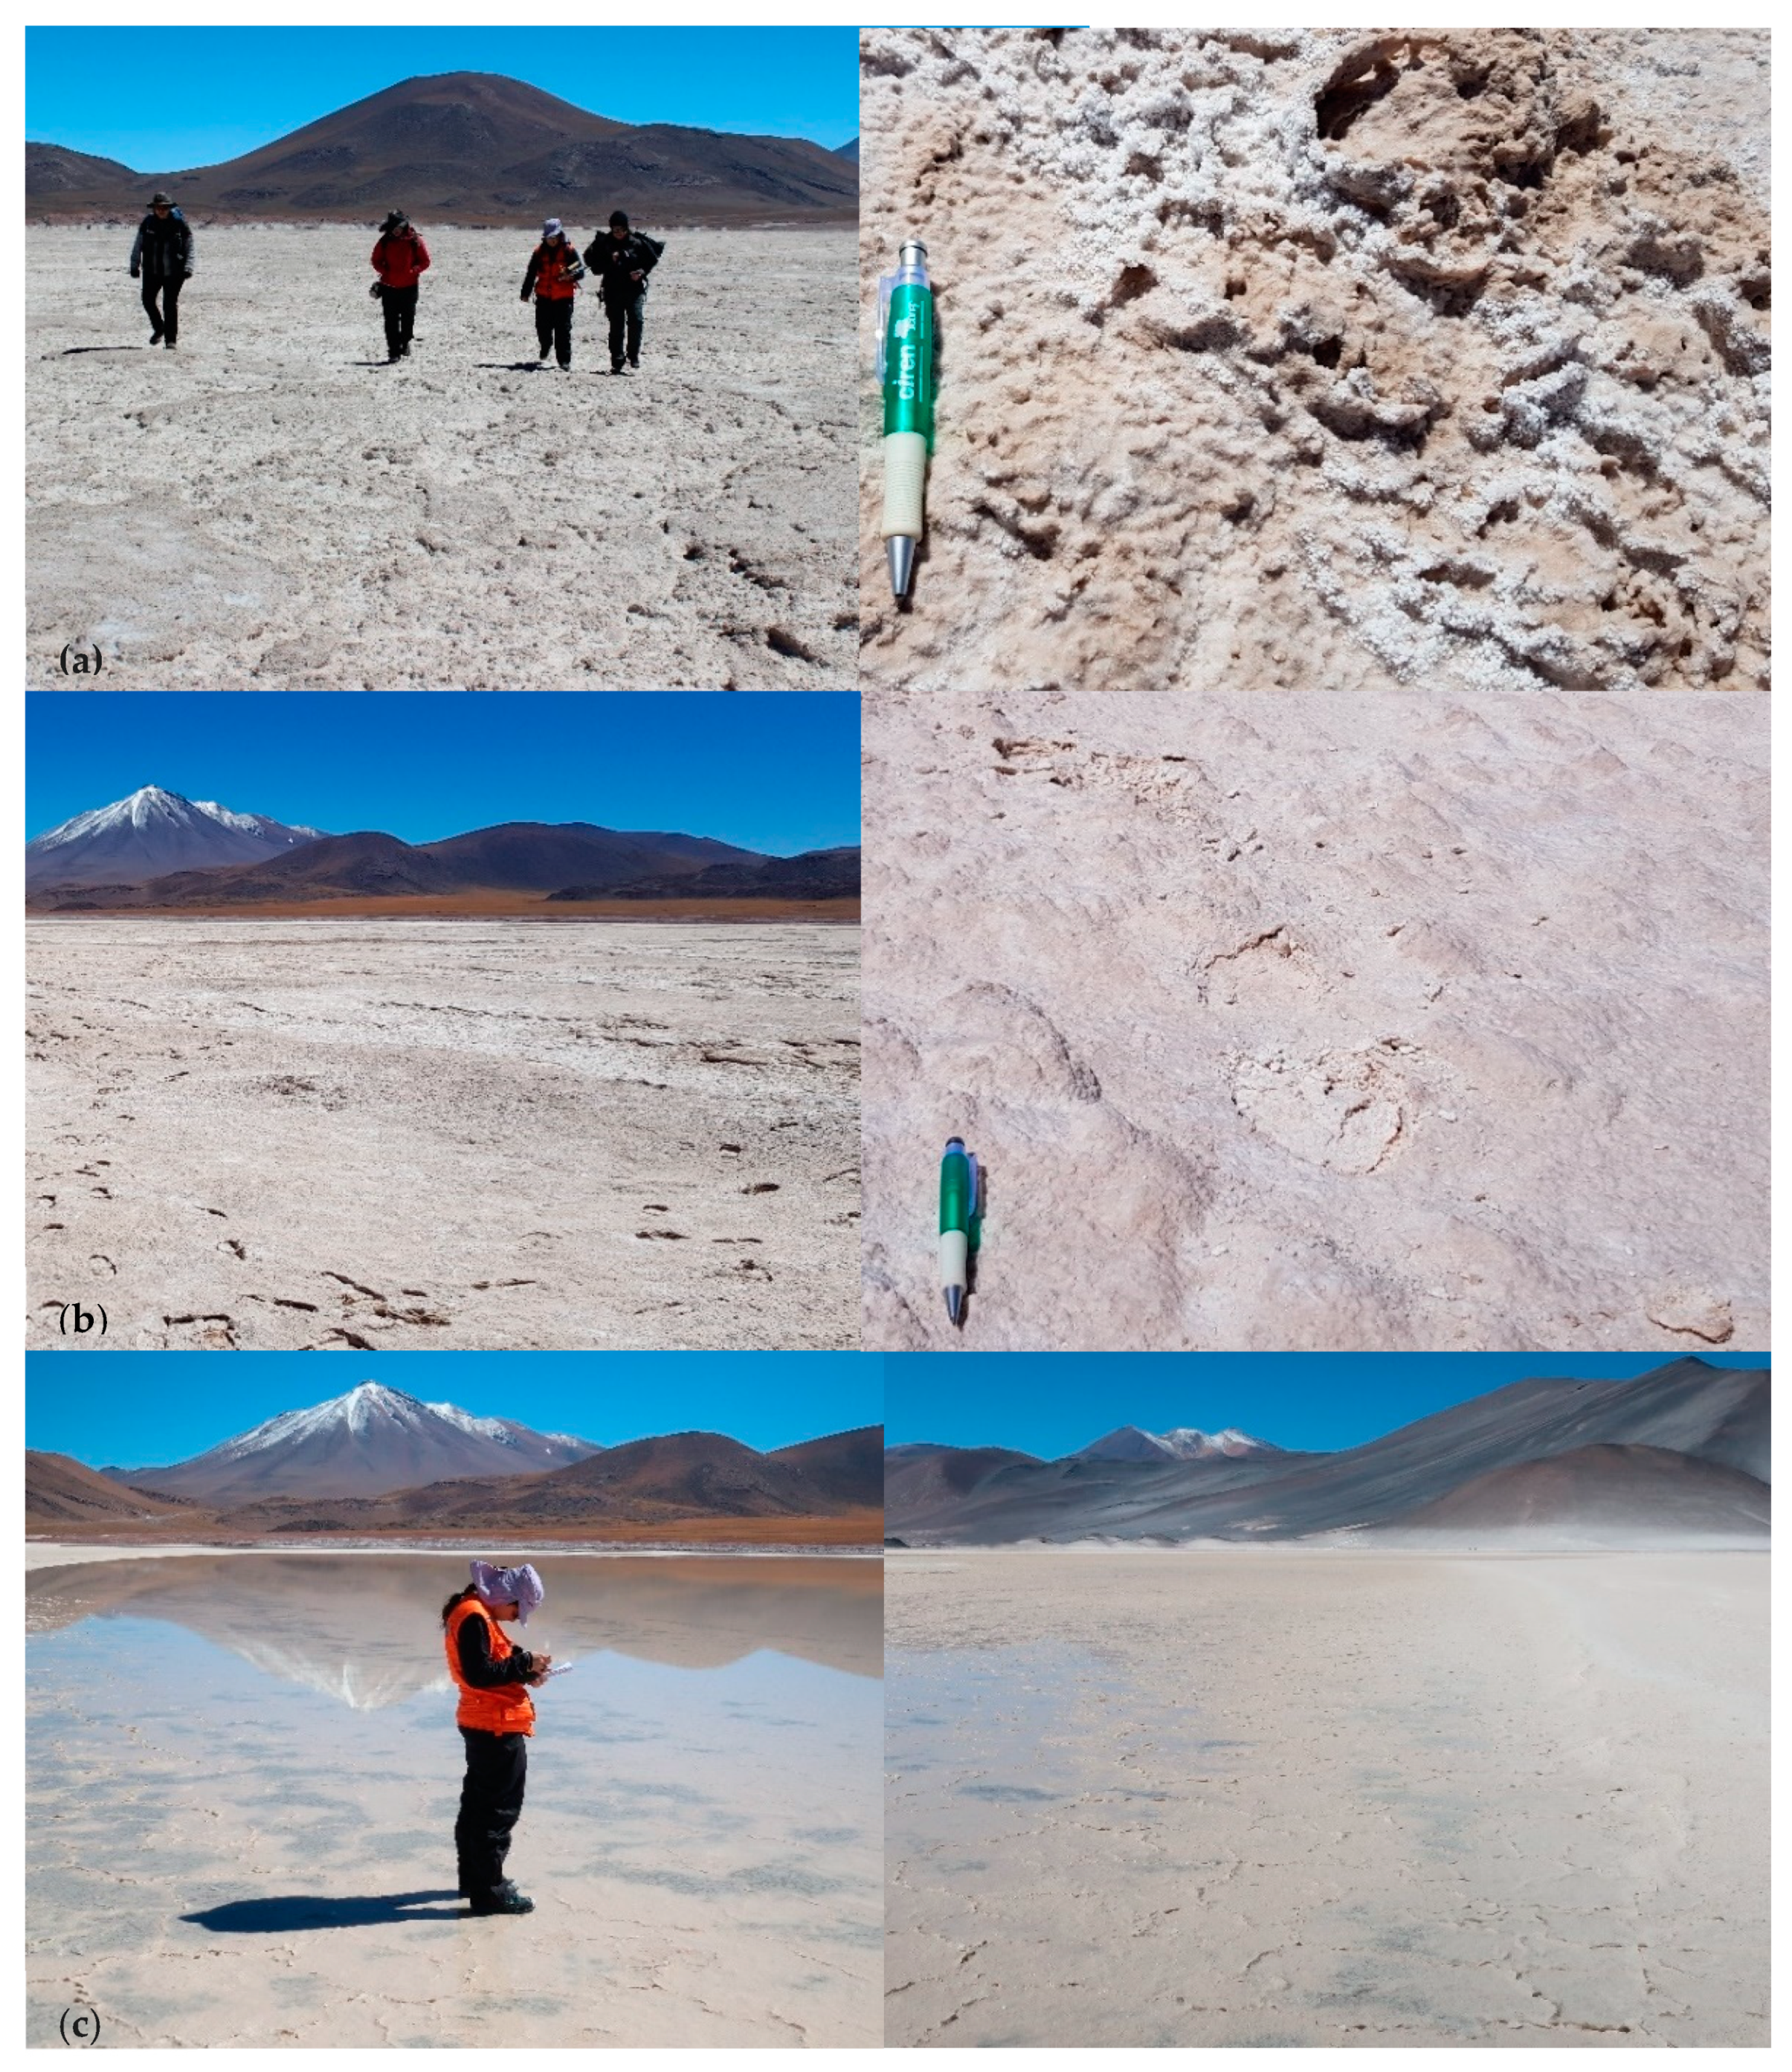
20]. Morphological and mineralogical features were extensive over the surface of the salar. Field observations showed highly heterogeneous pan crust environments that could be grouped into three different crust types (Figure 3 and Figure 4).
The first is a hard crust, Hard-pan crust 1, Figure 4a formed primarily by gypsum, halite and detrital particles. It is characterized by an irregular concave shape, uplifted rims, and salt enrichments crystalized as granular forms and thin sheets covering the gypsum pan over the borders indicating that most of the time remains not flooded [21]. These salts with granular form, indicate that they were formed from evaporation and rise of brines by capillarity [8]. Blowouts wind erosion on this crust is reflected by the development of wind deposits on the margins of the salars, also, deflation surfaces are characterized by low roughness and undulations similar to sabkhas formation. In an advanced stage of corrosion, by windblown surface in the presence of water, the remnants of the former crust being characterized by rounded cuspate forms described as pseudobarchans [2].
The second crust type is referred to as Hard-pan crust 2, and it is distributed along the east edge of the salt flat, formed by gypsum and halite containing cavities that indicate dissolution of salts due to infiltration and percolation of water causing loss of stiffness. The surface is somewhat soft, as can be noted from the footprint tracks leftover as seen in Figure 4b.
In the west, a salt crust with soft consistency is distributed Figure 4c. Almost flat with mud-crack polygons that contain a mixture of humid salts, primary halite, and less gypsum. The polygons indicate water loss after flooding events [22]. Field observations indicated that because of the soft and flat crust remained flooded, its elevation is lesser than the other salt pan crusts.
Towards the north and south of the salt flat, perennial ponds have been observed. The permanent inflow prevents the dry out entirely by evaporation. On the other hand, the water dissolves solutes, old evaporites, and clastic sediments. Salar pools appear to concentrate following structural patterns within the salar with northeast and north-south orientation and have been carved out as blowouts by wind erosion, and later filled with water as either shallow saline, thermal-spring or groundwater seeped upward from below. The deposition of halite and gypsum crystals through evaporation on the surface of the salt flat, together with the movement of surface water and the effect of sandstorm activity, plays an essential role in the temporal variability of the backscattered power on the surface of the salar.
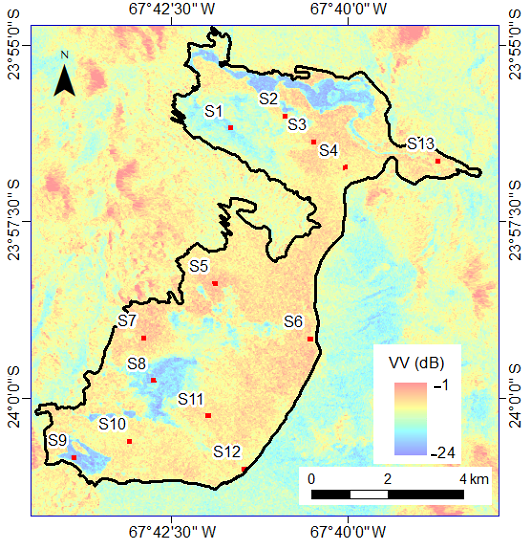
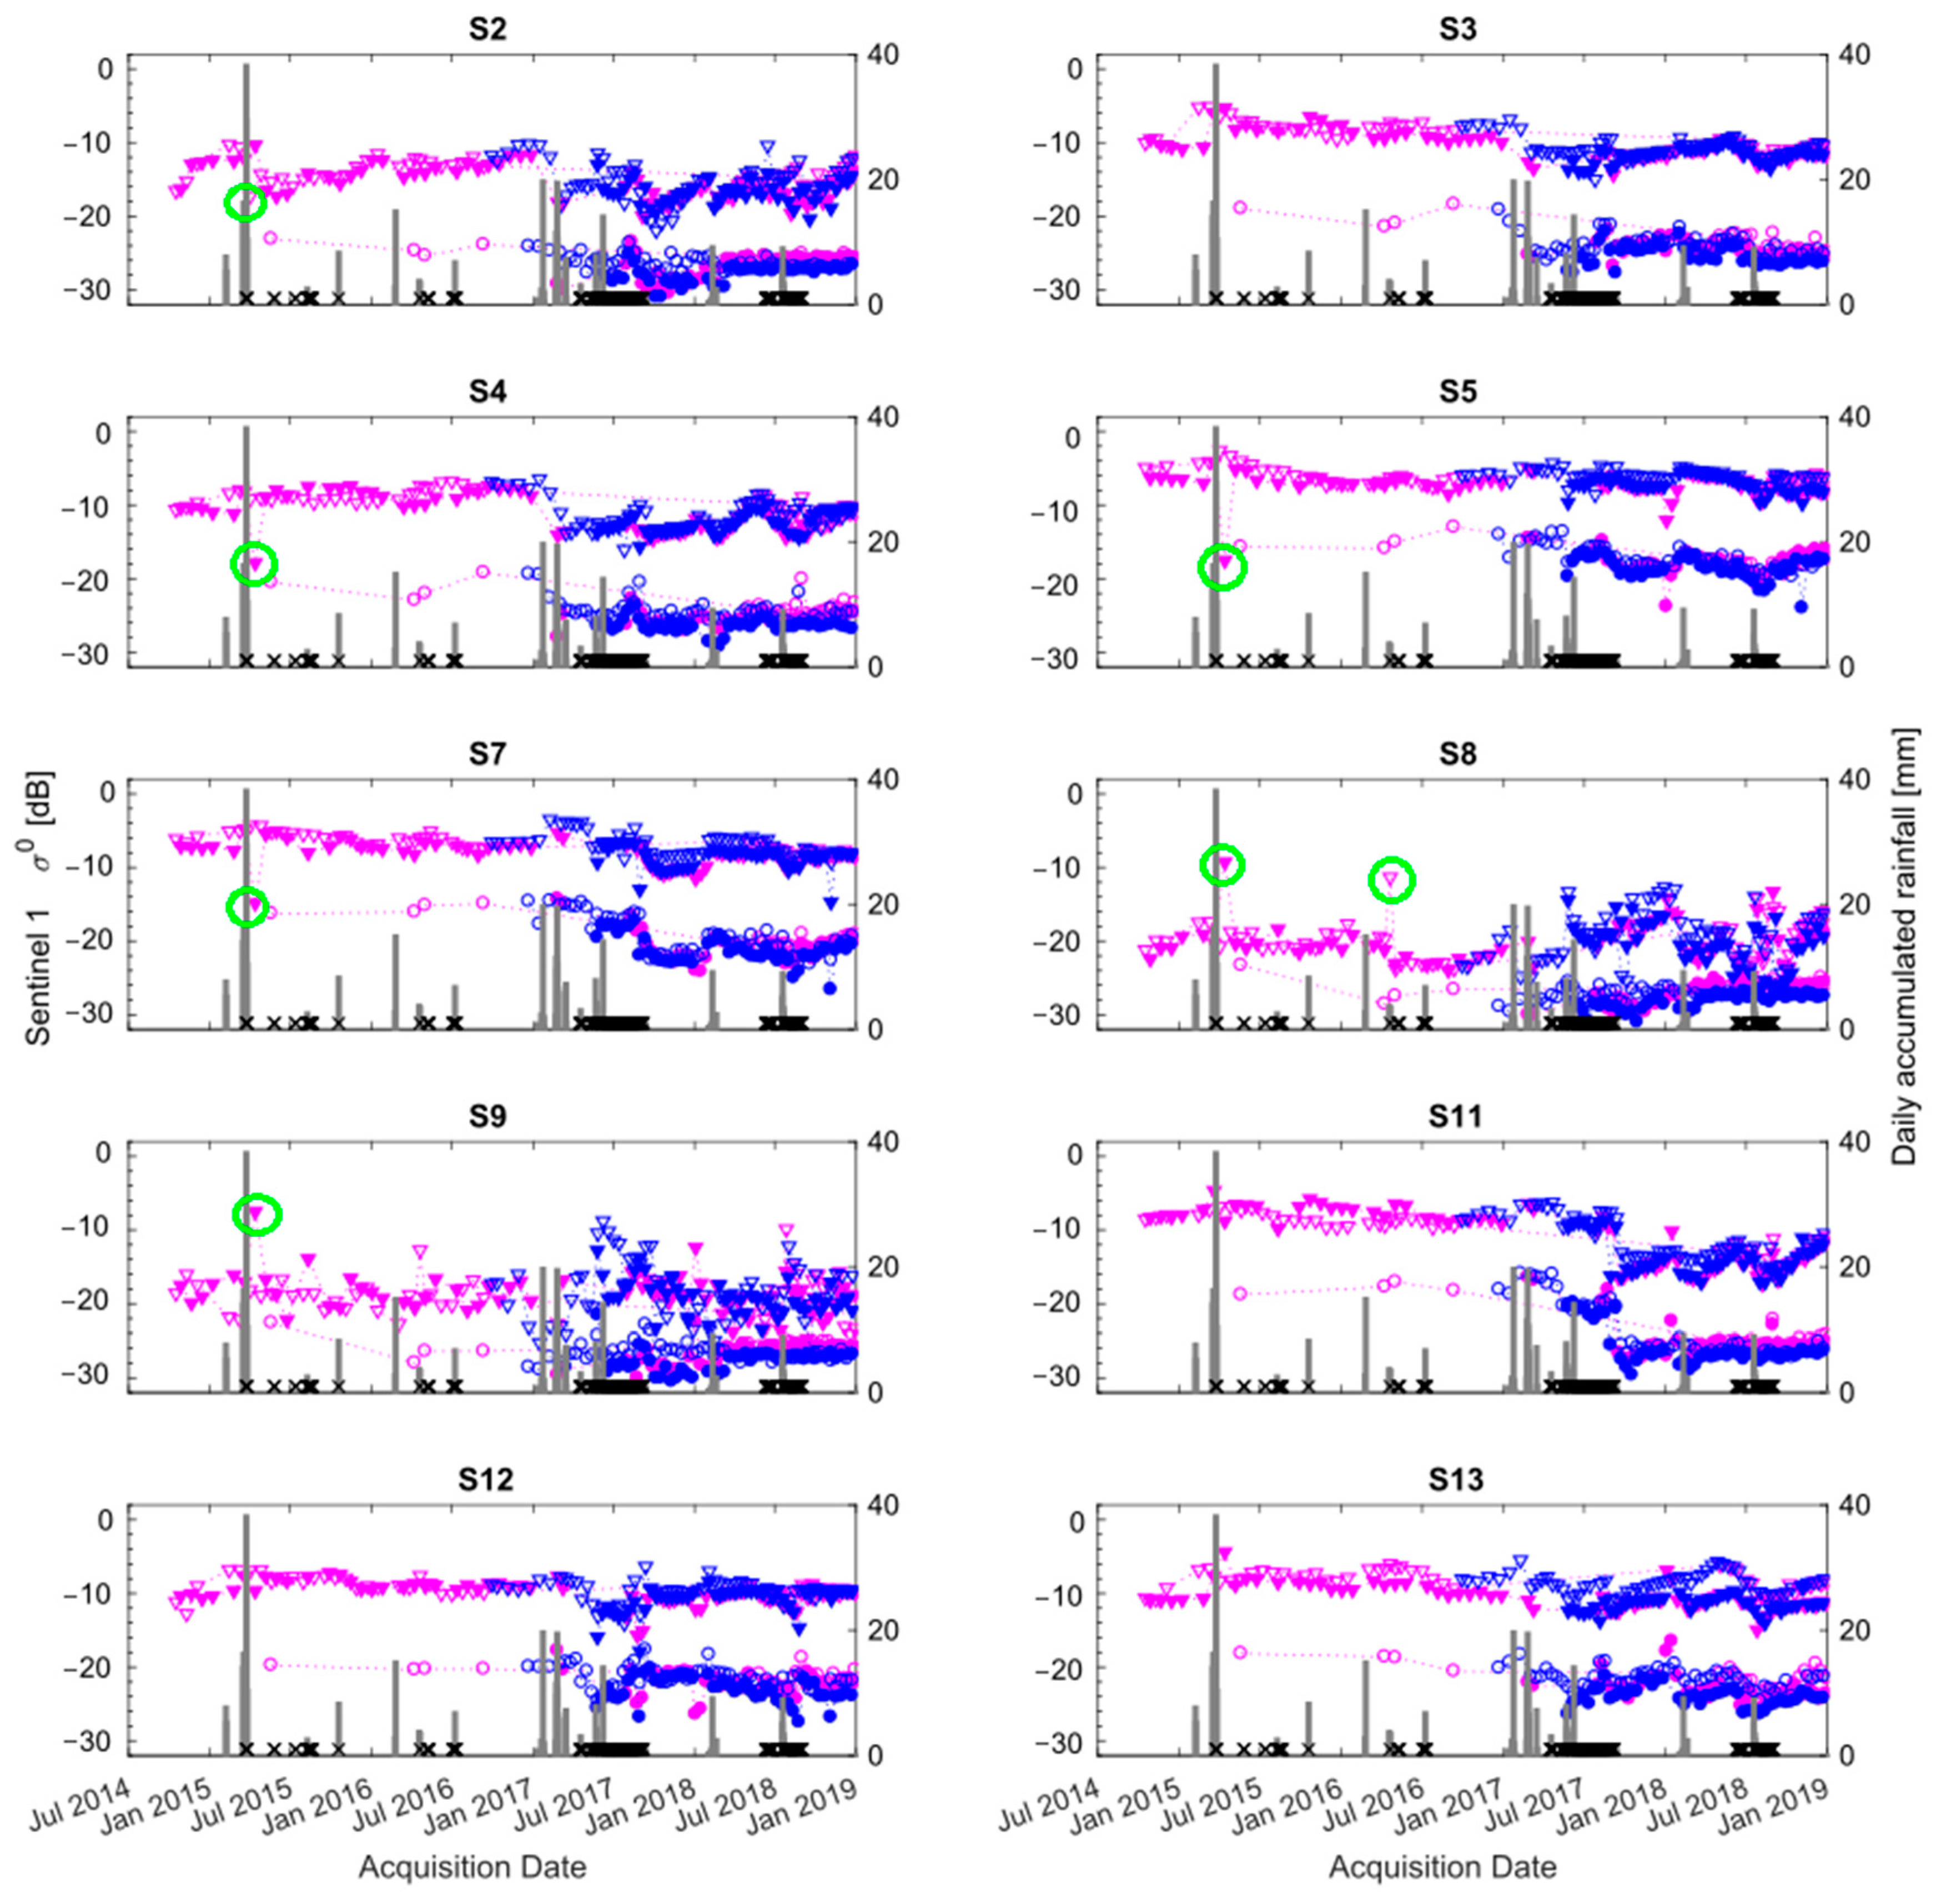
For the selection of the regions of interest (ROIs) and backscattering coefficients (σ0) retrieval, thirteen regions of interest were chosen (Table 2), being distributed over three types of salt crusts considered representative over the surface of the salar (Figure 3). Since each crust type was also distributed along with clusters over the salar area, the selection of the 13 sites also aimed at covering them. Each ROI has a 10x10 pixels size box. The rationale behind the ROI size selection was to include enough pixels so that its equivalent number of looks (mean²/std²) would be about 50, thus resulting in an uncertainty in backscattering coefficients (σ
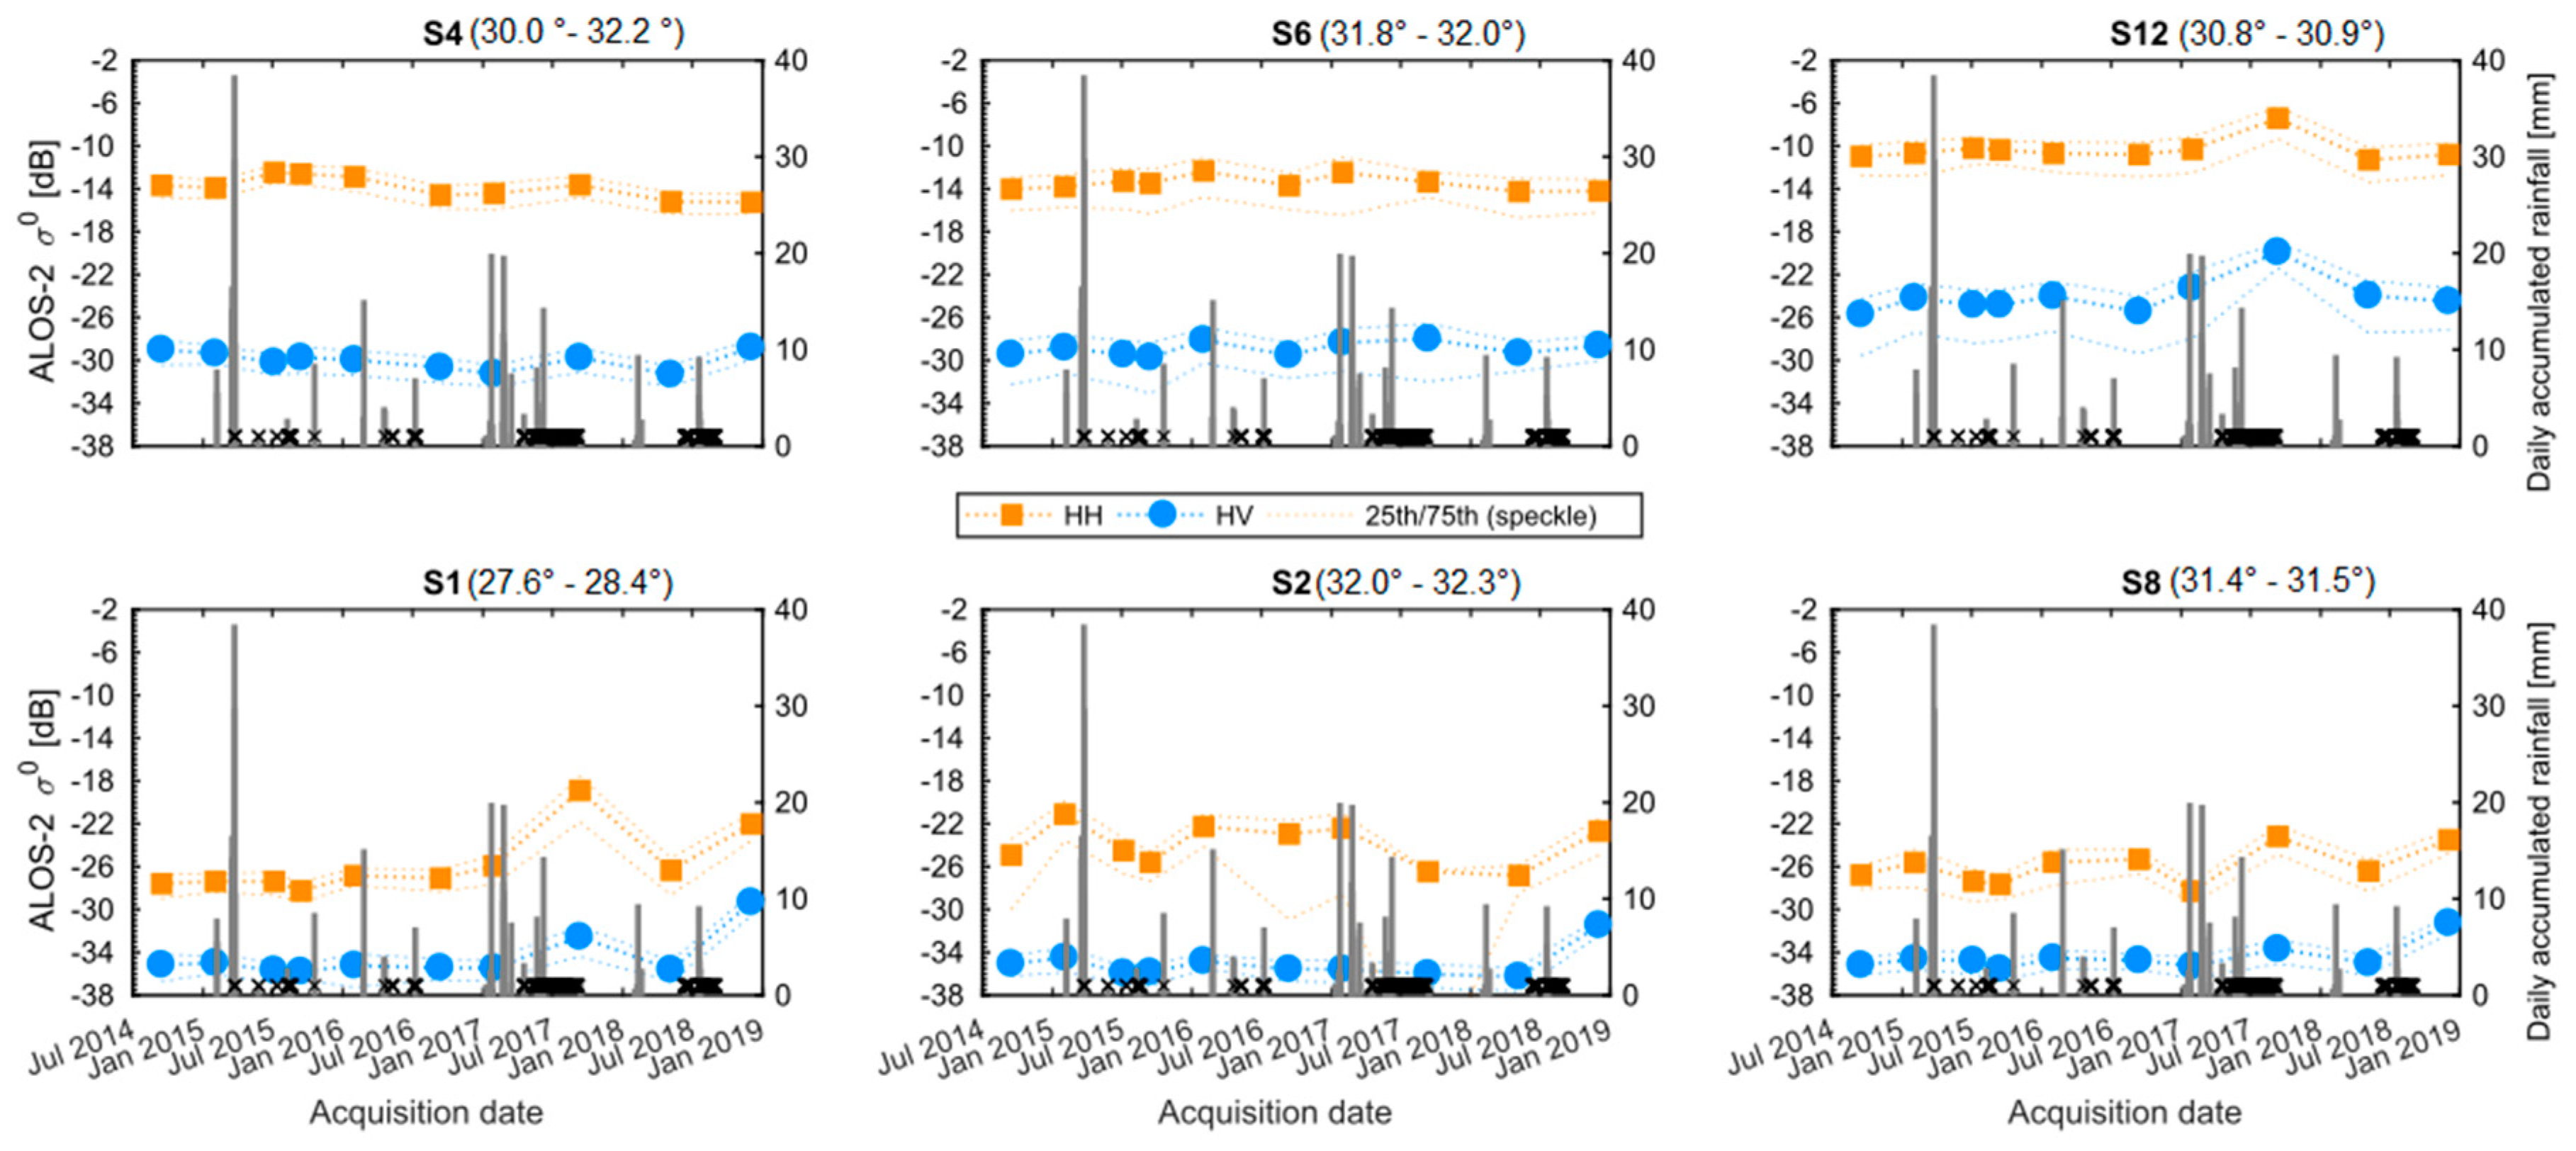
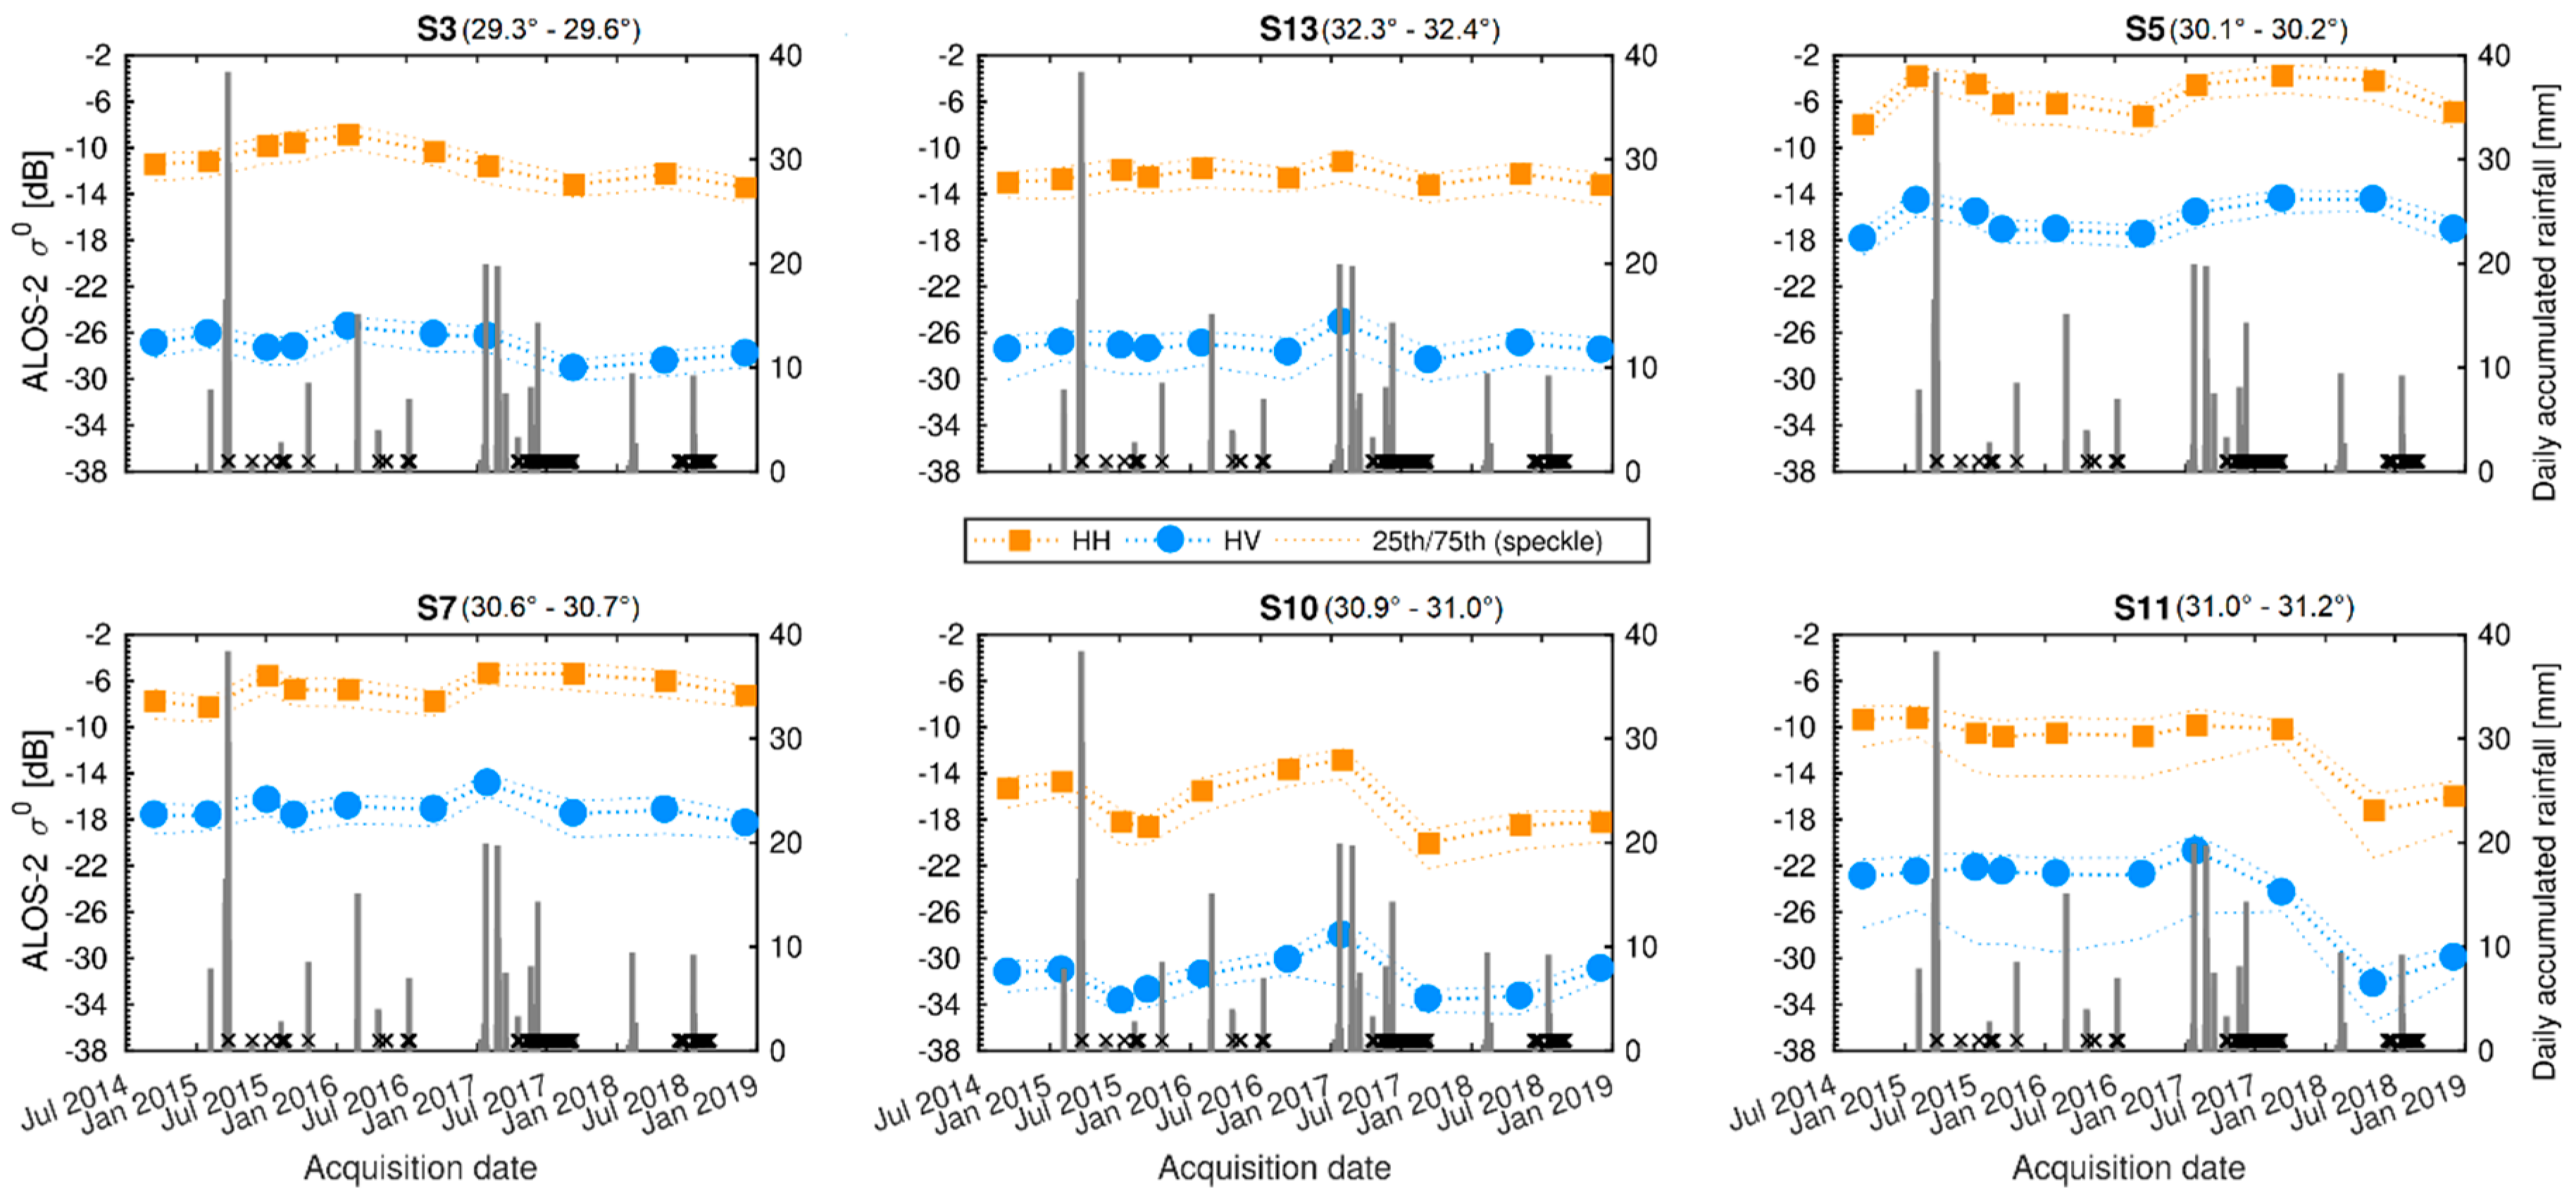
0) from residual speckle noise less than 1 dB as follows from the known gamma distribution for SAR data. In the case of ALOS-2/PALSAR-2, since its time series is sparse, the 25th/75th confidence levels will also be shown.
The multitemporal analysis of σ0 (mean values) in dB was performed using MATLAB R2019a software. Due to the angular variation of backscattering coefficient, only data acquired between 30° and 41° of local incidence angle were considered because it allows the analysis of data with a more significant number of images and σ0 of a rough surface such as the one of the salar is not expected to change significantly for this incidence angle range

2.4. Meteorological Data

The arid climatic conditions of the Salar de Aguas Calientes show an average of precipitations varying between 150 and 200 mm/year [23], with 10% to 20% occurring in the form of snow. The annual temperatures fluctuate between −30 °C to 10 °C, combined with strong winds leads to high evaporation rates with an average of 1500 mm per year [24].
Since there is no meteorological station in the Salar de Talar and the Purisunchi Sub-basin study area, information on daily precipitation for the period 2014–2018 was compiled from one ground station inside the Salar de Atacama basin and two satellite resources. The ground station is in Socaire village, 49.8 km away to the northwest of the Salar de Aguas Calientes Sur, downloaded from the Agromet Home Page [25]. Accumulated precipitation was retrieved from Global Precipitation Measurement (GPM) satellite constellation and Integrated Multi-satellitE GPM (IMERG). This product involves late accumulated precipitation in millimeters, over one day at 10 × 10 km of spatial resolution (Level 3, Version 05), downloaded from the NASA Earth Data Home Page [26]. Moreover, snow cover information over the salar was retrieved from a visual analysis of MODIS Terra Corrected Reflectance, a true color product from NASA Worldview Home Page [27].
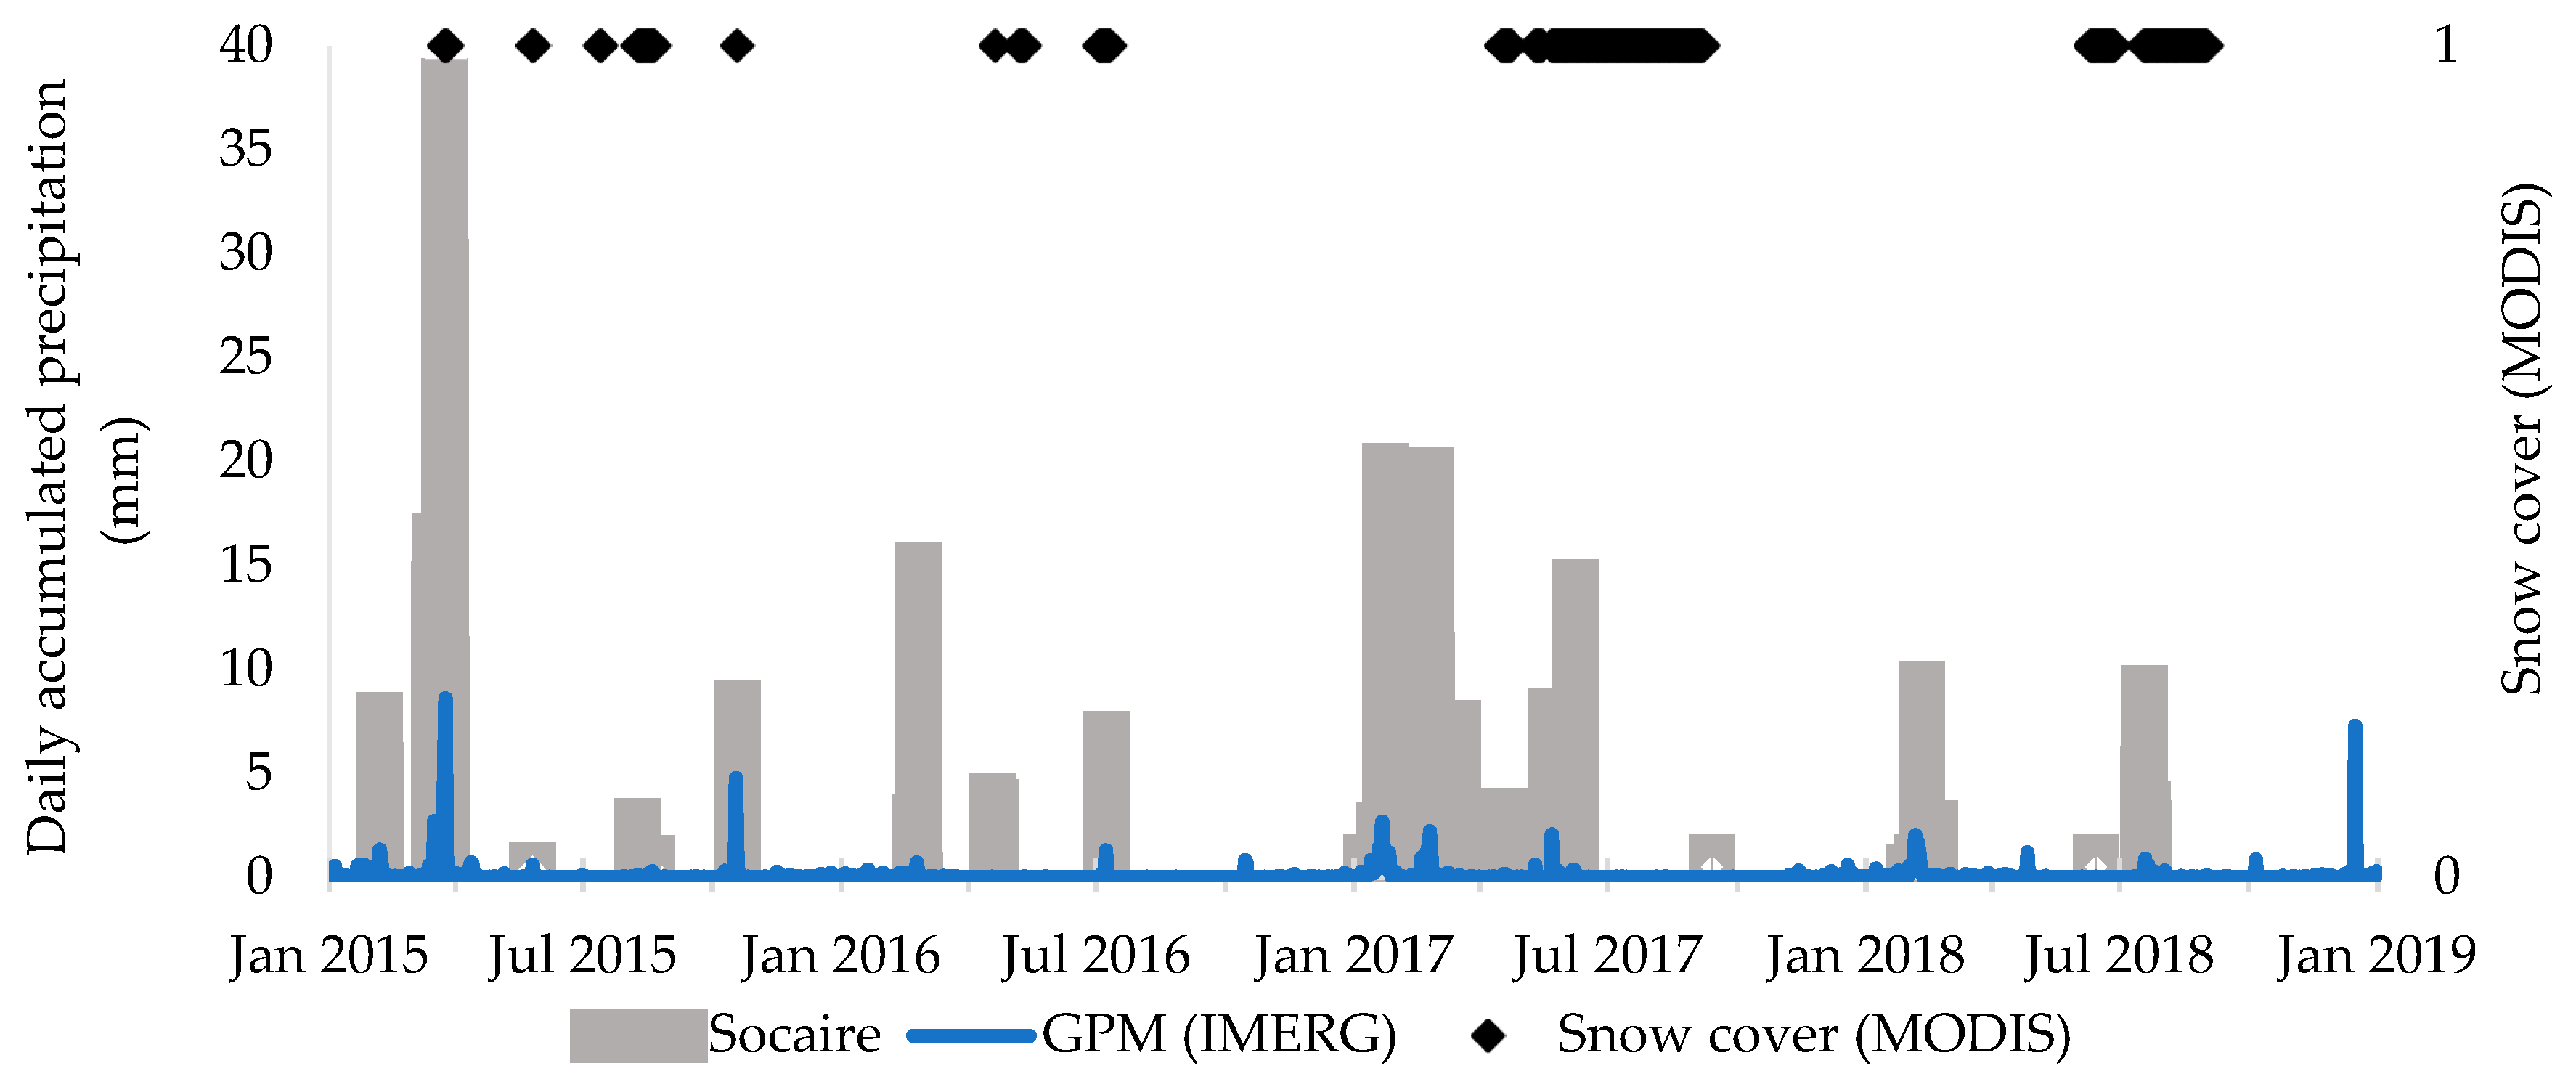
Precipitation events from Socaire ground station and IMERG data product and snow cover from MODIS are shown in Figure 5. The satellite data over the salar recorded precipitation events on the same dates that those of the ground station, despite its location. These precipitations events are indicative of the general trend of water supply to the salar area. Three seasons seem to be driven by rainfall and snowfall events: summer, autumn, and winter. Rainfall events were more often during the austral summer from December to mid-March, with heavy rains, electrical storms, and cooling originated eastward in the Amazon or La Plata basin which leads to the “Altiplanic Winter”. The highest rainfall recorded over the salar was on 16 December 2018, with 7.28 mm documented by the IMERG data product. From autumn to winter, snowfall events supply water to the salar. In the autumn of 2015, an exceptional event happened on 24 March 2015, with heavy rains registered in Socaire (38.3 mm) and 9 mm snowfall over the salar registered by IMERG. Snowfalls were intensified throughout the Andean region during La Niña events [24] (April 2017 to December 2018) with a 123-day (from 16 April to 7 September 2017) and a 64-day (10 June to 1 September 2018) period of snow covering the entire salar.
Temperature data indicated average values of 12 °C for the winter months and 23 °C for summer, with the highest temperatures recorded during January. 
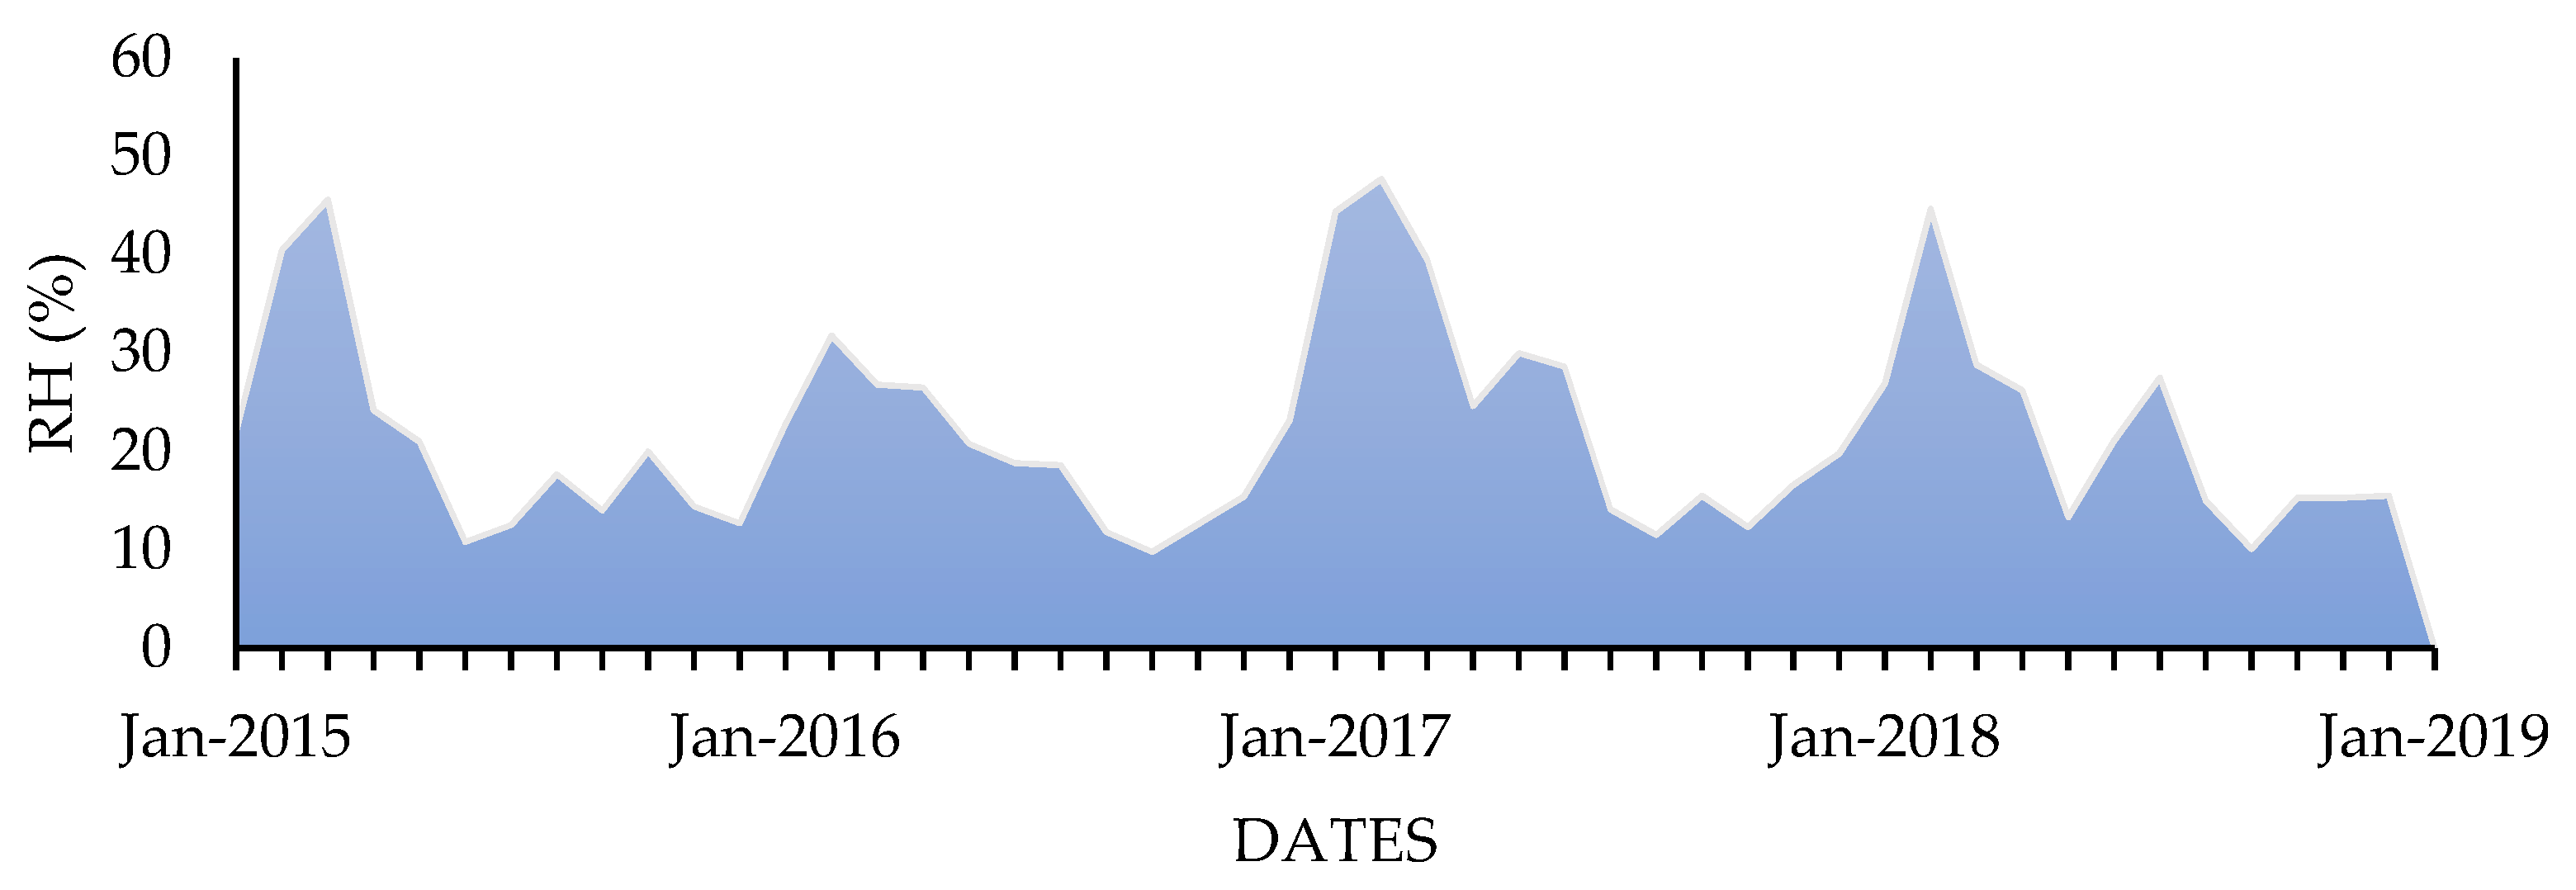
Figure 6 shows relative humidity (RH) through the study period. As for the relative humidity (RH), the Socaire station registered high values (38%) during the Altiplanic winter months (December to March), and an average 21% in southern winter (June to September). The wettest year was 2017 (25% average) coincident with the La Niña event and the driest 2016 (19% average). Finally, the wind does not have a specific temporal pattern.
The datasets were considered in the analysis of the results derived from the seasonality of Sentinel-1 and ALOS-2/PALSAR-2 backscattering power over Salar de Aguas Calientes Sur.

2.5. Penetration Depth

When SAR microwaves reach the playa lake saline soil, the electromagnetic wave penetrates through while interacts with the soil bulk constituents. Solid rock particles, air and brines scatter the incoming power. The depth at which the SAR power transmitted and attenuated is referred to as penetration depth (δp) and it is defined as the depth at which the power of a propagating wave is equal to exp (−1) = 0.3679 of its power at the medium’s surface. If scattering losses are ignored, δp can be calculated according to [28].
p = λ 0 4 π { ε 2 [ ( 1 + ( ε ε ) 2 ) 1 2 1 ] } 1 2
where λ0 is the wavelength in free space and ε′ and ε″ are the dielectric permittivity and loss, respectively, for the medium. For soil particles typically ε″< 0.05 [29] and the losses are therefore dominated by the salinity of the brines. If scattering losses are accounted for, the penetration depth is even smaller. δp computed as in (1) is, therefore, an upper limit for wave penetration and subsurface scattering. Simple dielectric mixing models compute ε′ and ε″ using the dielectric values for dry soil and saline water, each weighted by its respective proportion of the combined mixture, being the last given by the soil porosity when soil is saturated. 
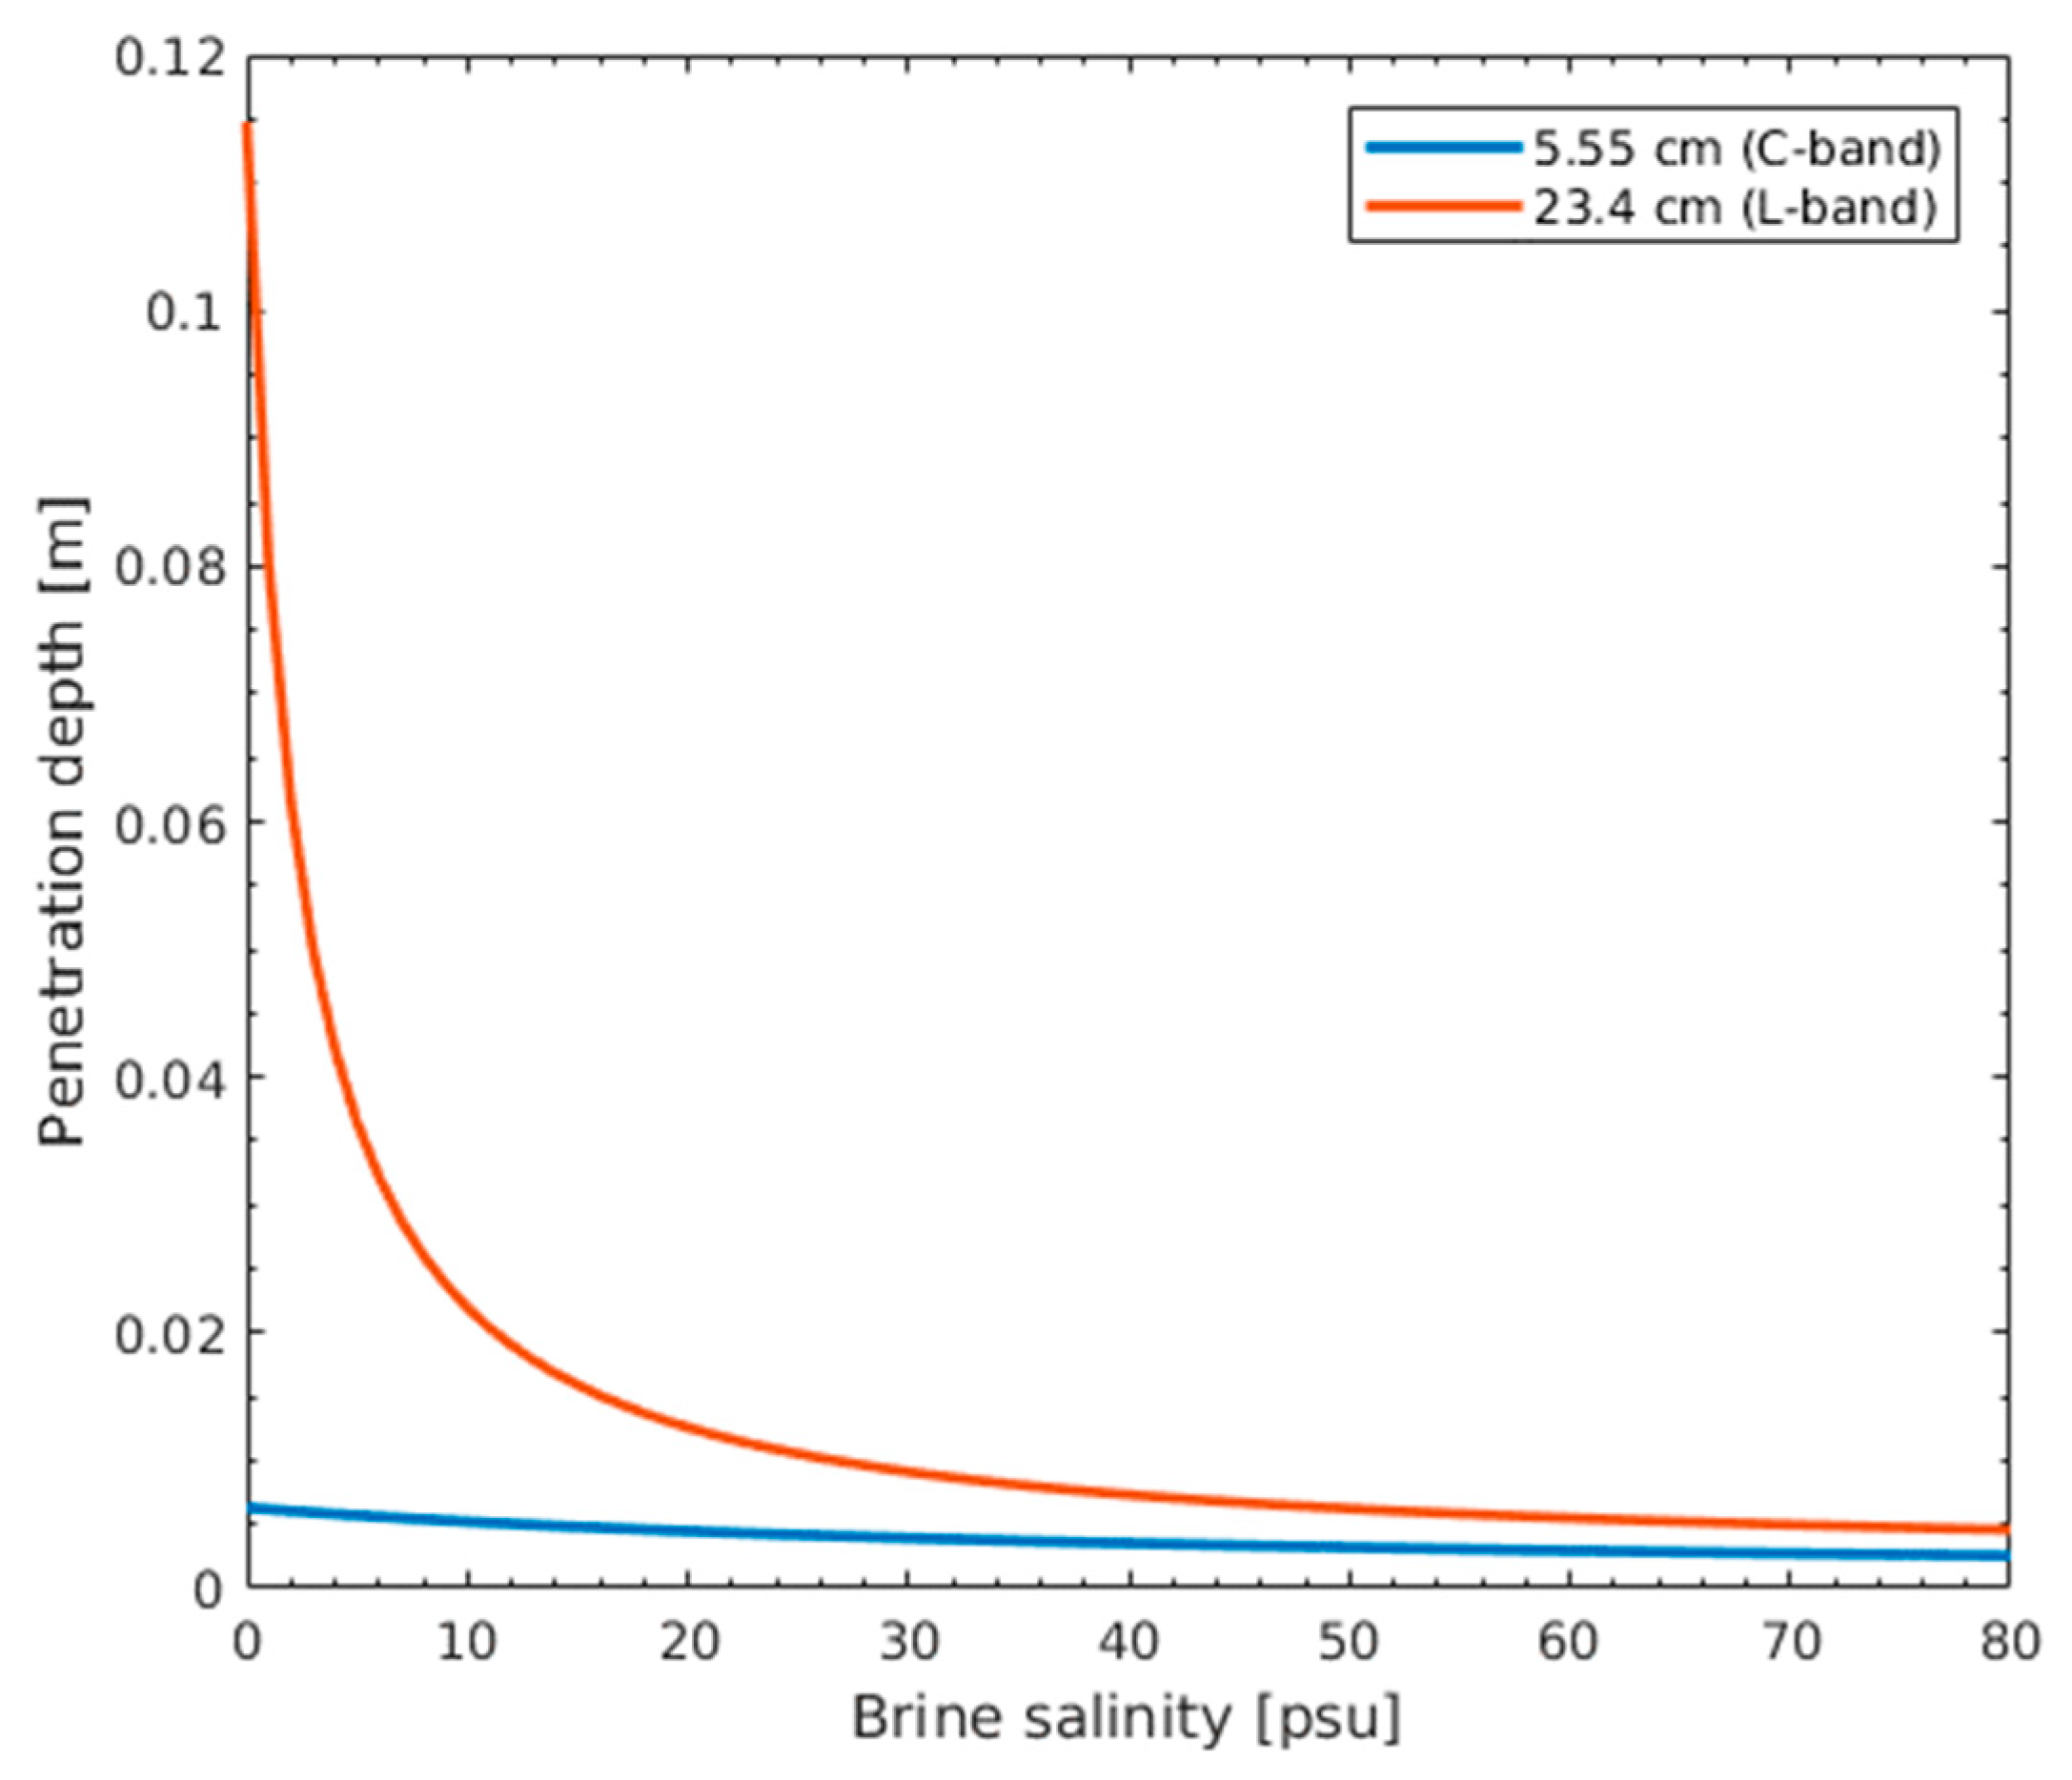
Figure 7 illustrates the δp for 5.55 cm (C-band), and 23.4 cm (L-band) calculated using a soil porosity of 34% and a soil temperature of 20 °C based on the measurements reported by [12] for a salar. Over the study area, subsurface brine salinity ranges between 2 and 45 psu as reported in 2013 by [20]. A salinity of 66 psu was measured recently in the northern lake near the site S2. The salinity has a significant impact on radar backscatter in terms of microwave penetration depth. Power losses at C-band result in surface scattering as the dominant backscattering mechanism, which implies a more considerable sensitivity to crust roughness than L-band. Moreover, L-band might have some components from subsurface scattering.

3. Results

3.1. Seasonality Analysis

In this section, averaged backscattering coefficients in dB from Sentinel 1 and ALOS-2/PALSAR-2 for sites S1, S6 and S10 as a function of acquisition date are shown in Figure 8 and Figure 13 to the end of this section, respectively. The rest of the sites will be analyzed below. Each time series have been collected with the same acquisition parameters such as wavelength, orbital pass, and incidence angle. Due to the low penetration depth at C-band, as seen in Section 2.5, the annual seasonality in the backscatter accounted for surface roughness changes. Growth of halite through evaporation of standing water or rise of brines by capillarity leads to a high increase of the radar power backscattered [8]. Thus, temporal changes in the time series were the result of salt crust development and their time evolution. We choose three patterns of time signatures to describe this behavior. The backscattered power from 2014 to 2018 has been explained in terms of climate and annual seasonality, and episodic events, each one with their own dynamics. Although an almost exclusively dry environment, wet conditions over extended periods in the salar are due to climate patterns such as La Niña. Summer and Altiplanic winter, where water supply was available, alternate to dry months on an annual basis. Finally, episodic events such as floods and strong winds resulted in eventual, short-term, intense variations in the salar surface and therefore to the corresponding radar backscattered power.

3.2. Climate Seasonality

Winters including sporadic snowfall conditions from 2014 to January 2017 prevented σ0 from significant variations. The almost constant trend shown in Figure 8 for sites S1, S6 and S10 accounted for the lack of significant snowfalls over that period. The episodic event that occurred on 13 April 2015 will be described elsewhere. From January 2017, Salar de Aguas Calientes Sur underwent an increase in the available water due to La Niña wet conditions through the two major snowfall events and some heavy rainfalls mentioned in Section 2.4. The availability of water and the evaporation that follows has driven the formation of crusts, and henceforth the change in surface roughness detected at C-band. Over long dry periods, crust development occurred at a slow rate driven by capillarity, which resulted in a small slope increase of VV-polarized σ0 from May 2015 to May 2016 for Site 6 as shown in Figure 8b and from July 2016 to February 2017 for Site 10 in Figure 8c. Conversely, water incomes from rain or snowfalls are related to marked σ0 variations over La-Niña-induced wet season from January 2017.
Figure 9a shows the dry salar over the thirteen regions of interest for 9 March 2015, with the higher backscattering coefficients from Hard-pan crust 1 and 2 types. It is noteworthy that the homogeneous texture in σ0 produced by long dry periods. Low-backscattering areas in the northern and southern parts are related to the salar depocenters, where the groundwater remains close to the surface and hence the halite crystals dissolved leading to a rather smooth.

3.3. Annual Seasonality

Humidity increase and water availability over the wet months are the main drivers to an annual-basis dynamic of the crust development and therefore of the corresponding backscattering coefficients. Changes in the backscattered power due to annual temporality showed different patterns depending on the salt pan spatial distribution and composition.
For type 2 (S6) and type 1 (S10) hard crusts, Figure 8b,c, respectively, σ0 increase and decrease pattern accounted for inter-annual wet and dry periods. This is more evident on the Hard-pan crust 1, where VV-polarized backscattering coefficient had an 8.80-dB-increase between the flooded and the well-developed crust surfaces in a four-month period between 17 September 2017 and 15 January 2018, leading to a rate of 2.20 dB/month over the 120-day interval between the period mentioned. On the other hand, for the Soft pan crust in S1, Figure 8a, annual seasonality had little impact on σ0. Note that backscattering coefficients differences in S6 between descending (incidence angle at 31°) and ascending (40°) pass demonstrated spatial heterogeneities in the crusts in the period from January to July 2018. Due to its lower sensitivity to surface changes, cross-polarized σ0 wet-and-dry cycles appeared not so marked in comparison to co-polarized ones. The two major snowfall events caused the backscattering coefficient to decrease, as shown in Figure 8c and Figure 10a from March to August 2017 and from June to September 2018. Snow crystals have a dielectric constant around 4 with a negligible imaginary part [29], therefore reducing the dielectric contrast in comparison to a brine-dry soil mixture. Moreover, the effect of a snow cover on the backscattered power is to decrease co-polarized σ0 by smoothing the surface roughness as seen in Figure 1a. As snow accumulated over the surface, volume scattering increased in September 2017. Over the following dry period, VH increased in the hard crusts possibly due to the rise of underground water that filled pore space within the crust. By the end of the time series, VH-polarized σ0 remained more or less constant showing low sensitivity to weather conditions. When the snow melted, flooded areas over the salar, as shown in Figure 1c, are subjected to episodic events such as wind and freezing as shown in Figure 1b.
Other σ0 variations are summarized in Table 3 for those sites with monthly rates greater than 1.00 dB. Rates are computed as the ratio of the interval to month on a 30-day month basis. For sites 1, 10 and 6 a large growth rate is found over the dry period after the snowfall at the beginning of the time series. When the water input is in the form of rainfall, as in February 2018, the halite growth rate that followed drops by about one half on sites 1 and 10. On site 11 and 4, the influence of precipitation type on the rate seemed not so marked. Thus, the effect of water droplets dissolving previously grown salt aggregates has different impacts on σ0.

3.4. Episodic Events

Restricted episodic changes occurred in a short time period and over large spatial extents. They account for marked variations in σ0, and some of them are indicated with green circles in the time series shown in Figure 8, corresponding to an extreme rainfall event on 24 March 2015, and flooding on 7 September 2018. Figure 9b showed the decrease of backscattered power over large extents on the salar surface after the extreme event on 24 March 2015, when heavy rains were registered in Socaire (38.3 mm) and a 9-mm-snowfall was measured by the IMERG data product. Flooded areas were subjected to an intense southeast wind of up to 70 km/h as registered by Socaire station from 9 September 2017 to 13 September 2018 that left a smeared pattern onto dry areas, such as in the nearby site S11. Conversely, loose material in dry areas deposited onto flooded ones such as to the north of site S1.
Site 1 has the most significant fluctuations in σ0 over the period from July to October 2018, as shown in Figure 8a. These are related to wind effects. When flooded, the radar backscatter is subjected to wind-generated roughness, increasing its backscattered power σ0. When standing water left, low backscattered power can be partially explained by the presence of wind-blown sands that tend to fill between uneven spaces, thus causing the surface to smoothen [30].

3.5. Seasonality of the Other Sites

For the other sites involved in the Sentinel 1 seasonality analysis, variations in both VH- and VV-polarized backscattered power for the four years are shown in Figure 11 for Hard-pan crust 1 (S3, S5, S7, S11, and S13), Hard-pan crust 2 (S4, S12) and Soft crusts (S2, S8, S9). Images were acquired at local incidence angles ranging from 37° to 41° (ascending pass) and from 30° to 34° (descending pass). In this section, seasonal, annual, and episodic temporalities were analyzed together.
As seen in Figure 8, for the other sites described in Figure 11, conditions from 2014 to January 2017 are also represented by σ0 constant trend due to the lack of significant rainfalls over that period. The episodic event that occurred on 13 April 2015 is also highlighted here, with a second episodic event registered on 20 April 2016, with a rapidly and isolated increase in σ0 for some sites. From January 2017, La Niña wet conditions changed the surface roughness detected at C-band. Over long dry periods, crust development occurred at a slow rate, which resulted in a small slope increase of VV-polarized σ0 from May 2015 to May 2016 for Sites S4 and S12 and from July 2016 to February 2017 for Sites S11 and S13. The latest sites surround flooding grounds, which are influenced by salt dissolution and seem to be influenced by those events decreasing σ0 during 2017–2018 springtime. Overall, the higher σ0 is observed over Sites S3, S5 and S7 with smooth slopes over time. These sites are over elevated grounds which prevented them from flooding and salt dissolution unless heavy rainfalls occurred.
In general, Sites S2, S8, and S9 had similar σ0 patterns over the four years, being affected by fluctuations in ponded water, increasing its backscattering power in presence of wind-induced roughness.

3.6. Seasonality as Seen by ALOS-2/PALSAR-2

The longer penetration depth at L-band in comparison to that of C-band allowed interpreting ALOS-2/PALSAR-2 σ0 in terms of subsurface scattering rather than surface scattering. For ALOS-2/PALSAR-2, variations in both HH- and HV-polarized backscattered power from 2014 to 2018 are shown in Figure 12 for type 2 Hard and Soft crusts, and Figure 13 for type 1 Hard crust. Images were acquired on ascending passes only with local incidence angles ranging from 30° to 35°. In what follows, seasonal, annual, and episodic temporalities were analyzed together.
Overall, hard crust 2 (Figure 12, upper panel) showed a higher σ0 than soft crust (Figure 12 bottom panel) because of the difference in surface roughness. The snowfall during the winter of 2017 and its subsequent melting during the spring, contributed significantly to change the σ0 in several sites. In some of them, it leads to a high backscatter coefficient (S12, S1, S8), which arises from the rise of the brine layer, thus resulting in a moistened medium with high dielectric constant.
Sites distributed over hard crust 1 (Figure 13) had differences from each other. The higher σ0 are observed over Sites S5 and S7. These sites are located over elevated grounds, which prevented them from flooding and salt dissolution, except under heavy rains. On the other hand, σ0 decreased in S10 since its surface flooded and S11 surrounded flooding areas seemed to be influenced by those events decreasing σ0 during 2017–2018 springtime.

4. Discussion

Our investigation revealed that seasonality analysis of C-band Sentinel-1 and L-band ALOS-2/PALSAR-2 allowed salar dynamics detection at different depths and salt pan-cover types. The results achieved in the current study suggest that the dynamics of the salar during the four years is the consequence of the development of temporal superficial saline crust affected by weather elements such as wind, snow, and rain. The meteorological information partially showed a relation between rain, snow events, and a decrease in the backscattered power. It is necessary to continue investigating the physical causes of the observed phenomenon.
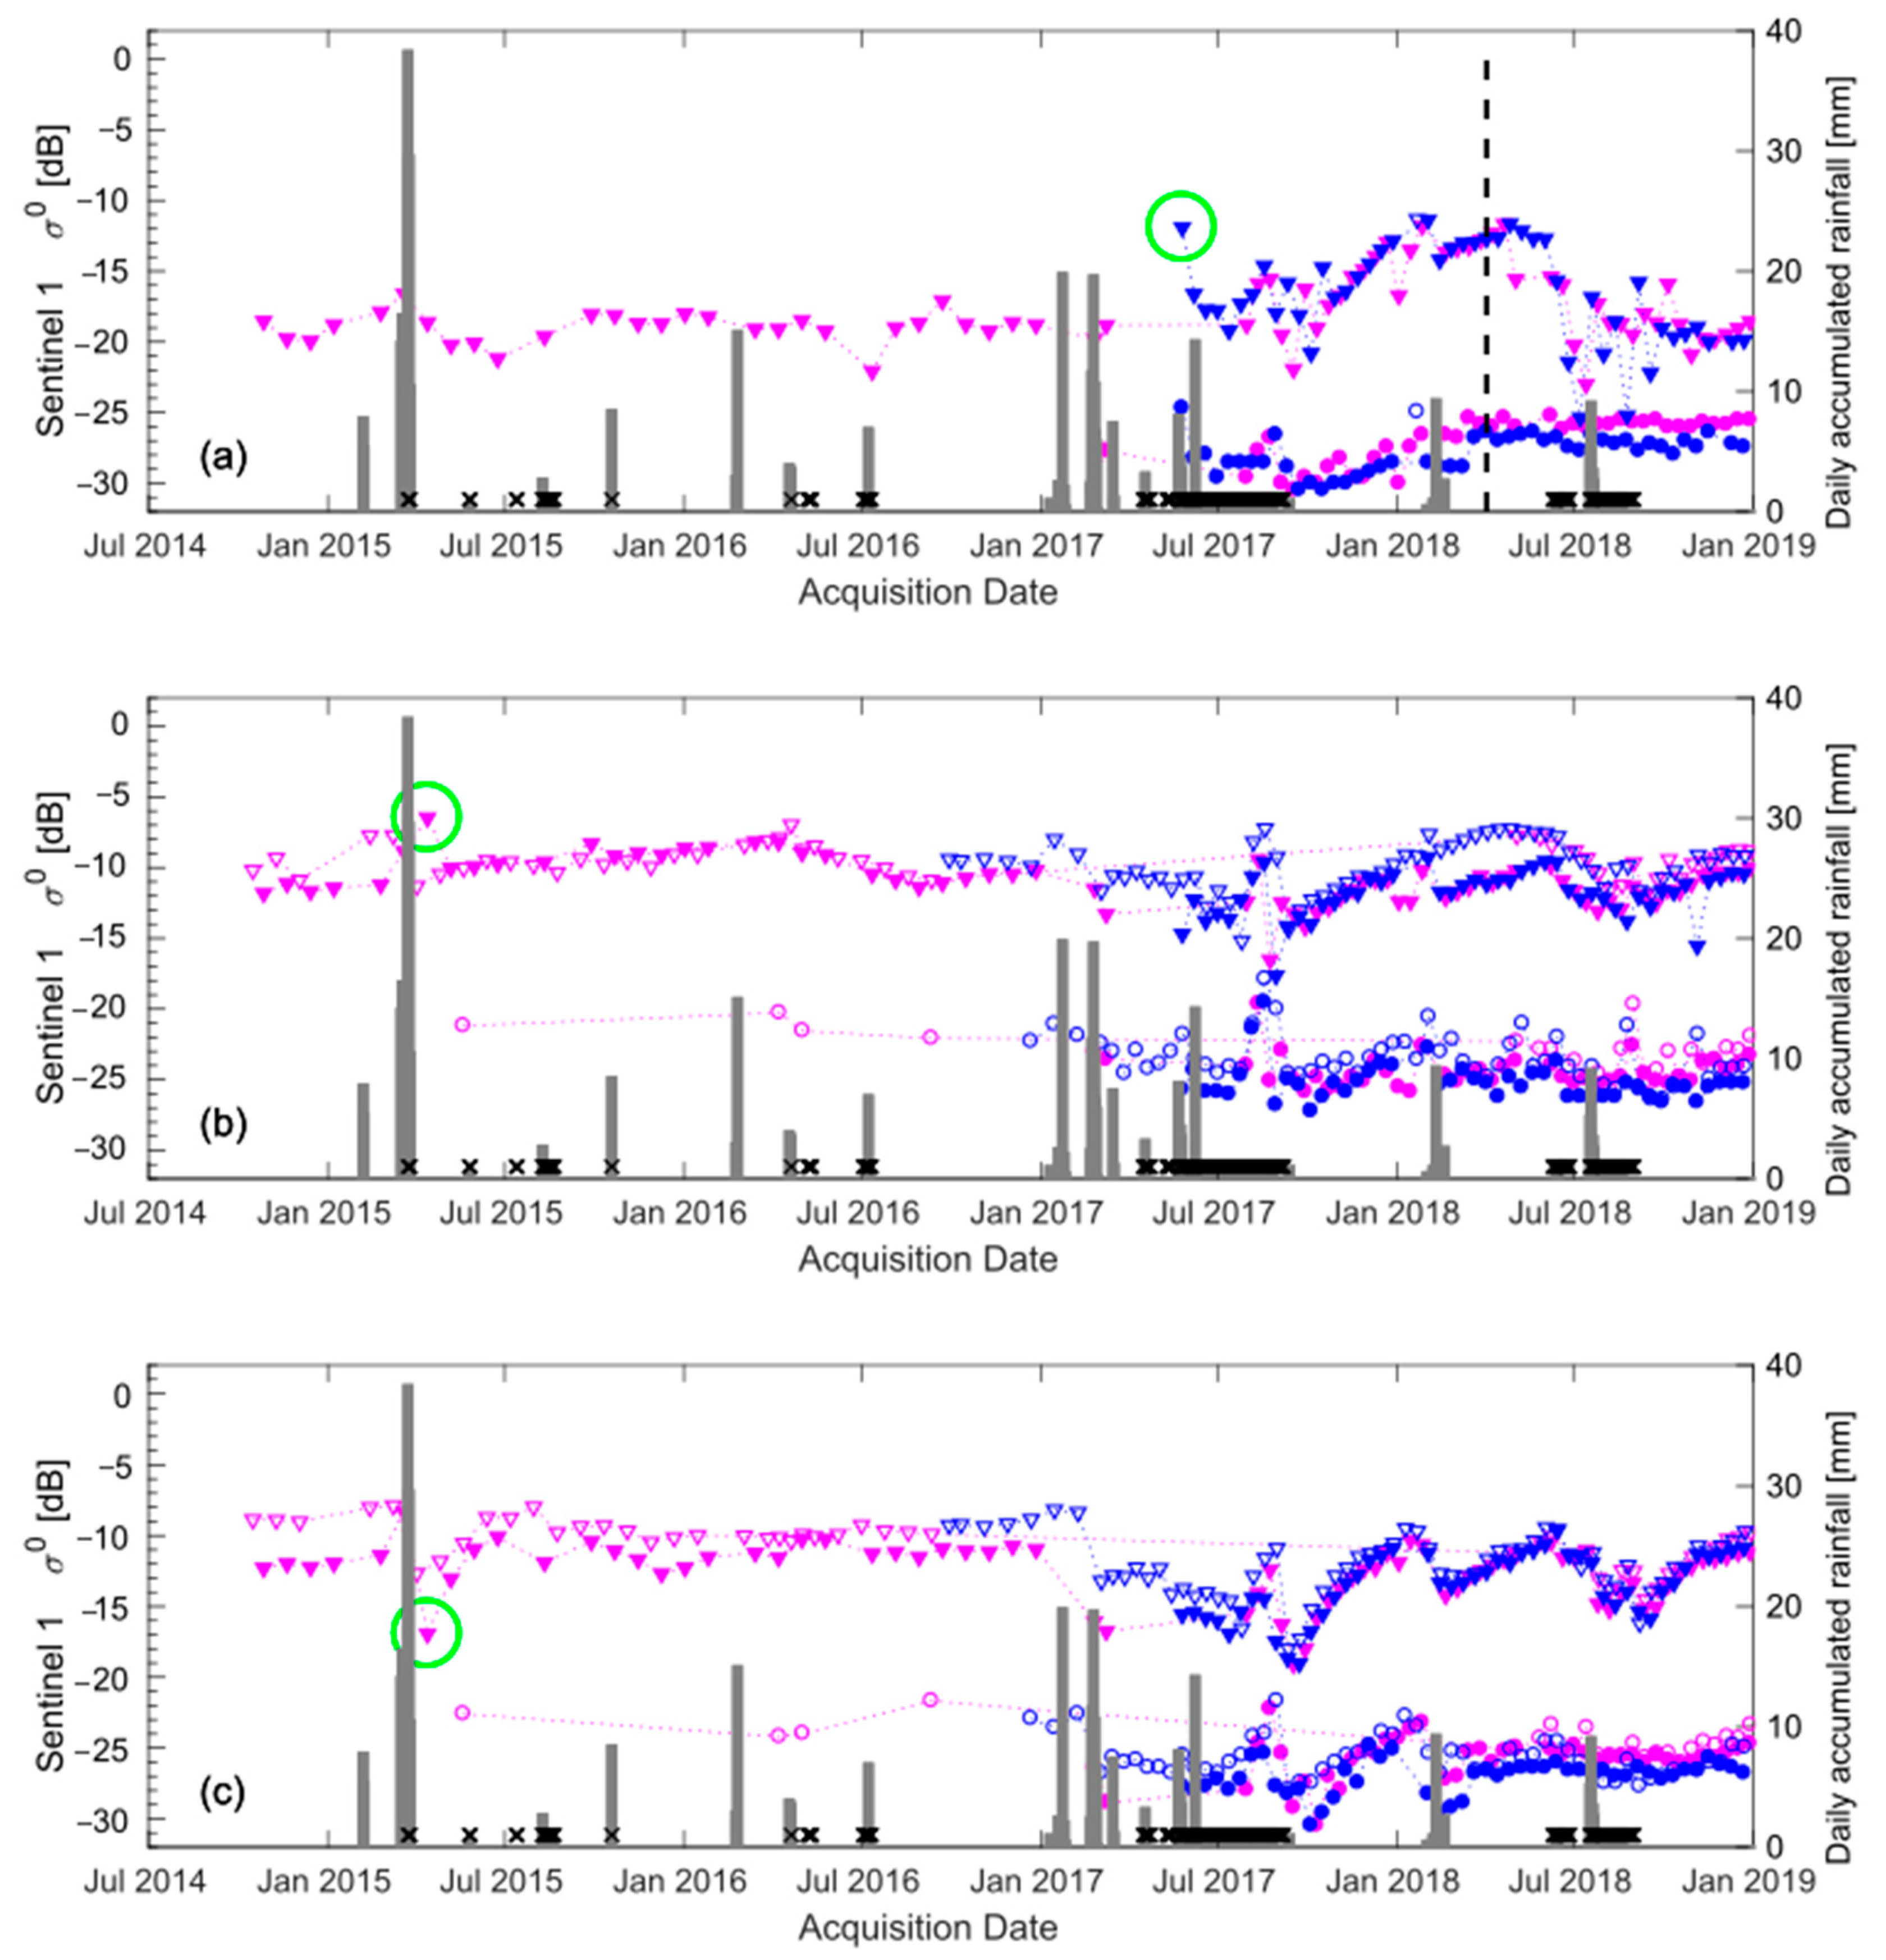
Sentinel-1 seasonality analysis showed three patterns in the backscatter power retrieved from the salt pan surfaces and better represented in VV polarization. The first one related to climate seasonalities starting with winters including sporadic snowfall conditions from 2014 to 2017 with the development of salt crust and backscattered power oscillating around 5 dB. Wet conditions given by La Niña from 2017 to 2018 led to snowfalls followed by floodings and a decrease of the backscattering power due to dilution of salts. Thus, VV-polarized σ0 reached variations up to 9 dB between dry and wet cycles. This is more evident on the Hard-pan crust 1, where VV-polarized backscattering coefficient had an 8.80-dB-increase between the flooded and the well-developed crust surfaces in a four-month period between 17 September 2017 and 15 January 2018, leading to a rate of 2.20 dB/month over the 120-day interval between the period mentioned. The annual seasonality seemed to depend on the humidity income given by either Altiplanic or southern winter through precipitations which resulted in decreasing the backscattered power by smoothening the salt crust roughness. Finally, episodic events occurred in a short time period and are principally triggered by wind blowing flooded areas increasing the backscattering power due to wind-induced roughness.
Similar results were found at the Chott el Djerid Tunisia [6,7,8] in different climatic and geographic conditions, located near sea level (15 m.a.s.l) with precipitations events mainly in winter, dry and warm summer, and mean annual rainfall between 75–100 mm (almost the half of the amount for Salar de Aguas Calientes, Chile) without snowfalls. The authors show a relation in C-band monitoring changes over evaporitic surfaces and present that backscattering power increases where VV-polarized σ0 markedly raised during the evaporation phase in summer, being stable while humidity lacks, and either decreases rapidly due to precipitations in winter. In
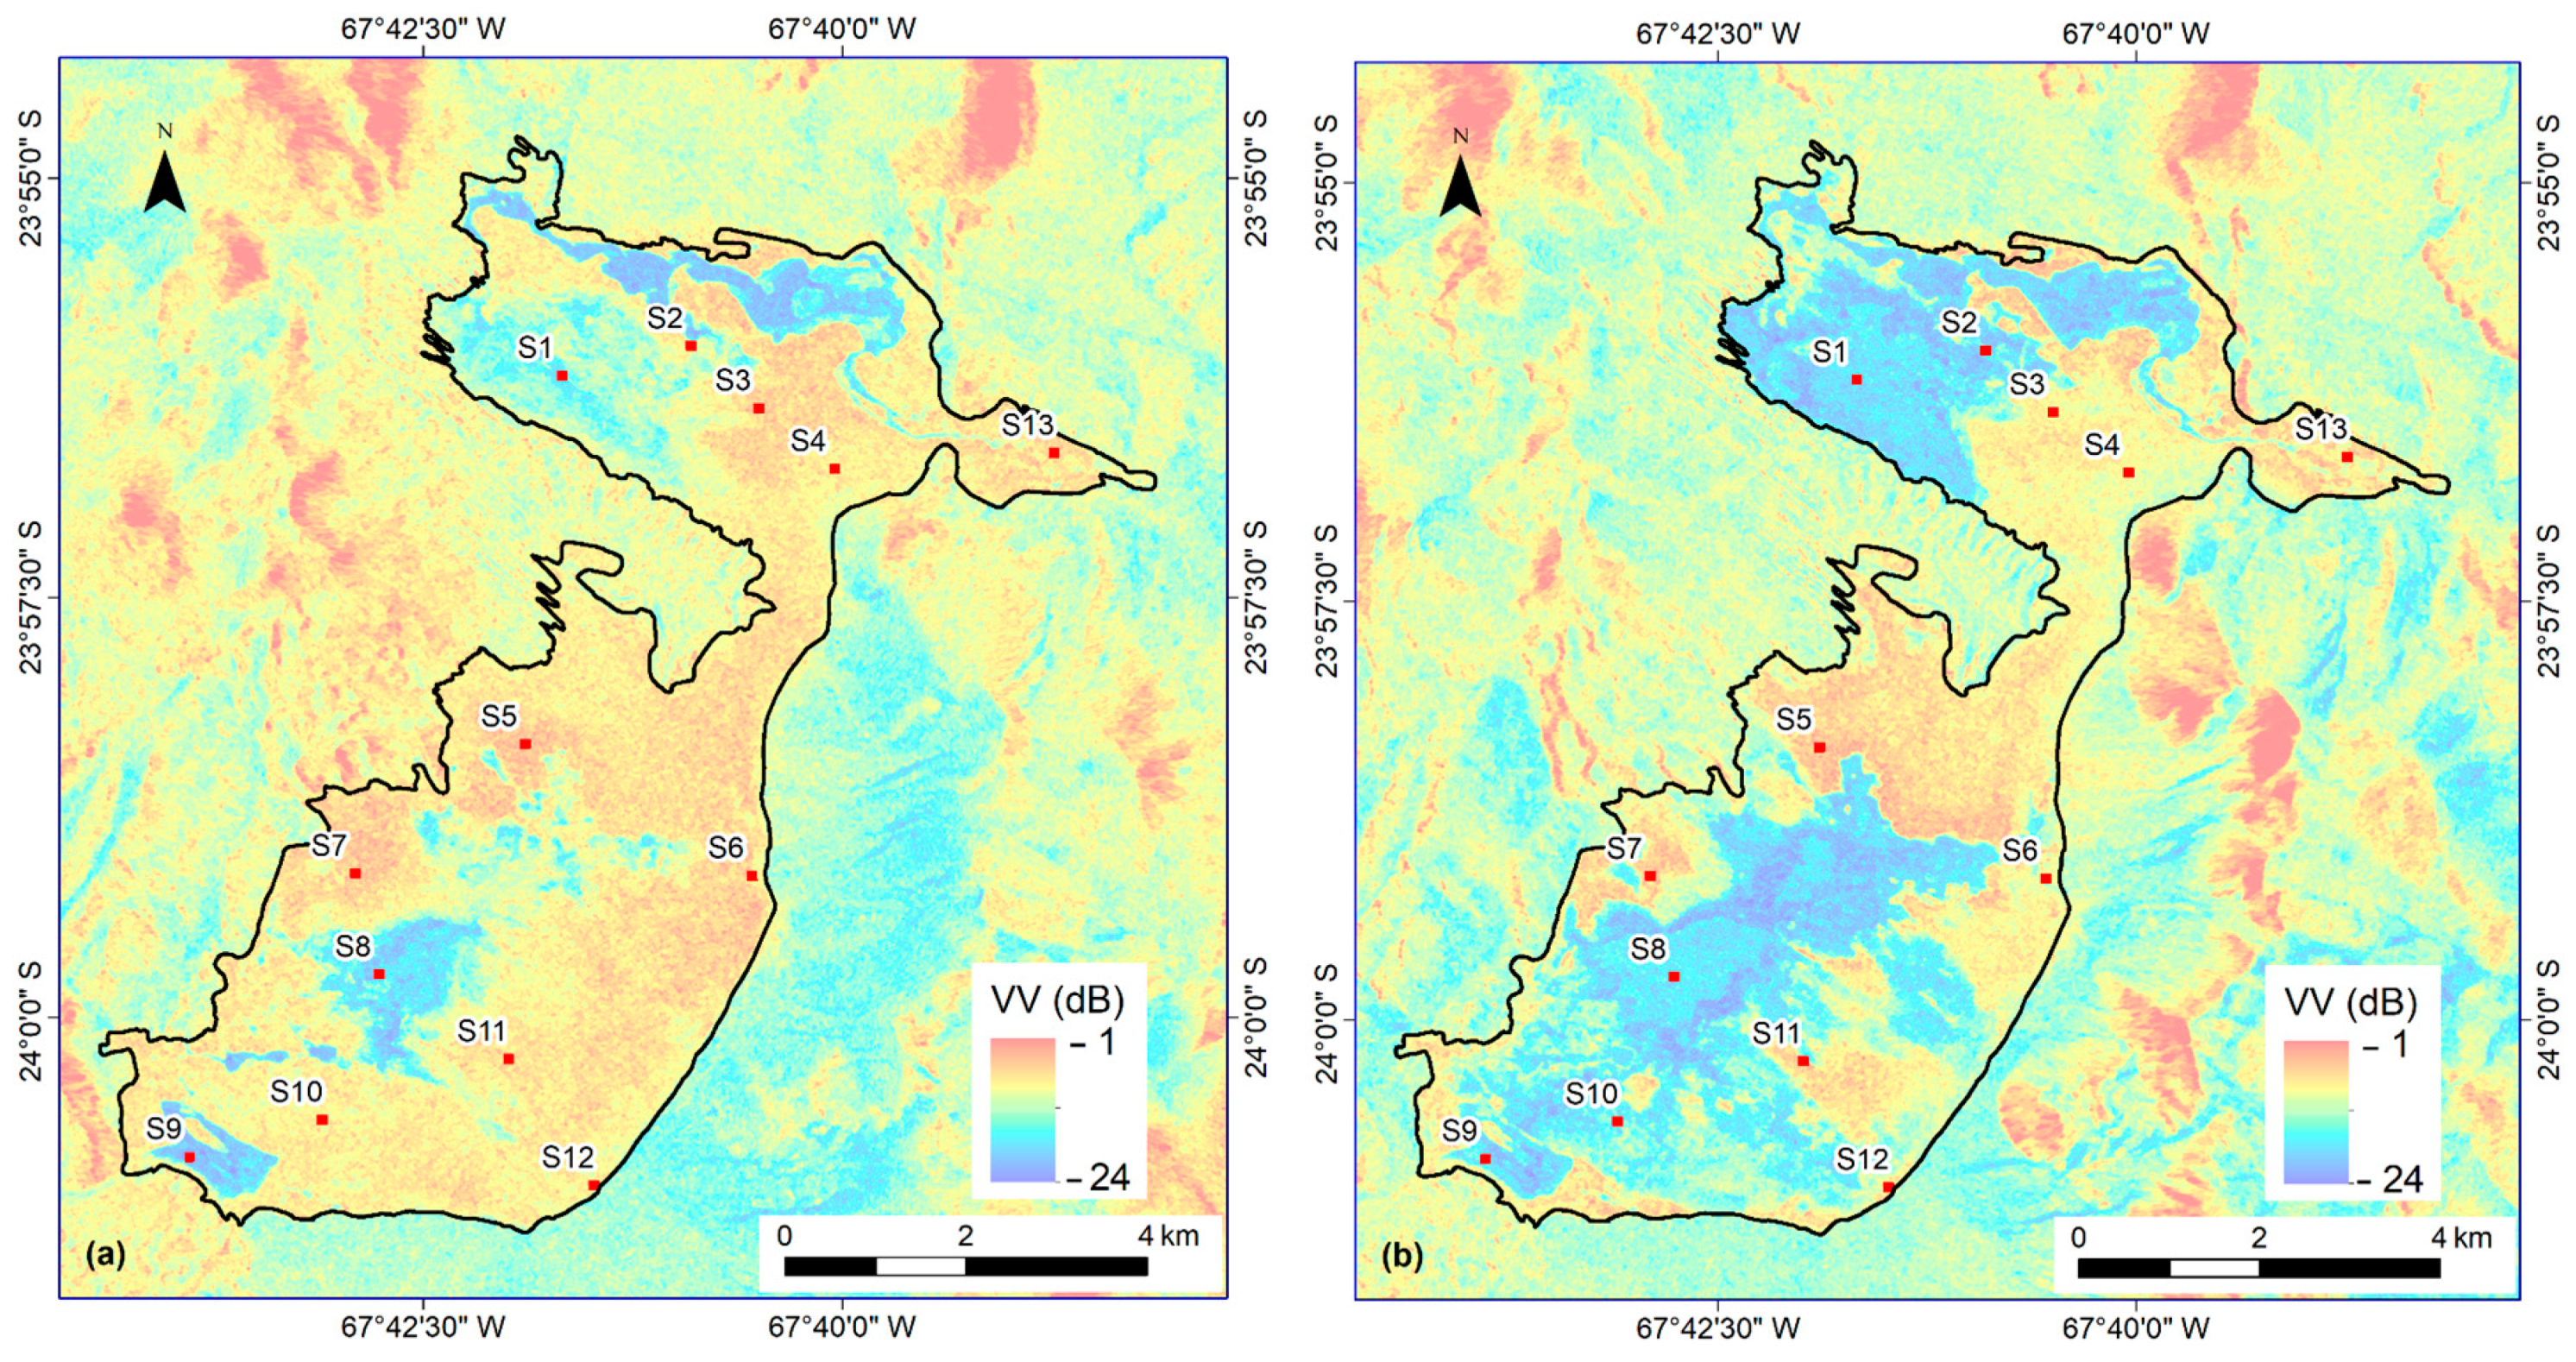
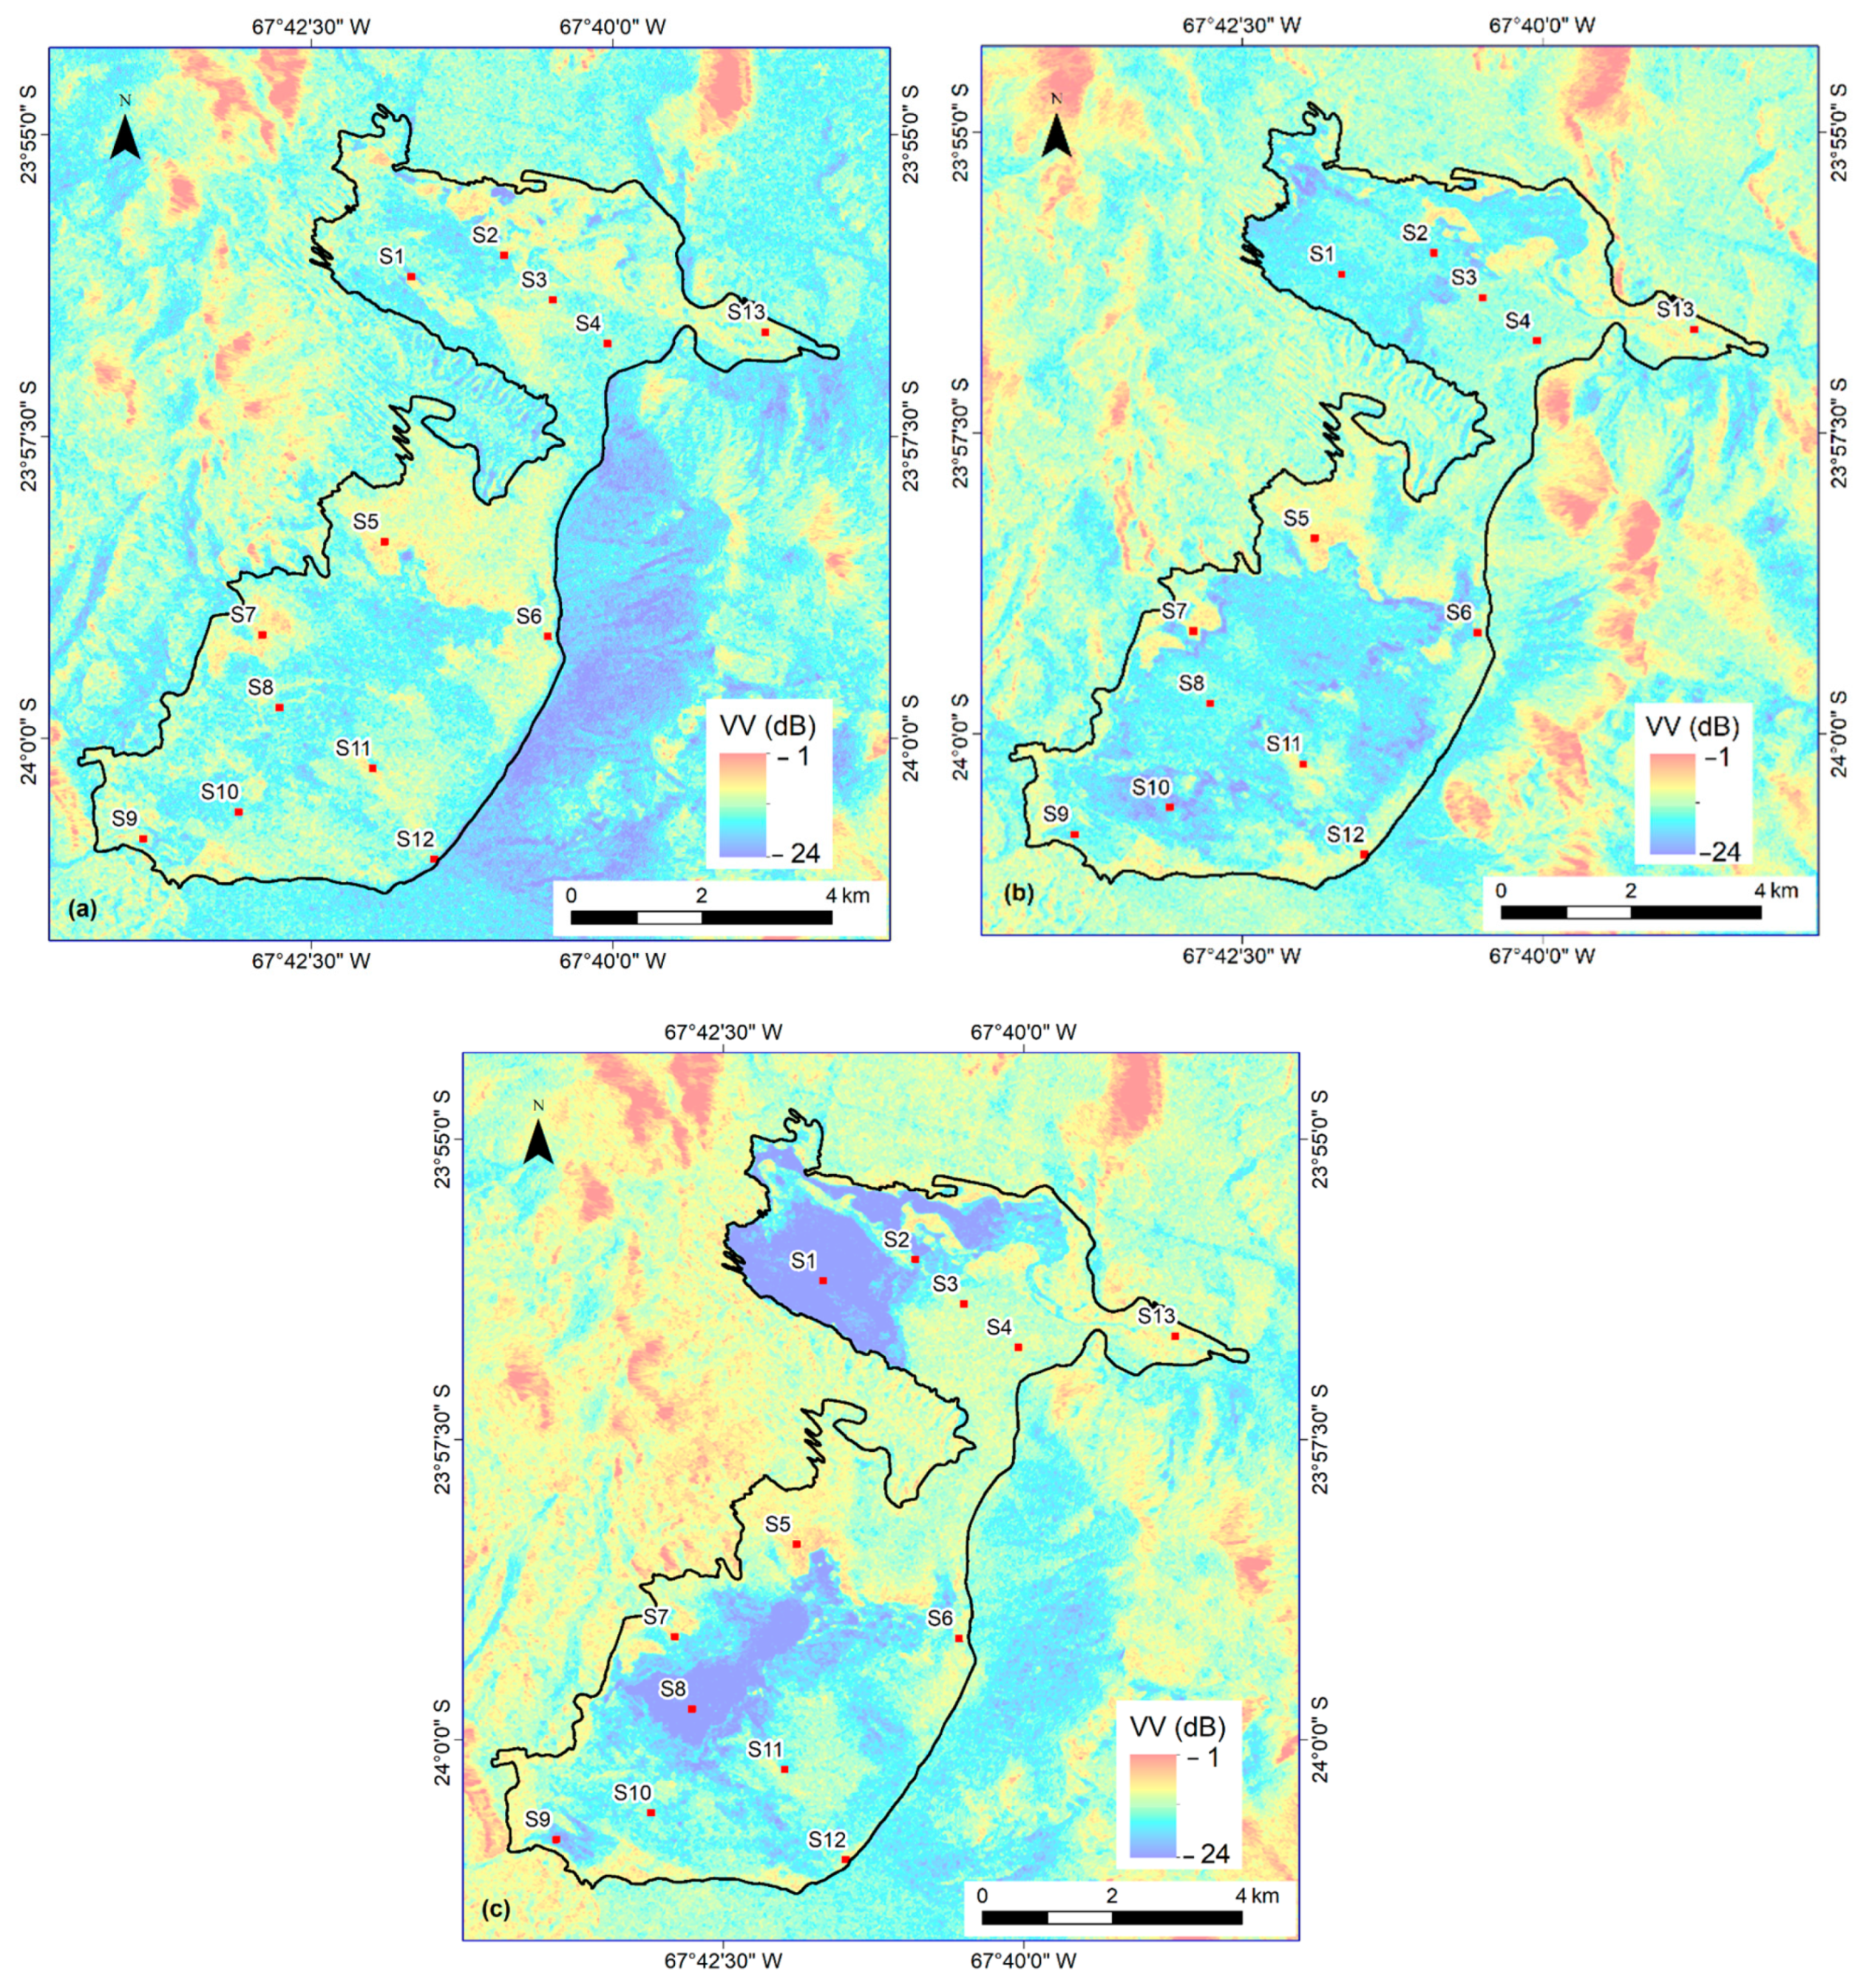
 Figure 9 and Figure 10, VV-polarized σ0 maps showed the vast superficial extensions over the salt flat affected either by flooding or snowfall events. In the case of flooding events, the areas are coincidental with previous studies for Salar de Aguas Calientes [2,4].
Cross-polarized σ0 wet-and-dry cycles appeared not so marked in comparison to co-polarized ones. Sentinel 1 instrument noise floor reduced sensitivity for low σ0 such as those measured at VH polarization. Instrument performance for the IW mode has a marked dependence with the incidence angle [31]. In effect, the noise floor is about −25 dB at 35° and marginally improves to about −27 dB at angles between 39° and 40°, which implied a precise VH-polarized returned power from the rougher crusts solely.
ALOS-2/PALSAR-2 seasonality analysis showed subsurface scattering due to more extended penetration of the signal. Compare with Sentinel-1 the backscattering power seems to be less influenced by precipitations and more affected by flooding and wind blowing the water. Our analyses were limited here since its time series contained fewer images for the study area. A seasonal-trend analysis at L-band could, therefore, be useful in further studies when multiple years of ALOS-2/PALSAR-2 data will be available.
The outcomes of the comparison between the σ0 mean values obtained by Sentinel-1 and ALOS-2/PALSAR-2 time series showed that the qualitative analysis is adequate to describe surface and subsurface salar dynamics over the Andes Highland areas. Lastly, the differences observed for the same day at different sites were due to the large area of study, different altitude locations, and incidence angles as presented before [3].
It is important to highlight that there are significant limitations in comparing data retrieved by weather and optical satellite sensors and Socaire ground weather station due to differences in spatial and temporal resolutions.

5. Conclusions

The paper describes the dynamics of the highland Salar de Aguas Calientes Sur by means of the backscattered power at C- and L-band derived remotely from Sentinel-1 and ALOS-2/PALSAR-2 orbiting sensors. The main aim was to determine the seasonality in the SAR response over the salar, through a four-year multitemporal analysis (2014–2018) in order to qualitatively estimate the salar dynamics and compare the results with weather conditions, in the perspective of data integration.
The analysis of the σ0 time series showed that the SAR signal can detect seasonality, with different sensitivities for each pan crust type. Further studies should focus on modeling the backscattering coefficient using two-layer scattering models and dielectric properties measurements retrieved over the salar.
SAR data can be used to detect the dynamics in ponds and salt pan crust, with an accuracy compatible with the temporal resolution of Sentinel-1 and ALOS-2/PALSAR-2 at 4000 m.a.s.l.
The dynamics of the salar during the four years are the result of the development of temporal superficial saline crust affected by wind, snow and water activity episodes. The meteorological information partially shows a relation between rain, snow events and decreases in the backscattered power. It is necessary to continue investigating the physical causes of the observed phenomenon. The lack of a permanent ground weather station inside the basin could lead to errors in the accuracy of seasonality event detection, especially for wind and frozen events. For this reason, future studies should be considered at a similar basin with ground weather station acquisitions to increase data consistency.
Unlike other salars studied worldwide, the roughness of the salt pan in Salar de Aguas Calientes Sur is conditioned by two winter episodes through a year with precipitations events that can dilute the salt crust, thus driving salar-wide dynamics.
Nevertheless, the presence of constant winds and high geographic altitude could contribute to the fast evaporation and development of salts.
The relevance of this work lies in its potential as a low-cost tool to explore different evaporitic environments for research purposes, monitoring of water contributions to the system, mining exploration projects, among others. It can also help to a better understanding of environmental changes in arid regions and global climate change.

Author Contributions

A.D. and M.B. collected the data. A.D. processed the data, performed the analysis and wrote the paper. M.B. supervised the work, helped to structure the document and contributed to the analysis and interpretation of results. A.G. added knowledge about the study area and technical support in the field. F.G., P.V.-P., W.P.-M. and I.B.-D.-U. thoroughly reviewed the manuscript. All authors have read and agreed to the published version of the manuscript.

Funding

This research received no external funding.

Acknowledgments

The authors thank the professionals at Magíster en Teledetección, Universidad Mayor for the administrative and technical support. Our sincerest thanks to Centro de Información de Recursos Naturales for its support to the field campaign. Our thanks are also extended to Silvia Arce (Sernageomin), who helped with geochemical analysis from the Salar de Aguas Calientes Sur.

Conflicts of Interest

The authors declare no conflict of interest.

References

  1. Chong Díaz, G. The Cenozoic Saline Deposits of the Chilean Andes Between 18°00’ and 27°00’ South Latitude. Lect. Notes Earth Sci. 1988, 17, 137–151. [Google Scholar]
  2. Stoertz, G.E.; Ericksen, G.E. Geology of Salars in Northern Chile; Technical Report; U.S. G.P.O: Washington, DC, USA, 1974; p. 65. [Google Scholar]
  3. Frison, P.L.; Paillou, P.; Sayah, N.; Pottier, E.; Rudant, J.-P. Spatio-temporal monitoring of evaporitic processes using multiresolution C-band radar remote sensing data: Example of the Chott el Djerid, Tunisia. Can. J. Remote Sens. 2013, 39, 127–137. [Google Scholar] [CrossRef]
  4. CIREN. Provisión de Imágenes Satelitales y Ejecución de un Estudio de Geoprocesamiento para Caracterización de Salares; Centro de Información de Recursos Naturales: Santiago, Chile, 2018; p. 250. [Google Scholar]
  5. Ulaby, F.T.; Dellwig, L.F. Satellite microwave observations of the Utah Great Salt Lake Desert. Radio Sci. 1975, 10, 947–963. [Google Scholar] [CrossRef]
  6. Wadge, G.; Archer, D.J.; Millington, A.C. Monitoring playa sedimentation using sequential radar images. Terra Nov. 1994, 6, 391–396. [Google Scholar] [CrossRef]
  7. Archer, D.J.; Wadge, G. Modeling the backscatter response due to salt crust development. IEEE Trans. Geosci. Remote Sens. 2001, 39, 2307–2310. [Google Scholar] [CrossRef]
  8. Wadge, G.; Archer, D.J. Evaporation of groundwater from arid playas measured by C-band SAR. IEEE Trans. Geosci. Remote Sens. 2003, 41, 1641–1650. [Google Scholar] [CrossRef]
  9. Shao, Y.; Hu, Q.; Guo, H.; Lu, Y.; Dong, Q.; Han, C. Effect of dielectric properties of moist salinized soils on backscattering coefficients extracted from RADARSAT image. IEEE Trans. Geosci. Remote Sens. 2003, 41, 1879–1888. [Google Scholar] [CrossRef]
  10. Aly, Z.; Bonn, F.J.; Magagi, R. Analysis of the backscattering coefficient of salt-affected soils using modeling and RADARSAT-1 SAR data. IEEE Trans. Geosci. Remote Sens. 2007, 45, 332–341. [Google Scholar] [CrossRef]
  11. Paillou, P.; Sufyar, S.; Freeman, A. The Chott El Djerid, Tunisia: Observation and discussion of a SAR Phase signature over evaporitic soils. IEEE Trans. Geosci. Remote Sens. 2014, 52, 5798–5806. [Google Scholar] [CrossRef]
  12. Lasne, Y.; Paillou, P.; Freeman, A.; Farr, T.; McDonald, K.C.; Ruffié, G.; Malézieux, J.-M.; Chapman, B.; Demontoux, F. Effect of salinity on the dielectric properties of geological materials: Implication for soil moisture detection by means of radar remote sensing. IEEE Trans. Geosci. Remote Sens. 2008, 46, 1674–1688. [Google Scholar] [CrossRef]
  13. Lasne, Y.; Paillou, P.; Freeman, A.; Farr, T.; McDonald, K.; Ruffié, G.; Malézieux, J.M.; Chapman, B. Study of hypersaline deposits and analysis of their signature in airborne and spaceborne SAR data: Example of Death Valley, California. IEEE Trans. Geosci. Remote Sens. 2009, 47, 2581–2598. [Google Scholar] [CrossRef]
  14. Shao, Y.; Gong, H.; Gao, Z.; Liu, L.; Zhang, T.; Li, L. SAR data for subsurface saline lacustrine deposits detection and primary interpretation on the evolution of the vanished Lop Nur Lake. Can. J. Remote Sens. 2012, 38, 267–280. [Google Scholar] [CrossRef]
  15. Shao, Y.; Gong, H.; Gao, Z.; Liu, L.; Zhang, T.; Li, L.; Wang, L. Subsurface deposits detection and shoreline feature interpretation of a vanished Lop Nur lake using multi-source SAR data. IGARSS 2014, 4580–4583. [Google Scholar] [CrossRef]
  16. Gong, H.; Shao, Y.; Zhang, T.; Liu, L.; Gao, Z. Scattering Mechanisms for the “Ear” Feature of Lop Nur Lake Basin. Remote Sens. 2014, 6, 4546–4562. [Google Scholar] [CrossRef] [Green Version]
  17. Liu, C.A.; Gong, H.; Shao, Y.; Li, B. Detecting the Depth of a Subsurface Brine Layer in Lop Nur Lake Basin Using Polarimetric L-band SAR. J. Sens. 2015, 2015, 11. [Google Scholar] [CrossRef] [Green Version]
  18. Liu, C.-A.; Gong, H.; Shao, Y.; Yang, Z.; Liu, L.; Geng, Y. Recognition of salt crust types by means of PolSAR to reflect the fluctuation processes of an ancient lake in Lop Nur. Remote Sens. Environ. 2016, 175, 148–157. [Google Scholar] [CrossRef] [Green Version]
  19. Ramírez, C.; Gardeweg, M. Hoja Toconao. Servicio Nacional de Geología y Minería. Carta Geológica de Chile, Ser. Geol. Básica. 1982, 54, 117. [Google Scholar]
  20. Troncoso, R.; Ercilla, O.; Carrasco, R.; Vivallo, W. Estudio del Potencial del Litio en Salares del Norte de Chile; Servicio Nacional de Geología y Minería: Santiago, Chile, 2013; p. 252. [Google Scholar]
  21. Ruch, J.; Warren, J.K.; Risacher, F.; Walter, T.R.; Lanari, R. Salt lake deformation detected from space. Earth Planet. Sci. Lett. 2012, 331–332, 120–127. [Google Scholar] [CrossRef]
  22. Warren, J.K. Evaporites: A Geological Compendium; Springer: Bangkok, Thailand, 2016; p. 1822. [Google Scholar]
  23. Herrera, C.; Custodio, E.; Chong, G.; Lambán, L.J.; Riquelme, R.; Wilke, H.; Jódar, J.; Urrutia, J.; Urqueta, H.; Sarmiento, A.; et al. Groundwater flow in a closed basin with a saline shallow lake in a volcanic area: Laguna Tuyajto, northern Chilean Altiplano of the Andes. Sci. Total Environ. 2016, 541, 303–318. [Google Scholar] [CrossRef]
  24. Risacher, F.; Fritz, B. Origin of Salts and Brine Evolution of Bolivian and Chilean Salars. Aquat Geochem. 2009, 15, 123–157. [Google Scholar] [CrossRef]
  25. Available online: http://agromet.inia.cl/estaciones.php (accessed on 22 August 2019).
  26. Available online: https://giovanni.gsfc.nasa.gov/giovanni/ (accessed on 17 February 2019).
  27. Available online: https://worldview.earthdata.nasa.gov (accessed on 12 May 2019).
  28. Ulaby, F.T.; Stiles, W.H.; Abdelrazik, M. Snowcover Influence on Backscattering from Terrain. IEEE Trans. Geosci. Remote Sens. 1984, GE-22, 126–133. [Google Scholar] [CrossRef]
  29. Ulaby, F.T.; Long, D.G.; Blackwell, W.; Elachi, C.; Fung, A.; Ruf, C.; Sarabandi, K.; Zebker, H.; Zyl, J.V. Microwave Radar and Radiometric Remote Sensing; University of Michigan Press: Ann Arbor, MI, USA, 2014. [Google Scholar]
  30. Charlton, M.B.; White, K. Sensitivity of radar backscatter to desert surface roughness. Int. J. Remote Sens. 2006, 27, 1641–1659. [Google Scholar] [CrossRef]
  31. Torres, R.; Navas-Traver, I.; Bibby, D.; Lokas, S.; Snoeij, P.; Rommen, B.; Osborne, S.; Ceba-Vega, F.; Potin, P.; Geudtner, D. Sentinel-1 SAR system and mission. IEEE Radar Conf. 2017, 1582–1585. [Google Scholar] [CrossRef]
Figure 1. Study area: (a) Location within Chile, (b) Sentinel 1B image, VV polarization in decibels (dB), ascending pass, acquired on 3 April 2018, indicating the location and contour of the salar in yellow. The sub-basin has an area of 671,576 km2. From: http://www.geoportal.cl. (Coordinate system: GCS_WGS_1984).
Remotesensing 12 00941 g001
Figure 2. Methodological flowchart for the four-year data sets. 1 Digital Model Elevation.
Remotesensing 12 00941 g002
Figure 3. Distribution of the salt pan crusts modified from a technical report together with Centro de Información de Recursos Naturales [4] and the corresponding author. The map is an original contribution of this paper. Red boxes indicate regions of interest.
Remotesensing 12 00941 g003
Figure 4. Types of salt crust observed in the field on 3 April 2018. (a) Upper panel: Hard-pan crust 1, mixture of salts and sediments (rough surface), (b) Center panel: Hard-pan crust 2 (gypsum and halite), (c) Bottom panel: Soft pan crust with contents of organic matter and thrust polygons by interaction with water.
Remotesensing 12 00941 g004
Figure 5. Meteorological data of the station Socaire, GPM (IMERG) and snow cover between January 2015 and December 2018, where 0 is no cover, and 1 indicates snow cover.
Remotesensing 12 00941 g005
Figure 6. Relative humidity (RH) registered by Socaire station over four years.
Remotesensing 12 00941 g006
Figure 7. C- and L-band penetration depth δp through a saturated saline soil of varying brine salinity. The dielectric constant is computed by means of a simple dielectric mixing model.
Remotesensing 12 00941 g007
Figure 8. Sentinel 1 temporal backscattering observed over the salt pan. Sentinel 1A (magenta) and Sentinel 1B (blue) in ascending (full markers) and descending (empty markers) orbits. VV polarization is indicated as triangles, and VH are circles. The vertical black dashed line indicated a field visit on 3 April 2018 (see Figure 4). (a) Soft pan crust (site S1), the local incidence angle is between 35.2°–35.4° (ascending only), (b) Hard-pan crust 2 (S6), the local incidence angle is between 39.9°–40.1° (ascending), and 31.1°–31.3° (descending), (c) Hard-pan crust 1 (S10), local incidence angle is between 39.2°–39.3° (ascending), and 32.2°–32.3° (descending). Sentinel 1A VH polarization is available from February 2017. The green circles indicate episodic events: on 26 May 2017 for site S1 and on 13 April 2015 for sites S6 and S10. Daily accumulate rainfalls recorded at Socaire are in grey bars, and snowfall cover also shown as black crosses.
Remotesensing 12 00941 g008
Figure 9. (a) Sentinel 1A, VV polarization, descending orbit (9 March 2015). High backscattering coefficient accounted for well-developed salt crusts formed by capillarity over dry periods before La Niña, (b) Sentinel 1A, VV polarization, ascending orbit (13 April 2015). Extreme rainfall event left vast areas with a smoothened surface after salts dissolved. Intense southeast winds caused standing water to depart from flooded areas to dry areas. The opposite also occurred with loose soil particles from dry areas to flooded ones.
Remotesensing 12 00941 g009
Figure 10. (a) Sentinel 1-B, VV polarization, descending orbit (27 May 2017). The salar surface is fully covered by snow, (b) Sentinel 1-B, VV polarization, ascending orbit (11 September 2017). Flooding event following the snow melting with wind-generated roughness over the water beds. (c) Sentinel 1-B, VV polarization, descending orbit (7 September 2018). No-wind condition: Low backscattered power from standing water over sites S1, S8, and S9. Note the similar flooding extents between (b) and (c).
Remotesensing 12 00941 g010
Figure 11. Sentinel 1 temporal backscattering observed over the salt pan for the remaining sites considered in this study. Sentinel 1A (magenta) and Sentinel 1B (blue) in ascending (full markers) and descending (empty markers) orbits. VV polarization is indicated as triangles, and VH are circles. The green circles indicate episodic events: on 13 April 2015, for sites S4, S5, S7, S8, S9, and 20 April 2016, for site S8. Daily accumulate rainfalls recorded at Socaire are in grey bars, and snowfall cover also shown as black crosses.
Remotesensing 12 00941 g011
Figure 12. ALOS-2/PALSAR-2 temporal backscattering observed over the salt pan. Sites corresponded to Hard crust 2 (upper panel) and Soft crust (bottom panel). Ascending orbit. The local incidence angles are indicated in degrees. Daily accumulate rainfalls recorded at Socaire are in grey bars, and snowfall cover also shown as black crosses.
Remotesensing 12 00941 g012
Figure 13. The same as Figure 12 for sites corresponding to Hard crust 1. Ascending orbit. The local incidence angles are indicated in degrees. Daily accumulate rainfalls recorded at Socaire are in grey bars, and snowfall cover also shown as black crosses.
Remotesensing 12 00941 g013
Table 1. Temporal distribution of the Sentinel 1A-1B and ALOS-2/PALSAR-2 images analyzed 1.
Dates
20142015201620172018
ON DJFMAMJJASONDJFMAMJJASONDJFMAMJJASONDJFMAMJJASOND
Sentinel 1A
                                                   
Sentinel 1B
                                                   
ALOS-2/PALSAR-2
                                                   
                                                   
1. In total 335 images from 2014 to 2018.
Polarizations
 HH-HV VV VV-VH
Table 2. Regions of interest (ROIs) surface distribution and basic stats.
SurfaceRegion of Interest (ROI)Total of Pixels
Hard-pan crust 1S3; S5; S7; S10; S11; S13600
Hard-pan crust 2S4; S6; S12300
Soft pan crust S1; S2; S8300
PondS9100
Table 3. Monthly rate of increase of VV polarized backscattering coefficient σ0 during dry periods.
SiteRange
(Start Date–End Date)
Interval [day]Variation [dB]Rate [dB/month]
123 October 2017–28 December 2017664.562.07
23 February 2018–27 April 2018722.551.06
1017 September 2017–15 January 20181208.802.20
20 February 2018–08 June 20181083.761.04
18 September 2018–23 December 2018965.011.57
1122 March 2018–14 June 2018844.181.49
12 September 2018–29 December 20181084.711.31
420 February 2018–21 May 2018904.101.37
06 September 2018–29 December 20181143.841.01
629 September 2017–28 December 2017903.711.24

