Influence of Spatial Resolution and Retrieval Frequency on Applicability of Satellite-Predicted PM2.5 in Northern China

1
Hubei Key Laboratory of Regional Development and Environmental Response, Hubei University, Wuhan 430062, China
2
Faculty of Resources and Environmental Science, Hubei University, Wuhan 430062, China
3
State Key Laboratory of Remote Sensing Science, Institute of Remote Sensing and Digital Earth of Chinese Academy of Sciences, Beijing 100101, China
4
Beijing Key Laboratory of Cloud, Precipitation and Atmospheric Water Resources, Beijing Weather Modification Office, Beijing 100089, China
*
Author to whom correspondence should be addressed.
Remote Sens. 2020, 12(4), 736; https://doi.org/10.3390/rs12040736
Submission received: 2 February 2020
/
Revised: 15 February 2020
/
Accepted: 21 February 2020
/
Published: 23 February 2020
(This article belongs to the Special Issue Advances in Remote Sensing and Modeling of Fires and/or Tropospheric Composition in Asia)
Abstract
:Satellite aerosol optical depth (AOD) products have been widely used in estimating fine particulate matter (PM2.5) concentrations near the surface at a regional scale, and perform well compared with ground measurements. However, the influence of limitations such as retrieval frequency and the spatial resolution of satellite AODs on the applicability of predicted PM2.5 values has been rarely considered. With three widely used MODIS AOD products, including Multi-Angle Implementation of Atmospheric Correction (MAIAC), Deep Blue (DB) and Dark Target (DT), here we evaluate the influence of their spatial resolution and sampling frequency by estimating daily PM2.5 concentrations in the Beijing-Tianjin-Hebei (BTH) region of northern China during 2017 utilizing a mixed effects model. The daily concentrations of PM2.5 derived from MAIAC, DB and DT AOD all have high correlations (R2: 0.78, 0.8, and 0.78) with the observed values, but the predicted annual PM2.5 exhibits a distinct spatial distribution. DT estimation obviously underestimates annual PM2.5 in polluted areas due to lower sampling of heavy pollution events. By contrast, the retrieval frequency (~40-60%) of MAIAC and DB AOD can represent well annual PM2.5 in nearly all 83 sites tested. However, MAIAC and DB-derived PM2.5 have a larger bias compared with observed values than DT, indicating that the large spatial variation of aerosol properties can exert an influence on the reliability of the statistical AOD-PM2.5 relationship. Also, there is notable difference between MAIAC and DB PM2.5 due to their different cloud screening methods. The MAIAC PM2.5 with high spatial resolution at 1 km can capture much finer hotpots than DB and DT at 10 km. Our results suggest that it is crucial to consider the applicability of satellite-predicted PM2.5 values derived from different aerosol products according to the specific requirements besides modeling the AOD-PM2.5 relationship.
1. Introduction
Fine particulate matter (PM2.5) is a dynamic and complex mixture of particle matter with aerodynamic diameter of 2.5 µm or less. Numerous epidemiological studies have shown a robust correlation between exposure to PM2.5 pollution and morbidity and mortality due to respiratory and cardiovascular diseases [1,2]. During the last decades, large amounts of anthropogenic emissions in China have led to widespread air pollution with high concentrations of PM2.5 [3,4,5]. The Chinese government has established a national air quality monitoring network since 2013, and extended it to nearly 1500 sites in 2015. Despite the high accuracy of ground PM2.5 measurements, the spatial coverage of the ground network is too sparse for regional exposure studies as well as other associated applications.
With the advantage of global coverage, satellite aerosol products have been widely used in estimation of PM2.5 concentrations [6]. Satellite-derived Aerosol Optical Depth (AOD) is the integral light extinction of the atmosphere column, which has a good correlation with PM2.5 mass concentrations near the surface [7]. However, its relationship with PM2.5 (hereafter AOD-PM2.5) is influenced by several factors such as the vertical aerosol distribution, chemical composition, and hygroscopic growth [7,8]. Thus, how to model these factors in an AOD-PM2.5 relationship is the key problem in satellite PM2.5 estimation at different scales. In the early stage, satellite AOD-PM2.5 relationship was constrained by aerosol components and meteorological data from the Chemistry Transport Model [8], with less dependence on ground sites. Then, with the availability of a regular ground network, many statistical models such as linear mixed effect model [9,10], geographically weighted regression [11,12], deep learning approach [13] and geographically and temporally weighted regression model [14,15] have been developed to predict PM2.5 concentrations on regional scales. These satellite-estimated PM2.5 usually show high consistency compared with collocated ground measurements.
However, the reliability and applicability of satellite AOD is subject to a variety of uncertainties from retrieval accuracy [16], frequency [17,18], spatial-temporal resolution [19], data record lengths and instrument calibration [20]. MODerate Resolution Imaging Spectroradiometer (MODIS) AOD products have been the most widely used satellite parameter in PM2.5 estimation due to its near daily global coverage. It should be stated that MODIS products include several aerosol algorithms with distinct capabilities in characterizing aerosol loading. Even for the operational MODIS Dark Target (DT) [20,21] and Deep Blue (DB) [22] algorithm, the retrieval frequency of DT AOD is only half of DB’s in eastern China [17], also with very different accuracy. In particular, recent MODIS Multi-Angle Implementation of Atmospheric Correction (MAIAC) algorithm with AOD retrieval at 1 km can capture numerous small pollution hotspots [19], which are missed by DB AOD at 10 km.
Although satellite PM2.5 values derived from different aerosol products all correspond well with their matched ground measurements [9,10,11,12,13,14,15], these predicted PM2.5 results along with satellite AOD are only available for partial of the year due to cloud cover and algorithm limitations. For heavily polluted regions such as northern China, PM2.5 concentrations show dramatic daily fluctuations and large seasonal differences [3,4,5]. Thus, whether satellite PM2.5 can capture the temporal variations and actual magnitude of PM2.5 in northern China can be obviously be impacted by the sampling frequency of satellite AOD. However, previous studies mainly focused on the influence of satellite AOD parameters such as spatial resolution on modeling of the AOD-PM2.5 relationship [23,24,25,26]. Even the several widely used MODIS aerosol products have remarkable differences in sampling frequency and spatial resolution [17,18,19]. It’s found that sampling frequency of MODIS AOD can lead to a considerable bias compared with mean values of continuous ground PM2.5 measurements [10,18]. However, the applicability of satellite PM2.5 in characterizing particle pollution in northern China has been rarely investigated until now.
Besides modeling the AOD-PM2.5 relationship, it’s critical to know whether the satellite aerosol dataset used can meet the requirement of PM2.5 exposure studies and associated uncertainties. In this study, we provide a comprehensive insight into the influence of satellite AOD products’ key parameters, spatial resolution and retrieval frequency on applicability of the widely used MODIS PM2.5 data in China. Section 2 mainly introduces the different MODIS aerosol products and PM2.5 estimation methods. The characterization of MODIS AOD from different retrieval algorithms is presented in Section 3.1. Then, the influence of the spatial resolution and retrieval frequency on applicability of the predicted PM2.5 values from MODIS AOD is analyzed in Section 3.2 and Section 3.3, respectively. The limitations and uncertainty of PM2.5 data estimated from MODIS AOD is discussed in Section 4. Section 5 briefly summarizes our work.
2. Data and Methods
2.1. Study area and Ground Sites
To make our study as representative as possible, we selected the most populated urban/industrial region, Beijing-Tianjin-Hebei (BTH) in eastern China, where cloud-free days are also the most frequent [15]. The BTH is the capital economic circle of China located in the North China Plain with serious air pollution problems. It covers about 218,000 square kilometers with a population of ~110 million including the megacities of Beijing, Tianjin and Shijiazhuang in Hebei Province. As shown in Figure 1, BTH is surrounded by the Taihang Mountains to the west, Yan Mountains to the north and the Bohai Sea to the east. The terrain of BTH is high in the northwest and low in the southeast, which is usually an adverse situation for the dispersion of atmospheric pollutants.
The Environmental Protection Agency of China publishes real-time hourly PM2.5 concentration for the major cities in China (http://106.37.208.233:20035/) with the same ambient quality-control standard since 2013. There are altogether 83 national monitoring sites in the BTH (Figure 1), which are mainly concentrated in large cities. Although these PM2.5 monitoring sites are sparse and located in urban areas, their distribution generally covers all the areas of the BTH.
2.2. MODIS AOD Datasets
The MODIS sensor onboard Terra and Aqua satellites have provided the most widely used aerosol products due to their near daily global coverage since 2000 and 2002, respectively. As shown in Table 1, there have been several MODIS AOD products, which are driven by increasing application requirements. The operational MODIS aerosol retrieval over land is firstly achieved over dense vegetation regions by a DT algorithm utilizing the spectral relationship in the surface reflectance between visible and shortwave infrared bands at 10 km spatial resolution [20]. Considering the wide applications of DT AOD in air pollution research, a 3 km DT aerosol dataset is added in Collection (C) 6 MODIS products with the same algorithm principle but finer resolution [21]. However, the DT aerosol retrieval is usually invalid for bright surfaces and under heavy pollution conditions (e.g., AOD>1.0) [17], where the spectral relationship diminishes or does not exist.
To fill the data gap of DT AOD, the MODIS DB algorithm was developed to retrieve aerosols over bright surfaces such as deserts and urban regions utilizing a pre-calculated surface reflectance database [22], and extends to all cloud-free and snow/ice-free areas from the C6 products. Ground validations show reliable accuracy of both C6 MODIS DT and DB AOD with most retrieval errors being better than ±(15%AODAERONET+0.05). By now, the current C6.1 MODIS DT and DB aerosol products have a similar algorithm principle as C6 with only some slight improvements. However, the performances of MODIS DT and DB aerosol retrievals show notable differences in eastern China [17], which is characterized by high aerosol loading and diverse emission sources.
Besides regular atmospheric aerosol products, the MODIS MAIAC algorithm can simultaneously retrieve aerosols and bidirectional surface reflectance by using multi-angle information from time series observations [27]. Moreover, with the multi-angle advantage, MAIAC aerosol retrieval is available over both dark and bright surfaces as DB. By gridding MODIS to a fixed 1 km grid, the recent C6 MODIS MAIAC algorithm has realized global aerosol retrieval at a high resolution of 1 km. MAIAC AOD shows very consistent distribution with MODIS DT and DB retrievals with much finer features [19].
In this study, C6.1 MODIS 10 km DT and DB, and C6 1 km MAIAC AOD are selected to estimate PM2.5 concentrations in the BTH region. Considering the lower retrieval frequency of 3 km DT AOD that 10 km [17,19], we only use the 10 km DT AOD dataset here. While utilized Level (L) 2 MODIS DT and DB AOD products have a spatial resolution of 10 km at nadir, L2 MAIAC AOD is gridded to fixed grids at 1 km resolution. To minimize the interference of AOD errors, only MODIS AOD with the best quality is selected. Despite the different spatial resolution, the mean value of satellite AOD in a window of 5×5 pixels is usually used to match up with ground monitoring site [11,12,13,14,15]. It’s found that the selection of window size has no obvious influence on ground validation of MAIAC AOD [20]. Thus, here we match daily averaged PM2.5 concentrations with mean value of MODIS AOD all in 5×5 pixels during the whole year of 2017. After screening out mean AOD values with few available pixels (<30%), there are 10,811 pairs of AODDT-PM2.5 matched values, 21,356 pairs for DB AOD and 16,547 pairs for MAIAC AOD in the BTH (83 sites), respectively.
2.3. Statistical Model and Validation
Satellite estimation of PM2.5 is used to obtain regional PM2.5 concentrations by modeling the relationship between satellite AOD and PM2.5 concentrations at ground sites. Sometimes, auxiliary data such as meteorological variables are also used to improve the accuracy of the AOD-PM2.5 relationship. A mixed effects model is chosen to estimate PM2.5 concentrations in the BTH, which has been widely used in other regions of the world [9,10,11]. This model can consider day-to-day changes of the AOD-PM2.5 relationship through calculating daily random intercepts and slopes of the AOD variable. Since our study focuses on evaluation of different satellite AOD products in PM2.5 prediction, other common variables such as meteorological fields, land use and populations information were not used in this model. The mixed effect model can be expressed by the following equation:
where PMij is the daily averaged PM2.5 concentration on day i at monitoring site j. The parameters α and μi are the fixed and random intercept of this model, respectively; β and νi are the fixed and random slope of AOD; AODij denotes MODIS AOD value at monitoring site j on day I; εij is the random error at site j on day i. The fixed slope and intercept of AOD denote averaged effects on PM2.5, and the random components represent daily variability of AOD-PM2.5 relationship.
We use 10-fold cross validation (CV) method to evaluate performance of the mixed effect model. Firstly, ground PM2.5 measurements in the 83 sites of BTH are randomly divided into ten subsets. One of them is selected at random as the test set, and the remaining sets are used to train the AOD-PM2.5 statistical model. Then, the predicted PM2.5 is validated by the test set. This process is repeated until all the sets are used as test set once. Some statistical indicators such as the root mean square error (RMSE) and coefficient of determination (R2) are used to assess reliability of the predicted results. The RMSE is calculated as follow equation:
3. Results and Analysis
3.1. Descriptive Statistics
Table 2 shows descriptive statistics of the dependent variables in our PM2.5 predication. The annual mean, maximum (max), minimum (min) and standard deviation (Std. Dev.) of PM2.5 concentration in the 83 sites that matches with MODIS AOD are compared. PM2.5 and AOD Days denote the number of days when PM2.5 (>5 sites) and AOD observations both have values. Since clouds usually only cover a partial region in northern China [19], there are more than 300 days with available daily matchups in establishing AOD-PM2.5 relationships for all the three MODIS AOD datasets. The annual mean of AOD-matched PM2.5 concentration for DT is much lower than that for MAIAC and DB, with a smaller standard deviation. Also, the AODDT-PM2.5 matched days are obviously fewer, which can be associated with lower frequency of DT AOD [17]. The smaller Max values of AODDT-matched PM2.5 could miss extreme pollution events. By contrast, the standard deviation of DB AOD (0.66) is obviously higher than that of MAIAC and DT AOD, demonstrating larger variability of DB AOD values.
To have a direct view of the spatial pattern of aerosol loading in the BTH region, annual mean values of MAIAC, DB and DT AOD during 2017 are shown and inter-compared (Figure 2). It’s worth noting that MAIAC 1 km AOD shows much finer features than DB and DT. Despite their good performance in their respective ground validation [19], the three MODIS AODs from different retrieval algorithms exhibit distinct spatial distributions. The annul mean of MAIAC AOD is much lower than that of DB and DT. Although inter-comparison of MAIAC, DB and DT AOD is consistent in case events [19], the retrieval frequencies of satellite AOD can be very different due to their differences in cloud screening and algorithm applicability to bright surfaces and heavy pollution conditions, which can be the main cause of their distinct mean values. Additionally, the abnormal high values of MODIS DT AOD along the Bohai Sea can be caused by retrieval errors.
The retrieval frequency of satellite AOD determines the number of matchups available for modeling the AOD-PM2.5 relationship. In particular, large daily fluctuations and high-AOD values are prevalent in northern China [5]. It’s found that PM2.5 estimation with C6 MODIS 3 km DT AOD obviously underestimates the annual PM2.5 concentration in Beijing due to missing AOD on frequently polluted days [17]. Figure 3 displays the retrieval frequency of the three MODIS AOD products in the BTH during 2017. While the annual frequencies of MAIAC and DB AOD generally have a similar distribution, notable differences still exist in the detailed scales. The frequency of MAIAC AOD is a little lower than DB’s. It’s striking that frequency of DT AOD is much lower (~80 days) than that of MAIAC and DB (~160-200 days), especially in the urban regions. There are very few DT retrievals in Tianjin close to the Bohai Sea, which may lead to a poor representativity for annual AOD. It’s necessary to examine how these substantial differences among the three MODIS aerosol products influence PM2.5 predictions.
The different accuracies of satellite AODs can also contribute to their discrepancy in modeling the AOD-PM2.5 relationship. Despite substantial differences in retrieval frequency and error patterns, MODIS AODs from MAIAC, DB, and DT algorithms have similar accuracies in ground validation [16,17]. Figure 4 displays an inter-comparison of MODIS MAIAC, DB, and DT AOD on April, 29, 2017, a typical cloud-free day without extreme pollution events. It can be seen that variations of the three MODIS AODs exhibit very consistent spatial trends. MAIAC AOD is slightly higher than DB and DT, especially in some small hotspots. Spatial average of retrieved 500 m or 1 km pixels into 10 km AOD of DB and DT can smooth high-resolution hotspots as in MAIAC retrievals [19]. Compared with the well spatial coverage of MAIAC and DB, DT AOD has much fewer values in bright surfaces such as the northwestern part. In the other hand, the statistical modeling process of AOD-PM2.5 relationship can narrow the discrepancy in absolute accuracies of these MODIS AOD datasets.
3.2. Model Fitting and PM2.5 Prediction with Different MODIS AOD Products
The fixed intercept and slope of linear mixed effects model are shown in Table 3. All of the slopes are positive and the results are statistically significant (P-Value < 0.0001), indicating that MODIS AOD have a positive relationship with PM2.5 in the BTH region. Figure 5 gives PM2.5 model fitting results for the three MODIS AOD products. Their coefficient of determination (R2) is similar and relatively high (MAIAC: 0.78, DB: 0.8, DT: 0.78), while their RMSEs have large difference. The RMSE of DT-derived PM2.5 (14.55 μg/m3) is about 7 μg/m3 and 6.5 μg/m3 lower than that of MAIAC and DB results, respectively. The lower RMSE of DT-derived PM2.5 can be caused by missing AOD in heavy pollution conditions [17]. Corresponding to the range of 200-500 μg/m3 for ground PM2.5, there are some notable abnormal predicted values that seems have no correlation with actual PM2.5 concentration. Such poor prediction only account for a very small fraction, and can be caused by special conditions such as extreme contrast with high AOD but low PM2.5 in some days.
As shown in the CV (Figure 6), the R2 decreased 0.03, 0.02 and 0.02, and RMSE increased 1.38 μg/m3, 0.77 μg/m3 and 0.86μg/m3 for MAIAC, DB and DT, respectively. Although we only use one dependent variable of AOD for PM2.5 predication, our CV R2 and RMSE are close with or even better than that of previous studies. For example, our CV R2 is higher than 0.72 from a two-stage statistical model in the BTH [28] and 0.73 from a random forest model in South Korea [29], but is lower than 0.84 in an improved geographically and temporally weighted regression (iGTWR) model [15]. The very similar CV results show robust performance of our selected mixed effects model in PM2.5 estimation.
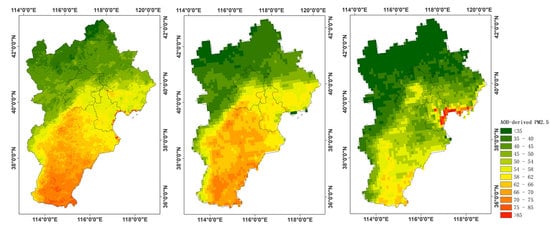
Figure 7 shows the annual mean PM2.5 concentration derived from MAIAC (1 km), DB (10 km) and DT (10 km) AOD in the BTH during 2017. Unlike the large difference in MODIS AOD, the MAIAC- and DB-derived PM2.5 concentrations have similar spatial pattern, and ranges in 60-80 μg/m3 in most parts of the BTH except the mountain areas, which is highly consistent with the ground measurements.
Owing to the continuous emission control measures of the Chinese government, there has been a large decrease in PM2.5 concentration in Beijing and surrounding areas, and the PM2.5 hotspots have moved to southern Hebei. By contrast, DT PM2.5 is only concentrated in ~40-60 μg/m3, much lower (~20 μg/m3) than MAIAC and DB PM2.5. Although there is a high R2 in AODDT-PM2.5 relationship, the low retrieval frequency and missing retrievals in most heavy pollution can largely limit the representativity of DT AOD in predicting annual mean PM2.5 [17].
Despite the similar distribution of MAIAC- and DB-derived PM2.5, considerable differences are obvious in their PM2.5 concentration magnitude in most areas. First, the high-resolution MAIAC PM2.5 at 1 km captures much finer features and reveals numerous small pollution hotspots. The high-level PM2.5 concentration (>80 μg/m3) in southern Hebei can be clearly detected in the MAIAC estimation. The DB PM2.5 smooths out such small PM2.5 hotspots due to the coarser resolution of 10 km. Second, the lower frequency of MAIAC AOD can also contribute to the difference. The over-strict cloud screening of the high-resolution MAIAC retrievals tends to filter out available values near clouds [16], leading to large differences in the annual mean of MAIAC and DB AOD. Compared with the large spatial difference of annual MAIAC and DB AOD, it can be seen that annual mean of their predicted PM2.5 values has much smaller discrepancy after the AOD-PM2.5 modeling process. However, the mismatch between MAIAC and DB retrieval can be the biggest challenge in the consistency of PM2.5 predictions from different aerosol products. In addition, the high PM2.5 concentration around the Bohai Sea is in the location of abnormal values of MAIAC and DT AOD, which cannot be smoothed by annual averaging due to the low retrieval frequency.
3.3. Inlfuence of MODIS AOD Selection on PM2.5 Predication
The coefficient of determination and RMSE in this study suggests that all the three satellite AOD have a close correlation with PM2.5 concentrations in their available time by statistical modeling. However, besides marked differences in PM2.5 derived from various MODIS AOD products, whether satellite estimation can represent actual PM2.5 variation suffers from the influence of several factors. Figure 8 displays the annual mean of PM2.5 from all the ground measurements and those in the day matched with available MODIS MAIAC, DB, and DT AOD, respectively, in the 83 monitoring sites of the BTH.
It’s found that observation with frequency of MAIAC and DB AOD can generally represent well the annual mean of PM2.5. The differences in annual mean of PM2.5 between all observations and MAIAC or DB matched observation is <5 μg/m3 in most sites. However, there is a poor temporal representativity for annual PM2.5 matched with DT AOD, about >15 μg/m3 lower than the total mean. It should be noted that annual mean of all the MODIS-matched PM2.5 data has little differences with the total mean when the total mean of PM2.5 concentration is <50 μg/m3. Gupta [30] found that the low sampling frequency of satellite AOD has minor impact on monthly and annual PM2.5 prediction over southeastern United States, where the annual mean of PM2.5 is at a low concentration (<40 μg/m3). PM2.5 in the mountainous areas of northern BTH is lower than 40 μg/m3, which is rarely influenced by regional transport and extreme high values. Thus, satellite PM2.5 predictions in these relatively clean areas in northern China are less influenced by the retrieval frequency of AOD.
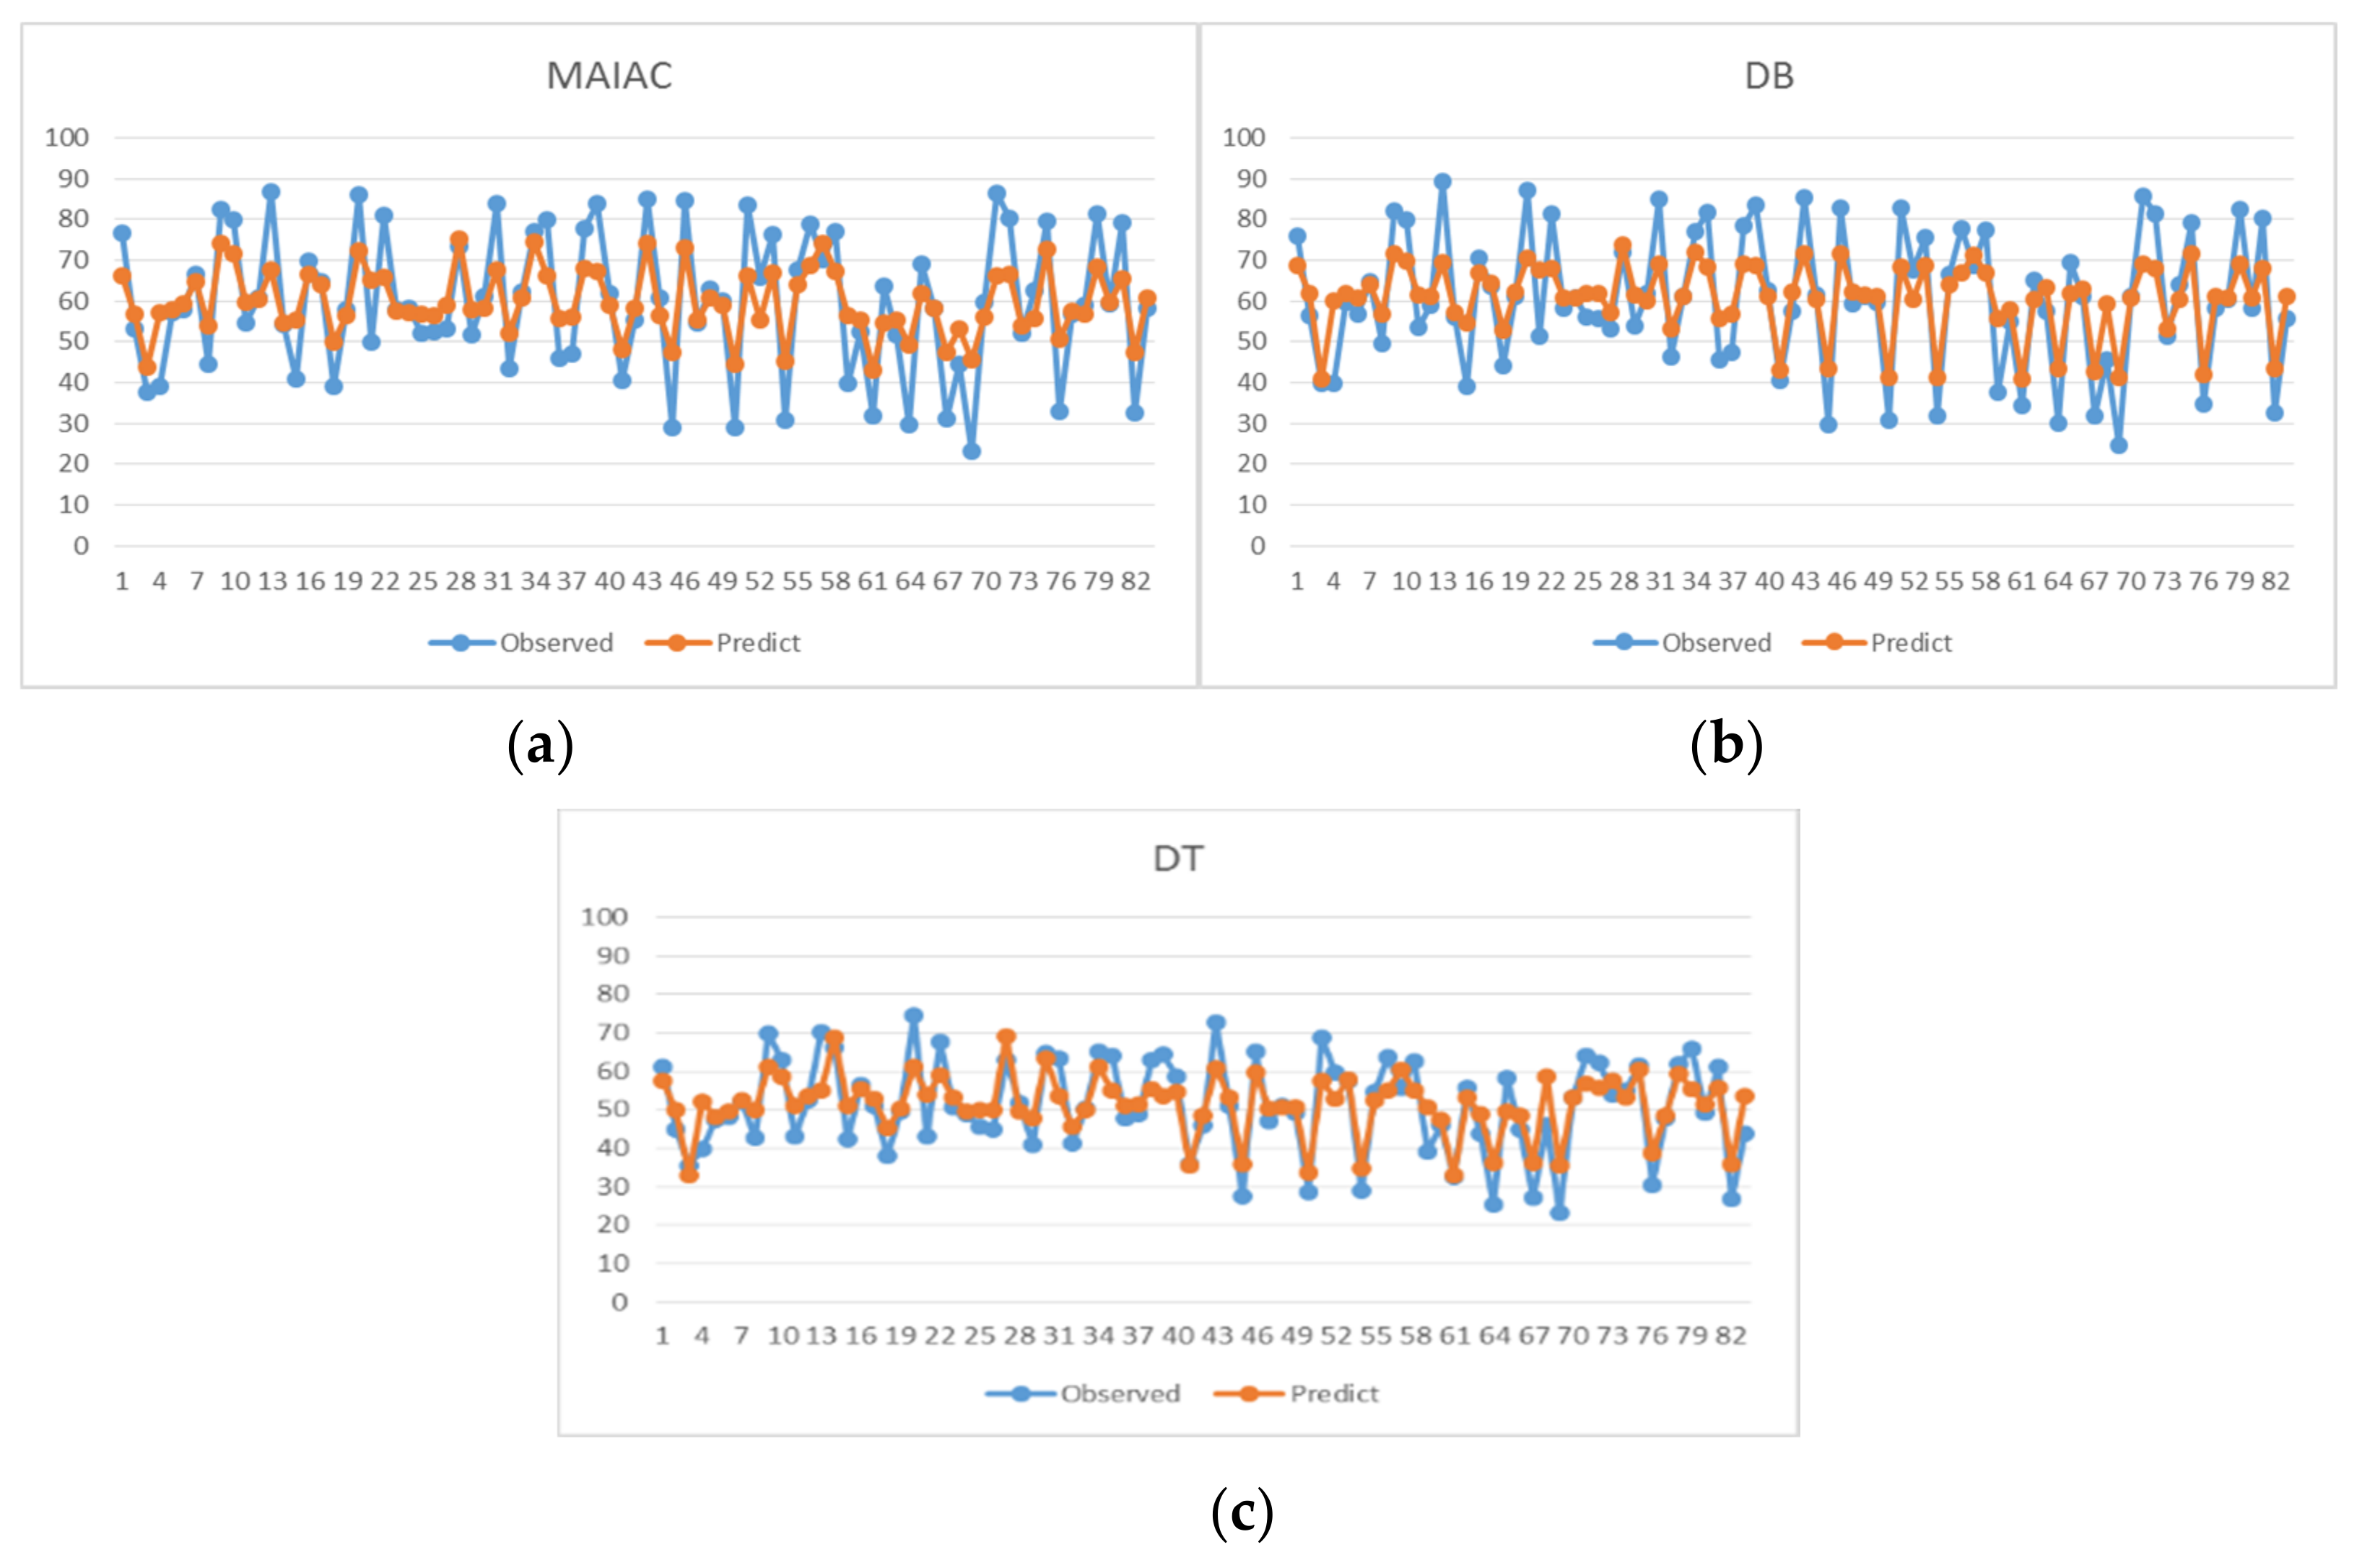
Site-by-site comparison of annual PM.5 values from satellite predictions and matched ground observations shows concrete variations of their estimation bias at different pollution levels (Figure 9). Notable overestimation and underestimation by ~5-15 μg/m3 for both MAIAC and DB PM2.5 exist in nearly half of the 83 sites. The overestimation of MAIAC is more serious than that of DB. Considering the slight influence of temporal resolution for MAIAC and DB, a higher MAIAC AOD can be the main cause. By contrast, the difference between DT PM2.5 and matched ground observations is much smaller, which can be largely due to lower frequency of high AOD (>1.0) in available DT retrievals [17]. In general, all three MODIS-derived PM2.5 results tend to overestimate at low PM2.5 sites (< ~50 μg/m3) and underestimate for high PM2.5 sites (> ~50 μg/m3).
It can be seen that the mean and median values of predicted annual PM2.5 are nearly all equal to those of their matched observations for MAIAC, DB, and DT (Table 4). While the offset of contrary deviation in low and high PM2.5 sites leads to very reliable mean values for predicted PM2.5, considerable bias (> ~10 μg/m3) exists for MODIS estimation in low and high PM2.5 levels. Consistent with Figure 8, the large differences in magnitude of mean and maximum for the three MODIS PM2.5 datasets further demonstrate the great influence of retrieval frequency of satellite AOD for PM2.5 prediction in polluted regions.
4. Discussion
Based on statistical modeling with sufficient observations from a ground network, a close AOD-PM2.5 relationship is obtained for all the three categories of MODIS aerosol products. Despite the apparent reliability, several remarkable uncertainties exist in meeting the requirements of actual application. The first challenge of satellite PM2.5 prediction is the retrieval frequency of AOD. It has shown that annual PM2.5 concentration in northern China can be well represented when the observation frequency exceeds one third of the year (Figure 8). For cleaner areas with smaller temporal variability in PM2.5 concentration, required AOD frequency in predicting representative annual mean of satellite PM2.5 can be lower. However, the representativity of satellite PM2.5 can be a problem in polluted or cloudy regions for aerosol algorithms such as DT, where the retrieval frequency cannot reflect the actual variability [16]. Despite the similar retrieval frequency, PM2.5 prediction with various satellite aerosol products can still have considerable differences since part of their retrievals are not matched due to different cloud screening methods (Figure 3 and Figure 7). The mismatch of DB and MAIAC AOD in northern China leads to notable differences in their annual mean values because they capture different pollution events.
Compared with the remarkable influence of sampling frequency, the difference in spatial resolution mainly impacts the consistence of MODIS PM2.5 results in detailed scales (Figure 7), which is important for exposure assessment on a regional scale such as the BTH. Most previous studies focus on influence of spatial resolution on AOD-PM2.5 relationship [23,24,25,26]. It is found that correlation of AOD-PM2.5 gets slightly higher for high-resolution PM2.5 estimation in the megacity of Beijing in northern China [31], but is not obvious on a regional scale (Figure 5 and Figure 6). The AOD-PM2.5 relationship can be more complicated on a large scale with inhomogeneous emission sources and meteorological conditions, which should utilize more related variables to constrain it. In addition, the applicability of satellite PM2.5 in regions with few ground sites still needs further examination.
The main purpose of this study was to provide an examination of the applicability of the widely used MODIS aerosol datasets in PM2.5 prediction in northern China. Besides selecting appropriate satellite data, as shown in Figure 9, PM2.5 predications suffer from considerable uncertainties in low and high pollution conditions, which need more constraints on the AOD-PM2.5 relationship with an improved model and extra information. Over the past few years, there have been a growing number of new satellite instruments such as Himawari-8 and GOES-16 that can provide hourly AOD during the daytime. The multiple satellite aerosol products can greatly enhance the spatial and temporal coverage of predicted PM2.5. To obtain consistent and reliable PM2.5 datasets, several uncertainties in their applicability should be considered besides the usual model accuracy, including the difference in spatial-temporal resolution, cloud screening, and retrieval errors.
5. Conclusions
Satellite AOD products have been widely used in estimating PM2.5 concentrations near the surface. Although statistical models can establish robust AOD-PM2.5 relationships, whether these AOD-matched PM2.5 can represent the truth remains subject to several uncertainties such as retrieval frequency and algorithm performance. Based on MODIS aerosol products from three typical algorithms including MAIAC, DB and DT, we provide a comprehensive insight into the influence of spatial resolution and retrieval frequency on the applicability of satellite predicted PM2.5 data in northern China. Based on satellite AOD and ground PM2.5 observations at 83 sites, we estimated daily PM2.5 in the BTH region of northern China during 2017 with a mixed effects model. It’s found that all three categories of MODIS AOD can predict PM2.5 with high CV R2 values ranging between 0.75~0.78.
However, annual PM2.5 data derived from MODIS MAIAC, DB and DT AOD exhibit distinct spatial patterns. The DT PM2.5 is much lower than the MAIAC and DB predictions due to the fewer available AOD retrievals, especially for heavy pollution events. By comparison, ground observed PM2.5 matched with MAIAC and DB AOD can both represent well the annual PM2.5 in almost all of the 83 sites. MAIAC and DB PM2.5 show a similar accuracy level but exhibit notable spatial differences. The different cloud screening methods of MAIAC and DB lead to partial mismatch of their AOD values. The high-resolution MAIAC PM2.5 at 1 km can capture much finer hotspots, which is significant for air pollution monitoring on a city scale. It should be stated that the absolute error between MAIAC and DB PM2.5 and matched observations is larger than that of DT, indicating that the inhomogeneous distribution of aerosol properties has a considerable influence on daily AOD-PM2.5 relationship.
Generally, MAIAC AOD is most suitable for PM2.5 prediction for both adequate retrieval frequency and high spatial resolution. DB PM2.5 has a slightly lower bias than MAIAC PM2.5, but with much coarser resolution. Owning to the low retrieval frequency, DT PM2.5 cannot reflect the actual PM2.5 level in eastern China. In addition, the consistency of PM2.5 concentrations derived from different satellite products still faces some uncertainties, which need further study. Our results can however provide a reference for the application and estimation of satellite-predicted PM2.5 concentrations at regional scales.
Author Contributions
Conceptualization, R.L. and L.C.; methodology, Z.W.; software, L.W.; validation, Y.J.; formal analysis, R.L.; investigation, R.L.; resources, X.M.; data curation, L.W.; writing—original draft preparation, R.L.; writing—review and editing, R.L. and L.C; visualization, R.L.; supervision, X.M.; project administration, R.L.; funding acquisition, X.M. All authors have read and agreed to the published version of the manuscript.
Funding
This research was funded by the National Key R&D Program of China (Grant No. 2017YFB0503901) and the National Natural Science Foundation of China (Grant No.41601472, 41830109).
Acknowledgments
We appreciate MODIS DT, DB, and MAIAC team for the aerosol products used.
Conflicts of Interest
The authors declare no conflict of interest.
References
- Peters, A.; Dockery, D.; Muller, J.E.; Mittleman, M.A. Increased particulate air pollution and the triggering of myocardial infarction. Circulation 2001, 103, 2810–2815. [Google Scholar] [CrossRef] [Green Version]
- Iii, C.A.P.; Burnett, R.T.; Thun, M.J.; Calle, E.E.; Krewski, D.; Ito, K.; Thurston, G.D.; Pope, C.A. Lung Cancer, Cardiopulmonary Mortality, and Long-term Exposure to Fine Particulate Air Pollution. JAMA 2002, 287, 1132–1141. [Google Scholar]
- Tao, M.; Chen, L.; Su, L.; Tao, J. Satellite observation of regional haze pollution over the North China Plain. J. Geophys. Res. Space Phys. 2012, 117, 12203. [Google Scholar] [CrossRef]
- Tao, M.; Chen, L.; Xiong, X.; Zhang, M.; Ma, P.; Tao, J.; Wang, Z. Formation process of the widespread extreme haze pollution over northern China in January 2013: Implications for regional air quality and climate. Atmospheric Environ. 2014, 98, 417–425. [Google Scholar] [CrossRef]
- Tao, M.; Chen, L.; Li, R.; Wang, L.; Wang, J.; Wang, Z.; Tang, G.; Tao, J. Spatial oscillation of the particle pollution in eastern China during winter: Implications for regional air quality and climate. Atmospheric Environ. 2016, 144, 100–110. [Google Scholar] [CrossRef] [Green Version]
- Hoff, R.M.; Christopher, S.A.; Hidy, G.; Sharma, P.; Poulsen, T.; Kalluri, P.; Hoff, S.; Bundy, D.; Nelson, M.; Zelle, B.; et al. Remote Sensing of Particulate Pollution from Space: Have We Reached the Promised Land? J. Air Waste Manag. Assoc. 2009, 59, 645–675. [Google Scholar] [CrossRef] [PubMed]
- Wang, J.; Christopher, S.A. Intercomparison between satellite-derived aerosol optical thickness and PM2.5 mass: Implications for air quality studies. Geophys. Res. Lett. 2003, 30. [Google Scholar] [CrossRef]
- Van Donkelaar, A.; Martin, R.V.; Brauer, M.; Kahn, R.; Levy, R.; Verduzco, C.; Villeneuve, P.J. Global Estimates of Ambient Fine Particulate Matter Concentrations from Satellite-Based Aerosol Optical Depth: Development and Application. Environ. Heal. Perspect. 2010, 118, 847–855. [Google Scholar] [CrossRef] [Green Version]
- Lee, H.J.; Liu, Y. B.; Coull, A.; Schwartz, J.; Koutrakis, P. A novel calibration approach of MODIS AOD data to predict PM2.5 concentrations. Atmos. Chem. Phys. 2011, 11, 7991–8002. [Google Scholar] [CrossRef] [Green Version]
- Li, R. Estimating Ground-Level PM2.5 Using Fine-Resolution Satellite Data in the Megacity of Beijing, China. Aerosol Air Qual. Res. 2015, 15, 1347–1356. [Google Scholar] [CrossRef] [Green Version]
- Hu, X.; Waller, L.A.; Al-Hamdan, M.Z.; Crosson, W.L., Jr.; Estes, S.M.; Quattrochi, D.; Sarnat, J.A.; Liu, Y. Estimating ground-level PM2.5 concentrations in the southeastern U.S. using geographically weighted regression. Environ. Res. 2013, 121, 1–10. [Google Scholar] [CrossRef] [PubMed]
- You, W.; Zang, Z.; Zhang, L.; Li, Y.; Pan, X.; Wang, W. National-Scale Estimates of Ground-Level PM2.5 Concentration in China Using Geographically Weighted Regression Based on 3 km Resolution MODIS AOD. Remote. Sens. 2016, 8, 184. [Google Scholar] [CrossRef] [Green Version]
- Li, T.; Shen, H.; Yuan, Q.; Zhang, X.; Zhang, L. Estimating Ground-Level PM2.5by Fusing Satellite and Station Observations: A Geo-Intelligent Deep Learning Approach. Geophys. Res. Lett. 2017, 44, 11985–11993. [Google Scholar] [CrossRef] [Green Version]
- Guo, Y.; Tang, Q.; Gong, D.; Zhang, Z. Estimating ground-level PM2.5 concentrations in Beijing using a satellite-based geographically and temporally weighted regression model. Remote. Sens. Environ. 2017, 198, 140–149. [Google Scholar] [CrossRef]
- He, Q.; Huang, B. Satellite-based high-resolution PM2.5 estimation over the Beijing-Tianjin-Hebei region of China using an improved geographically and temporally weighted regression model. Environ. Pollut. 2018, 236, 1027–1037. [Google Scholar] [CrossRef]
- Tao, M.; Wang, Z.; Tao, J.; Chen, L.; Wang, J.; Hou, C.; Wang, L.; Xu, X.; Zhu, H. How Do Aerosol Properties Affect the Temporal Variation of MODIS AOD Bias in Eastern China? Remote. Sens. 2017, 9, 800. [Google Scholar] [CrossRef] [Green Version]
- Tao, M.; Chen, L.; Wang, Z.; Tao, J.; Che, H.; Wang, X.; Wang, Y. Comparison and evaluation of the MODIS Collection 6 aerosol data in China. J. Geophys. Res. Atmos. 2015, 120, 6992–7005. [Google Scholar] [CrossRef]
- Song, Z.; Fu, D.; Zhang, X.; Han, X.; Song, J.; Zhang, J.; Wang, J.; Xia, X. MODIS AOD sampling rate and its effect on PM2.5 estimation in North China. Atmospheric Environ. 2019, 209, 14–22. [Google Scholar] [CrossRef]
- Tao, M.; Wang, J.; Li, R.; Wang, L.; Wang, L.; Wang, Z.; Tao, J.; Che, H.; Chen, L. Performance of MODIS high-resolution MAIAC aerosol algorithm in China: Characterization and limitation. Atmospheric Environ. 2019, 213, 159–169. [Google Scholar] [CrossRef]
- Levy, R.C.; Mattoo, S.; Munchak, L.A.; Remer, L. A.; Sayer, A.M.; Patadia, F.; Hsu, N.C. The Collection 6 MODIS aerosol products over land and ocean. Atmos. Meas. Tech. 2013, 6, 2989–3034. [Google Scholar] [CrossRef] [Green Version]
- Remer, L.A.; Mattoo, S.; Levy, R.; Munchak, L.A. MODIS 3 km aerosol product: algorithm and global perspective. Atmospheric Meas. Tech. 2013, 6, 1829–1844. [Google Scholar] [CrossRef] [Green Version]
- Hsu, N.C.; Jeong, M.-J.; Bettenhausen, C.; Sayer, A.; Hansell, R.; Seftor, C.S.; Huang, J.; Tsay, S.-C. Enhanced Deep Blue aerosol retrieval algorithm: The second generation. J. Geophys. Res. Atmos. 2013, 118, 9296–9315. [Google Scholar] [CrossRef]
- Chudnovsky, A.A.; Kostinski, A.; Lyapustin, A.; Koutrakis, P. Spatial scales of pollution from variable resolution satellite imaging. Environ. Pollut. 2013, 172, 131–138. [Google Scholar] [CrossRef] [PubMed]
- Chudnovsky, A.; Tang, C.; Lyapustin, A.; Wang, Y.; Schwartz, J.; Koutrakis, P. A critical assessment of high-resolution aerosol optical depth retrievals for fine particulate matter predictions. Atmospheric Chem. Phys. Discuss. 2013, 13, 10907–10917. [Google Scholar] [CrossRef] [Green Version]
- Wu, J.; Liang, J.; Zhou, L.; Yao, F.; Peng, J. Impacts of AOD Correction and Spatial Scale on the Correlation between High-Resolution AOD from Gaofen-1 Satellite and In Situ PM2.5 Measurements in Shenzhen City, China. Remote. Sens. 2019, 11, 2223. [Google Scholar] [CrossRef] [Green Version]
- Mei, L.; Strandgren, J.; Rozanov, V.; Vountas, M.; Burrows, J.P.; Wang, Y. A study of the impact of spatial resolution on the estimation of particle matter concentration from the aerosol optical depth retrieved from satellite observations. Int. J. Remote. Sens. 2019, 40, 7084–7112. [Google Scholar] [CrossRef]
- Lyapustin, A.; Wang, Y.; Korkin, S.; Huang, N. MODIS Collection 6 MAIAC algorithm. Atmospheric Meas. Tech. 2018, 11, 5741–5765. [Google Scholar] [CrossRef] [Green Version]
- Wu, J.; Yao, F.; Li, W.; Si, M. VIIRS-based remote sensing estimation of ground-level PM2.5 cocentrations in Beijing-Tianjin-Hebei: a spatiotemporal statistical model. Remote Sens. Environ. 2016, 184, 316–328. [Google Scholar] [CrossRef]
- Park, S.; Shin, M.; Im, J.; Song, C.-K.; Choi, M.; Kim, J.; Lee, S.; Park, R.; Kim, J.; Lee, N.-W.; et al. Estimation of ground-level particulate matter concentrations through the synergistic use of satellite observations and process-based models over South Korea. Atmospheric Chem. Phys. Discuss. 2019, 19, 1097–1113. [Google Scholar] [CrossRef] [Green Version]
- Gupta, P.; Christopher, S.A. An evaluation of Terra-MODIS sampling for monthly and annual particulate matter air quality assessment over the Southeastern United States. Atmospheric Environ. 2008, 42, 6465–6471. [Google Scholar] [CrossRef]
- Xie, Y.; Wang, Y.; Bilal, M.; Dong, W. Mapping daily PM2.5 at 500 m resolution over Beijing with improved hazy day performance. Sci. Total Environ. 2019, 659, 410–418. [Google Scholar] [CrossRef] [PubMed]
Figure 1.
Spatial distribution of the 83 PM2.5 monitoring sites in Beijing-Tianjin-Hebei (BTH) region. DEM denotes Digital Elevation Model.
Figure 1.
Spatial distribution of the 83 PM2.5 monitoring sites in Beijing-Tianjin-Hebei (BTH) region. DEM denotes Digital Elevation Model.

Figure 2.
Annul mean of MAIAC (a), DB (b) and DT (c) AOD data in BTH during 2017.

Figure 3.
Observed frequencies of MAIAC (a), DB (b) and DT (c) AOD data in BTH during 2017.

Figure 4.
MODIS MAIAC (a), DB (b) and DT (c) AOD in northern China during Aril 29, 2017.
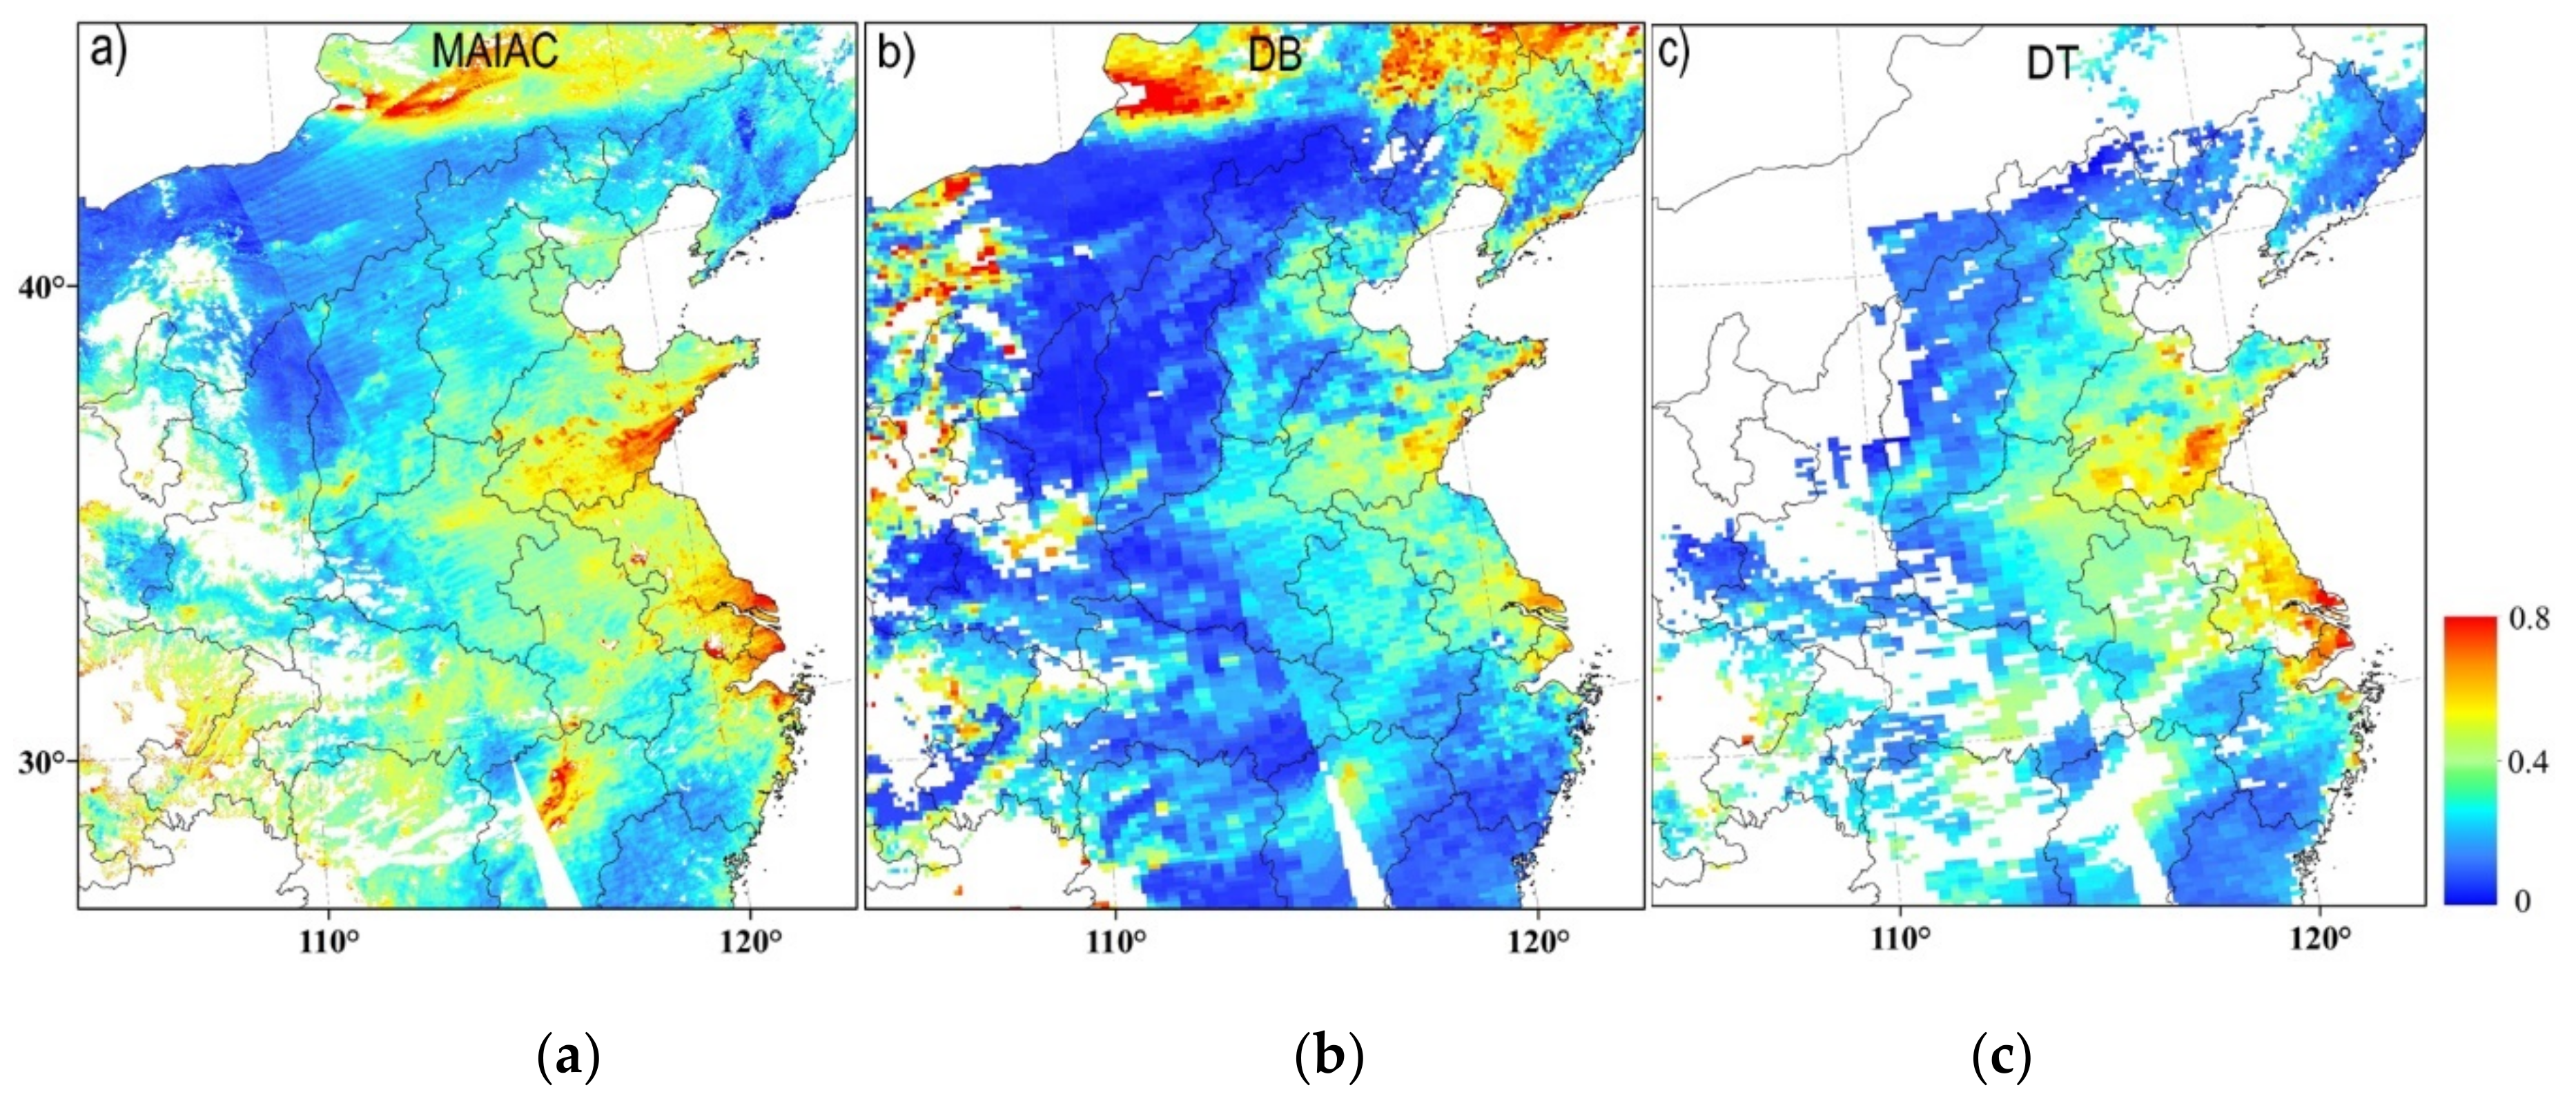
Figure 5.
Predicted PM2.5 vs Observed PM2.5 for model fitting from MAIAC (a), DB (b) and DT(c) AOD.
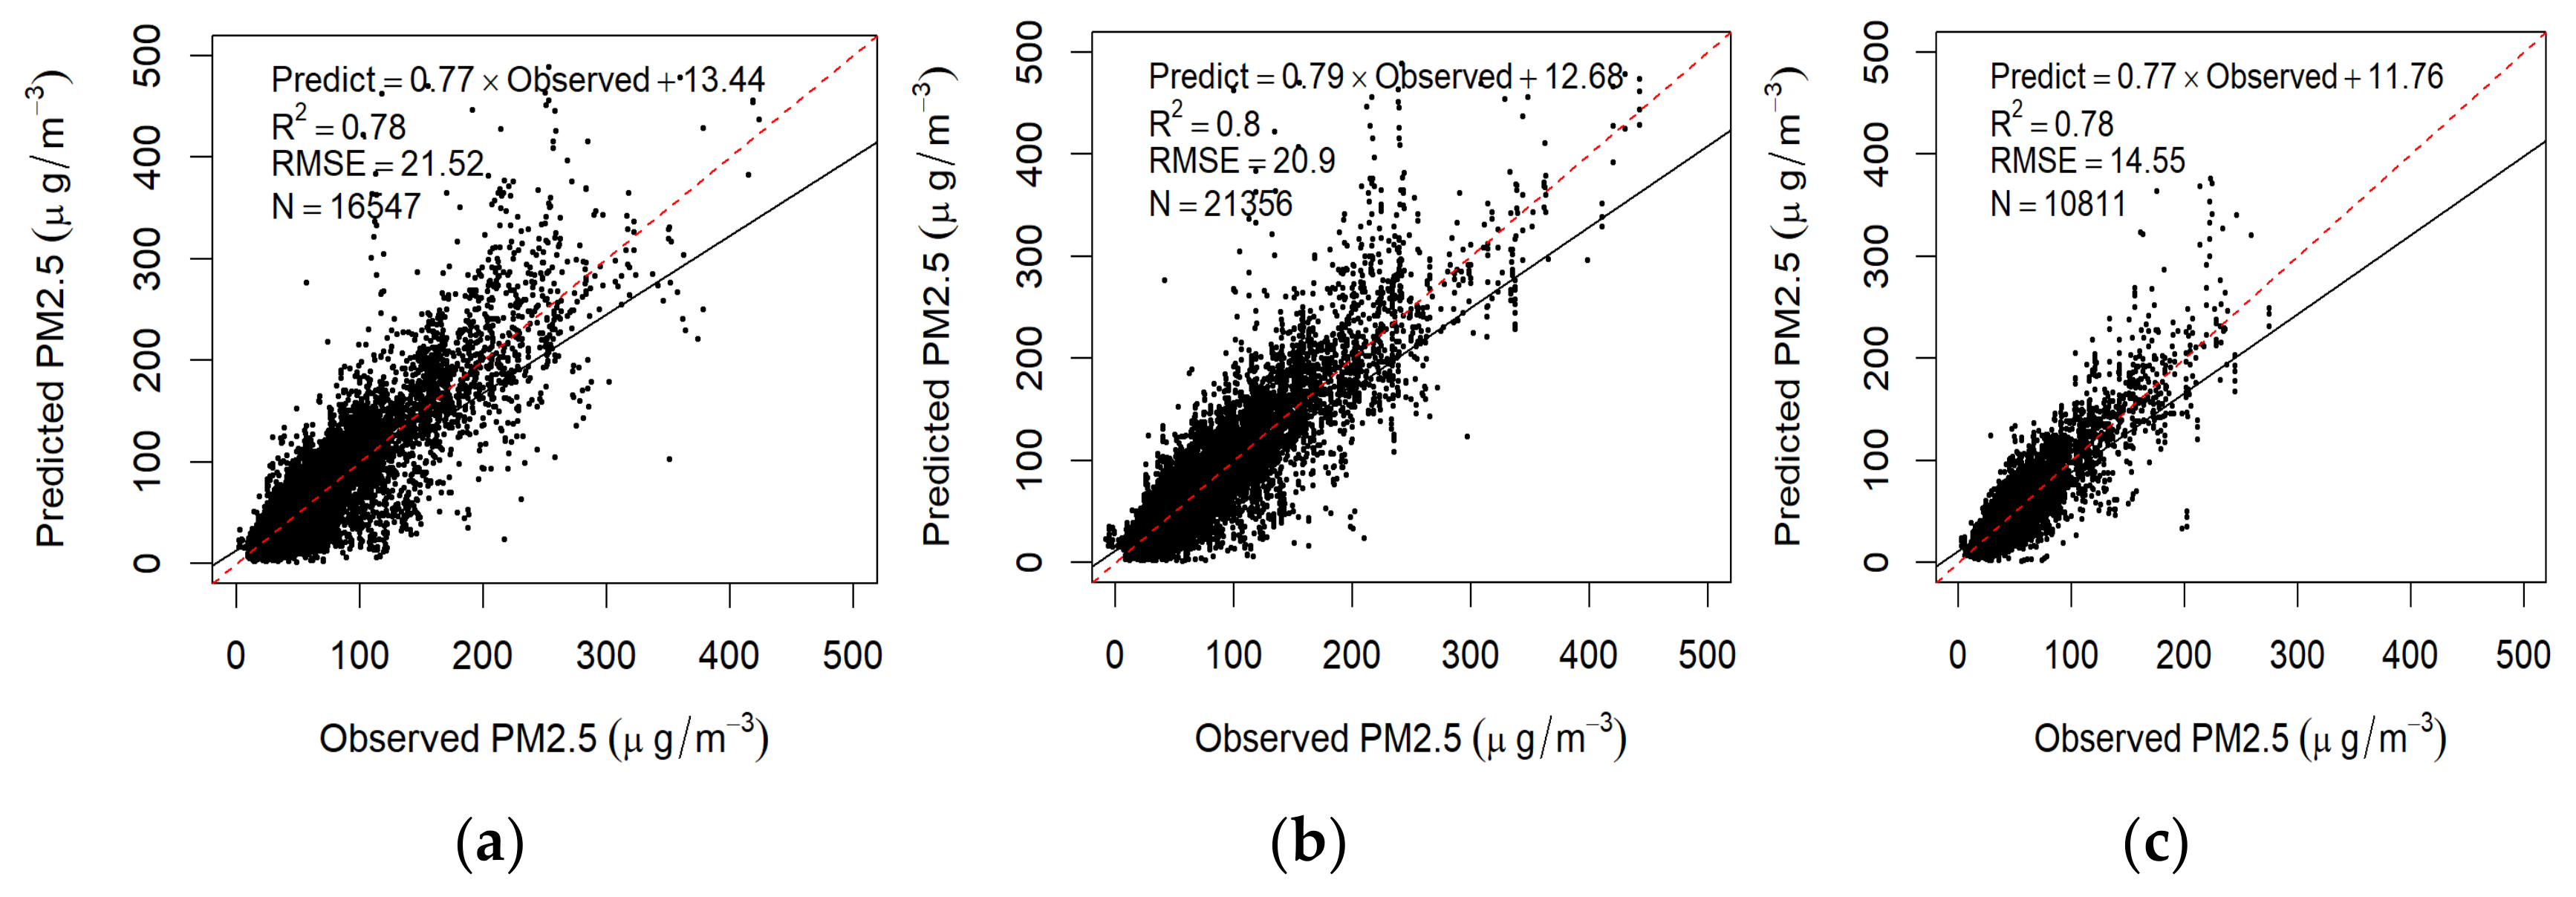
Figure 6.
Predicted vs Observed PM2.5 for cross validation from MAIAC (a), DB (b) and DT(c) AOD.

Figure 7.
The annual mean satellite predicted PM2.5 in the BTH during 2017 from (a) MAIAC, (b) DB, and (c) DT AOD.
Figure 7.
The annual mean satellite predicted PM2.5 in the BTH during 2017 from (a) MAIAC, (b) DB, and (c) DT AOD.
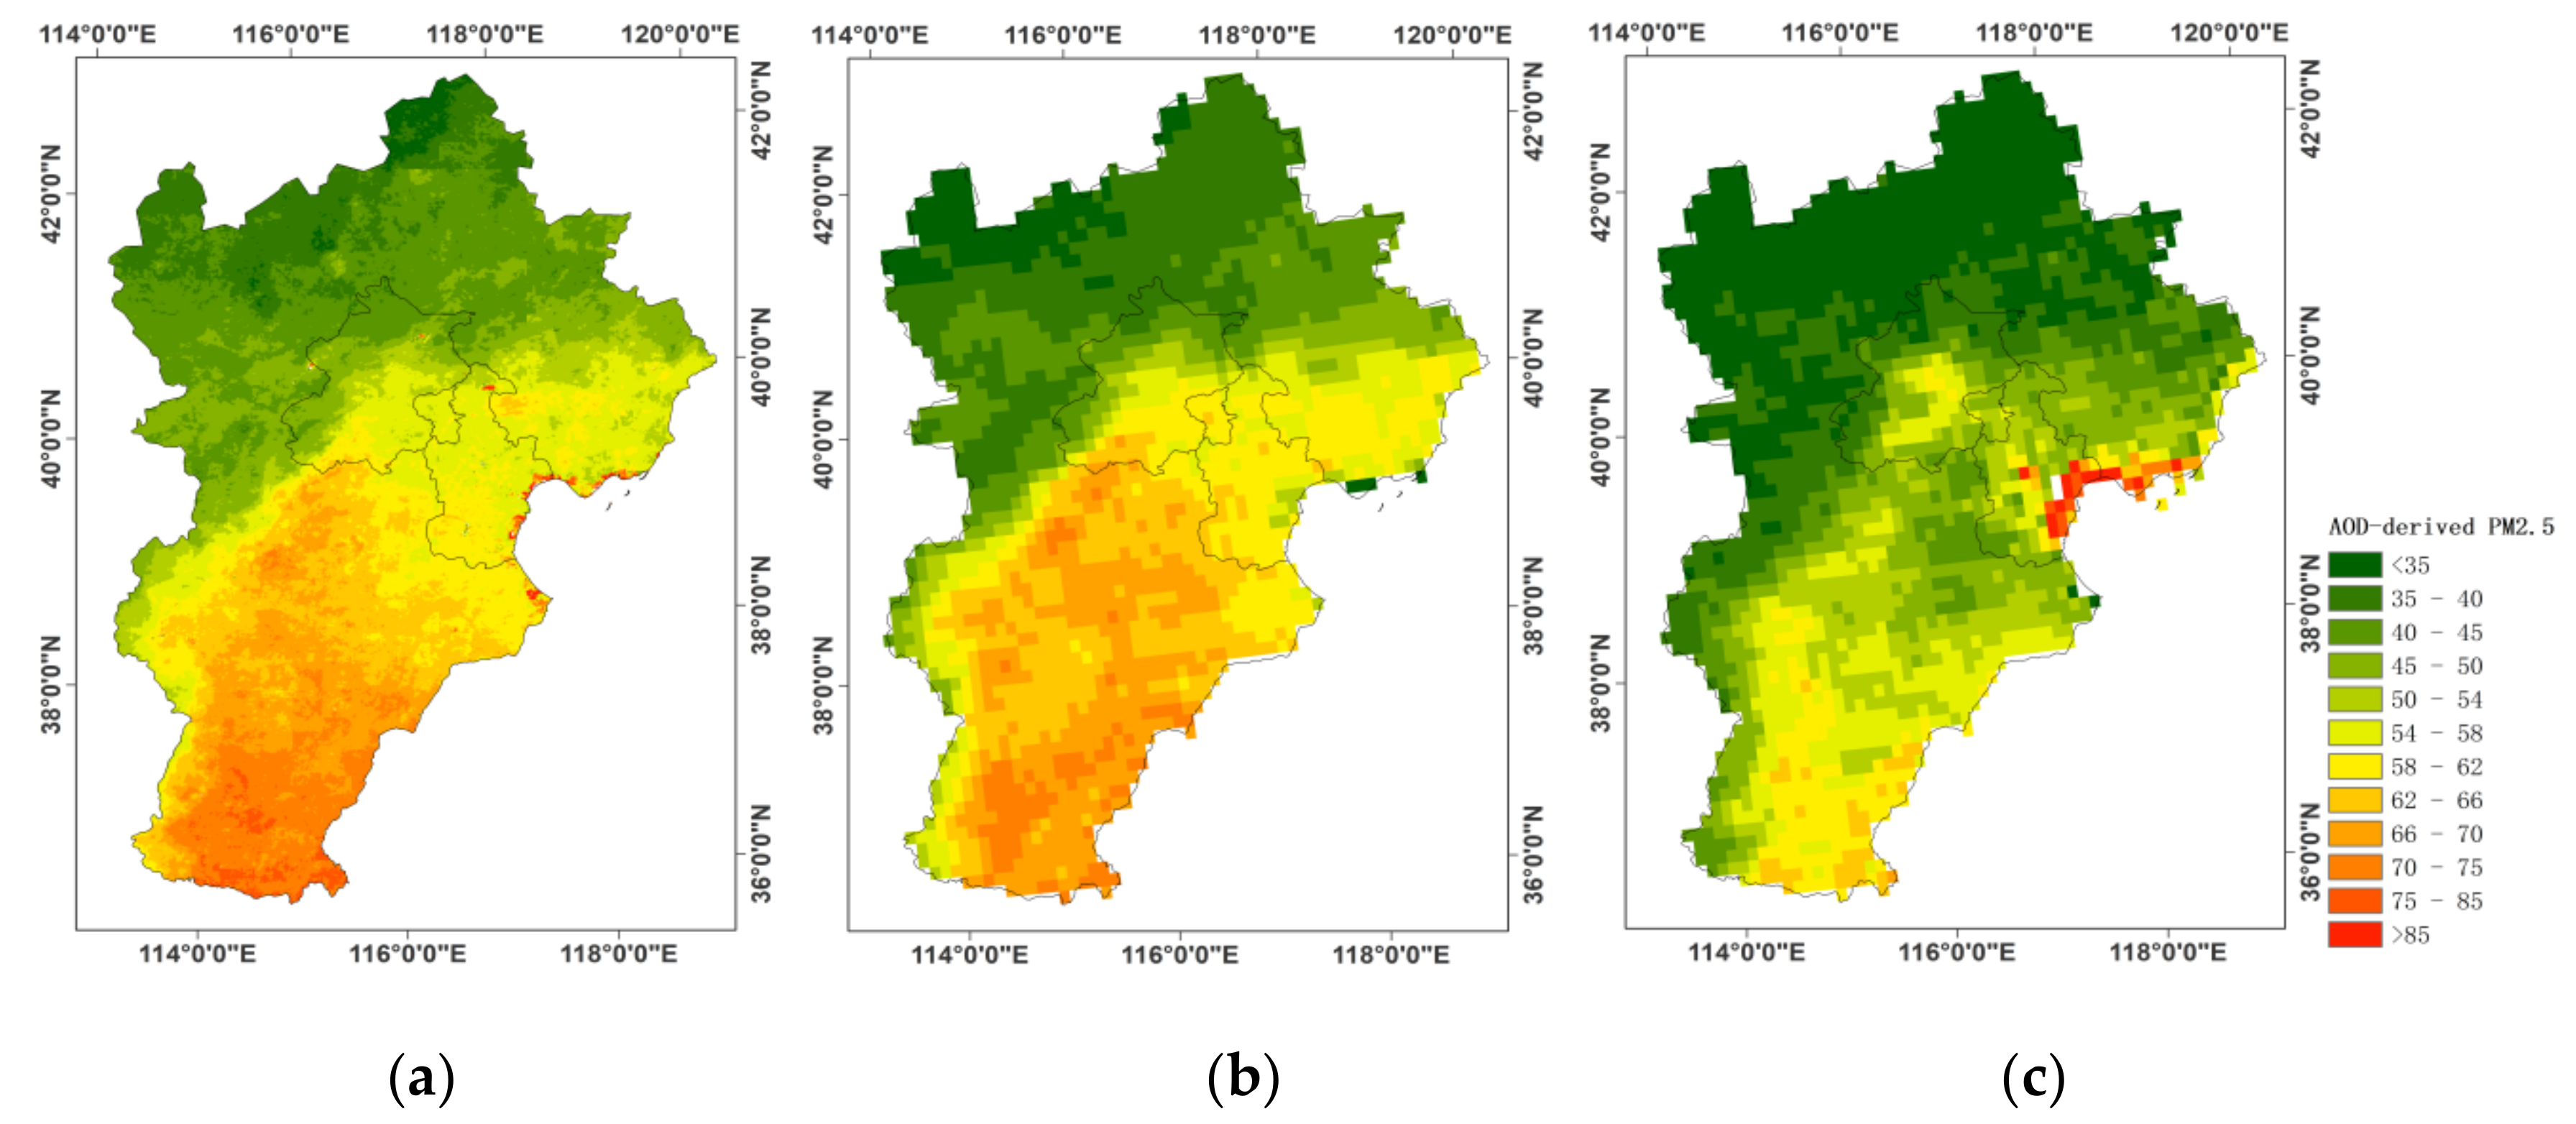
Figure 8.
The annual mean PM2.5 values in the 83 sites for all the measurements (PM2.5_ALL) and those matched with MAIAC, DB, and DT AOD, respectively. The number of ground sites is sequenced by annual PM2.5 concentration of ground measurements. Site 1–42 is at the top, and 43–83 is at the bottom.
Figure 8.
The annual mean PM2.5 values in the 83 sites for all the measurements (PM2.5_ALL) and those matched with MAIAC, DB, and DT AOD, respectively. The number of ground sites is sequenced by annual PM2.5 concentration of ground measurements. Site 1–42 is at the top, and 43–83 is at the bottom.
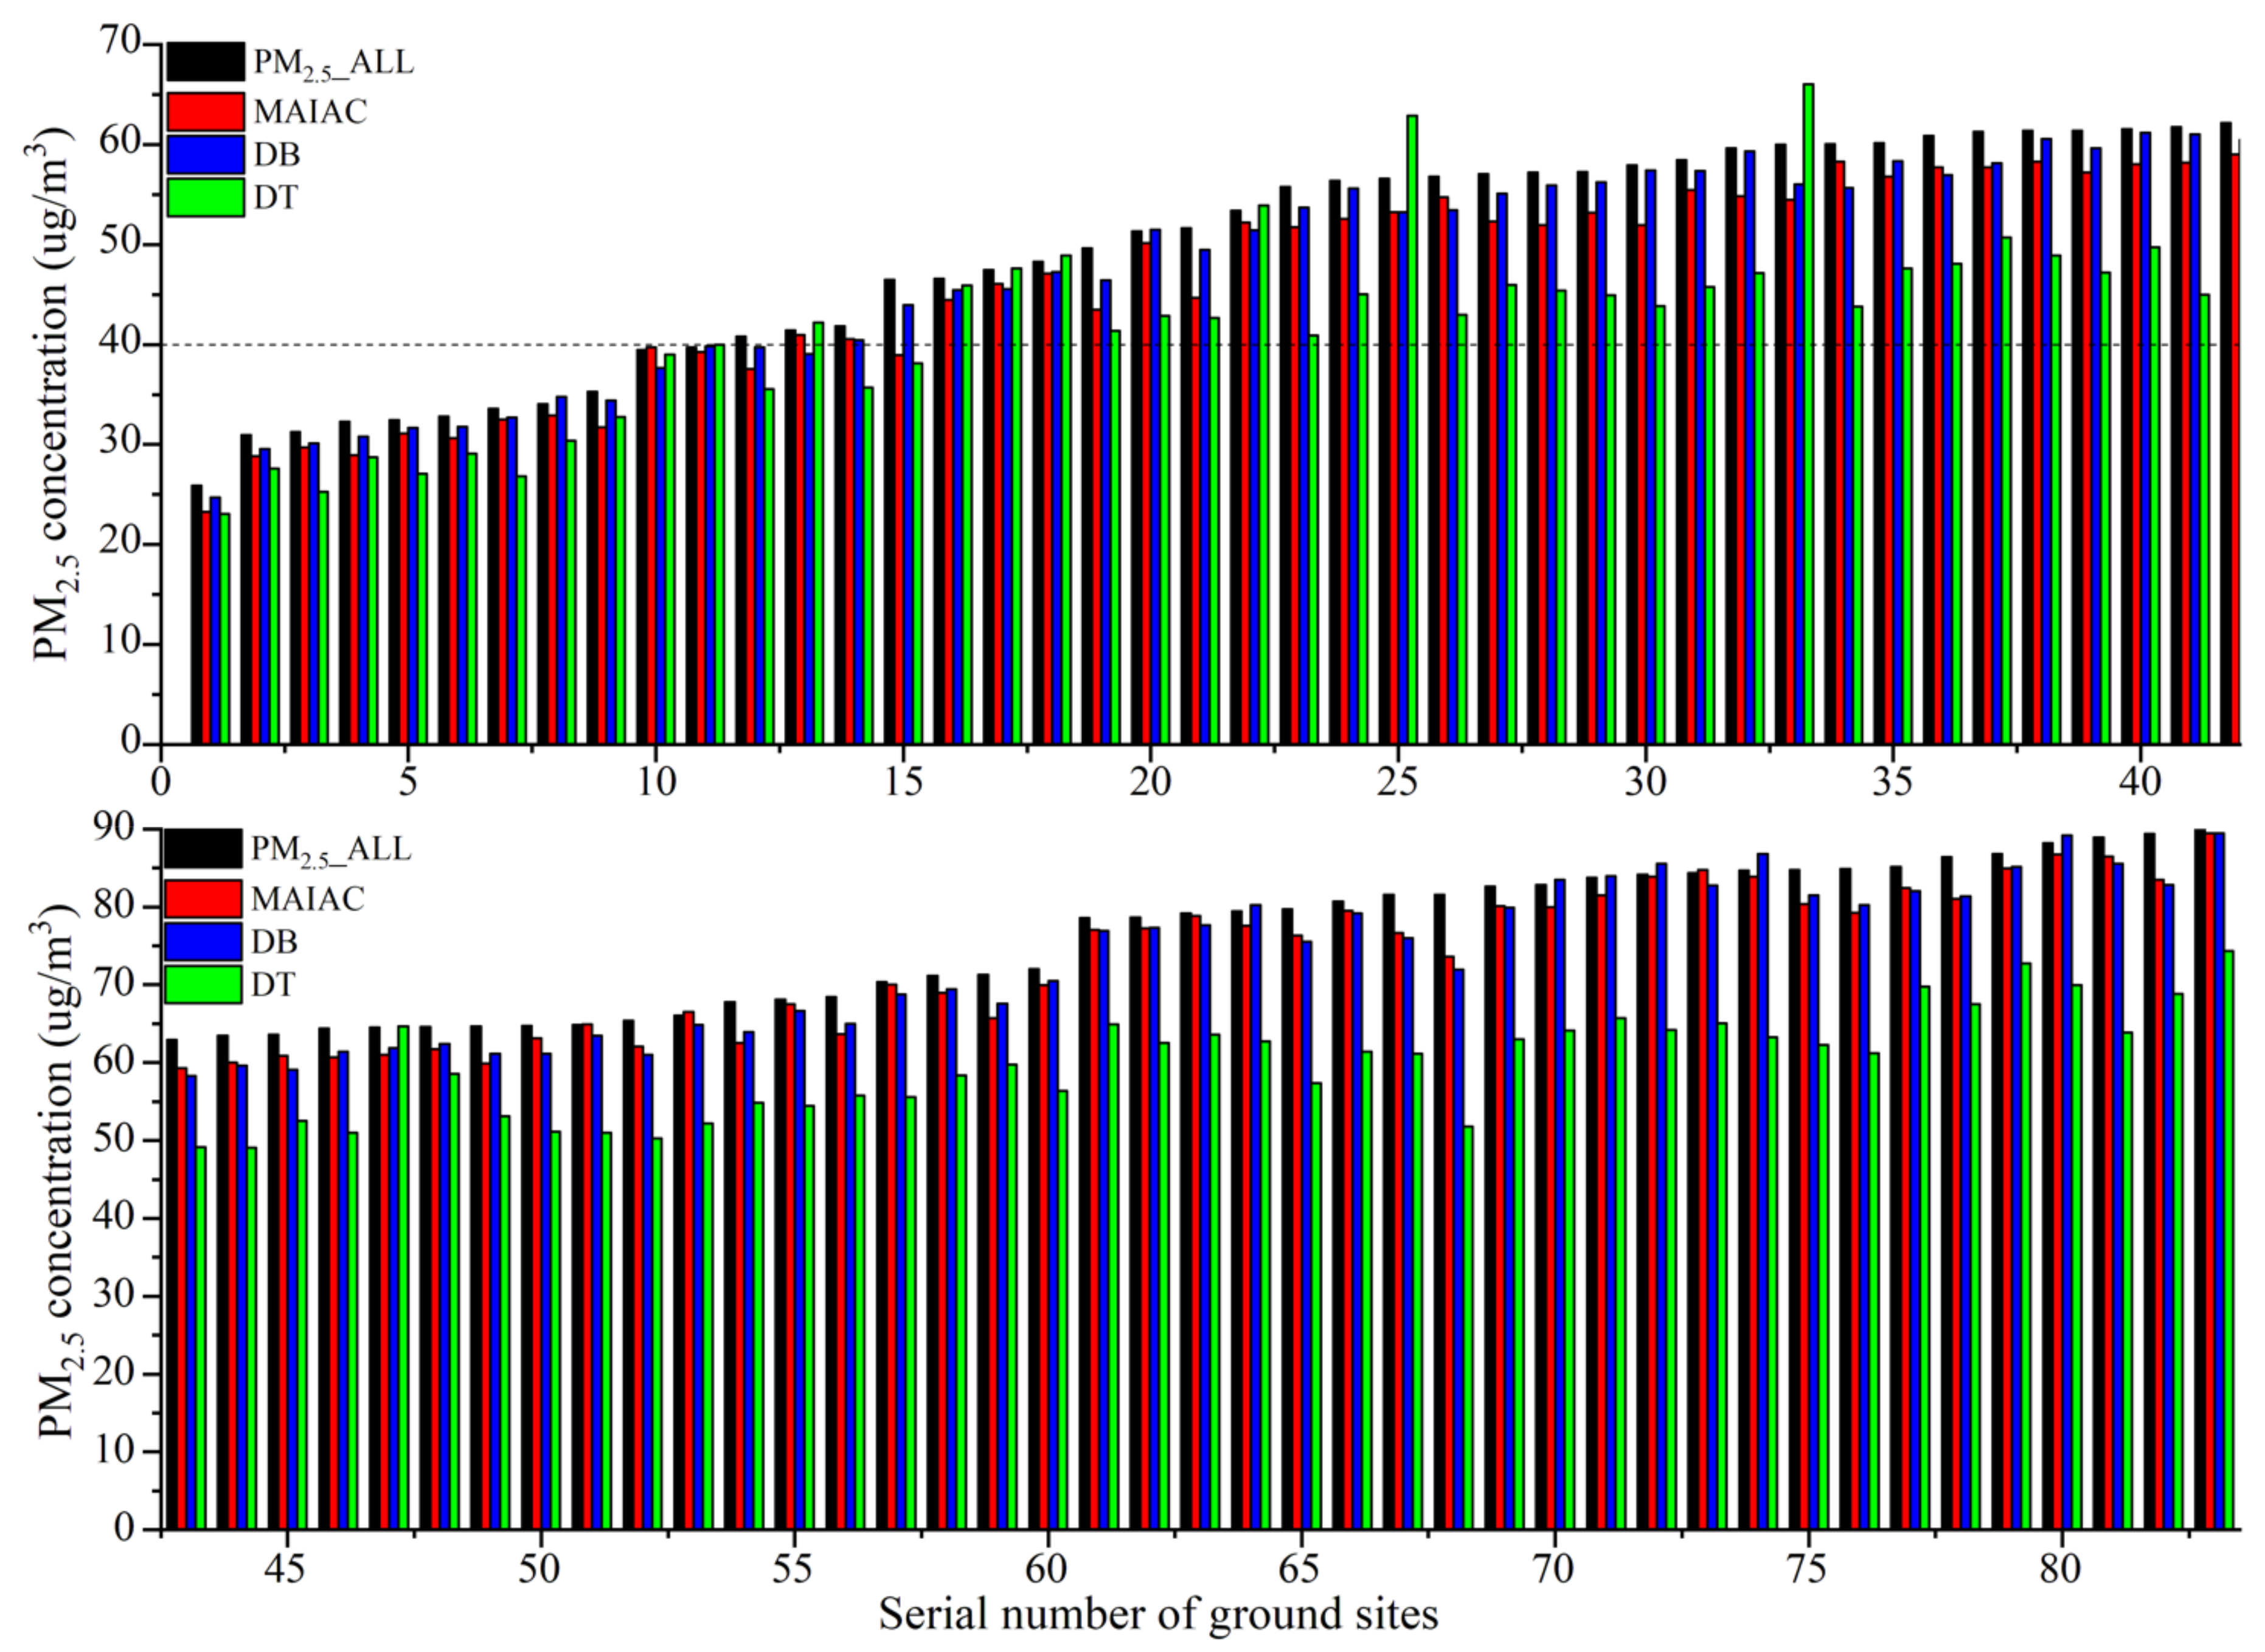
Figure 9.
Comparison of annual mean of satellite predicted (Predict) and matched observed (Observed) PM2.5 in the 83 sites from MAIAC (a), DB (b), DT(c) AOD, respectively. The dotted lines here are used to show site-by-site variations of predicted PM2.5 bias.
Figure 9.
Comparison of annual mean of satellite predicted (Predict) and matched observed (Observed) PM2.5 in the 83 sites from MAIAC (a), DB (b), DT(c) AOD, respectively. The dotted lines here are used to show site-by-site variations of predicted PM2.5 bias.

Table 1.
Comparison of three primary MODIS AOD datasets. The AOD-PM2.5 matchup denotes number of matchups for available AOD with ground measurements from the 83 sites in northern China during 2017.
Table 1.
Comparison of three primary MODIS AOD datasets. The AOD-PM2.5 matchup denotes number of matchups for available AOD with ground measurements from the 83 sites in northern China during 2017.
| Algorithm | Spatial Resolution | Retrieval Principle | Application Area | Latest Collection | AOD-PM2.5 Matchups |
|---|---|---|---|---|---|
| DT | 3 km, 10 km | Spectral relationship of surface reflectance | Vegetation | C6.1 | 10811 |
| DB | 10 km | Surface reflectance database | All snow/ice-free | C6.1 | 21356 |
| MAIAC | 1 km | Minimal ratio of spectral surface reflectance | All snow/ice-free | C6 | 16547 |
Table 2.
Descriptive statistics of variables. The term Days here denotes the number of days with available AOD-PM2.5 matchups.
Table 2.
Descriptive statistics of variables. The term Days here denotes the number of days with available AOD-PM2.5 matchups.
| Mean | Std. Dev. | Min | Max | Days | ||
|---|---|---|---|---|---|---|
| MAIAC | AOD | 0.49 | 0.51 | 0.02 | 3.27 | 329 |
| PM2.5 (μg/m3) | 59.31 | 52.58 | 1.54 | 488.08 | ||
| DB | AOD | 0.56 | 0.66 | 0.002 | 3.88 | 344 |
| PM2.5 (μg/m3) | 60.49 | 52.33 | 1.54 | 488.08 | ||
| DT | AOD | 0.55 | 0.5 | 0.02 | 3.5 | 305 |
| PM2.5 (μg/m3) | 51.62 | 35.78 | 1.54 | 375.83 |
Table 3.
Fixed intercept and slope of the linear mixed effects model.
| Intercept | Slope | P-Value | |
|---|---|---|---|
| MAIAC | 35.48 | 48.54 | <0.0001 |
| DB | 33.63 | 41.18 | <0.0001 |
| DT | 29.21 | 38.43 | <0.0001 |
Table 4.
Descriptive statistics of satellite predicted (top line) and matched ground observed (bottom line) PM2.5 for MAIAC, DB, and DT AOD (unit: μg/m3).
Table 4.
Descriptive statistics of satellite predicted (top line) and matched ground observed (bottom line) PM2.5 for MAIAC, DB, and DT AOD (unit: μg/m3).
| AOD Type | Mean | Std. Dev. | Min | Max | Median |
|---|---|---|---|---|---|
| MAIAC | 59.666 | 16.888 | 23.291 | 86.704 | 58.998 |
| 59.668 | 7.97 | 43.172 | 75.136 | 58.217 | |
| DB | 60.393 | 16.461 | 24.705 | 89.16 | 60.449 |
| 60.593 | 8.752 | 40.748 | 73.654 | 61.389 | |
| DT | 51.048 | 12.235 | 23.077 | 74.321 | 50.999 |
| 51.389 | 7.833 | 32.816 | 69.036 | 52.599 |
© 2020 by the authors. Licensee MDPI, Basel, Switzerland. This article is an open access article distributed under the terms and conditions of the Creative Commons Attribution (CC BY) license (http://creativecommons.org/licenses/by/4.0/).
Share and Cite
MDPI and ACS Style
Li, R.; Mei, X.; Chen, L.; Wang, Z.; Jing, Y.; Wei, L. Influence of Spatial Resolution and Retrieval Frequency on Applicability of Satellite-Predicted PM2.5 in Northern China. Remote Sens. 2020, 12, 736. https://doi.org/10.3390/rs12040736
AMA Style
Li R, Mei X, Chen L, Wang Z, Jing Y, Wei L. Influence of Spatial Resolution and Retrieval Frequency on Applicability of Satellite-Predicted PM2.5 in Northern China. Remote Sensing. 2020; 12(4):736. https://doi.org/10.3390/rs12040736
Chicago/Turabian StyleLi, Rong, Xin Mei, Liangfu Chen, Zifeng Wang, Yingying Jing, and Lifei Wei. 2020. "Influence of Spatial Resolution and Retrieval Frequency on Applicability of Satellite-Predicted PM2.5 in Northern China" Remote Sensing 12, no. 4: 736. https://doi.org/10.3390/rs12040736
Note that from the first issue of 2016, this journal uses article numbers instead of page numbers. See further details here.