Geometric Quality Assessment of Chang’E-2 Global DEM Product


1
State Key Laboratory of Remote Sensing Science, Aerospace Information Research Institute, Chinese Academy of Sciences, Beijing 100101, China
2
School of Geology and Geomatics, Tianjin Chengjian University, Tianjin 300384, China
3
State Key Laboratory of Lunar and Planetary Sciences, Macau University of Science and Technology, Macau 999078, China
4
CAS Center for Excellence in Comparative Planetology, Hefei 230026, China
*
Author to whom correspondence should be addressed.
Remote Sens. 2020, 12(3), 526; https://doi.org/10.3390/rs12030526
Submission received: 19 December 2019
/
Revised: 31 January 2020
/
Accepted: 3 February 2020
/
Published: 6 February 2020
(This article belongs to the Special Issue Lunar Remote Sensing and Applications)
Abstract
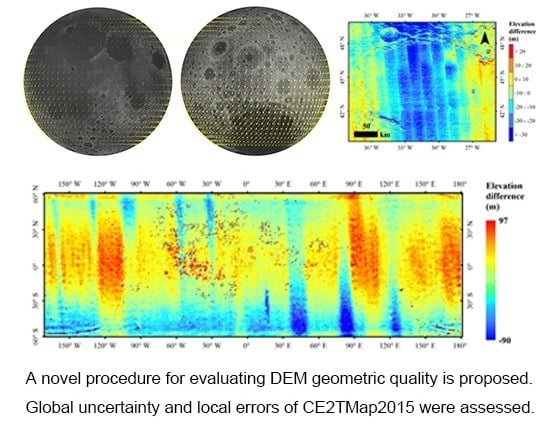
:The Chang’E-2 digital elevation model (DEM, named CE2TMap2015), which is the highest resolution DEM product in China, was released with global coverage of the lunar surface. A detailed geometric quality assessment of the product is desirable for wider applications by users. A novel procedure for evaluating DEM geometric quality, which investigates both the global geometric uncertainty and local gross errors, is proposed in this paper. First, the DEM was divided into regular blocks and matched with the reference DEM. Then, the characteristics of errors were investigated using the statistical information of the matched tie points. Next, the local outlier factor (LOF) algorithm was performed to locate the gross errors. In our experiment, CE2TMap2015 was evaluated using the proposed method, with SLDEM2015 as the reference DEM. The results show that there were widespread geometric inconsistencies with an area-weighted average of 183.1 m horizontally (with the standard deviation being 101.2 m) and 2.3 m vertically (with the standard deviation being 15.4 m). Gross errors were detected automatically and were excluded in the statistical analysis. The periodic errors were extracted in the frequency domain using a Fourier transform. Our research results provide instructional information for the utilization of CE2TMap2015 by world-wide users. The proposed method can be used in the assessment of other planetary DEMs.
1. Introduction
A digital elevation model (DEM) is a typical topographic mapping product and has a wide range of applications in the field of planetary exploration. For example, a DEM provides topographic information for morphological and geological analysis [1,2,3,4]. It can also contribute to the implementation of engineering tasks, such as landing site selection, path planning, and obstacle avoidance for lander and rover missions [5,6]. For the last ten years, large numbers of lunar high-resolution topographic products have been generated from heterogeneous sources. For example, lots of DEMs have been produced based on the data acquired by laser altimeters or cameras onboard the Lunar Reconnaissance Orbiter (LRO), Selenological and Engineering Explorer (SELENE), Chang’E-1 (CE-1), Chang’E-2 (CE-2), and so on [7]. The global or nearly global coverage DEMs, such as Lunar Reconnaissance Orbiter Laser Altimeter (LOLA) DEM [8], SLDEM2015 [9], and CE-2 DEM (named CE2TMap2015) [10], have provided significant contributions to lunar scientific research. Laser altimetry and stereo photogrammetry are two main means for producing lunar global DEMs. Combining and fusing different sources of DEM products (e.g., SLDEM2015) is also a practical solution.
Different data sources and production methods bring different geometric errors. As a result, there are widespread inconsistencies among various DEMs. In order to choose a suitable DEM for different studies or use multiple DEMs synergistically, it is important to evaluate the geometric quality of DEM products in detail. CE2TMap2015, which was generated from CE-2 stereo images and recently released by National Astronomical Observatories, Chinese Academy of Sciences (NAOC), is one of the high-resolution DEMs [10]. As a new global DEM product to the lunar community, it has many potential applications for lunar exploration and research [11,12]. A preliminary comparison with LOLA DEM was made by the producers, and they found that there is a 43 m elevation difference (standard deviation is 110 m) between CE2TMap2015 and LOLA DEM [10]. However, a detailed geometric quality assessment is highly desirable for wider applications by more potential users all over the world.
Such a method is feasible way to evaluate DEM products of the Earth using high-accuracy ground control points (GCPs) or high-accuracy reference data [13,14]. However, there is not enough high-accuracy GCPs and high-accuracy references on the lunar surface. So far, there are only five lunar laser ranging retro reflectors (LRRRs) that can be used to determine the absolute position accurately on the Moon. The widely used Unified Lunar Control Network 2005 (ULCN2005) has a horizontal accuracy of a hundred meters to a few hundred meters and a vertical accuracy of 100 m [15,16], which is inappropriate as a reference for evaluating the recently produced DEM products [17]. At present, studies on geometric quality evaluation of lunar DEMs are mainly based on the elevation differences between the DEM and an available high-precision DEM. The previous elevations are usually used without considering the effects of planimetric displacements [9,10,18] and the impact caused by the precision of the reference itself. In this paper, we propose a novel procedure for DEM geometric quality assessment, which can investigate the global characteristics of planimetric and elevation errors and detect local gross errors simultaneously. The procedure mainly includes two techniques: DEM matching and geometric accuracy analysis.
The DEM matching method is a critical step in DEM assessment. Many studies have been done on DEM matching in the past [19]. Three-dimensional least squares surface matching methods [20], such as iterative closest point (ICP) [21] and least Z-difference (LZD) [22] methods, were widely used in previous studies. Guo and Wu compared CE-1 and SELENE altimeter data of the Sinus Iridium area and Apollo 15 landing site based on surface matching, and they found small shifts between the data [23]. The least squares matching method can obtain high-precision matching results, but it is time consuming and requires good initial approximations of the transformation (translation and rotation) parameters between the two data sets. A feature-based matching method, which extracts the conjugate feature points, feature lines, and feature surfaces of a DEM, was also commonly used [24,25]. Michael [26] generated a global displacement field between the United States Geological Survey (USGS) 1:2M controlled photomosaic and the Mars Orbiter Laser Altimeter (MOLA) based on the centers of craters. However, a feature-based matching method may fail in places with poor texture.
Geometric error analysis is the key issue of DEM quality assessment. Detailed and comprehensive geometric error analysis can not only find problems in producing the DEM, but also guide the application and improvement of the DEM. DEM errors originate from the process of data acquisition and/or data processing. Theoretically, DEM errors can be classified into three types: gross errors, systematic errors, and random errors [27]. Generally, systematic errors can be characterized through statistics, while gross errors may affect the statistics and should be detected and eliminated before statistical analysis of the systematic errors. The gross errors of a DEM, which are the large deviations between a DEM product and ground truth or a high-precision reference DEM, is usually detected manually via visual inspection of the DEM after applying a visual effect enhancement method, such as relief shading [28], remainder imaging [27], RGB multi-band shading [29], and so on. For systematic and random error elimination, a filtering method is commonly used in the spatial domain (e.g., median filtering) or frequency domain [30] (e.g., low-pass filtering and high-pass filtering [31]). To detect possible gross errors of a large DEM, e.g., the CE2TMap2015 global lunar DEM, an automatic gross error detection method is needed.
In this study, the geometric quality of the DEM was assessed based on a novel DEM matching method. Through the illumination model and given illumination conditions, a simulated image was generated from the DEM. Using an image simulation technique, the 3D matching problem of DEMs was transformed into a 2D matching of images problem for simplification. Simulated images were matched based on the affine scale invariant feature transform (ASIFT) algorithm [32]. The proposed method did not require initial values for the transformation parameters, thus simplifying the matching process. The geometric quality of DEM was then assessed based on the extracted and matched feature points (tie points). In addition, we proposed DEM gross error and systematic error extraction methods. The geometric quality of CE2TMap2015 was evaluated using our proposed procedure. The global characteristics of errors and location of CE2TMap2015 gross errors are elaborated in this paper. The results of the article are meaningful for further use of CE2TMap2015 and for DEM improvement.
2. Data
CE2TMap2015, which initial reported as CE2DEM2014 [33], was produced from 384 long-strip CE-2 stereo images and with the full coverage of the lunar surface. The CE-2 stereo camera with two Charge-coupled Device (CCD) line detectors assembling on a unique focal plane obtained forward-view and backward-view stereo images with 7.98° and −17.2° view angles, respectively. The stereo images that were selected to generate the CE2TMap2015 were obtained at the orbital altitude of 100 km and had a 7 m resolution and 43 km image width. The overlap on the across-track direction could reach 24% at the equator and increased with latitude. A global adjustment was performed with tie points between and within image strips, as well as five LRRRs as ground control points to improve the position consistency and precision [34]. The control accuracies of CE2TMap2015 were estimated to be 21–97 m and 2–19 m horizontally and vertically, respectively [10]. The 20-m grid spacing DEM (tiff image format) is available online and was chosen for this DEM assessment research. The data has 188 subdivisions and can be downloaded from the Data Release and Information Service System of China’s Lunar Exploration Program (http://moon.bao.ac.cn/index_en.jsp).
SLDEM2015, which is a combined product of LOLA laser points and the DEM generated by Japanese SELENE Terrain Camera (TC) images was chosen as the relative reference DEM in this study. The LOLA laser points and their topographic map acted as the reference geodetic framework in many usage cases for the high positioning accuracy (with a vertical precision of ≈10 cm and an accuracy of ≈1 m [35]). Though the cross-track spacing of LOLA laser points are a significant improvement over all the previous lunar laser altimeters, the near equator gap width between ground tracks are still a bit large. Thus, stereo-derived DEMs from SELENE TC images [36], whose resolution is 10 m, were co-registered and merged to LOLA laser points. By combining the two data sets, SLDEM2015 provides a direct assessment reference of not only the spatial accuracy but also the true resolution of the stereo component. SLDEM2015, which covers latitudes within ±60°, has a vertical accuracy of approximately 3–4 m, and has a grid spacing of 512 pixels per degree (grid size of 60 m at the equator) [9]. It is worth noting that some areas, where data from the Multiband Imager (MI) were used to fill the gaps of TC DEMs, are known to be of lower quality than most of the data. The data can be obtained from the United States Geological Survey (USGS) website (https://astrogeology.usgs.gov/search/map/Moon/LRO/LOLA/Lunar_LRO_LrocKaguya_DEMmerge_60N60S_512ppd).
The Lunar Reconnaissance Orbiter Camera (LROC) Narrow Angle Camera (NAC) DEM, which is constructed through stereo photogrammetry with images of M1303619844 and M1303640934, was chosen as a reference DEM to compare the SLDEM2015 and CE2TMap2015 in the Chang’E-4 (CE-4) landing area. It has a ground sample distance of 5.0 m and height precision of ≈1.1 m. The data is available online (http://wms.lroc.asu.edu/lroc/view_rdr/NAC_DTM_CHANGE4).
3. Method
The flowchart of the proposed method is outlined in Figure 1. First, both CE2TMap2015 and the reference DEM are subdivided into regular blocks in latitude and longitude. Then, the DEM blocks were converted into simulated images using a hillshading technique [37,38]. In order to obtain the tie points that are used to evaluate the geometric performance of CE2TMap2015, ASIFT matching is performed between the simulated images. Furthermore, the displacement of CE2TMap2015 is assessed through the coordinate differences of the extracted tie points. Finally, the gross error and systematic error of CE2TMap2015 are detected based on the displacement statistical results.
3.1. DEM Matching Based on Simulated Images
In this research, the simulated images were used to convert a 3D image matching problem into a 2D image matching problem. The lunar surface has no artificial features and is mostly covered by regolith [39]. Thus, using the hillshading technique on lunar surface can produce a simulated image that is close to a real image. The principle of the hillshading technique is to represent the reflectance of a small, flat surface as a function of the gradient of the terrain. An idealized reflectance model (the surface is assumed to be an ideal diffuser or Lambertian surface) is used to establish the following function on the Moon [37]:
where is the simulated pixel intensity, i is the incidence angle, e is the emission angle, is an albedo factor, is the solar azimuth of each image, is the solar altitude of each image, and p and q are the gradients of the surface in line and sample directions, respectively. The solar azimuth and solar altitude were set to be 315° and 45°, respectively.
We chose the ASIFT matching method [32] to extract the tie points between CE2TMap2015 and SLDEM2015 in corresponding blocks. The ASIFT algorithm is completely affine invariant, which can match the images with translation, scaling, and rotation. In this study, an open source web code (http://demo.ipol.im/demo/my_affine_sift/) developed by Yu and Morel [40] was used to extract the tie points on the simulated images. Then a random sample consensus (RANSAC) [41] algorithm was used to eliminate mismatches, i.e., the features identified as the same were actually different features. It should be noted that there was no intent to remove the correctly matched points, which could express the gross errors of DEM. However, most of them were still removed; these removed points, which could be used for detecting the gross position errors in a very small range, have limited influence on large-scale gross error detection.
Meanwhile, in order to obtain evenly distributed tie points to ensure the accuracy and robustness of the DEM assessment, the redundant points were removed from the tie points set. For this purpose, each block was divided into dense grids (e.g., 0.33° × 0.33°), where the point closest to the center of the grid was retained if multiple points existed in a grid.
3.2. DEM Geometric Quality Assessment
There is no standard procedure for DEM geometric quality assessment, especially when absolute accuracy cannot be checked. The usual case involves calculating the elevation difference between the DEM to be evaluated and the reference DEM. In this study, both planimetric and elevation displacements were investigated using the tie points, and gross errors were inspected.
3.2.1. Displacement Statistics
The geometric displacements of CE2TMap2015 with respect to the reference DEM contains two components: horizontal (planimetric) and vertical (elevation) displacements. Both were assessed according to the geographic coordinate difference of the tie points. The horizontal displacement of each tie point can be calculated as follows:
where and are the magnitude and orientation of the horizontal displacement of each grid, respectively; and are the longitude and latitude differences between the tie points, respectively; and , which are converted to meters, are the average differences between the tie points in each grid; D is the diameter of the Moon; the coordinates of the tie points are (, , ) and (, , ); hei is the elevation of the point; and is the ith tie point extracted in each block.
The elevation difference between the two DEMs is calculated as follows:
where is the elevation difference between each tie point.
In order to inspect the global distribution of errors effectively, a mean displacement was calculated for each subdivided block. As a result, a mean displacement vector field was obtained, which depicts the displacements between CE2TMap2015 and SLDEM2015.
3.2.2. Gross Error Detection
CE2TMap2015 was produced from CE-2 stereo images after global adjustment. In general, the relative geometric precisions of the images were consistent in the same track and adjacent tracks. However, some gross errors did exit in the DEM due to errors in registration or adjustment. For example, phantom crater (Figure 2) appeared as two craters in the DEM, which reflects the gross error in the local area of the DEM. Lots of the gross errors were caused by this type of geometric inconsistency where images overlapped. Some were caused by DEM noises or errors. Such a gross error may have a great impact on subsequent applications. The local outlier factor (LOF) algorithm was used to extract the possible gross error area in this paper.
The LOF method is an anomaly detection method proposed by Breuning et al. in 2000 [42]. It detects the outliers by comparing the local density of each data set. If the local density of one set is lower than that of its neighbors, then the point is considered as an outlier, i.e., a gross error. The main steps of the LOF algorithm are briefly described as follows [42]:
(1) Local reachability density calculation: the local reachability density of a point (a displacement vector in this research) can be defined as follows:
where is the data set of nearest neighbors that includes all points within a certain distance. k_distance() is the distance of the point to the -th nearest neighbor. is the reachability distance of from its neighbor data sets . is the distance between point and . In Equations (4) and (5), the distance is the length of the vector difference between the displacements involved.
(2) Local outlier factor (LOF) calculation: the calculated local reachability density is compared with those of the neighbors based on the LOF in Equation (6).
The LOF of point is the average local reachability density of the neighbor set divided by the local reachability density of point . In general, a larger than 1 means that point is an outlier (lower density than neighbors).
If a gross error exists, the displacement between the DEM and the reference DEM in a certain range would not be systematic. The LOF algorithm was used to extract the outlier vectors as the candidate gross error areas. Although some of the points were correctly matched, which can show that gross errors of a local small area were eliminated using RANSAC, performing the LOF algorithm on the averaged displacements over 1° × 1° blocks is also feasible for large-scale gross error detection. Furthermore, this detection, which is intended to identify outlier positional errors in the blocks, became more reasonable and effective by eliminating matched errors though RANSAC and using averaged displacements instead of direct measurement displacements. As DEM matching precision can influence the gross error extraction results, a distance threshold between the vector length and average vector length was used to determine the final gross errors from the candidate gross errors.
3.2.3. Periodic Systematic Error Detection
In this study, a method to detect the systematic error in the frequency domain was developed. In the frequency domain, it is easier to extract noise or systematic error based on frequency filtering.
In the field of image processing, the spatial and frequency domains can be transformed through a discrete Fourier transformation (DFT) and an inverse discrete Fourier transformation (IDFT). The equations for DFT and IDFT are shown in Equations (7) and (8), respectively [43]:
where is the function of the DEM; M and N are the number of samples and lines of the DEM, respectively; u and v are the frequency variables of ; and x and y are the spatial variables of .
In the frequency domain, the periodic information can be easily extracted from low-frequency parts. We extract the low-frequency periodic noise through an ideal low-pass filter operation [44], which is represented using the following equation:
where is the periodic noise of DEM, is the low-pass filter, is the DFT result of the original DEM, is the distance from point to the center of the filter, is a cut-off frequency, and is the IDFT.
In this method, the DEM is transformed in the frequency domain based on DFT first. Then, the periodic error of DEM is separated through a low-pass filter operation. In addition, the periodic error of the DEM can be removed by subtracting the extracted periodic error from the DEM.
4. Results and Discussion
4.1. DEM Matching Results
In this study, CE2TMap2015 and SLDEM2015 were divided into 5° × 5° in latitude and longitude. Figure 3 shows the matching results of one block. The simulated images (Figure 3c,g) had similar surface features that provided the possibility for 2D feature matching. We extracted the tie points from the simulated images through the ASIFT method in each block (Figure 3d,h), and the gross errors of tie points were eliminated through the RANSAC algorithm (Figure 3e,i). It is clear that the tie points were unevenly distributed, with many more tie points in the rough areas than in the smooth areas. This may have affected the assessment result. After redundant points were removed (Figure 3f,j), the remaining tie points were almost evenly distributed. Finally, 318,302 tie points were extracted from the whole DEMs (an average of 184 tie points per block) that could satisfy the following research.
Two-dimensional image matching methods, which made the DEM matching simple, could be applied directly to the DEM data itself. However, creating simulated images enhanced higher-frequency terrain information, which could improve the matching performance. Many other types of algorithms that can produce enhanced effects also could be used. The method mentioned above should be used on the condition that the rotation between the DEMs is very small in each local region. It should be noticed that in most areas, the DEMs contained local noises that may led to mismatching by image matching methods. However, ASIFT, similar to SIFT, contains a Gaussian filtering. Noise and small-scale features are filtered out and do not appear in matching features. Furthermore, as the local noises in the two DEMs have low similarities, the noises do not have notable impact on the matching results.
4.2. Geometric Quality Assessment of CE2TMap2015
4.2.1. Gross Error Detection Results
The geometric accuracy of CE2TMap2015, as well as the reference SLDEM2015, is generally consistent in local areas within the same product. The displacement vectors between the two products are also consistent in local areas, in other words, the displacement should be systematic in a certain range. The mean error of a 5° × 5° block was used to investigate the global geometric quality. Each block was subdivided into 25 sub-blocks (each sub-block was a 1° × 1° area) to check the consistency of the displacement vectors. Figure 4 shows some examples of the displacement vector field for different latitudes and longitudes. It was obvious that the mean displacement vector of each sub-block was similar in both length and orientation if no gross error existed.
If a gross error did exist, the displacement vector of a sub-block was abnormal compared to neighboring sub-blocks. Such abnormal displacement vectors were extracted by the LOF algorithm and considered to be candidate gross errors. A distance threshold (2 pixels) between the vector length and average vector length was used to select the final gross error from the candidates.
Figure 5a shows the gross error areas (red vectors) extracted using the proposed algorithm. Figure 5b shows an example of the candidate gross error area (the dashed rectangle box in Figure 5a). In Figure 5b, there is an obvious geometric inconsistency in the candidate error area, e.g., the longitudes of the same crater (pointed by red arrows) in the two DEMs were significantly different.
The global result of the gross error extraction is shown in Figure 6. The filled rectangles are the areas with gross errors extracted using the proposed method. We manually checked all the extracted areas and found that the actual gross errors may be in CE2TMap2015 or SLDEM2015. The red rectangles are the areas with gross errors in CE2TMap2015. The pink rectangles are the low-quality areas of SLDEM2015; for example, Figure 7 shows an example where apparent artifacts exist in SLDEM2015. These areas are related to where the TC DEM was unavailable, as indicated in Figure 5 of Barker et al. [9]. The positions of the gross error areas (1° × 1° sub-blocks) are listed in Table 1.
4.2.2. Global Geometric Quality of CE2TMap2015
Based on the displacement statistic results after excluding the gross errors, a mean displacement map between CE2TMap2015 and SLDEM2015 at a 5° spacing (Figure 8) was produced. We found that the error directions of the displacement vectors displayed an anticlockwise circular trend. This indicated that the error of the global adjustment remained systematic and could be improved.
In order to obtain the statistical information of errors, a color-coded map of the magnitude of the planimetric offsets (Figure 9a) and elevation difference (Figure 9b) between CE2TMap2015 and SLDEM2015, respectively, at a 1° spacing are given. They show that the difference between CE2TMap2015 and SLDEM2015 was smaller in lunar maria. This trend is consistent with the control accuracy based on five high accuracy control points (i.e., the LRRRs) which are located in the northern hemisphere of the lunar near side and are used in CE2TMap2015 production. The elevation difference map (Figure 9b) was based on the average elevation differences of the tie points between the two DEMs. In other words, the planimetric displacements did not affect the elevation statistics. As shown in Figure 9b, most elevation differences showed an equator to poles variation. Some of the boundaries seemed to line up and have strict north–south trend. They had some association with boundaries of SLDEM2015 problem areas, as seen by comparing them with Figure 5 in Barker et al. [9]. Some others, which do not correspond to SLDEM2015 problem areas, were inclined. These may have been related to the CE-2 image strip direction. The elevation differences of these two DEMs in the lunar near side were lower than other areas. High elevation differences were generally located in several longitudinal bands (90°E–120°E in the northern hemisphere, 40°E–50°E and 80°E–90°E in the southern hemisphere, and 110°W–120°W at the equator).
We calculated the area proportion for each grid. Furthermore, the distribution of planimetric (longitude and latitude) and elevation displacements were calculated based on the area proportion in Figure 10 (N per bin was the area proportion for each bin). The area-weighted average offset between the two DEMs was 183.1 m, and its standard deviation was 101.2 m. The maximum displacement in Figure 8 was 482.0 m. We can see that the displacement between the two DEMs in the lunar near side (with an area-weighted average of 125.5 m) was less than that in the far side (with area weighted average of 239.3 m). Furthermore, the area weighted average displacement in south hemisphere (with an area-weighted average of 239.5 m) was almost twice as the displacement in the northern hemisphere (with an area-weighted average of 125.7 m). The area-weighted average elevation difference was 2.3 m, with the standard deviation being 15.4 m (the maximum difference was 96.9 m). Furthermore, 95.8% of the elevation difference was less than twice the standard deviation.
The global geometric quality results were compared with the results of Li et al. [10]. Li et al. compared the planimetric displacements between CE2TMap2015 and GLD100 DOM, and compared the elevation difference between CE2TMap2015 and LOLA DEM. Although CE2TMap2015 was compared with different reference data, the trend both in planimetric and in elevation were consistent (the highest planimetric displacement was in the far southern hemisphere and high elevation differences were generally located in almost the same longitudinal zones).
4.2.3. Finding of Periodic Systematic Error
The Von Kármán crater (CE-4 landing area) and the Sinus Iridum (Chang’E-3 (CE-3) landing area) were chosen as the regions of interest to evaluate the details of CE2TMap2015. Using the matched tie points, second-order polynomial transformation models were built though least squares fitting for the Von Kármán crater and Sinus Iridum areas. Furthermore, CE2TMap2015 was co-registered to SLDEM2015 based on the parameters.
The original CE2TMap2015 and co-registered CE2TMap2015 in the two experimental areas were subtracted from SLDEM2015 pixel by pixel. Figure 11a,b shows that the elevation difference between the original CE2TMap2015 and SLDEM2015 was strongly associated with the slope; this indicated the horizontal coordinate differences between them were widely distributed. The influence of the planimetric displacement was more significant where the elevation difference was large (such as the edge of the crater). After co-registration, the planimetric displacements were removed (or greatly reduced) and the elevation differences still existed in the Von Kármán crater (82% of the elevation differences were lower than 15 m) and Sinus Iridum (56% of the elevation differences were lower than 15 m) in Figure 11c,d). In particular, systematic errors in the periodic pattern were found in both the CE-3 and CE-4 landing areas (Figure 11c,d). The periodic errors were also visible in the elevation difference of CE2TMap2015 relative to the other reference DEM (LOLA DEM). The periodic errors were mainly in the cross-track direction with ≈21 km in the Von Kármán crater and Sinus Iridum areas, which corresponded to the CE-2 image swaths (considering the overlap rate). This indicated that the periodic errors mentioned above existed on CE2TMap2015 instead of SLDEM2015. Some periodic errors could also be found along the track. Along-track periodic errors may have been introduced through the residuals of bundle adjustment of the CE-2 images and were associated with attitude and orbit precisions.
The periodic errors were extracted from CE2TMap2015 (Figure 12a,b) based on a low-pass filter (described in Section 3.2.3) of Figure 11c,d. The profiles of AA’, BB’, CC’, and DD’ in Figure 12a,b were also drawn. The profiles in the Von Kármán crater and Sinus Iridum area (AA’ and CC’) are compared further in Figure 13. The figure shows that the wavelength (≈21 km, ≈1° of longitude in the Von Karman and Sinus Iridium areas) and amplitude (≈5 m) in these two areas were consistent. It is highly possible that these residual errors were the result of optical distortions.
4.3. Local Assessment of CE2TMap2015 in the CE-4 Landing Area
CE-4 is one of the key missions in the Chinese Lunar Exploration Program. The CE-4 probe successfully landed on the far side of the Moon on 3 January 2019. It was the first soft landing mission on the far side of the Moon and is significant for the in situ exploration of the Von Kármán crater. In this section, the results of a local detailed analysis of CE2TMap2015 at the CE-4 landing site is presented. The results in Figure 14 show that, although the matched CE2TMap2015 is much more consistent with the SLDEM2015 after co-registration (Figure 14b), there are still elevation differences between the two DEMs (Figure 14c,d). This indicates that the topographies represented in CE2TMap2015 and SLDEM2015 may be different at the detailed level.
Figure 15 shows the details of CE2TMap2015 and SLDEM2015 for the CE-4 landing area. These two DEMs were compared to a recently released LROC NAC DEM product (Figure 15a). The NAC DEM was produced from stereo images (image ID: M1303619844 and M1303640934) and can be downloaded from the LROC website (http://wms.lroc.asu.edu/lroc/view_rdr/NAC_DTM_ CHANGE4). It has a much higher grid spacing (5 m) than that of CE2TMap2015 and SLDEM2015, and thus can be used as a good reference for comparing the two DEMs. Obviously, there were some details (such as craters) only visible in SLDEM2015 (the blue arrows point in Figure 15), and some other details only visible in CE2TMap2015 (the red arrow points in Figure 15). We could also find that in some regions (e.g., the red dotted rectangle in Figure 15b), SLDEM2015 contained stripe noises, which may have been caused by low resolution in the across-track direction, while CE2TMap2015 had better quality in this local area (Figure 15c). It should be noted that though the image resolution of CE-2 was slightly higher than the TC images (7 m vs. 10 m), the real horizontal resolution of CE2TMap2015 was lower than SLDEM2015 in the areas we examined (e.g., Figure 15 apart from the lower-quality area of SLDEM2015).
5. Conclusions
A novel procedure for lunar DEM geometric quality assessment was presented in this paper. This method can both investigate the global geometric quality and detect local gross errors. The geometric quality of CE2TMap2015 was comprehensively assessed based on the proposed method, taking SLDEM2015 as the reference DEM. The results and findings are summarized as follows.
- Widespread geometric inconsistencies existed between CE2TMap2015 and SLDEM2015 based on the automatically matched tie points. The average planimetric displacement and elevation difference were 183.1 m and 2.3 m, respectively, with standard deviations of 101.2 m and 15.4 m.
- The displacement between CE2TMap2015 and SLDEM2015 was smaller in lunar maria than that in high lands and was smaller on the near side than on the far side. These findings are consistent with the distribution of the five high accuracy control points (i.e., the LRRRs), which were used in CE2TMap2015 production.
- Gross errors were detected using the LOF algorithm based on the displacement vector field. It was found through manual checking that the actual gross errors may have been in CE2TMap2015 or SLDEM2015. The positions of the gross error areas are provided for users to use with caution.
- Systematic errors in the periodic pattern were found for both the CE-3 and CE-4 landing site regions of CE2TMap2015. These periodic errors were mainly in the across-track direction and in the along-track direction after a frequency domain analysis. The issue of periodic error deserves more in-depth investigation in more areas, even globally.
- Local details of CE2TMap2015 and SLDEM2015 for the CE-4 landing site were compared using a recently available LROC NAC DEM as the reference. The two DEMs were generally consistent after co-registration but provided different details in different areas.
The results of this research provide instructional information for the utilization of CE2TMap2015 by world-wide users in various scientific applications. They are also valuable for possible quality improvement of CE2TMap2015 in the future.
At present, planetary DEM products are numerous and usually lack effective and detailed quality assessment and cross-validation. The method proposed and used in this paper can be used in the assessment of other planetary DEMs.
DEMs of the same area derived from different sources usually contain different information because of the different resolutions and illumination conditions of the images. Thus, it is possible and meaningful to combine multi-source DEMs to produce a better DEM. SLDEM2015 is a good example of DEM fusion. The CE2TMap2015 can also supply lots of detailed and complementary information to SLDEM2015. Planetary DEM fusion should be investigated and used in the future.
Author Contributions
Conceptualization: B.L. and K.D.; data curation: X.X. and K.D.; formal analysis: X.X., B.L., and S.G.; funding acquisition: B.L., K.D., and Z.Y.; investigation: X.X. and B.L.; methodology: X.X. and B.L.; project administration: B.L.; software: X.X. and B.L.; validation: K.D., Z.Y., and S.G.; visualization: X.X., Z.Y., and S.G.; writing—original draft: X.X. and B.L.; writing—review and editing: X.X., B.L., K.D., Z.Y., and S.G. All authors have read and agreed to the published version of the manuscript.
Funding
This work was supported by the National Natural Science Foundation of China (grant nos. 41941003, 41771490, and 41671458).
Acknowledgments
The authors gratefully acknowledge the Lunar and Deep Space Exploration Science Applications Center of the National Astronomical Observatories for providing the CE2TMap2015. We thank all those who worked on the Planetary Data System archive to make the SLDEM2015 publicly available. We also thank Arizona State University for providing the LROC NAC DEM for the CE-4 landing site. Constructive reviews by three anonymous reviewers improved the quality of this manuscript substantially and are greatly appreciated.
Conflicts of Interest
The authors declare no conflict of interest.
References
- Jin, S.; Arivazhagan, S.; Araki, H. New results and questions of lunar exploration from SELENE, Chang’E-1, Chandrayaan-1 and LRO/LCROSS. Adv. Space Res. 2013, 52, 285–305. [Google Scholar] [CrossRef]
- Rosenburg, M.A.; Aharonson, O.; Head, J.W.; Kreslavsky, M.A.; Mazarico, E.; Neumann, G.A.; Smith, D.E.; Torrence, M.H.; Zuber, M.T. Global surface slopes and roughness of the Moon from the Lunar Orbiter Laser Altimeter. J. Geophys. Res. 2011, 116. [Google Scholar] [CrossRef] [Green Version]
- Yue, Z.; Di, K.; Liu, Z.; Michael, G.; Jia, M.; Xin, X.; Liu, B.; Peng, M.; Liu, J. Lunar regolith thickness deduced from concentric craters in the CE-5 landing area. Icarus 2019, 329, 46–54. [Google Scholar] [CrossRef]
- Wang, J.; Cheng, W.; Luo, W.; Zheng, X.; Zhou, C. An Iterative Black Top Hat Transform Algorithm for the Volume Estimation of Lunar Impact Craters. Remote Sens. 2017, 9, 952. [Google Scholar] [CrossRef] [Green Version]
- Liu, B.; Di, K.; Wang, B.; Tang, G.; Xu, B.; Zhang, L.; Liu, Z. Positioning and precision validation of Chang’E-3 Lander based on multiple LRO NAC images. China Sci. Bull. 2015, 60, 2750–2757. [Google Scholar] [CrossRef] [Green Version]
- Liu, Z.; Di, K.; Peng, M.; Wan, W.; Liu, B.; Li, L.; Yu, T.; Wang, B.; Zhou, J.; Chen, H. High precision landing site mapping and rover localization for Chang’e-3 mission. Sci. China Phys. Mech. Astron. 2014, 58, 1–11. [Google Scholar] [CrossRef]
- Kirk, R.L.; Archinal, B.A.; Gaddis, L.R.; Rosiek, M.R. Lunar cartography: Progress in the 2000s and prospects for the 2010s. Int. Arch. Photogramm. Remote Sens. Spat. Inf. Sci. 2012, XXXIX-B4, 489–494. [Google Scholar] [CrossRef] [Green Version]
- Smith, D.E.; Zuber, M.T.; Neumann, G.A.; Lemoine, F.G.; Mazarico, E.; Torrence, M.H.; McGarry, J.F.; Rowlands, D.D.; Head, J.W.; Duxbury, T.H.; et al. Initial observations from the Lunar Orbiter Laser Altimeter (LOLA). Geophys. Res. Lett. 2010, 37, L18204. [Google Scholar] [CrossRef]
- Barker, M.K.; Mazarico, E.; Neumann, G.A.; Zuber, M.T.; Haruyama, J.; Smith, D.E. A new lunar digital elevation model from the Lunar Orbiter Laser Altimeter and SELENE Terrain Camera. Icarus 2016, 273, 346–355. [Google Scholar] [CrossRef] [Green Version]
- Li, C.; Liu, J.; Ren, X.; Yan, W.; Zuo, W.; Mou, L.; Zhang, H.; Su, Y.; Wen, W.; Tan, X.; et al. Lunar Global High-precision Terrain Reconstruction Based on Chang’e-2 Stereo Images. Geomat. Inf. Sci. Wuhan Univ. 2018, 43, 485–495. [Google Scholar]
- Liu, J.; Ren, X.; Yan, W.; Li, C.; Zhang, H.; Jia, Y.; Zeng, X.; Chen, W.; Gao, X.; Liu, D.; et al. Descent trajectory reconstruction and landing site positioning of Chang’E-4 on the lunar farside. Nat. Commun 2019, 10, 4229. [Google Scholar] [CrossRef] [PubMed] [Green Version]
- Liu, B.; Niu, S.; Xin, X.; Jia, M.; Di, K.; Liu, Z.; Peng, M.; Yue, Z. High precision DTM and DOM generating using multi-source orbital data on Chang’E-4 landing site. In Proceedings of the ISPRS Geospatial Week 2019-GSW2019, “International workshop on Planetary Remote Sensing and Mapping”, Enschede, The Netherlands, 10–14 June 2019; pp. 1413–1417. [Google Scholar]
- Adkins, K.F.; Merry, C.J. Accuracy assessment of elevation data sets using the Global Positioning System. Photogramm. Eng. Remote Sens. 1994, 60, 195–202. [Google Scholar]
- Day, T.; Muller, J.P. Quality assessment of digital elevation models produced by automatic stereomatchers from SPOT image pairs. Photogramm. Rec. 1988, 12, 797–808. [Google Scholar] [CrossRef]
- Archinal, B.A.; Rosiek, M.R.; Kirk, R.L.; Redding, B.L.; The Unified Lunar Control Network 2005. Open-File Rep. 2006. Available online: https://pdfs.semanticscholar.org/2458/f764f87b91fa677c87a2e2d31b39406597de.pdf (accessed on 2 December 2019).
- Archinal, B.A.; Rosiek, M.R.; Kirk, R.L.; Hare, T.L.; Redding, B.L. Final completion of the unified lunar control network 2005 and lunar topographic model. In Proceedings of the 38th Lunar and Planetary Science Conference, League City, TX, USA, 12–16 March 2007; p. 1904. [Google Scholar]
- Di, K.; Liu, B.; Peng, M.; Xin, X.; Jia, M.; Zuo, W.; Ping, J.; Wu, B.; Oberst, J. An Initiative for Construction of New-Generation Lunar Global Control Network Using Multi-Mission Data. ISPRS Int. Arch. Photogramm. Remote Sens. Spat. Inf. Sci. 2017, XLII-3/W1, 29–34. [Google Scholar] [CrossRef] [Green Version]
- Cai, Z.C.; Zheng, C.M.; Tang, Z.S.; Qi, D.X. Lunar digital elevation model and elevation distribution model based on Chang’E-1 LAM data. Sci. China Tech. Sci. 2010, 40, 2558–2568. [Google Scholar] [CrossRef]
- Lee, H.; Hahn, M. KOMPSAT-3 Digital Elevation Model Correction Based on Point-to-Surface Matching. Remote Sens. 2019, 11, 2340. [Google Scholar] [CrossRef] [Green Version]
- Gruen, A.; Akca, D. Least squares 3D surface and curve matching. ISPRS J. Photogramm. Remote Sens. 2005, 59, 151–174. [Google Scholar] [CrossRef] [Green Version]
- Besl, P.; McKay, N. A method for registration of 3-D shapes. IEEE Trans. Pattern Anal. Mach. Intell. 1992, 14, 239–256. [Google Scholar] [CrossRef]
- Rosenholm, D.; Torlegard, K. Three-dimensional absolute orientation of stereo models using digital elevation models. Photogramm. Eng. Remote Sens. 1988, 54, 1385–1389. [Google Scholar]
- Guo, J.; Wu, B. Comparison of lunar topographic models derived from multiple sources based on least squares matching. Int. Arch. of the Photogramm. Remote Sens. Spat. Inf. Sci. 2012, XXXIX-B4, 313–319. [Google Scholar]
- Kim, J.R.; Muller, J.P.; Morley, J. Automated MOLA track registration in MOC and Viking images and it’s application for the establishment of new 3-D control points on Mars. Int. Arch. Photogramm. Remote Sens. Spat. Inf. Sci. 2000, XXXⅢ, 469–475. [Google Scholar]
- Wu, B.; Guo, J.; Hu, H.; Li, Z.; Chen, Y. Co-registration of lunar topographic models derived from Chang’E-1, SELENE, and LRO laser altimeter data based on a novel surface matchingmethod. Earth Planet. Sci. Lett. 2013, 364, 68–84. [Google Scholar] [CrossRef]
- Michael, G.G. Coordinate registration by automated crater recognition. Planet. Space Sci. 2003, 51, 563–568. [Google Scholar] [CrossRef]
- Oksanen, J. Tracing the gross errors of DEM-visiualization techniques for preliminary quality analysis. In Proceedings of the 21st International Cartographic Conference, Durban, South Africa, 10–16 August 2003; pp. 2410–2416. [Google Scholar]
- Hunter, G.J.; Goodchild, M.F. A new model for handling vector data uncertainty in geographic information systems. In Proceedings of the URISA ‘95, San Antonio, TX, USA, 16–20 July 1995; pp. 410–419. [Google Scholar]
- Hobbs, K.F. An investigation of RGB multi-band shading for relief visualisation. Int. J. Appl. Earth Obs. Geoinf. 1999, 1-3/4, 181–186. [Google Scholar] [CrossRef]
- Wilson, J.P.; Gallant, J.C. Terrain Analysis: Principles and Applications; John Wiley & Sons, Inc.: Hoboken, NJ, USA, 2000. [Google Scholar]
- Karkee, M.; Steward, B.L.; Aziz, S.A. Improving quality of public domain digital elevation models through data fusion. Biosyst. Eng. 2008, 101, 293–305. [Google Scholar] [CrossRef]
- Morel, J.-M.; Yu, G. ASIFT: A New Framework for Fully Affine Invariant Image Comparison. Siam J. Imaging Sci. 2009, 2, 438–469. [Google Scholar] [CrossRef]
- Li, C.L.; Ren, X.; Liu, J.J.; Wang, F.F.; Wang, W.R.; Yan, W.; Zhang, G.H. A new global and high resolution topographic map product of the moon from Chang’E-2 image data. In Proceedings of the 46th Lunar and Planetary Science Conference, The Woodlands, TX, USA, 16–20 March 2015; p. 1638. [Google Scholar]
- Ren, X.; Liu, J.; Li, C.; Li, H.; Yan, W.; Wang, F.; Wang, W.; Zhang, X.; Gao, X.; Chen, W. A global adjustment method for photogrammetric processing of Chang’E-2 stereo images. IEEE Trans. Geosci. Remote Sens. 2019, 57, 6832–6843. [Google Scholar] [CrossRef]
- Goossens, S.; Mazarico, E.; Lemoine, F.G.; Rowlands, D.D.; Neumann, G.A.; Torrence, M.H.; Smith, D.E.; Zuber, M.T. Improved precision orbit determination of lunar orbiters from the GRAIL-derived lunar gravity models. Proceedings of 23rd AAS/AIAA Space Flight Mechanics Meeting, Kauai, HI, USA, 10–14 February 2013; pp. 13–274. [Google Scholar]
- Haruyama, J.; Hara, S.; Hioki, K.; Iwasaki, A.; Morota, T.; Ohtake, M.; Matsunaga, T.; Araki, H.; Matsumoto, K.; Ishihara, Y.; et al. Lunar global digital terrain model dataset produced from SELENE (KAGUYA) terrain camera stereo observations. In Proceedings of the 43rd Lunar and Planetary Science Conference, The Woodlands, TX, USA, 19–23 March 2012; p. 1200. [Google Scholar]
- Horn, B.K.P.; Bachman, B.L. Using synthetic images to register real images with surface models. Graph. Image Process. 1978, 21, 914–924. [Google Scholar] [CrossRef] [Green Version]
- Horn, B.K.P. Hill shading and the reflectance map. Proc. IEEE 1981, 69, 14–47. [Google Scholar] [CrossRef] [Green Version]
- McKay, D.S.; Heiken, G.; Basu, A.; Blanford, G.; Simon, S.; Reedy, R.; French, B.M.; Papike, J. The lunar regolith. In Lunar Sourcebook; Heiken, G., Vaniman, D., French, B.M., Eds.; Cambridge University Press: Cambridge, UK, 1991; pp. 285–356. [Google Scholar]
- Yu, G.; Morel, J.-M. ASIFT: An Algorithm for Fully Affine Invariant Comparison. Image Process. Line 2011, 1, 11–38. [Google Scholar] [CrossRef] [Green Version]
- Fischler, M.A.; Bolles, R.C. Random Sample Consensus: A Paradigm for Model Fitting with Applications to Image Analysis and Automated Cartography. Read. Comput. Vis. 1987, 726–740. [Google Scholar] [CrossRef]
- Breunig, M.M.; Kriegel, H.-P.; Ng, R.T.; Sander, J. LOF: Identifying Density-Based Local Outliers. In Proceedings of the 2000 ACM SIGMOD International Conference on Management of Data, Dallas, TX, USA, 16–18 May 2000; pp. 93–104. [Google Scholar]
- Bracewell, R.N. The Fourier Transform and Its Application, 3rd ed.; McGrawHill: New York, NY, USA, 2000. [Google Scholar]
- Mather, P.M. Computer Processing of Remotely-Sensed Images: An Introduction, 3rd ed.; John Wiley & Sons: Hoboken, NJ, USA, 2004. [Google Scholar]
Figure 1.
Flowchart of the proposed method. ASIFT: affine scale invariant feature transform, DEM: digital elevation model.
Figure 1.
Flowchart of the proposed method. ASIFT: affine scale invariant feature transform, DEM: digital elevation model.

Figure 2.
An example of a DEM position error: (a) a local area of CE2TMap2015 with a phantom crater in the red dashed rectangle and (b) CE-2 digital ortho map (DOM) of the same area.
Figure 2.
An example of a DEM position error: (a) a local area of CE2TMap2015 with a phantom crater in the red dashed rectangle and (b) CE-2 digital ortho map (DOM) of the same area.

Figure 3.
Examples of DEM matching results of one block: (a) SLDEM2015, (b) CE2TMap2015, (c) simulated image (SLDEM2015), (d) tie points (SLDEM2015), (e) tie points after random sample consensus (RANSAC; SLDEM2015), (f) final tie points (SLDEM2015), (g) simulated image (CE2TMap2015), (h) tie points (CE2TMap2015), (i) tie points after RANSAC (CE2TMap2015), and (j) final tie points (CE2TMap2015).

Figure 4.
Examples of the displacement vector field in each block. The coordinates of lower-left corner from (a) to (f) are (180°W, 45°N), (0°, 45°N), (180°W, 0°), (0°, 0°), (180°W, 45°S), (0°, 45°S).
Figure 4.
Examples of the displacement vector field in each block. The coordinates of lower-left corner from (a) to (f) are (180°W, 45°N), (0°, 45°N), (180°W, 0°), (0°, 0°), (180°W, 45°S), (0°, 45°S).

Figure 5.
An example of the gross error extraction results in one block: (a) gross errors marked as red displacement vectors and (b) DEM patches of the rectangle areas in (a). The upper DEM was from CE2TMap2015, and the lower one was from SLDEM2015.
Figure 5.
An example of the gross error extraction results in one block: (a) gross errors marked as red displacement vectors and (b) DEM patches of the rectangle areas in (a). The upper DEM was from CE2TMap2015, and the lower one was from SLDEM2015.

Figure 6.
Gross error extraction result.

Figure 7.
An example of a gross error area in SLDEM2015: (a) hillshade of SLDEM2015 revealing apparent artifacts and (b) hillshade of CE2TMap2015.
Figure 7.
An example of a gross error area in SLDEM2015: (a) hillshade of SLDEM2015 revealing apparent artifacts and (b) hillshade of CE2TMap2015.

Figure 8.
Displacement vector field between CE2TMap2015 and SLDEM2015 at a 5° spacing.

Figure 9.
Color-coded map of planimetric and elevation difference at a 1° spacing: (a) color-coded map of the magnitude of planimetric offsets and (b) elevation difference between CE2TMap2015 and SLDEM2015.
Figure 9.
Color-coded map of planimetric and elevation difference at a 1° spacing: (a) color-coded map of the magnitude of planimetric offsets and (b) elevation difference between CE2TMap2015 and SLDEM2015.

Figure 10.
Distribution of X, Y, and Z (longitude, latitude, and elevation) offsets between CE2TMap2015 and SLDEM2015. The X and Y bin size was 10 m, and the Z bin size was 2 m.
Figure 10.
Distribution of X, Y, and Z (longitude, latitude, and elevation) offsets between CE2TMap2015 and SLDEM2015. The X and Y bin size was 10 m, and the Z bin size was 2 m.

Figure 11.
Elevation differences between CE2TMap2015 and SLDEM2015: (a,b) are the elevation difference between the original CE2TMap2015 and SLDEM2015 in the Von Kármán crater and Sinus Iridum, respectively; (c,d) are the elevation differences between the co-registered CE2TMap2015 and SLDEM2015 in the Von Kármán crater and Sinus Iridum.

Figure 12.
Profile analysis of the periodic errors: (a) periodic errors extracted from Figure 11c, (b) periodic errors extracted from Figure 11d, (c) profile of AA’ in (a), (d) profile of CC’ in (b), (e) profile of BB’ in (a), and (f) profile of DD’ in (b).


Figure 13.
Comparison of plot AA’ and CC’.

Figure 14.
Elevation profile analysis: (a) SLDEM2015 for the Von Kármán crater, (b) profiles of the black line in (a), (c) zoomed-in profile of area A in (a), and (d) zoomed-in profile of area B in (a).
Figure 14.
Elevation profile analysis: (a) SLDEM2015 for the Von Kármán crater, (b) profiles of the black line in (a), (c) zoomed-in profile of area A in (a), and (d) zoomed-in profile of area B in (a).

Figure 15.
Comparisons of the DEMs for the CE-4 lading site: (a) LROC NAC DEM, (b) SLDEM2015, and (c) CE2TMap2015. The red dotted rectangle and red arrow points to the area where CE2TMap2015 showed more details than SLDEM2015. The blue arrows point out the details that are only visible in SLEDM2015. Lastly, the red star shows the CE-4 landing point.


Table 1.
The positions of the sub-blocks with gross errors.
| Longitude of Lower-Left Corner | Latitude of Lower-Left Corner | DEM That the Low-Quality or Gross Error Was Located In |
|---|---|---|
| 58°W | 0° | CE2TMap2015 |
| 58°W | 1°N | CE2TMap2015 |
| 58°W | 2°N | CE2TMap2015 |
| 57°W | 0° | CE2TMap2015 |
| 57°W | 1°N | CE2TMap2015 |
| 57°W | 4°N | CE2TMap2015 |
| 48°W | 7°N | CE2TMap2015 |
| 48°W | 8°N | CE2TMap2015 |
| 48°W | 9°N | CE2TMap2015 |
| 48°W | 10°N | CE2TMap2015 |
| 48°W | 11°N | CE2TMap2015 |
| 48°W | 13°N | CE2TMap2015 |
| 9°W | 2°N | CE2TMap2015 |
| 13°E | 28°N | CE2TMap2015 |
| 168°W | 58°S | SLDEM2015 |
| 127°W | 29°S | SLDEM2015 |
| 108°W | 28°S | SLDEM2015 |
| 105°W | 32°S | SLDEM2015 |
| 105°W | 31°S | SLDEM2015 |
| 105°W | 18°S | SLDEM2015 |
| 104°W | 48°S | SLDEM2015 |
| 18°W | 48°N | SLDEM2015 |
| 149°E | 50°S | SLDEM2015 |
| 151°E | 60°S | SLDEM2015 |
| 154°E | 49°S | SLDEM2015 |
| 160°E | 51°S | SLDEM2015 |
| 170°E | 58°S | SLDEM2015 |
© 2020 by the authors. Licensee MDPI, Basel, Switzerland. This article is an open access article distributed under the terms and conditions of the Creative Commons Attribution (CC BY) license (http://creativecommons.org/licenses/by/4.0/).
Share and Cite
MDPI and ACS Style
Xin, X.; Liu, B.; Di, K.; Yue, Z.; Gou, S. Geometric Quality Assessment of Chang’E-2 Global DEM Product. Remote Sens. 2020, 12, 526. https://doi.org/10.3390/rs12030526
AMA Style
Xin X, Liu B, Di K, Yue Z, Gou S. Geometric Quality Assessment of Chang’E-2 Global DEM Product. Remote Sensing. 2020; 12(3):526. https://doi.org/10.3390/rs12030526
Chicago/Turabian StyleXin, Xin, Bin Liu, Kaichang Di, Zongyu Yue, and Sheng Gou. 2020. "Geometric Quality Assessment of Chang’E-2 Global DEM Product" Remote Sensing 12, no. 3: 526. https://doi.org/10.3390/rs12030526
Note that from the first issue of 2016, this journal uses article numbers instead of page numbers. See further details here.