Land Subsidence Response to Different Land Use Types and Water Resource Utilization in Beijing-Tianjin-Hebei, China

 ,
, 
Abstract
:
1. Introduction
2. Study Area and Data Source
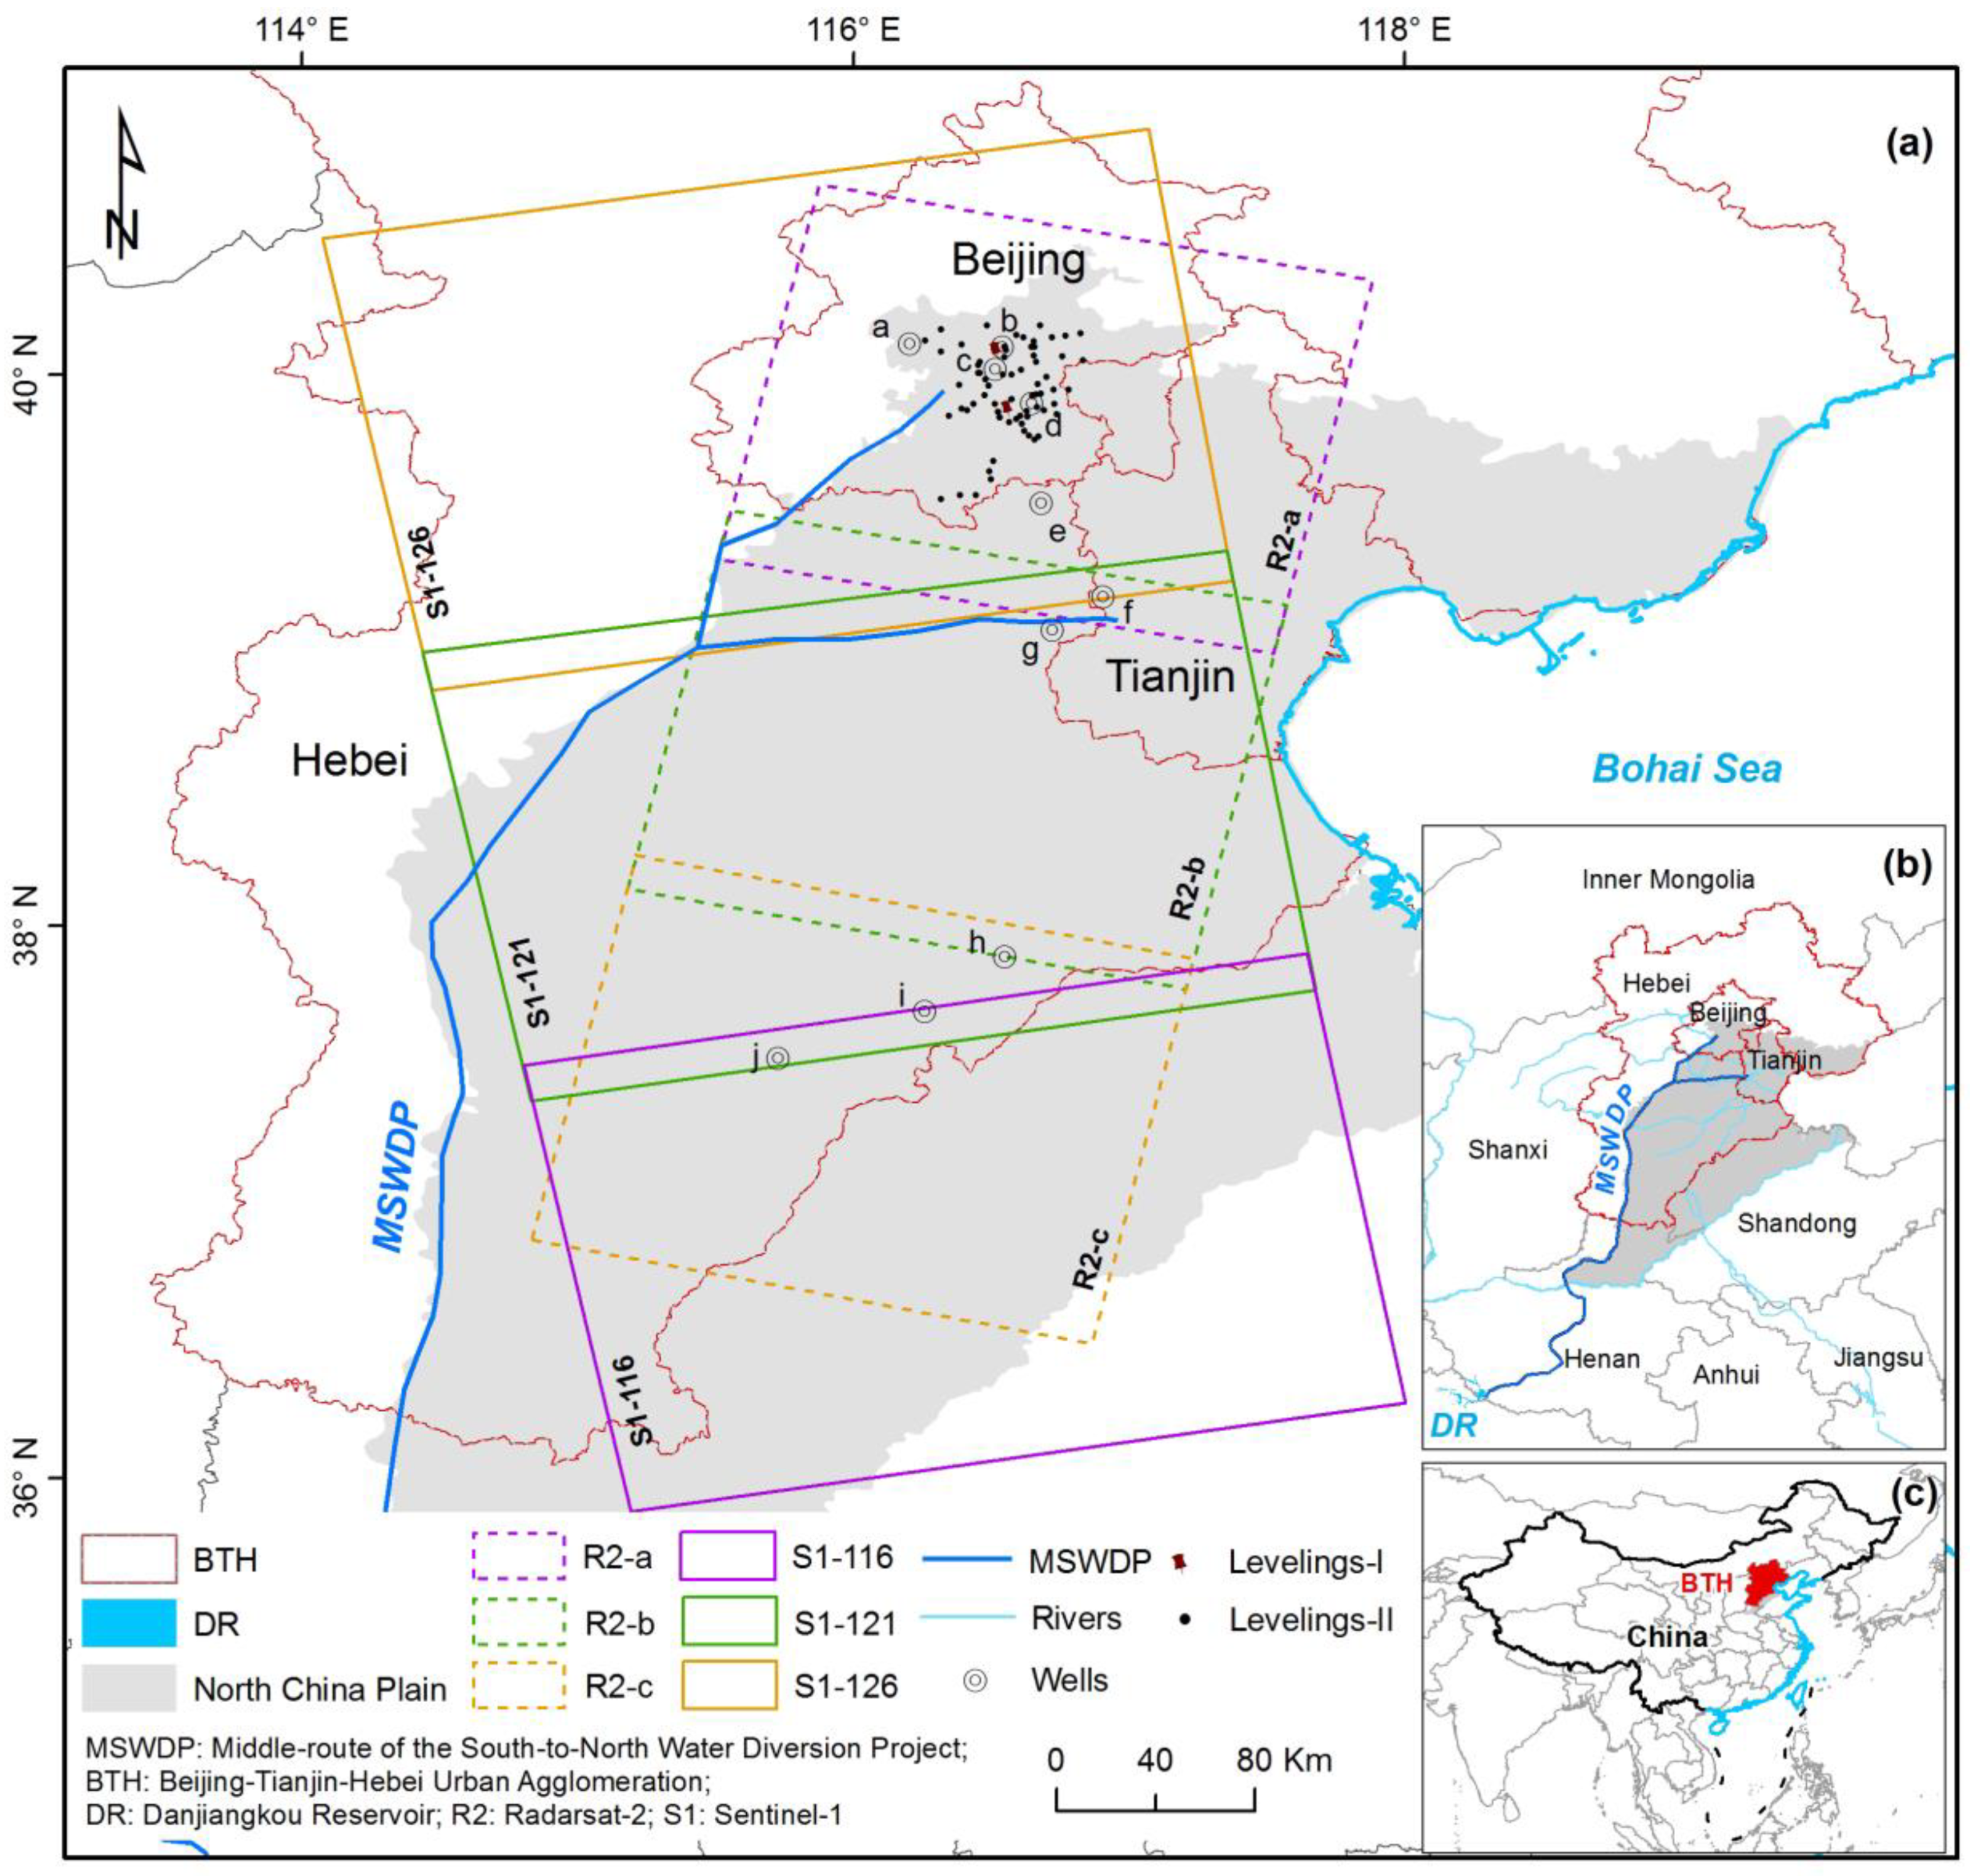
2.1. Study Area
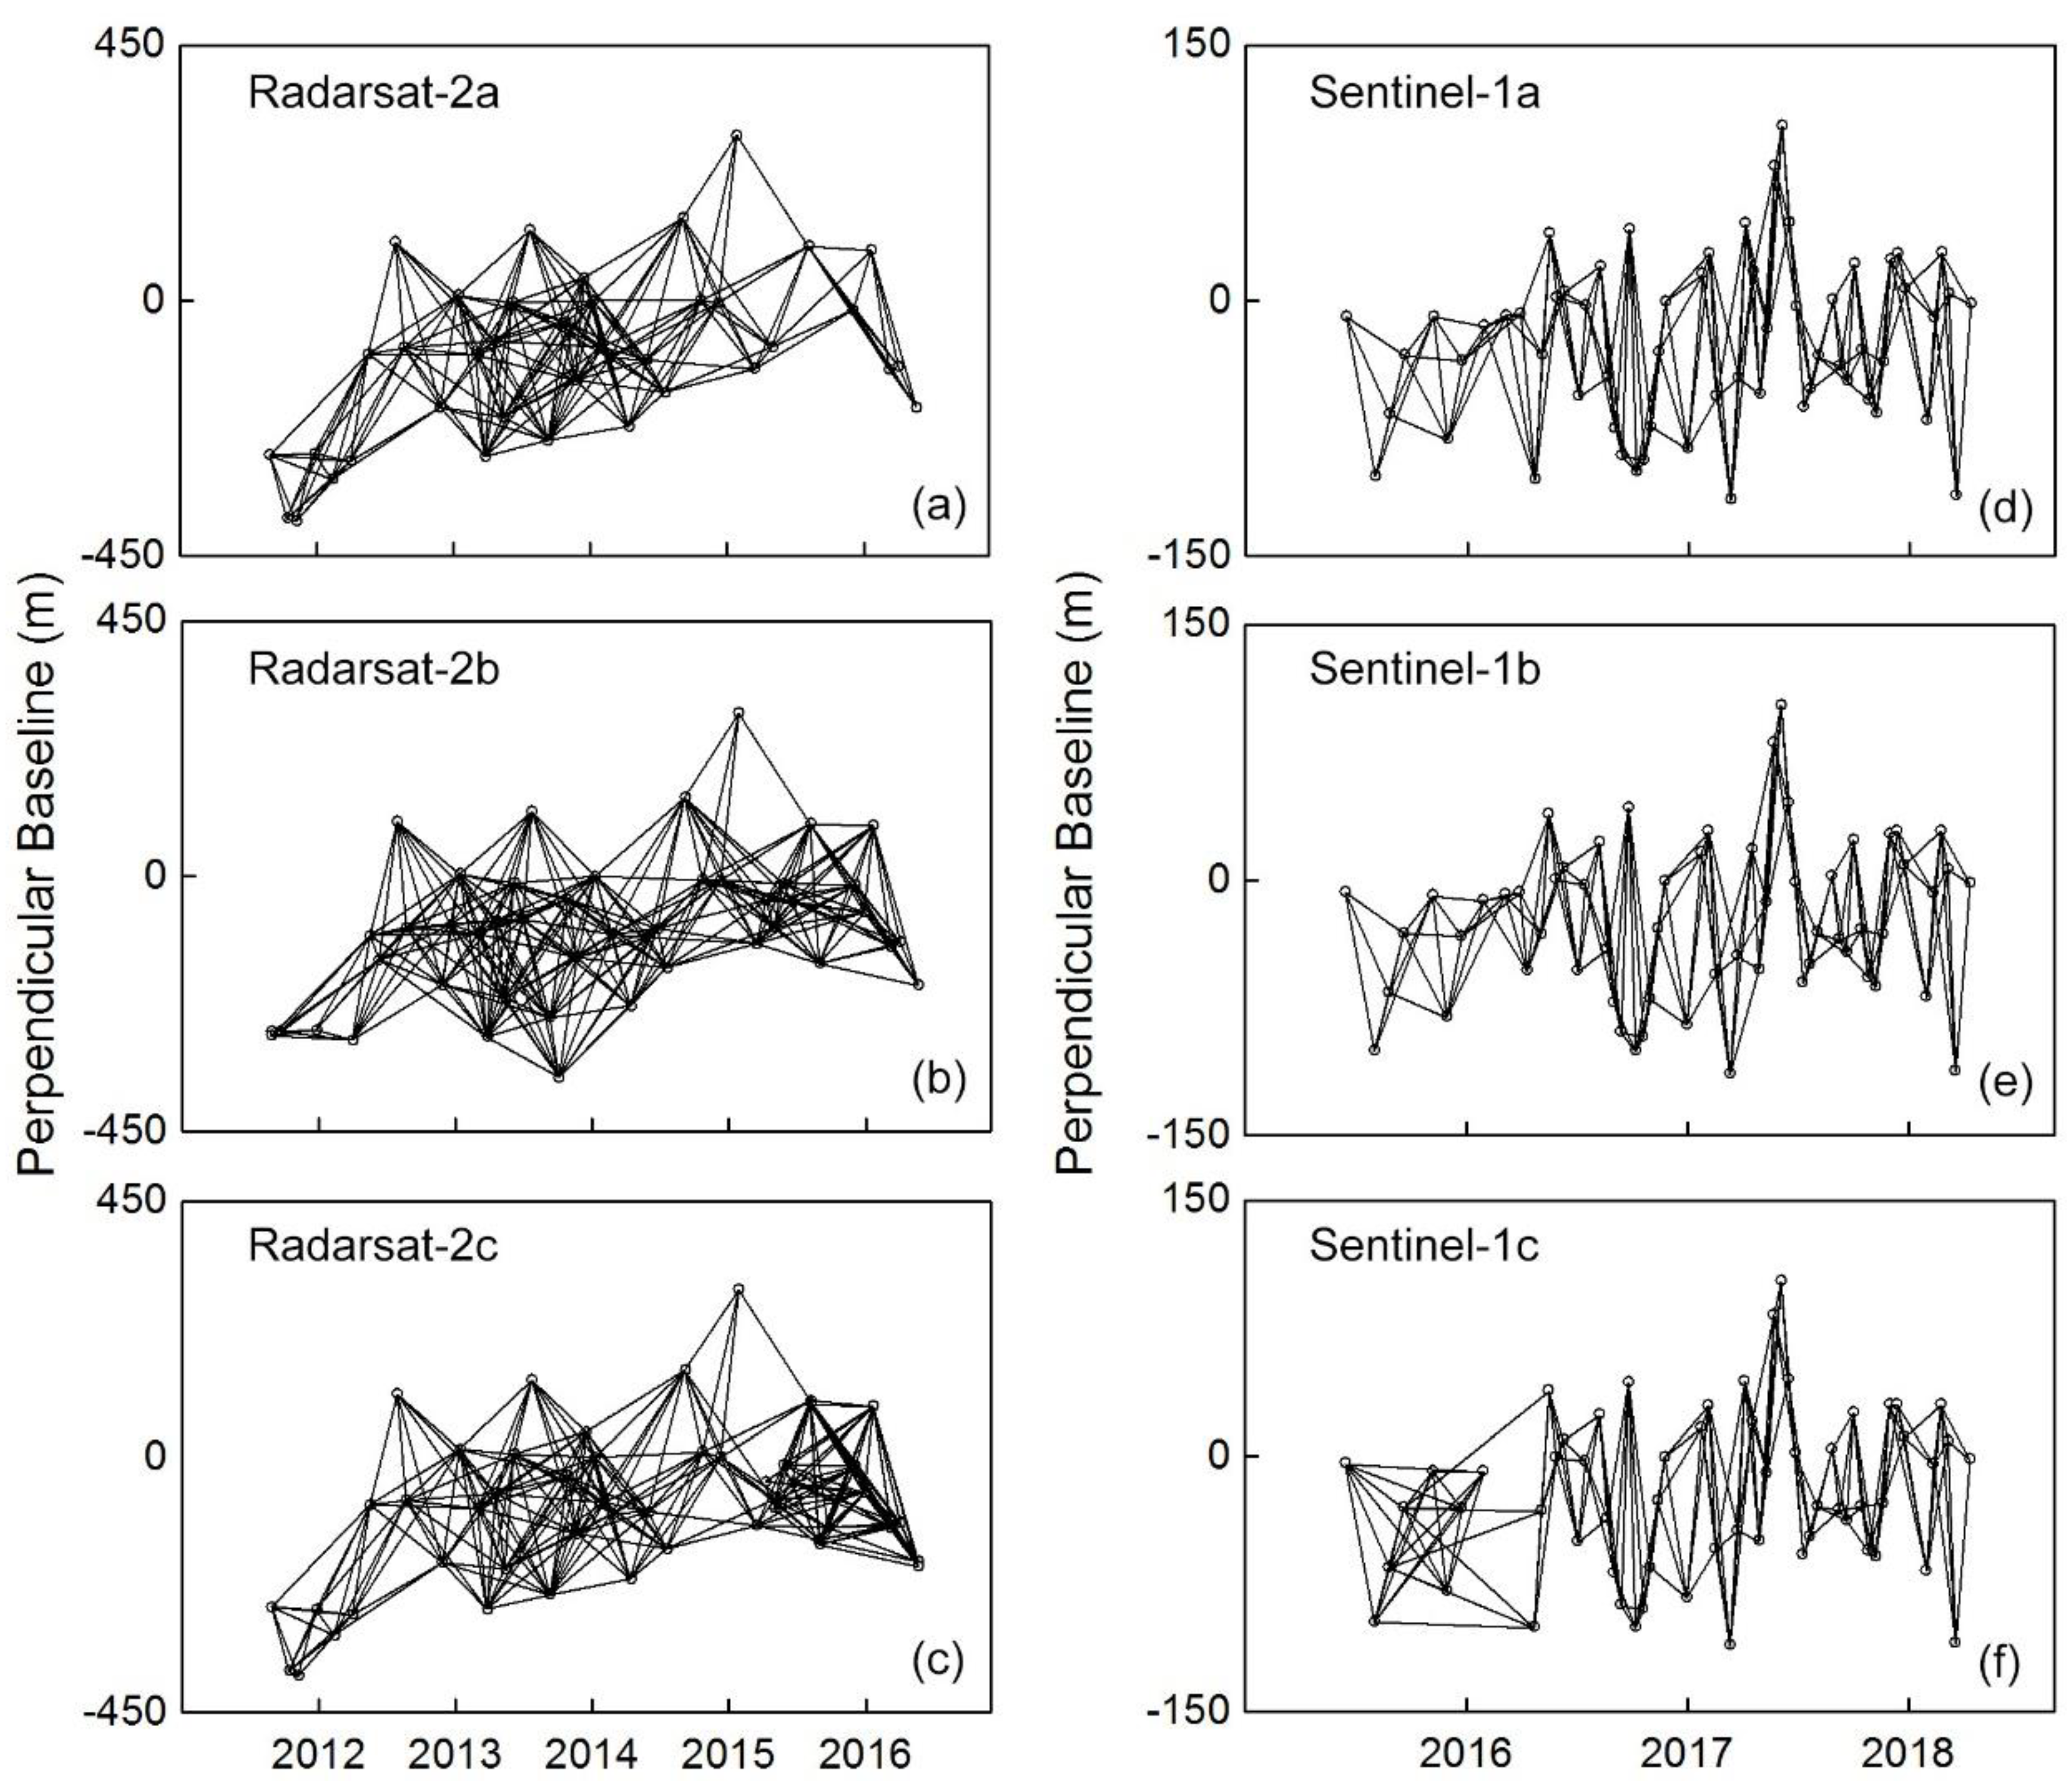
2.2. Data Source
3. Methods
3.1. IPTA
3.2. Merging the InSAR Monitoring Results
3.3. Impulse Responses Function
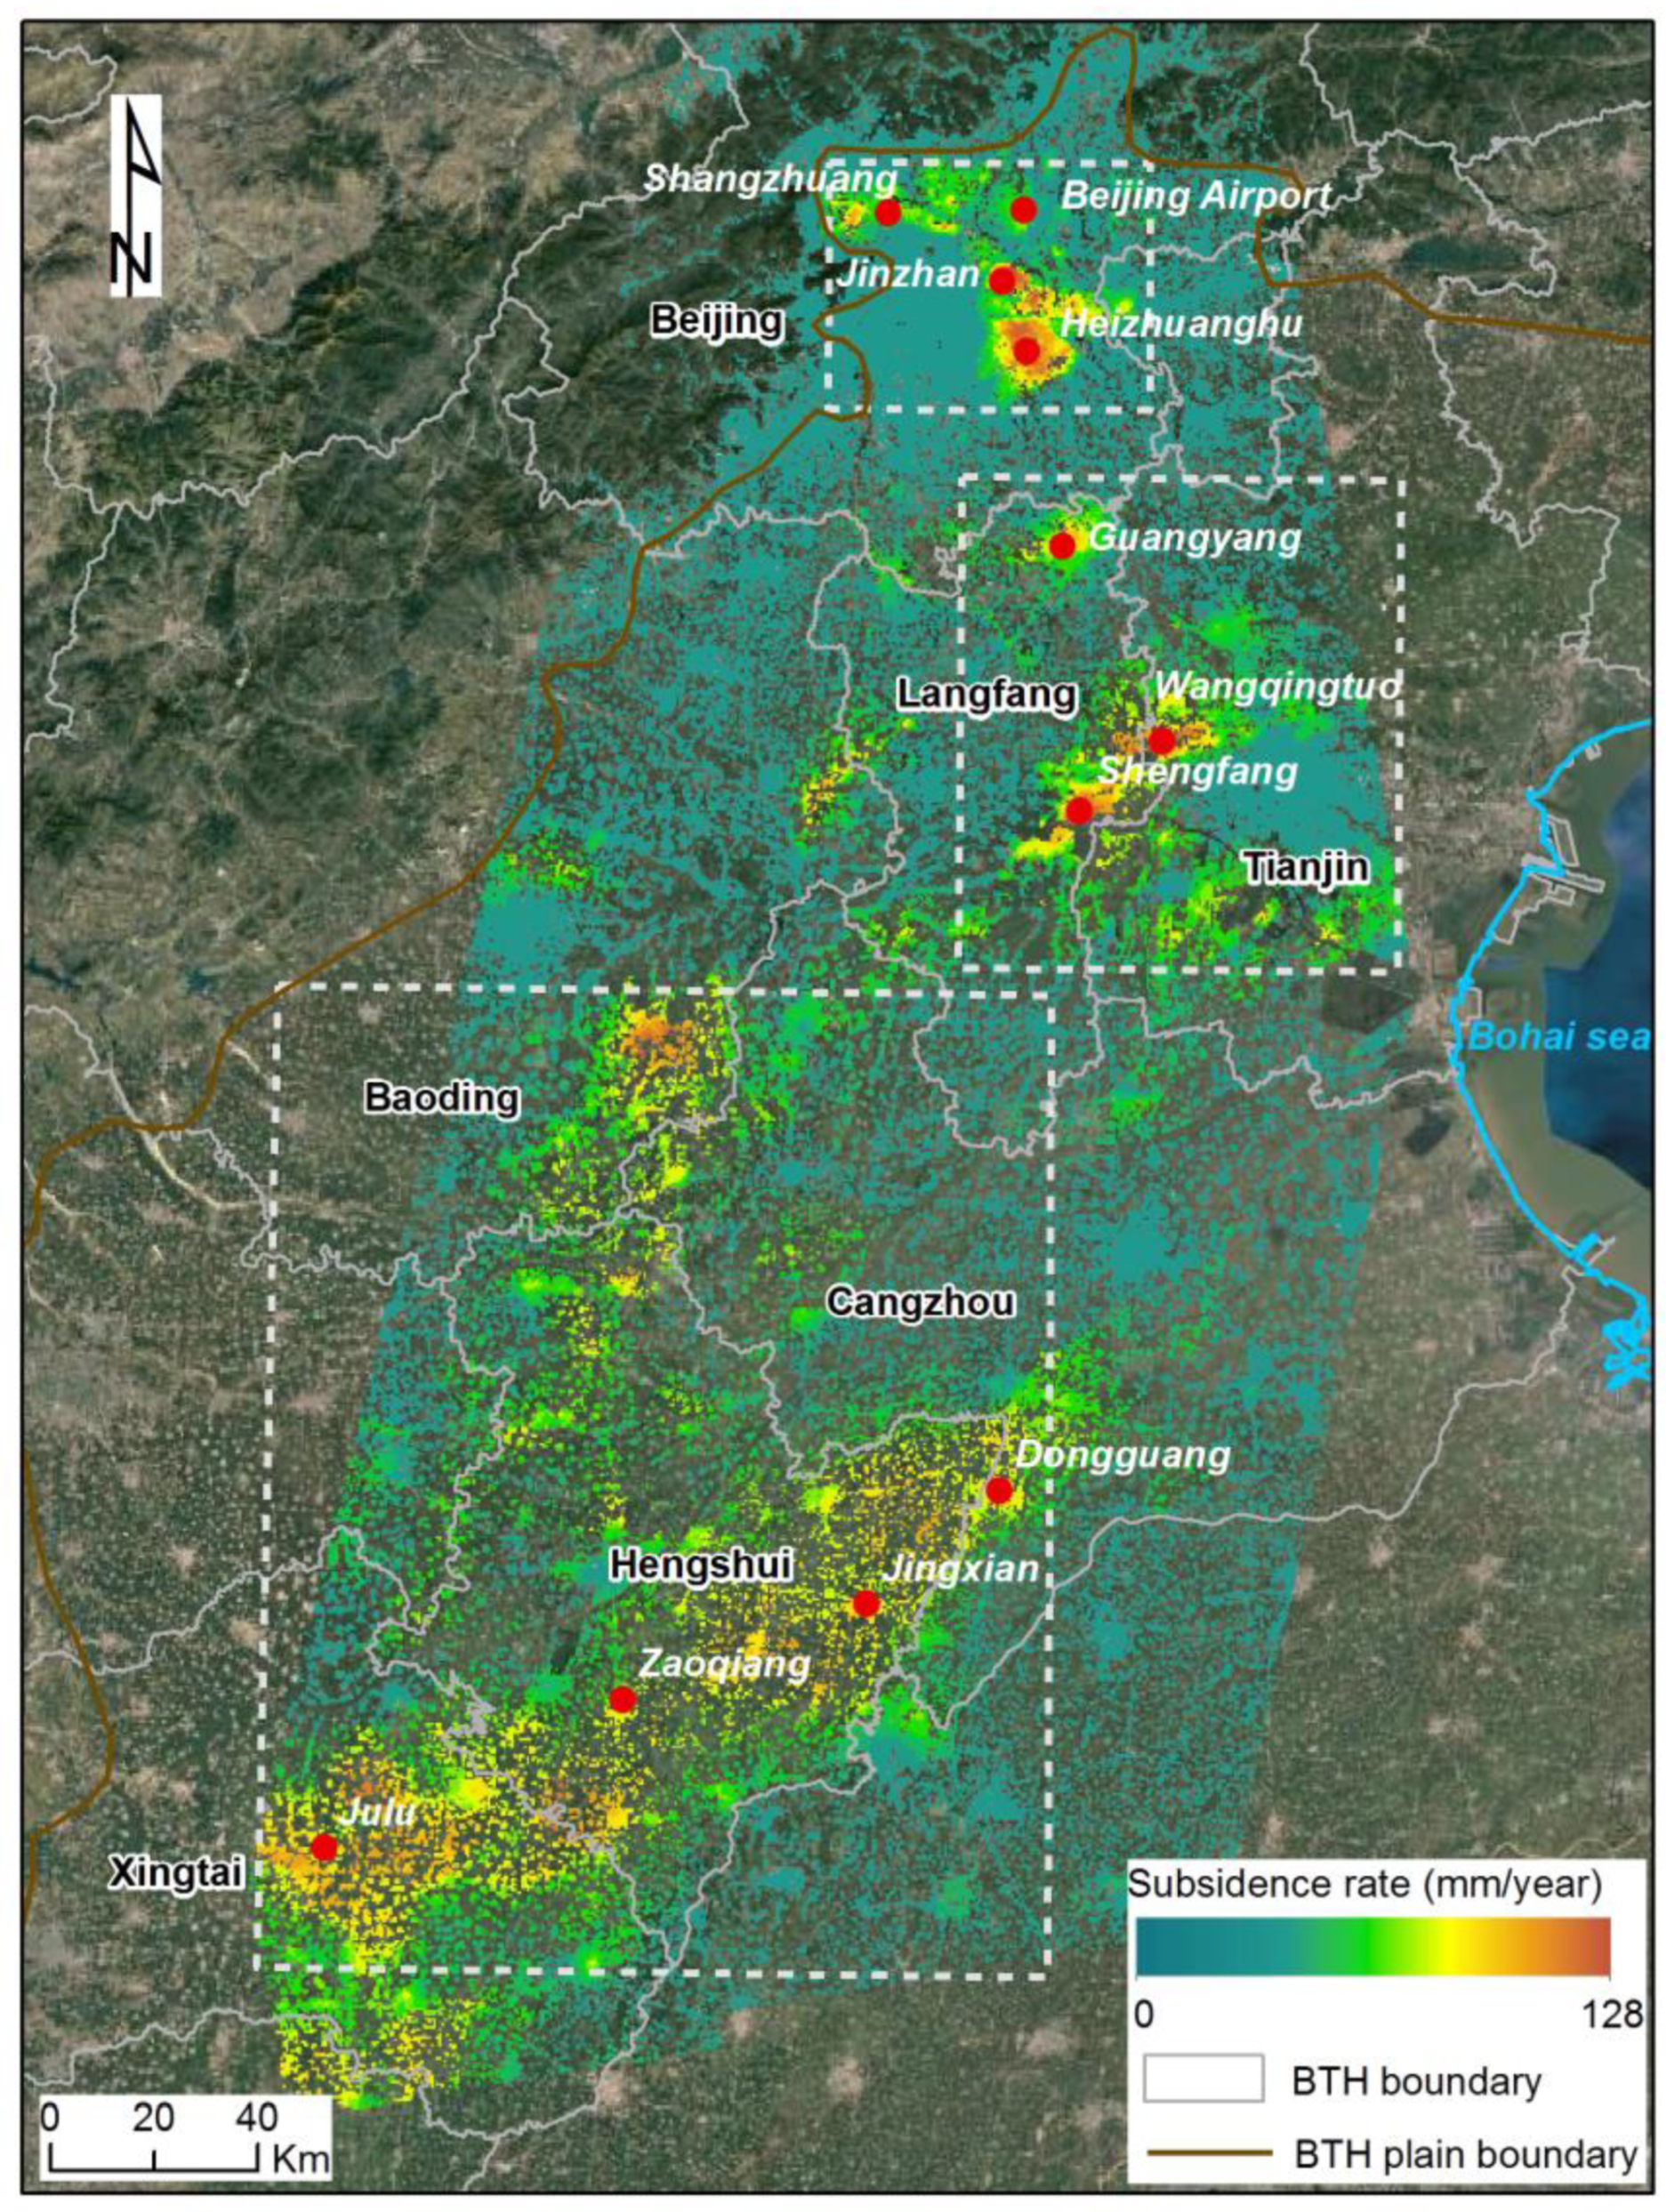
4. Results
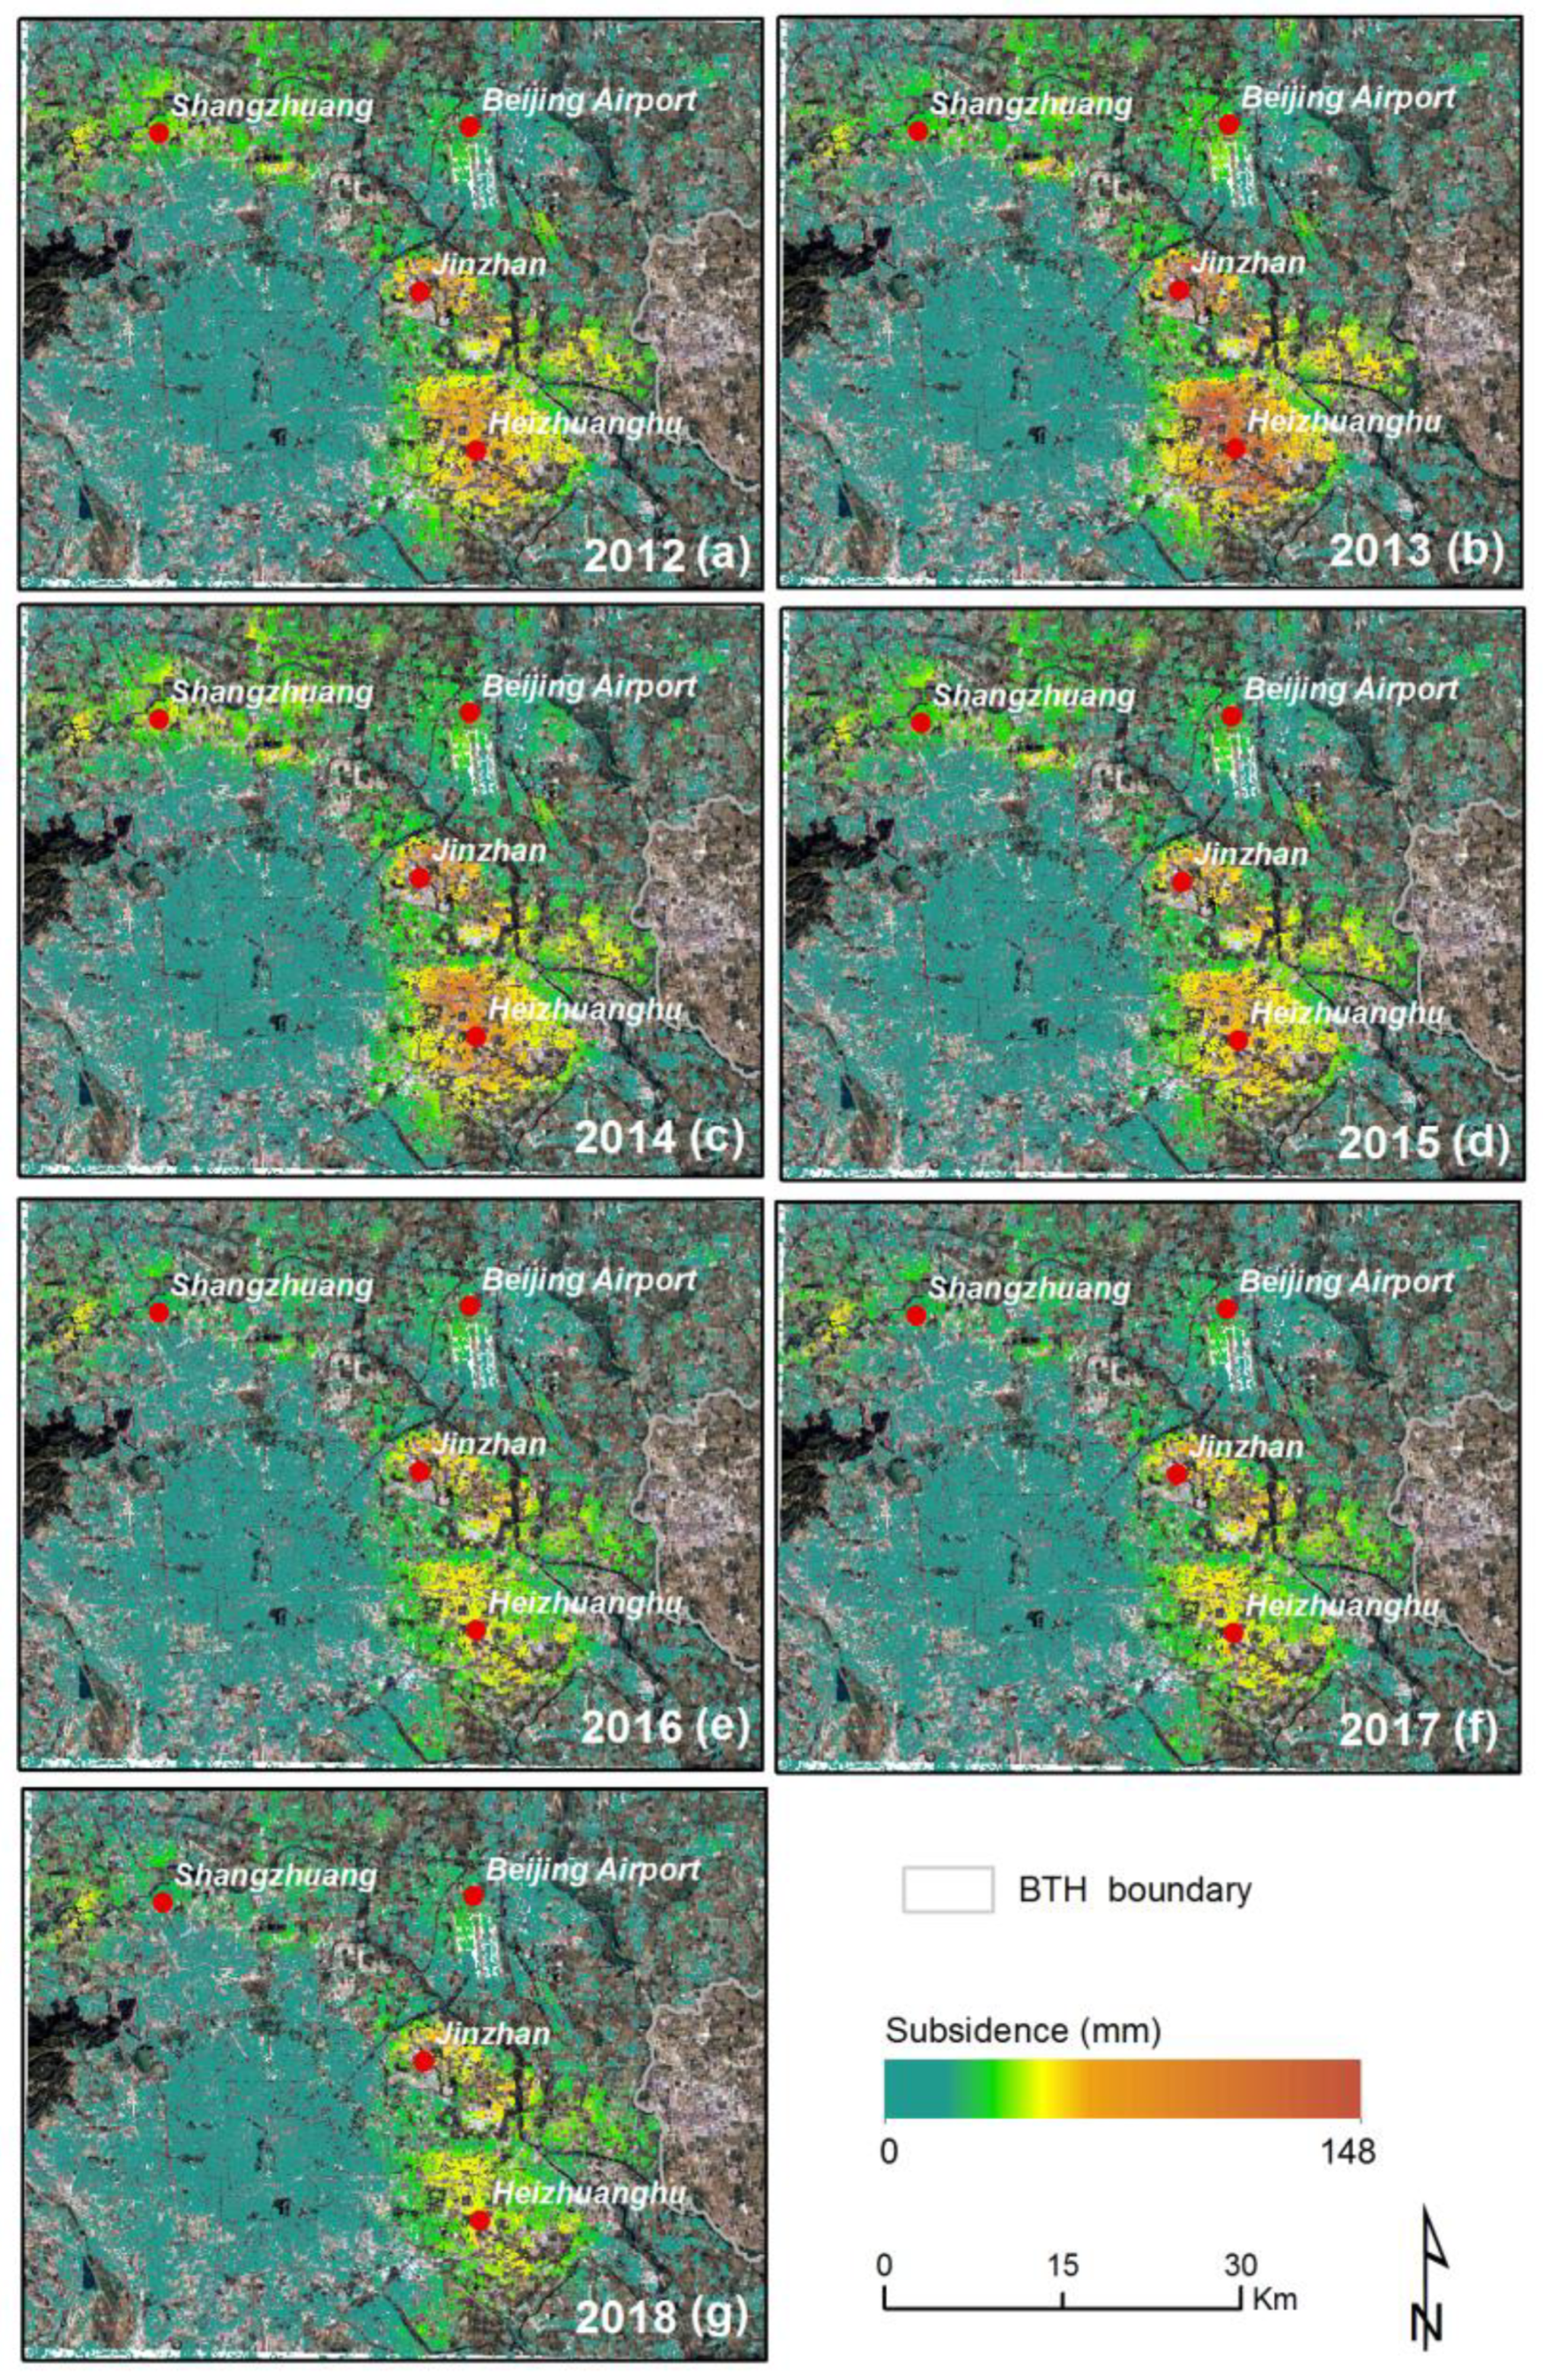
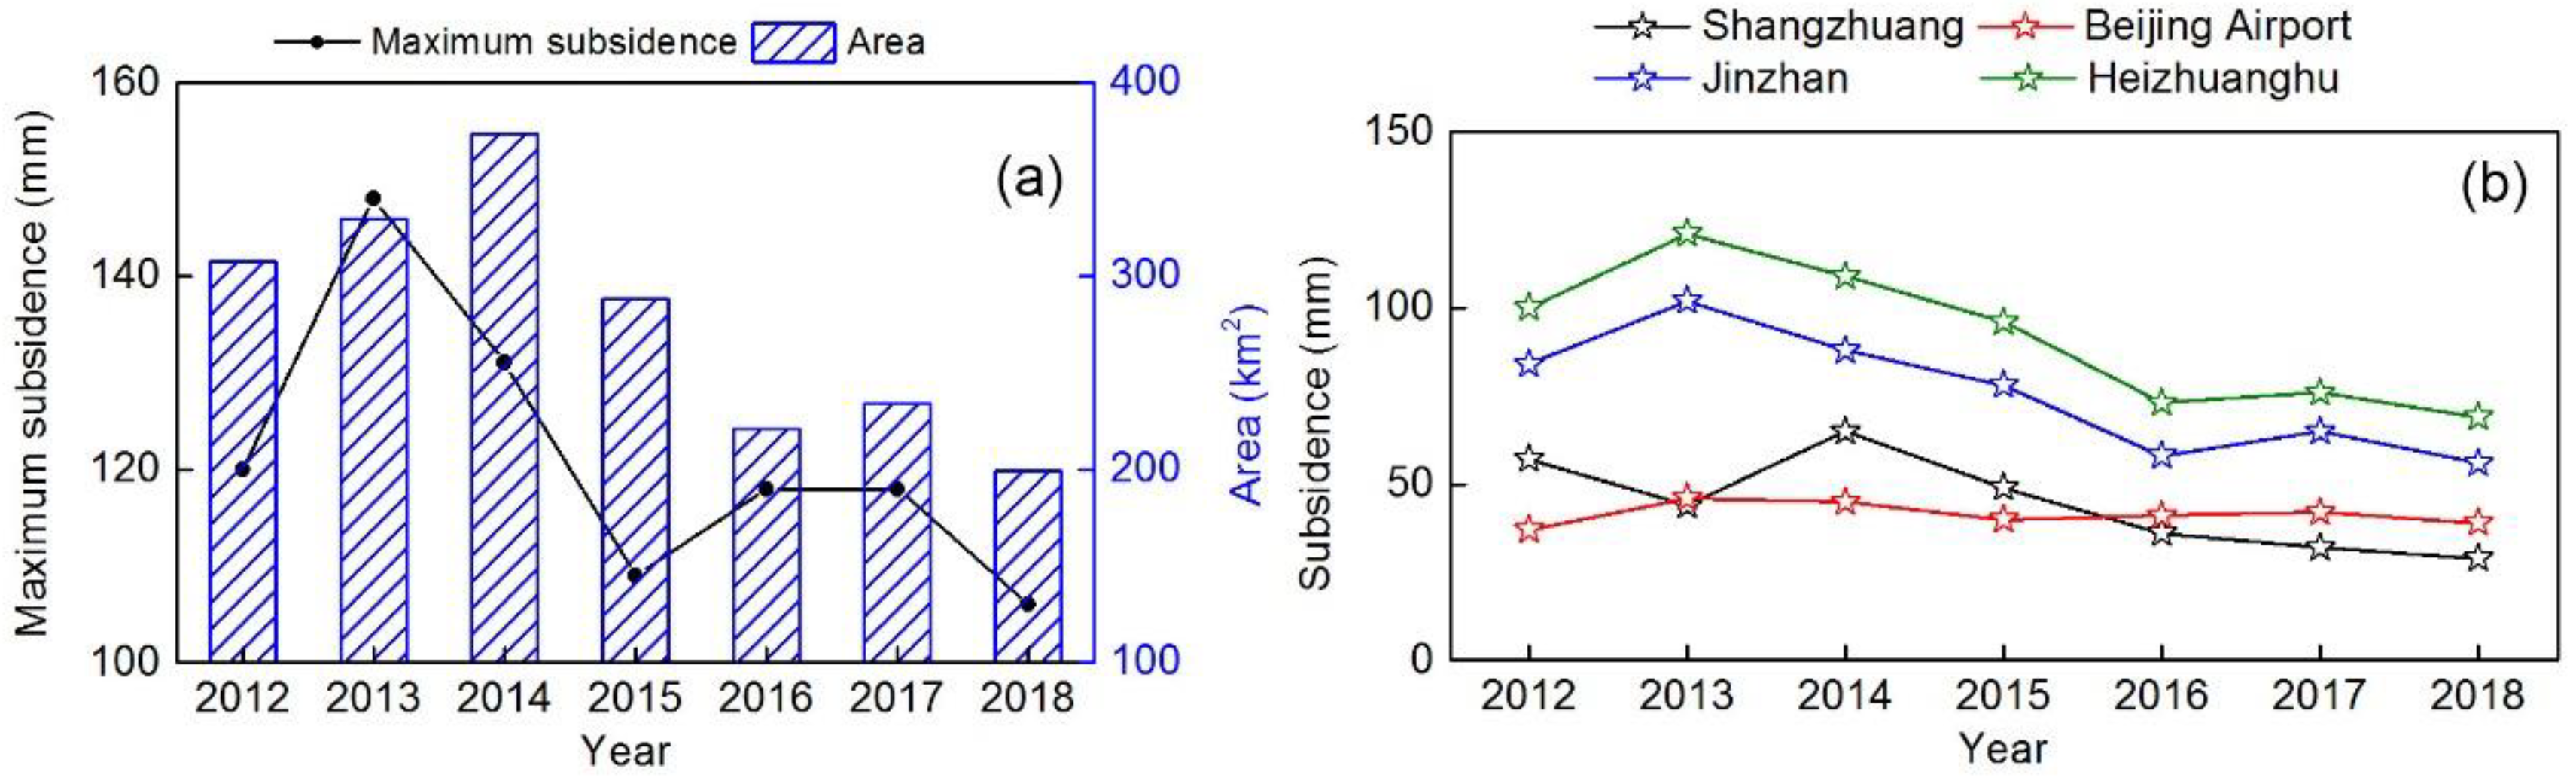
4.1. Land Subsidence in Beijing
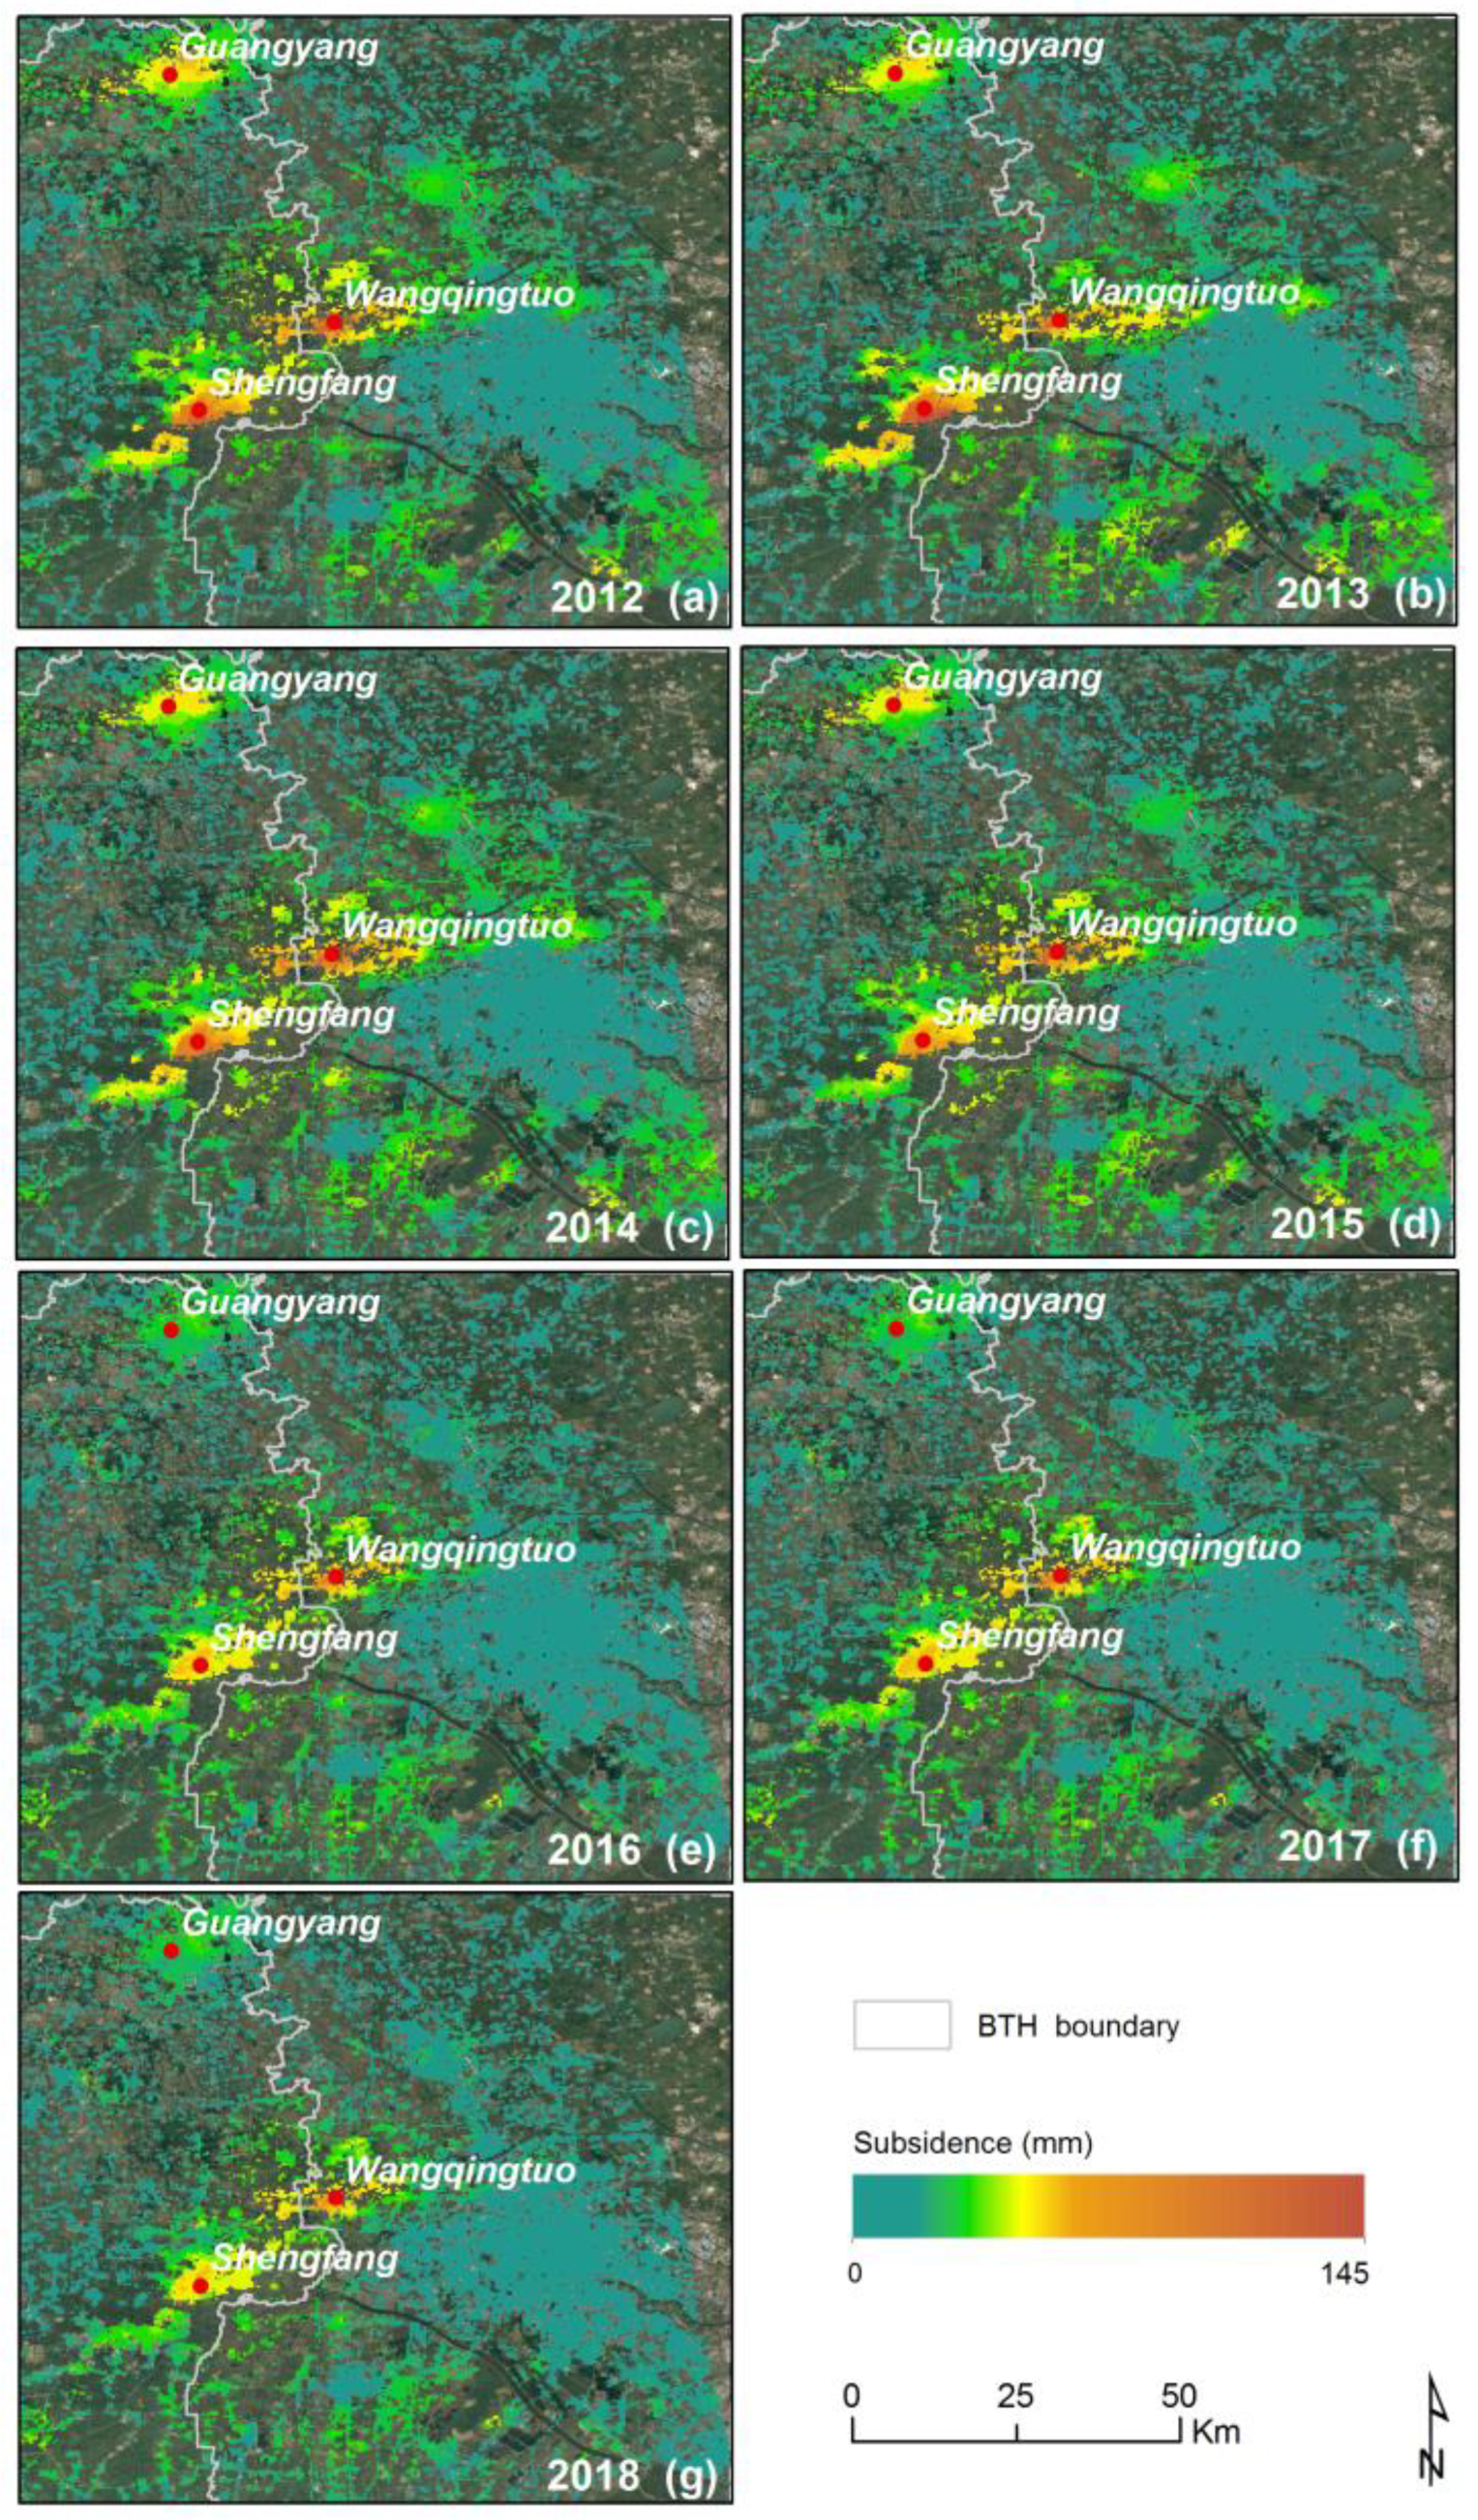
4.2. Land Subsidence in Langfang, Tianjin
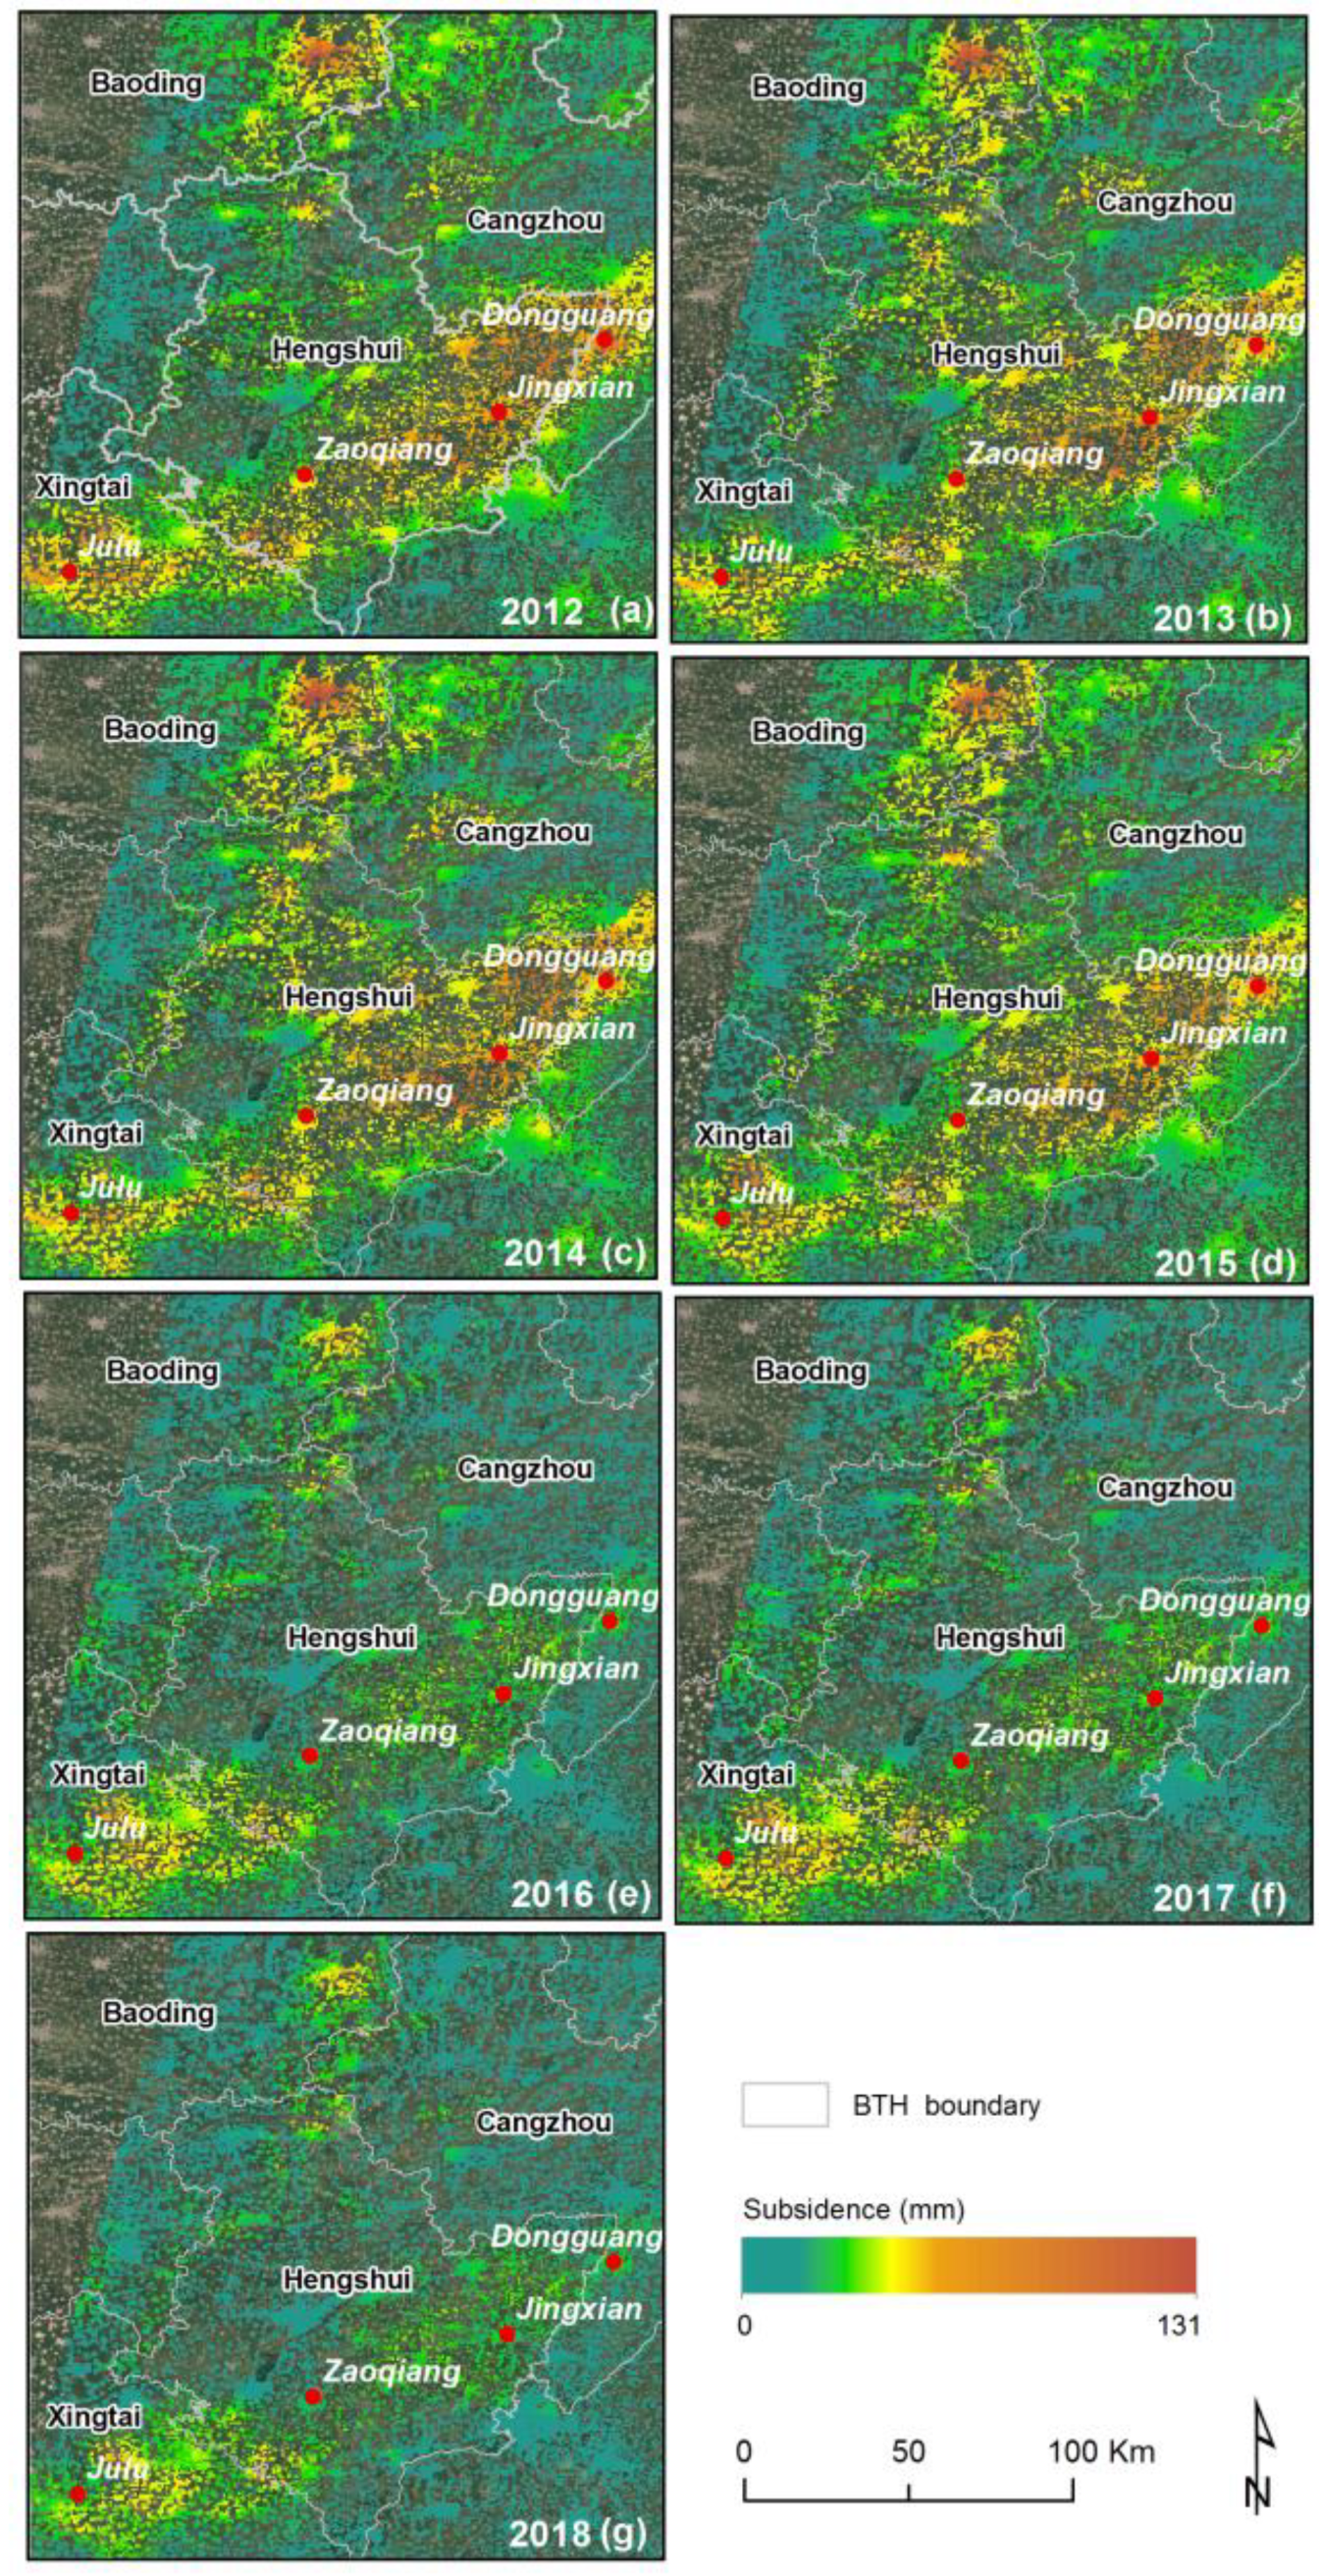
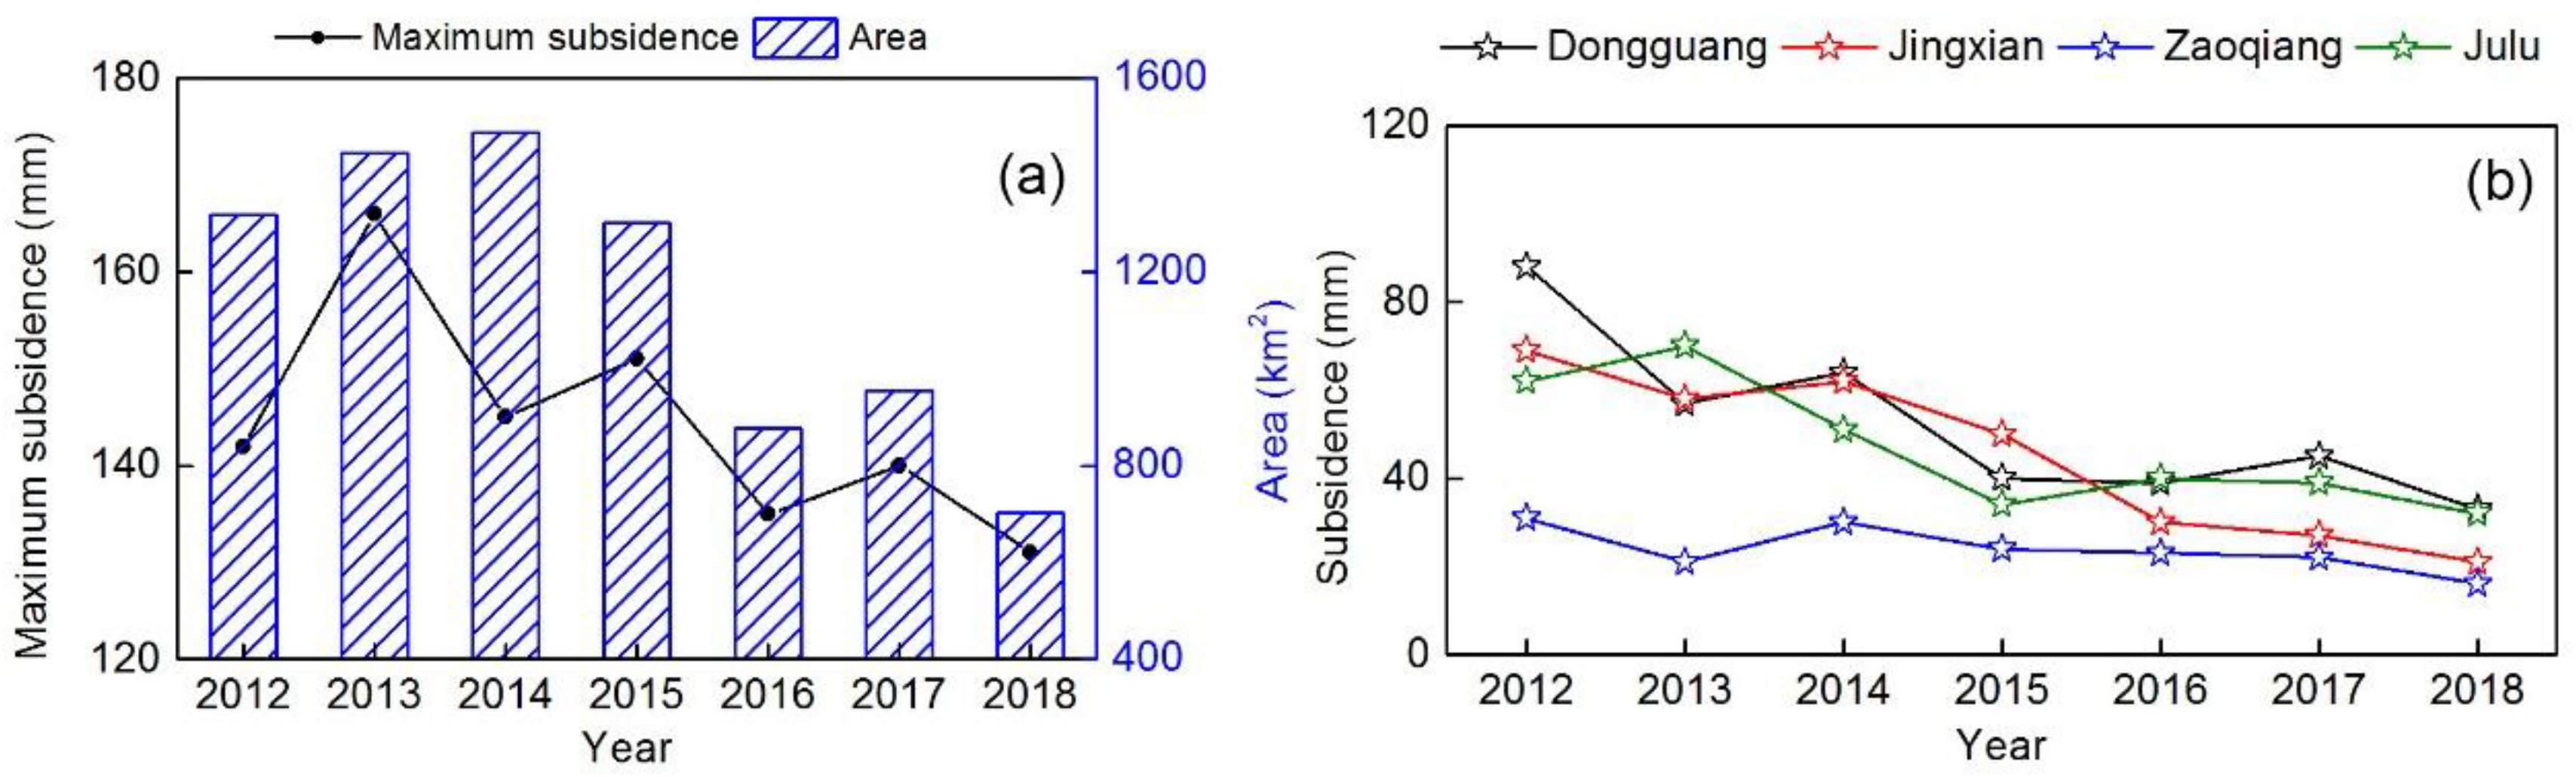
4.3. Land Subsidence in Heibei (Baoding, Hengshui, Xingtai)
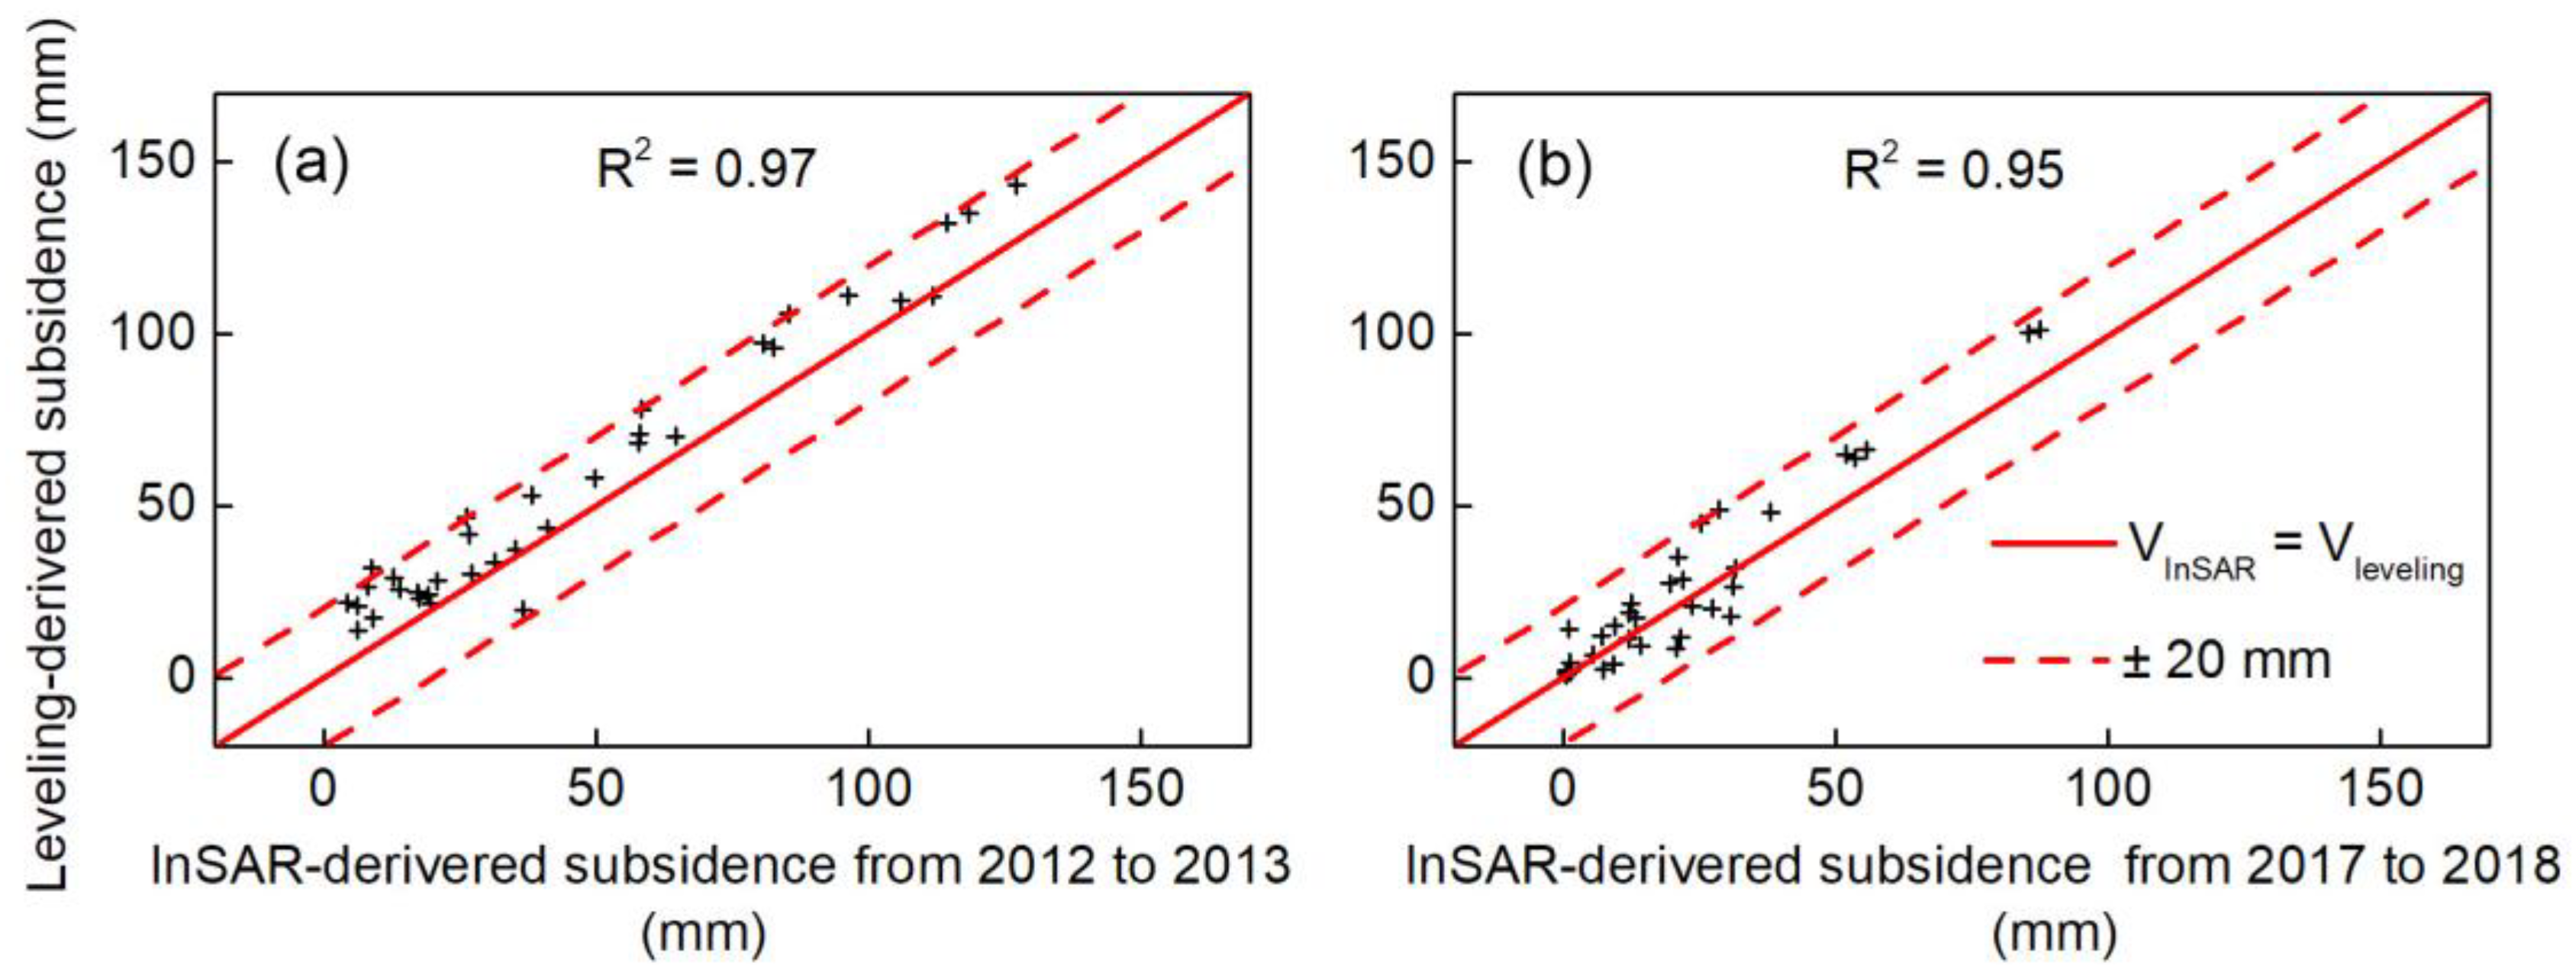
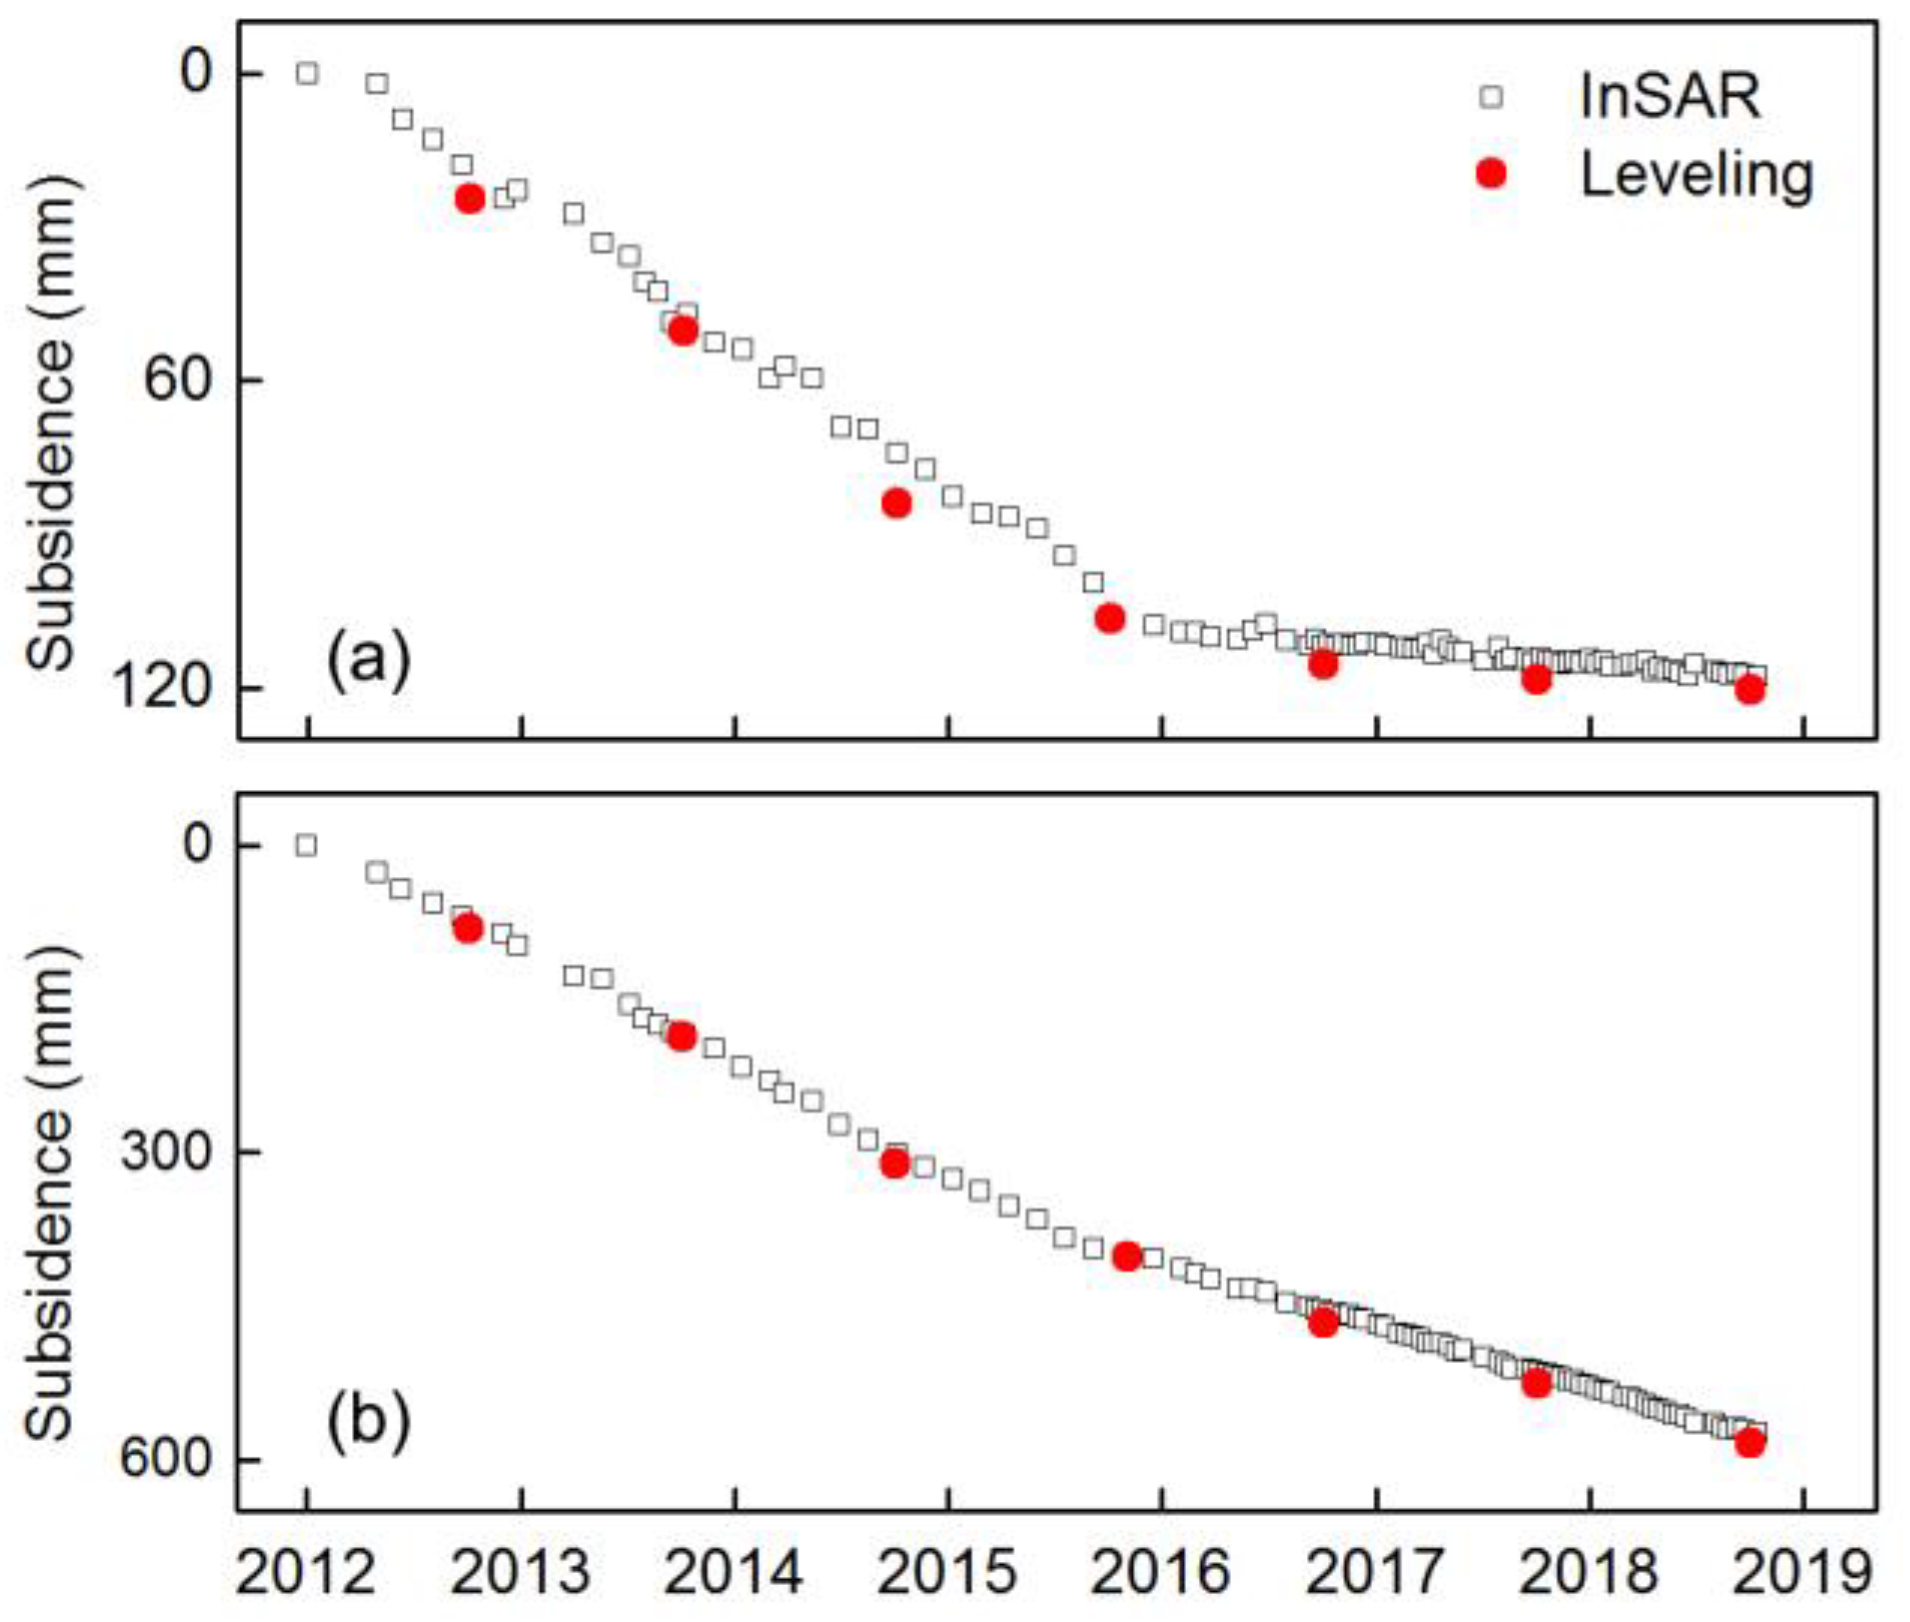
4.4. Accuracy Assessment of InSAR Results vs Leveling Data
5. Discussion
5.1. Land Subsidence Response to Different Land Use Types
5.2. Land Subsidence Response to Different Water Use
6. Conclusions
Author Contributions
Funding
Acknowledgments
Conflicts of Interest
References
- Chen, G.; Zhang, Y.; Zeng, R.; Yang, Z.; Chen, X.; Zhao, F.; Meng, X. Detection of Land Subsidence Associated with Land Creation and Rapid Urbanization in the Chinese Loess Plateau Using Time Series InSAR: A Case Study of Lanzhou New District. Remote Sens. 2018, 10, 270. [Google Scholar] [CrossRef] [Green Version]
- Sun, H.; Zhang, Q.; Zhao, C.; Yang, C.; Sun, Q.; Chen, W. Monitoring land subsidence in the southern part of the lower Liaohe plain, China with a multi-track PS-InSAR technique. Remote Sens. Environ. 2017, 188, 73–84. [Google Scholar] [CrossRef] [Green Version]
- Bai, L.; Jiang, L.; Wang, H.; Sun, Q. Spatiotemporal Characterization of Land Subsidence and Uplift (2009–2010) over Wuhan in Central China Revealed by TerraSAR-X InSAR Analysis. Remote Sens. 2016, 8, 350. [Google Scholar] [CrossRef] [Green Version]
- Samsonov, S.V.; d’Oreye, N.; Gonzalez, P.J.; Tiampo, K.F.; Ertolahti, L.; Clague, J.J. Rapidly accelerating subsidence in the Greater Vancouver region from two decades of ERS-ENVISAT-RADARSAT-2 DInSAR measurements. Remote Sens. Environ. 2014, 143, 180–191. [Google Scholar] [CrossRef] [Green Version]
- Samsonov, S.V.; Gonzalez, P.J.; Tiampo, K.F.; d’Oreye, N. Modeling of fast ground subsidence observed in southern Saskatchewan (Canada) during 2008–2011. Nat. Hazard. Earth. Sys. 2014, 14, 247–257. [Google Scholar] [CrossRef] [Green Version]
- Castellazzi, P.; Arroyo-Dominguez, N.; Martel, R.; Calderhead, A.I.; Normand, J.C.L.; Garfias, J.; Rivera, A. Land subsidence in major cities of Central Mexico: Interpreting InSAR-derived land subsidence mapping with hydrogeological data. Int. J. Appl. Earth Obs. Geoinf. 2016, 47, 102–111. [Google Scholar] [CrossRef]
- Castellazzi, P.; Garfias, J.; Martel, R.; Brouard, C.; Rivera, A. InSAR to support sustainable urbanization over compacting aquifers: The case of Toluca Valley, Mexico. Int. J. Appl. Earth Obs. Geoinf. 2017, 63, 33–44. [Google Scholar] [CrossRef]
- Castellazzi, P.; Longuevergne, L.; Martel, R.; Rivera, A.; Brouard, C.; Chaussard, E. Quantitative mapping of groundwater depletion at the water management scale using a combined GRACE/InSAR approach. Remote Sens. Environ. 2018, 205, 408–418. [Google Scholar] [CrossRef]
- Fabris, M.; Achilli, V.; Menin, A. Estimation of subsidence in Po Delta area (Northern Italy) by integration of GPS data, high-precision leveling and archival orthometric elevations. Int. J. Geosci. 2014, 5, 571. [Google Scholar] [CrossRef] [Green Version]
- Fiaschi, S.; Tessitore, S.; Boni, R.; Di Martire, D.; Achilli, V.; Borgstrom, S.; Ibrahim, A.; Floris, M.; Meisina, C.; Ramondini, M.; et al. From ERS-1/2 to Sentinel-1: Two decades of subsidence monitored through A-DInSAR techniques in the Ravenna area (Italy). Gisci. Remote Sens. 2017, 54, 305–328. [Google Scholar] [CrossRef]
- Cianflone, G.; Tolomei, C.; Brunori, C.A.; Dominici, R. InSAR Time Series Analysis of Natural and Anthropogenic Coastal Plain Subsidence: The Case of Sibari (Southern Italy). Remote Sens. 2015, 7, 16004–16023. [Google Scholar] [CrossRef] [Green Version]
- Teatini, P.; Ferronato, M.; Gambolati, G.; Bertoni, W.; Gonella, M. A century of land subsidence in Ravenna, Italy. Environ. Geol. 2005, 47, 831–846. [Google Scholar] [CrossRef]
- Tosi, L.; Teatini, P.; Carbognin, L.; Frankenfield, J. A new project to monitor land subsidence in the northern Venice coastland (Italy). Environ. Geol. 2007, 52, 889–898. [Google Scholar] [CrossRef]
- Jones, C.E.; An, K.; Blom, R.G.; Kent, J.D.; Ivins, E.R.; Bekaert, D. Anthropogenic and geologic influences on subsidence in the vicinity of New Orleans, Louisiana. J. Geophys. Res.-Solid Earth 2016, 121, 3867–3887. [Google Scholar] [CrossRef]
- Chen, B.; Gong, H.; Li, X.; Lei, K.; Zhu, L.; Gao, M.; Zhou, C. Characterization and causes of land subsidence in Beijing, China. Int. J. Remote Sens. 2017, 38, 808–826. [Google Scholar] [CrossRef]
- Chen, B.; Gong, H.; Lei, K.; Li, J.; Zhou, C.; Gao, M.; Guan, H.; Lv, W. Land subsidence lagging quantification in the main exploration aquifer layers in Beijing plain, China. Int. J. Appl. Earth Obs. Geoinf. 2019, 75, 54–67. [Google Scholar] [CrossRef]
- Gao, M.; Gong, H.; Li, X.; Chen, B.; Zhou, C.; Shi, M.; Guo, L.; Chen, Z.; Ni, Z.; Duan, G. Land Subsidence and Ground Fissures in Beijing Capital International Airport (BCIA): Evidence from Quasi-PS InSAR Analysis. Remote Sens. 2019, 11, 1466. [Google Scholar] [CrossRef] [Green Version]
- Gong, H.; Pan, Y.; Zheng, L.; Li, X.; Zhu, L.; Zhang, C.; Huang, Z.; Li, Z.; Wang, H.; Zhou, C. Long-term groundwater storage changes and land subsidence development in the North China Plain (1971–2015). Hydrogeol. J. 2018, 26, 1417–1427. [Google Scholar] [CrossRef] [Green Version]
- Guo, H.; Zhang, Z.; Cheng, G.; Li, W.; Li, T.; Jiao, J.J. Groundwater-derived land subsidence in the North China Plain. Environ. Earth Sci. 2015, 74, 1415–1427. [Google Scholar] [CrossRef]
- Yang, Y. Land Subsidence Disaster Prevention and Cure in Beijing-Tianjin-Hebei Area, China. Urban Geol. 2015, 1, 1–7. [Google Scholar]
- Galloway, D.L.; Hudnut, K.W.; Ingebritsen, S.E.; Phillips, S.P.; Peltzer, G.; Rogez, F.; Rosen, P.A. Detection of aquifer system compaction and land subsidence using interferometric synthetic aperture radar, Antelope Valley, Mojave Desert, California. Water Resour. Res. 1998, 34, 2573–2585. [Google Scholar] [CrossRef]
- Berardino, P.; Fornaro, G.; Lanari, R.; Sansosti, E. A new algorithm for surface deformation monitoring based on small baseline differential SAR interferograms. IEEE Trans. Geosci. Remote Sens. 2002, 40, 2375–2383. [Google Scholar] [CrossRef] [Green Version]
- Ferretti, A.; Prati, C.; Rocca, F. Nonlinear subsidence rate estimation using permanent scatterers in differential SAR interferometry. IEEE Trans. Geosci. Remote Sens. 2000, 38, 2202–2212. [Google Scholar] [CrossRef] [Green Version]
- Ferretti, A.; Prati, C.; Rocca, F. Permanent scatterers in SAR interferometry. IEEE Trans. Geosci. Remote Sens. 2001, 39, 8–20. [Google Scholar] [CrossRef]
- Hooper, A. A multi-temporal InSAR method incorporating both persistent scatterer and small baseline approaches. Geophys. Res. Lett. 2008, 35, L16302. [Google Scholar] [CrossRef] [Green Version]
- Lanari, R.; Mora, O.; Manunta, M.; Mallorqui, J.J.; Berardino, P.; Sansosti, E. A small-baseline approach for investigating deformations on full-resolution differential SAR interferograms. IEEE Trans. Geosci. Remote Sens. 2004, 42, 1377–1386. [Google Scholar] [CrossRef]
- Yang, K.; Yan, L.; Huang, G.; Chen, C.; Wu, Z. Monitoring Building Deformation with InSAR: Experiments and Validation. Sensors 2016, 16, 2182. [Google Scholar] [CrossRef]
- Haghighi, M.H.; Motagh, M. Ground surface response to continuous compaction of aquifer system in Tehran, Iran: Results from a long-term multi-sensor InSAR analysis. Remote Sens. Environ. 2019, 221, 534–550. [Google Scholar] [CrossRef]
- Gong, H.; Li, X.; Pan, Y.; Zhu, L.; Zhang, Y.; Chen, M.; Chen, B.; Ke, Y.; Wang, Y.; Gao, M.; et al. Groundwater depletion and regional land subsidence of the Beijing-Tianjin-Hebei area. Bull. Natl. Nat. Sci. Found. China 2017, 31, 72–77. [Google Scholar]
- Zhang, Z.; Luo, G.; Wang, Z.; Liu, C.; Li, Y.; Jiang, X. Study on Sustainable Utilization of Groundwater in North China Plain. Resour. Sci. 2009, 31, 355–360. [Google Scholar]
- Cao, G.; Zheng, C.; Scanlon, B.R.; Liu, J.; Li, W. Use of flow modeling to assess sustainability of groundwater resources in the North China Plain. Water Resour. Res. 2013, 49, 159–175. [Google Scholar] [CrossRef]
- Feng, W.; Zhong, M.; Lemoine, J.-M.; Biancale, R.; Hsu, H.-T.; Xia, J. Evaluation of groundwater depletion in North China using the Gravity Recovery and Climate Experiment (GRACE) data and ground-based measurements. Water Resour. Res. 2013, 49, 2110–2118. [Google Scholar] [CrossRef]
- Lei, K.; Luo, Y.; Chen, B.; Guo, G.; Zhou, Y. Distribution characteristics and influence factors of land subsidence in Beijing area. Geol. China 2016, 43, 2216–2228. [Google Scholar]
- Shi, J.; Guo, J.; Sun, Y.; Sun, Y.; Chen, Y. Spatial Analysis of the Relation between Deep Groundwater Exploitation and Land Subsidence in Beijing Tianjin Hebei- Dezhou Plain Area. Dizhi Lunping (Geol. Rev.) 2006, 52, 804–809. [Google Scholar]
- Zhang, Y.; Wu, H.; Kang, Y. Ground Subsidence over Beijing-Tianjin-Hebei Region during Three Periods of 1992 to 2014 Monitored by Interferometric SAR. Acta Geod. Cartogr. Sin. 2016, 45, 1050–1058. [Google Scholar]
- Zhang, J.; Liu, J.; Zhai, L.; Hou, W. Implementation of Geographical Conditions Monitoring in Beijing-Tianjin-Hebei, China. ISPRS Int. J. Geo-Inf. 2016, 5, 89. [Google Scholar] [CrossRef] [Green Version]
- Rahmati, O.; Golkarian, A.; Biggs, T.; Keesstra, S.; Mohammadi, F.; Daliakopoulos, I.N. Land subsidence hazard modeling: Machine learning to identify predictors and the role of human activities. J. Environ. Manag. 2019, 236, 466–480. [Google Scholar] [CrossRef] [PubMed]
- Zhang, Y.; Gong, H.; Gu, Z.; Wang, R.; Li, X.; Zhao, W. Characterization of land subsidence induced by groundwater withdrawals in the plain of Beijing city, China. Hydrogeol. J. 2014, 22, 397–409. [Google Scholar] [CrossRef]
- Zhu, L.; Gong, H.; Li, X.; Wang, R.; Chen, B.; Dai, Z.; Teatini, P. Land subsidence due to groundwater withdrawal in the northern Beijing plain, China. Eng. Geol. 2015, 193, 243–255. [Google Scholar] [CrossRef]
- Zuo, J.; Gong, H.; Chen, B.; Liu, K.; Zhou, C.; Ke, Y. Time-Series Evolution Patterns of Land Subsidence in the Eastern Beijing Plain, China. Remote Sens. 2019, 11, 539. [Google Scholar] [CrossRef] [Green Version]
- Gao, M.; Gong, H.; Chen, B.; Li, X.; Zhou, C.; Shi, M.; Si, Y.; Chen, Z.; Duan, G. Regional Land Subsidence Analysis in Eastern Beijing Plain by InSAR Time Series and Wavelet Transforms. Remote Sens. 2018, 10, 365. [Google Scholar] [CrossRef] [Green Version]
- Zhou, C.; Gong, H.; Chen, B.; Li, X.; Li, J.; Wang, X.; Gao, M.; Si, Y.; Guo, L.; Shi, M.; et al. Quantifying the contribution of multiple factors to land subsidence in the Beijing Plain, China with machine learning technology. Geomorphology 2019, 335, 48–61. [Google Scholar] [CrossRef]
- Zhou, C.; Gong, H.; Chen, B.; Zhu, F.; Duan, G.; Gao, M.; Lu, W. Land subsidence under different land use in the eastern Beijing plain, China 2005–2013 revealed by InSAR timeseries analysis. Gisci. Remote Sens. 2016, 53, 671–688. [Google Scholar] [CrossRef]
- Zhou, C.; Gong, H.; Zhang, Y.; Warner, T.A.; Wang, C. Spatiotemporal Evolution of Land Subsidence in the Beijing Plain 2003-2015 Using Persistent Scatterer Interferometry (PSI) with Multi-Source SAR Data. Remote Sens. 2018, 10, 552. [Google Scholar] [CrossRef] [Green Version]
- Liu, Y. Land subsidence in Tianjin. Urban Constr. Theory Res. 2013, 22. [Google Scholar]
- Zhang, Y.; Wu, H.a.; Kang, Y.; Zhu, C. Ground Subsidence in the Beijing-Tianjin-Hebei Region from 1992 to 2014 Revealed by Multiple SAR Stacks. Remote Sens. 2016, 8, 675. [Google Scholar] [CrossRef] [Green Version]
- Yu, G.; KaiCheng, X.; Pu, W. Research on Change Trend of Temperature and Precipitation in Cangzhou Nearly 40 Years. Chin. J. Agrometeorol. 2008, 29, 143–145. [Google Scholar]
- Liu, X.; Wang, Y.; Yan, S. Ground deformation associated with exploitation of deep groundwater in Cangzhou City measured by multi-sensor synthetic aperture radar images. Environ. Earth. Sci. 2017, 76, 6. [Google Scholar] [CrossRef]
- Li, H.; Zhang, Y.; Meng, J. Characteristics on land subsidence in North China plain within effect of nontectonic movement. China Energy Environ. Prot. 2017, 39, 57–62. [Google Scholar]
- Mora, O.; Mallorqui, J.J.; Broquetas, A. Linear and nonlinear terrain deformation maps from a reduced set of interferometric SAR images. IEEE Trans. Geosci. Remote Sens. 2003, 41, 2243–2253. [Google Scholar] [CrossRef]
- Werner, C.; Wegmuller, U.; Strozzi, T.; Wiesmann, A. Interferometric point target analysis for deformation mapping. In Proceedings of the IGARSS 2003. IEEE International Geoscience and Remote Sensing Symposium. Proceedings (IEEE Cat. No. 03CH37477), Toulouse, France, 21–25 July 2003; Volume 7, pp. 4362–4364. [Google Scholar]
- Sims, C.A. Macroeconomics and reality. Econometrica 1980, 48, 1–48. [Google Scholar] [CrossRef] [Green Version]
- Ewing, B.T.; Riggs, K.; Ewing, K.L. Time series analysis of a predator-prey system: Application of VAR and generalized impulse response function. Ecol. Econ. 2007, 60, 605–612. [Google Scholar] [CrossRef]
- Lütkepohl, H. New Introduction to Multiple Time Series Analysis; Springer-Verlag: Berlin/Heidelberg, Germany; New York, NY, USA, 2005; Chapter 2; pp. 51–63. [Google Scholar]
- Wei, J.; Xu, J.; Lu, Y.; Yi, C. Analysis on Land Subsidence Funnel in Wangqingtuo Area of Tianjin. Ground Water 2012, 345, 61–63. [Google Scholar]
- Wang, Q.; Liu, J.; Zhao, D. Study on water footprint of main crop production in Jing-Jin-Ji Region. Water Resour. Prot. 2018, 34, 22–27,33. [Google Scholar]
- Zhang, G.; Yan, M.; Tian, Y.; Wang, J. Groundwater Guarantee Ability and Evaluation Theory Method of Major Food Bases in China; Science Press: Alexandria, Australia, 2018; pp. 259–260. [Google Scholar]


| Dataset | Numbers | Time Span | Area (km2) | Location |
|---|---|---|---|---|
| R2-a | 45 | 2012.1.28–2016.10.21 | 27,062 | Beijing/Tianjin |
| R2-b | 39 | 2012.1.28–2016.10.21 | 28,213 | Tianjin/Hebei |
| R2-c | 42 | 2012.1.28–2016.10.21 | 29,087 | Hebei/Shandong |
| S1-116 | 63 | 2016.1.14–2018.11.11 | 46,680 | Hebei/Shandong |
| S1-121 | 60 | 2016.1.14–2018.11.11 | 46,298 | Hebei/Tianjin |
| S1-126 | 61 | 2016.1.14–2018.11.11 | 47,137 | Hebei /Beijing/Tianjin |
| Groundwater Monitoring Wells | Monitoring Depth (m) | Hydraulic Properties |
|---|---|---|
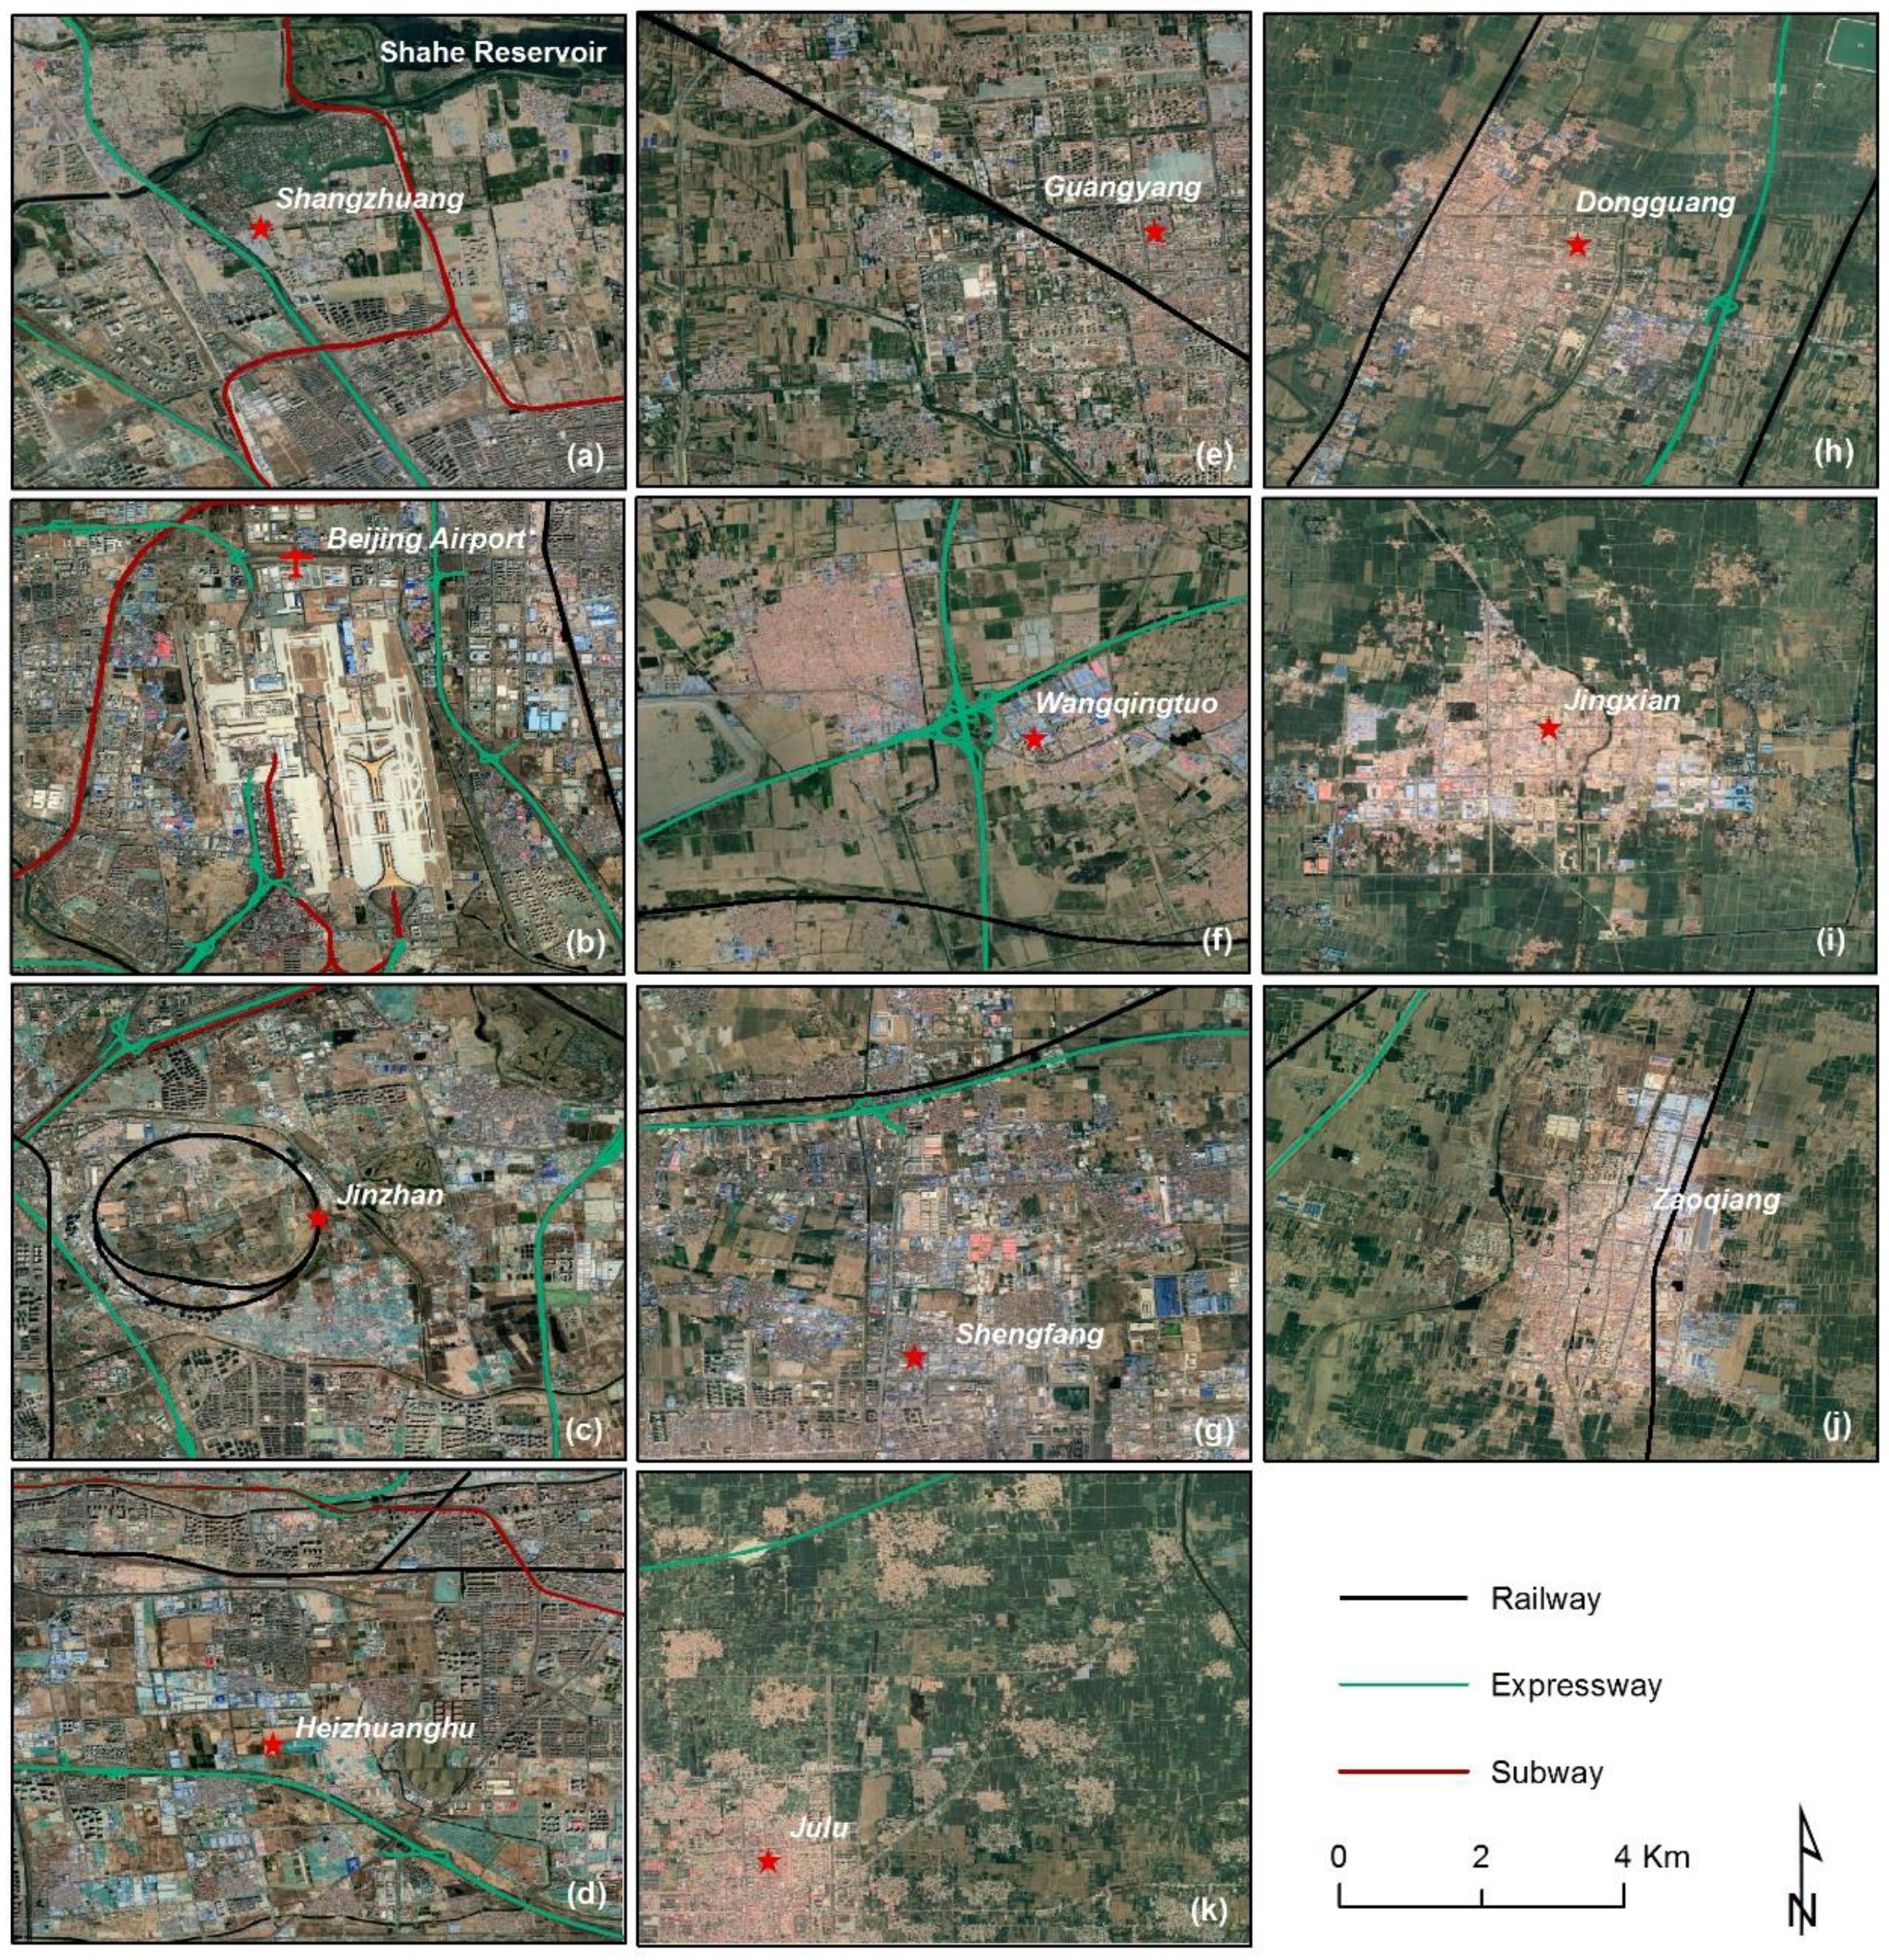
| Shangzhuang (a) | 140 | Unconfined-confined aquifer |
| Beijing airport (b) | 120 | Unconfined-confined aquifer |
| Jinzhan (c) | 130 | Unconfined-confined aquifer |
| Heizhuanghu (d) | 143 | Unconfined-confined aquifer |
| Guangyang (e) | 204 | Confined aquifer |
| Wangqingtuo (f) | 238 | Confined aquifer |
| Shengfang (g) | 150 | Unconfined-confined aquifer |
| Dongguang (h) | 313 | Confined aquifer |
| Jingxian (i) | 225 | Confined aquifer |
| Zaoqiang (j) | 260 | Confined aquifer |
| Subsidence Feature | Variables | p-Value | D(p-Value) | Subsidence Feature | Variables | p-Value | D(p-Value) |
|---|---|---|---|---|---|---|---|
| Shangzhuang | Sub | 0.01 | 0.01 | Shengfang | Sub | 0.01 | |
| Gl | 0.09 | 0.04 | Gl | 0.03 | |||
| Beijing airport | Sub | 0.01 | Wangqingtuo | Sub | 0.07 | 0.01 | |
| Gl | 0.01 | Gl | 0.02 | 0.04 | |||
| Jinzhan | Sub | 0.02 | Dongguang | Sub | 0.13 | 0.01 | |
| Gl | 0.01 | Gl | 0.02 | 0.01 | |||
| Heizhuanghu | Sub | 0.13 | 0.01 | Jingxian | Sub | 0.04 | |
| Gl | 0.01 | 0.01 | Gl | 0.01 | |||
| Guangyang | Sub | 0.09 | 0.01 | Zaoqiang | Sub | 0.01 | 0.01 |
| Gl | 0.42 | 0.05 | Gl | 0.27 | 0.01 |
| Subsidence Features | Land Use Types | Subsidence Range (mm/year) |
|---|---|---|
| Shangzhuang (a) | Expressway, subway, and urban residential land | 9–56 |
| Beijing airport (b) | Expressway, subway, railway, airport and urban residential land | 7–52 |
| Jinzhan (c) | Expressway, subway, railway, urban, villages and towns residential land | 8–117 |
| Heizhuanghu (d) | Expressway, subway, railway, urban, villages and towns residential land | 44–105 |
| Guangyang (e) | Railway, agricultural, and urban residential land | 6–61 |
| Wangqingtuo (f) | Expressway, railway, agricultural, industrial, villages and towns residential land | 18–120 |
| Shengfang (g) | Expressway, railway, agricultural, industrial, villages and towns residential land | 15–101 |
| Dongguang (h) | Expressway, railway, agricultural, villages and towns residential land | 18–59 |
| Jingxian (i) | Agricultural, villages and towns residential land | 22–54 |
| Zaoqiang (j) | Expressway, railway, agricultural, villages and towns residential land | 12–42 |
| Julu (k) | Expressway, agricultural, villages and towns residential land | 17–51 |
© 2020 by the authors. Licensee MDPI, Basel, Switzerland. This article is an open access article distributed under the terms and conditions of the Creative Commons Attribution (CC BY) license (http://creativecommons.org/licenses/by/4.0/).
Share and Cite
Zhou, C.; Gong, H.; Chen, B.; Gao, M.; Cao, Q.; Cao, J.; Duan, L.; Zuo, J.; Shi, M. Land Subsidence Response to Different Land Use Types and Water Resource Utilization in Beijing-Tianjin-Hebei, China. Remote Sens. 2020, 12, 457. https://doi.org/10.3390/rs12030457
Zhou C, Gong H, Chen B, Gao M, Cao Q, Cao J, Duan L, Zuo J, Shi M. Land Subsidence Response to Different Land Use Types and Water Resource Utilization in Beijing-Tianjin-Hebei, China. Remote Sensing. 2020; 12(3):457. https://doi.org/10.3390/rs12030457
Chicago/Turabian StyleZhou, Chaofan, Huili Gong, Beibei Chen, Mingliang Gao, Qun Cao, Jin Cao, Li Duan, Junjie Zuo, and Min Shi. 2020. "Land Subsidence Response to Different Land Use Types and Water Resource Utilization in Beijing-Tianjin-Hebei, China" Remote Sensing 12, no. 3: 457. https://doi.org/10.3390/rs12030457