1. Introduction
Coastal areas with high population densities and rapid growth and urbanization have relatively vulnerable structures to coastal flooding, such as the sea-level rise and storm surge due to climatic extremes [
1,
2]. The losses caused by these disasters have also continued to increase in recent years. The western North Pacific (WNP) is one of the oceanic regions most prone to typhoons [
3,
4,
5,
6,
7,
8,
9]. Since China is located on the west coast of the WNP, it is greatly affected by typhoons, particularly along the east coast [
10]. The strong winds, heavy precipitation, and storm surge of typhoons pose serious threats to China’s social economy and national personal safety. For example, the super typhoon “Mangkhut” affected many provinces and regions over South China in September 2018. The number of people affected was close to 3 million, with ~1200 houses damaged and ~174.4 thousand hectares of crops being affected. The direct economic loss exceeded CNY 5.2 billion (USD 77.5 million) [
11].
Failure to properly manage water resources due to incorrect rainfall forecasts during the typhoon season can lead to serious flooding or water shortage, regardless of how well forecast and water management was carried out before the typhoon [
10,
12]. In recent years, however, the development of satellite observations and mathematical modeling, along with integration and data assimilation techniques using various observational datasets, typhoon tracking and intensity prediction have continuously improved [
13,
14,
15,
16,
17,
18,
19,
20]. Nevertheless, typhoon-induced rainfall prediction remains very difficult and less accurate than typhoon track prediction [
21,
22,
23,
24,
25,
26,
27,
28,
29]. For example, Li et al. [
26] established a non-parametric statistical method using numerical models and typhoon intensity predictions to estimate the maximum daily rainfall and three-day cumulative rainfall amounts. Previously, Ebert et al. [
27] noted that a satellite-based tracking of tropical rain could improve the short-term prediction of typhoon-induced heavy rainfall. More recently, Kim et al. [
28] hypothesized that typhoons with similar tracks have similar rainfall patterns, and demonstrated the use of tracks, intensities, and precipitation data for 91 typhoons affecting the Korean Peninsula over the course of several decades to establish a statistical model for forecasting typhoon-induced rainfall over that region.
Although typhoon-induced rainfall prediction models are constantly being improved, the rainfall conditions related to typhoons differ from region to region and most of the aforementioned methods were developed according to one or other specific regions [
26,
27,
28,
29,
30]. While the establishment of a typhoon-induced rainfall prediction model requires accurate track and intensity forecasts; however, complex physical processes such as the interaction between typhoon and land also need to be considered. These factors may cause rapid changes in precipitation during the passage of typhoons [
21,
22]. Therefore, typhoon-induced rainfall prediction is particularly challenging work.
The purpose of the present study is to establish a new statistical prediction model based on the principle of track similarity, using fuzzy C-means clustering, intensity correction, and other methods to optimize typhoon-induced accumulated rainfall (TAR) forecasts over China. The following section introduces the data used to develop the prediction model and describes how the TAR of each typhoon in the western North Pacific in recent decades is determined. Then, in
Section 3, typhoons with tracks similar to that of the target typhoon are selected. In addition, TAR correction is conducted based on typhoon intensity, and the optimal number of similar-track typhoons is selected for ensemble averaging. After substituting the previous typhoon data, the results of the prediction model are given. Finally,
Section 4 provides a summary and conclusions, including a discussion of the advantages of this method as well as the limitations that can be improved in future work.
2. Data and Methods
2.1. Data
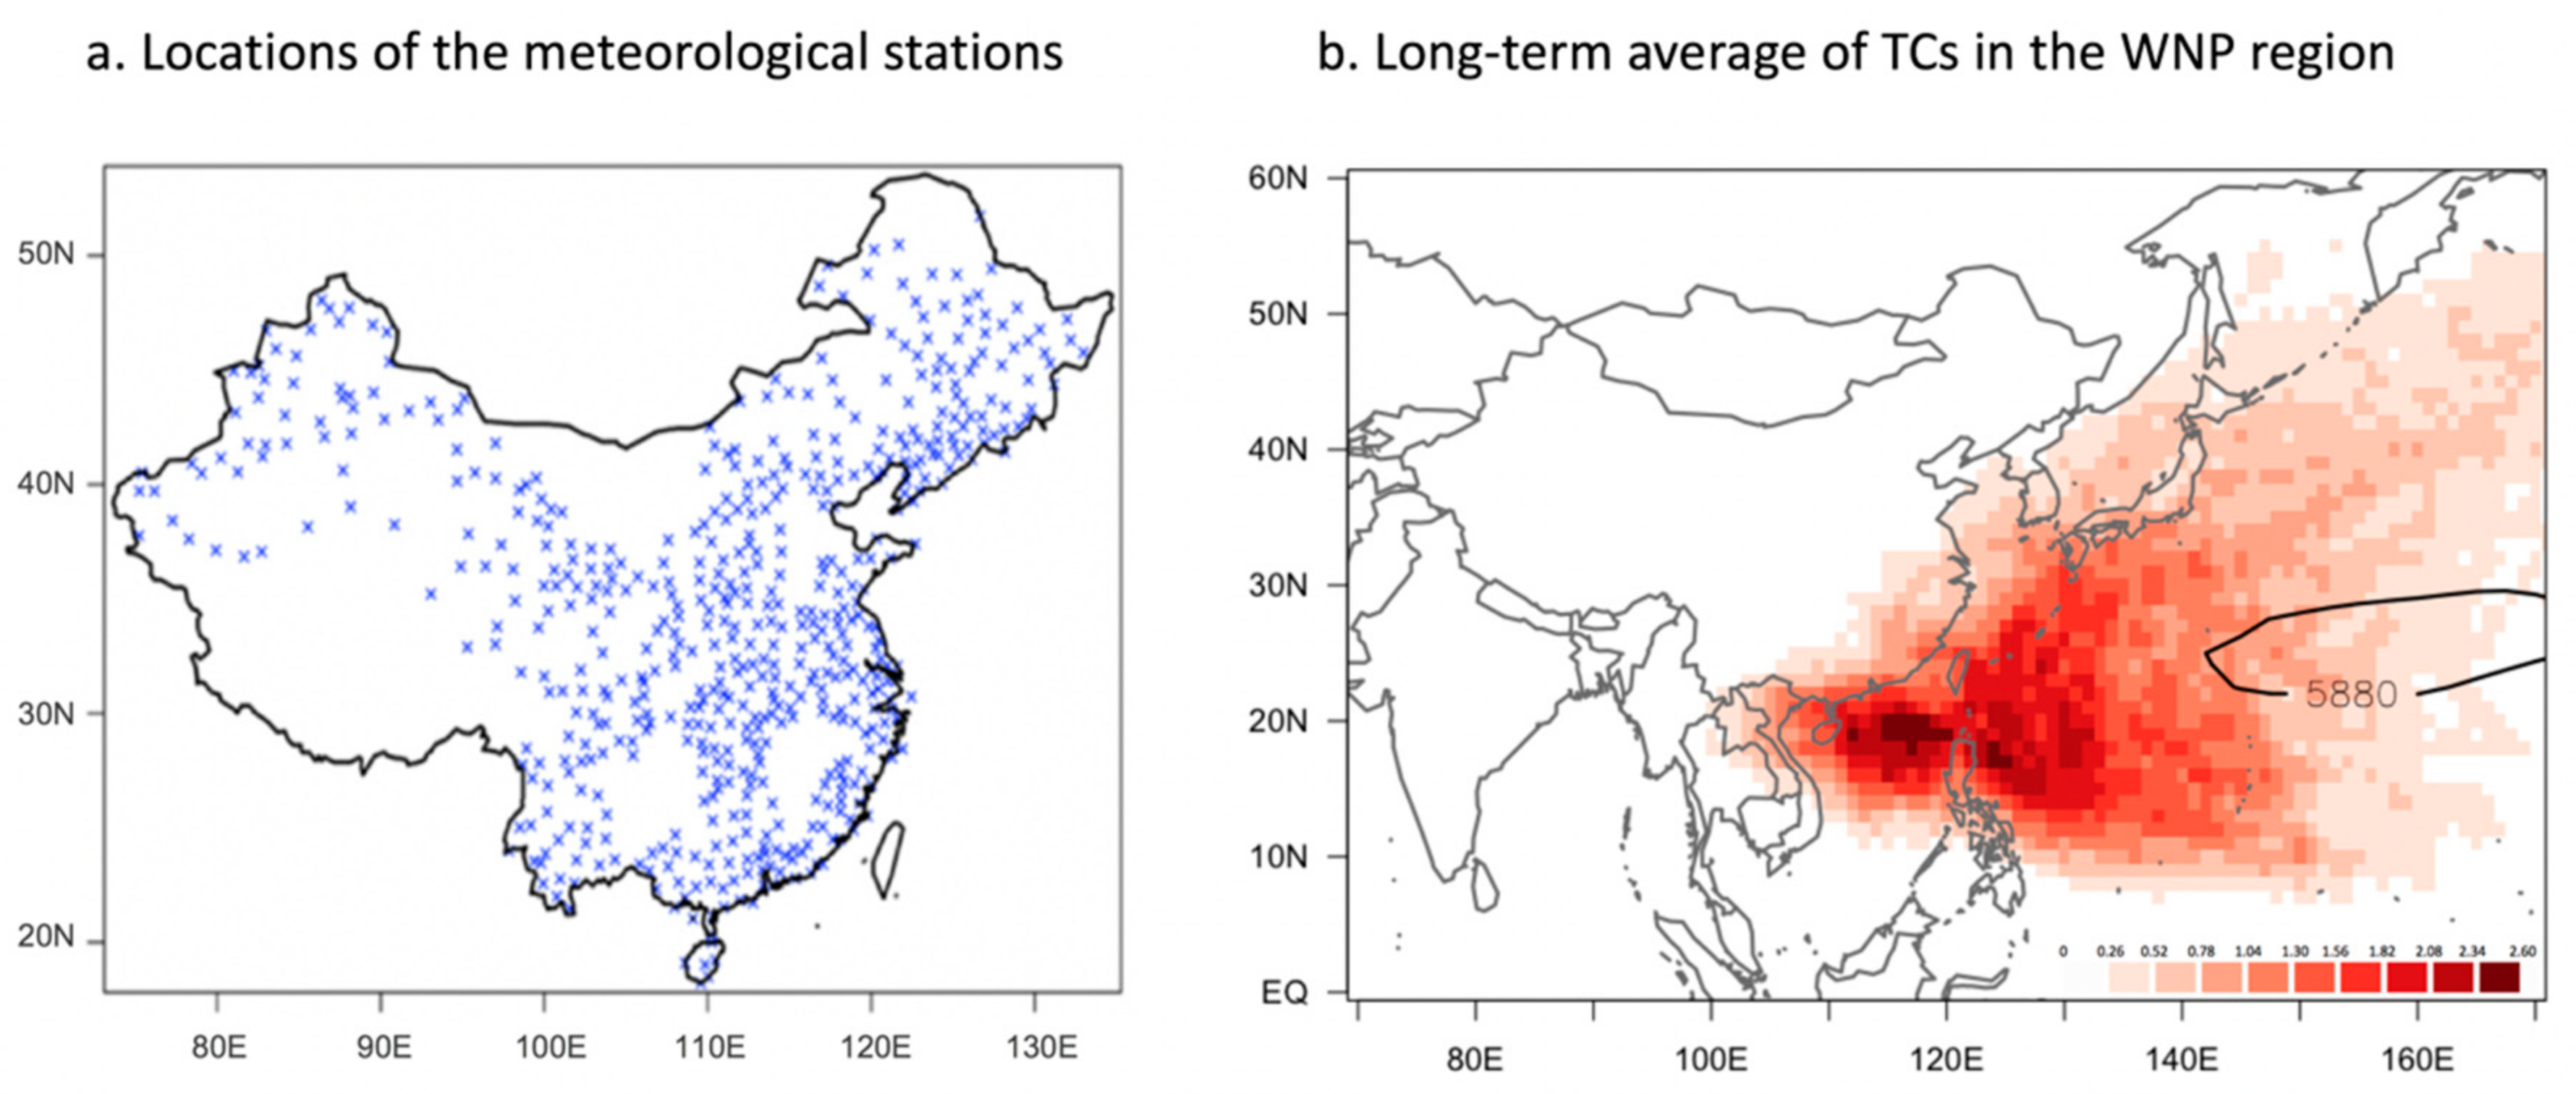
To establish the TAR prediction model, the daily rainfall data without any gaps between 1961 and 2017 from 537 meteorological stations in China (
Figure 1a;
http://data.cma.cn) were used, along with best-track data for a total of 1536 typhoons in the WNP were used during the period 1961–2017 (
Figure 1b). Typhoon intensity correction was performed and the effects of ensemble averaging and typhoon similarity levels were analyzed using primarily the 55 tropical cyclone (TC) datasets affecting 75 meteorological stations in the southeast coastal area of China listed in
Table 1. The 6-hourly location and intensity data for the typhoons, including the specific date, time, longitude, latitude, maximum wind speed, and typhoon number, were obtained from the Regional Specialized Meteorological Center (RSMC)—Tokyo.
Due to the proximity of typhoons to mid-latitude regions, typhoons will transition into tropical storms under the impacts of landfall, cold air mixing, and other factors, leading to a rapid weakening of their intensities. Nevertheless, the impact of the associated rainfall will impact large areas and generate disasters such as debris flows and floods that may cause losses of life and property. Therefore, in order to better estimate the rainfall that a typhoon can cause, the present study includes the period after each typhoon turns into a tropical storm.
2.2. Calculation of Typhoon-Induced Accumulated Rainfall (TAR)
The first step in establishing the TAR prediction model is to calculate the TAR for each local station. The specific calculation process is as follows:
- (1).
Determine whether the rainfall for a specific location is caused by the typhoon. Only when the distance between a typhoon and a specific location is less than a certain value can the typhoon be considered to have an impact on that location’s rainfall. The selection criterion used in the present study is that the distance between the typhoon and the meteorological station must be less than or equal to 500 km. [
9,
31,
32,
33]
- (2).
As the typhoon will have a continuous impact on the rainfall in a specific area, the rainfall on the day in which the region is affected is considered, along with that of the day before and the day after, as being caused by the typhoon. That is, the total duration of rainfall caused by a typhoon in a specific location is represented by the time period of the typhoon entering and leaving a 500 km range of the area within a time window ± 1 day of its landfall.
- (3).
The TAR values for each typhoon at each station are obtained by adding up the daily rainfall in the previously determined period.
It was noted that a substantial error would arise if coexisting typhoons were used to establish a TAR prediction model, which would result in an inaccurate model forecast. To prevent this problem, typhoons of this type were discarded during the prediction model establishment process.
2.3. Selection of Typhoons Using the Fuzzy C-Means Clustering Algorithm
In the present study, the fuzzy C-means clustering (FCM) algorithm was used to select typhoons with similar tracks. This is a partitioning algorithm in which objects with the greatest similarities are grouped into the same cluster and objects with few similarities into separate clusters. The FCM was proposed by Bezdek [
34] as an improvement on the hard C-means clustering method and enables an estimate of the degree to which each data point belongs to a certain cluster, i.e., the degree of membership. In detail, the FCM divides
n vectors X
i (
i = 1, 2,...,
n) into a number (c) of fuzzy groups and identifies the clustering center of each group so that the value function of the dissimilarity index is minimized. A fuzzy division is then used to assign a degree of membership between 0 and 1 and examine how well each data point belongs to each group. According to the FCM, the membership matrix U assigns the values of the elements between 0 and 1, while the constraints of the normalization dictate that the total membership of the dataset must always be equal to unity, as indicated by Equation (1):
Then, the value function (or objective function) of the FCM is given by Equation (2):
where
is between 0 and 1,
is the clustering center of the fuzzy group
, and
is the Euclidean distance between the
-th clustering center and the
j-th data point.
In the process of clustering typhoons using the FCM method, the membership coefficient
is calculated. This indicates the probability,
, that each typhoon belongs to the target typhoon group
Ck [
28,
35]. The value of
is determined by the partial derivative of the sum of squared errors (SSE) according to Equations (3) and (4):
where
is the distance between each typhoon track and the target typhoon track.
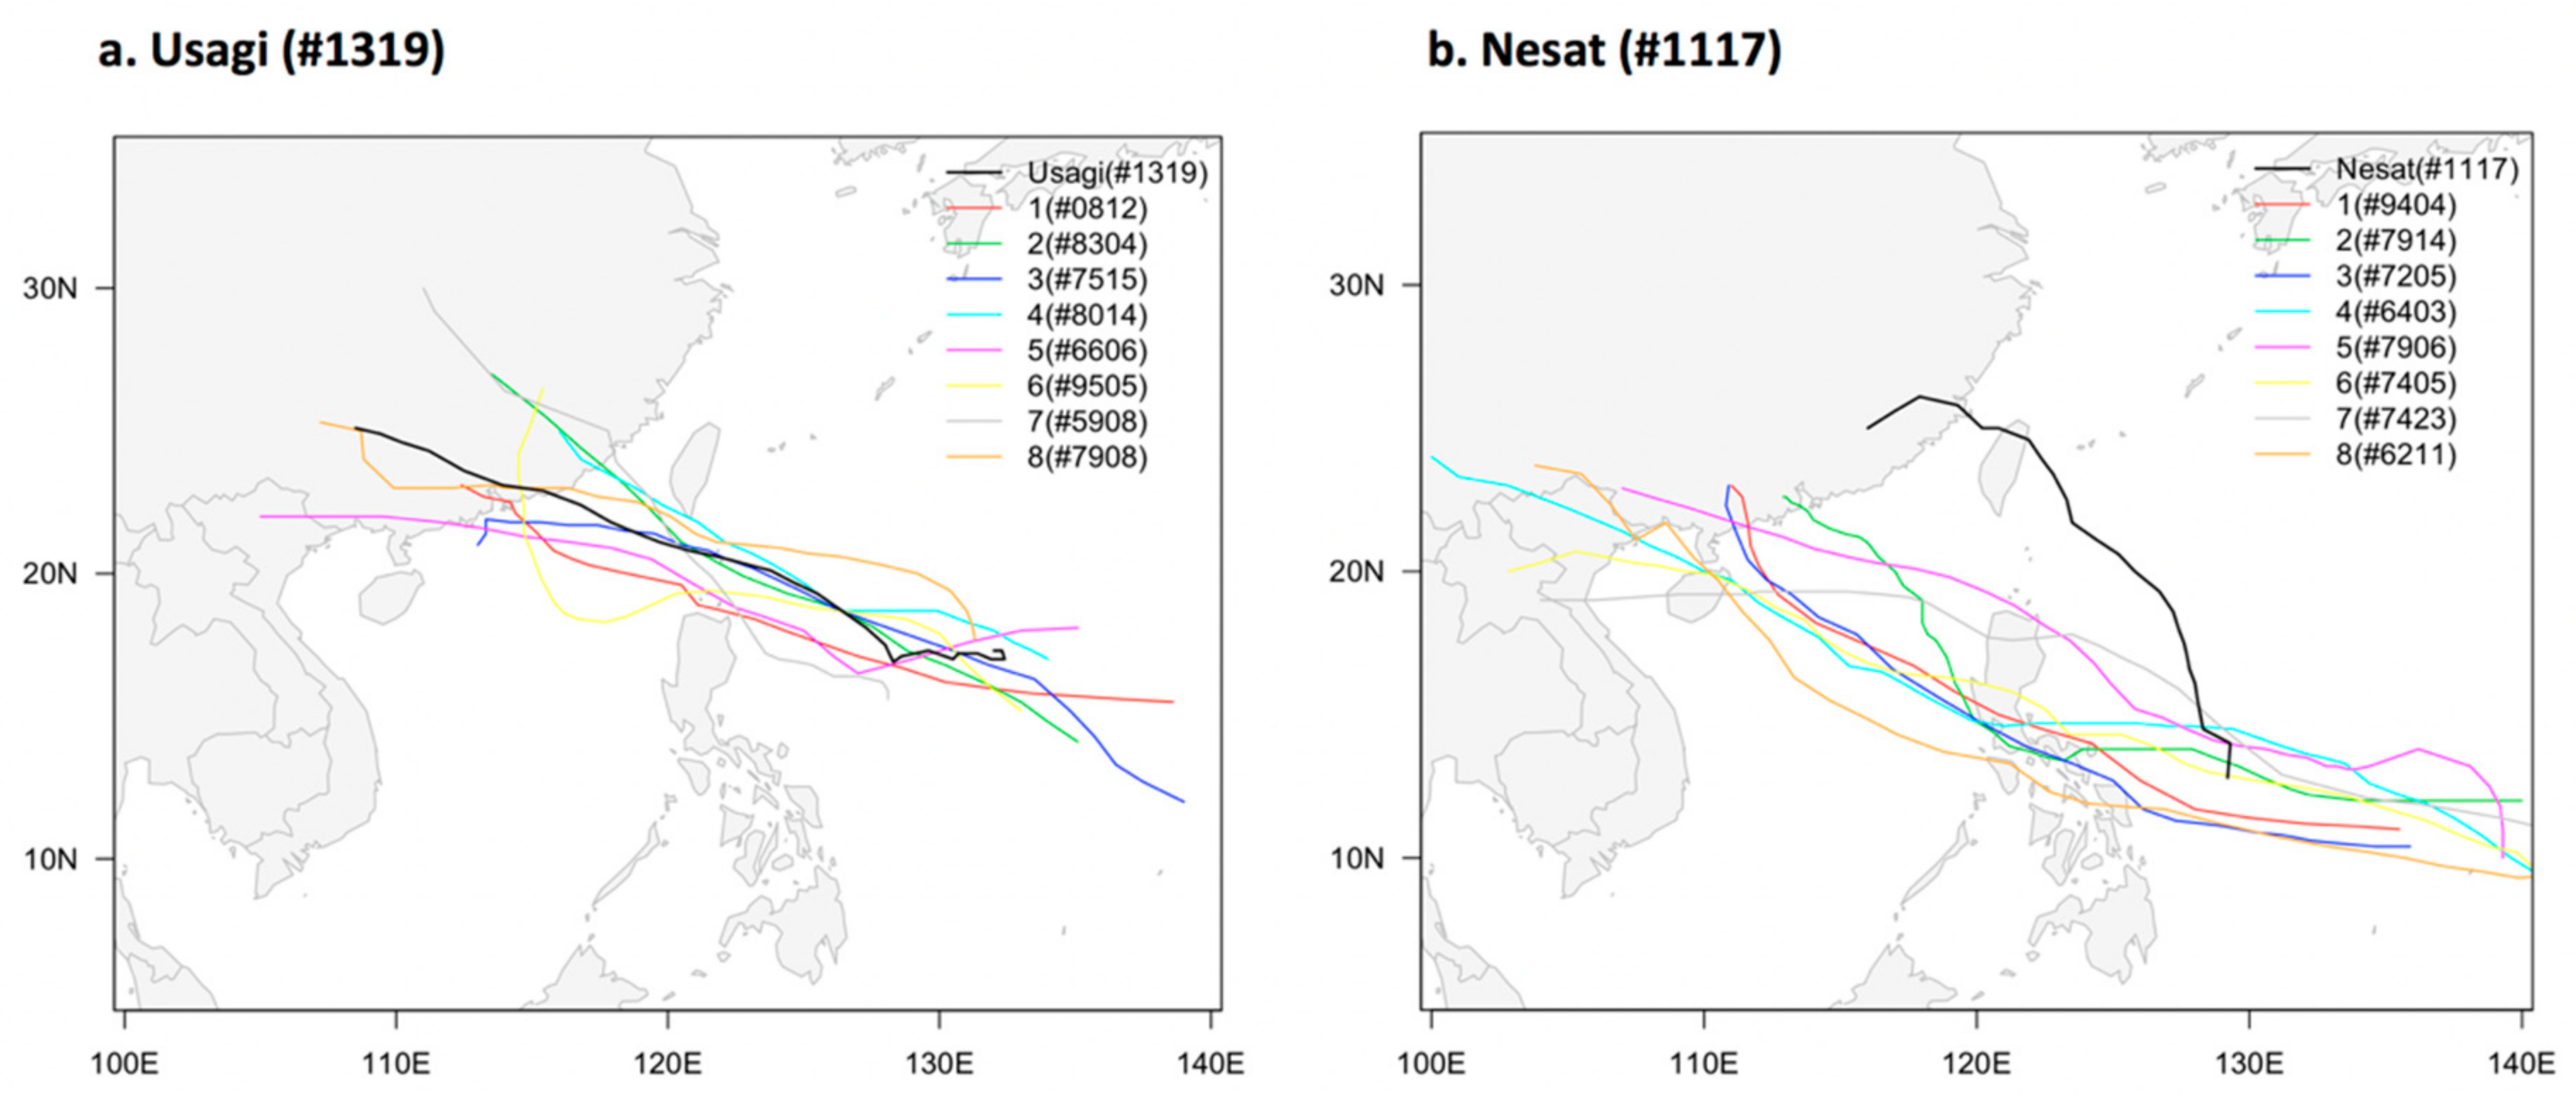
When using the FCM method to cluster all the typhoon tracks, these must first be divided into lines with the same number of location points. In the present study, all typhoons were uniformly interpolated according to the typhoon with the largest number of location points in its track data. In addition, the FCM membership coefficient was used as a criterion for screening typhoons that were similar to the target typhoon: the larger the coefficient value, the higher the typhoon similarity. For example, the eight typhoons with the greatest similarity to typhoons Usagi (#1319) and Nesat (#1117) according to the FCM method are indicated in
Figure 2. Typhoon Usagi (#1319) made landfall on the coast of Fujian Province in southern China in 2013 and affected the surrounding areas of Taiwan and southern provinces of China (
Figure 2a), whereas typhoon Nesat (#1117) passed through Hainan Province and Qiongzhou Strait in 2011 and then caused serious damage to the surrounding areas, including Hainan, Guangdong, and other provinces (
Figure 2b). The results in
Figure 2 indicate that the tracks of typhoons Nuri (#0812) in 2008 and Sharon (#9404) in 1994 are the most similar to those of Usagi (#1319) and Nesat (#1117), respectively.
3. Results
3.1. Correcting the TAR Using Typhoon Intensity Information
Since it is impossible for different typhoons to have exactly the same intensity and structure, every typhoon is unique. Therefore, it is not theoretically possible to accurately predict the amount of rainfall caused by a typhoon based only on the track of one typhoon only. In other words, even when two typhoons have exactly the same tracks, differences in their intensities will result in different rainfall amounts, with higher intensity typhoons usually resulting in more rainfall [
36]. Therefore, a typhoon wind intensity correction (TWIC) was used in the present study to further reduce the error in the TAR prediction model. The effects of the TWIC and ensemble averaging were first assessed using the training datasets of 55 TCs and then verified for model performance later in
Section 3.3.
The eastern and southern coastal areas of China were selected as target areas for prediction during the training of this model because these are the areas that are most frequently affected by typhoons, whereas the inland areas of China are rarely affected. In the process of TAR correction based on TC wind speed, data from typhoons affecting 75 weather stations along the southeastern coast of China (Pearl River Basin and Southeast River Basin) were used. Typhoons that occur simultaneously in the same region were not used for this process, as it is difficult to obtain their individual TAR periods and rainfall amounts accurately.
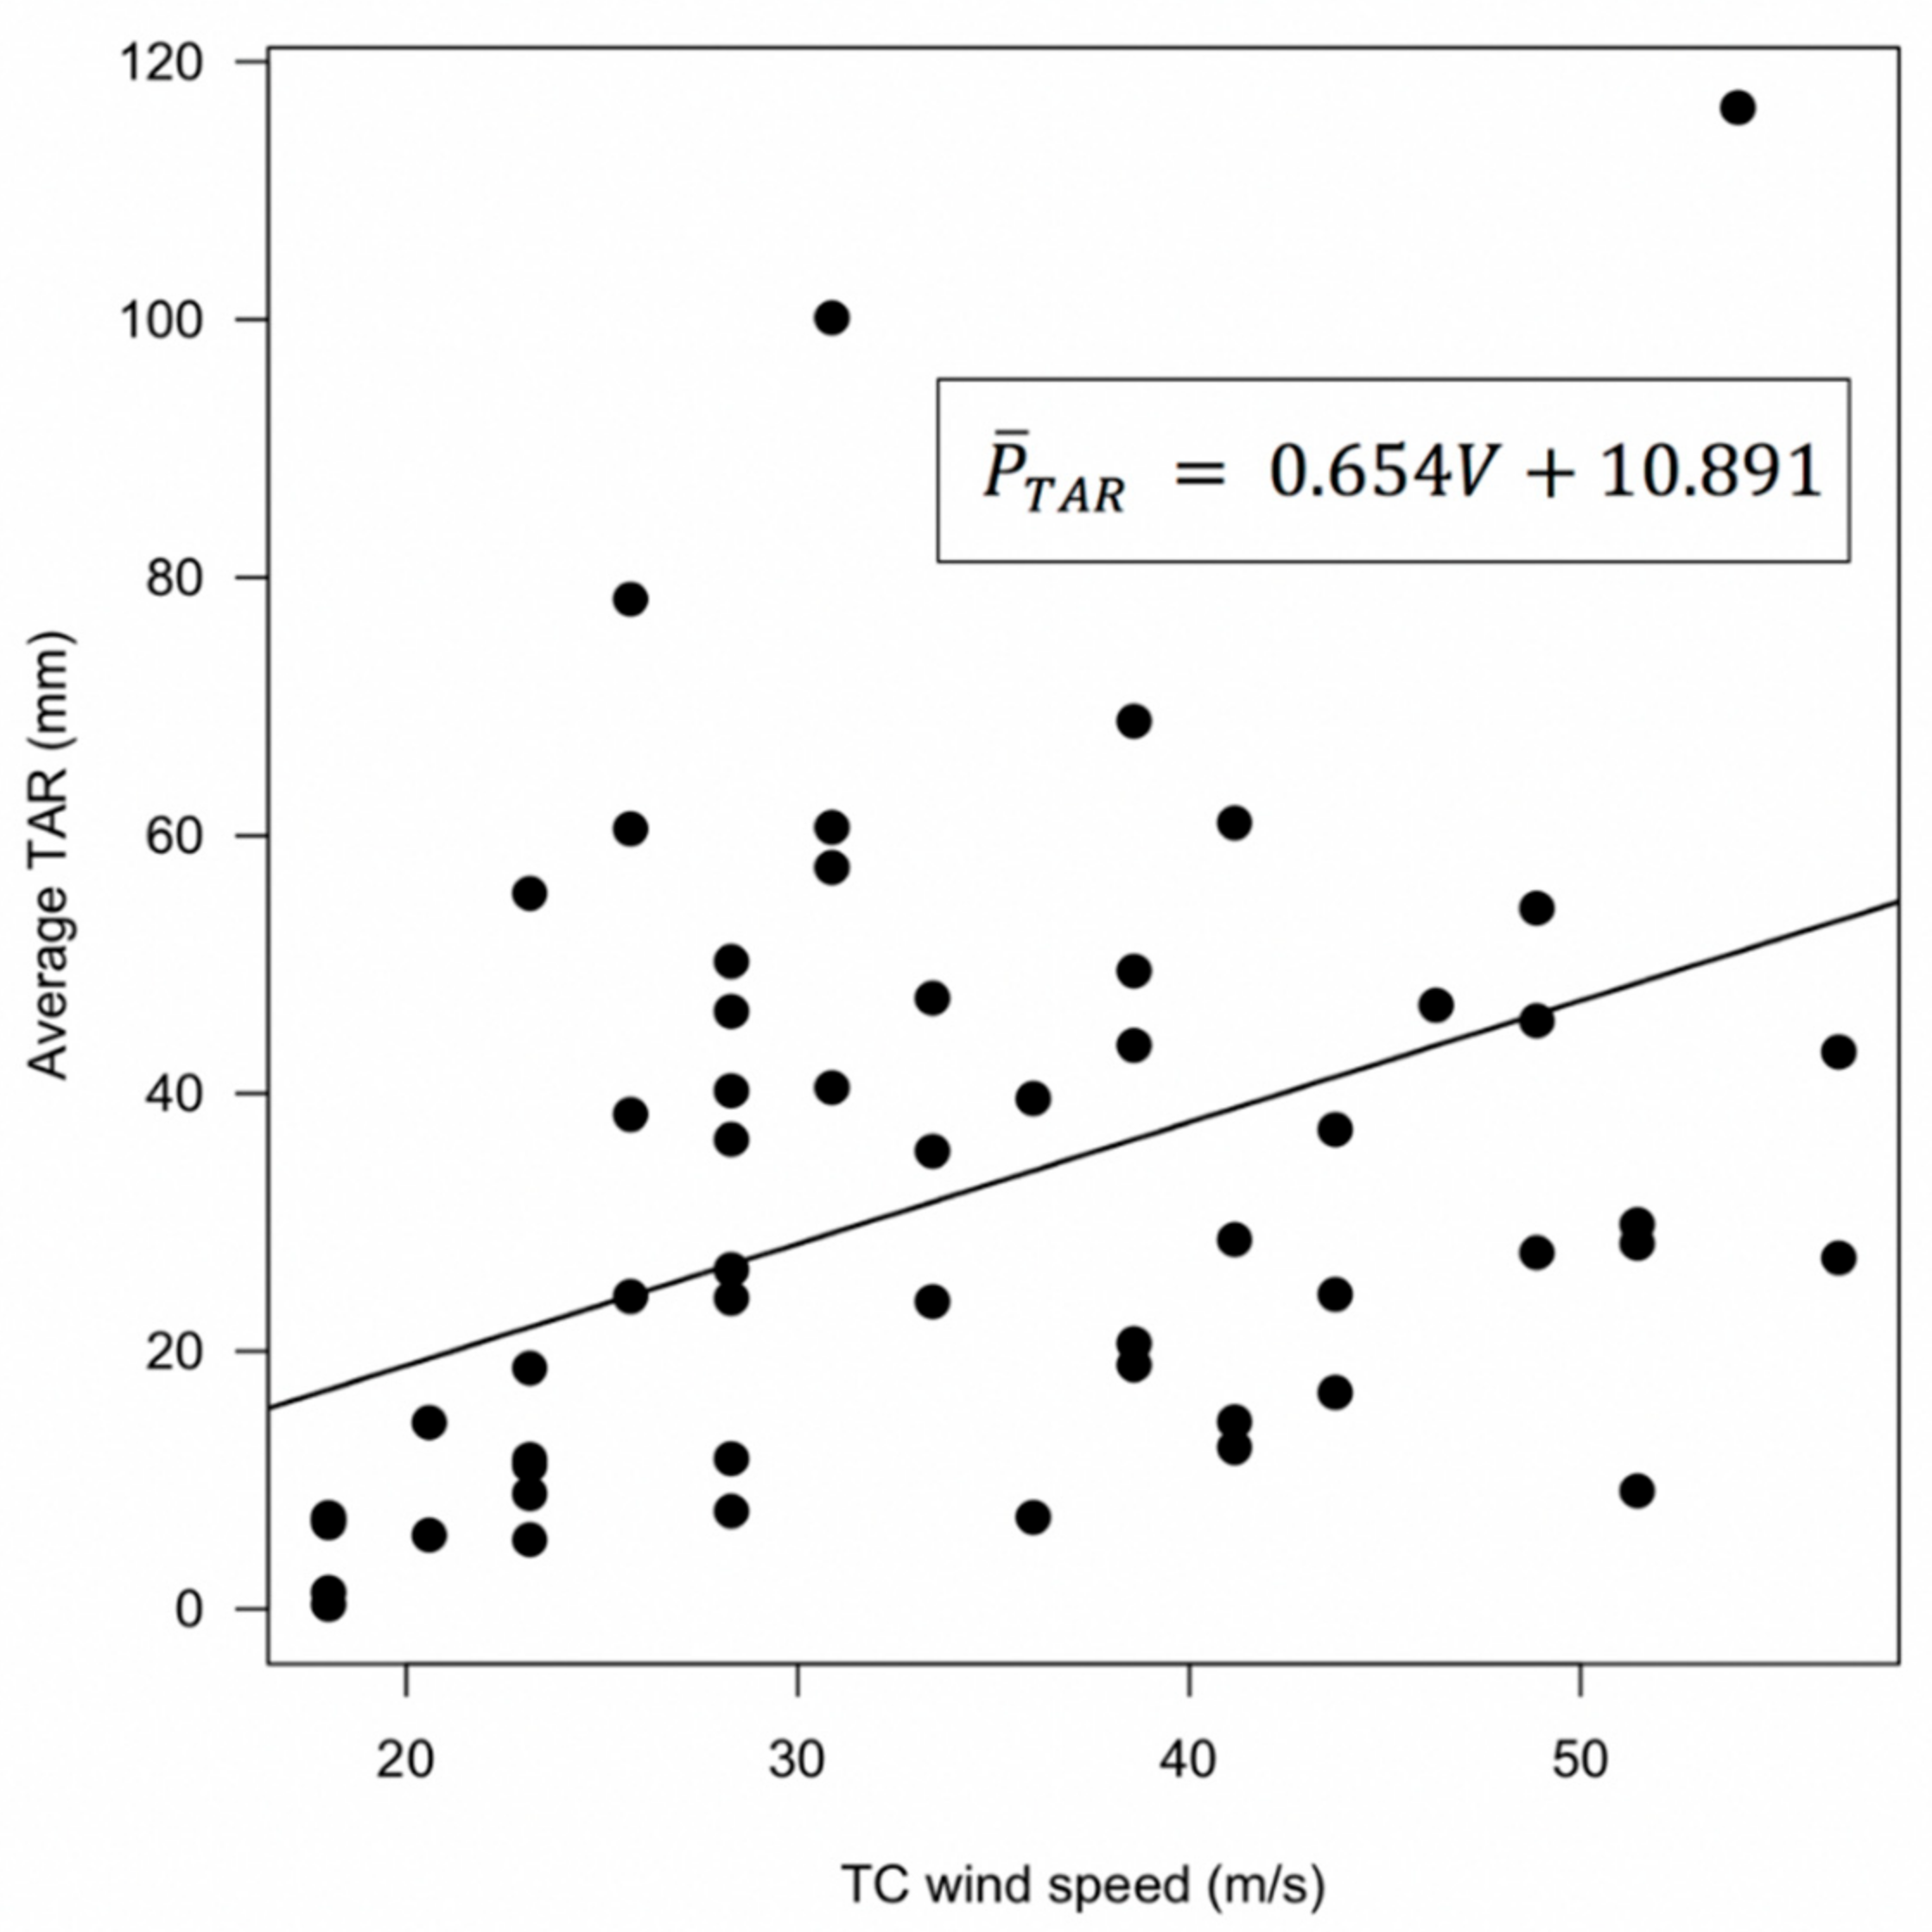
After processing the data, the 55 most representative typhoons with high data accuracy and their corresponding similar-track typhoons were finally selected. The TC wind speed and average rainfall values during the passage of these typhoons were then calculated from the data obtained from 75 stations in the southeast coastal area of China. Using these data, the linear regression equation relating the TC wind speed of the 75 weather stations and the average TAR during typhoon passage was obtained (
Figure 3) and the best fit was given by Equation (5):
The equation shows that there is a positive correlation between the TC wind speed (V, m/s) and the average TAR (, mm). This shows a significant relationship (p < 0.05) between the TC wind speed and the average TAR (R2 = 0.654 ± 0.291). During the training process for the TAR prediction model, this linear equation was adopted to apply an intensity correction to all typhoons with similar tracks.
3.2. Effects of Track Similarity, Ensemble Averaging, and Intensity Correction on the TAR Predictions
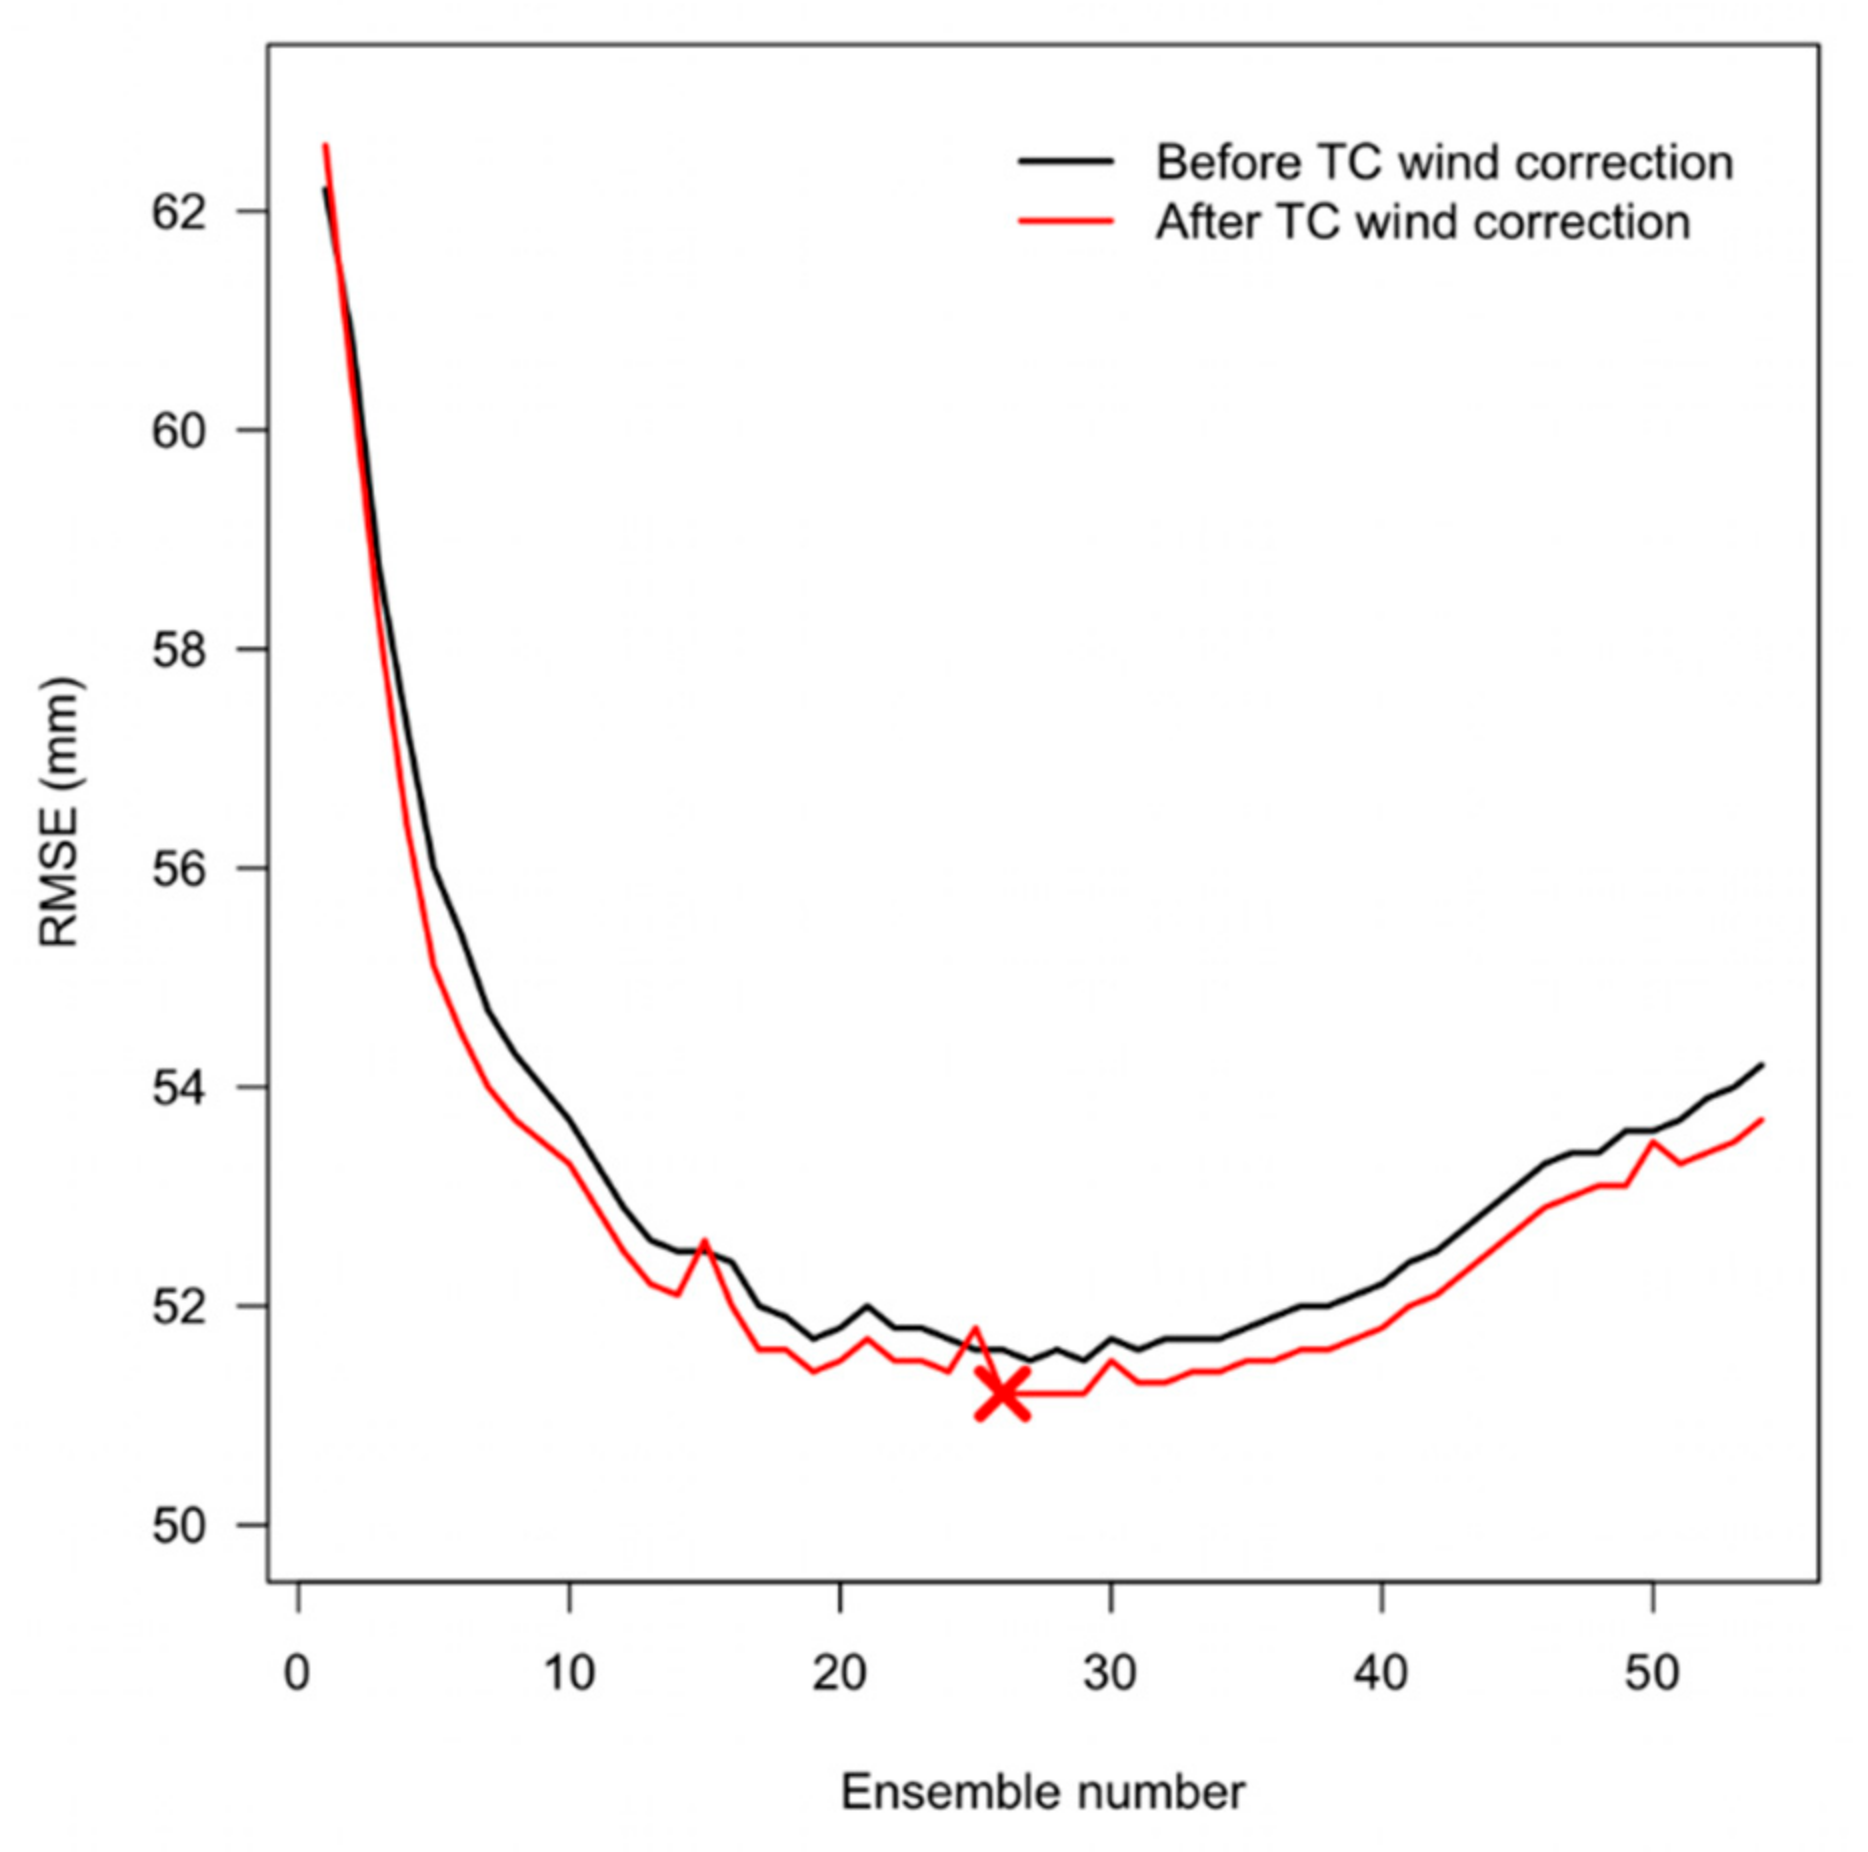
The similarity level of the typhoon track, the number of ensemble averages, and whether the typhoon intensity is corrected may have an impact on the TAR prediction. To examine the influence of the typhoon track similarity level, the accuracy of the prediction result is judged by the root mean square error (RMSE), where a smaller error indicates a more accurate result. The results presented in
Figure 4 (black line) show that the use of a single typhoon with the most similar track to predict the TAR values of the target typhoon in the target areas from 1961 to 2017 gives an average RMSE of 62.2 mm. However, if the typhoon with the second-best track similarity is used alone for the prediction, the RMSE is slightly decreased to 60.8 mm, while using only the typhoon rainfall data with the third-best track similarity decreases the average RMSE to 58.7 mm. Thereafter, the average RMSE continues to decrease as the similarity of the selected typhoon increases. In general, the prediction error decreases with the use of individual typhoons with increasing track similarity levels, but the use of only a single typhoon in the TAR prediction process may nevertheless result in an unsatisfactory error reduction even if its track is very similar to that of the target typhoon.
To further reduce the prediction errors, ensemble averaging (EA) was then considered [
21,
37]. To detect the influence of EA on the TAR prediction result, the number of high track-similarity typhoons used in the prediction at each station was increased step-by-step to form an ensemble, then their average TAR values were calculated and compared with the observed values. The results in
Figure 4 (black line) indicate that as the number of typhoons in the ensemble increases, the RMSE initially decreases to a minimum of 51.5 mm with an ensemble of the 27 most similar typhoons, and gradually increases thereafter.
Then, to study the influence of typhoon wind intensity correction upon TAR prediction, the TAR obtained after TWIC was calculated using the EA method, and the results were compared with those obtained without TWIC in
Figure 4. Here, the red line indicates a decrease of 0.5–0.9 mm in the average RMSE after the TWIC. In other words, the TWIC helps reduce the error in TAR predictions. In addition, the above results indicate an optimal ensemble number of 26 when using the EA method to predict the TAR.
Based on the results of the above analysis, the operational process of the statistical TAR prediction model used in the present study for the southeast coastal area of China is as follows:
- (1).
The model is used when the predicted typhoon track is judged as potentially having an impact on rainfall in the target area (i.e., when the distance between the typhoon center and the stations is less than 500 km).
- (2).
According to the historical typhoon tracks, the top 27 typhoons that are most similar to the track of the target typhoon are selected.
- (3).
The TWIC equation is used to correct the TAR according to the typhoon intensity for selected typhoons observed at 75 stations.
- (4).
The TAR of selected typhoons is averaged after intensity correction.
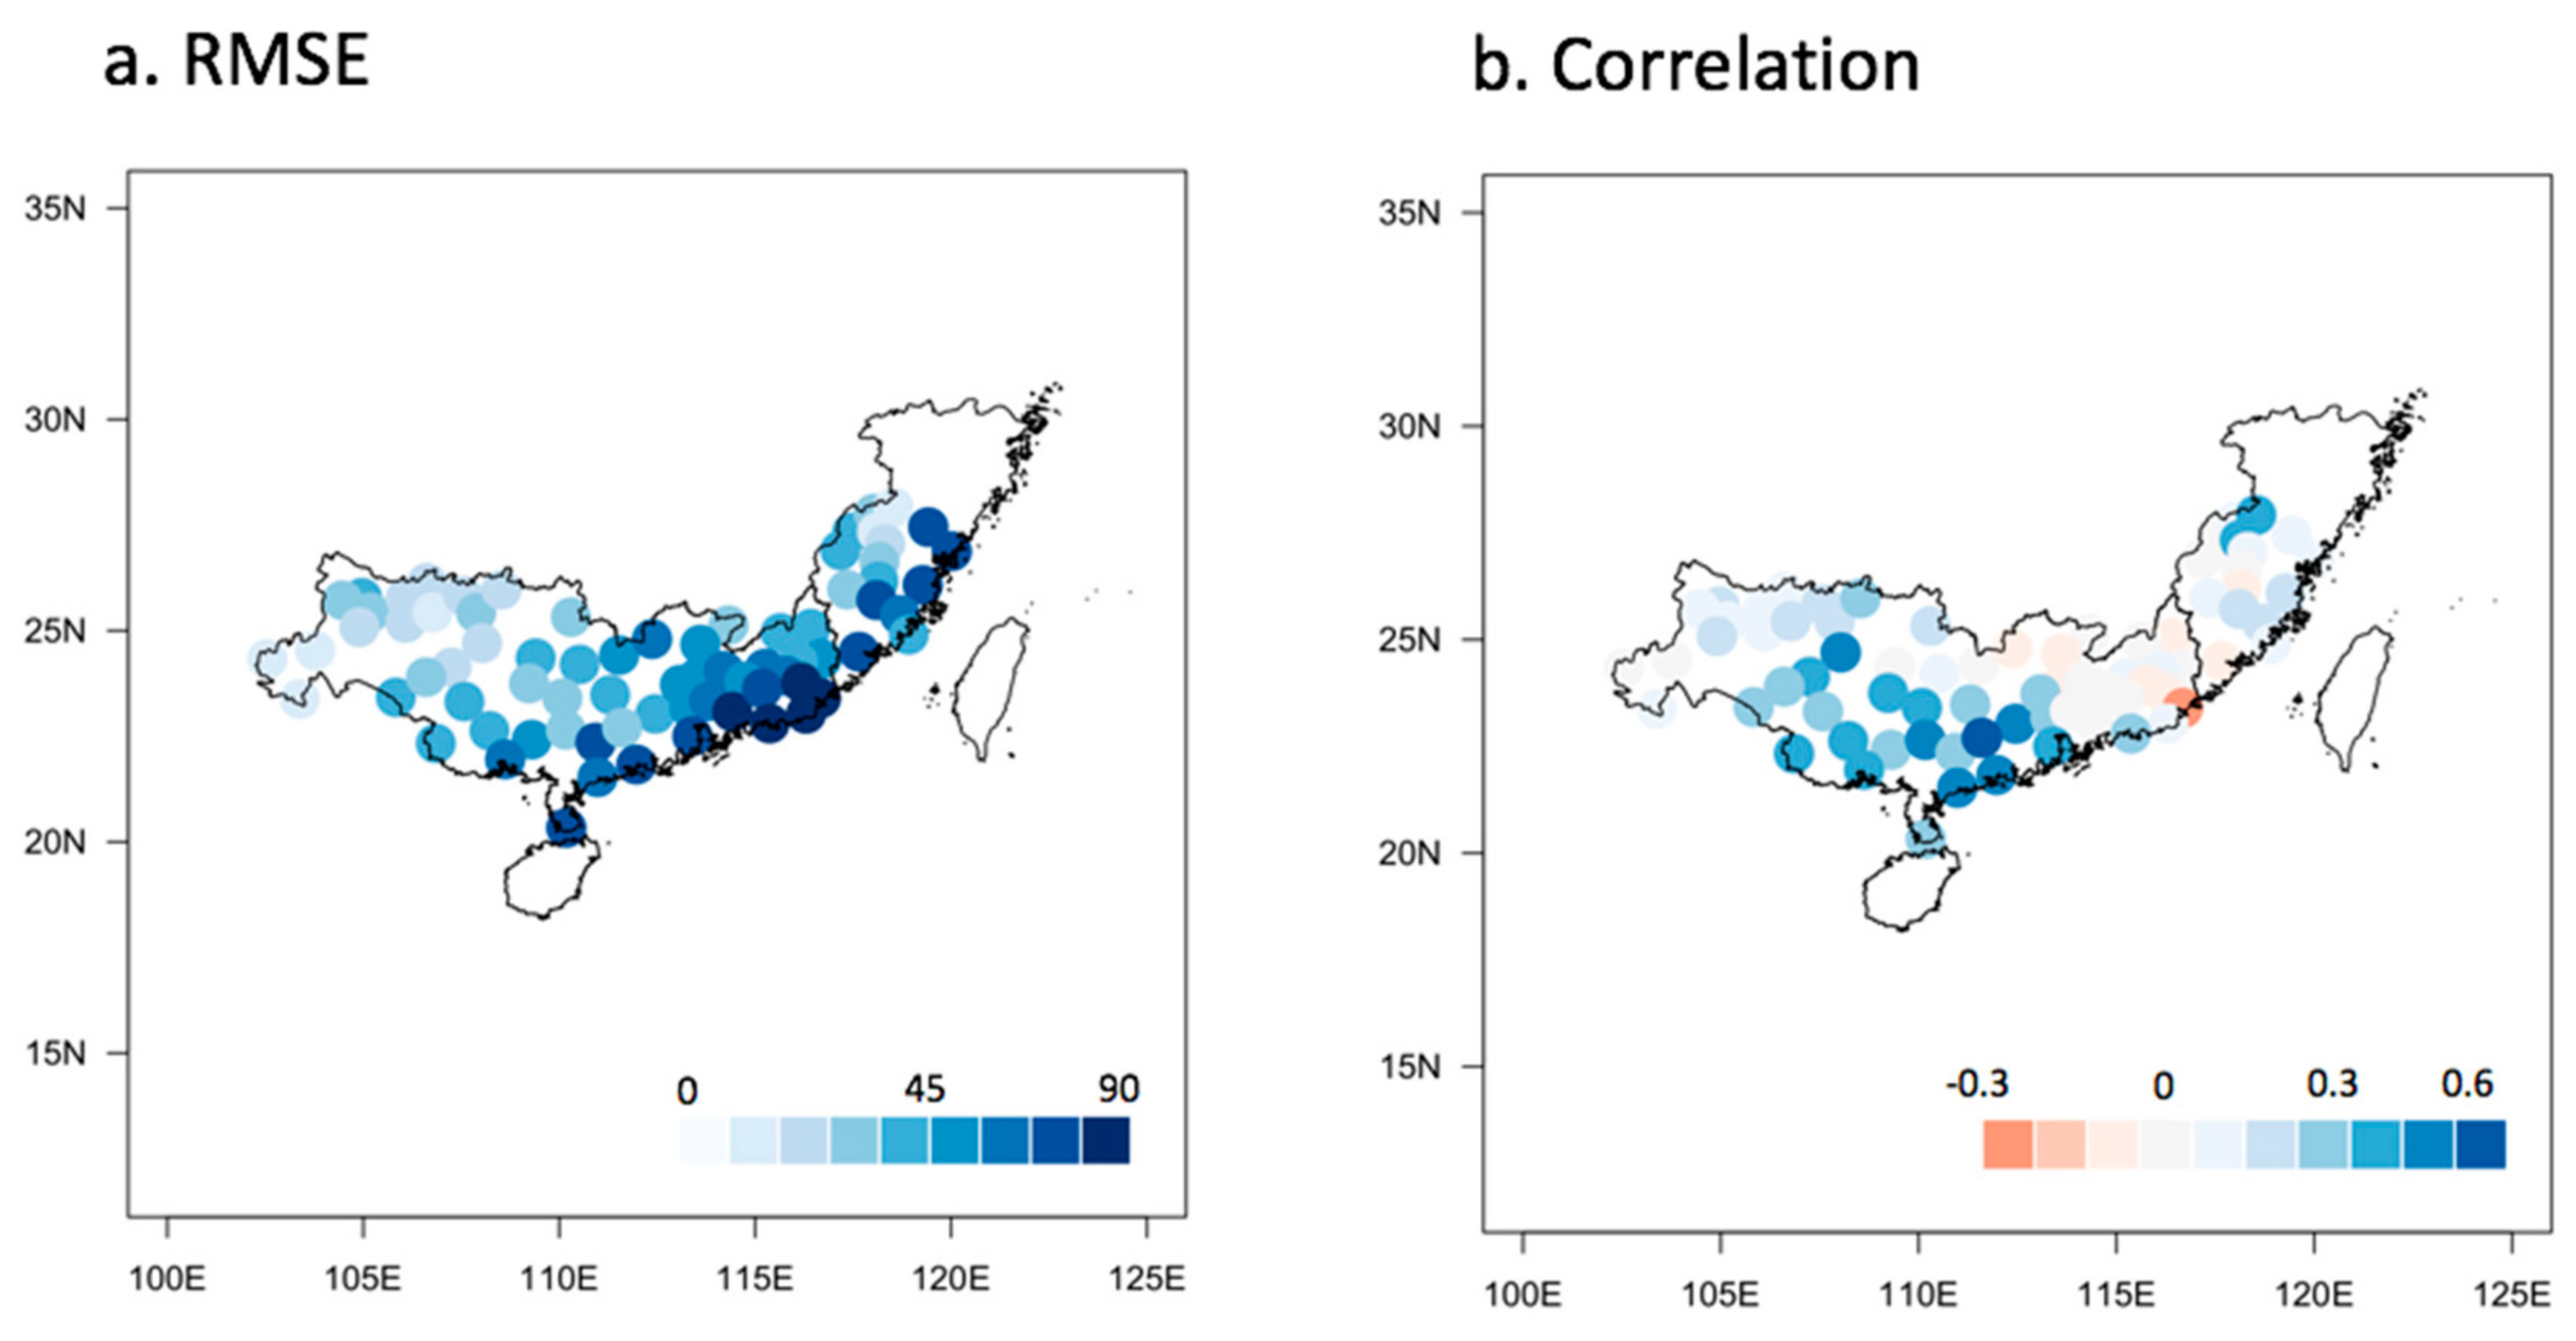
The spatial distribution of the RMSE (mm) and correlation coefficients of 55 typhoons at 75 stations in the eastern and southern coastal areas of China from 1961 to 2017 estimate using this TAR prediction model during the training period are presented in
Figure 5. Here, the RMSE of the 55 typhoons at the majority of stations is seen to be below 70 mm. The particularly large error and low correlation at the southern and eastern coastlines of China may be due to the impact of the co-existing rainy front in southeastern China and the relatively strong TC passing through the coastal areas, since a strong rainfall intensity with considerable regional variations can reduce the accuracy of TAR predictions.
3.3. Model Performance
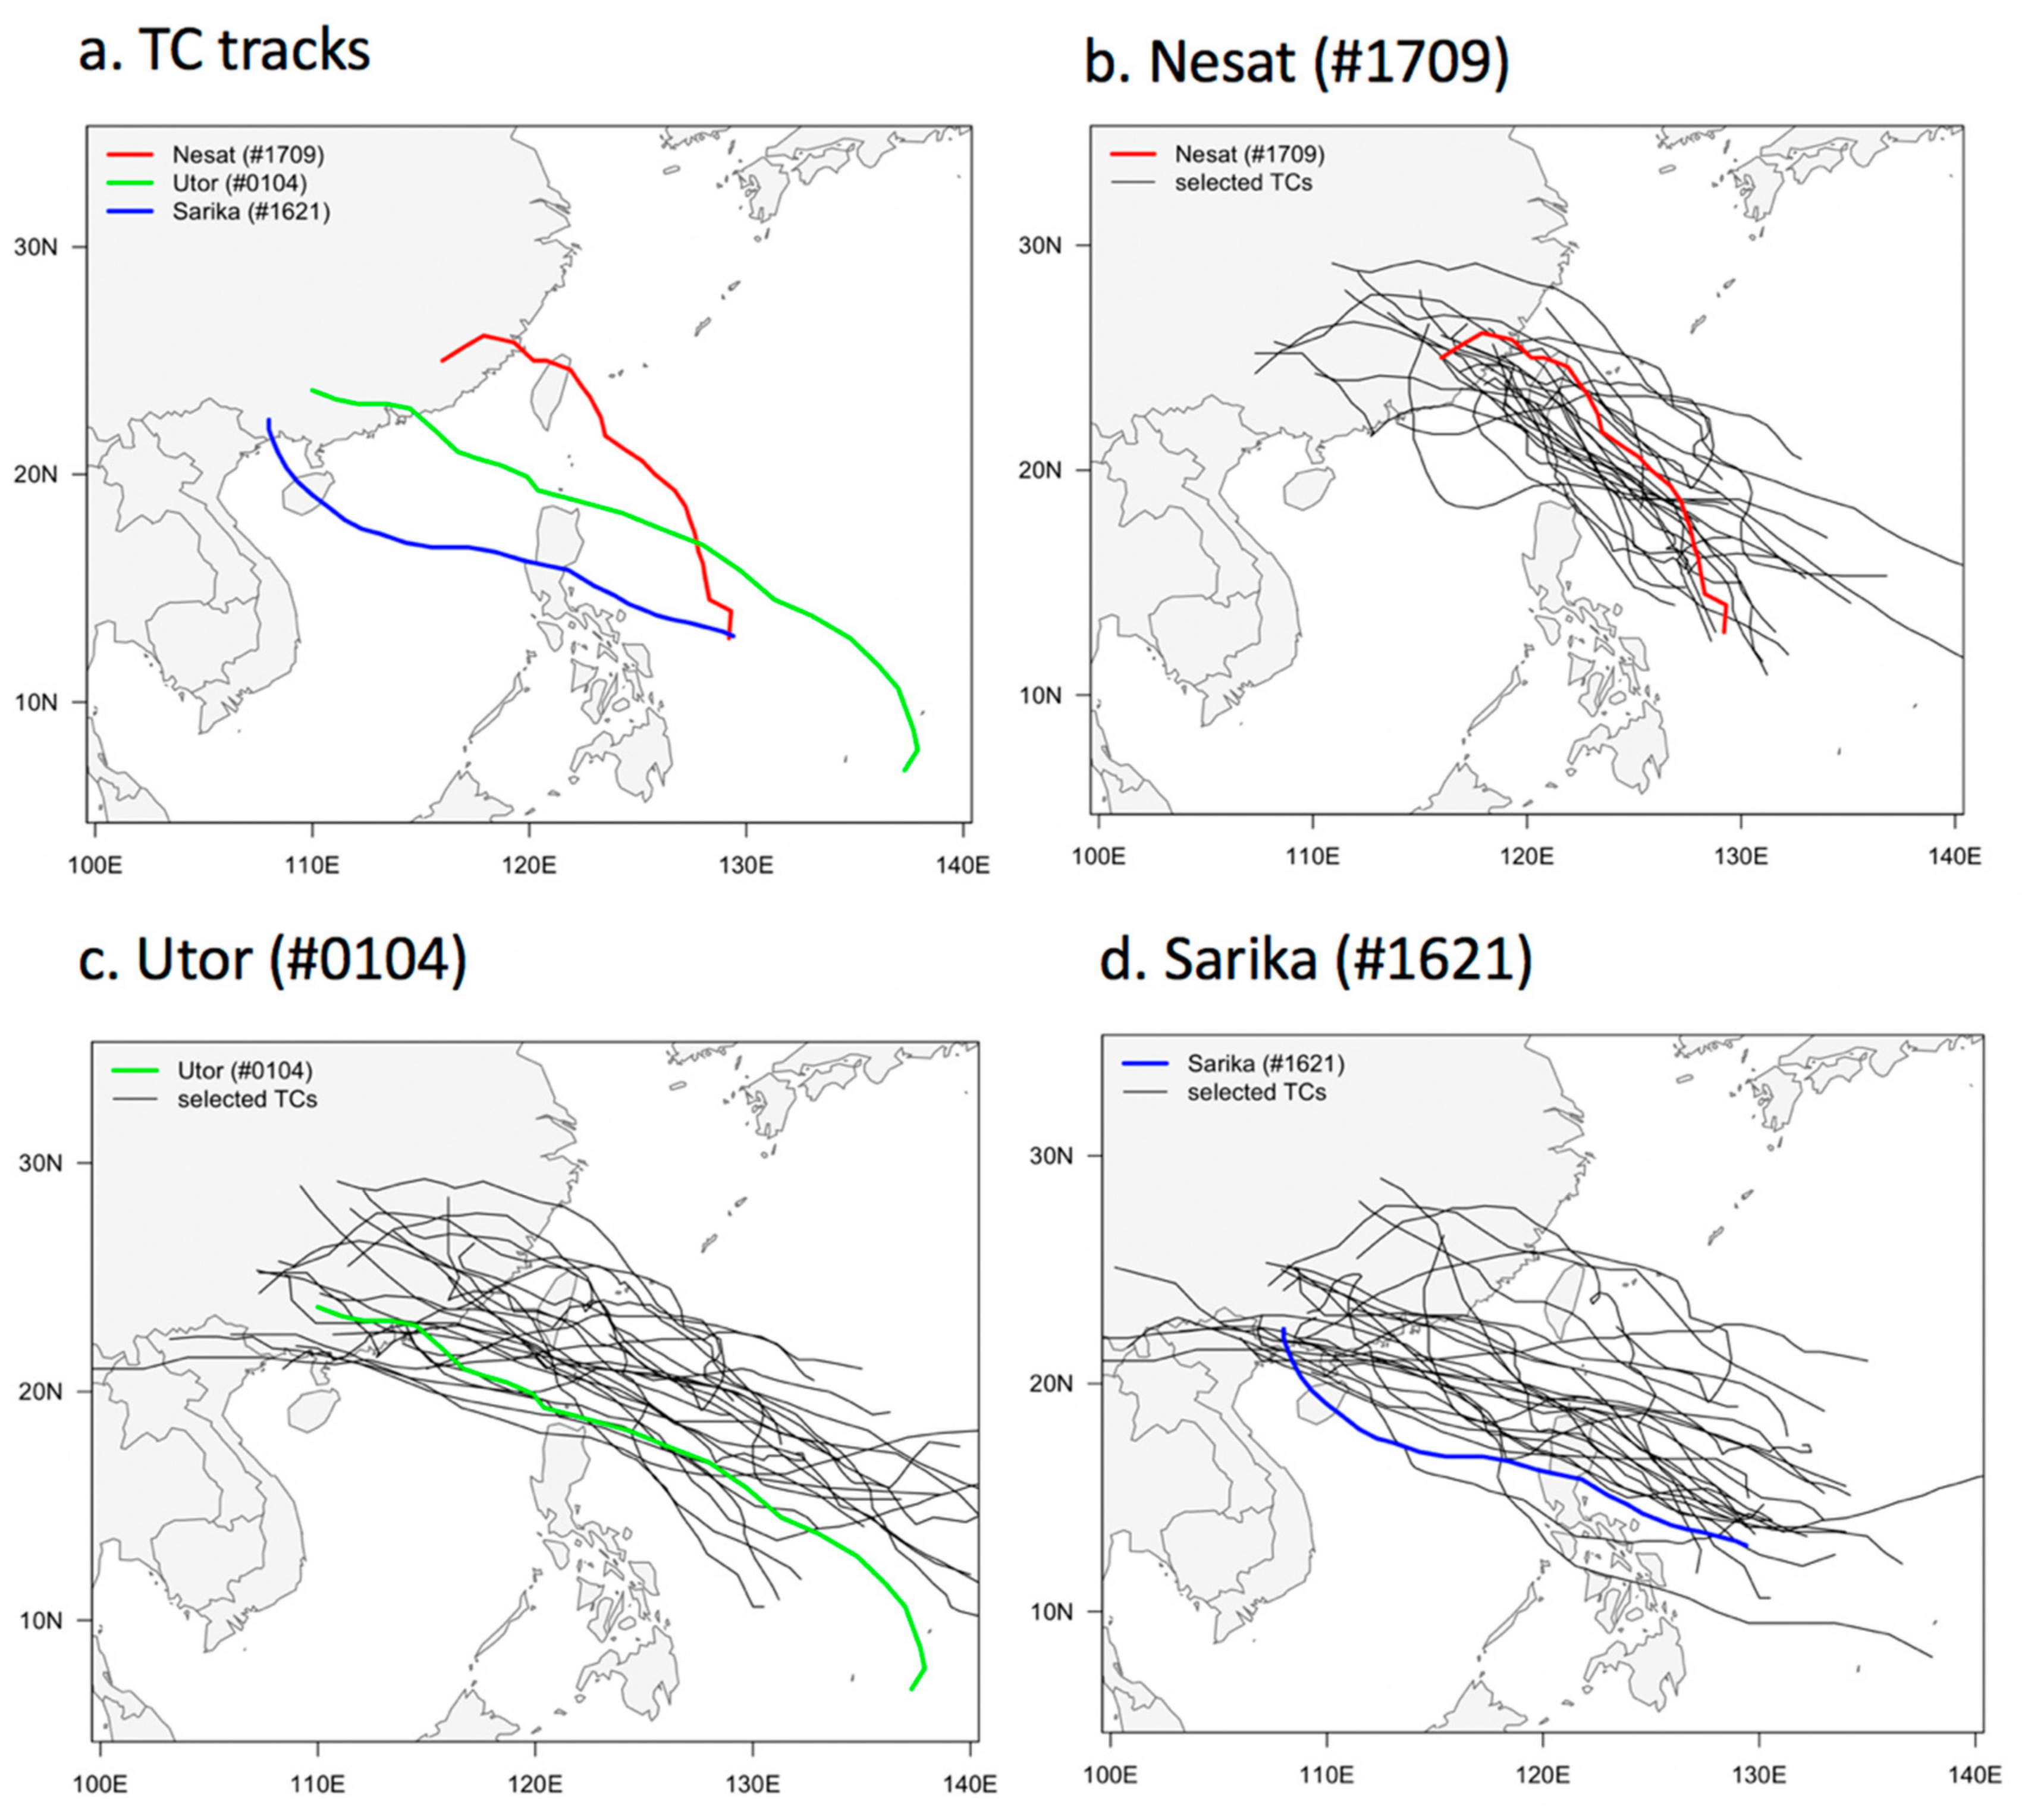
Typhoon Sarika (#1621), which affected the coastal area of southern China in 2016, typhoon Nesat (#1709), which affected the coastal area of southeast China in 2017, and typhoon Utor (#0104), which passed between Hainan Island and Taiwan, were then used to evaluate the actual performance of the TAR prediction model. The three typhoons had different tracks as they approached and made landfall in China, with Sarika (#1621) crossing Hainan Island and moving northwestward to land along the southern coastline of Guangxi Province in China, while Nesat (#1709) landed in Fujian Province through the Taiwan Strait after passing through northern Taiwan and then moving southwest. The FCM approach was used to selected typhoons with the most similar tracks, then their TAR intensities were corrected according to the aforementioned equation and were then averaged. The most similar tracks obtained from the FCM analysis are presented in
Figure 6. By averaging the TC wind intensity-corrected historical TAR records of these typhoons, the TAR values of Sarika (#1621), Nesat (#1709), and Utor (#0104) at the 75 stations in the southeastern coastal and southern coastal areas of China were predicted and compared with the observed values. The results indicate RMSE values of 35.7, 55.5, and 47.2 mm for typhoons Nesat (#1709), Utor (#0104), and Sarika (#1621), respectively. Thus, the error in the results of TAR prediction for two of the three typhoons using the proposed statistical model is lower than the average error (51.2 mm) obtained using 55 typhoons during the model training period.
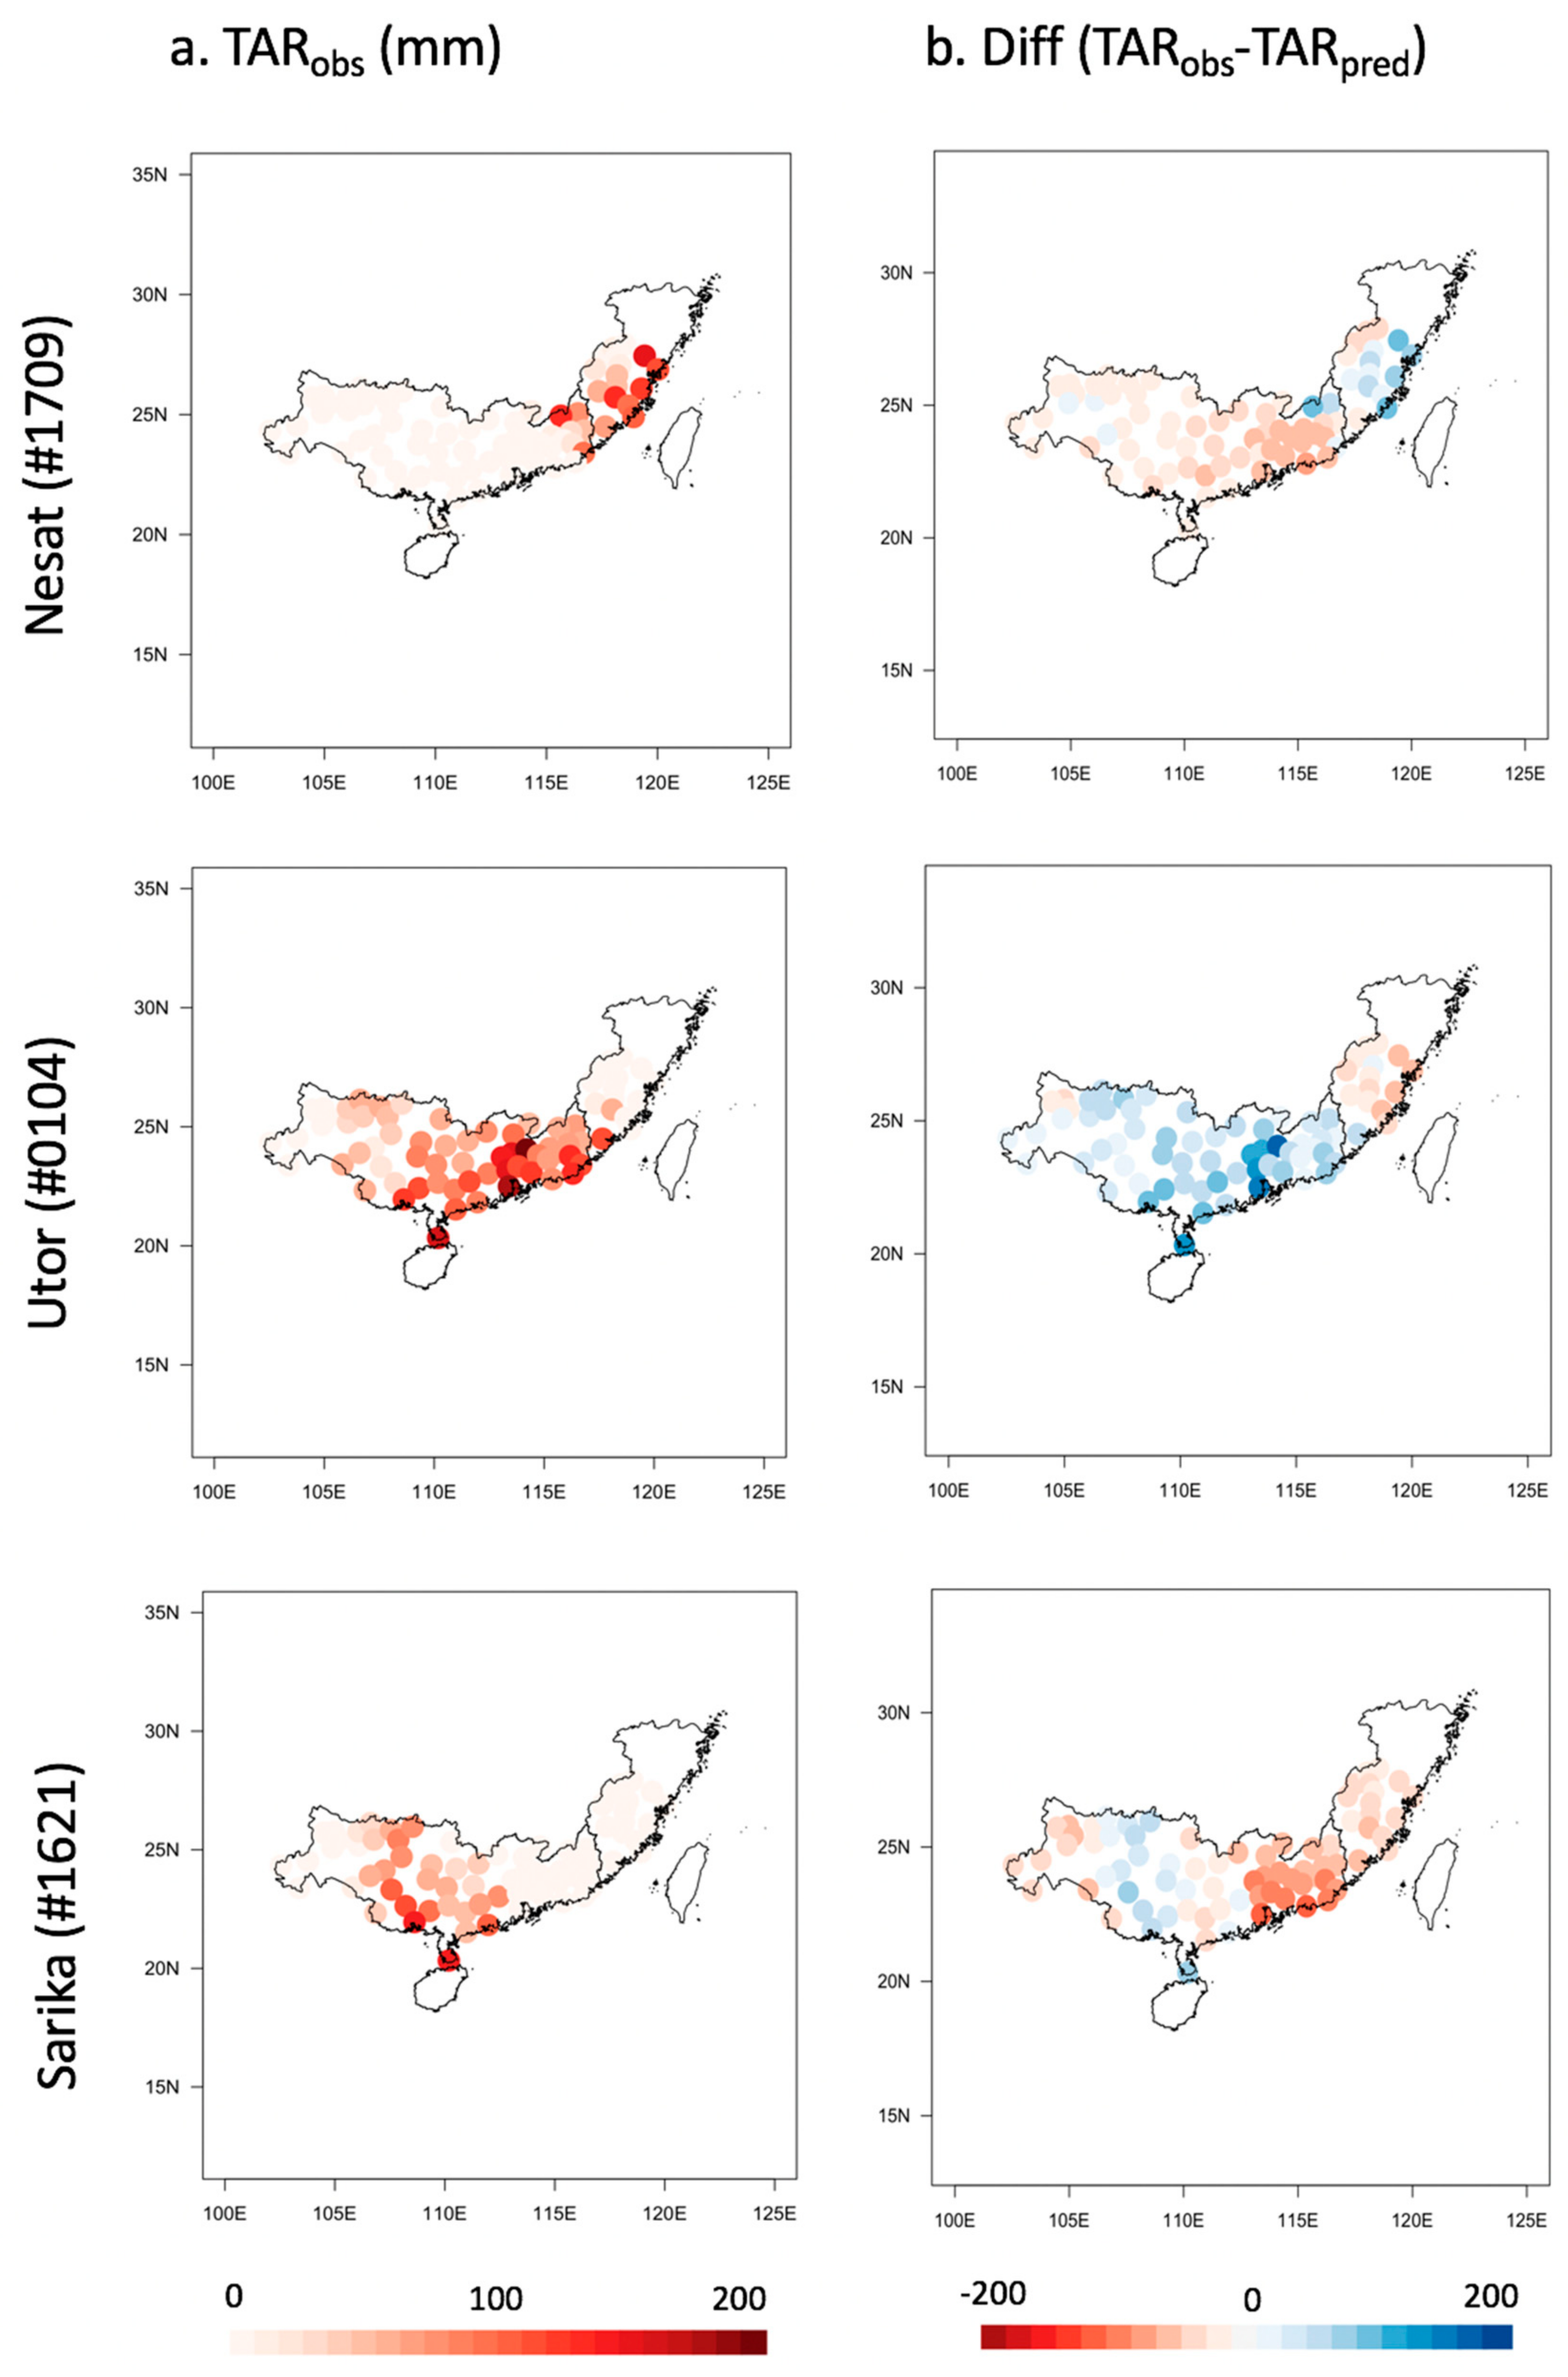
The observed TAR values for typhoons Nesat (#1709), Utor (#0104), and Sarika (#1621) are presented, along with the differences between observed and predicted values, in
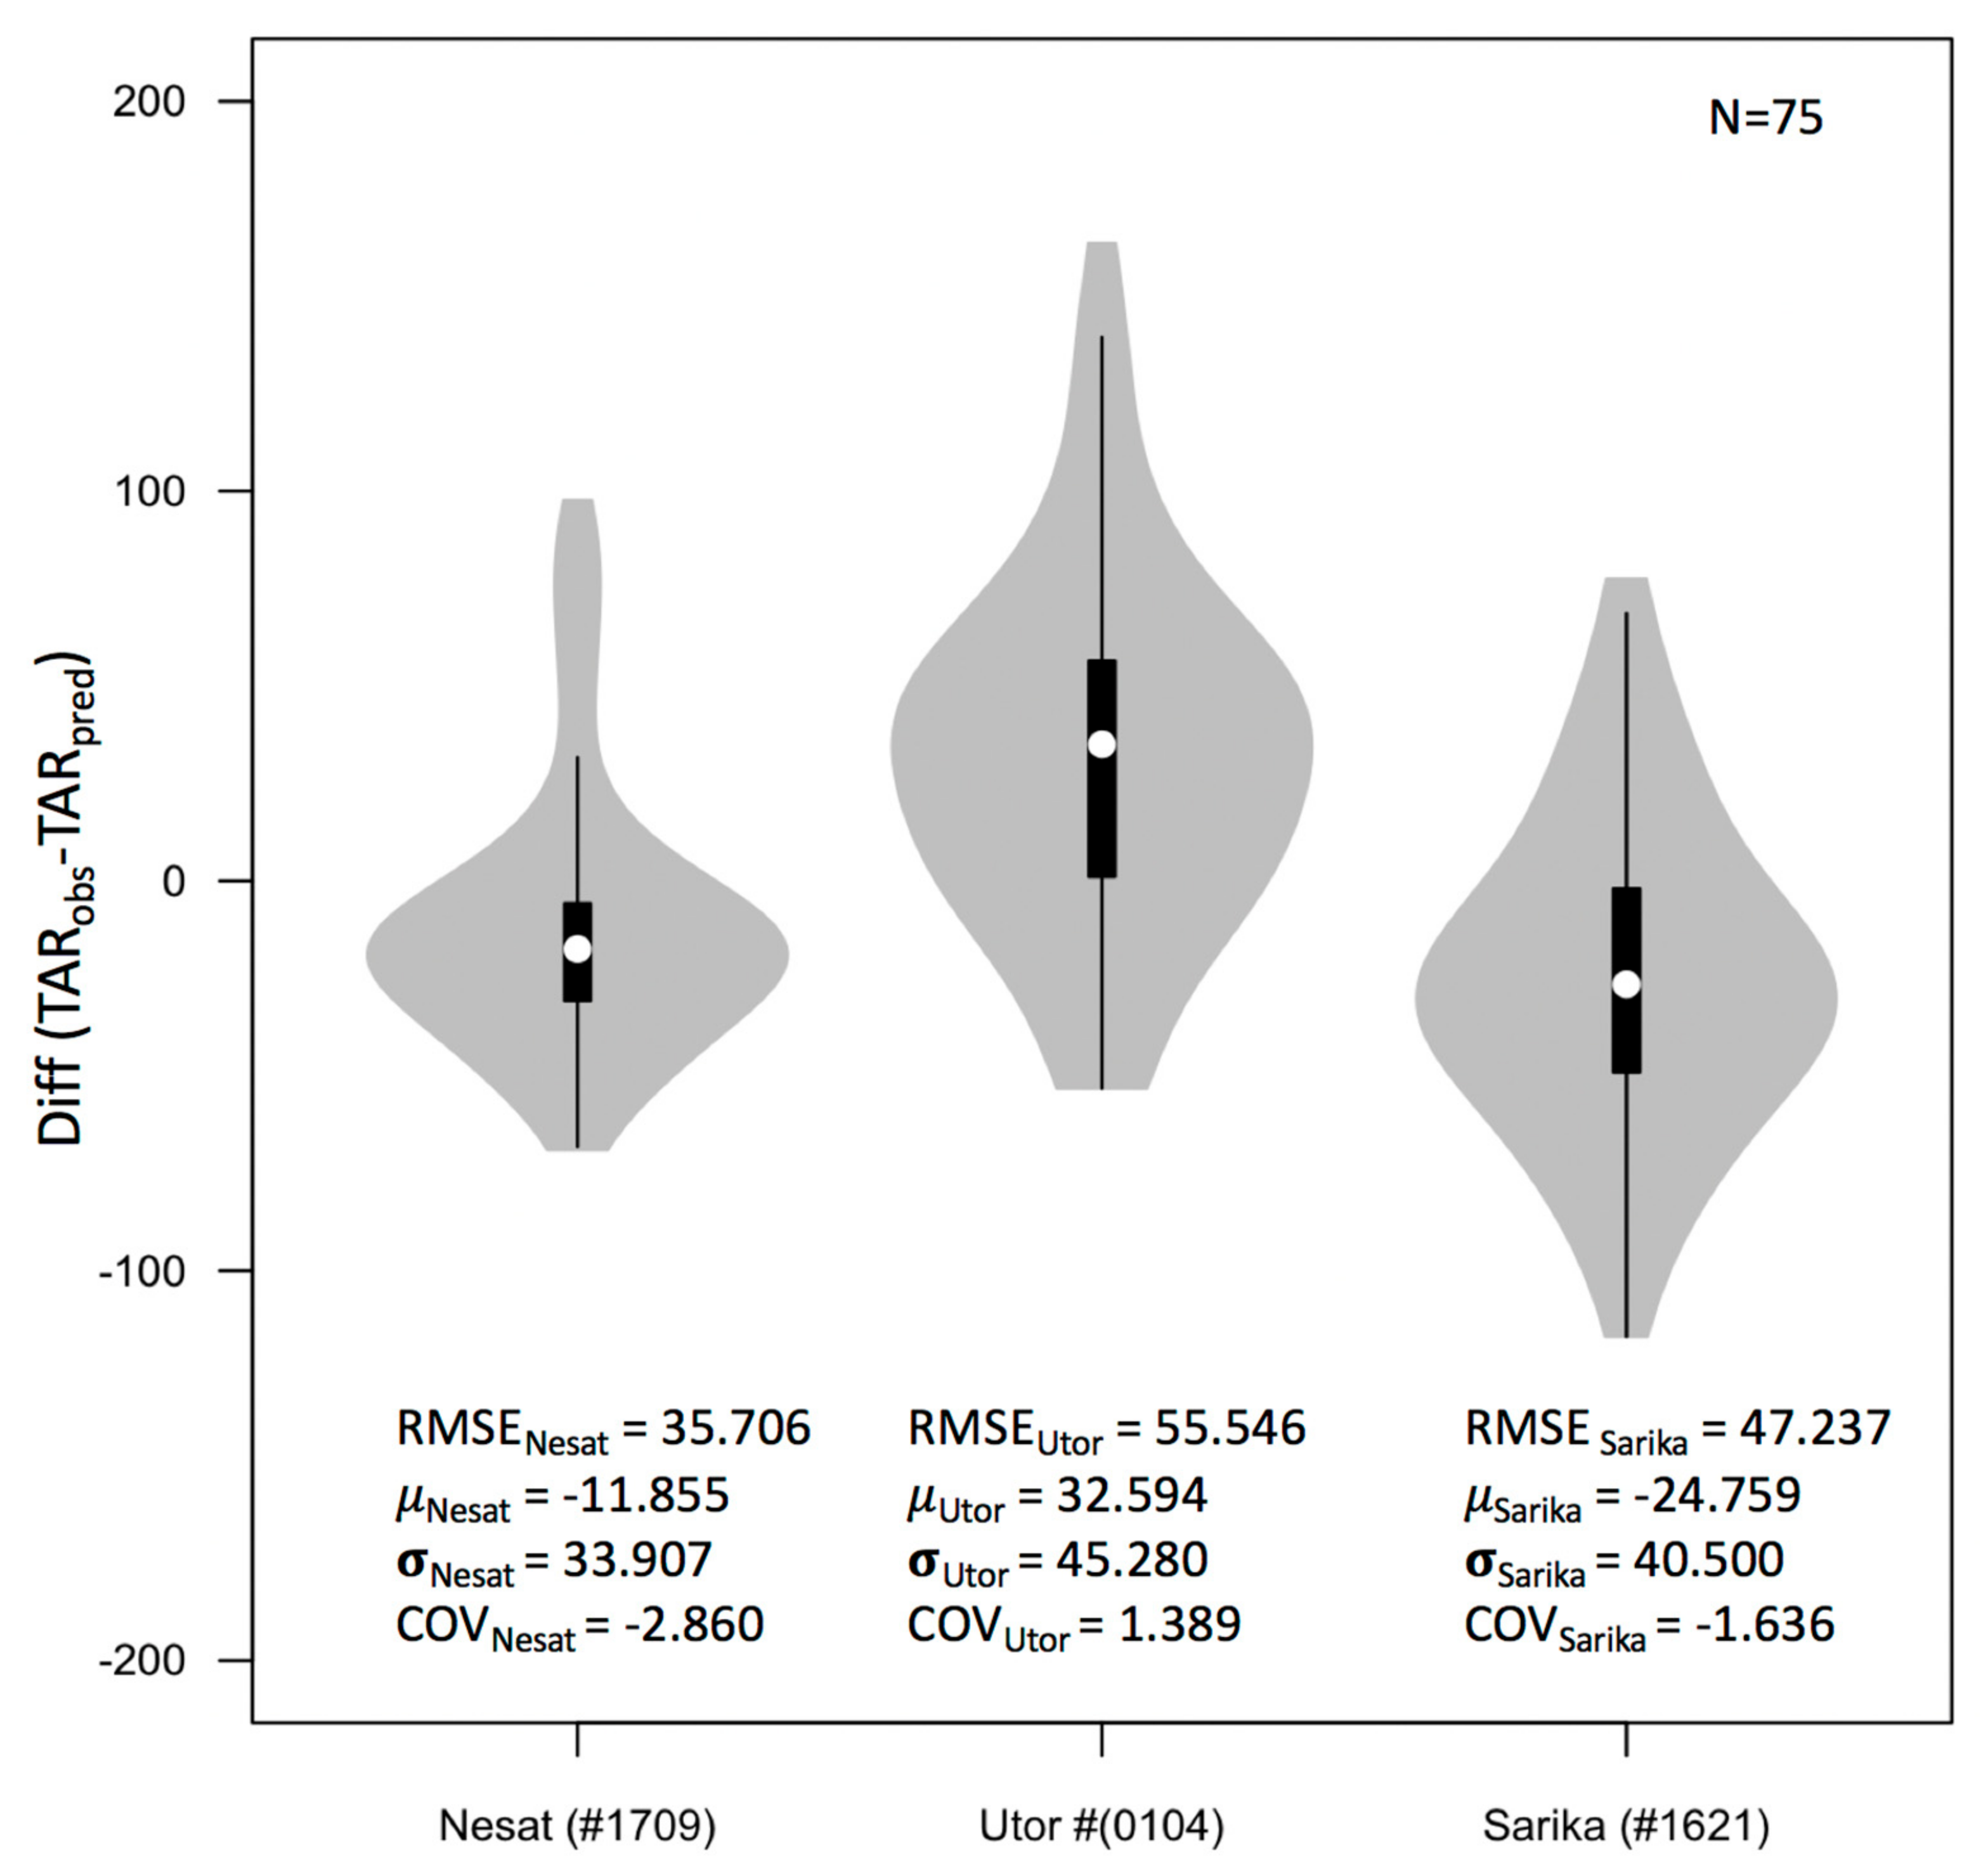
Figure 7. Here, the predicted TAR spatial pattern for typhoon Nesat (#1709) is seen to be very similar to the observed outcome, except that the TAR for part of the area farther away from the coast is overestimated. For typhoon Utor (#0104), the predicted results show significant differences in the Southeastern and Pearl river basins, being slightly overestimated in the former and underestimated in the latter compare to the observation. For typhoon Sarika (#1621), the distribution of predicted TAR values in the southern and southeastern coastal areas of China is very similar to the actual observations, although it is overestimated in Fujian Province and underestimated in Guangdong Province. These results are further illustrated by the violin plots (boxplot-density trace synergism) in
Figure 8. In conclusion, the results of the TAR prediction model presented in this study are effectively similar to the actual observations and indicate the overall good performance of the model for predicting the spatial distribution of TAR values.
4. Summary and Conclusions
A statistical approach for predicting typhoon rainfall was developed herein based on the historical storm track, intensity, and rainfall data for 55 typhoons affecting the southeastern coastal areas of China from 1961 to 2017. Specifically, the statistical model was based on the principle of track similarity. Since tropical cyclones (TCs) with similar tracks tend to produce relatively similar rainfall patterns, therefore, historical TC rainfall data with similar tracks were used to predict the accumulated rainfall caused by the target TC. In addition, TC intensity correction and ensemble averaging for multiple similar TC tracks were used to reduce prediction errors. The fuzzy C-means clustering (FCM) algorithm was used to select the typhoons with the most similar tracks to that of the target typhoon. The typhoon-induced accumulated rainfall (TAR) values of the selected typhoons observed at each of the 75 stations were corrected according to typhoon intensity, and then averaged to provide an estimate of the target typhoon’s TAR value at each station.
The results indicated an average error of 51.2 mm across the 75 stations in the coastal area of southern China. In addition, three typhoons that were excluded from the model training process (i.e., Nesat (#1709), Utor (#0104), and Sarika (#1621)) were subsequently used to generate a forecast according to their best-track data and, thus, verify the predictive performance of the model. The resulting RMSE for the predicted TAR of Utor (#0104) is slightly high (55.5 mm), while those of Nesat (#1709) and Sarika (#1621) were 35.7 and 47.2 mm, respectively. The latter two errors were lower than the average error (51.2 mm) obtained during the model training period, thus proving the feasibility of the model for use in actual predictions. Subsequently, the spatial distribution results of the TAR values for the three typhoons predicted by this model at 75 stations were analyzed and found to be similar to the actual observations. This further demonstrated the overall good performance of the model in predicting the spatial distribution of the TAR values.
Nevertheless, the TAR prediction model presented in this study is limited to predicting only the accumulated rainfall caused by typhoons; it cannot predict the change in rainfall over time at all locations. Although numerical weather prediction (NWP) models are more advanced in this respect, the results predicted by the proposed statistical model have greater significance in certain contexts—especially for regulating reservoir discharge and flood control. The roles of the proposed model are to provide a more accurate forecast of the TAR at the target site, to coordinate the prediction of traditional numerical models, and to ensure that the region has responded well to typhoon-related rainfall measures.
Predicting rainfall caused by typhoons is challenging because, in addition to the track and intensity of the typhoon, many factors such as the regional terrain, the interaction of the typhoon with the land, and the speed of the storm translation can have certain effects upon the TAR. Notably, the TAR prediction model established in the present study did not consider these factors. Additionally, the number of typhoon samples used to build the TAR prediction model in the southern and southeastern coastal areas of China was not large. If additional factors are considered in future research, such as a correction for storm translation speed and size, and if the effective sample size is increased by using more typhoon data, the predicted results might become more accurate. In addition, confirmation is required via a comparison with NWP-based ensemble prediction models. All these approaches can help improve the performance of the TAR prediction model over China.
Author Contributions
Conceptualization, Resources, Formal analysis, Writing—Original draft, J.-S.K., and A.C.; Conceptualization, Methodology; I.-J.M., J.L., and J.-S.K., Writing—Review & editing, I.-J.M., Y.-I.M. and J.-S.K. All authors have read and agreed to the published version of the manuscript.
Funding
We appreciate the support of the State Key Laboratory of Water Resources and Hydropower Engineering Science, Wuhan University.
Conflicts of Interest
The authors declare no conflict of interest.
References
- McCarthy, J.J. IPCC, Climate Change 2001: Impacts, Adaptation and Vulnerability: Contribution of Working Group II to the Third Assessment Report of the Intergovernmental Panel on Climate Change, 1st ed.; Cambridge University Press: Cambridge, UK, 2001; ISBN 0521015006. [Google Scholar]
- Neumann, B.; Vafeidis, A.T.; Zimmermann, J.; Nicholls, R.J. Future Coastal Population Growth and Exposure to Sea-Level Rise and Coastal Flooding—A Global Assessment. PLoS ONE 2015, 10, e0118571. [Google Scholar] [CrossRef] [PubMed] [Green Version]
- Kang, H.Y.; Kim, J.S.; Kim, S.Y.; Moon, Y.I. Changes in High- and Low-Flow Regimes: A Diagnostic Analysis of Tropical Cyclones in the Western North Pacific. Water Resour. Manag. 2017, 31, 3939–3951. [Google Scholar] [CrossRef]
- Kim, J.S.; Jain, S.; Kang, H.Y.; Moon, Y.I.; Lee, J.H. Inflow into Korea’s Soyang Dam: Hydrologic variability and links to typhoon impacts. J. Hydro Environ. Res. 2019, 22, 50–56. [Google Scholar] [CrossRef]
- Kim, J.S.; Kim, S.T.; Wang, L.; Wang, X.; Moon, Y.I. Tropical cyclone activity in the northwestern Pacific associated with decaying Central Pacific El Niños. Stoch. Env. Res. Risk A 2016, 30, 1335–1345. [Google Scholar] [CrossRef]
- Knuston, T.R.; McBride, J.L.; Chan, J.; Emanuel, K.; Holland, G.; Landsea, C.; Held, I.; Kossin, J.P.; Srivastava, A.K.; Sugi, M. Tropical cyclones and climate change. Nat. Geosci. 2010, 3, 157–163. [Google Scholar]
- Wang, Y.; Shen, X.S.; Chen, D.H. Verification of tropical cyclone rainfall predictions from CMA and JMA global models. J. Trop. Meteorol. 2012, 18, 537. [Google Scholar]
- Chen, P.; Yu, H.; Chan, J.C.L. A western North Pacific tropical cyclone intensity prediction scheme. Acta Meteorol. Sin. 2011, 25, 611–624. [Google Scholar] [CrossRef]
- Kim, J.S.; Jain, S. Precipitation trends over the Korean peninsula: Typhoon-induced changes and a typology for characterizing climate-related risk. Environ. Res. Lett. 2011, 6, 034033. [Google Scholar] [CrossRef]
- Rogers, R.; Marks, F.; Marchok, T. Tropical cyclone rainfall. In Encyclopedia of Hydrological Sciences; John Wiley & Sons, Ltd.: Chichester, UK, 2009; ISBN 9780471491033. [Google Scholar] [CrossRef]
- Lian, Y.; Liu, Y.; Dong, X. Strategies for controlling false online information during natural disasters: The case of Typhoon Mangkhut in China. Technol. Soc. 2020, 62, 101265. [Google Scholar] [CrossRef]
- Kim, T.K. Impacts of Data Assimilation on the K-PPM for Hydro-Meteorological Application: Based on Analysis of Typhoon Cases Landed on the Korean Peninsula during 2012 (Unpublished Doctoral Dissertation); Pukyong National University: Busan, Korea, 2013. [Google Scholar]
- Bender, M.A.; Ginis, I.; Tuleya, R.E.; Thomas, B. The operational GFDL coupled Hurricane–Ocean prediction system and a summary of its performance. Mon. Weather Rev. 2007, 135, 3965–3989. [Google Scholar] [CrossRef]
- Lin, I.I.; Wu, C.C.; Pun, I.F.; Ko, D.S. Upper-ocean thermal structure and the western North Pacific category 5 typhoons. Part I: Ocean features and the category 5 typhoons’ intensification. Mon. Weather Rev. 2008, 136, 3288–3306. [Google Scholar] [CrossRef] [Green Version]
- Elsberry, R.L.; Carr, L.E., III. Consensus of dynamical tropical cyclone track forecasts errors versus spread. Mon. Weather Rev. 2000, 128, 4131–4138. [Google Scholar] [CrossRef]
- Goerss, J.S. Tropical cyclone track forecasts using an ensemble of dynamical models. Mon. Weather Rev. 2000, 128, 1187–1193. [Google Scholar] [CrossRef]
- Gao, S.; Zhao, P.; Pan, B.; Li, Y.; Zhou, M.; Xu, J.L.; Zhong, S.; Shi, Z. A nowcasting model for the prediction of typhoon tracks based on a long short term memory neural network. Acta Oceanol. Sin. 2018, 37, 8–12. [Google Scholar] [CrossRef]
- Kim, W.J.; Hasegwa, O. Time Series Prediction of Tropical Storm Trajectory Using Self-Organizing Incremental Neural Networks and Error Evaluation. J. Adv. Comput. Intell. Intell. Inform. 2018, 22, 465–474. [Google Scholar] [CrossRef]
- Chen, G.M.; Yu, H.; Cao, Q.; Zeng, Z.H. The performance of global models in TC track forecasting over the western North Pacific from 2010 to 2012. Tropical Cyclone Res. Rev. 2013, 2, 149–158. [Google Scholar]
- Lei, X.T.; Wong, W.K.; Fong, C. A Challenge of the Experiment on Typhoon Intensity Change in Coastal Area. Tropical Cyclone Res. Rev. 2017, 6, 94–97. [Google Scholar]
- Mackey, B.P.; Krishnamurti, T.N. Ensemble forecast of a typhoon flood event. Weather Forecast. 2001, 16, 399–415. [Google Scholar] [CrossRef]
- Kidder, S.Q.; Knaff, J.A.; Kusselson, S.J.; Turk, M.; Ferraro, R.R.; Kuligowski, R.J. The tropical rainfall potential (TRaP) technique. Part I: Description and examples. Weather Forecast. 2005, 20, 456–464. [Google Scholar] [CrossRef] [Green Version]
- Marks, F.D.; Kappler, G.; DeMaria, M. Development of a tropical cyclone rainfall climatology and persistence (RCLIPER) model. In Reprints of the 25th Conference on Hurricanes and Tropical Meteorology; American Meteorological Society: San Diego, CA, USA, 2002. [Google Scholar]
- Lonfat, M.; Rogers, R.; Marchok, T.; Marks, F.D., Jr. A parametric model for predicting hurricane rainfall. Mon. Weather Rev. 2007, 135, 3086–3097. [Google Scholar] [CrossRef]
- Liu, C.C. The influence of terrain on the tropical rainfall potential technique in Taiwan. Weather Forecast. 2009, 24, 785–799. [Google Scholar] [CrossRef]
- Li, Q.; Lan, H.; Chan, J.C.L.; Cao, C.; Li, C.; Wang, X. An operational statistical scheme for tropical cyclone-induced rainfall forecast. J. Trop. Meteorol. 2016, 21, 101–110. [Google Scholar]
- Ebert, E.E.; Turk, M.; Kusselson, S.J.; Yang, J.; Seybold, M.; Keehn, P.R.; Kuligowski, R.J. Ensemble tropical rainfall potential (e TRaP) forecasts. Weather Forecast. 2011, 26, 213–224. [Google Scholar] [CrossRef]
- Kim, H.J.; Moon, I.J.; Kim, M. Statistical prediction of typhoon-induced accumulated rainfall over the Korean Peninsula based on storm and rainfall data. Meteorol. Appl. 2019, 1–18. [Google Scholar] [CrossRef] [Green Version]
- Ren, F.; Qiu, W.; Ding, C.; Jiang, X.; Wu, L.; Xu, Y.; Duan, Y. An objective index of tropical cyclone track similarity and its preliminary application in the prediction of the precipitation associated with landfalling tropical cyclones. Weather Forecast. 2018, 33, 1725–1742. [Google Scholar] [CrossRef]
- Lee, C.-S.; Huang, L.-R.; Shen, H.-S.; Wang, S.-T. A climatology model for forecasting typhoon rainfall in Taiwan. Nat. Hazards 2006, 37, 87–105. [Google Scholar] [CrossRef]
- Wu, Y.; Wu, S.; Zhai, P. The impact of tropical cyclones on Hainan Island’s extreme and total precipitation. Int. J. Climatol. 2007, 27, 1059–1064. [Google Scholar] [CrossRef]
- Son, C.-Y.; Kim, J.-S.; Moon, Y.-I.; Lee, J.-H. Characteristics of tropical cyclone-induced precipitation over the Korean River basins according to three evolution patterns of the Central-Pacific El Niño. Stoch. Env. Res. Risk A. 2017, 28, 1147–1156. [Google Scholar] [CrossRef]
- Dhakal, N.; Jain, S. Nonstationary influence of the North Atlantic tropical cyclones on the spatio-temporal variability of the eastern United States precipitation extremes. Int. J. Climatol. 2019, 40, 3486–3499. [Google Scholar] [CrossRef]
- Bezdek, J.C.; Ehrlich, R.; Full, W. FCM: The fuzzy c means clustering algorithm. Comput. Geosci. 1984, 10, 191–203. [Google Scholar] [CrossRef]
- Kim, H.S.; Kim, J.H.; Ho, C.H.; Chu, P.S. Pattern classification of typhoon tracks using the fuzzy c-means clustering method. J. Climate. 2011, 24, 488–508. [Google Scholar] [CrossRef]
- Cerveny, R.S.; Newman, L.E. Climatological relationships between tropical cyclones and rainfall. Mon. Weather Rev. 2000, 128, 3329–3336. [Google Scholar] [CrossRef]
- Qi, L.; Yu, H.; Chen, P. Selective ensemble-mean technique for tropical cyclone track forecast by using ensemble prediction systems. Q. J. Roy. Meteor. Soc. 2014, 140, 805–813. [Google Scholar] [CrossRef]
| Publisher’s Note: MDPI stays neutral with regard to jurisdictional claims in published maps and institutional affiliations. |
© 2020 by the authors. Licensee MDPI, Basel, Switzerland. This article is an open access article distributed under the terms and conditions of the Creative Commons Attribution (CC BY) license (http://creativecommons.org/licenses/by/4.0/).


