1. Introduction
This paper aims at presenting a general, simple, and remote sensing-based procedure for the quick update of the assessment of the population exposed to natural hazards that can be applied in any area of interest all over the world. This procedure explores the potential of the combination of the high refresh rate of satellite nightlights intensity products with the high precision of urban cartography. The final product is a map of exposure that can be easily and quickly updated, with the refresh rate typical of remote sensing products, to be used in developed but especially in developing countries, where urbanization and population densities may change at a sub-yearly time scale.
The impact of natural disasters such as floods, earthquakes, or cyclones is growing significantly in recent decades [
1]. This can be related to the growth of all components of the risk equation—hazard impacted by climate change on one hand and exposure and vulnerability affected by the rapid economic growth and land-use changes in many areas of the world on the other. While the evaluation of the hazard component of the risk equation is a quite well established and consolidated procedure (see, e.g., Teng et al. [
2] for floods and Jena et al. [
3] for earthquakes) and global hazard maps are produced for several hazards (see, e.g., Dottori et al. [
4] and Aerts et al. [
5] for floods and Pagani et al. [
6] for earthquakes), the assessment of both the built-up areas and the number of people exposed to natural hazards is a complex process, which needs information that should be updated often, especially in areas with strong economic and urban development (see, e.g., Tran et al. [
7]). Nevertheless, this information is not easily available and even more difficult to update at the same rate of land use development. Currently, available satellite-based exposure products, such as the GUF
(for all the acronyms and abbreviations used in the text, please refer to the ‘Abbreviations’ section at the end of the manuscript) database [
8,
9,
10] or the ESM [
11], are very detailed and reliable, designed for use even on a fine scale, for example, for demographic monitoring, analysis on the spatial structure of built-up areas, and so forth [
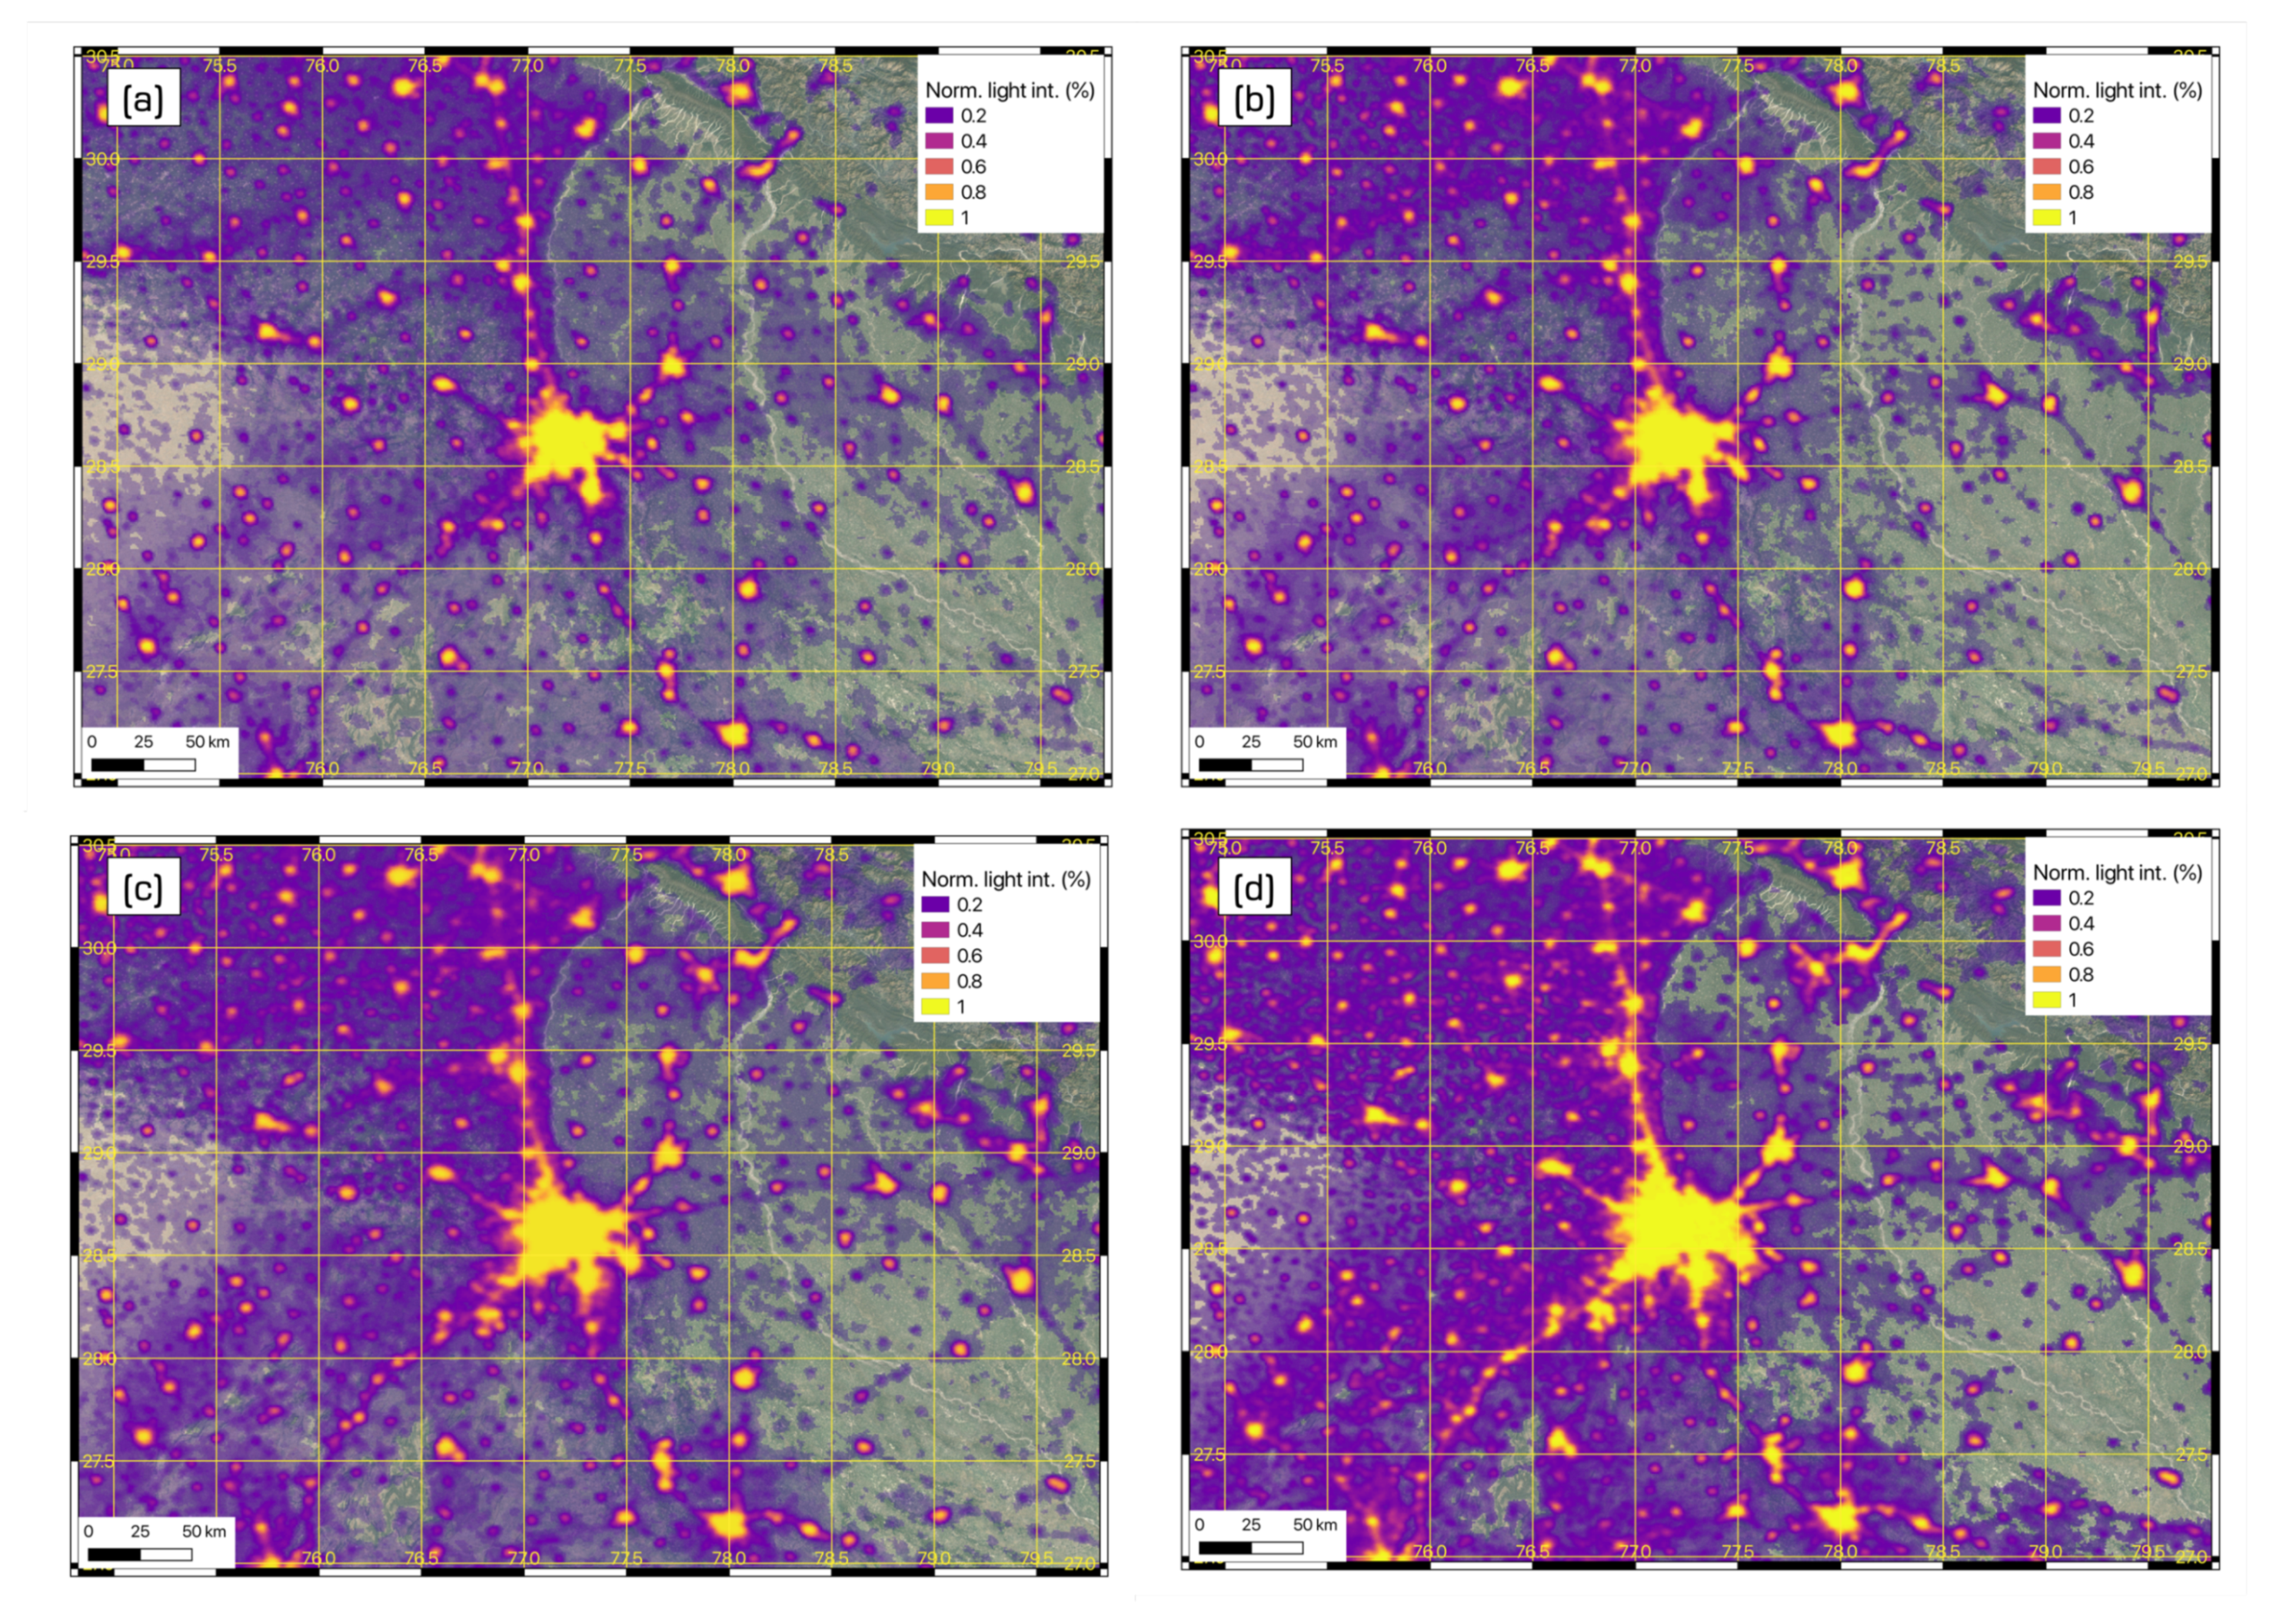
9]. Nevertheless, the level of processing required to release a final reliable version of these products lasts for several years, making their refresh rates significantly lower than the urban growth rate of many areas of the world. This is especially true for developing countries, where urban settlements and population may grow at a very impressive pace, showing significant changes in time frames which are lower than the ones required to update census data and high-detail satellite-based exposure products. As a clear example of this phenomenon, satellite-based DMSP nightlight intensity maps (as a proxy for urban density and population density) for the city of New Delhi, in India, are reported in
Figure 1 for the years 1998, 2003, 2008 and 2013.
It is worth mentioning here the provisions of the Sendai Framework for Disaster Risk Reduction [
12], which requires a frequent update (e.g., yearly) of information on the population or assets exposed at the national or provincial scale, to be used for the monitoring of some of its indicators, such as “Number of directly affected people attributed to disasters, per 100,000 population” (indicator B-1) or “Direct economic loss attributed to disasters in relation to global gross domestic product” (indicator C-1).
To provide a solution to the need for high refresh rate exposure data, it would be possible to link the cartography of exposure to other easily available information that can be updated with a higher refresh rate. Satellite-based nightlights have been used by various authors to map global urban extent and its dynamic [
13,
14,
15,
16,
17,
18,
19] or as proxy for population density [
20,
21,
22,
23,
24,
25,
26,
27,
28], economic activity [
29,
30,
31], and other. Results provided by Bagan and Yamagata [
25] show that the correlation between population density and nightlights intensity becomes significant for values of DMSP nightlights intensity above 61–62 (97–98% of the maximum intensity). Ceola et al. [
32] use the Version 4 DMSP-OLS Nighttime Lights Time Series to derive information about the exposure of the population to the flood risk [
33], linking the variation of the light intensity from 1992 to 2012 to the proximity of a river network, identified using the USGS HydroSHEDS database [
34]. However, the temporal evolution of the exposure does not only depend on the intensity of the light in a defined area around the watercourses, but it is also linked to the evolution of the extension of the urbanized area (not entirely represented by the pixels surrounding rivers only) and to its intersection with the areas exposed to the flood hazard.
This paper presents and validates an experimental methodology to quickly update the urbanization and the population density maps for a given area of interest, in order to assess the population exposed to natural hazards. This output can be used to perform aggregated (i.e., at scales coarser than the asset-scale) risk and direct damage estimations. The method is based on the identification of a relationship between nightlights intensity derived from satellite sensors and urbanization density derived from global available cartography, starting from the assumption that the latter can be considered as a proxy to quantify exposure in hazard-prone areas. This relation can be assessed at a specific time when both nightlights intensity and urbanization maps are available, and then can be potentially used to extrapolate the urbanization at different time steps, when only nightlights are available. In this way, the urbanization density can be quickly updated each time a new nightlight intensity map is available. On this map, it is then possible to redistribute the most updated population estimation-at least an aggregated value for the whole area of interest-to obtain a population density map and then evaluate the exposed population.
Although previous studies [
20,
21,
22,
23,
24,
25,
26,
27,
28] have explored various methodologies to spatialize population starting from satellite nightlights intensity products, they used complicated steps [
20,
23,
24] or required a high level of pre-processing for the input data [
28]. Almost all of these studies do not focus on the possibility to update the urbanization and the population density since they mainly investigated the development of algorithms for spatialize census data at higher detail [
21,
23,
24] or the analysis of the evolution of spatio-temporal population characteristics [
25,
27]. Moreover, many of the proposed methods use relationships calibrated for the specific area of interest [
23,
27] that are not exported elsewhere.
This work solves all of these issues, presenting a very simple methodology that requires a limited amount of input data, which can be easily found globally and do not require any complex pre-processing. The purpose of this approach is not to develop an algorithm to spatialize at higher detail census data, but to develop a simple tool to produce updated information on population distribution just using new nightlight intensity maps and aggregated population estimations. Furthermore, it is demonstrated that the relationships between nightlight intensity and urban density calibrated on a portion of the area of interest can be easily exported to significantly larger areas with good results. Moreover, studies focusing on the spatialization of census data at higher detail usually encounter significant issues in verifying and validating their simulations [
23], because of the need for census counts with a finer resolution that are not currently available. Indeed, our methodology is tested and validated all over Italy using official census data, showing a good agreement.
To test the methodology, we propose a reconstruction of the spatial distribution of the population exposed to riverine flood in Italy based on a probabilistic relationship between the intensity of the nightlights provided by the DMSP database and the density of urbanization estimated from the GUF database. The probabilistic relation is obtained by fitting a calibration curve on the GUF and DMSP data in three different regions, for the reference year 2011. The obtained curve is then reliably used to redistribute at finer scales the regional population provided by ISTAT, outside the calibration regions, for all of Italy. As a final step, people exposed to riverine flood are evaluated crossing the obtained distributed population with riverine flood hazard zones provided by ISPRA. The validation of the results is made on the reference exposed population derived from the independent database provided by ISTAT, making a comparison at the municipal scale. It shows a good agreement.
The paper is organized as follows—in
Section 2 the methodology and the databases used for the analysis are described.
Section 3 reports the results obtained applying the proposed methodology for the assessment of the number of people exposed to riverine flood hazard in Italy, together with a validation of the obtained output at the municipal scale.
Section 4 and
Section 5 report the discussion of the results and the related conclusions, respectively.
2. Materials and Methods
The proposed methodology allows producing updated maps of built-up areas and population within a given area of interest (e.g., a country, a region, a district) using readily available satellite-based information on small portions of that area (calibration regions). The maps are produced at the same resolution as the available satellite-based information. These maps, if combined with hazard maps, can be used to perform aggregated risk and direct damage estimations. In order to apply the methodology nightlights intensity data, urbanization maps, and a population estimation at least aggregated for the whole area of interest are required.
More specifically, the present approach starts from the identification of a relationship between the intensity of nightlights derived from satellite sensors and urbanization density derived from globally available urbanization maps, starting from the assumption that the latter can be considered as a proxy to quantify exposure in hazard-prone areas. This relation, named as urban density calibration curve, can be assessed for one or more calibration regions inside the country or region under study and derived at a specific time when both nightlights intensity and urbanization maps are available. Each time a new nightlight intensity map is available, the resulting calibration curve/s (derived inside the calibration region/s) can be applied to derive an updated urban density map for the whole area of interest. On this map, it is then possible to redistribute the most updated population estimation-at least an aggregated value for the whole area of interest-in order to evaluate the exposed population.
It is worth underlining that the calibration curve can be properly applied only on new nightlight intensity data that have been obtained with the same sensor and the same processing algorithm used to acquire the ones used for the calibration. Indeed, a different response of the sensor or the use of a different algorithm may introduce a change in nightlight intensity which can be misled with a change due to an increase in urbanization and/or population densities. To overcome these limitations, it is possible to use harmonized nightlight intensity series, such as the ones developed by Li et al. [
35].
The proposed methodology finds a correlation between urbanization and nightlights to obtain an updated urban density map (used as a basis to redistribute population and to obtain a population density map), rather than finding directly a relationship between nightlights and available population density datasets (see, e.g., WorlPop [
36]) or official census data. This choice has been undertaken for three main reasons: (i) this allows us to obtain, as an intermediate product, also an updated urbanization density map that can be used alone as a layer to perform built-up area exposure, if needed; (ii) population density datasets such as WorlPop are obtained combining several input data among which there are also satellite-based nightlights intensity data [
37], making these datasets not independent from nightlight data and therefore not suitable to be used together to find a correlation function; (iii) census data are a spatially aggregated information, therefore they require to build the regression function between the population and the nightlight intensity values at a scale that is necessarily coarser than the pixel scale (e.g., at county-level scales, as performed by Yu et al. [
27]).
2.1. Algorithm
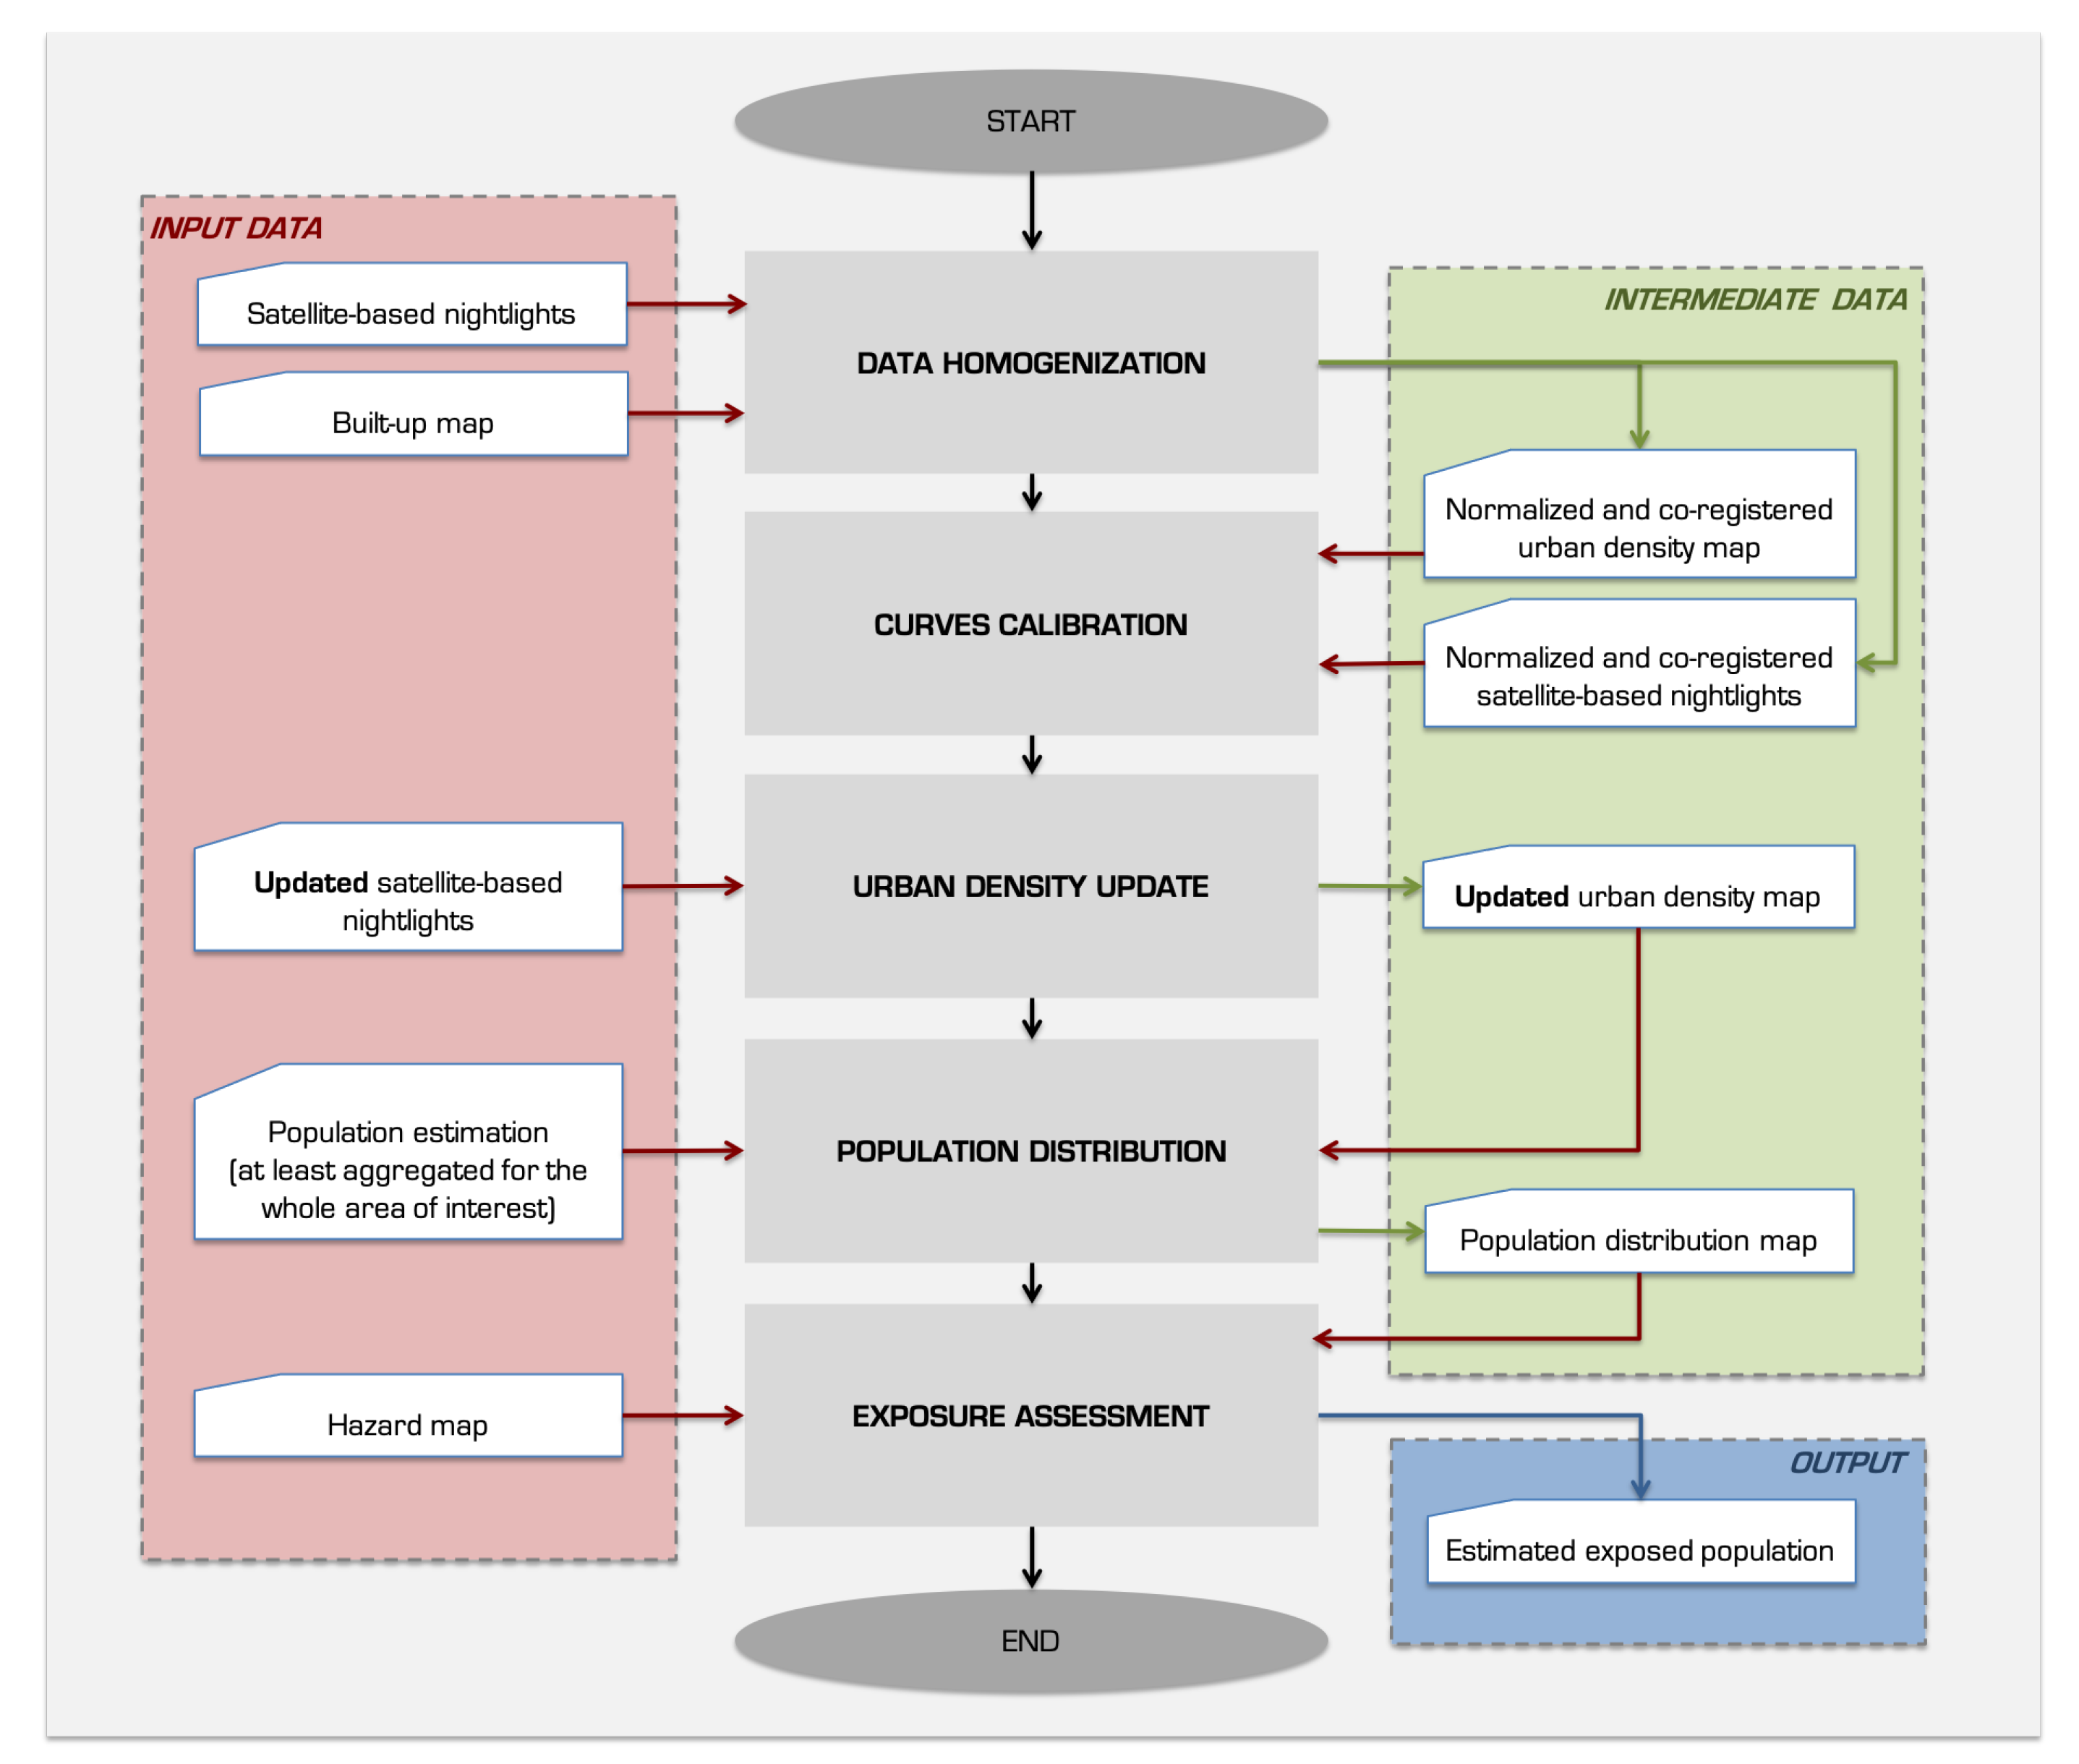
The steps to be performed to obtain an updated population distribution map are reported hereafter:
Data homogenization: Nightlights intensity and built-up area data are co-registered and normalized between 0 and 1. The resolution of the reference grid for co-registration is the same as the nightlights intensity layer, which is usually the dataset provided at the lower resolution. The choice to co-register the built-up data and the nightlights allows to better calibrate the relationship between them generating a single urban density value for each cell of the nightlights intensity map. In fact, by co-registering, the built-up values are transformed into urban density values, measured as a percentage of the pixel of the new grid occupied by built-up areas.
Curves calibration: Urban density curves are calibrated in one or more regions of the case study area, evaluating at the pixel scale the relationship between normalized nightlights intensity and urban density data (obtained from the previous step) available for the same time period. The choice of the number of curves to calibrate strongly depends on the distribution of the levels of urban development inside the study area. If the study area has a homogeneous urban development a unique curve can be derived. The degree of the polynomial that better fits data and the significance of its terms need to be evaluated case by case since a unique relationship suitable for all regions of the world cannot be identified. The curve degree and the value of its parameters are identified according to optimality criteria based on the results of a least-square fitting, in terms of RMSE and .
Urban density update: If new nightlights intensity data are available, the corresponding map is normalized. The curve is then applied to this new nightlight intensity map to estimate updated urban density for the whole case study area. Therefore, the urban density for each pixel
i of the map is evaluated as:
where
is the urban density for pixel
i,
is the normalized light intensity for the same pixel and
f is the calibration curve which better fits the experimental data, maximizing the
measure.
Population distribution: Updated urban density is used to redistribute new available population data provided at least aggregated for the whole area of interest, applying the following expression:
where
i is the pixel in which population is redistributed;
j is the area for which population data are available (e.g., country, region, district);
is the redistributed population in the
i-th pixel belonging to the
j-th area;
is the total population in area
j;
is the updated urban density
for pixel
i belonging to area
j.
Exposure assessment: Distributed population is crossed with hazard maps and population exposed is estimated.
A graphical representation of the methodological steps above described is reported in
Figure 2.
2.2. Test and Validation
To test the performance of the methodology, an application for the assessment of the number of people exposed to riverine flood in Italy is performed. Input data used for this application are described in detail in
Section 2.3 and the obtained results are presented and discussed in detail in
Section 3 and
Section 4 respectively.
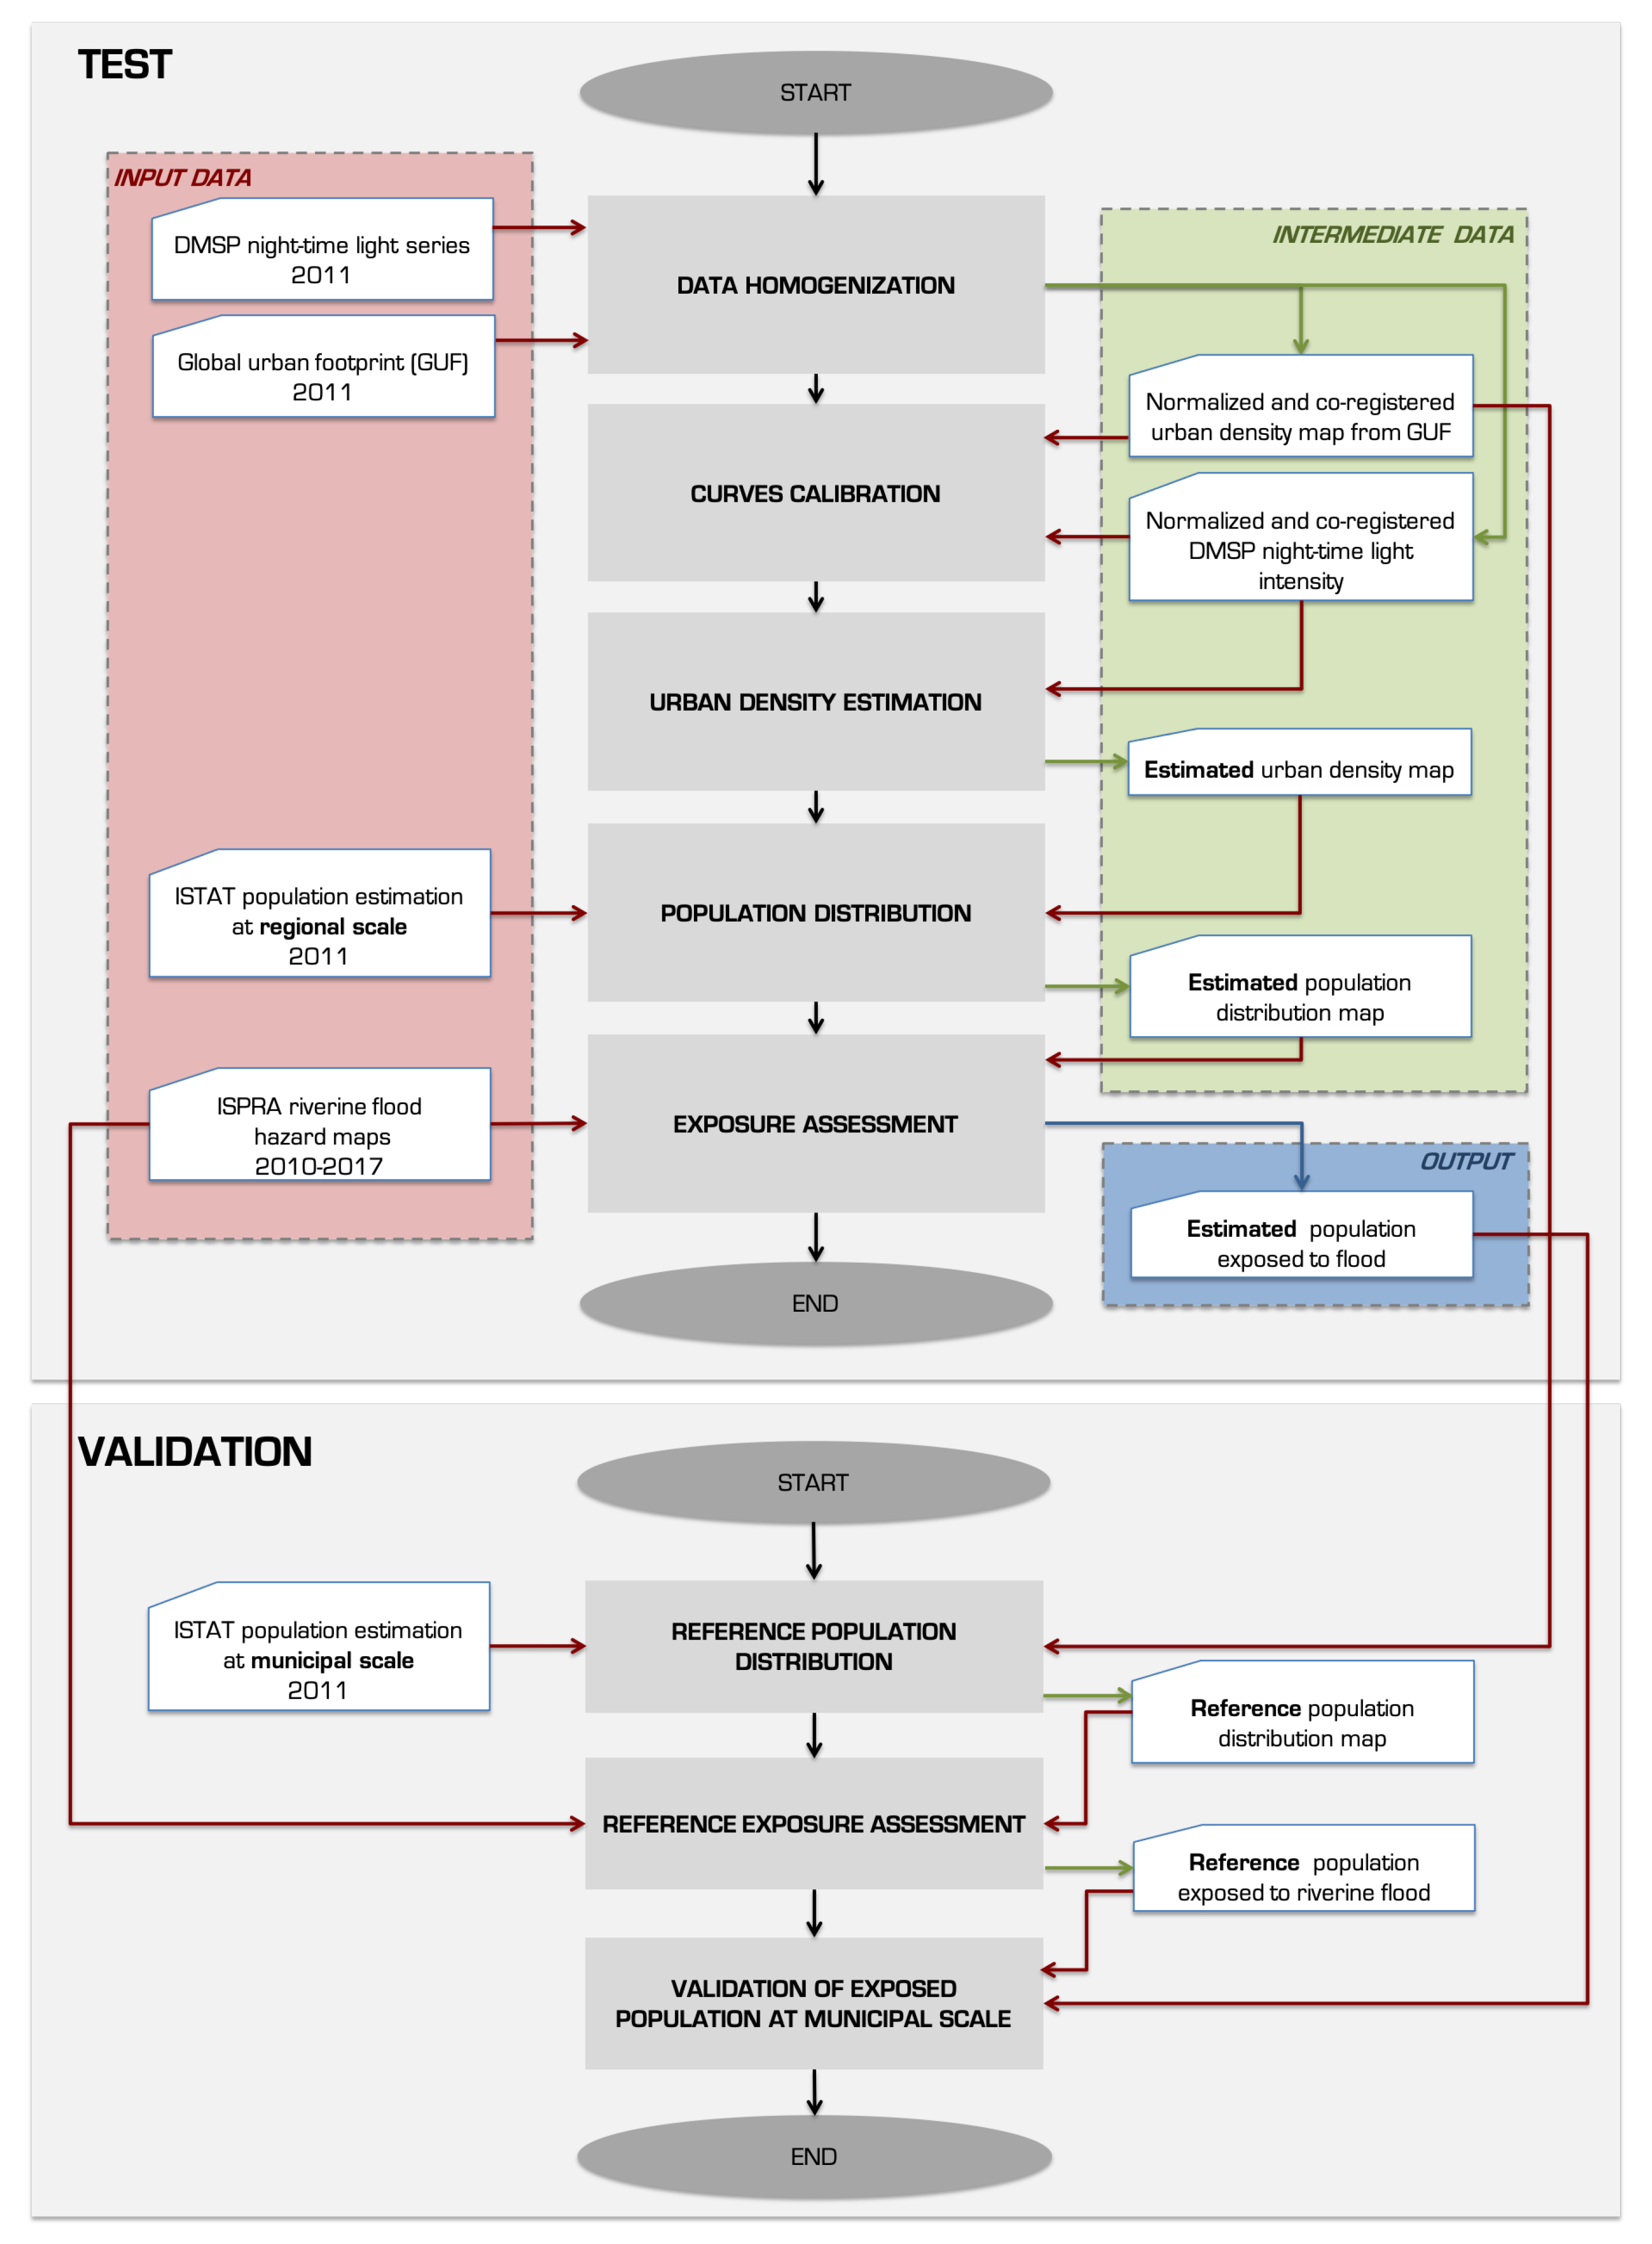
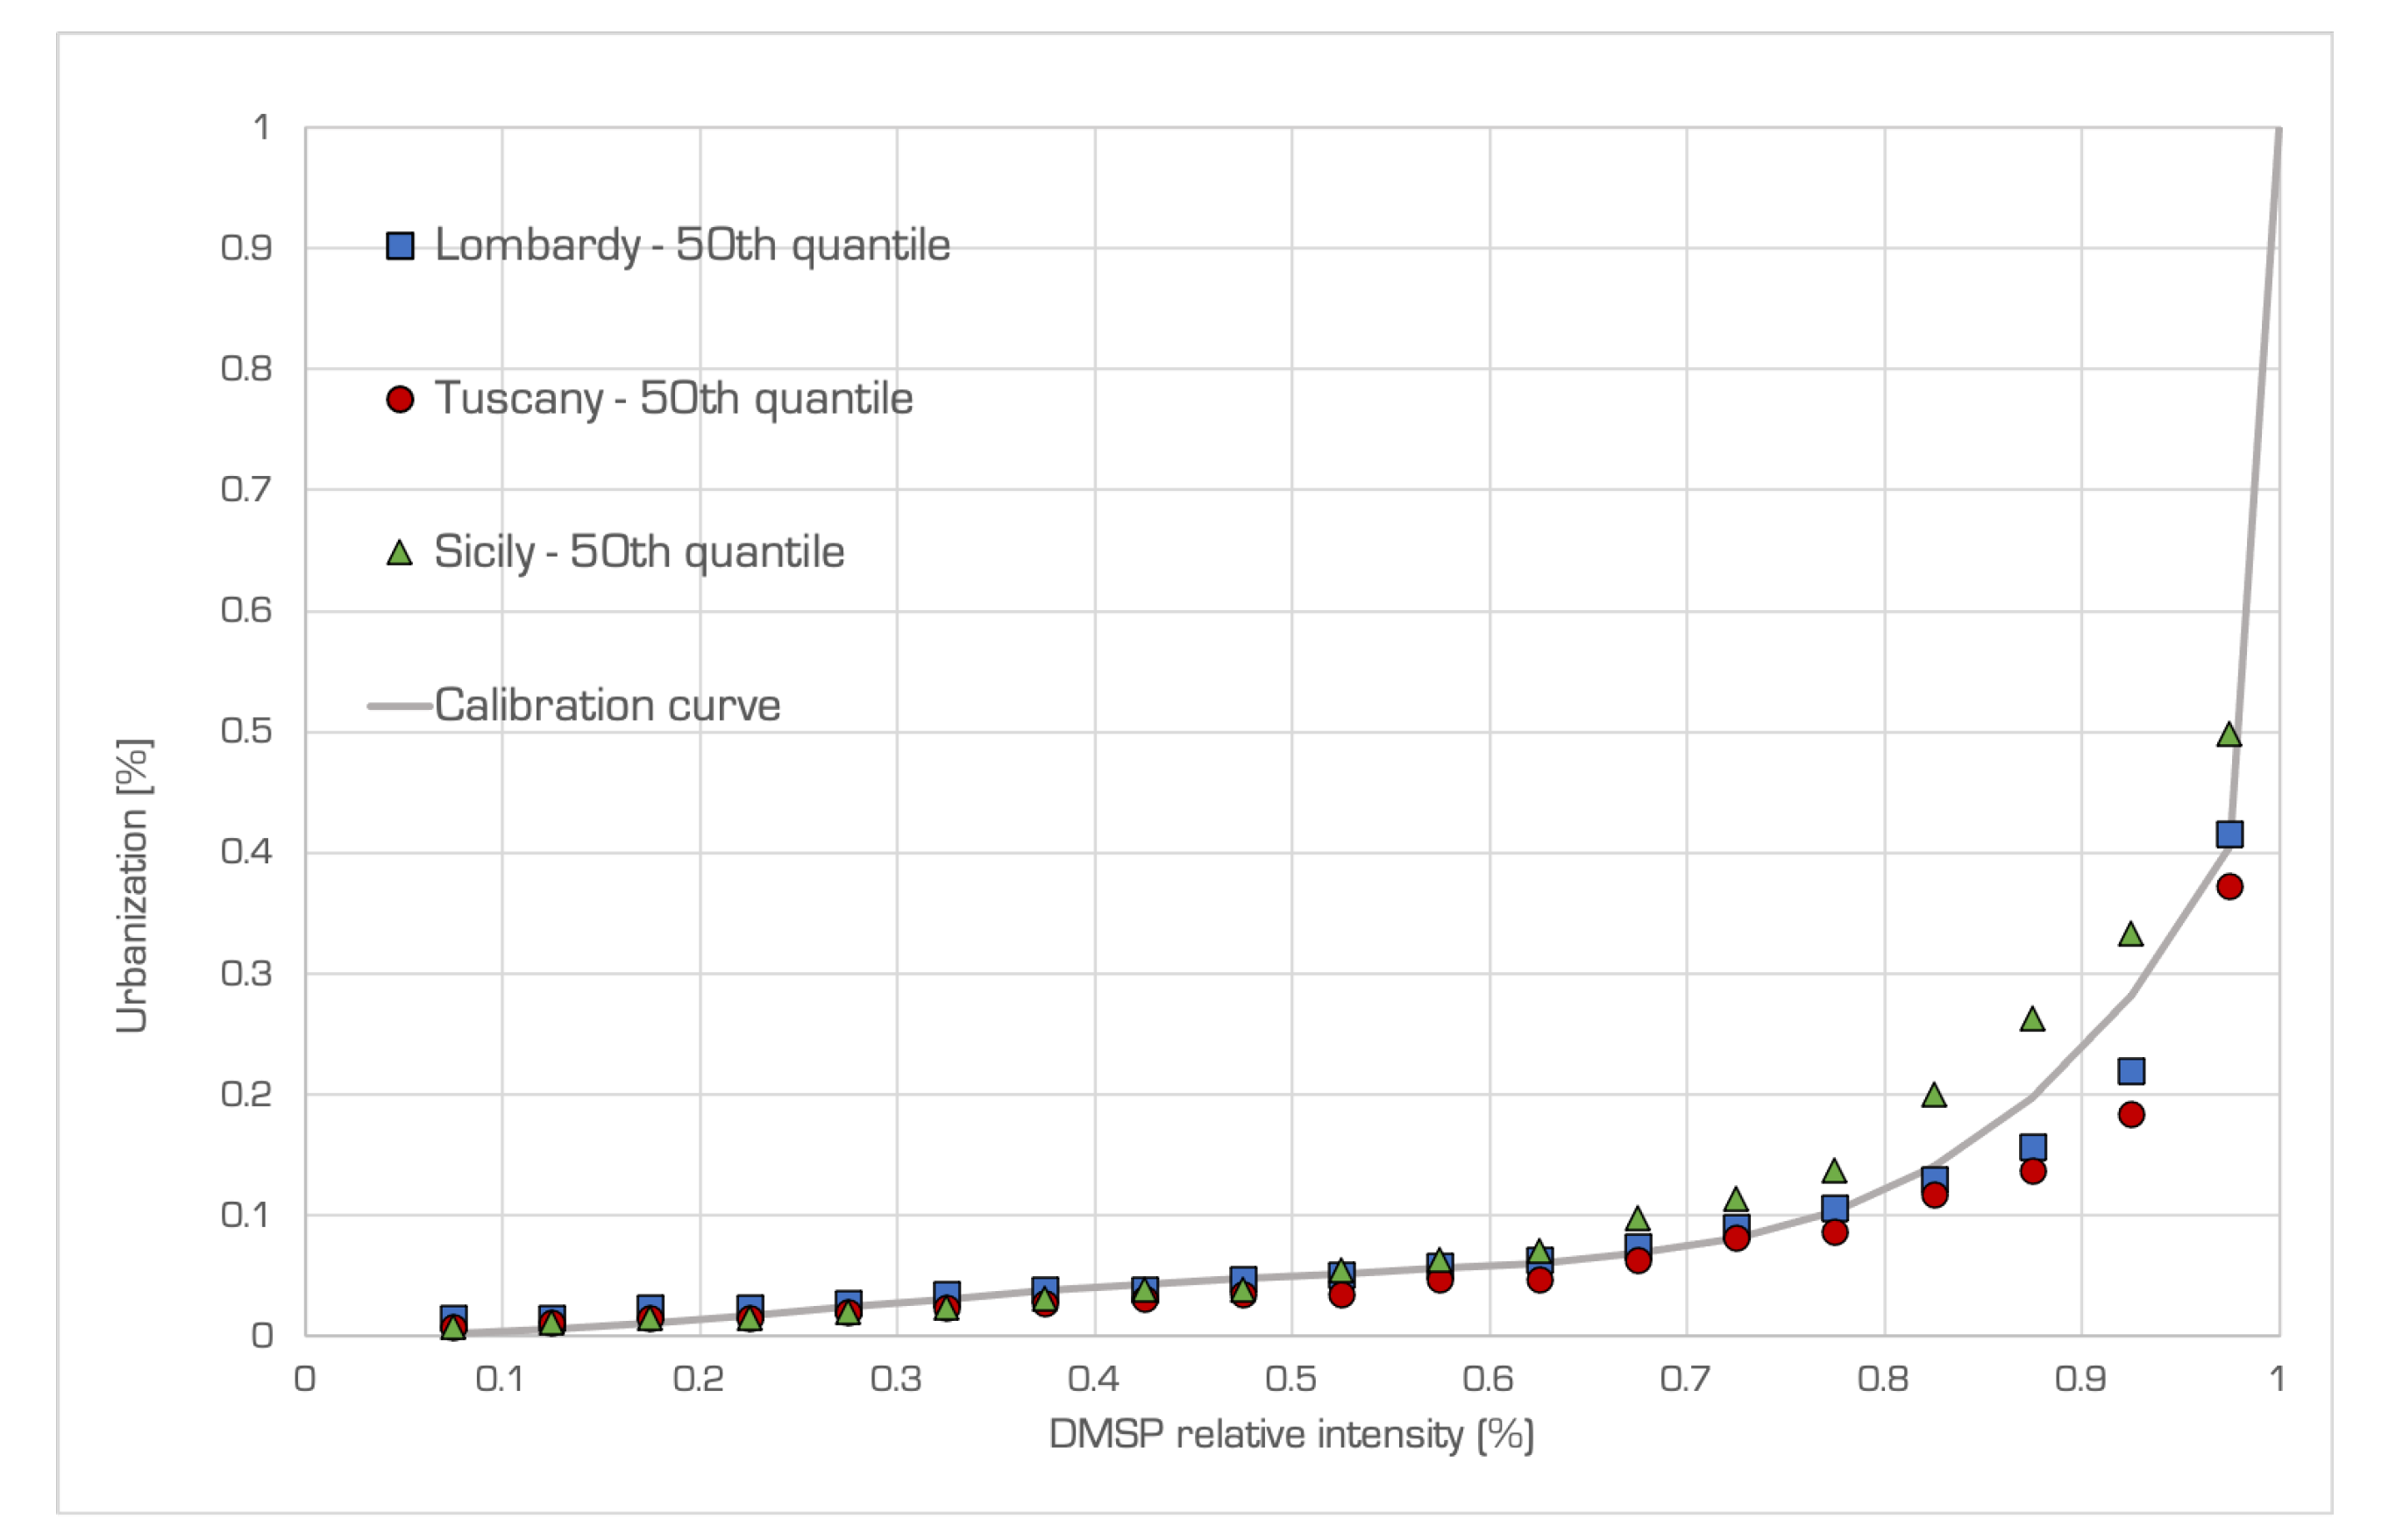
In this test, the probabilistic relation between nightlights and urbanization density is derived by fitting a calibration curve for the reference year 2011. With the purpose of testing the goodness of the obtained relationship, the calibration curve evaluated for three specific regions (Lombardy, Tuscany and Sicily) is applied on the same satellite-based nightlights map of 2011 producing an estimated urban density map at the national scale. This new urban density map is used to redistribute population data provided at the regional scale by ISTAT, applying (
2). The estimated distributed population is crossed with hazard maps provided by ISPRA and the estimated exposed population derived.
The choice of using the same reference year for calibration and testing, without realizing an update with more recent nightlight data, has been guided by the fact that most updated information on the population exposed to riverine flood at municipal scale for Italy (to be used as independent validation data) is available for the year 2011. Indeed, validation is performed comparing the evaluated exposed population obtained from testing with reference exposed population. The reference exposed population is obtained redistributing population provided by ISTAT at the municipal scale on the original urban density map derived from GUF and then crossing the obtained distribution with the hazard zones layer provided by ISPRA. The validation is performed at the municipal scale, which is the scale at which reference data are provided. For this reason, both reference and evaluated exposed population from testing are aggregated at the municipal scale to perform the comparison.
A graphical representation of the steps performed for testing and validation is reported in
Figure 3.
2.3. Input Data
To test the methodology for riverine flood exposure assessment in Italy, two remote sensing-based data-sets have been identified as input data for curves calibration: the DMSP night-time light series as nightlights intensity dataset, and the GUF as built-up area map. Furthermore, in order to estimate population exposed to natural hazards, regional population data provided by ISTAT from the 2011 census and riverine flood hazard zones provided by ISPRA are used. Both ISTAT and ISPRA datasets are provided as vector layers.
The layer used for validation is obtained using the same riverine flood hazard zones by ISPRA, the urban density directly obtained from the GUF dataset, and population data provided by ISTAT from the 2011 census aggregated at the municipal scale.
The list of all the data-sets used for test and validation are reported in
Table 1. Each of them is then described in detail in the following subsections.
2.3.1. DMSP-OLS Nighttime Lights Time Series
Information on nightlights intensity is derived from the Version 4 DMSP-OLS Nighttime Lights Time Series. The series, ranging from 1992 to 2013, is accessible for free through the NOAA-NGDC web site [
33]. Data are provided by 6 different satellite platforms for a total of 34 scenes. Nightlights data are expressed as yearly averaged digital number (DN) values ranging between 0 to 63, where 0 represents complete darkness and 63 bright areas. Data are provided in raster GeoTiff format with a spatial resolution of 30 arcsec (0.00833°, nearly 1 km at the equator). The spatial extension of nightlight images is between 75°N and 65°S and 180°W and 180°E. The database contains three different data types—Average Visible, Stable Lights, and Cloud Free Coverages. The stable-lights data type has been used for our analysis since, according to the processing made by the data provider, it does not contain any temporary change in lighting. This processing includes moonlit exclusion based on a calculation of lunar illuminance, masking of ephemeral events, and elimination of background noise (see Elvidge et al. [
19] for details). For this reason, they were considered as the most suitable information to describe the level of exposure. The DN derived was subsequently normalized between 0 and 1 (maintaining the quality of the original data) to ease the comparison with the urbanization percentage.
2.3.2. Global Urban Footprint
The Global Urban Footprint is a world-wide map of human settlements at very high resolution produced by analyzing a global coverage of TerraSAR-X and TanDEM-X images collected in the context of the TanDEM-X mission launched by DLR in 2007 [
9]. The global map has been produced starting from around 180.000 single TerraSAR-X/TanDEM-X image products for the reference year 2011, which have been processed by DLRs operational UFP, followed by an automated post-processing approach. The final product is a binary, thematic raster dataset in GeoTiff format, with reports value 255 for built-up areas and 0 for non-built-up areas, available at a geometric resolution of 0.4 arc seconds (12 m, near the equator) [
8,
38].
2.3.3. Italian Riverine flood HAZARD Zones
Riverine flood hazard maps have been collected by ISPRA, in accordance with the European Floods Directive (2007/60/EC) which requires each Member State to map Flood Hazard and Flood Risk for significant flood risk areas. The riverine flood hazard maps produced by ISPRA report the delimitation of the geographic areas that could be affected by floods for three probability scenarios: low probability (P1), medium probability (P2), and high probability (P3). The identification and delimitation of flood-prone areas for different hydraulic hazard scenarios have been carried out by applying two different approaches—(i) a hydro-geomorphological and historical-inventory based methodology that combines LiDAR data, aerial photos, satellite images, geological maps, and historical records of areas affected by past flood events; (ii) a hydrological-hydraulic analysis, in which flood-prone areas are identified determining the hydrographs for different return periods and applying a numerical hydraulic model [
39]. Riverine flood hazard maps for the entire Italian territory are provided as a vector layer. These national maps are obtained as a mosaic of the maps produced at the basin scale by the different river basin district authorities on the national territory. The release used in this paper refers to the update of the national mosaic of December 2017 (v. 4.0). This release is obtained combining data which refers to a broad time frame (from 2010 to 2017), according to the last update performed by each single river basin district authority. Updates are usually performed as a result of new studies and surveys, new hydro-geological events, the completion of structural risk mitigation interventions, or following the request of local authorities. Nevertheless, significant changes in riverine flood hazard maps are mainly associated to the realization of main structural risk mitigation interventions. Italy has not experienced significant risk mitigation interventions in the last 10 years. Therefore, the 2017 release of the national mosaic can be considered a stable picture at least from 2010.
2.3.4. Italian Census of Population
Population data used for testing and validation have been extracted from the data warehouse of the “15th Population and Housing Census” carried out by ISTAT [
40]. The warehouse contains a wealth of information, disaggregated to the sub municipal level or aggregated at the municipal, regional or national scale, on the demographic and social structure of the population usually resident in Italy and on Italy’s housing stock. The census reference date is 9 October 2011. The census information which has been used for this paper is the final demographic data on the population resident in Italy, used at the regional scale for testing and at the municipal scale for validation.
4. Discussion
The test and validation of the methodology allowed evaluating its goodness for future applications, in which it would be possible to use updated data about nightlights intensity and population estimation-at least an aggregated value for the whole area of interest-to quickly perform an update of the population exposed to hazards.
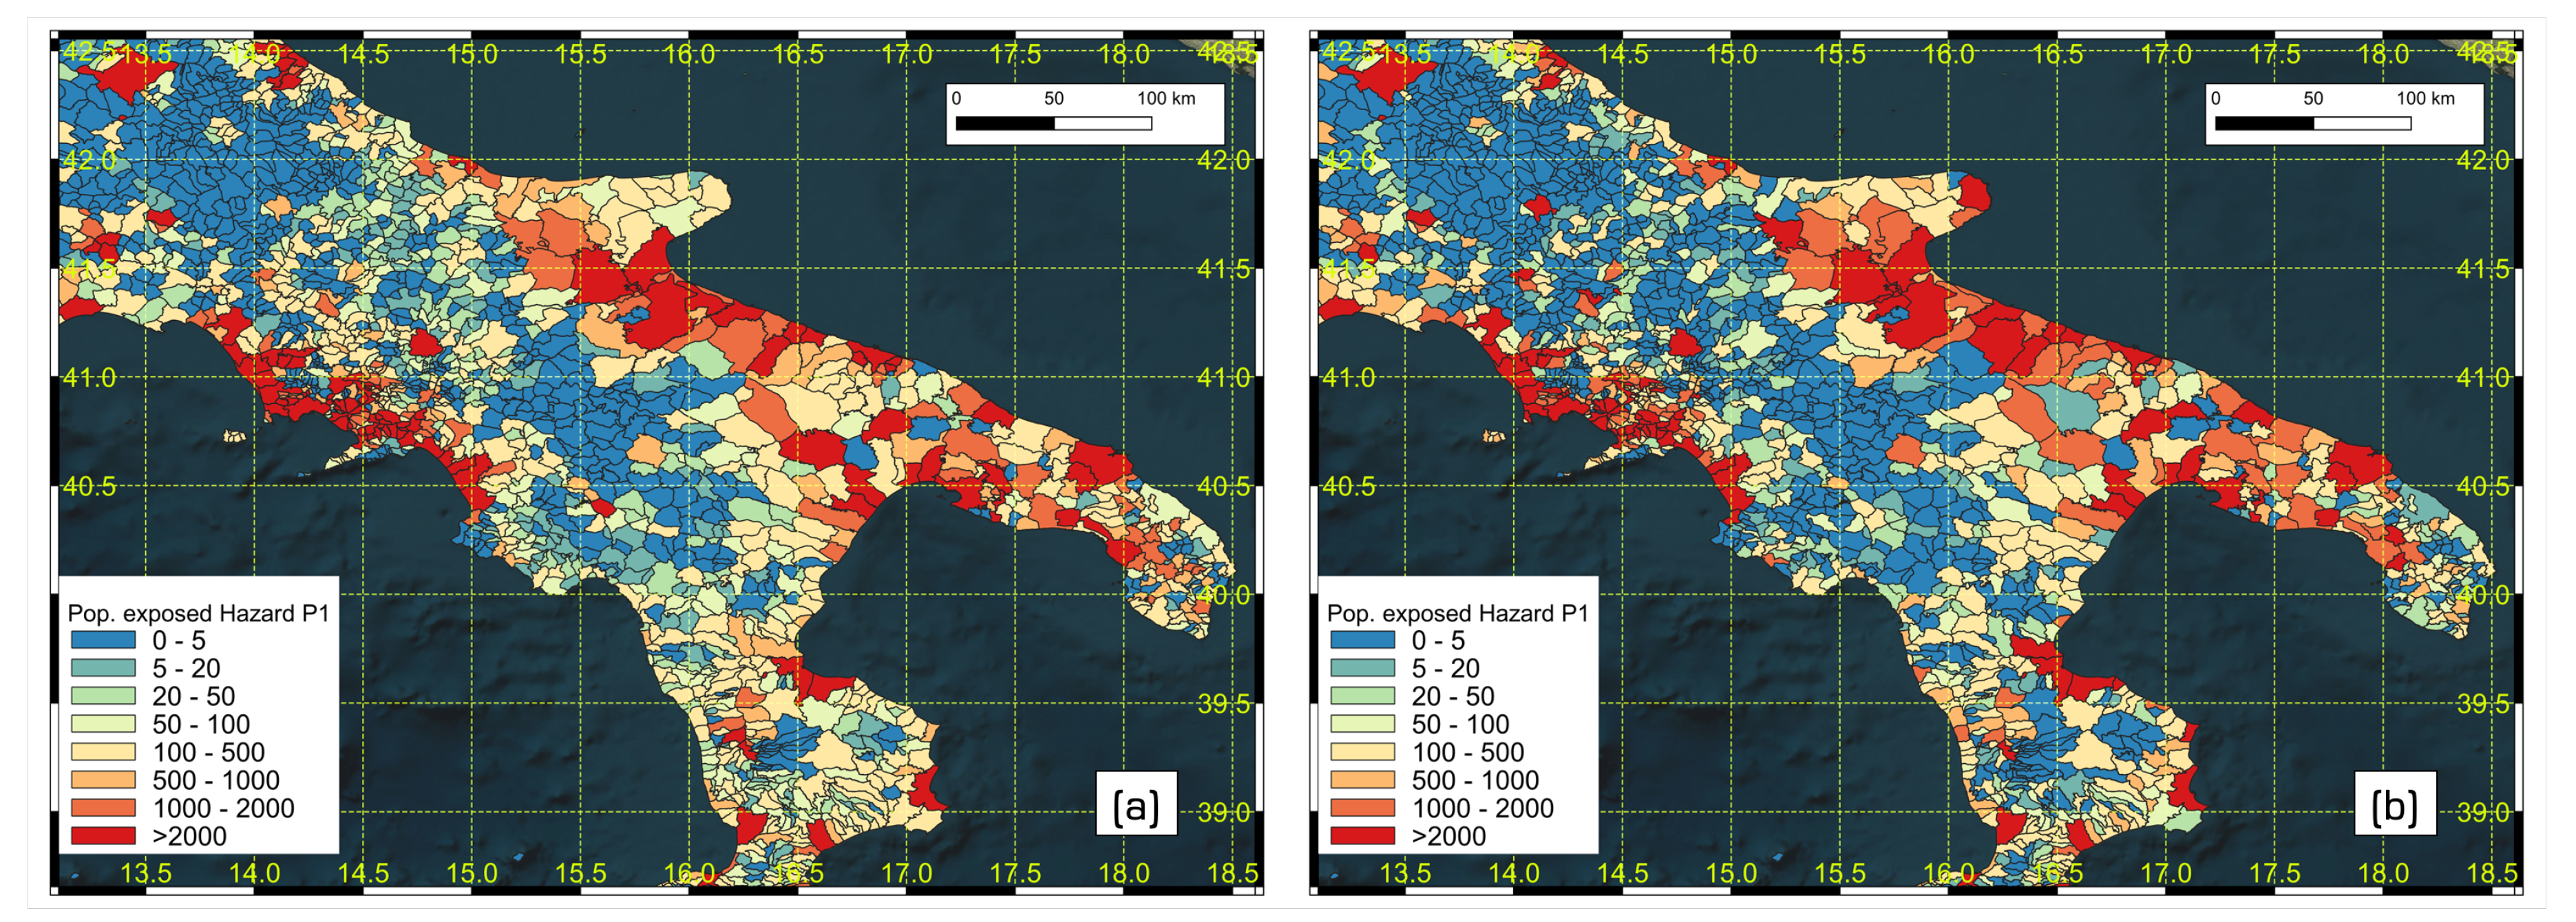
Indeed, the validation with independent data shows good agreement between estimated and reference population exposed to riverine flood hazard in Italy (
Figure 9), demonstrating a strong consistency in the statistical relationship expressed by (
3). Furthermore, the shape of the obtained correlation curve (
Figure 5) shows an agreement with similar studies presented in the literature, such as the correlation curve between population density and nightlights intensity presented by Bagan and Yamagata [
25] for Japan. In their study, the correlation becomes significant for values of DMSP nightlights intensity above 61–62 (97–98% of the maximum intensity). This result is absolutely coherent with the choice to force the calibration curve described by (
3) to draw through (1,1), in order to ensure the maximum urbanization density in correspondence to the maximum nightlights intensity.
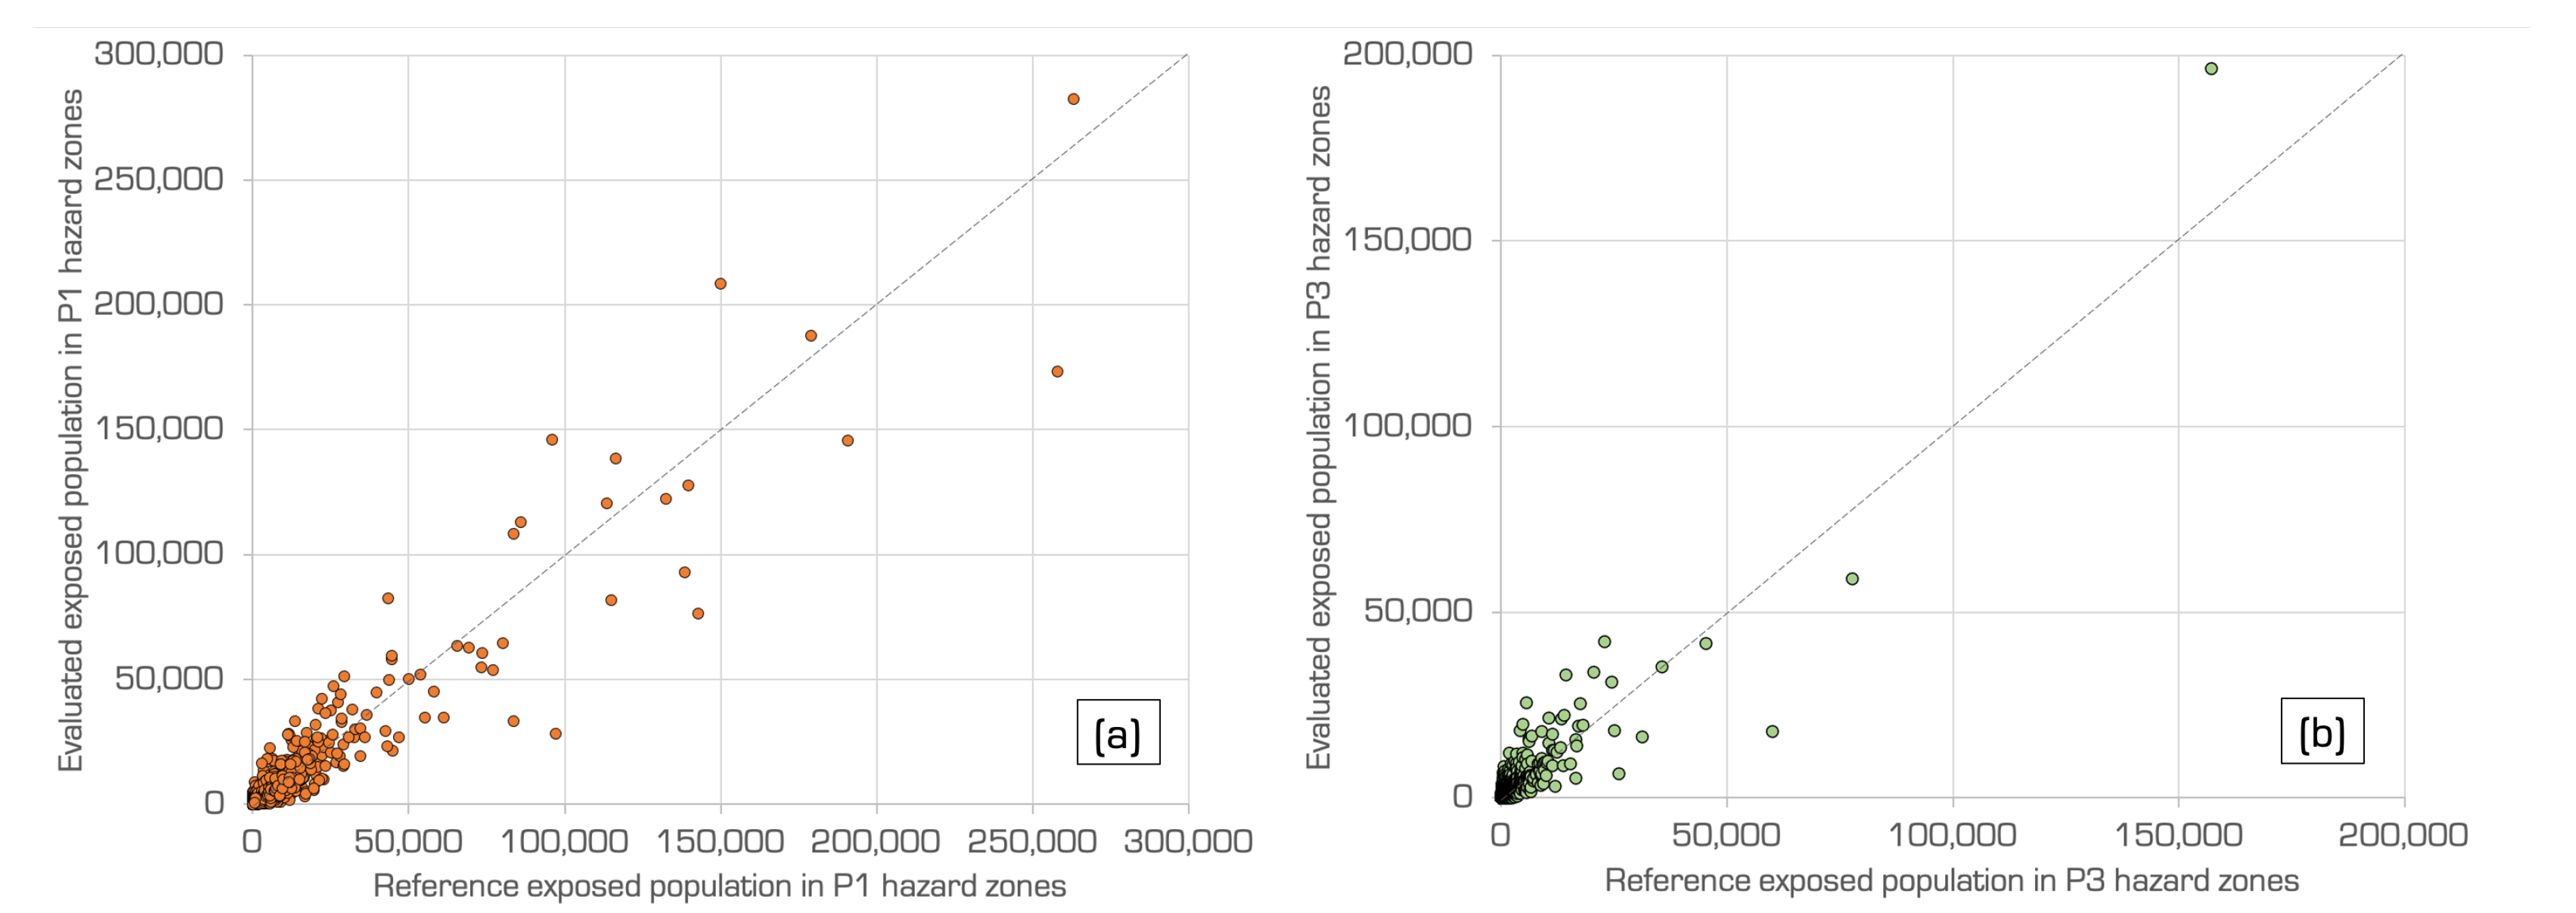
Scatter-plots reported in
Figure 10 prove a very strong correlation between estimated and reference exposed population at the municipal scale. Specifically, for exposure evaluated in P1 (low probability) hazard zones, correlation reaches a value of around 0.93, while for P3 (high probability) hazard zones the correlation coefficient is around 0.92. The discrepancy between results obtained with P1 and P3 hazard zones is not so considerable at the national scale (the difference between the two correlation values is very small) because of compensation. Nevertheless, at a finer scale, this discrepancy is significantly highlighted. In
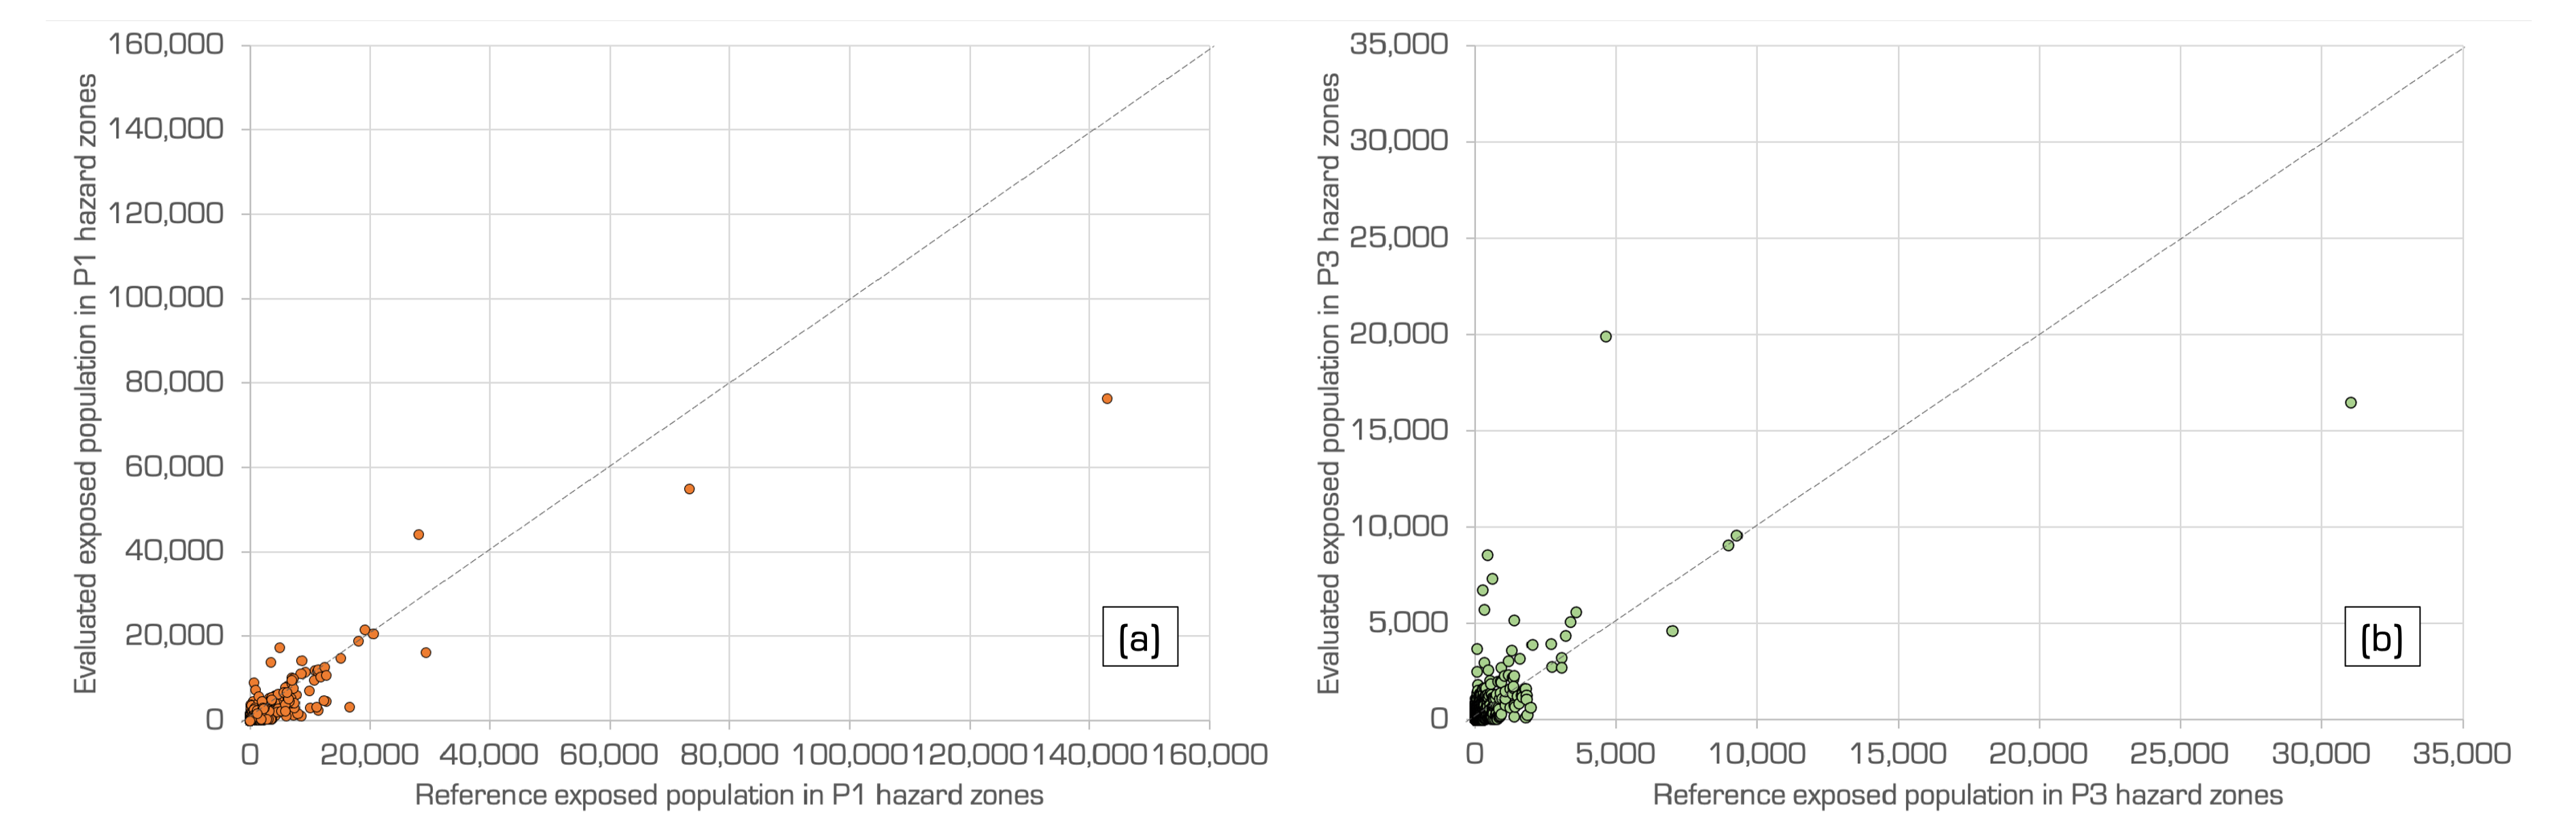
Figure 11, the correlation between estimated and actual exposed population per municipality for the Lombardy region is shown in two scatter-plots, which evaluate the correlation for P1 (low probability) and P3 (high probability) hazard zones, respectively.
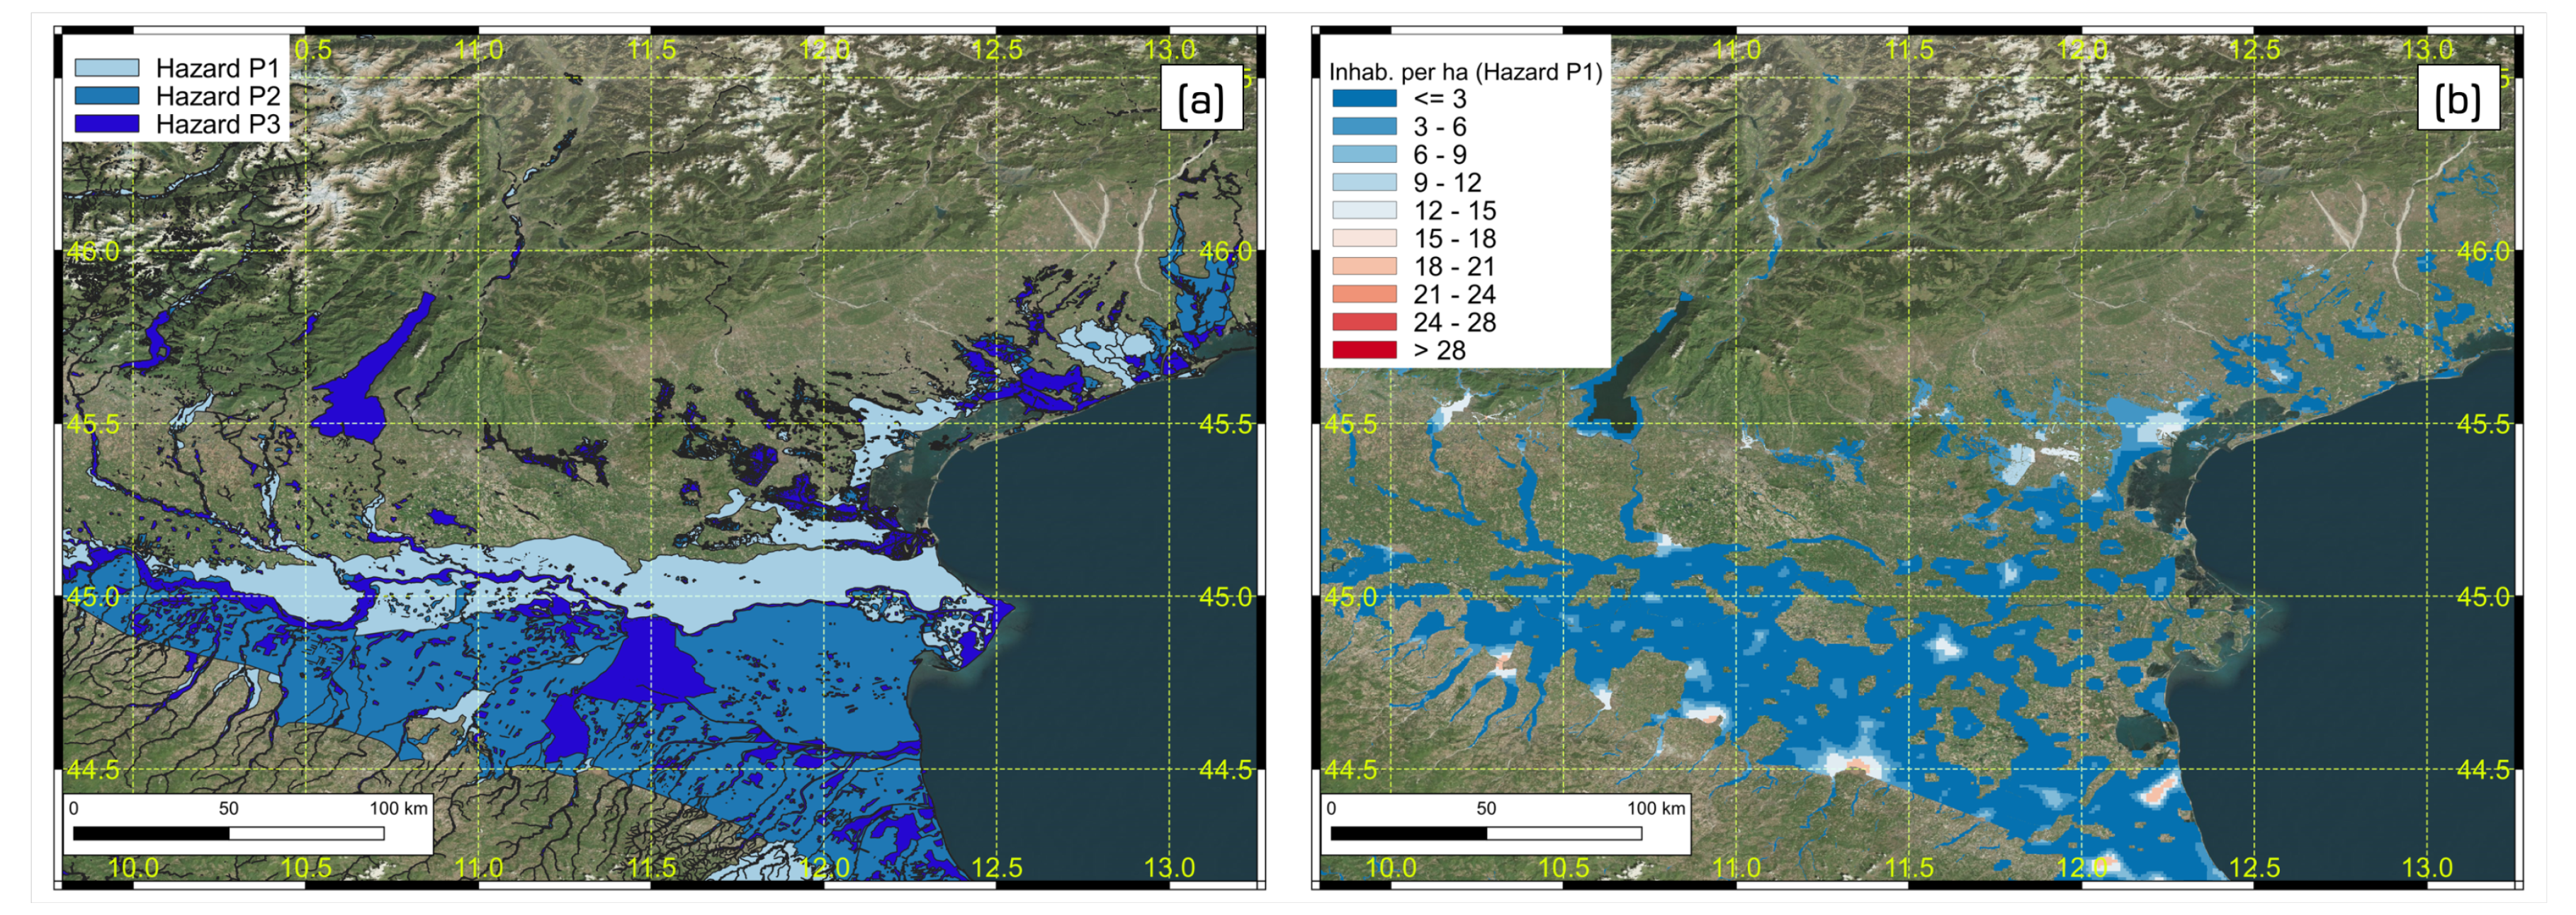
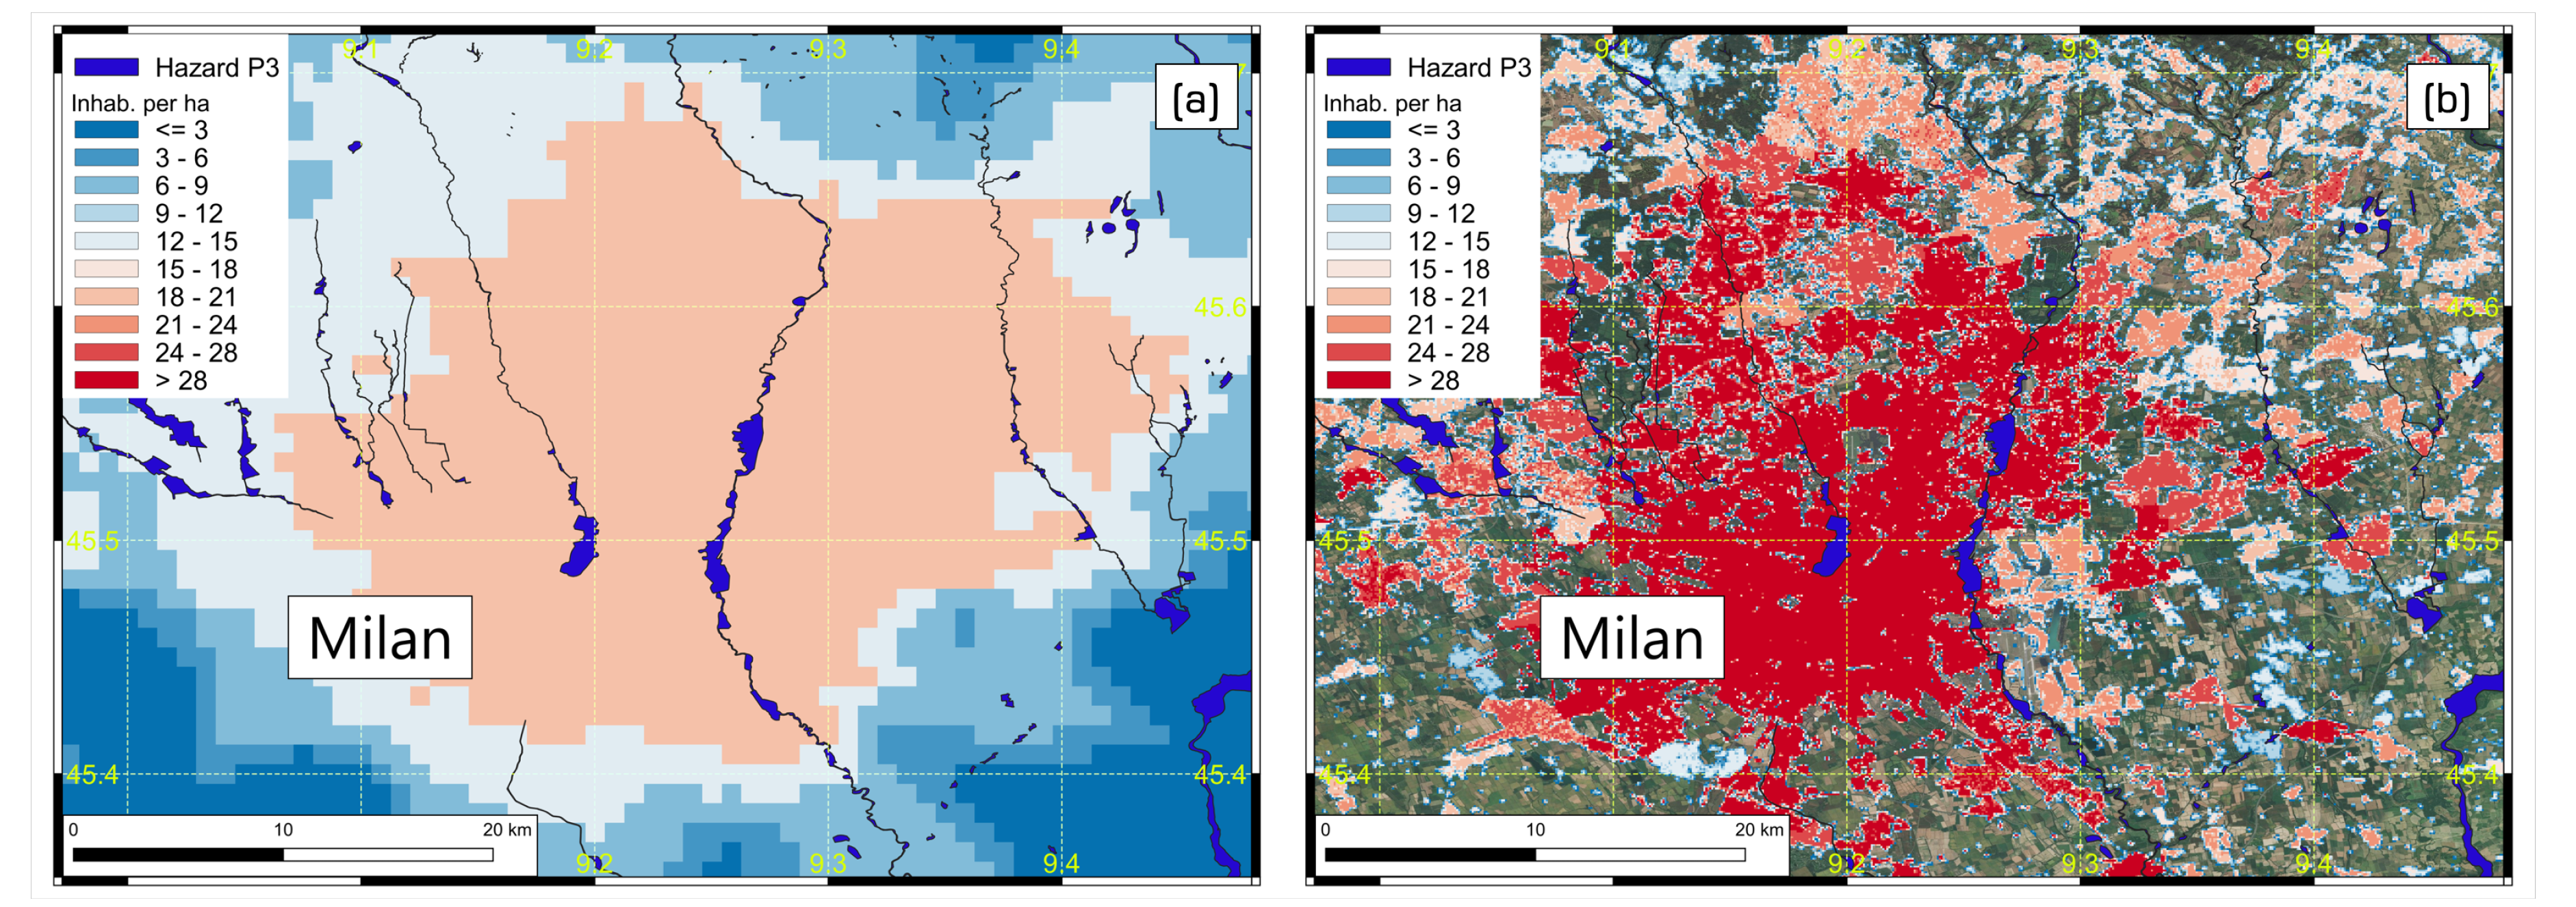
In this case, the correlation reaches a value of around 0.90 for P1 (low probability) and significantly decreases for P3 (high probability) hazard zones (around 0.70) due to the increasing inconsistencies between nightlights data resolution and the detail of the P3 hazard zones. Indeed, higher probability flooding scenarios are characterized by a smaller and more scattered extent such as P3 hazard zones, which are very thin buffers around small rivers. Therefore, the proposed methodology provides better results on large flood hazard areas, or, in general, large hazard areas, which are more consistent with the light intensity map resolution. These inconsistencies can be well observed in
Figure 12, where derived and reference population distributions for the city of Milan are overlapped by P3 hazard zones.
More specifically, it is possible to observe that the hazard zones are very narrow along the river network, having a cross-dimension significantly lower than the resolution of the derived population distribution, obtained from DMSP nightlight data. If hazard maps with a lower detail would be used, such as seismic hazard maps, this issue would be potentially avoided.
A possible estimate of the overall uncertainty of the method can be found from the dispersion of the points around the bisector X = Y in
Figure 10 and
Figure 11. Furthermore, it is interesting to note that some estimated values also differ significantly from real values. This suggests using the proposed method to estimate relative rather than absolute variations in exposure with respect to a reference estimate made when both real data and estimates are available.
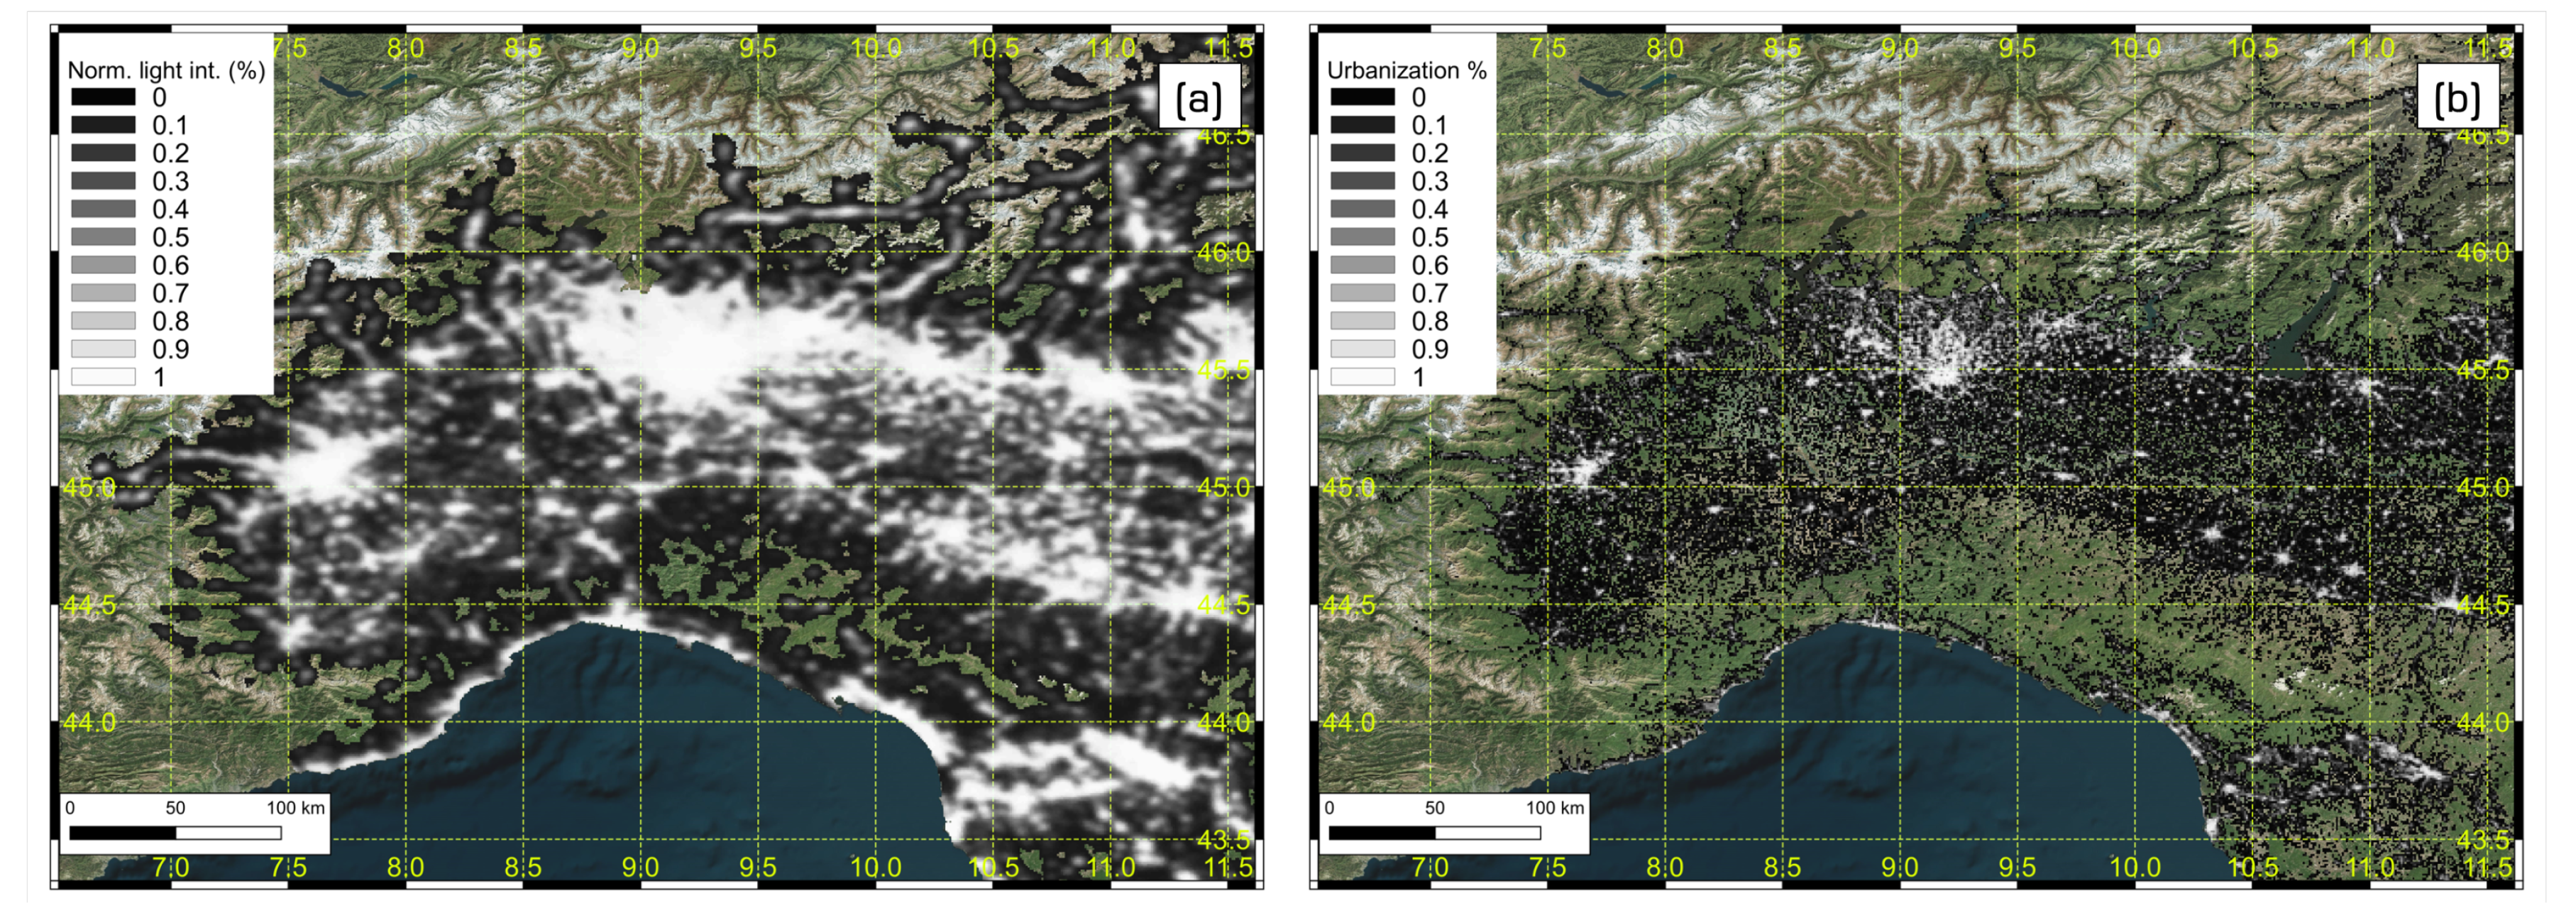
The goodness of the relationship described by (
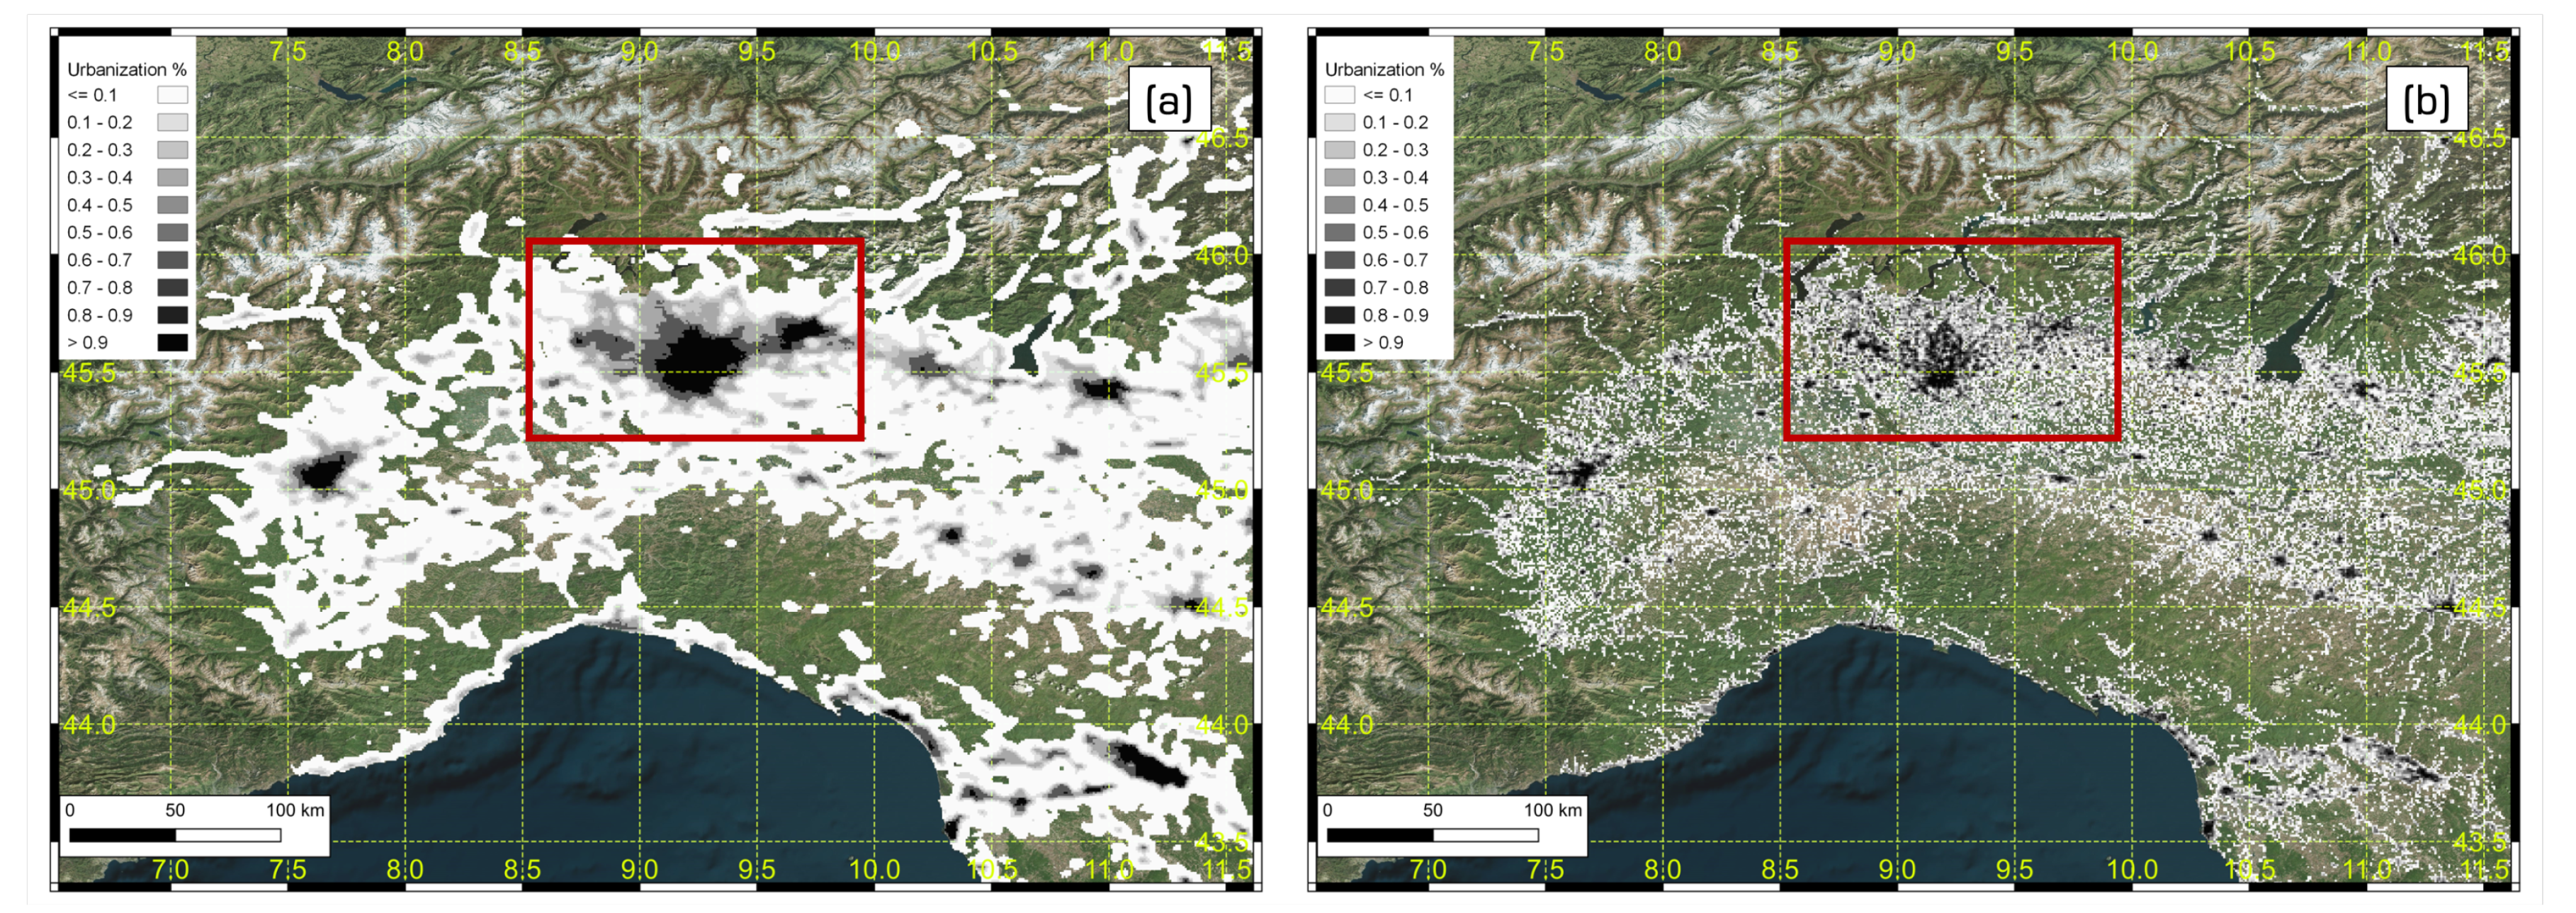
3) can be appreciated also comparing the estimated and the original urban density maps, both reported in
Figure 6. The comparison between the two maps shows very consistent patterns. Nevertheless, light diffusion is stronger in big urban areas, such as Milan (squared in red in
Figure 6). Indeed, the DMSP night-time light used as input to produce the estimated urban density map tends to overestimate the light intensity around big urban areas because of the glare phenomenon. If higher resolution satellite light intensity data will be available in the future, it may be possible to reduce the glare effect. Furthermore, products with better resolution than DMSP will also allow increasing the correlation between nightlight intensity and urban density, improving the overall performance of the proposed methodology.
5. Conclusions
The up-to-date assessment of both the built-up area and the number of people exposed to natural hazards represents a key component to perform a reliable risk assessment and to implement successful risk reduction strategies. The work presented in this paper has allowed identifying, testing, and validating a general and simple remote sensing-based procedure for the quick update of the population exposed to natural hazards that can be applied in any area of interest all over the world. The methodology is based on the identification of a relationship between nightlights intensity and urbanization density that can be assessed in some calibration regions and then applied to extrapolate the urbanization for the whole area of interest at different time steps when only nightlights are available.
The validation with independent data shows good agreement between estimated and reference population exposed to riverine flood hazard, making this approach suitable for future applications. Nevertheless, some factors can influence the reliability of the results, delimiting the field of application of this approach. A first factor is the impact of the resolution of nightlights intensity data on the estimation of population distribution around big urban areas because of the glare phenomenon. A second limitation is represented by the fact that the methodology provides better results on large hazard areas (e.g., flood hazard area P1), which extent is sufficiently larger than the low resolution of the light intensity map, making unnecessary a more detailed spatial distribution of the population. Future nightlights products with better resolution than DMSP data may overcome all these two limitations, increasing significantly the performance of the methodology.
Despite the current limitations, the present approach performs well for the estimation of exposed population aggregated at least at the municipal scale, producing updated exposure maps that can be used to evaluate aggregated risk and direct damage estimations. The possibility to easily and quickly update exposure maps with a higher refresh rate compared to available exposure cartography makes this approach particularly suitable for applications in developing countries, where urbanization and population densities may change at a sub-yearly time scale.


