Land Surface Subsidence Due to Mining-Induced Tremors in the Upper Silesian Coal Basin (Poland)—Case Study


Faculty of Mining Surveying and Environmental Engineering, AGH University of Science and Technology, 30-059 Cracow, Poland
*
Author to whom correspondence should be addressed.
Remote Sens. 2020, 12(23), 3923; https://doi.org/10.3390/rs12233923
Submission received: 30 October 2020
/
Revised: 26 November 2020
/
Accepted: 27 November 2020
/
Published: 30 November 2020
(This article belongs to the Special Issue Monitoring Land Subsidence Using Remote Sensing)
Abstract
:Seismic phenomena threaten land-based buildings, structures, and infrastructure and can transform land topography. There are two basic types of seismic phenomena, namely, tectonic and anthropogenic, which differ mainly in epicenter depth, surface impact range, and magnitude (energy). This article shows how a land surface was changed by a series of seven rock mass tremors of magnitude ML = 2.3–2.6 in March–May 2017. Their immediate cause was the “momentary” acceleration of void clamping, which was activated by local and short-term seismic phenomena caused by human activity. The induced seismic events resulted from the geological structure of the rock mass, which in the specific region of examination was classified as being highly prone to mining tremors. The authors focused on describing vertical surface displacements in the Upper Silesian Coal Basin in the south of Poland. The surface deformations were identified using DInSAR technology, which allows quasi-continuous monitoring of large areas of land surface. The present research used freely available data from the Copernicus Program and seismic data from the European Plate Observing System.
1. Introduction
The seismic phenomena that occur in nature are associated with geological structure, tectonic-plate movement, volcanism, and human activities. The main cause of earthquakes is sudden release of stress in the Earth’s crust with displacements of rock mass layers. Seismic phenomena of anthropogenic origin are a decline of equilibrium between the external and internal forces that affect rock mass elements and are caused by human activities [1,2]. Such seismic phenomena are caused directly by voids in the rock mass due to the extraction of mineral resources, and they are common in the deep mining of gold [3], copper-ore mining [4], hard coal mining [5], natural gas extraction [6], and open-pit lignite mining [7], for example. With favorable geological structure of the overburden, disturbing the force equilibrium in a three-axis stress configuration may cause abrupt cracking and movements of the rock mass toward the post-excavation caverns. High-energy mining tremors with energies of at least 105 J [8] pose a real threat and can be felt as far as several kilometers from the epicenter [9]. Numerous scientific studies indicate a significant relationship between strong mining tremors and damage to residential buildings and building facilities [3,10,11,12,13,14].
The development of interferometric synthetic aperture radar (InSAR) technology has led to new possibilities for evaluating the surface effects of rapid seismic phenomena [15,16]. InSAR has also been used widely to monitor land displacement processes related to landslides [17,18], mining-induced subsidence [19,20,21], subsidence induced by aquifer system drainage [22], upward movement of post-mining areas [23,24,25,26], and land subsidence due to groundwater extraction [27,28]. Satellite radar images allow assessment of the extent of the surface deformation area, as well as the vertical and horizontal displacements. Previous research conducted within the Upper Silesian Coal Basin (USCB) [29,30,31] and the Legnica-Głogów Copper District (LGCD) [32,33,34] in the south of Poland indicates a risk of tremor-induced troughs from strong mining tremors (ML ≥ 3). In such cases, the surface deformations have relatively high dynamics (3–4 days in the LGCD), the maximum subsidence can amount to several centimeters, and the troughs can extend as far as 2 km [32,33].
A difficulty to date in observing the surface effects of mining-induced tremors has been due to having to make point-based observations of the surface on either profiles (observation lines) or scattered points using GPS technology [35]. Another difficulty is the inability to predict the time and (in most cases) the exact location of the epicenter to facilitate detailed measurements before and after a seismic event. As such, traditional land surveying measurement methods have led to only isolated cases of identified land displacements due to mining tremors [9,36].
The present paper presents the effects of a series of seven rock mass tremors of magnitude ML = 2.3–2.6 on a land surface. These changes occurred between March and May of 2017.
2. Materials and Methods
2.1. Area of Interest
The area of interest is the mining area of a hard coal mine operating in the northeastern part of the USCB in the south of Poland (Figure 1). In the USCB (approximately 5800 km2 within the boundaries of Poland), hard coal has been extracted since the second half of the 17th century [37]. Currently, the hard coal output is approximately 50 million Mg per year (in 2018). In the study area, coal was extracted from two seams (Figure 1) in the years 2001–2017. The first one was extracted along 6 longwalls at the depth of about 560 m in 2001–2007. The second seam was extracted at the depth of about 640 m along 3 longwalls in 2008–2014. After two years, the last longwall of seam no. 2 was extracted in 2016–2017. The phenomenon of land surface deformation discussed in this article is related to the extracted of this longwall. The USCB is characterized by high seismic activity, with more than 1000 tremors per year of magnitude ML of at least 1.5 [38] and several thousand minor tremors reported. The USCB is a highly urbanized region of Poland, where several cities (including Katowice, Sosnowiec, Gliwice, and Zabrze) form the Upper Silesian Conurbation inhabited by more than 2 million people.
The changes in land surface morphology discussed herein occurred in a region that is prone to unfavorable dynamic phenomena covering high-energy tremors. They pose a real threat and can be felt by residents in the area, who report consequential damage to buildings and infrastructure [39]. This situation is impacted by both the rock mass geological structure (including fault zones; Figure 2) and post-excavation effects (coal deposits extracted from above seams cumulating the stresses from previous hard coal exploitations; Figure 1) and exploitations depth [39]. The main lithological reason is the presence of thick and stiff sandstone beds in deposit roofs [40,41] presented in Figure 2. In the carbon formations (between the hard coal seams), the thickness of the rigid sandstone layers reaches approximately 35 m [39]. In the immediate roof (above the hard coal deposits), the height of these layers (i.e., fine- and medium-grain sandstone) reaches more than 85 m locally. Tremor-generating qualities are also shown by high-strength sand slates in this area [40]. The simplified geological cross-section is shown in Figure 2, and its location in Figure 1.
2.2. SAR Data Acquisition and Processing
The present land surface deformations were described and analyzed based on freely available data that came from the Sentinel-1 satellite mission of the Copernicus Program financed by the European Space Agency and the European Commission. An exemplary phase interferometric band showing land surface deformations related to mining operations in the USCB region over a 6-day period is shown in Figure A1. The seismic data (i.e., date, time, location, and local magnitude ML) were taken from the IS-EPOS platform [42], which is part of the European Plate Observation System (EPOS) project. The boundaries of the mining area were taken from the Central Geological Database of the Polish Geological Institute. Appendix A shows interferometric phase band of study area in the period from 30 March 2017 to 05 April 2017.
Between 17 and 27 March 2017 in the area of interest, there were seven reported tremors of the rock mass of magnitude ML = 2.3–2.6. Table 1 gives the detailed data concerning the analyzed seismic events. The first two tremors (ML = 2.3 and 2.5) were recorded within 24 h of each other on 17 and 18 March 2017, respectively, at around 17:00 UTC. On the 22–25 March, there were four tremors (ML = 2.5 or 2.6). The last one in the discussed series was reported before 21:00 UTC on 27 March 2017 (ML = 2.6). The horizontal distance between any two epicenters did not exceed 75 m (Figure 3).
The surface impact of the seismic events was evaluated using differential InSAR (DInSAR) technology. For this purpose, 15 radargrams from the Copernicus Open Access Hub covering the period between 6 March and 29 May 2017 were taken. The mission satellites Sentinel-1 A and B (each with a revisit time of 12 days) enabled the acquisition of radargrams with a 6-days interval (pass Ascending, relative orbit 102). SLC data acquired in Interferometric Wide swath mode and a ground resolution of 5 m × 20 m (range × azimuth) were used. Table 2 shows the radar images used for the investigation.
SNAP (SeNtinel’s Application Platform) and SNAPHU (Statistical-Cost, Network-Flow Algorithm for Phase Unwrapping) software dedicated for processing the satellite images, were used to processing radargrams. In the first step, co-registration of radargrams was performed. It consisted in spatial matching of the corresponding pixels of two processed master and slave radargrams acquired in 6-day intervals. This process took into account the data on the precise orbits of satellites and the DEM obtained from the 1” Shuttle Radar Topography Mission. In the next step, the phase difference for individual pixels was calculated, creating an interferogram. At the same time, a coherence value was calculated for each pair of pixels. During the generation of interferograms, the part of the phase resulting from the curvature of the earth was removed. It was possible thanks to the precise calculated coordinates of the satellites and the used DEM. Additionally, based on the DEM, the component responsible for the terrain topography was removed from the determined value of the phase difference. In order to reduce the noise of the radar signal, the interferogram was filtered by the Goldstein method. As a result, a differential interferogram was obtained, in which the phase difference of individual pixels indicated changes in the height of the land surface over a period of 6 days. Information on the value of the phase difference, ranging from 0 to 2π, was developed with the use of SNAPHU software (the so-called phase unwrapping). The developed wavelength was calculated to vertical displacement s by Equation (1).
In the last step, the obtained image of the altitude changes of the terrain surface was geo-referenced (EPSG: 2177).
2.3. Determination of Subsidence Trough
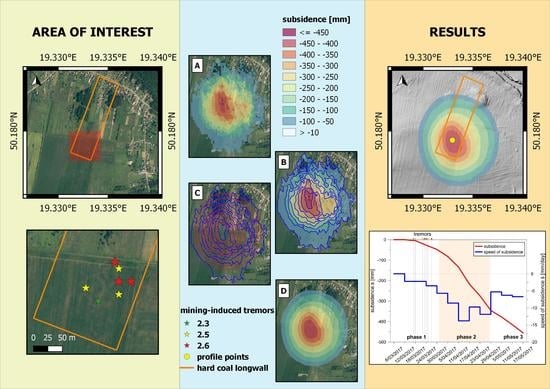
Figure 4 shows the stages of data processing in the Geographic Information System (GIS) environment. The final subsidence trough was digitized as a sum up all 6-days subsidence once.
Step A presents 6-days subsidence based on radargrams. In step B, the raster file with subsidence (Figure 4A) was automatically converted into a vector image of subsidence isolines (Figure 4B). However, the isolines so generated do not represent fully the actual spatial image of the effects of the analyzed deformation, the reason being the residual signal noise (e.g., low coherence, plant vegetation, ground moisture, weather conditions), which could not be eliminated fully in the radargram processing. During the three-dimensional (3D) modeling of the surface deformation, attempts were made to eliminate the occurring irregularities of the isoline distribution of surface subsidence (Figure 4B; blue lines) and the subsidence profile (Figure 5) caused by the radar signal noise. This modeling was in two steps: first, by interpolating the subsidence profile using eighth-degree orthogonal polynomials (red line, Figure 5). At the intersection of the P-P’ profile and the approximated subsidence, marked as green points (Figure 4C and Figure 5), corrections for individual subsidence isolines [39] were determined as the absolute value of the difference of subsidence Θ, as follows in Equation (2):
where SRASTER is subsidence based on raster data, SPOLY is subsidence based on orthogonal polynomials approximation.
Θ = | sRASTER – sPOLY |
In the second step manually entering the corrections to the surface distribution of isolines for each individual subsidence once by manual digitalization (Figure 4C; red lines). The presented procedure may be used for several field profiles. Interpolating the profiles allowed correct assignment of subsidence values for the corrected isolines. This provided a spatial image of the deformations (3D model) close to the actual conditions (Figure 4D).
To obtain an adjustment of an orthogonal polynomial, the mean-square criterion for minimizing the distances between the approximating function and the discrete data set was used. The main problem in such cases is determining the optimum degree of the approximation orthogonal polynomial. Hejmanowski and Kwinta [43] proposed using the following criterion from Equation (3):
where j is the optimum degree of the approximating orthogonal polynomial, and ms(j) is the mean error in approximating subsidence s with the orthogonal polynomial of degree j; Ms is a coefficient that describes the stochastic variability of the subsidence Equation (4).
Polish measurements suggest that Ms is between ±0.01 and ±0.04; here, Ms = 0.01 is assumed.
where σs is a standard deviation of observed subsidence average course, and ŝmax is maximum subsidence of observed subsidence average course.
The analysis of fitting the subsidence profiles using the proposed criterion indicated that (I) the loss function decreases as the polynomial degree is increased; (II) after a certain degree of the orthogonal polynomial, the approximation error stabilizes and consequently the graphs of approximating functions have a similar course; and (III) in the case of surface subsidence, the optimum orthogonal polynomial degree for different sets of input data (vertical displacements observed in different locations) may not be the same. Based on the performed analyses [43,44], it can be assumed that the optimum orthogonal polynomial degree p for surface subsidence is between 6 and 8. Herein, p = 8 was assumed because of the iterative nature of the process of reaching the final model of vertical displacements (Figures 9 and 10).
3. Results
Based on the available radar data and their processing according to the presented methodology, a series of 6-days vertical displacements was obtained for 6 March to 29 May 2017. In the case of the last two interferograms for 17 May to 23 May 2017 and 23 May to 29 May 2017, insufficient coherence (due mainly to the intense plant vegetation) made it impossible to determine the vertical displacements to a sufficiently high reliability. Connected to this fact, some data were lost for the end of the planned study period, this being due directly to the limitations of the DInSAR method. Figure 6 shows the obtained 6-days land surface deformations between 6 March and 17 May 2017.
In the subsequent stage of data processing, the vertical displacements between 6 March and 17 May 2017 were summed up. Six-days subsidence isolines were also generated (starting on 12 March 2017) to obtain the incremental values. Consequently, this allowed field profiles to be developed, particularly ones crossing the point at which maximum surface subsidence occurred (Figure 7, yellow point). On this basis, it was possible to present the development of surface deformation over time. Figure 8 presents an example of the field profile (in the SW-NE direction).
Based on the summed-up raster data (Figure 9A) and abovementioned methodology of data processing (Section 2.3) the total vertical displacements were generated (Figure 9B). Final subsidence trough with 50-mm isolines is shown in Figure 9D. According to the prepared methodology, an example of field profiles is presented in Figure 10. Combining the information from interpolation (two-dimensional) with the digitized surface distribution of subsidence enabled generating a spatial model (3D) of the surface deformation caused by the series of rock mass tremors (Figure 11).
4. Discussion
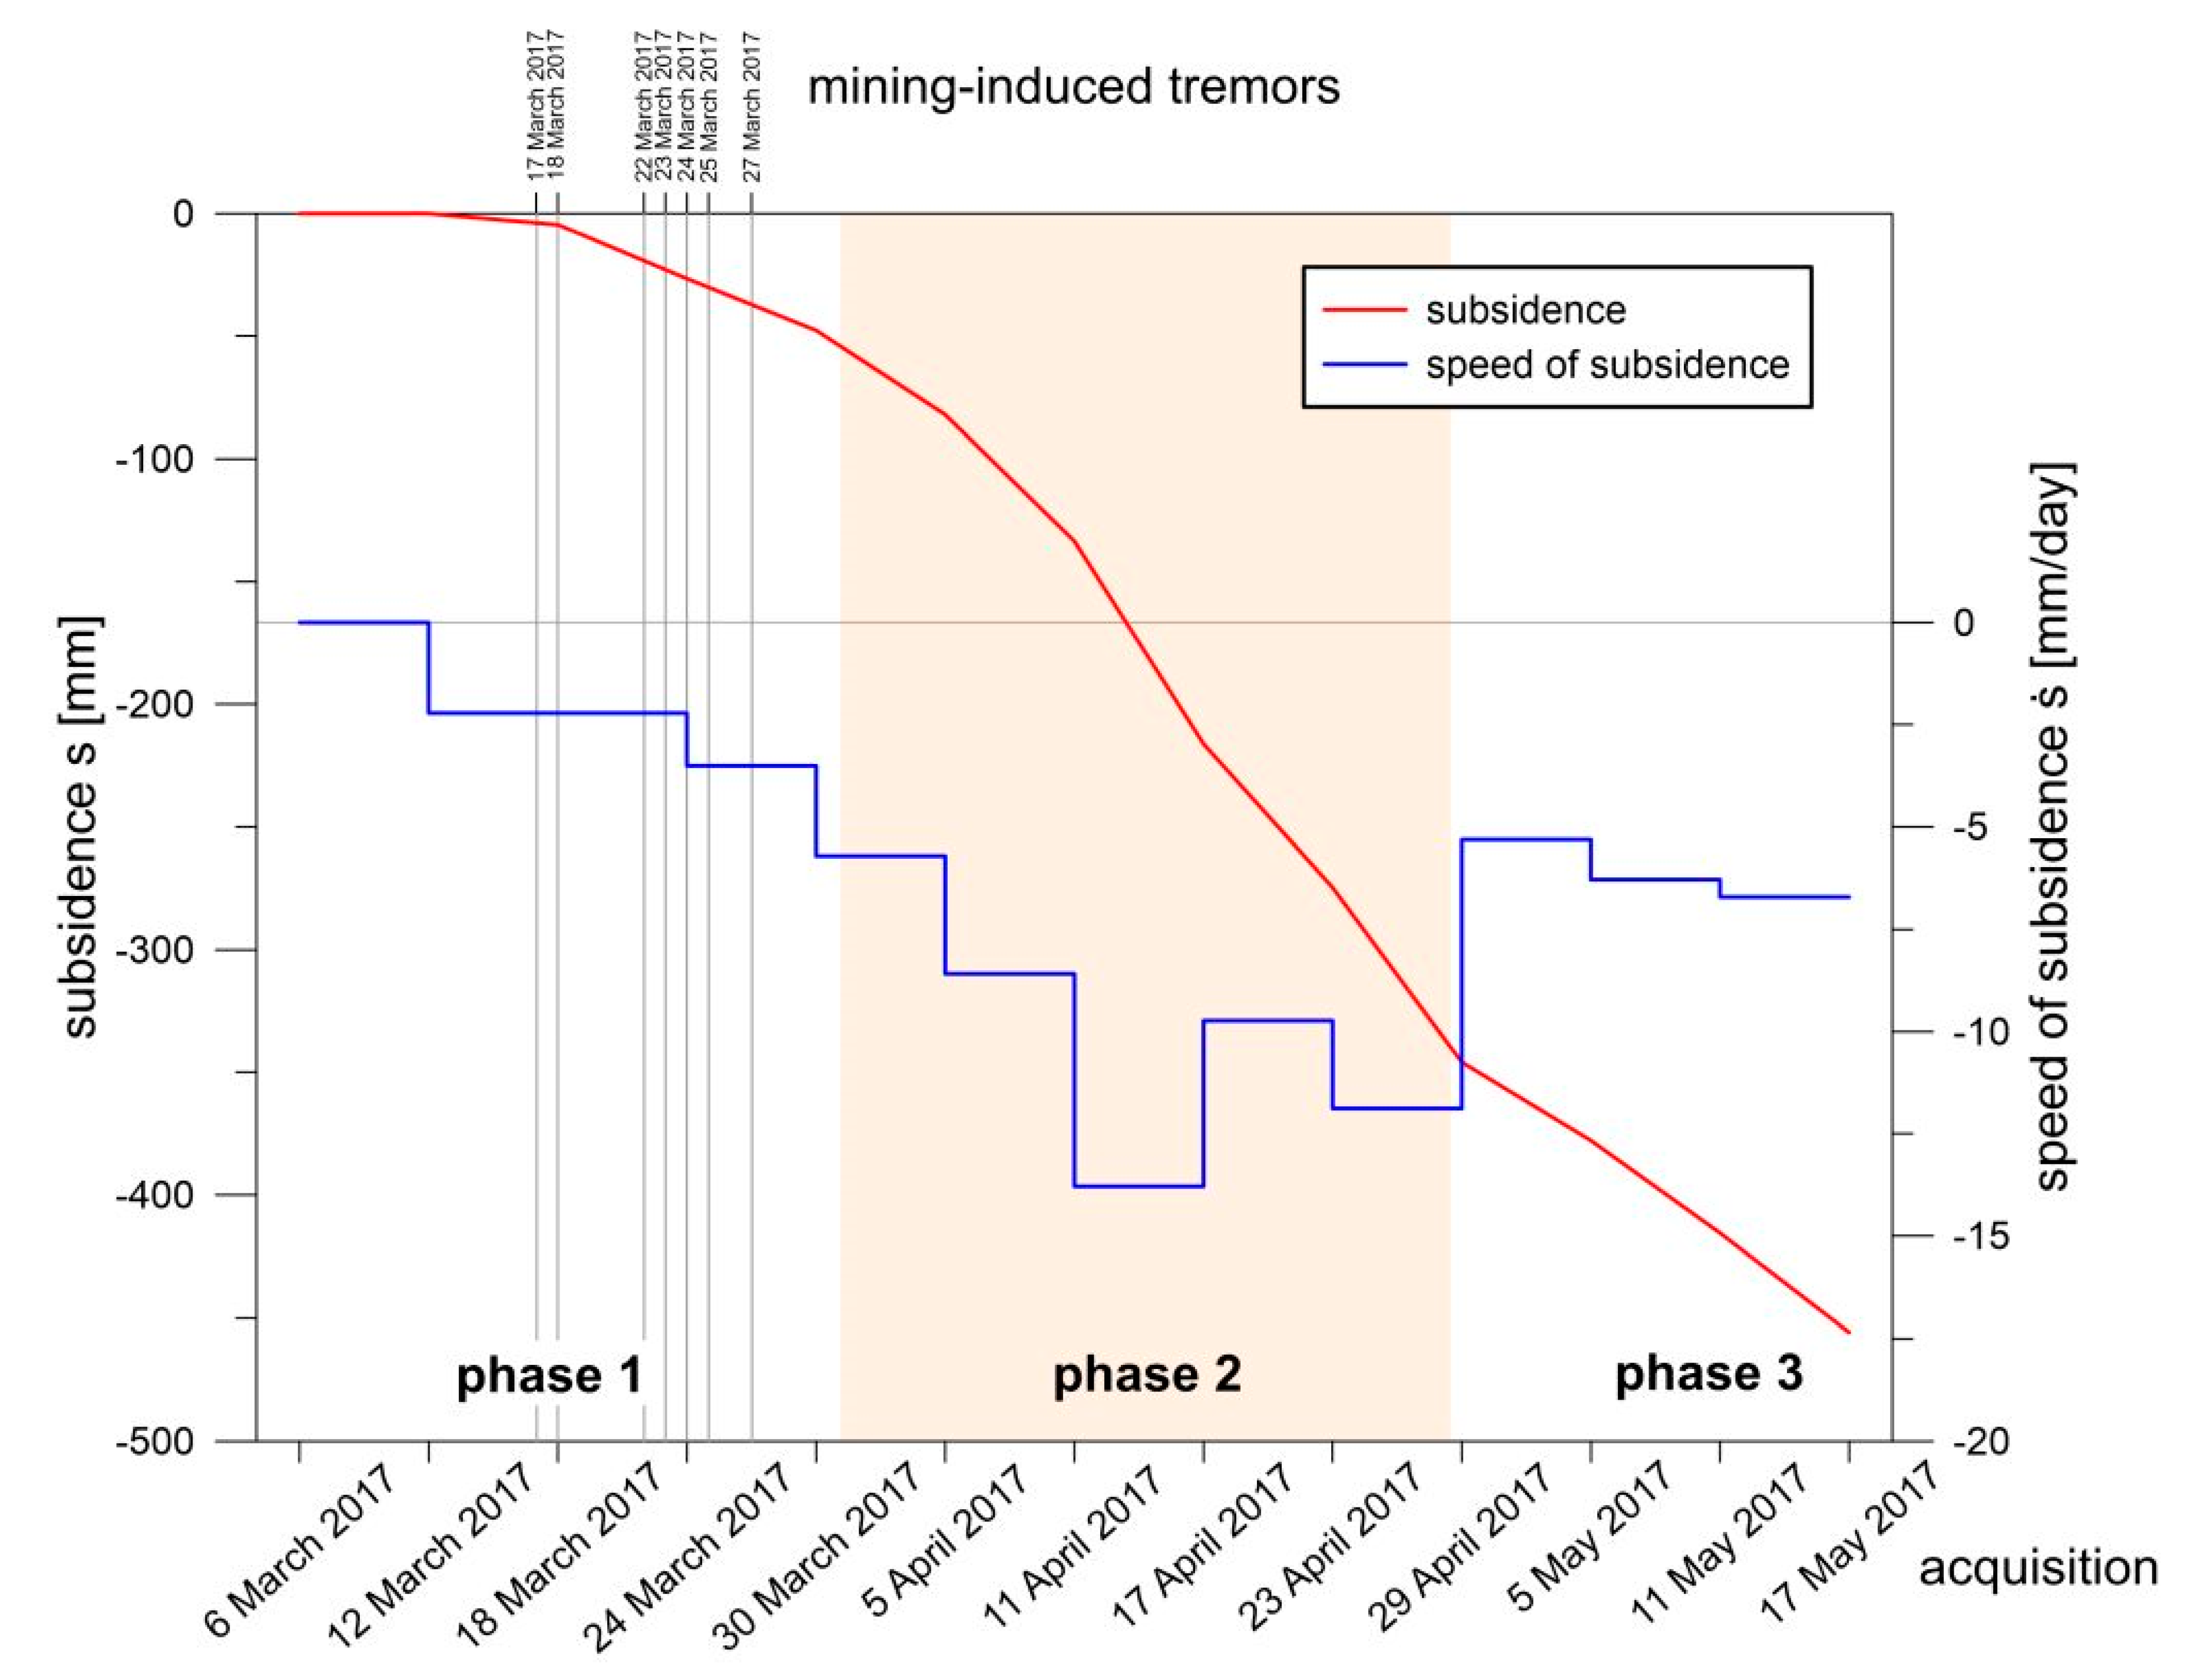
The observed phenomenon of surface transformation was a consequence of deformations in the rock mass. It was characterized by dynamic conditions varying in time, related to the changing speed of incremental surface subsidence (Figure 12). The authors’ experience [45,46,47] shows that the impact of drainage of aquifers in the conditions of Polish coal mining is small and does not exceed 3–4 mm in the analyzed period. For this reason, dehydration subsidence was not considered in this article. In this case, the impulse that initiated the deformation process was a series of seven tremors that occurred within 10 days of each other between 17 and 27 March 2017. The dynamics of the variations in the land surface morphology were characterized by analyzing the subsidence profiles in time for a point in the center of the resulting subsiding trough (Figure 7, yellow point). The initial speed of land subsidence caused by the moving rock mass material toward the cavity was approx. −3 mm/d. A few days after the last tremor (on 27 March 2017), the speed started to increase nonlinearly. In the middle of April, the subsidence speed reached its maximum value of approximately −14 mm/d. In the subsequent period, a slowing decreasing rate was reported. In the middle of May, it was between −5 and −6 mm/d, indicating slow fading of the surface displacements.
This phenomenon can be explained by the delay related to the time required for deformations to pass through the rock mass on the way from the cavern to the land surface [48,49]. This can be compared to the propagation of electromagnetic waves in a damping medium. Changing speeds during the process of rock mass deformation indicate similarity to the exponential models of natural processes in time, in which a damping factor is present (e.g., mechanical systems with motion resistance; oscillating systems with energy loss; charging and discharging electrical systems).
The relatively low quality of radar data in the following period (17–29 May 2017) made it impossible to determine exactly the date on which the land surface subsidence ceased. This was caused by the high intensity of plant vegetation after 17 May 2017, which reduced the legibility of the acquired data to a level below the threshold for interpreting the processed DInSAR images. This movement could have continued for between two and four weeks, increasing the subsidence of the trough by no more than between −5 and −10 cm.
Strictly speaking, the land surface deformation presented herein does not show features that are characteristic of the effects of the ongoing mining operations [2,50]. This is indicated by the generated maps of vertical displacement (Figure 6), presenting continuous data about the subsidence that occurred between 6 March and 17 May 2017. The time-based subsidence (6-day) detected in the subsequent images covered almost the same surface area all the time (800 m × 700 m) and are strongly correlated with the epicenters of the tremors that preceded the examined phenomenon. In the case of progressive exploitation of the hard coal longwall mining, the increasing size of the voids formed in the rock mass would cause subsidence on the surface that covers more and more area. The indicated temporary subsidence would then cover an increasing area on the surface. Subsidence development would follow the direction of the longwall face. In the conditions of the USCB, increments in subsidence can reach values higher than −20 mm/d [51]. Additionally, the expected land subsidence amounts to about 70–80% of the thickness of the extracted coal seam, and 95% of this subsidence is revealed in the period from 3 to 9 months [52]. In the case of the analysis of subsidence accumulation dynamics, a significant similarity can be shown between the development of post-tremor and mining-induced subsiding trough. This is related to the physical and mechanical parameters of the rock medium in which deformation occurs. In both the first case (post-tremor, Figure 12) and the second case (mining-induced), three basic phases of deformation development can be distinguished: (1) The initial phase (occurring in early April) involves the first reaction of the rock mass on the cause of subsidence, in which the subsidence speed began to rise; (2) the main phase (ending in the third decade of April), in which the subsidence speed stabilized at a specific and usually relatively high level (the maximum speed occurs in this phase); (3) the ending phase (start of May and later), where the impact dynamics abates and as a result the subsidence speed is reduced to zero.
All the observed phases of deformation development, particularly the few weeks with symptoms of deformation showing on the surface, are contrary to the earlier experiences resulting, for example, from observations performed in previous years in the LGCD [32,33]. Approximately 80% of the total subsidence values can be detected within 48 h from the occurrence of the rock mass tremor. The final subsidence smax is between −8 and −12 cm (speed of subsidence: ṡ = 20–35 mm/d). The shapes of the formed subsiding troughs are close to an ellipse with dimensions of approximately 1.5 km × 2.5 km. Research conducted so far in the USCB [29,31] refers to the detection of subsidence caused by seismic phenomena and the distances from the points of maximum subsidence to the tremor epicenters, but it does not cover the aspect of dynamics (time) of detecting the surface impacts.
Sroka [53,54,55] presented the dynamics of the deformation process in German and Polish mining operations. That work shows that significant damage of buildings and structures in the mining areas is caused, among other factors, by the high and variable speeds of deformation of the rock mass and land surface. Factors that determine a threat to buildings and structures under the influence of dynamics of the deformation process include the speed of land surface subsidence ṡ. Table 3 gives the upper limit ṡB of the boundary speed of surface subsidence along with the corresponding categories of building strength and mining areas in Poland.
The incremental subsidence speed was analyzed based on the similarity of the dynamics of mining-induced and post-tremor subsidence processes. The dynamics of this process (Figure 12) indicate that the process of gradual increase in subsidence complies with the exponential model of the dynamics of other natural processes in which damping effects can be found. Such a model exists in the description of the land surface subsidence process in time, as a result of mining operations. Equation (5) present the formula for the course of subsidence in time at a given point [56]:
where s is the final subsidence as a result of mining operations, st is the subsidence at time t, and c is a parameter describing the damping effect (delay in reaching the final subsidence at a given point).
The strength of buildings to the dynamic impact of mining exploitation is characterized by the subsidence speed (ṡB). The maximum subsidence speed (Figure 12) where the subsiding trough forms is ṡmax = −13.8 mm/d. This is a value that poses a damage hazard for infrastructure that is qualified as resistant to the 3rd category of mining impact. The strength category of buildings and structures is used in the context of mining area protection. Building structures are assigned to a category of resistance against mining impacts [57,58] described by the values of the so-called deformation factors, e.g., changes in the area tilt T and horizontal deformation ε (relative change of the distance between observation points) [59,60]. This indicates that the building construction can transfer the deformation impact caused by mining operations. In the five-stage scale of strength categories, buildings classified to 3rd category are resistant to significant land surface deformations (−6 mm/d < ṡB ≤ −12 mm/d [55], 5 mm/m < TB ≤10 mm/m, 3 mm/m < |εB| ≤ 6 mm/m [59]). Therefore, it can be concluded that buildings (with strength category 0–3) exposed to a dynamic impact whose magnitude is comparable to that described here, depending on their strength, could be damaged. However, because of the lack of such examples, it is not possible to verify this hypothesis, but nevertheless attention should be paid to that type of threat.
5. Conclusions
Rock mass tremors and their related effects on urbanized areas are definitely unfavorable phenomena and can threaten buildings, infrastructure, and people. In the case of tremors induced in areas where rock mass voids exist (natural caverns, closed workings, fault zones), apart from the surface tremors caused by the course of a seismic wave, significant morphological changes of this surface should also be expected. These changes can be observed for example as continuous deformations, such as subsiding troughs. The general availability of seismic data (e.g., GEOFON program from GFZ German Research Centre for Geosciences, IS-EPOS, European-Mediterranean Seismological Centre) and satellite imaging (Sentinel mission from European Space Agency) and also the possibilities for data processing in software licensed under the GNU General Public License allow examination of large-scale area deformations. They also allow the assessment of the level of risk to the area covered by such deformations. An excellent example of such use of data is the case analyzed herein. Assessing the impact of rock mass tremors on the land surface required developing a bespoke method for processing the satellite data, leading to the obtained model of a post-tremor subsiding trough. As a result, the characteristics and dynamics of the surface deformation process caused by a series of seven tremors of the rock mass with magnitudes reaching ML = 2.6 were determined in the studied region. The tremors occurred between 17 and 27 March 2017. Moreover, based on experience in protecting mining areas, the threats to building structures were evaluated according to the classification used in mining areas. That evaluation was done to indicate potential threats for the developed area on the surface. In the discussed case, building structures with resistance lower than the limit values of subsidence speed (ṡB = −12 mm/d; Table 3) can be exposed to the risk of damage.
Because of the significant scale of occurrence of seismic activities caused by humans, for example, related to the excavation of mineral deposits, it is important to examine the effects of such phenomena regarding public safety. To date, this problem has not been identified sufficiently despite the large number of seismic events that occur, such as those in the USCB. This creates favorable conditions for performing further studies in this field.
Author Contributions
Conceptualization, P.S., T.S., A.W. and D.M.; methodology, P.S., T.S., A.W. and D.M.; software, A.W. and D.M.; validation, T.S. and A.W.; formal analysis, P.S. and T.S.; investigation, D.M.; resources, A.W. and D.M.; data curation, A.W. and D.M.; writing—original draft preparation, T.S. and D.M.; writing—review and editing, P.S. and A.W.; visualization, A.W. and D.M.; supervision, P.S. and T.S. All authors have read and agreed to the published version of the manuscript.
Funding
This research was funded by the research subvention of AGH University of Science and Technology, grant number 16.16.150.545.
Conflicts of Interest
The authors declare no conflict of interest.
Appendix A
Figure A1.
Interferometric phase band of study area in the period from 30 March 2017 to 05 April 2017.
Figure A1.
Interferometric phase band of study area in the period from 30 March 2017 to 05 April 2017.

References
- Chrousos, G.P.; Loriaux, D.L.; Gold, P.W. Mechanisms of Physical and Emotional Stress; Springer: Boston, MA, USA, 1988; Volume 245, ISBN 9788578110796. [Google Scholar]
- Brady, B.H.G.; Brown, E.T. Rock Mechanics; Springer: Dordrecht, The Netherlands, 1999; ISBN 978-0-412-47550-4. [Google Scholar]
- Durrheim, R.; Anderson, R.; Cichowiczc, A.; Ebrahim-Trolloped, R.; Huberte, G.; Kijkoc, A.; McGarrf, A.; Ortleppg, W.D.; Van der Merwe, N. The risks to miners, mines, and the public posed by large seismic events in the gold mining districts of South Africa. In Proceedings of the 3rd International Seminar on Deep and High Stress Mining 2006, Quebec, QC, Canada, 2–4 October 2006; p. 14. [Google Scholar]
- Rudziński, L.; Mirek, J.; Lizurek, G. Identification of seismic doublets occurred on Rudna mine, Poland. Acta Geophys. 2017, 65, 287–298. [Google Scholar] [CrossRef] [Green Version]
- Fritschen, R. Mining-induced seismicity in the Saarland, Germany. Pure Appl. Geophys. Pageoph 2009, 167, 77–89. [Google Scholar] [CrossRef]
- Spetzler, J.; Dost, B. Hypocentre estimation of induced earthquakes in Groningen. Geophys. J. Int. 2017, 209, 453–465. [Google Scholar]
- Gibowicz, S.; Droste, Z.; Guterch, B.; Hordejuk, J. The Belchatow, Poland, earthquakes of 1979 and 1980 induced by surface mining. Eng. Geol. 1981, 17, 257–271. [Google Scholar] [CrossRef]
- Szczerbowski, Z. High-energy seismic events in Legnica-Głogów Copper District in light of ASG-EUPOS data. Reports Geod. Geoinformatics 2019, 107, 25–40. [Google Scholar] [CrossRef] [Green Version]
- Szczerbowski, Z. Mining induced seismic events and surface deformations monitored by GPS permanent stations. Acta Geodyn. Geomater. 2015, 12, 237–248. [Google Scholar] [CrossRef] [Green Version]
- Kaláb, Z. Impact of seismicity on surface in mining affected areas: General description. Acta Geodyn. Geomater. 2004, 1, 35–39. [Google Scholar]
- Mutke, G.; Dubiński, J.; Lurka, A. New criteria to assess seismic and rock burst hazard in coal mines. Arch. Min. Sci. 2015, 60, 743–760. [Google Scholar] [CrossRef] [Green Version]
- Witkowski, M.; Wodyński, A. Analysis of mining damage notifications in single-family buildings after the occurrence of intensive mining tremors. Geomat. Environ. Eng. 2015, 9, 101. [Google Scholar] [CrossRef] [Green Version]
- Wodyński, A.; Lasocki, S. Assessment of mining tremor inflence on the technical wear of building. Acta Geodyn. Geomater. 2004, 1, 187–194. [Google Scholar]
- Bryt-Nitarska, I. Effects of strong mining tremors, and assessment of the buildings’ resistance to the dynamic impacts. E3S Web Conf. 2018, 36, 01003. [Google Scholar] [CrossRef] [Green Version]
- Kobayashi, T.; Morishita, Y.; Yarai, H.; Fujiwara, S. InSAR-derived crustal deformation and reverse fault motion of the 2017 Iran-Iraq earthquake in the Northwest of the Zagros Orogenic Belt. Bull. Geospat. Info. Auth. Jpn. 2017, 1–9. [Google Scholar]
- Sreejith, K.M.; Sunil, P.; Agrawal, R.; Saji, A.P.; Ramesh, D.S.; Rajawat, A.S. Coseismic and early postseismic deformation due to the 25 April 2015, M w 7.8 Gorkha, Nepal, earthquake from InSAR and GPS measurements. Geophys. Res. Lett. 2016, 43, 3160–3168. [Google Scholar] [CrossRef] [Green Version]
- Bayer, B.; Simoni, A.; Schmidt, D.A.; Bertello, L. Using advanced InSAR techniques to monitor landslide deformations induced by tunneling in the Northern Apennines, Italy. Eng. Geol. 2017, 226, 20–32. [Google Scholar] [CrossRef]
- Schlögel, R.; Doubre, C.; Malet, J.P.; Masson, F. Landslide deformation monitoring with ALOS/PALSAR imagery: A D-InSAR geomorphological interpretation method. Geomorphology 2015, 231, 314–330. [Google Scholar] [CrossRef]
- Ilieva, M.; Polanin, P.; Borkowski, A.; Gruchlik, P.; Smolak, K.; Kowalski, A.; Rohm, W. Mining Deformation life cycle in the light of InSAR and deformation models. Remote Sens. 2019, 11, 745. [Google Scholar] [CrossRef] [Green Version]
- Ng, A.H.-M.; Ge, L.; Du, Z.; Wang, S.; Ma, C. Satellite radar interferometry for monitoring subsidence induced by longwall mining activity using Radarsat-2, Sentinel-1 and ALOS-2 data. Int. J. Appl. Earth Obs. Geoinf. 2017, 61, 92–103. [Google Scholar] [CrossRef]
- Pawluszek-Filipiak, K.; Borkowski, A. Integration of DInSAR and SBAS Techniques to determine mining-related deformations using sentinel-1 data: The case study of Rydułtowy mine in Poland. Remote Sens. 2020, 12, 242. [Google Scholar] [CrossRef] [Green Version]
- Guzy, A.; Malinowska, A.A. State of the art and recent advancements in the modelling of land subsidence induced by groundwater withdrawal. Water 2020, 12, 2051. [Google Scholar] [CrossRef]
- Cuenca, M.C.; Hooper, A.; Hanssen, R.F. Surface deformation induced by water influx in the abandoned coal mines in Limburg, The Netherlands observed by satellite radar interferometry. J. Appl. Geophys. 2013, 88, 1–11. [Google Scholar] [CrossRef]
- Malinowska, A.; Witkowski, W.T.; Guzy, A.; Hejmanowski, R. Satellite-based monitoring and modeling of ground movements caused by water rebound. Remote Sens. 2020, 12, 1786. [Google Scholar] [CrossRef]
- Milczarek, W.; Blachowski, J.; Grzempowski, P. Application of PSInSAR for assessment of surface deformations in post-mining area-case study of the former Walbrzych Hard Coal Basin (SW Poland). Acta Geodyn. Geomater. 2016, 14, 41–52. [Google Scholar] [CrossRef]
- Vervoort, A.; Declercq, P.-Y. Surface movement above old coal longwalls after mine closure. Int. J. Min. Sci. Technol. 2017, 27, 481–490. [Google Scholar] [CrossRef]
- Chaussard, E.; Wdowinski, S.; Cabral-Cano, E.; Amelung, F. Land subsidence in central Mexico detected by ALOS InSAR time-series. Remote Sens. Environ. 2014, 140, 94–106. [Google Scholar] [CrossRef]
- Chen, M.; Tomás, R.; Li, Z.; Motagh, M.; Li, T.; Hu, L.; Gong, H.; Li, X.; Yu, J.; Gong, X.-L. Imaging land subsidence induced by groundwater extraction in Beijing (China) using satellite radar interferometry. Remote Sens. 2016, 8, 468. [Google Scholar] [CrossRef] [Green Version]
- Krawczyk, A.; Grzybek, R. An evaluation of processing InSAR Sentinel-1A/B data for correlation of mining subsidence with mining induced tremors in the Upper Silesian Coal Basin (Poland). E3S Web Conf. 2018, 26, 00003. [Google Scholar] [CrossRef] [Green Version]
- Mirek, K.; Mirek, J. Observation of underground exploitation influence on a surface in Budryk, Sośnica, and Makoszowy Coal Mine Area. Pol. J. Environ. Stud. 2016, 25, 57–61. [Google Scholar]
- Rudziński, L.; Mirek, K.; Mirek, J. Rapid ground deformation corresponding to a mining-induced seismic event followed by a massive collapse. Nat. Hazards 2018, 96, 461–471. [Google Scholar] [CrossRef] [Green Version]
- Hejmanowski, R.; Malinowska, A.; Witkowski, W.T.; Guzy, A. An analysis applying InSAR of subsidence caused by nearby mining-induced earthquakes. Geosciences 2019, 9, 490. [Google Scholar] [CrossRef] [Green Version]
- Malinowska, A.; Witkowski, W.T.; Guzy, A.; Hejmanowski, R. Mapping ground movements caused by mining-induced earthquakes applying satellite radar interferometry. Eng. Geol. 2018, 246, 402–411. [Google Scholar] [CrossRef]
- Milczarek, W.J. Application of a small baseline subset time series method with atmospheric correction in monitoring results of mining activity on ground surface and in detecting induced seismic events. Remote Sens. 2019, 11, 1008. [Google Scholar] [CrossRef] [Green Version]
- Hejmanowski, R.; Malinowska, A.; Stoch, T.; Pluciński, P.; Warchała, M.; Kosior, R. New interpretation of GPS measurements results. Miner. Resour. Manag. 2008, 24, 197–204. [Google Scholar]
- Popiołek, E.; Ostrowski, J.; Czaja, J.; Mazur, J. The impact of a strong mining tremor on the subsidence of the area surface in the Legnica-Glogow Copper Area. In Proceedings of the 10th FIG International Symposium on Deformation Measurements, Orange, CA, USA, 19–22 March 2001; pp. 77–80. [Google Scholar]
- Kowalski, A. Surface Deformation in Upper Silesian Coal Basin; Central Mining Institute: Katowice, Poland, 2015. (In Polish) [Google Scholar]
- IS EPOS Episode: USCB. Available online: https://tcs.ah-epos.eu/#episode:USCB, (accessed on 30 October 2020).
- Okoń, A.; Wróbel, A.; Poznański, G. Exploitation of seam 209 in seismic hazard conditions at ZG “Sobieski”. Bezp. Pr. Ochr. Śr. Gór. 2010, 6, 23–28. [Google Scholar]
- Drzewiecki, J.; Myszkowski, J. Mining-induced seismicity of a seam located in rock mass made of thick sandstone layers with very low strength and deformation parameters. J. Sustain. Min. 2018, 17, 167–174. [Google Scholar] [CrossRef]
- Kozłowska, M.; Orlecka-Sikora, B.; Rudziński, Ł.; Cielesta, S.; Mutke, G. Atypical evolution of seismicity patterns resulting from the coupled natural, human-induced and coseismic stresses in a longwall coal mining environment. Int. J. Rock Mech. Min. Sci. 2016, 86, 5–15. [Google Scholar] [CrossRef]
- Mutke, G.; Kotyrba, A.; Lurka, A.; Olszewska, D.; Dykowski, P.; Borkowski, A.; Araszkiewicz, A.; Barański, A. Upper Silesian geophysical observation system a unit of the EPOS project. J. Sustain. Min. 2019, 18, 198–207. [Google Scholar] [CrossRef]
- Hejmanowski, R.; Kwinta, A. Determining the coefficient of horizontal displacements with the use of orthogonal polynomials. Arch. Min. Sci. 2009, 54, 441–454. [Google Scholar]
- Stoch, T.; Niedojadło, Z.; Sopata, P.; Moskała, S. Functions approximating the average course of deformation indicators for the determination of the random dispersion parameters of the post-mining dislocations and land surface deformations. Prz. Gór. 2014, 70, 113–123. (In Polish) [Google Scholar]
- Hejmanowski, R.; Stoch, T.; Sopata, P.; Wójcik, A.; Witkowski, W.T. Effect of coal strata dewatering on land surface subsidence. Prz. Gór. 2013, 8, 38–43. (In Polish) [Google Scholar]
- Witkowski, W.T. Subsidence changes modeling in drainage basin by use of the trend method. Prz. Gór. 2013, 7, 35–40. (In Polish) [Google Scholar]
- Niedojadło, Z.; Stoch, T.; Sopata, P.; Wójcik, A. Analysis of the Results of Geodetic Observations on Observation Lines and Surface Infrastructure Facilities, the Goal Verification of Design Assumptions Adopted for Indicator Forecasts Deformation of the Area within TG ZG “Sobieski” for TAURON Wydobycie; Scientific and Research Study: Kraków, Poland, 2016. (In Polish) [Google Scholar]
- Kratzsch, H. Mining Subsidence Engineering; Springer: Berlin, Germany; New York, NY, USA, 1983; ISBN 13:978-3-642-81925-4. [Google Scholar]
- National Coal Board Subsidence Engineering Handbook; NCB: London, UK, 1975.
- Peng, S.S.; Ma, W.M.; Zhong, W.L. Surface Subsidence Engineering; Society for Mining, Metallurgy, and Exploration: Littleton, CO, USA, 1992; ISBN 0873351142. [Google Scholar]
- Rogowska, J.; Knothe, S.; Gustkiewicz, J.; Popiołek, E.; Kanciruk, A.; Ostrowski, J.; Hejmanowski, R.; Pielok, W.; Leśniak, J.; Cygan, J.; et al. The Influence of the Halting of the Front. of Underground Exploitation on the Course of the Translocations and Deformations of the Area; Rogowska, J., Ed.; Strata Mechanics Research Institute of the Polish Academy of Science: Kraków, Poland, 2004. (In Polish) [Google Scholar]
- Kowalski, A. Land Deformation in the Mining Areas of Hard Coal Mines; Central Mining Institute: Katowice, Poland, 2020; ISBN 978-83-65503-23-7. (In Polish) [Google Scholar]
- Sroka, A. Dynamics of Mining Exploitation from Point of View Mining Damage; The Publishing House of the Mineral and Energy Economy, Research Institute of the Polish Academy of Sciences: Kraków, Poland, 1999. (In Polish) [Google Scholar]
- Sroka, A. Der Einfluss von Hochleistungsstreben auf das Gebirge und die Tagesoberfläche. Glückauf Forsch. 2003, 64. [Google Scholar]
- Sroka, A. Influence of time-based parameters of longwall panel exploitation on objects inside rock mass and on the surface. Arch. Min. Sci. 2009, 54, 819–826. [Google Scholar]
- Knothe, S. Effect of time on formation of basin subsidence. Arch. Min. Steel Ind. 1953, 1, 1–7. [Google Scholar]
- Malinowska, A. Analysis of methods used for assessing damage risk of buildings under the influence of underground exploitation in the light of world’s experience-Part 1. Arch. Min. Sci. 2013, 58, 843–853. [Google Scholar]
- Malinowska, A. Accuracy estimation of the approximated methods used for assessing risk of buildings damage under the influence of underground exploitation in the light of world’s and polish experience-Part 2. Arch. Min. Sci. 2013, 58, 855–865. [Google Scholar]
- Popiołek, E. Protection of Mining Areas; AGH-UST Publishing House: Kraków, Poland, 2009; ISBN 978-83-7464-229-3. (In Polish) [Google Scholar]
- Ostrowski, J. Surface Deformations of Protected Mining Area; Agencja Wydawniczo-Poligraficzna Art-Tekst: Kraków, Poland, 2015; ISBN 978-83-7783-124-3. (In Polish) [Google Scholar]
Figure 1.
Area of Interest: (A) location of the research area (B) mining area (C) mining operations in seam 1 and seam 2 in 2001–2017 and localization of geological cross section.
Figure 1.
Area of Interest: (A) location of the research area (B) mining area (C) mining operations in seam 1 and seam 2 in 2001–2017 and localization of geological cross section.
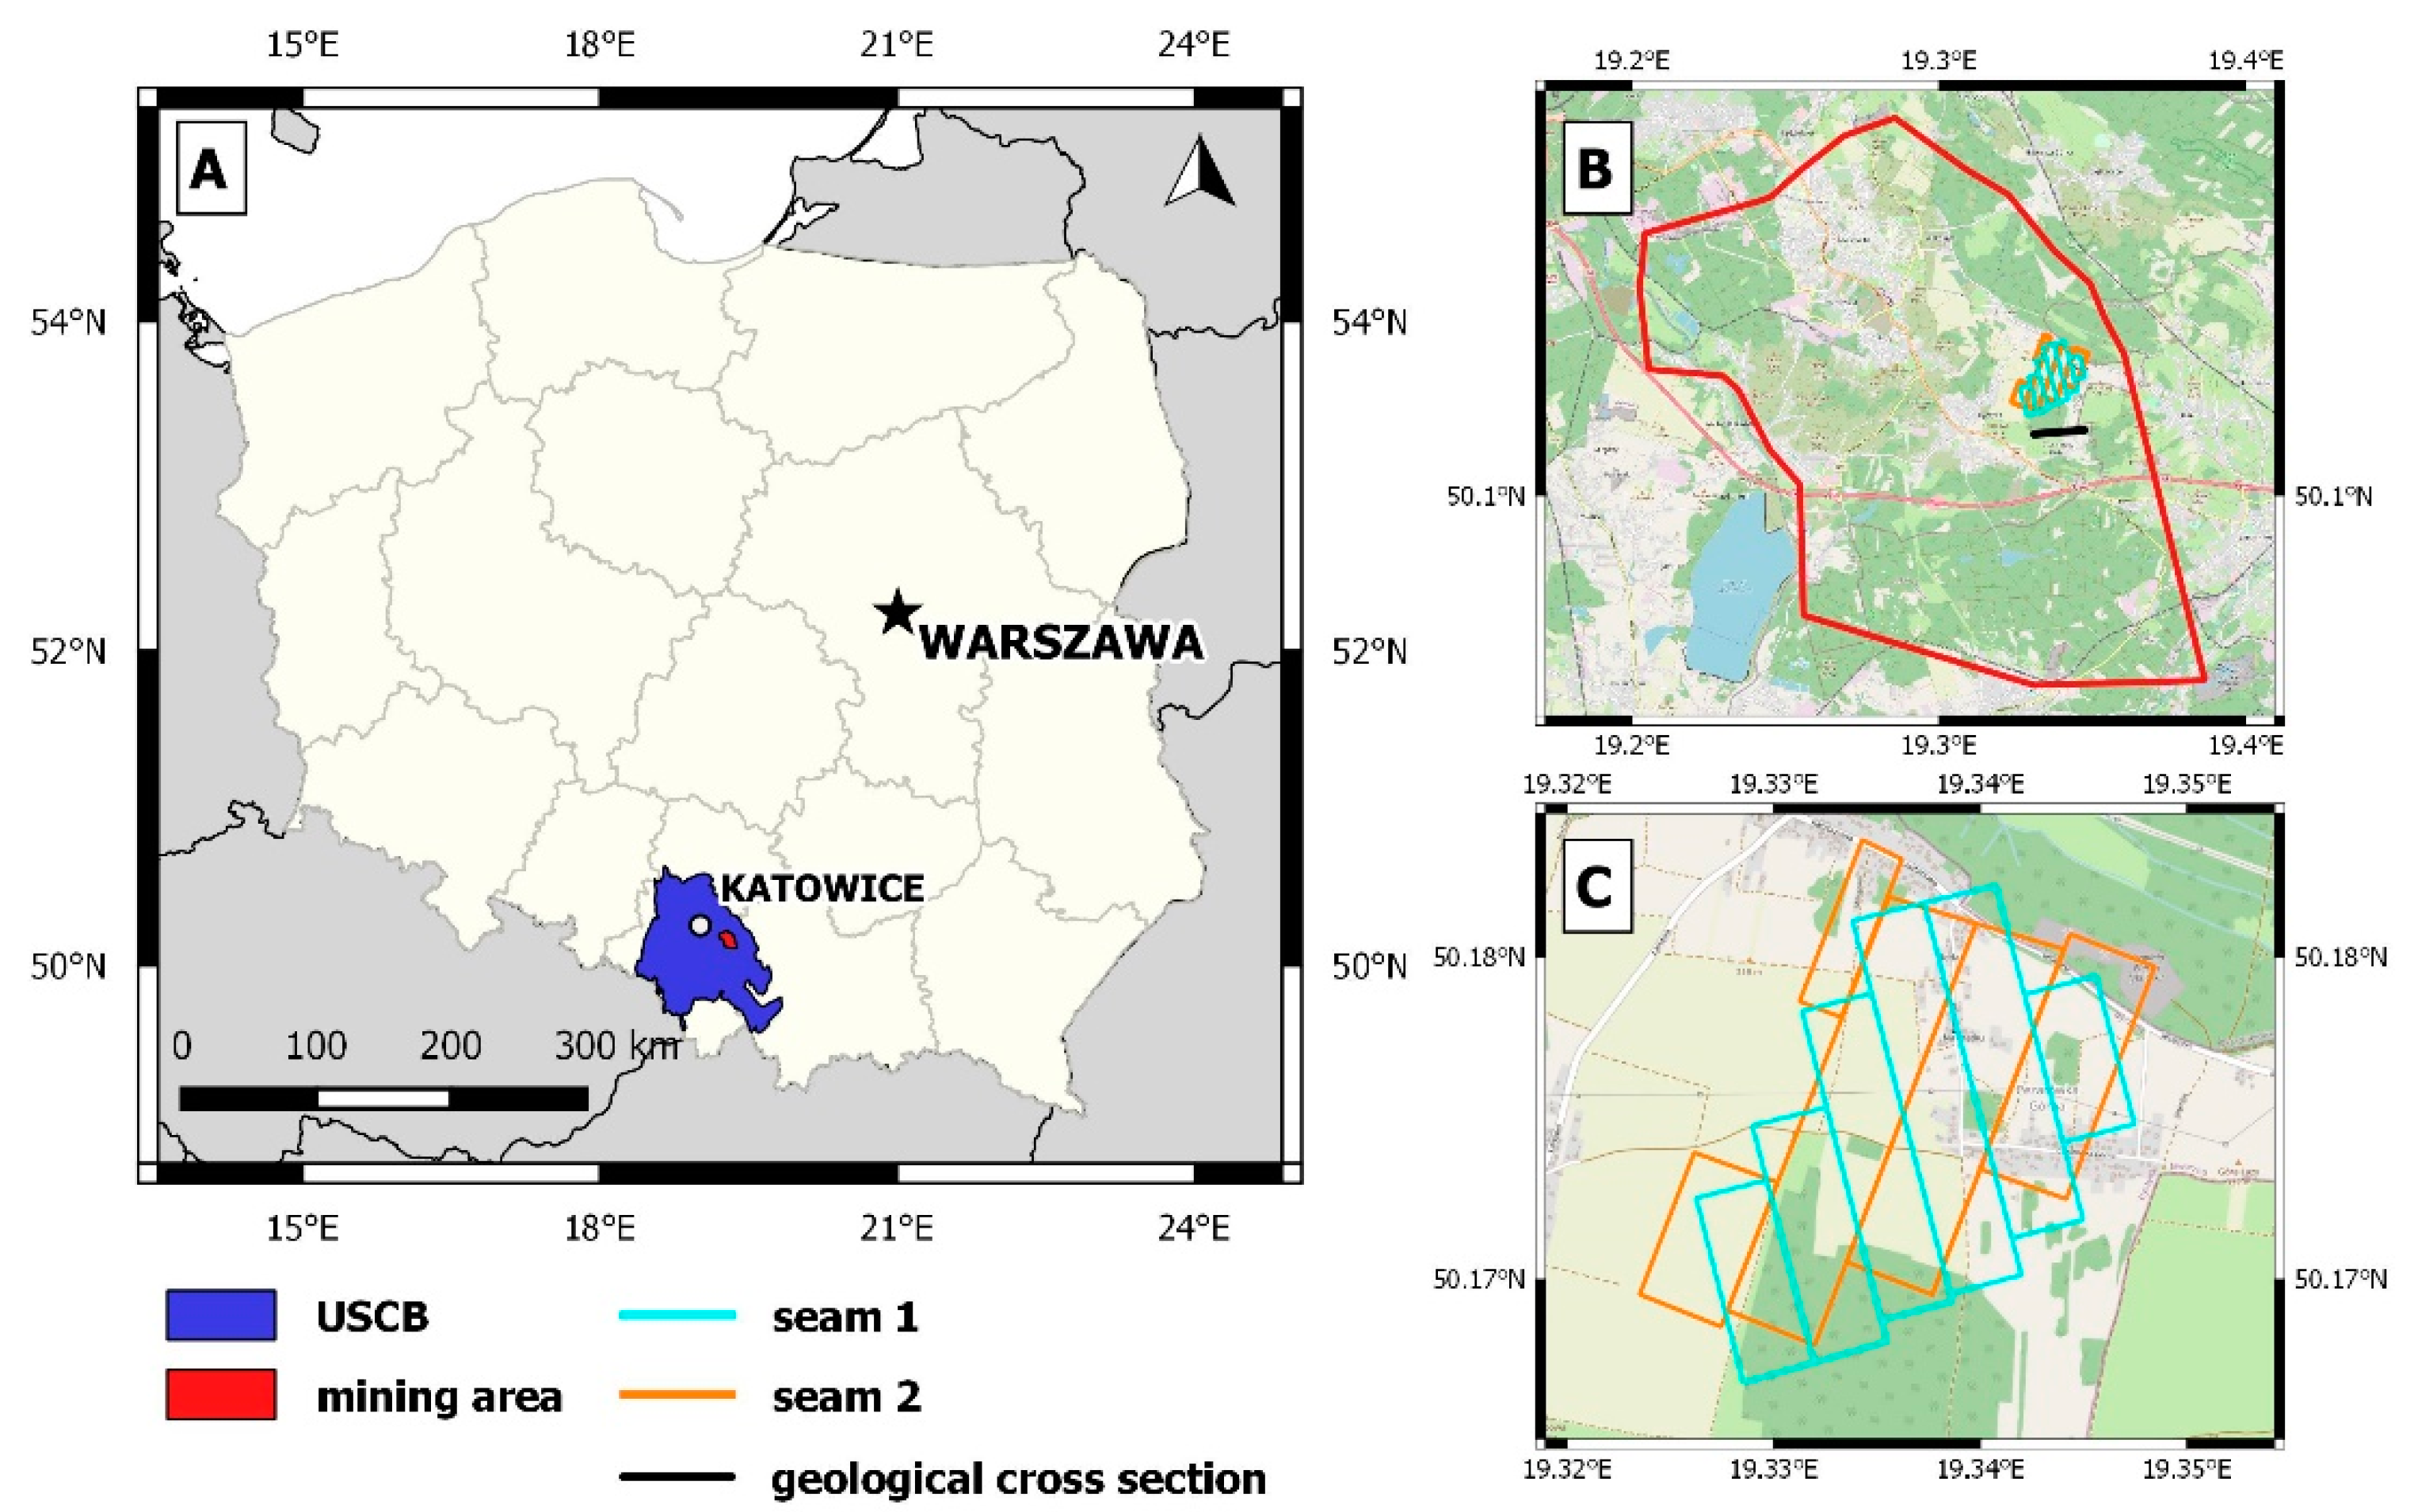
Figure 2.
Simplified geological cross section.

Figure 3.
Surface distribution of mining tremors epicenters from 17 March 2017 to 27 March 2017 over longwall mining operations in seam 2.
Figure 3.
Surface distribution of mining tremors epicenters from 17 March 2017 to 27 March 2017 over longwall mining operations in seam 2.

Figure 4.
Steps of determining 6-day subsidence isolines on the basis of a raster image and P-profile: (A) vertical displacements based on interferometric data, (B) automatic vectorization of land surface subsidence isolines, (C) approximation of subsidence profiles along the P-profile and smoothing of subsidence isolines, (D) surface distribution of corrected subsidence isolines.

Figure 5.
The approximation of the subsidence profile (SPOLY, red line) and the subsidence profile based on raster data (SRASTER, light-blue line).
Figure 5.
The approximation of the subsidence profile (SPOLY, red line) and the subsidence profile based on raster data (SRASTER, light-blue line).
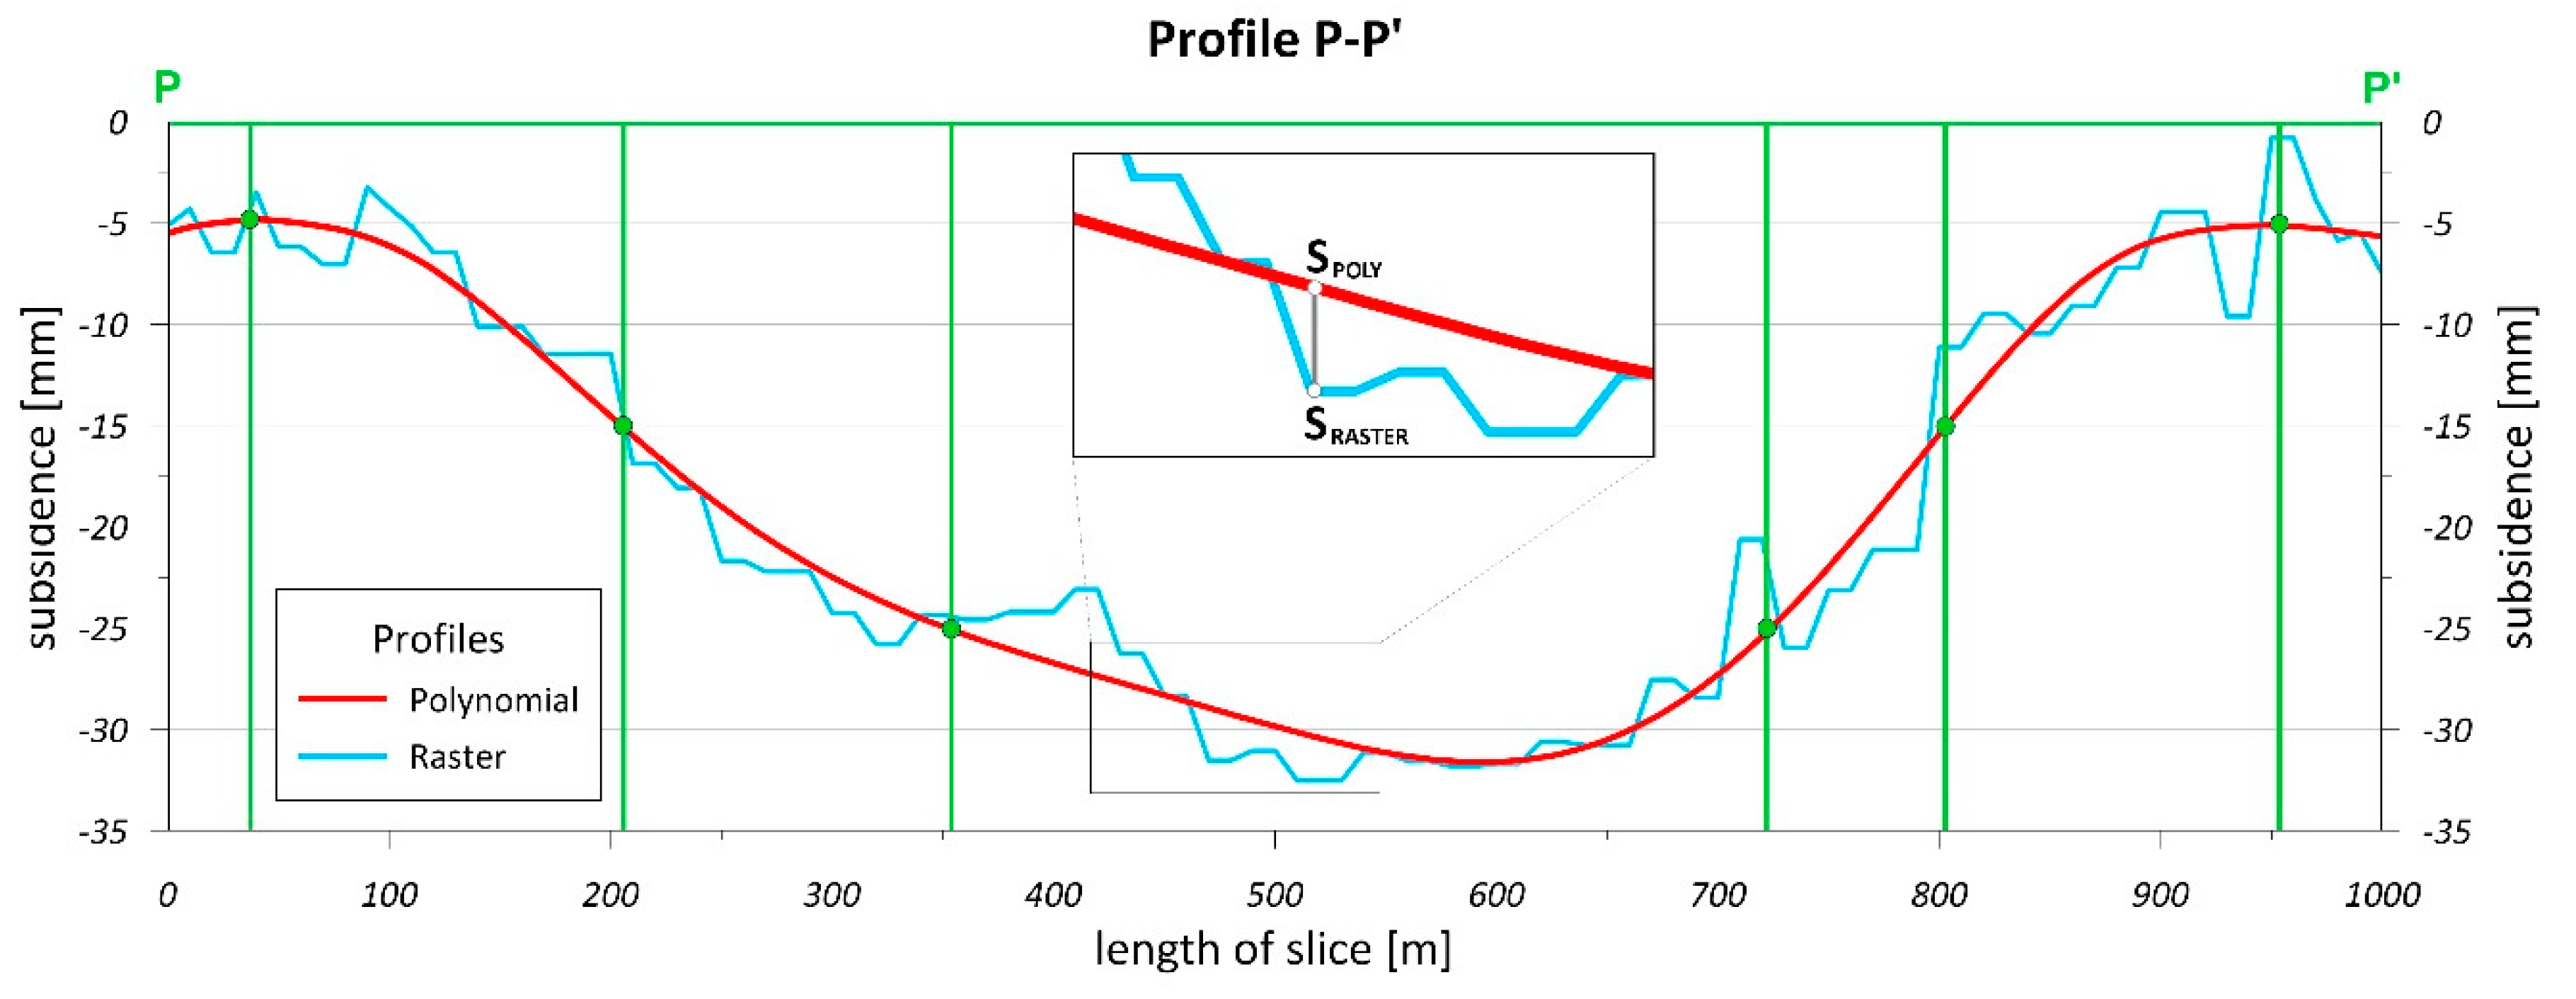
Figure 6.
Days subsidence maps in the period 6 March to 17 May 2017 with registered epicenters of mining-induced tremors.
Figure 6.
Days subsidence maps in the period 6 March to 17 May 2017 with registered epicenters of mining-induced tremors.

Figure 7.
The final subsidence trough in the period from 6 March 2017 to 17 May 2017 with profile lines (black lines). The SW-NE red line represents the main profile line.
Figure 7.
The final subsidence trough in the period from 6 March 2017 to 17 May 2017 with profile lines (black lines). The SW-NE red line represents the main profile line.
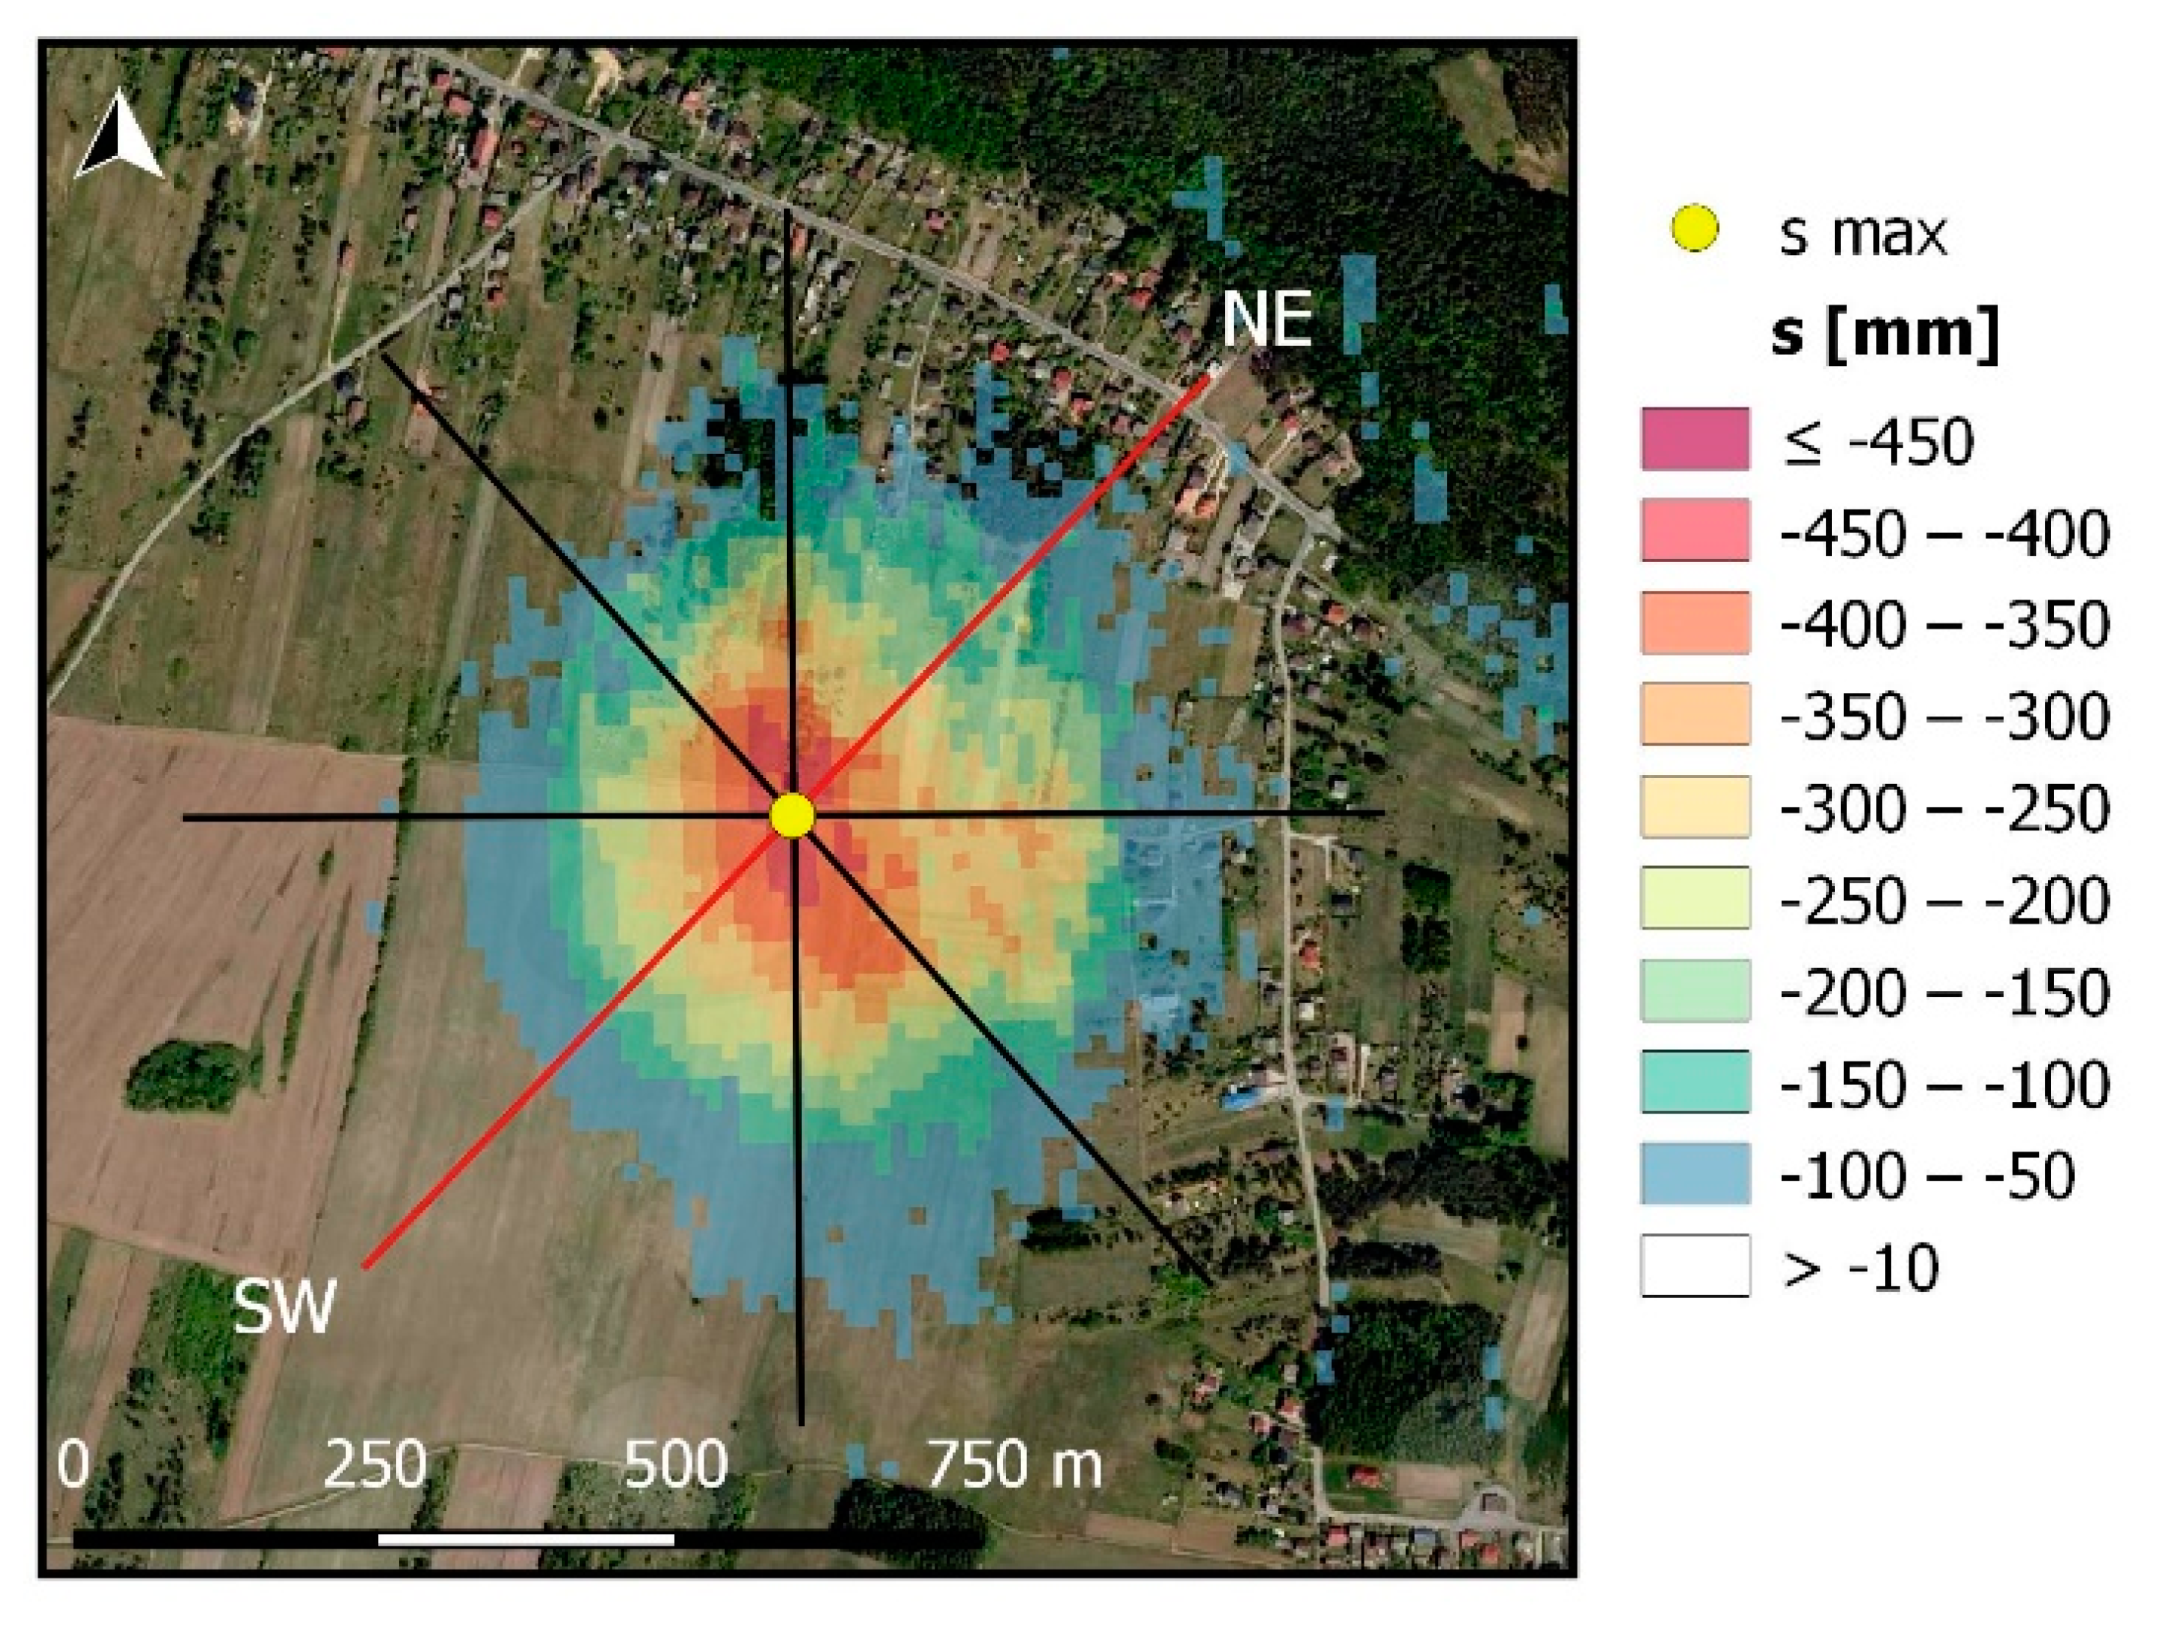
Figure 8.
Development of subsidence trough in the period from 6 March 2017 to 17 May 2017.
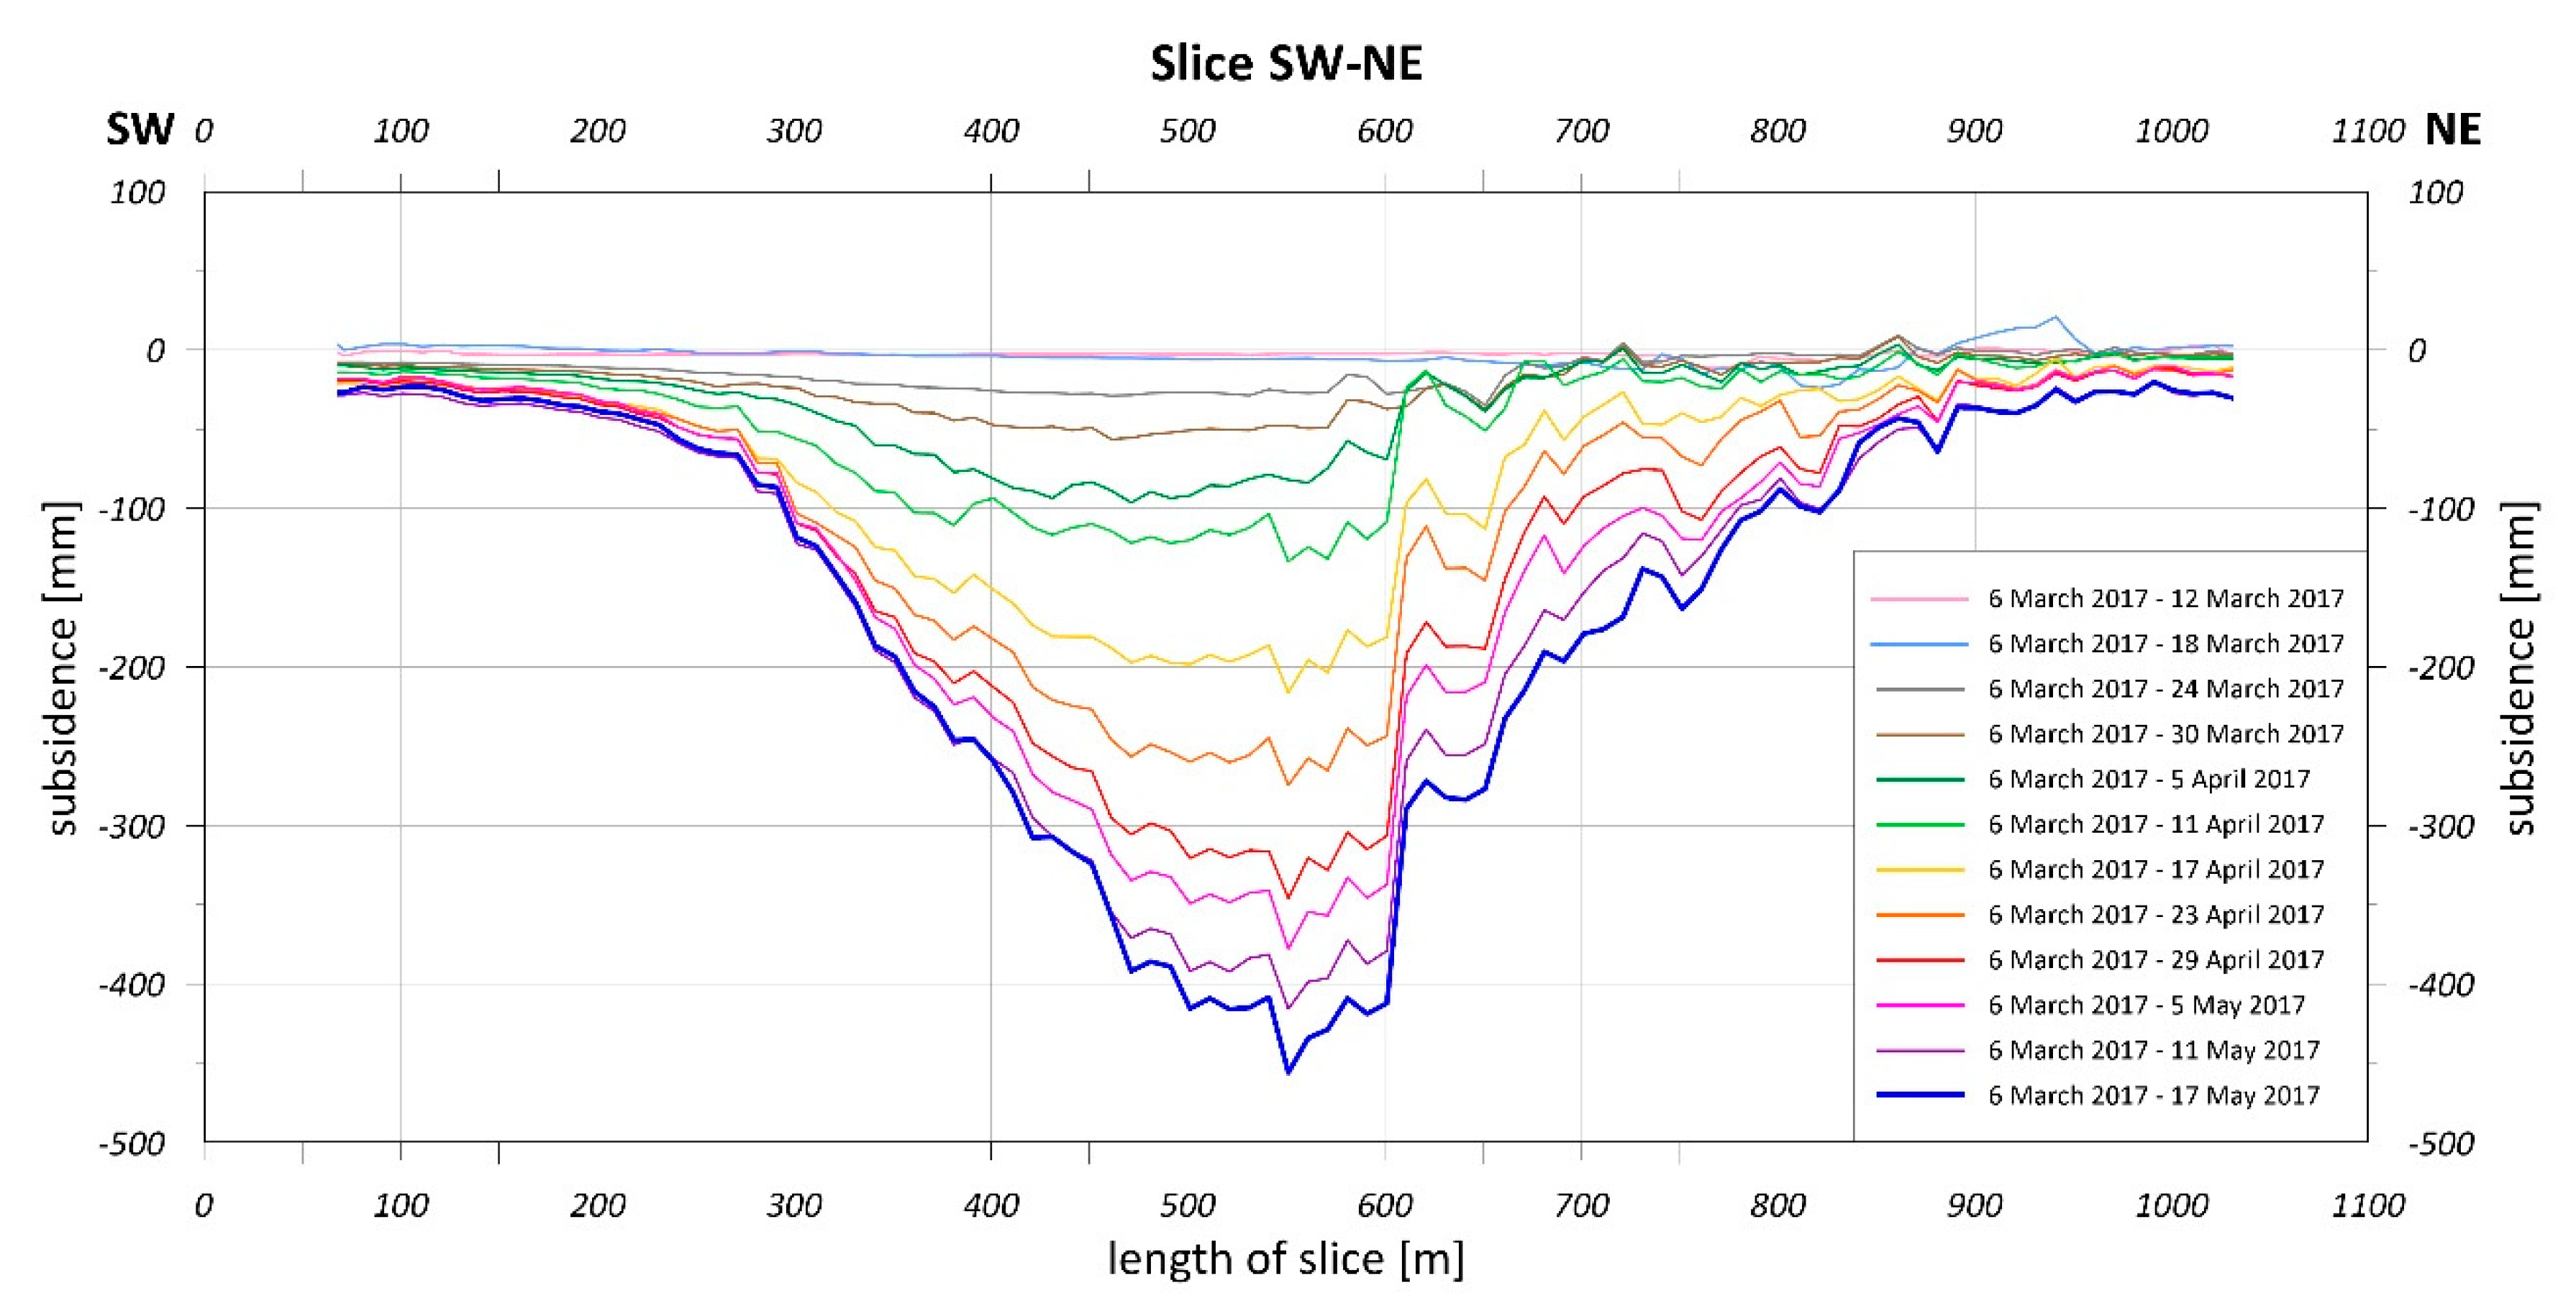
Figure 9.
Results of final land surface subsidence modeling based on methodology described in Section 2.3. (A) summed-up vertical displacements from 6 March 2017 to 17 May 2017, (B) automatic vectorization of land surface subsidence isolines, (C) approximation of subsidence and smoothing of subsidence isolines, (D) surface distribution of corrected subsidence isolines.
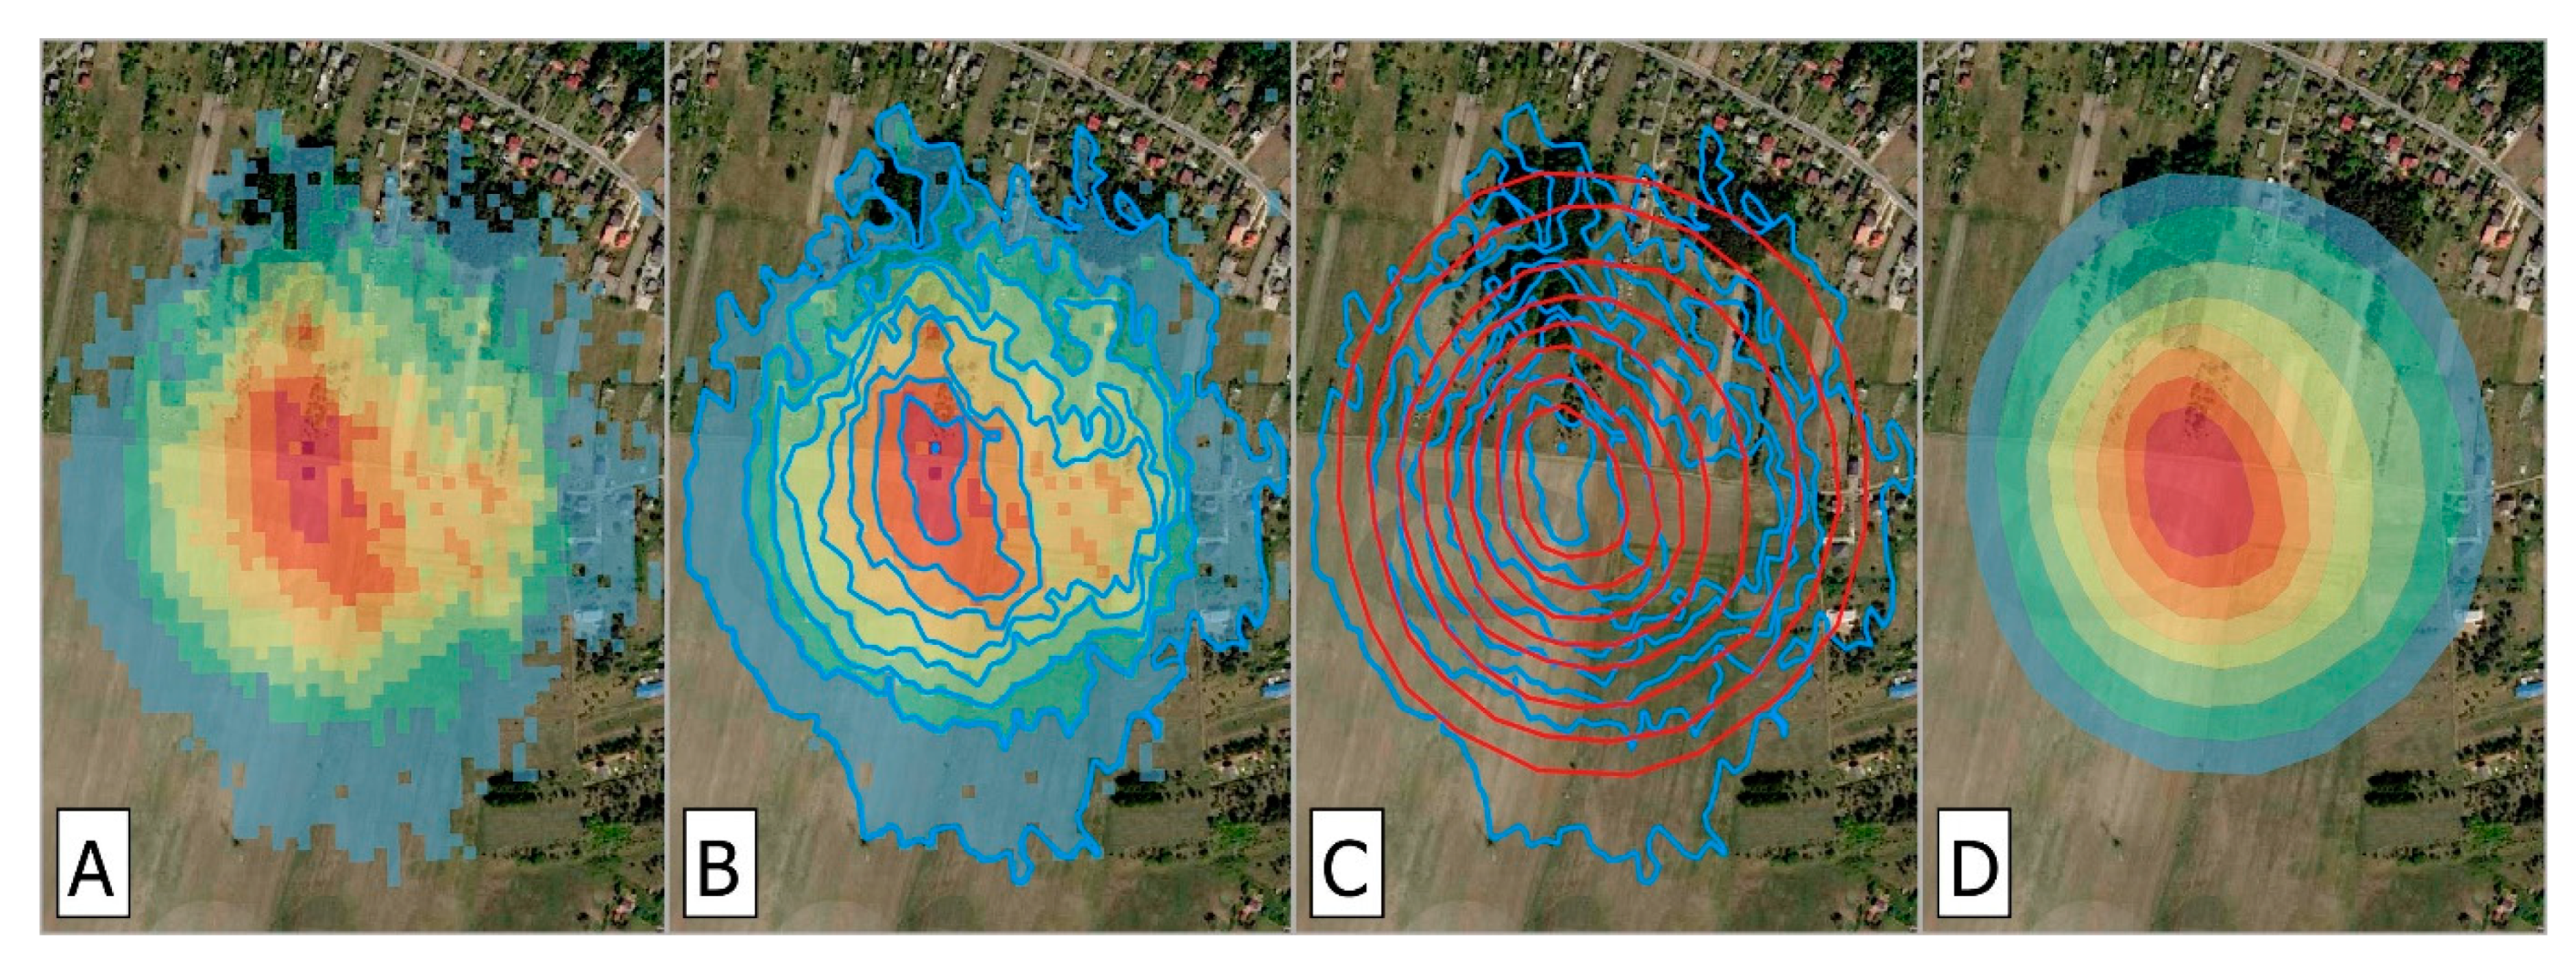
Figure 10.
Orthogonal polynomial interpolation of incremental subsidence.

Figure 11.
3D model of final subsidence trough.

Figure 12.
Subsidence and speed of surface subsidence initiated by mining-induced tremors.

Table 1.
Characteristics of mining-induced tremors.
| Date dd/mm/yyyy | Time (UTC) | Longitude [deg] | Latitude [deg] | Local Magnitude ML |
|---|---|---|---|---|
| 17 March 2017 | 17:30 | 50.1789 N | 19.3328 E | 2.3 |
| 18 March 2017 | 16:37 | 50.1791 N | 19.3325 E | 2.5 |
| 22 March 2017 | 05:02 | 50.1790 N | 19.3333 E | 2.5 |
| 23 March 2017 | 06:00 | 50.1792 N | 19.3333 E | 2.6 |
| 24 March 2017 | 15:44 | 50.1792 N | 19.3336 E | 2.6 |
| 25 March 2017 | 11:59 | 50.1794 N | 19.3333 E | 2.5 |
| 27 March 2017 | 20:53 | 50.1795 N | 19.3332 E | 2.6 |
Table 2.
Characteristics of radargrams.
| No. | Acquisition dd/mm/yyyy | Sentinel-1 Mission | Orbit | Pass | No. | Acquisition dd/mm/yyyy | Sentinel-1 Mission | Orbit | Pass |
|---|---|---|---|---|---|---|---|---|---|
| 1 | 06 March 2017 | A | 102 | ASC | 9 | 23 April 2017 | A | 102 | ASC |
| 2 | 12 March 2017 | B | 102 | ASC | 10 | 29 April 2017 | B | 102 | ASC |
| 3 | 18 March 2017 | A | 102 | ASC | 11 | 05 May 2017 | A | 102 | ASC |
| 4 | 24 March 2017 | B | 102 | ASC | 12 | 11 May 2017 | B | 102 | ASC |
| 5 | 30 March 2017 | A | 102 | ASC | 13 | 17 May 2017 | A | 102 | ASC |
| 6 | 05 April 2017 | B | 102 | ASC | 14 | 23 May 2017 | B | 102 | ASC |
| 7 | 11 April 2017 | A | 102 | ASC | 15 | 29 May 2017 | A | 102 | ASC |
| 8 | 17 April 2017 | B | 102 | ASC |
Table 3.
Boundary speed of surface subsidence ṡB in relation to building strength categories and category of mining areas.
Table 3.
Boundary speed of surface subsidence ṡB in relation to building strength categories and category of mining areas.
| Building Strength Category [55] | ṡB [mm/d] | Category of Mining Areas |
|---|---|---|
| 0 | −1 | 0 |
| 1 | −3 | I |
| 2 | −6 | II |
| 3 | −12 | III |
| 4 | −18 | IV |
Publisher’s Note: MDPI stays neutral with regard to jurisdictional claims in published maps and institutional affiliations. |
© 2020 by the authors. Licensee MDPI, Basel, Switzerland. This article is an open access article distributed under the terms and conditions of the Creative Commons Attribution (CC BY) license (http://creativecommons.org/licenses/by/4.0/).
Share and Cite
MDPI and ACS Style
Sopata, P.; Stoch, T.; Wójcik, A.; Mrocheń, D. Land Surface Subsidence Due to Mining-Induced Tremors in the Upper Silesian Coal Basin (Poland)—Case Study. Remote Sens. 2020, 12, 3923. https://doi.org/10.3390/rs12233923
AMA Style
Sopata P, Stoch T, Wójcik A, Mrocheń D. Land Surface Subsidence Due to Mining-Induced Tremors in the Upper Silesian Coal Basin (Poland)—Case Study. Remote Sensing. 2020; 12(23):3923. https://doi.org/10.3390/rs12233923
Chicago/Turabian StyleSopata, Paweł, Tomasz Stoch, Artur Wójcik, and Dawid Mrocheń. 2020. "Land Surface Subsidence Due to Mining-Induced Tremors in the Upper Silesian Coal Basin (Poland)—Case Study" Remote Sensing 12, no. 23: 3923. https://doi.org/10.3390/rs12233923
Note that from the first issue of 2016, this journal uses article numbers instead of page numbers. See further details here.